1. Introduction
Fractured geological media widely exist in energy development, underground engineering and geotechnical projects, often leading to fluid leakage, energy dissipation and structural instability. As a key method for fracture sealing, seepage improvements and strength enhancement in geological media, the applicability of grouting technology directly affects the construction quality of geotechnical engineering and resource utilization efficiency. For example, fluid leakage may cause more than 15% of working fluid loss in the Tianjin Panzhuang karst geothermal reservoir, where an injection–production imbalance has led to a sharp decline in geothermal pressure [
1]. In existing studies, the grouting optimization method based on discrete fracture networks [
2] and the polyurethane grout fracturing grouting technology [
3] provide important ideas and references for related applications. In recent years, scholars worldwide have conducted systematic research on grouting technology, forming a complete research system covering process innovation, material development, engineering evaluation and numerical simulation.
Remarkable technological breakthroughs have been achieved in grouting process optimization and the development of new material under complex geological conditions. For typical engineering scenarios such as anchor foundation pits of ultra-deep suspension bridges and karst-developed strata, the optimized D-RJP high-pressure jet grouting technology can form qualified composite foundations in deep soft soil and high-pressure confined water strata [
4]. The application of capsule-type sleeve valve pipe grouting technology effectively solves the problem of grout leakage in karst formations and realizes precise grouting in karst cavities [
5]. The embedded capsule grouting pile technology further reveals the regulation law of grouting parameters on the mechanical properties of pile foundations [
6]. At the technical specification level, the establishment of a comprehensive guideline for jet grouting numerical simulations has standardized the simulation process [
7]. The development of a nano-silica sol-based composite grout has also addressed the industrial problem of low injectability in micro-fractures of argillaceous rock masses from the perspective of material mechanisms [
8].
The application scope of grouting technology in engineering protection and formation improvement continues to expand. Numerical analysis and engineering practice show that jet grouting can effectively restrain the deformation of adjacent metro tunnels caused by the construction of deep foundation pits, and clarify the relationship between grouting zone parameters and tunnel deformation [
9]. The proposed steel hoop composite grouting reinforcement technology significantly improves the seismic performance of concrete beam–column joints [
10]. For key engineering problems such as water–sand inrush in coal mines and tunnel restoration, the application of loose-sand-layer grouting technology has realized structural reconstruction and improved the strength of geological media [
11,
12], and the innovation of pulsed pneumatic pre-splitting grouting technology has greatly enhanced the injectability of high-viscosity grout in low-permeability strata [
13]. In addition, a sustainability evaluation framework for grouting, integrated with real-time monitoring and visualization tools, provides a systematic evaluation system for the long-term evolution of the technology [
14].
Research on grouting parameter optimization and engineering technical system construction has become increasingly mature. The application of overburden isolated grouting technology in coal mining and subsidence control has achieved systematic parameter optimization in multiple scenarios [
15]. Laboratory tests on double-liquid jet grouting verify its superiority in foundation reinforcement from the perspective of physical and mechanical properties [
16]. Special studies on cross-fault tunnels and subsea tunnels have established core technical parameters: the three-dimensional finite element method clarifies the key parameters of advance grouting under different excavation methods [
17] and the exploration of oscillating grouting technology determines the optimal process range through rheological parameter analysis [
18]. Meanwhile, rainfall optimization technology provides an intelligent scheme for anti-seepage grout selection [
19], and a review of large-cross-section subsea tunnels constructed by the drill-blasting method has established a complete technical system covering composite grouting and waterproofing systems [
20].
The improvement in grouting material performance and the evaluation of reinforcement effect have further perfected the technical application system, while relevant studies have also made important progress in site assessment and fluid machinery performance analysis. Research on the application of cement-based grouting technology in radioactive waste disposal has proposed solidification schemes and analyzed the enhancing effects of additives [
21]. For the difficulty of coal mine floor reinforcement, an evaluation system combining the “pipe pile–key stratum” structural model and microseismic monitoring array has realized the accurate quantification of reinforcement effects and identification of response characteristics [
22]. Existing studies have established liquefaction assessment methods for coral sand sites based on shear wave velocity [
23], and conducted comparative analyses of the performance of different impeller seal clearance structures of pumped-storage units using improved entropy production theory [
24].
The development of a grouting numerical simulation provides critical support for precise grouting design. Most of the above studies focus on macroscopic processes and material evaluation, while the CFD-DEM coupled simulation enables the quantitative characterization of grout–soil/rock interactions and grout diffusion laws. This technical approach deepens the mechanism understanding of grouting: the coupling method reveals the diffusion mechanism of jet grouting and optimal process parameters [
25], clarifies the water-sealing mechanism of expandable particle grout under flowing water conditions [
26], and analyzes the regulation law of the pull-out bearing capacity of anchors in grouted media [
27]. Further studies on synchronous grouting combined with the VOF method [
28], sedimentation law in coal gangue backfill areas [
29], and the microscopic grouting mechanism of subgrade [
30] verify the universality and accuracy of the CFD-DEM coupling technique in various geotechnical scenarios.
To better clarify the characteristics and applicable scopes of different research approaches, a comparative analysis of typical experimental and numerical methods is summarized in
Table 1.
In recent decades, numerous studies have explored the flow mechanisms of grouting slurries in rough fractures through laboratory experiments, field investigations, and numerical simulations. Experimental studies have visualized slurry infiltration and particle migration, quantifying the influences of fracture roughness, slurry rheology, and aggregate clogging on flow behavior and sealing performance. Field observations have further identified preferential flow channels and non-uniform grout diffusion caused by wall roughness and in situ geological conditions. With the advancement of computational techniques, numerical methods, particularly coupled CFD-DEM simulations, have been increasingly adopted to characterize fluid–particle interactions and dynamic flow field evolution in rough fractures. Compared with the Euler–Euler two-fluid model, the CFD-DEM method can better capture particle-scale migration, collision, and clogging behaviors, making it more suitable for analyzing aggregate slurry flow in rough fractures. Recent studies have focused on the coupled effects of fracture geometry, grouting rate, and slurry properties on flow stability and grout propagation, providing important insights into the grouting mechanism in fractured geological media.
These engineering applications further highlight the practical demand for the accurate simulation of rough fractures; focusing on the lack of precise simulation of rough fractures in existing studies, the fractal model and Fluent–DEM coupling method adopted in this study effectively improve the simulation accuracy of rough fracture flow characteristics, which is the core innovation point of this research. Differing from previous studies, which mostly adopted smooth parallel plate models, this study innovatively replaces the idealized smooth fracture with a natural rough fracture model characterized by the Hurst exponent and JRC, which is more consistent with real engineering geological conditions. On the basis of existing research results [
31], this work further extends the applicable scope of slurry flow simulation from simple smooth channels to complex rough fracture systems, making the numerical results more realistic and instructive.
It is hypothesized that the greater the fracture roughness, the higher the grout flow resistance and the smaller the diffusion range, and a higher grouting pressure can alleviate this effect. It is hypothesized that in the rough fracture model based on the Hurst index, grout velocity and shear effect are stronger in geometrically abrupt sections while the flow field is more stable in Flat-leg regions, and both fracture roughness and grouting pressure govern the movement of grout and particles, all verified by CFD-DEM coupling simulation.
2. Model Construction and Basic Theory of Slurry Flow
2.1. Construction of Joint Profiles in Rough Fractures
In rock mechanics and engineering geology, the use of random fractal curves to simulate natural joint profiles has been widely accepted. At present, mathematical tools such as the Brownian motion principle, Weierstrass function and Hurst exponent [
32,
33] are mainly adopted to characterize and reconstruct the irregular geometric morphology of joint surfaces. Among these, the Hurst exponent is utilized in rough fracture modeling to control the undulation of generated profiles, enabling the efficient generation of statistically representative random rough surfaces. Compared with Brownian motion and the Weierstrass function, the Hurst exponent method can more conveniently and stably control the roughness and undulation characteristics of fracture surfaces, making it more suitable for constructing statistically representative 3D rough fracture models in grouting simulations.
Given the advantages of the Hurst exponent method in balancing computational efficiency and geometrical authenticity, this study adopts it to construct a single rough fracture model. The initial straight-line profile is divided by a random point P, and the baseline is segmented at a fixed equal interval. In the Y-direction, the offset P(x) of each equidistant point on both sides of point P relative to the preceding point is given by Equation (1).
In Equation (1), P(x) denotes the offset in the Y-direction; x is the distance from an equidistant point to the dividing point P; R is a normally distributed random variable with zero mean and unit variance; W is a relevant parameter controlling the amplitude; and H is the Hurst exponent.
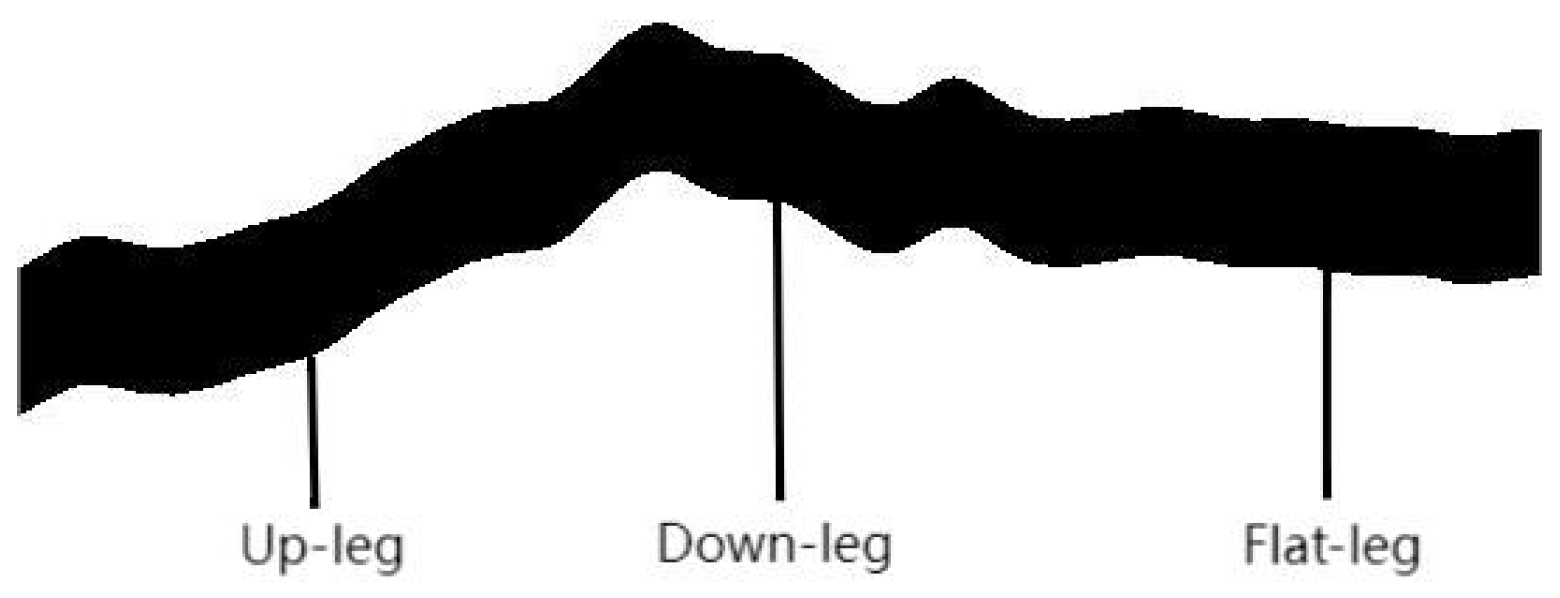
Considering the characteristics of common fractures in engineering practice, this study establishes a single rough fracture model (as shown in
Figure 1) with macroscopic geometric dimensions: a length of 650 mm and an aperture of 10 mm. After generating a random height field conforming to the statistical law of the Hurst exponent, the roughness coefficient is quantitatively back-calculated using the structural function method proposed by Barton N [
34]. The obtained JRC value ranges from 11 to 13, consistent with the moderately rough fractures commonly encountered in engineering. This model represents a typical rough fracture widely distributed in rock masses, providing a standardized geometric platform for the subsequent systematic investigation into the universal laws of slurry migration. The detailed generation parameters of the model are listed in
Table 2.
The rough fracture model was constructed in SCDM 19.2 software based on the Hurst exponent method, with a Joint Roughness Coefficient (JRC) of approximately 11–13. It should be noted that the 10 mm aperture adopted in this simulation is larger than the typical fracture size in actual deep excavation engineering, especially near the excavation face, where newly formed joints are dominant. This aperture setting is a reasonable simplification for numerical simulation, which helps to improve computational convergence and clearly capture flow characteristics. This discrepancy between the model aperture and real in situ conditions is recognized as a limitation of the present study.
In this study, the joint roughness coefficient JRC 11–13 is selected as the representative roughness. According to the fractal characteristics of natural rock joints and the verified relationship between JRC and fractal dimension in previous studies [
35], the coefficients presented in
Table 2 for rough fracture modeling are also clearly supported by the existing literature [
36]. JRC 11–13 represents a moderate roughness level, which can reflect the general morphological characteristics of most geothermal reservoir fractures without being too gentle or extremely rough, and is representative when revealing the flow mechanism of grout in rough fractures under conventional engineering conditions.
In addition, a fracture aperture of 10 mm is adopted in this study. This setting is conducive to obvious flow phenomena, clear visual observation, and accurate data capture in laboratory tests, which is a common simplification for physical model experiments. Although natural fractures usually have smaller apertures, the selected aperture ensures the flow laws in rough fractures can be fully displayed and measured. Combined with the model length of 650 mm and width of 50 mm, the overall geometric proportion is reasonable, and the research results still have good representativeness for field fractures.
2.2. Fundamental Theory of Liquid-Phase Flow
The fluid adopted in this study is Bingham fluid, which is an incompressible fluid. Its flow behavior in rough fractures follows Continuity Equation (2) and Navier–Stokes (N–S) Equation (3):
Equation (2) is the continuity equation for incompressible fluids, which describes the mass balance during flow. Equation (3) serves as the momentum conservation equation for fluid motion, which inherently reflects the mechanical equilibrium relationship during fluid movement. It correlates the changes in fluid motion state with various acting forces, including pressure driving force, viscous resistance, and gravity. This equation comprehensively reveals the motion laws of fluids under the combined action of multiple forces and is a core equation for analyzing the macroscopic motion characteristics of fluids.
It should be noted that the rheological properties of actual grout typically exhibit time-dependent behavior due to hydration and thickening effects. In this study, the Bingham fluid model is adopted as a simplified and widely accepted approach to focus on the flow mechanism within rough fractures. Although time-varying rheological characteristics are not considered in the simulation, the influence of grout evolution over time on flow and sealing performance is acknowledged. This simplification ensures clear analysis of the flow law, and the relevant differences between ideal model and actual grout were discussed to improve the rationality of the study.
The rough fracture model constructed based on the Hurst exponent method can truly reflect the surface morphology characteristics of rock mass fractures. The undulating changes in the fracture walls directly affect the flow field distribution, the intensity of shear action, and the pressure evolution law, thereby determining the overall flow characteristics of the grout inside the fractures.
2.3. Numerical Simulation and Parameter Settings
To systematically investigate the effects of fracture roughness and inlet velocity on particle migration, a total of three groups of numerical simulation tests were designed in this study. The liquid-phase inlet velocities for the three cases were set to 0.5 m/s (a), 0.55 m/s (b), and 0.6 m/s (c) respectively, and the mechanisms of fluid flow and particle migration in rough fractures were discussed by comparing different flow velocity conditions in the same fracture structure.
The inlet velocity range of 0.5–0.6 m/s in this study is determined based on extensive CFD experimental verification, analysis of velocity deviation impact and reference to previous studies. A large number of preliminary CFD experiments show that the velocity range can avoid insufficient diffusion or hydraulic fracturing caused by inappropriate velocity, and ensure the stability of the simulation results. This range also refers to the relevant research results in the literature [
31], and is further adjusted according to the fracture characteristics and grout properties of this study.
In addition, it should be explained that the constant inlet velocity adopted in this simulation is a reasonable numerical simplification, which is listed as a limitation of this study. It is necessary to emphasize that the use of inlet velocity as the boundary condition is a common practice in CFD simulations, mainly to ensure the stability and convergence of numerical calculations. In actual grouting, the highly nonlinear relationship between pressure and flow rate is likely to cause numerical convergence difficulties, while setting a constant inlet velocity can avoid such problems, simplify the calculation, and effectively capture the flow characteristics of grout. In actual on-site grouting, operators control the grouting pressure, and the flow rate is the result of the combined action of pressure and flow resistance. The constant-velocity condition artificially separates the relationship between flow and hydraulic response, which shows a certain deviation from the actual engineering. The adoption of a constant-velocity condition aims to avoid the convergence difficulties caused by the nonlinear relationship between pressure and flow rate. In the follow-up, we will optimize the model by adopting constant-pressure conditions for comparative calculations. It is worth noting that if a pressure inlet is adopted, high slurry viscosity, low formation permeability, or the occurrence of clogging may lead to a highly nonlinear relationship between the set inlet pressure and the actual flow rate, thereby causing convergence difficulties or unstable results in the numerical simulation [
37].
In this paper, the coupled computational fluid dynamics and discrete element method (CFD-DEM) is used to conduct numerical simulations of the fracture grouting process. The physical parameters of the liquid phase are set according to the grout proportion determined by Ren [
38] in our research group through orthogonal tests, which is composed of cement, fly ash, loess and water. In the FLUENT simulation, the particle characteristics of fine aggregates are ignored, the grout is simplified as a homogeneous continuous medium, and the Herschel–Bulkley model is adopted, with the parameter settings listed in
Table 3.
To simulate the particle phase, the EDEM 2020 software was adopted, and the Hertz–Mindlin soft-sphere model was used to describe the contact behaviors between particles and the wall as well as between particles themselves. The particle diameter was uniformly set to 1 mm, and the material parameters were set as follows: shear modulus of 4.7 × 10⁸ Pa and Poisson’s ratio of 0.3. These parameters ensure that the motion response of particles in the flow field can accurately reflect their physical and mechanical properties. However, ignoring the particle size effect in the EDEM simulation is a limitation of this study. This simplification may lead to certain deviations in describing the local flow field, particle retention, and blockage characteristics near fracture surfaces. In future work, a more refined particle model with consideration of size effects and surface roughness will be adopted to improve the accuracy of simulation results.
The liquid-phase flow field was solved by FLUENT 2019 software based on the Navier–Stokes equation, the motion of the particle phase was tracked and calculated by EDEM, and the momentum exchange between the fluid and particles was realized through a two-way coupling algorithm. The time step was set to 2 × 10⁻³ s based on the CFL condition and particle collision time, with a data output interval of 500 steps.
3. Results and Discussion
3.1. Effects of Roughness on Fracture Flow Field Structure and Velocity Distribution
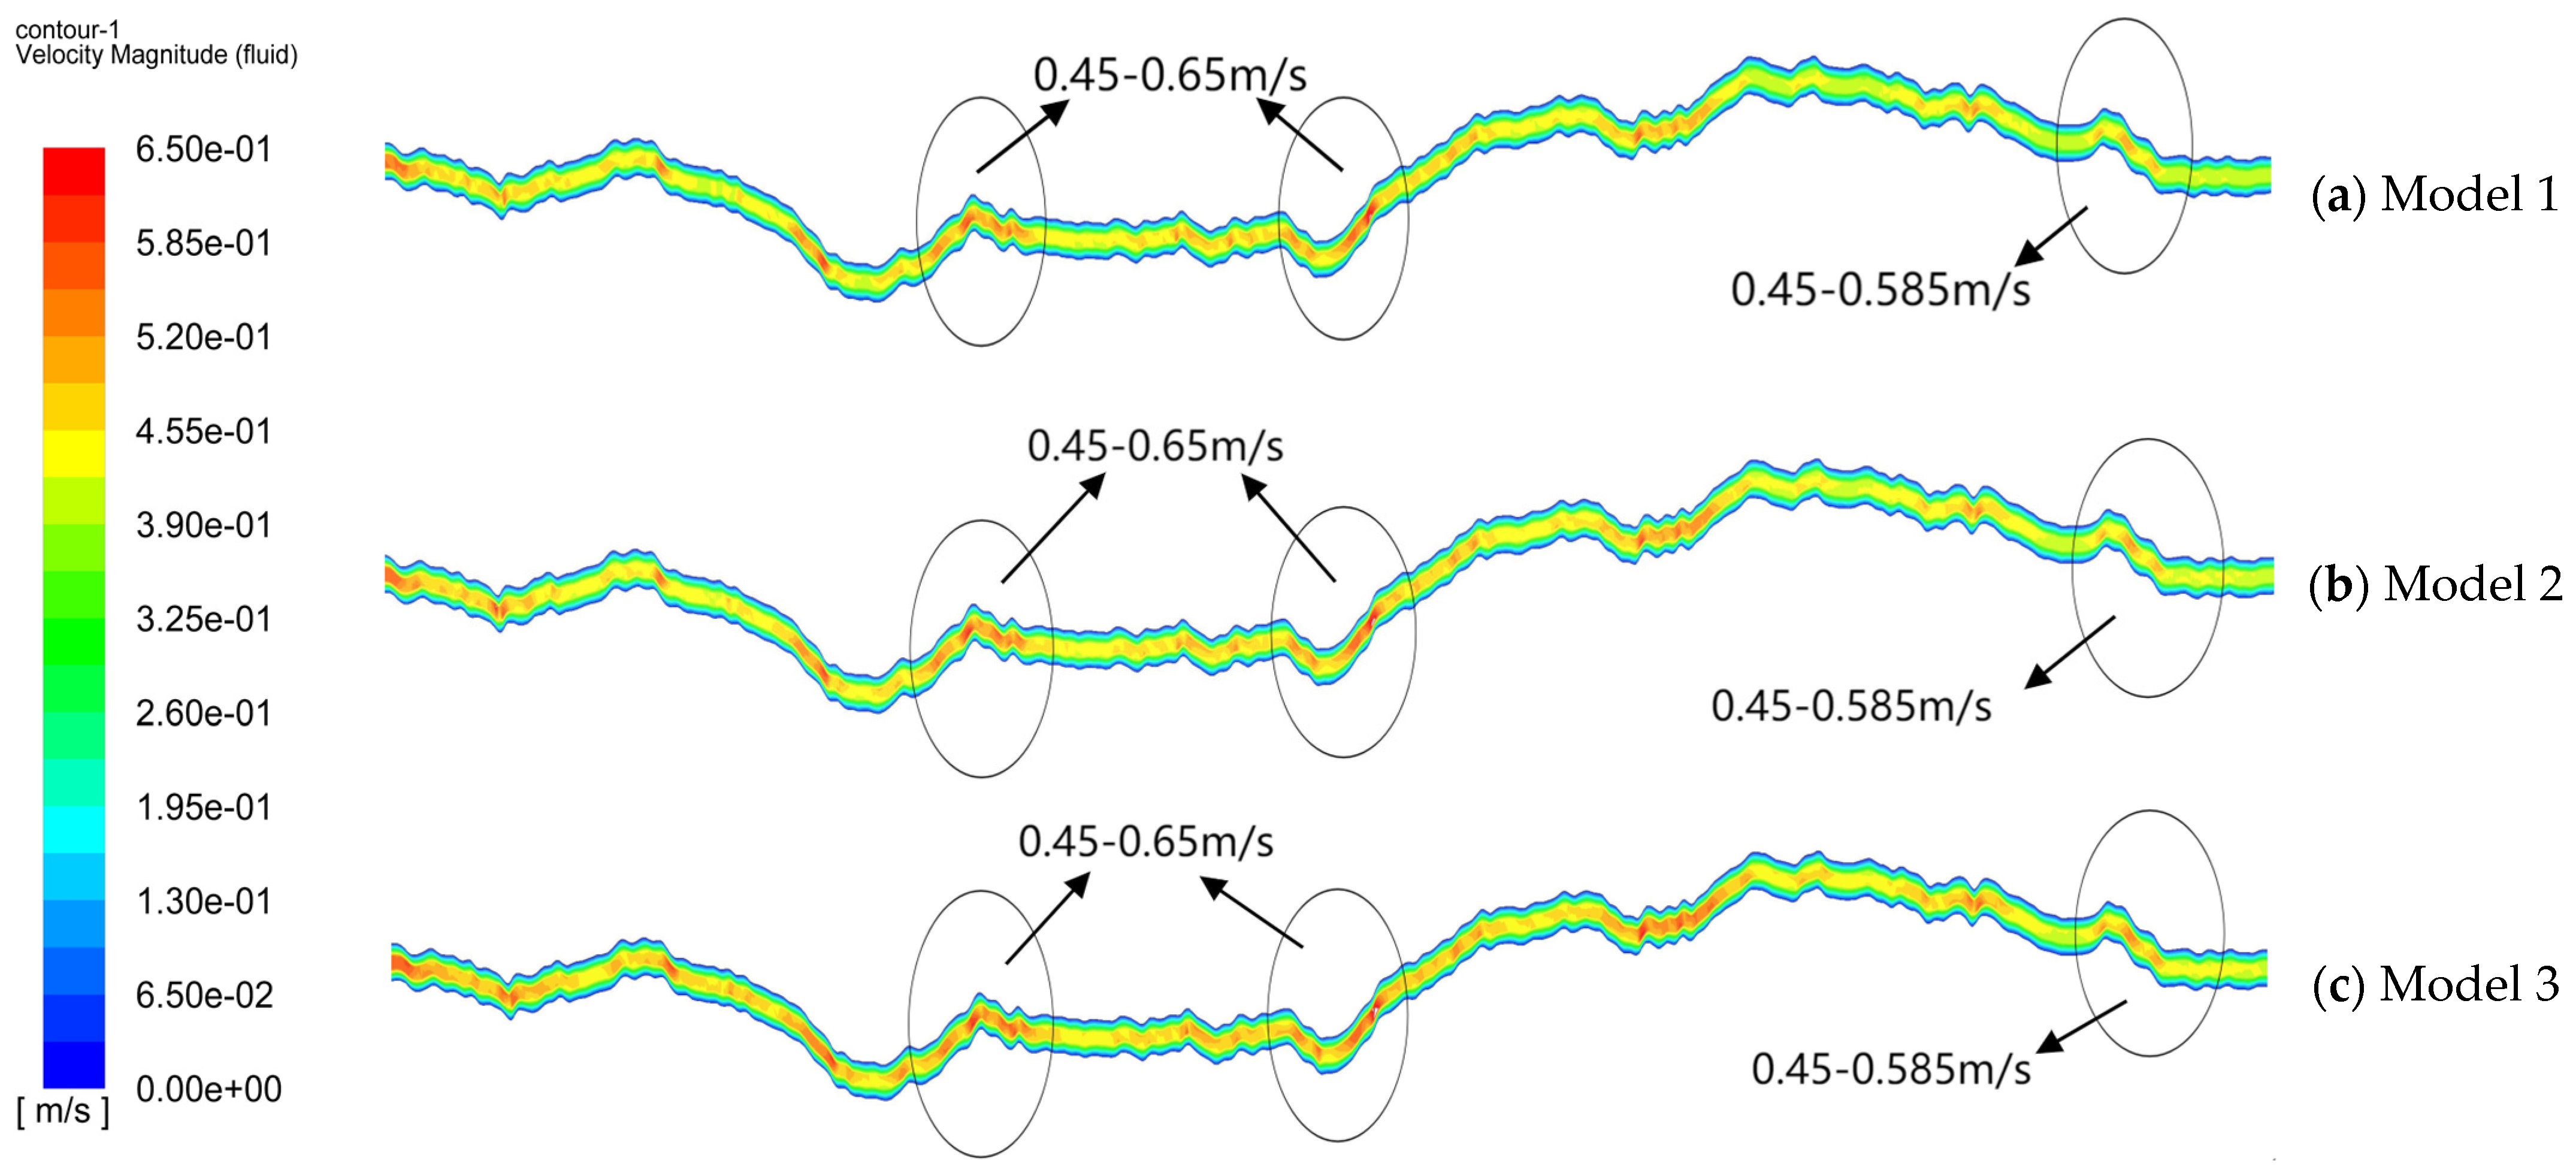
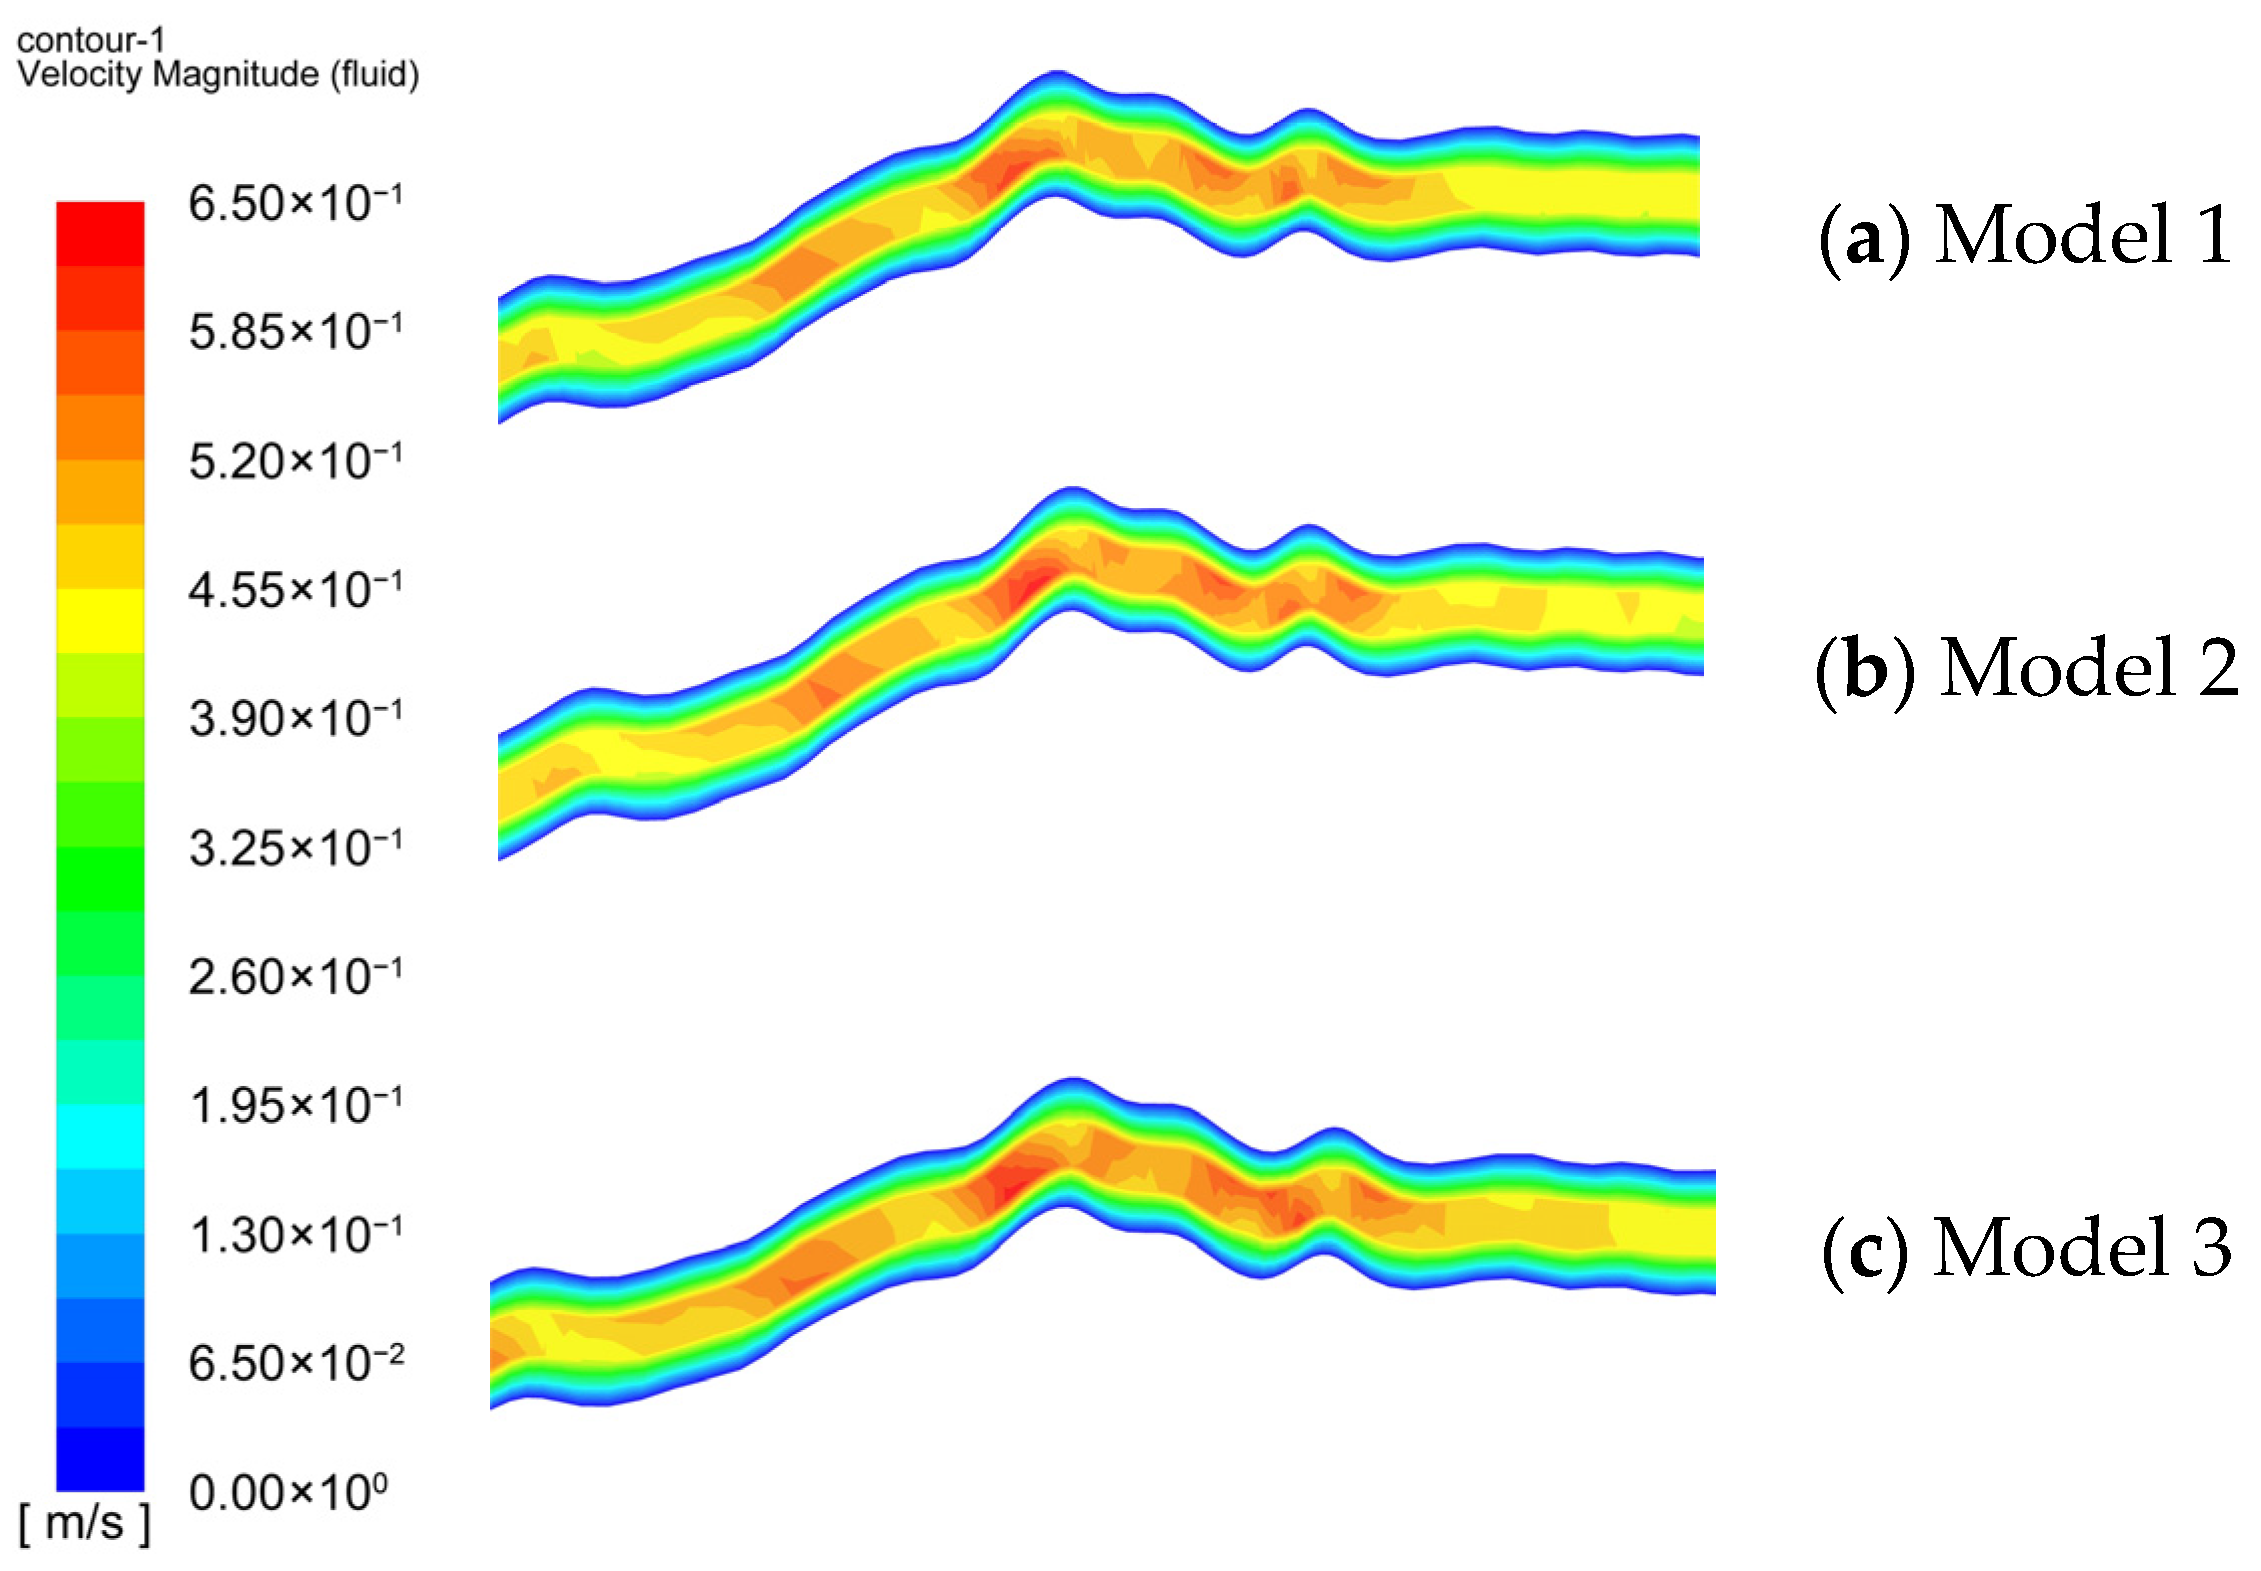
Figure 2 presents the fluid velocity contour in the rough fracture of groups (a), (b), and (c). The flow field exhibits heterogeneous characteristics with local high-velocity zones, where the velocity generally exceeds 0.52 m/s and is distributed in continuous bands along the convex or concave contours of the fracture walls, concentrating at geometric abrupt changes (e.g., the regions marked by black circles in the figure), namely the Up-leg and Down-leg of the rough fracture. In contrast, the velocity in the Flat-leg of the fracture returns to a medium level, ranging approximately from 0.26 to 0.45 m/s, and the flow structure shows a strict correspondence with the wall morphology. Geometric abrupt regions such as the Up-leg and Down-leg form a large pressure gradient due to flow channel contraction, providing a sufficient driving force for fluid flow and causing obvious inertial acceleration. In addition, the velocity difference between the main flow region and the near-wall region increases significantly, enhancing the relative motion between fluid layers and notably elevating the shear action, which reduces the equivalent viscosity of the grout and decreases the flow resistance, ultimately forming local high-velocity zones. In the Flat-leg, the flow channel morphology is stable, the pressure gradient is small, the inertial acceleration effect is weakened, the velocity difference between fluid layers is small, the shear action is weak, the equivalent viscosity of the grout is high and the flow resistance is large, so the flow velocity decreases and tends to be stable.
3.2. Particle Velocity Evolution Mechanism and Flow Field Verification
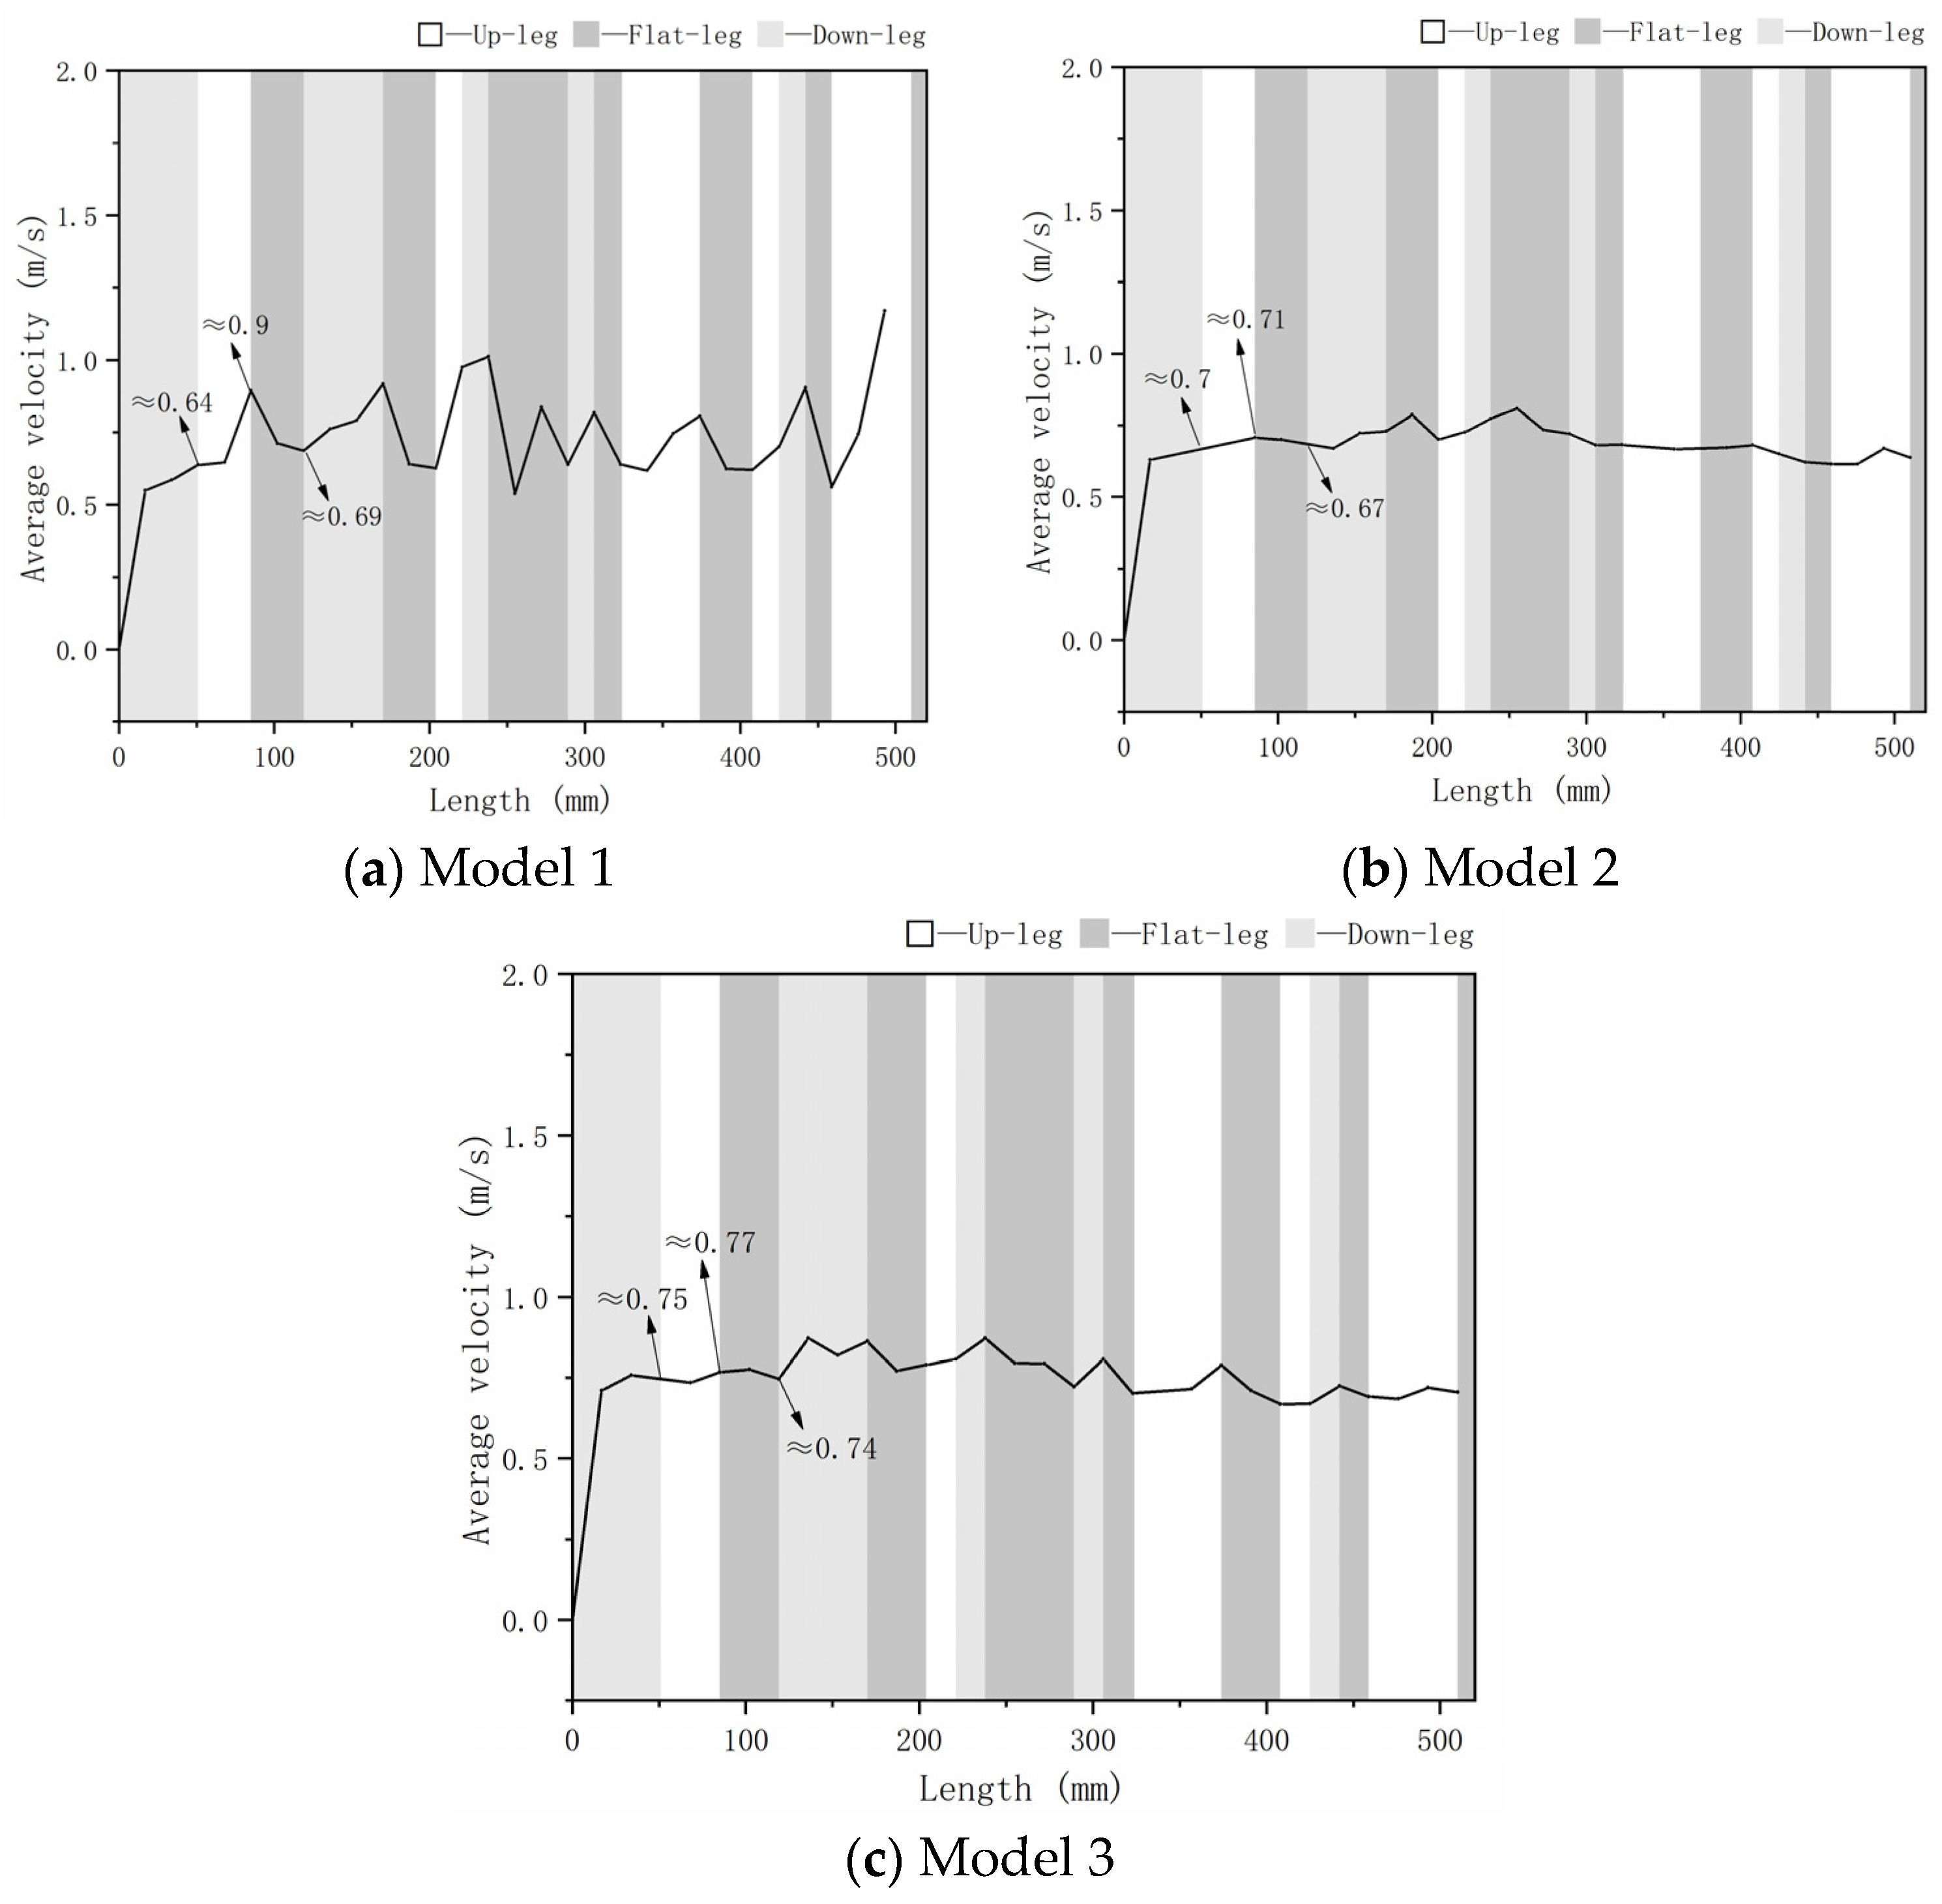
Figure 3 shows the statistical line graphs of the average particle velocity between 40 velocity slices created in EDEM. Based on the above flow field characteristics and slice statistics, a three-stage differentiated evolution law of particle motion along the fracture can be revealed.
Taking every three characteristic color blocks in the velocity contour as an analysis unit, the average particle velocity in Unit 1 of Group (a) rises from approximately 0 m/s to 0.64 m/s in the Down-leg, increases to about 0.9 m/s in the Up-leg, and drops back to around 0.69 m/s in the Flat-leg. The average particle velocity in Unit 1 of Group (b) rises from about 0 m/s to 0.7 m/s in the Down-leg, increases to roughly 0.71 m/s in the Up-leg, and falls back to approximately 0.67 m/s in the Flat-leg. The average particle velocity in Unit 1 of Group (c) rises from about 0 m/s to 0.75 m/s in the Down-leg, increases to roughly 0.77 m/s in the Up-leg, and falls back to approximately 0.74 m/s in the Flat-leg. The variation patterns clearly demonstrate that particle velocity evolves regularly with fracture structure and inlet conditions, which provides a quantitative basis for the subsequent analysis of flow characteristics. The average particle velocity at each cross-section and the average velocity change rate at each stage for the three groups of samples were calculated, and the statistical results are presented in
Table 4.
Although a small number of gentle-slope units show that the peak velocity in the Up-leg or Down-leg is lower than that in the Flat-leg of adjacent units, most units exhibit similar trends. The results show that particle motion along the fracture presents an obvious three-stage evolution law: generally, driven by the fluid (superimposed with the initial velocity of particles), particle velocity increases in the descending and Up-legs of the rough fracture, and decreases slightly and stabilizes in the Flat-leg. This trend is highly consistent with the velocity distribution characteristics reflected in the velocity contours, demonstrating typical segmented flow characteristics controlled by flow channel geometry, which further verifies the above conclusions.
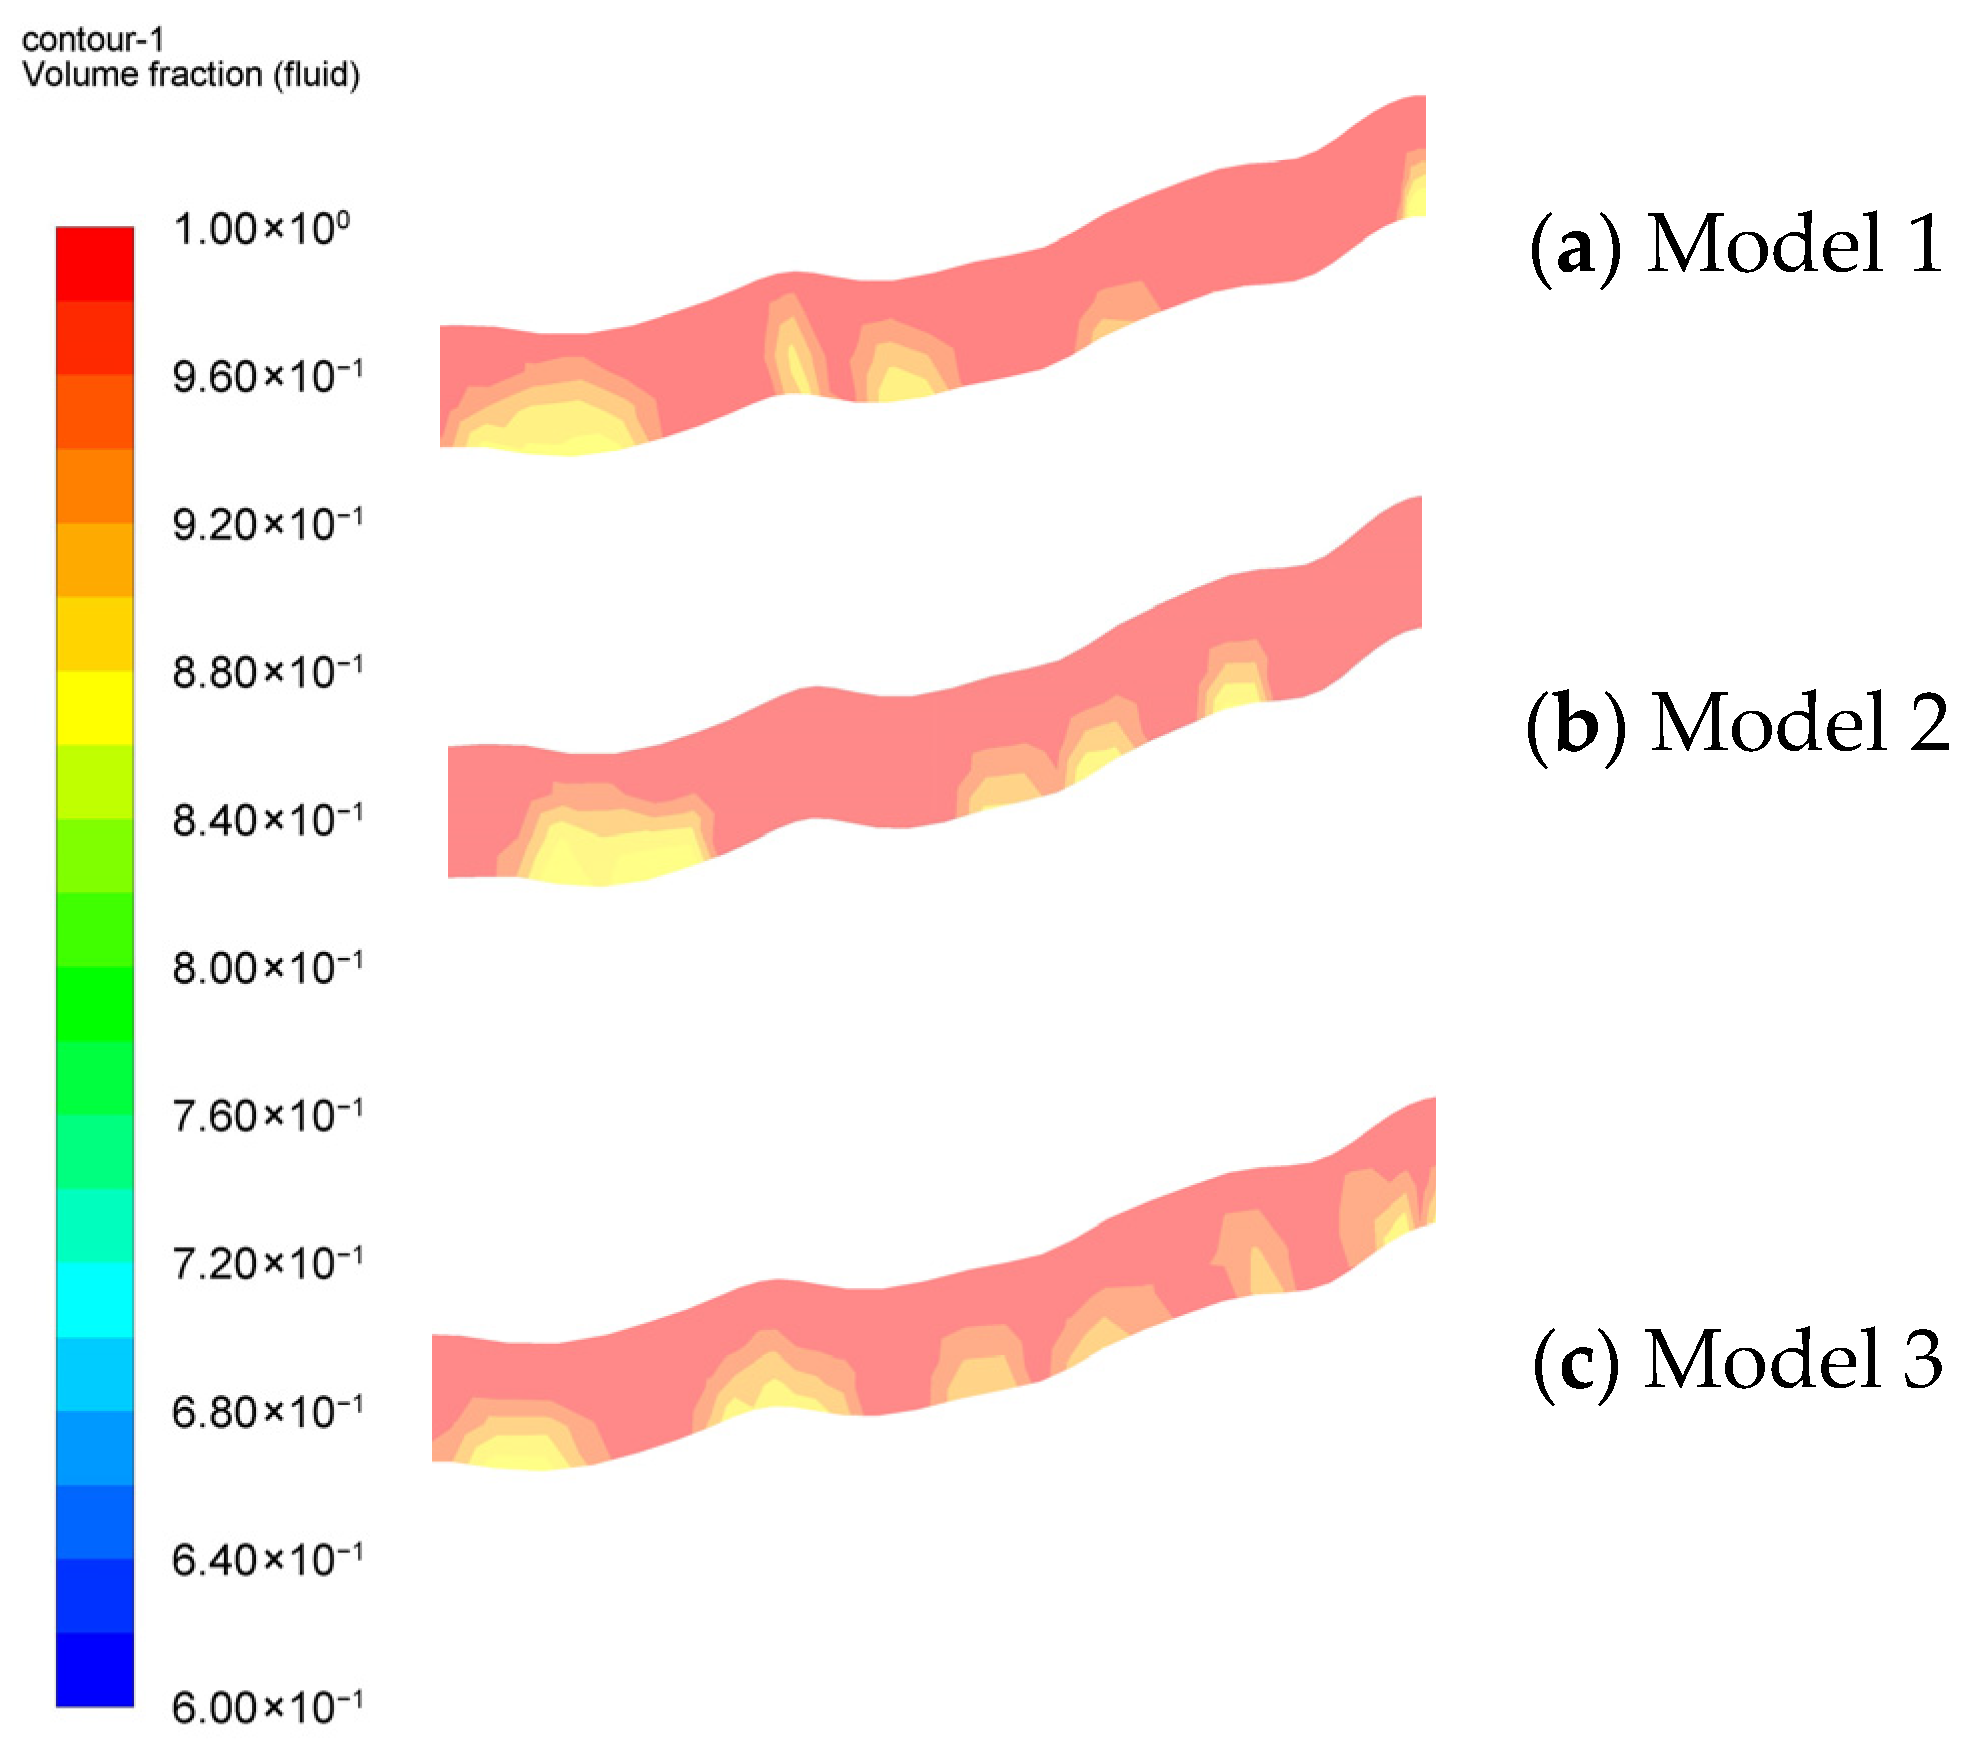
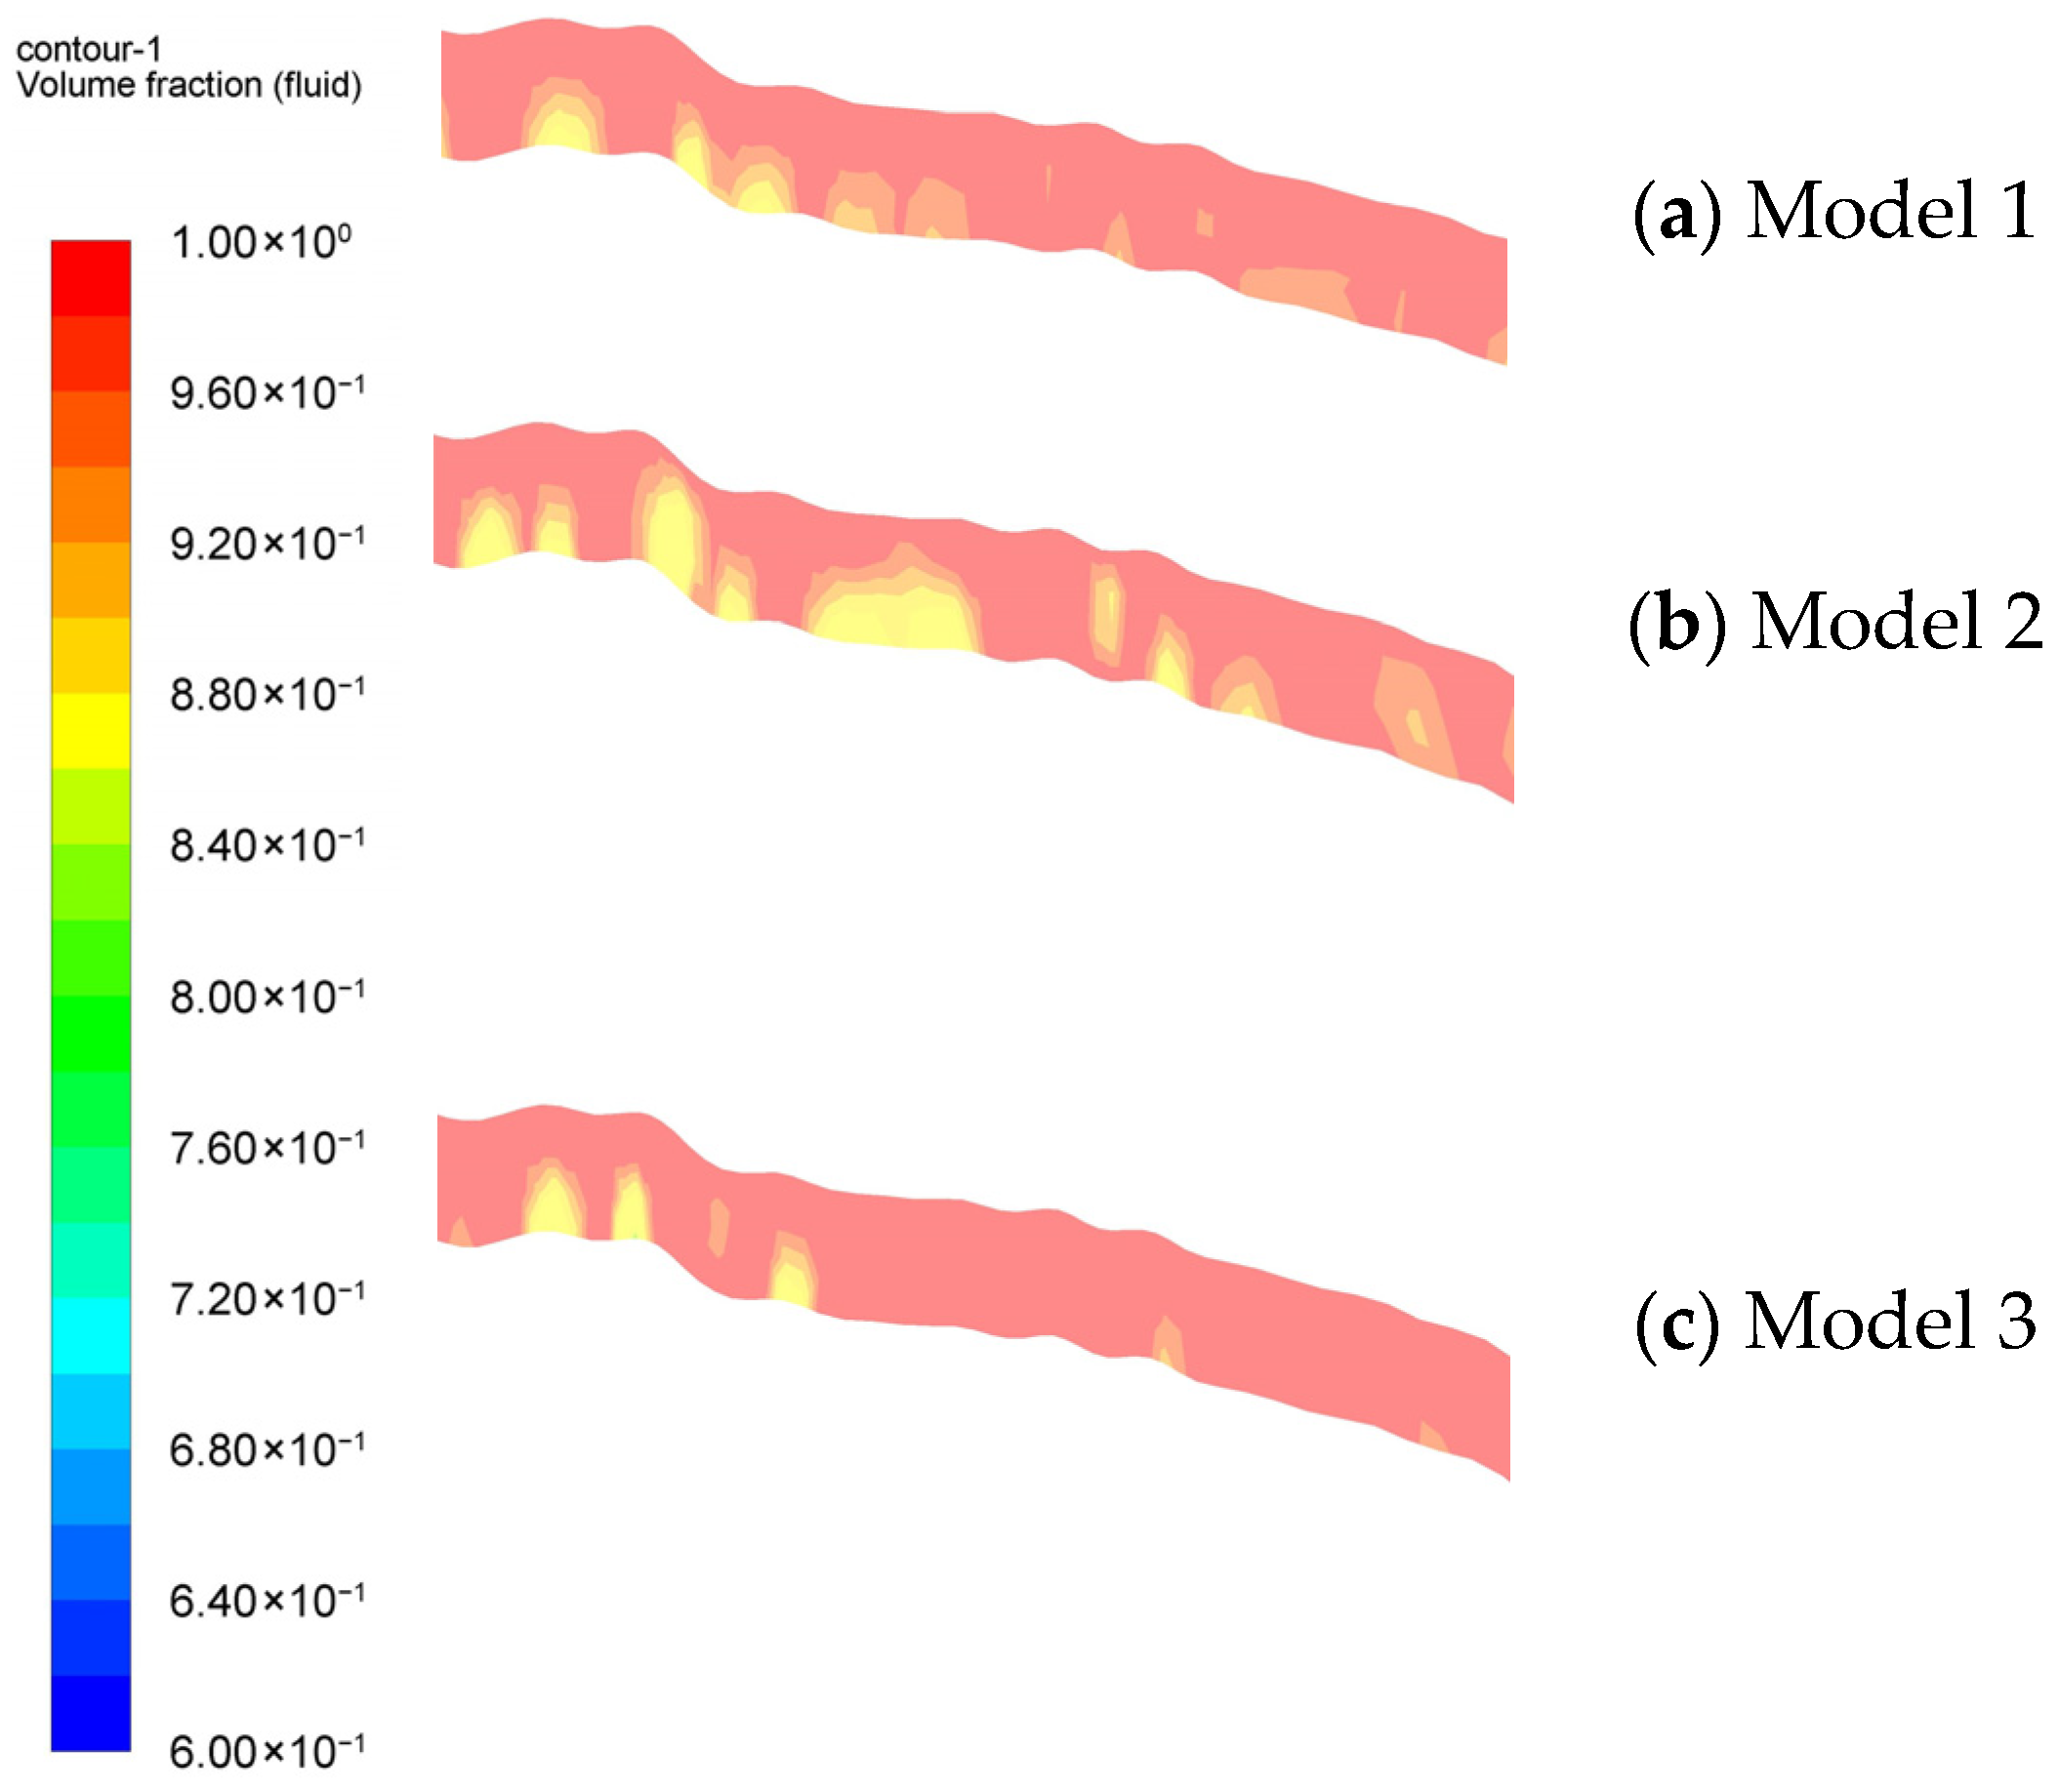
The influence of the above flow field characteristics on particle migration further leads to variations in the liquid-phase volume fraction distribution at abrupt sections. Combined with the liquid-phase volume fraction contours of the local ascending and Down-legs of a random unit (
Figure 4 and
Figure 5), it can be seen that the area with a liquid-phase volume fraction of approximately 90% gradually decreases in the ascending and Down-legs of the rough fracture, and the liquid-phase volume fraction generally gradually increases along the flow direction.
This law corresponds well with the above-mentioned fracture flow mechanism and particle migration law: flow channel contraction at geometric abrupt sections significantly accelerates the fluid flow, enhances local shear action, reduces the equivalent viscosity of the grout, and decreases flow resistance. Driven by the pressure gradient, the grout fills the fracture space more easily, and aggregate particles are effectively transported and dispersed, resulting in a continuous increase in the liquid-phase proportion. Importantly, this flow and packing behavior is closely associated with the actual grout diffusion efficiency in engineering practice—an increase in liquid-phase volume fraction along the flow direction indicates more efficient grout penetration and filling of the fracture, which directly reflects the improvement in grout diffusion efficiency. This further confirms the inherent law that fracture morphology dominates grout diffusion and aggregate migration by regulating the flow field distribution, and provides a theoretical basis for optimizing grout diffusion efficiency in actual engineering projects.
The above evolution of velocity and liquid-phase volume fraction also has important implications for rock engineering practices. As noted in recent studies [
39,
40] on rough rock fracture grouting, the geometrically controlled segmented flow directly determines the uniformity of grout filling and the stability of the reinforced rock mass. In practical tunnel grouting, underground mining, and geothermal reservoir development, such flow characteristics imply that preferential flow and local accumulation easily occur in steep fracture segments, whereas relatively uniform filling appears in gentle sections. The reasonable identification of fracture geometric features can thus help optimize grouting pressure and injection rate to avoid insufficient penetration or excessive fracturing, which provides a quantitative reference for field construction design and risk control.
3.3. Verification and Analysis of Pressure and Viscosity Characteristics of Local Fluid
Combined with an asperity unit flow channel region of Groups (a), (b) and (c) in rough fractures (
Figure 6) and the corresponding velocity contours (
Figure 7), it can be intuitively shown that concentrated high-velocity zones (0.45–0.65 m/s) are formed in both the ascending and Down-legs of this raised unit, while the gentle areas at the slope tops of each section present large-scale low-velocity zones (0.45–0.65 m/s). This phenomenon is consistent with the typical segmented flow characteristics controlled by the geometric morphology of flow channels in rough fractures mentioned above. To further reveal the inherent mechanisms of the above flow phenomena, this section focuses on analyzing the pressure distribution characteristics in rough fractures and intuitively verifies the evolution law of the flow field through pressure contours.
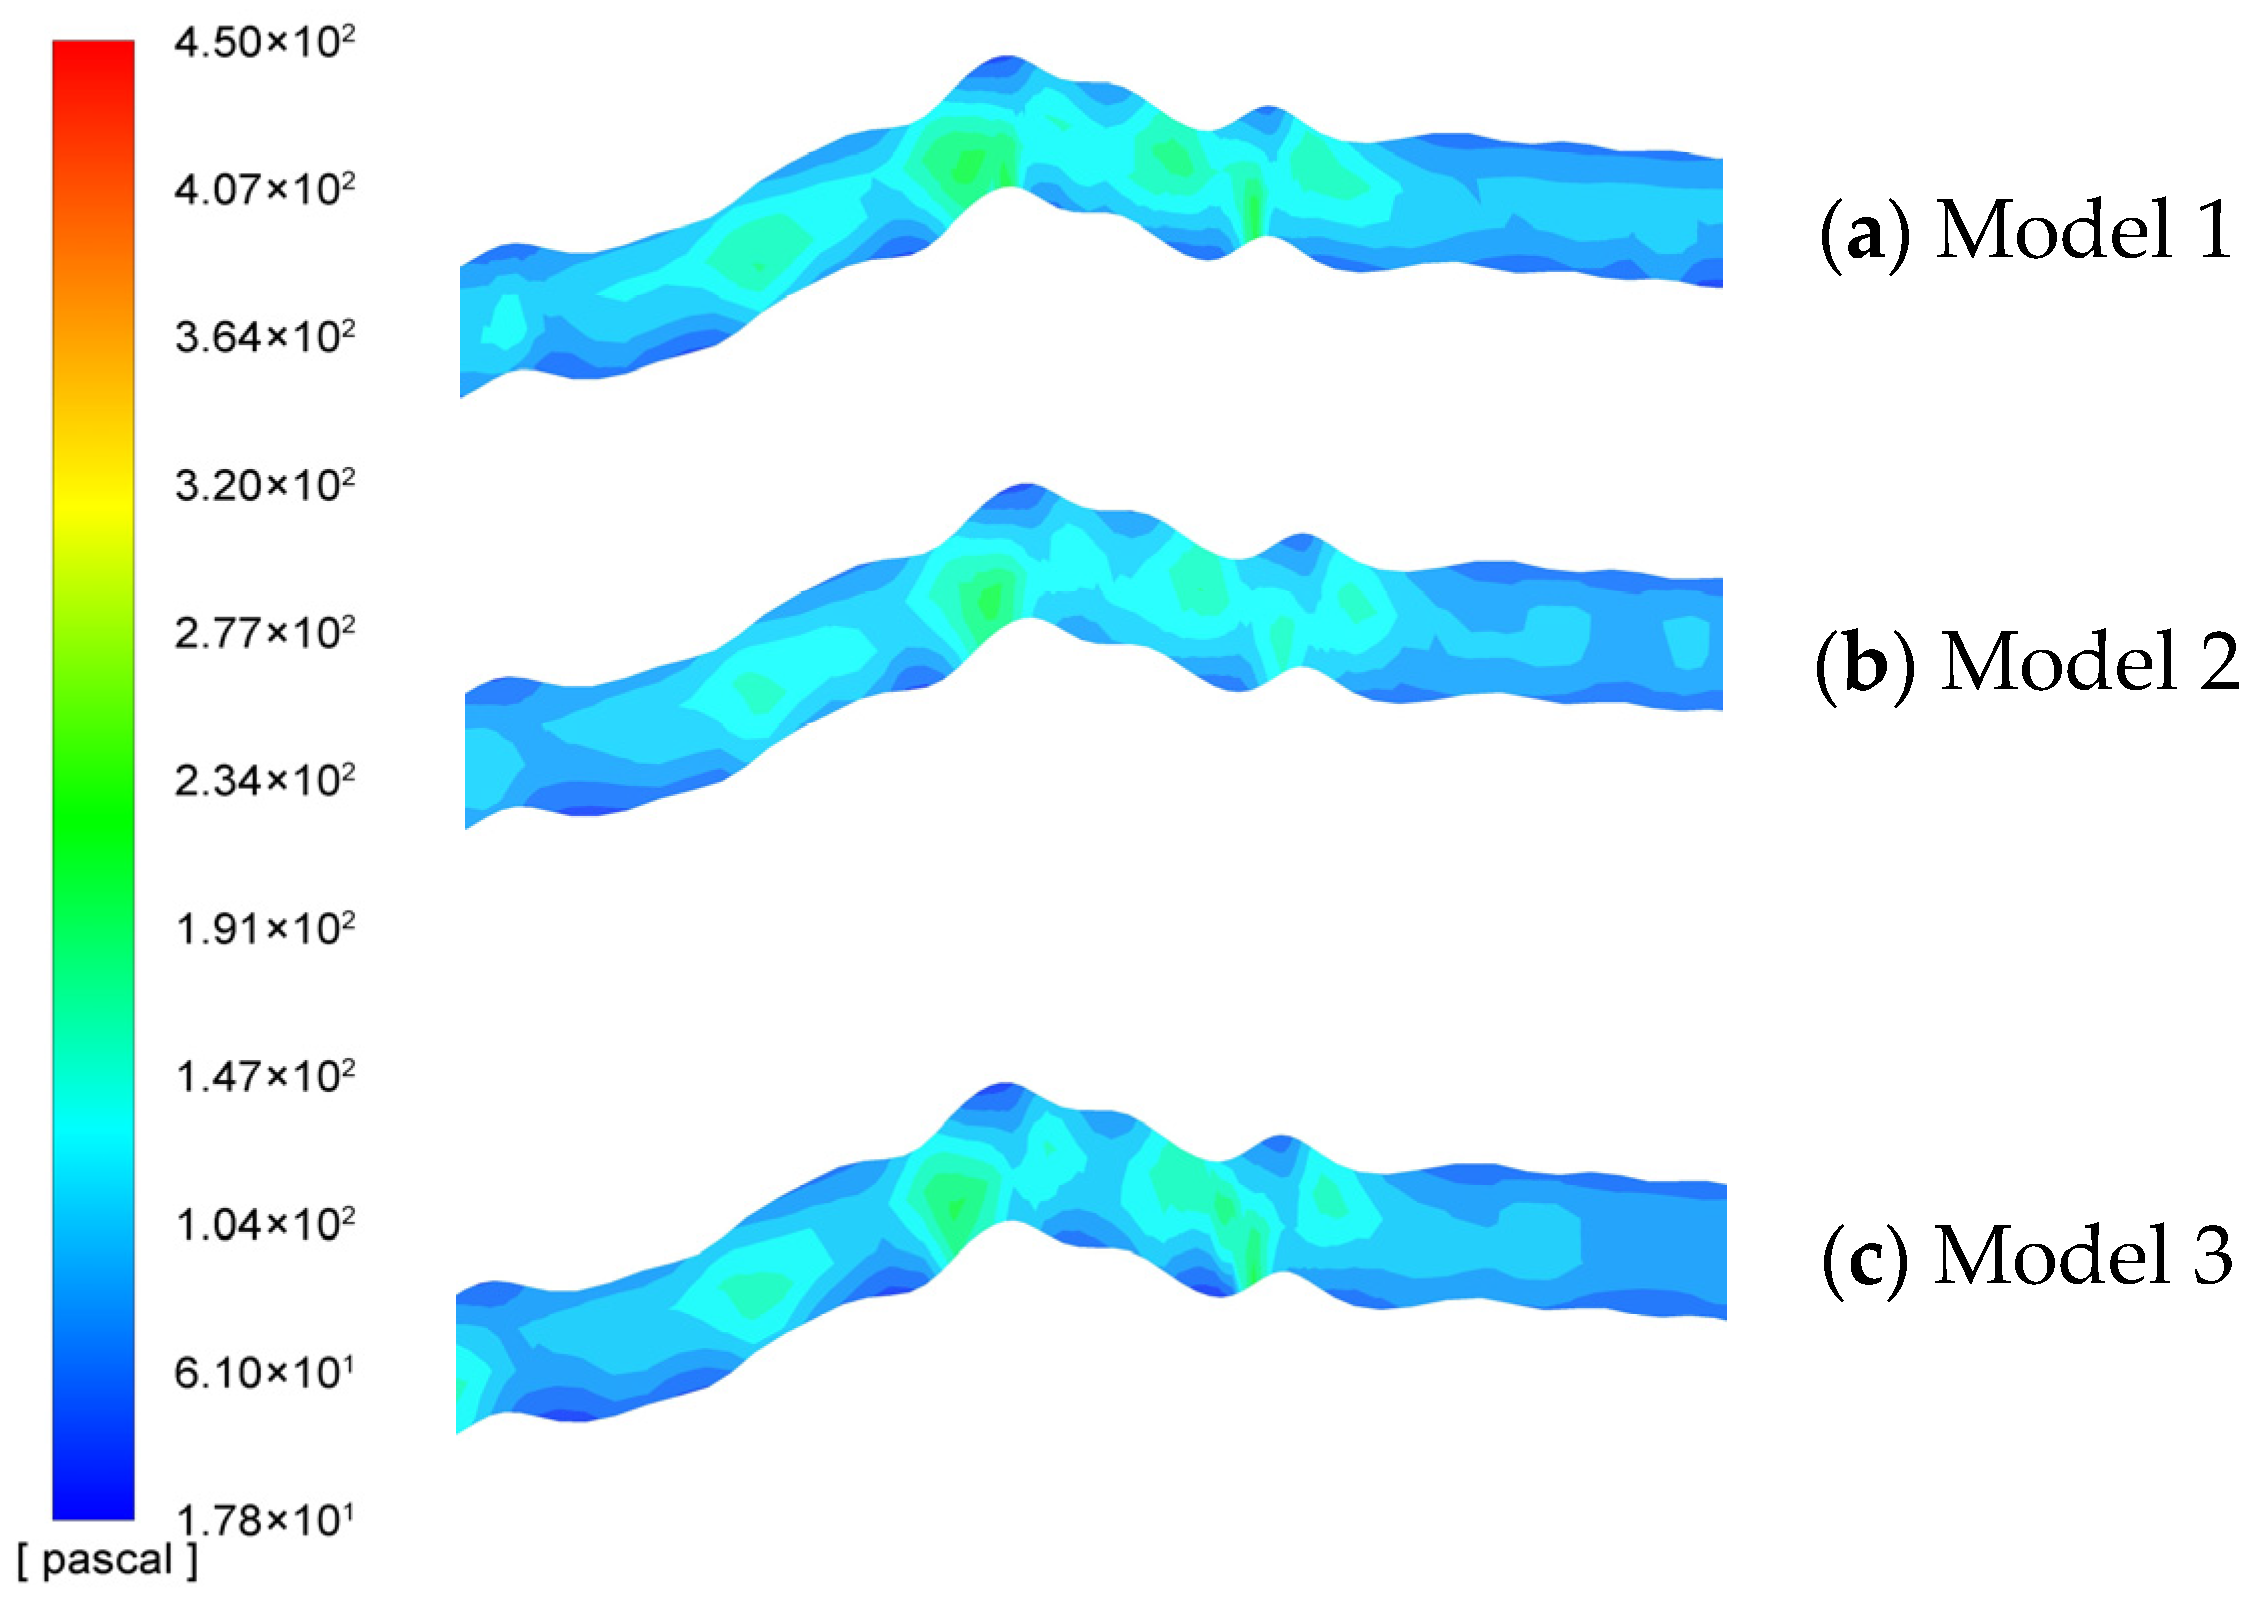
The pressure contours of the corresponding unit (
Figure 8) clarify the inherent mechanism of such differentiated velocity evolution to a certain extent. Obvious pressure-increasing regions are observed in both the ascending and Down-legs of the color-block unit: the pressure in the Up-leg reaches 1.91 × 10
2–2.77 × 10
2 Pa, and the Down-leg achieves a comparable pressure level. The pressure corresponding to the gentle color-block zones remains relatively stable at approximately 1.04 × 10
2–1.47 × 10
2 Pa.
The pressure rise in the Up-leg originates from the dynamic pressure conversion and convective inertia caused by the contraction and acceleration of the forced flow, where the adverse pressure gradient and inertial force jointly drive the initial acceleration of particles. From the perspective of force and energy balance, the pressure increment in the Up-leg is essentially the result of the conversion of flow kinetic energy into pressure energy, which provides the driving force for particle acceleration. The pressure increase in the Down-leg is related to the energy dissipation and potential energy release in the vortex region after flow separation; the coupled effects of pressure redistribution, flow separation and fluid potential energy maintain the high-speed motion of particles, and the energy balance between flow dissipation and potential energy release ensures the stable operation of the flow field. In the Flat-leg, the pressure gradient weakens, and the particle kinetic energy decays due to turbulent dissipation, which is consistent with the energy conservation law—the kinetic energy of particles is gradually converted into turbulent dissipation energy, leading to the attenuation of particle motion. In summary, this velocity evolution follows the flow laws governed by the Navier–Stokes equations, and results from the dynamic competition and balance between inertial force, pressure gradient and viscous force induced by the differentiated geometric morphology of multiple independent raised units in the rough fracture.
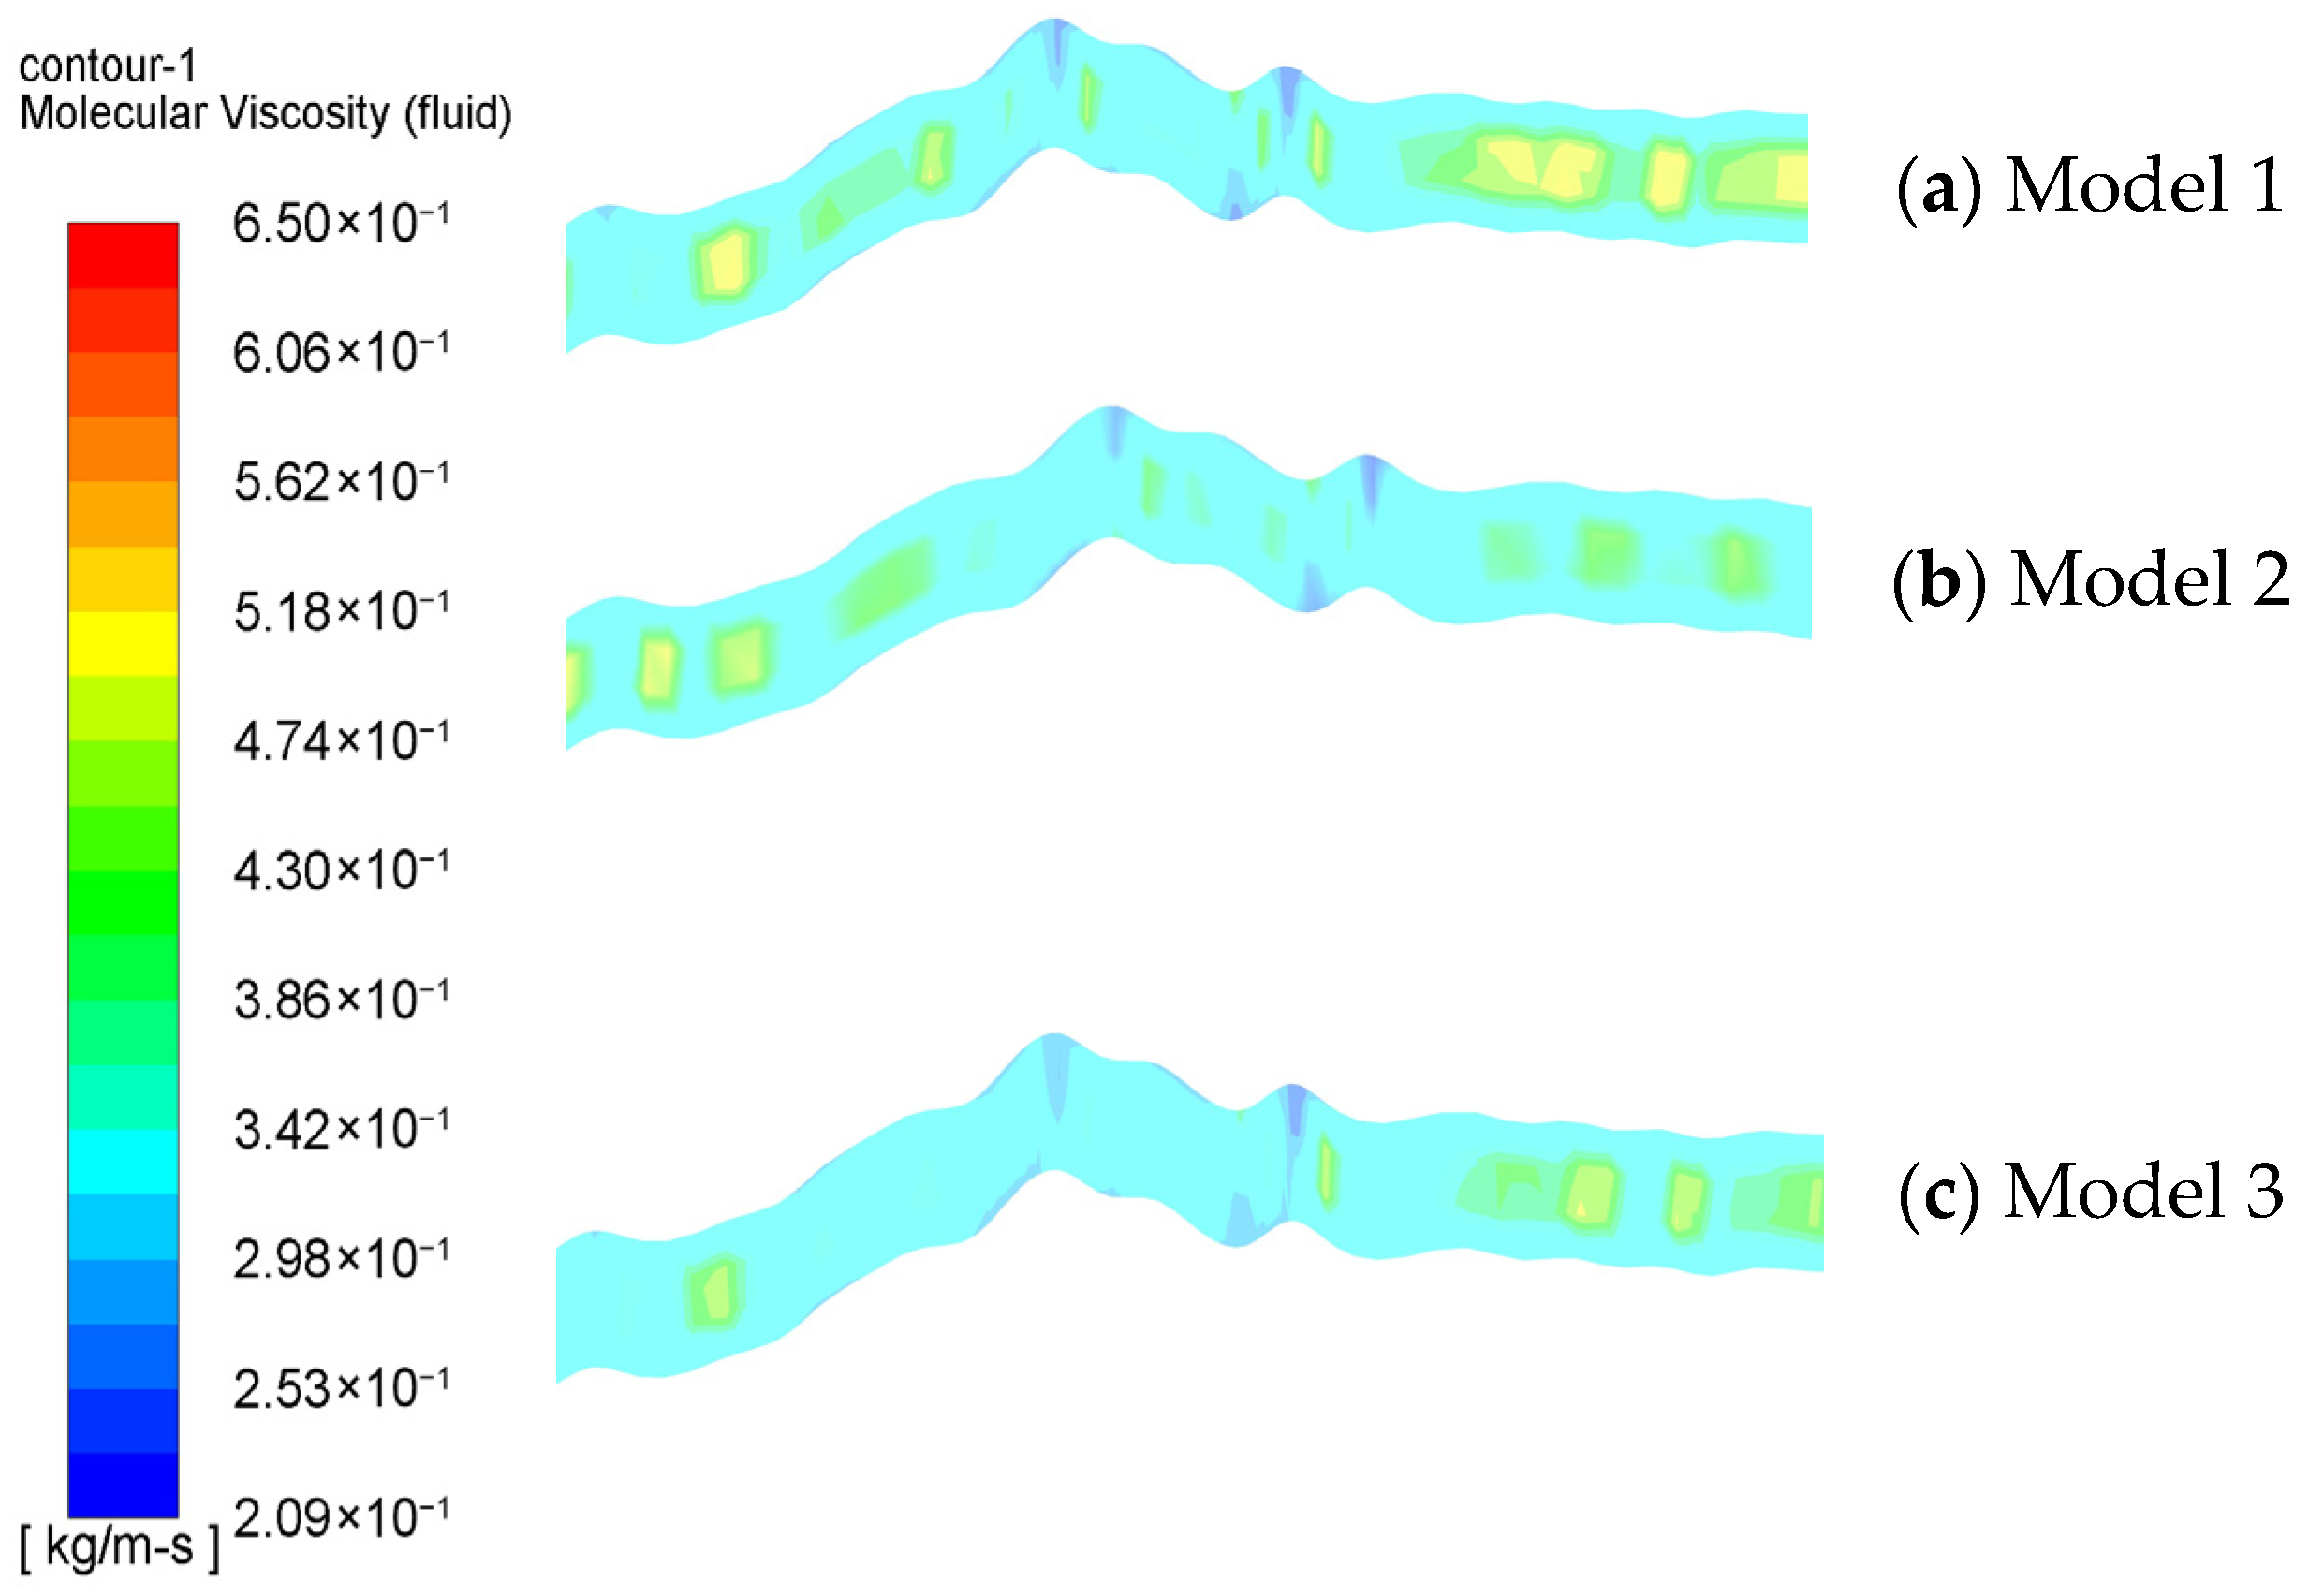
The corresponding viscosity contours of the identified elements (
Figure 9) were extracted to further elucidate the intrinsic mechanism governing the differential flow velocity evolution. The viscosity contours for both the ascending and descending segments of these elements reveal that the area fraction of high-viscosity regions (ranging from 0.342 to 0.518 kg/(m·s)) is significantly lower compared to the Flat-leg. In geometrically abrupt regions, such as the ascending and descending segments within the rough fractures, the constriction of flow channels forces the fluid to accelerate and undergo abrupt flow redirection. This process substantially amplifies the velocity differential between the mainstream core and the near-wall fluid layers, thereby intensifying the shear effects. The consequent reduction in viscosity diminishes flow resistance. Driven by a larger pressure gradient, the fluid flow velocity is markedly enhanced, leading to the formation of local high-velocity zones. According to the experimentally measured liquid-phase parameters (consistency index 1.53; power-law index 0.66; yield stress threshold 6.51 Pa), the grout presents obvious shear-thinning rheological behavior, so the enhanced shear action directly reduces the equivalent viscosity of the grout and further decreases flow resistance.
In the Flat-leg, however, the stable flow channel and uniform flow lead to weak shearing and high effective viscosity, which increases flow resistance and reduces velocity, resulting in a steady flow field. Overall, this velocity evolution follows the Navier–Stokes equations and arises from the dynamic competition and balance between pressure gradient and viscous forces caused by the varied geometries of the multiple independent asperity units in rough fractures.




 ,
,