Article

Experimental and Simulation Study on Liquid Entrainment in the Gas Cyclone–Liquid Jet Absorption Separator


1
National Engineering Research Center for Flue Gas Desulfurization, College of Architecture & Environment, Sichuan University, Chengdu 610065, China
2
College of Carbon Neutrality Future Technology, Sichuan University, Chengdu 610065, China
3
School of Mechanical and Power Engineering, East China University of Science and Technology, Shanghai 200237, China
*
Author to whom correspondence should be addressed.
Processes 2026, 14(6), 929; https://doi.org/10.3390/pr14060929
Submission received: 10 February 2026 / Revised: 4 March 2026 / Accepted: 10 March 2026 / Published: 15 March 2026
(This article belongs to the Section Separation Processes)

Abstract

Liquid entrainment presents a significant challenge in wet flue gas desulfurization systems, leading to downstream corrosion and secondary pollution. This study systematically investigates the characteristics of liquid entrainment and pressure drop in a gas cyclone–liquid jet absorption separator (GLAS) through both experimental and simulation methods. The effects of inlet gas flow rate (QG), absorbent flow rate (QL), overflow pipe insertion depth, and the presence of a liquid-guiding cover (LGC) were evaluated. The results revealed that liquid entrainment initially increased and then decreased with rising QG, QL, and insertion depth of overflow pipe, given the competing effects of turbulent jet breakup and centrifugal separation. To mitigate liquid entrainment, a novel LGC was introduced at the overflow pipe outlet. This intervention resulted in a reduction in liquid entrainment by up to 23.9%, achieved through physical interception and inertial impaction, while maintaining the difference value of pressure drop of less than 302 Pa. The numerical simulations further analyzed the gas–liquid two-phase distributions in GLAS under various operating conditions, with results that align well with experimental observations. These findings offer valuable insights for mitigating liquid entrainment in GLAS and optimizing its industrial applications.

1. Introduction

Pillar industries driving economic development, such as power generation, steel manufacturing, and cement production, release substantial volumes of SO2-containing flue gas during industrial processes [1,2,3]. Globally, approximately 1.05 × 10² teragrams of SO2 are emitted into the atmosphere annually. As a highly soluble, irritating, and corrosive gas, SO2 readily dissolves in atmospheric moisture to form acid rain and ultrafine particulate matter, which accelerates ecological damage and air pollution. Furthermore, inhalation of SO2 poses severe health risks, particularly to the respiratory system, thereby presenting a major threat to public health [4,5,6]. To mitigate gaseous SO2 emissions, dry, semi-dry, and wet flue gas desulfurization (FGD) technologies have been widely adopted [7].
Wet flue gas desulfurization technologies are the most extensively applied, owing to their low operating costs, technological maturity, and high sulfur removal efficiency [8,9,10]. Wet desulfurization equipment, including spray towers, packed columns, and Venturi scrubbers, has been widely employed in industrial facilities for flue gas desulfurization. Spray towers are characterized by simple structures, low capital costs, and excellent adaptability to load fluctuations. However, liquid entrainment is prone to occur due to excessive gas velocities and demister blockage, resulting in downstream corrosion and scaling [11]. Similarly, packed columns provide a high specific surface area, facilitating efficient mass transfer and high desulfurization efficiency. Nevertheless, they are susceptible to excessive liquid loading, which can induce liquid entrainment and gas-phase carryover [12]. Severe liquid entrainment significantly impairs desulfurization efficiency, leading to secondary pollution and substantial increases in operating costs. In contrast, Venturi scrubbers exhibit exceptionally high gas–liquid mass transfer efficiency, as the extremely high gas velocity at the throat atomizes liquid into droplets. However, inadequate gas–liquid separation in downstream cyclone separators tends to result in liquid entrainment, which may cause corrosion of downstream pipelines [13]. Therefore, mitigating liquid entrainment in wet desulfurization systems is a critical strategy for reducing operating costs and extending equipment service life.
Numerous studies have explored strategies to mitigate liquid entrainment in desulfurization equipment. Cejpek et al. examined the relationship between spray characteristics, entrainment fraction, and pressure drop (ΔP) in spray towers [14]. Using an entrainment model, they demonstrated that optimizing droplet size and velocity effectively minimizes liquid entrainment. Kister et al. showed that liquid entrainment and its adverse effects can be mitigated or eliminated through measures such as adopting well-vented spray distributors, reducing cascade height, and adding defoaming agents in specific cases [15]. Ananthanarayanan et al. found that reducing nozzle spacing in Venturi scrubbers prevents spray interference and subsequent liquid accumulation, thereby mitigating the risk of localized entrainment [16]. They further reported that optimizing nozzle diameter combinations or redistributing liquid flow across nozzles effectively avoids liquid-phase concentration along single pathways, thus reducing overall entrainment. However, existing research primarily focuses on liquid entrainment in traditional absorption equipment. These devices are often governed by gravity settling and downstream demisting, whereas the cyclone-based gas–liquid absorption separator couples jet atomization and swirl separation in a compact volume, which may introduce distinct entrainment pathways and different design considerations.
The Gas–Liquid Absorption Separator (GLAS), developed from conventional cyclone separator designs, is an innovative gas absorption separation device that has garnered significant attention due to its simple structure, high separation efficiency, and low investment cost. Upon entering the GLAS, gas enters the device through a tangential inlet, and it develops a strong swirling flow. The injected liquid jet continuously interacts and collides with the rapidly rotating gas, and the high-velocity gas imposes strong aerodynamic shear and impingement on the jet. As a result, the continuous liquid column rapidly destabilizes and breaks up, atomizing into numerous droplets and liquid film and thereby increasing the interfacial area available for gas–liquid mass transfer [17,18]. Meanwhile, under the static high-gravity environment generated by the strong swirling flow, droplets and liquid fragments rotate at high speed with the gas stream and undergo pronounced shape oscillations and rapid surface renewal. These effects enhance interfacial mixing and reduce mass-transfer resistance across the gas–liquid interface [19]. Because the GLAS is derived from cyclone-based separators, its liquid entrainment behavior is closely related to entrainment mechanisms reported for other swirling gas–liquid separators. Wang et al. measured the upper swirling liquid film thickness of a gas–liquid cylindrical cyclone (GLCC) and reported that both gas and liquid velocities markedly affect film thickness and flow patterns, which directly relates to liquid entrainment risk [20]. Xie et al. combined visual observation with quantitative measurements of overflow liquid flow rate and liquid holdup in a gas–liquid cyclone separator and identified that the size of the air core determines two kinds of sources of liquid entrainment, including the surrounding liquid direct entry into the overflow pipe and the film short-circuit flow beneath the top wall of the separator [21]. Kim et al. evaluated a swirl-vane moisture separator using an air–water facility and quantified the moisture carry-over under a wide range of conditions, providing an experimental basis to relate carry-over to operating regimes and pressure drop constraints [22]. Berrio et al. optimized the inlet geometry of the up-branched dual-inlet configuration in a GLCC by employing the Reynolds Stress Model (RSM) and Volume of Fluid (VOF) [23]. The optimized inlet geometry reduced the liquid film in the upper cylinder and decreased the occurrence of liquid entrainment. Luo et al. implemented a VOF-based slug-flow inlet method and analyzed how slug dissipation in the inlet pipe alters the internal flow field, thereby providing a route to link upstream unsteadiness with downstream carry-over tendencies in GLCC [24]. These insights provide a useful context for discussing entrainment in the GLAS. As a static high-gravity device, GLAS exhibits remarkable resistance to scaling and clogging [25,26]. Furthermore, the system has been successfully utilized to remove a wide range of flue gas pollutants, including CS2, CO2, NH3, HCl, SOX, and NOX [25,27,28,29]. Although the GLAS achieves a tenfold increase in mass transfer coefficient and an 80% reduction in equipment volume compared to conventional devices [18,27], it is also challenged by liquid entrainment. Current research has primarily focused on the effects of operational and geometric parameters on GLAS performance, aiming to optimize its structural design, including jet orifice size, gas and liquid phase velocities, and overflow pipe diameter [28,30]. Whereas the mechanisms of liquid entrainment in the GLAS have not yet been systematically studied, nor have effective strategies to mitigate liquid entrainment been developed.
This study combines experiments and CFD to quantify liquid entrainment and pressure drop in the GLAS under various operating conditions. Key parameters examined include gas flow rate (QG), absorbent flow rate (QL), and the insertion depth of the overflow pipe. To mitigate liquid entrainment in the GLAS, we also evaluated the impact of the liquid-guiding cover (LGC) on both liquid entrainment and pressure drop, and further analyzed the correlation coefficients between liquid entrainment and the key parameters. The findings of this research will enhance the understanding of liquid entrainment mechanisms in GLAS and contribute to reducing liquid entrainment in its industrial applications.

2. Materials and Methods

2.1. Gas Cyclone–Liquid Jet Absorption Separator

The structure of GLAS is illustrated in Figure 1. The separator was composed of an internal cylinder and an external jacket. The cylinder was divided into two parts, the upper cylindrical section H1 and the conical section H2. The gas inlet of the GLAS was rectangular and tangentially aligned with the upper cylindrical section, enabling efficient gas entry into the separator. Two liquid inlet holes were symmetrically arranged on opposite sides of the midsection of the outside jacket, allowing for uniform distribution of QL at both inlets. The jet holes, each with a diameter of 1.2 mm, were located on the inner wall of the upper cylindrical section. A total of four layers of jet holes were installed, with six uniformly spaced holes per layer. The layers were arranged in a vertically staggered configuration to enhance distribution uniformity. The LGC, comprising a top cap and sidewalls, was connected to the overflow pipe. Its insertion depth was S, and all other dimensional specifications are detailed in Table 1.

2.2. Structure of the LGC

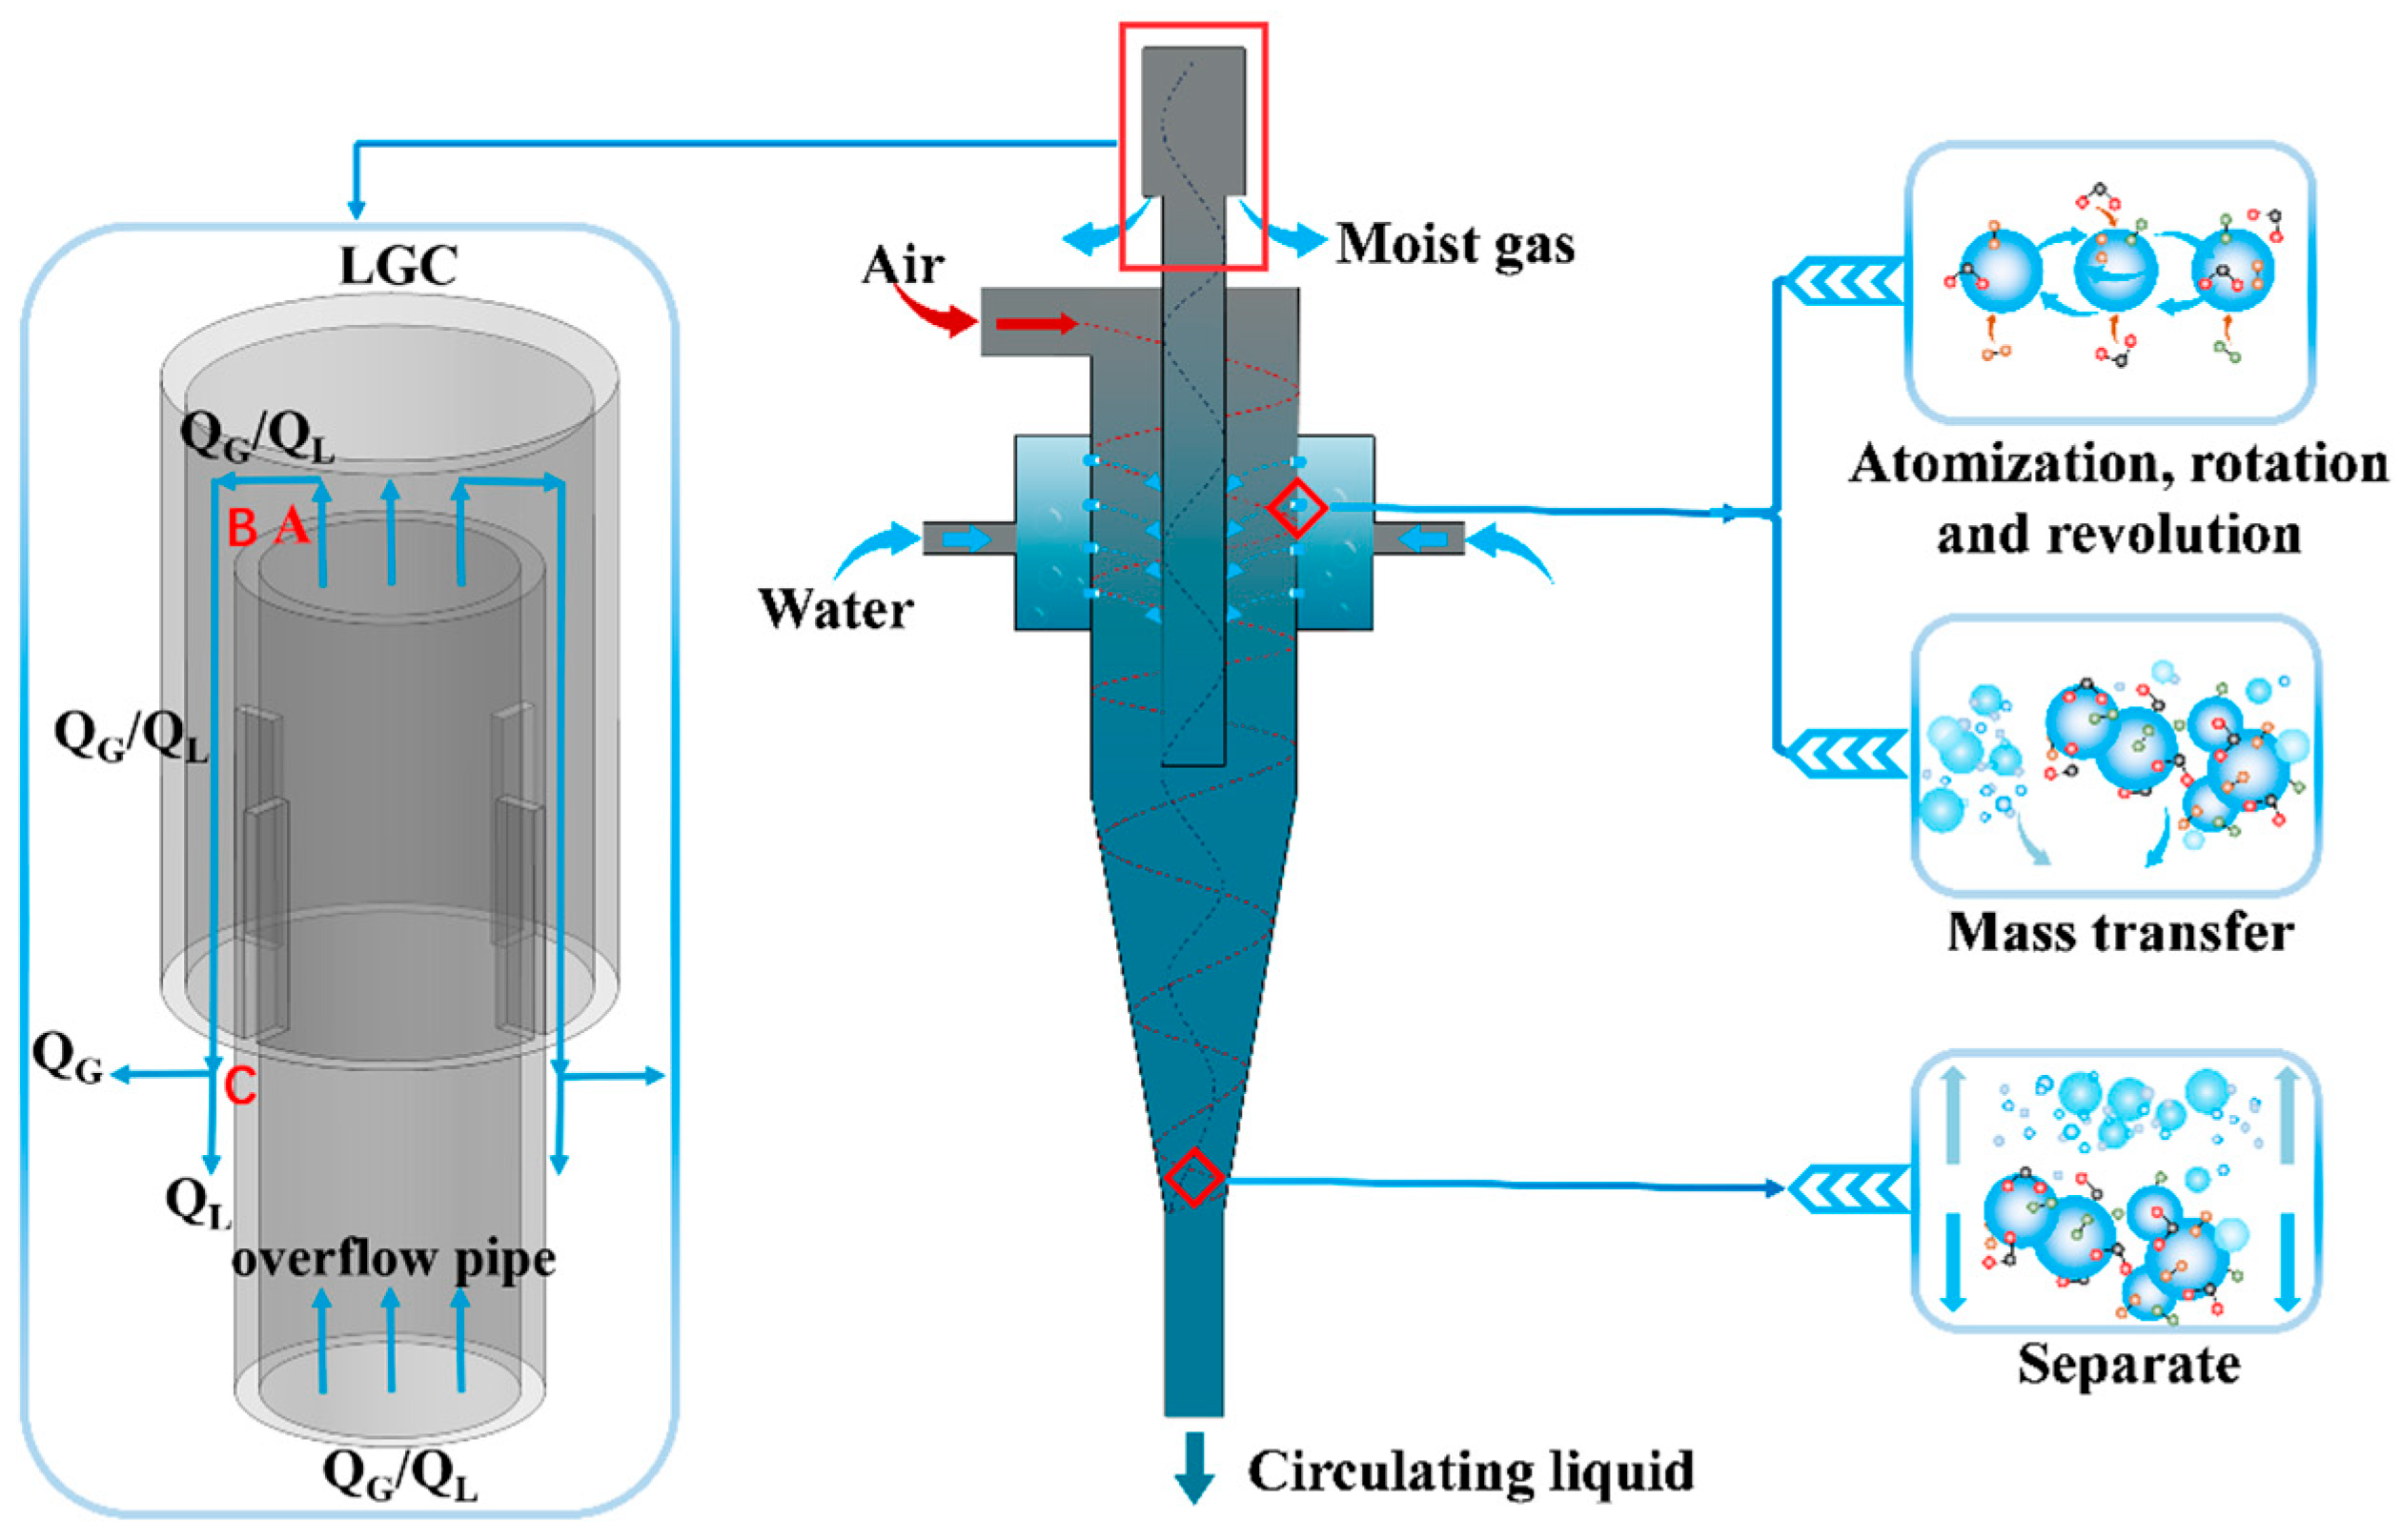
The separation mechanism of the LGC involves a multi-stage process governed by inertial impaction and gravitational settling, as illustrated in Figure 2. The gas–liquid mixture initially flowed axially upward through the overflow pipe. At Position A, the gas phase exhibited its maximum axial velocity of about 15 m/s at maximum when QG was 43.75 m3/h. Upon impinging onto the top LGC center, this high-velocity flow encountered a stagnation layer where the axial velocity instantaneously dropped to zero. This drastic velocity decay forced the flow to redirect radially outward, while liquid possessing high inertia failed to follow the streamlines and was captured on the LGC surface. At Position B, after being redirected, the gas accelerated radially outward, attaining a high radial velocity before striking the LGC sidewall. At this impact zone, the radial velocity component again vanished to zero, constraining the gas to turn 90° downward. The liquid, maintaining its high radial momentum, impinged on the wall to form a liquid film, which drained downward driven by gravity. As the fluid entered the annular gap, the gas velocity increased due to the reduction in cross-sectional area. Within the LGC annular gap, the intense swirling flow generated significant centrifugal forces that drove droplets and film fragments toward the sidewall, where they were assimilated into the descending liquid film. At Position C, entrained liquid decoupled from the gas flow and descended under gravity. This mechanism leverages the mass disparity between the gas and liquid phases, which leads to distinct responses to inertial forces after collisions, as well as differences in velocity decay times and directional shifts. The multi-stage LGC was developed with a high degree of coupling to GLAS. This design effectively mitigates liquid entrainment within the GLAS system.

2.3. Experimental System

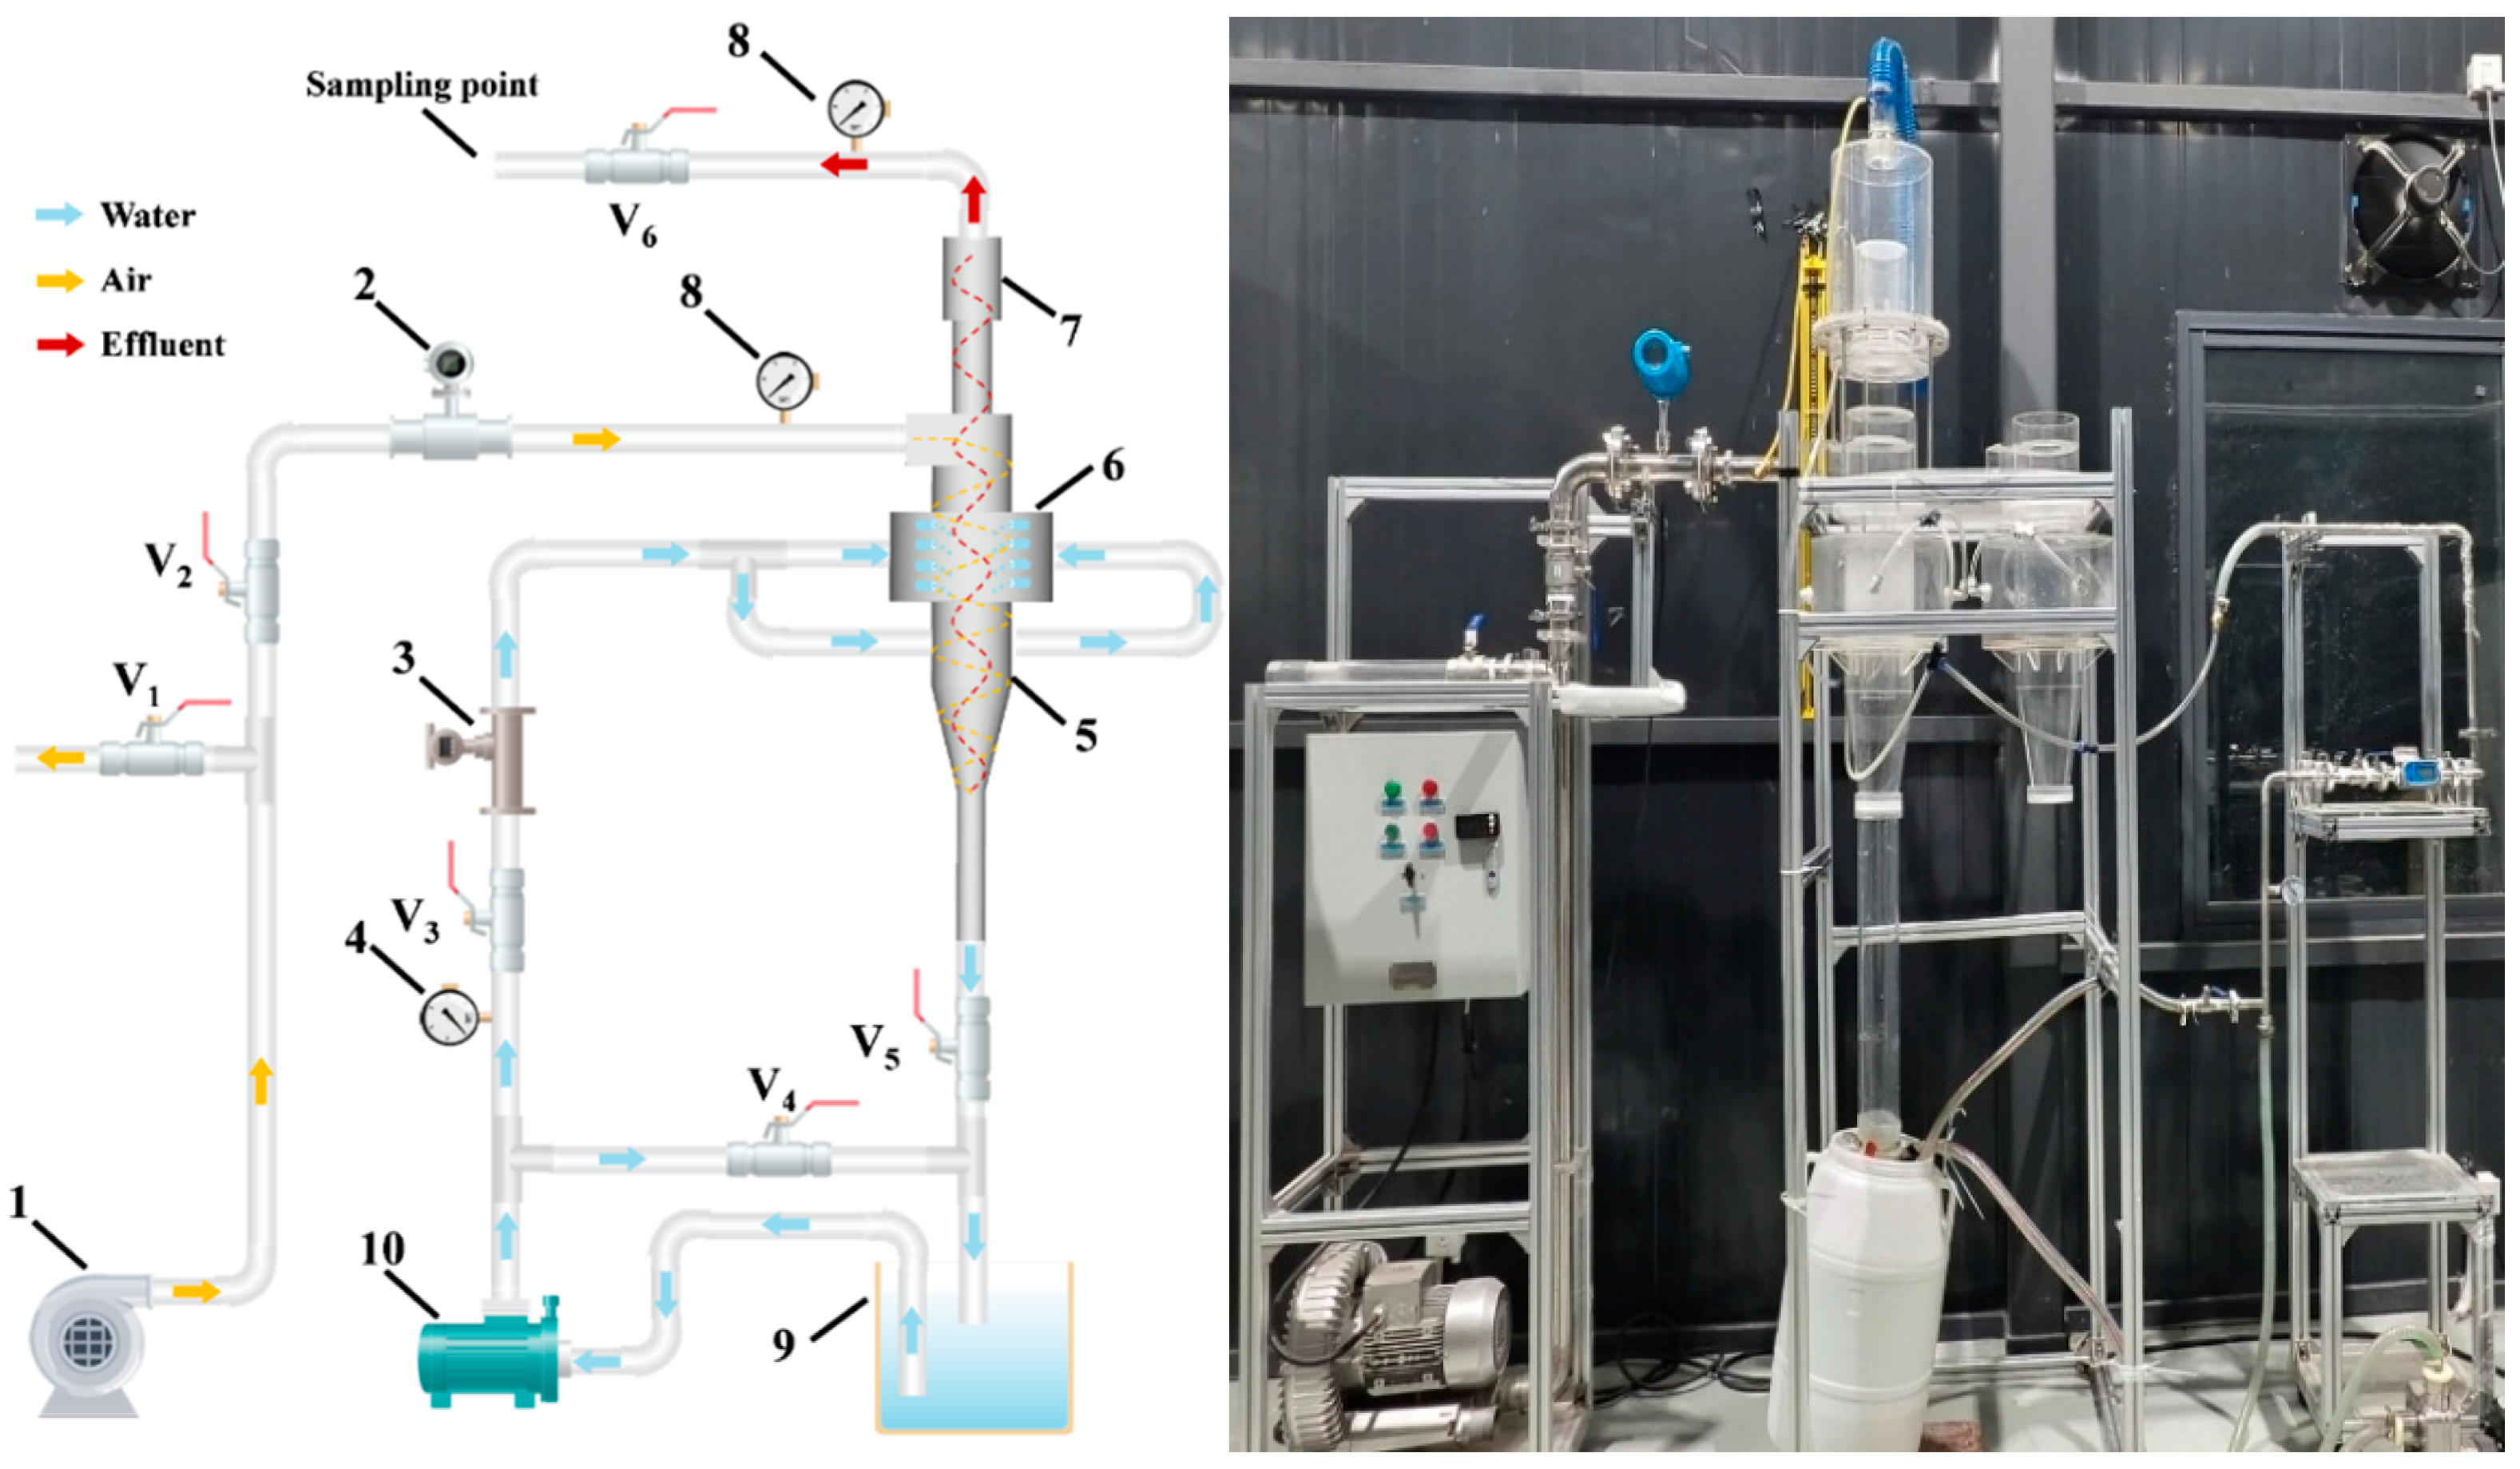
Figure 3 shows the flowchart and photo of this experimental system, which consisted of a GLAS, an LGC, a circulating liquid pump, a fan, a liquid circulation tank, a gas flowmeter, a liquid flowmeter, a gas pressure gauge, a liquid pressure gauge, a jacket, an LGC, and so forth, as detailed in Table 2. By using overflow pipes of varying lengths, the insertion depth ratio (S/H1) was adjusted to controlled values of 0.2, 0.4, 0.6, 0.8, and 1.0, where S was the insertion depth of the overflow pipe. Before the experiment, the water in the liquid circulation tank (9) was replaced, and all components of the experimental system were thoroughly inspected to ensure proper operation. The fan (1) was activated, and QG (12.50, 18.75, 25.00, 31.25, 37.50, and 43.75 m3/h) was adjusted by manipulating the bypass valve (V1) and the main flow valve (V2). The reading on the gas flowmeter (2) was monitored and recorded, and QG was maintained at a constant value under the specific experiment conditions. Then, the circulating liquid pump (10) was activated, and QL (0.65, 1.30, 1.95, 2.60, 4.55, and 6.50 L/min) was controlled by adjusting the main valve (V3) and the bypass valve (V4). The liquid flowmeter (3) was observed, and its reading was recorded to ensure flow stability during the operation. Special attention was paid to the liquid pressure gauge (4), which was kept below 0.2 MPa to prevent potential detachment at pipe joints that could lead to liquid ejection and electrical safety hazards. Driven by the circulating liquid pump, the liquid was radially injected through jet holes in the inner wall jacket (6) into the separator (5), while high-velocity gas entered tangentially from the top inlet. The liquid jets were sheared into liquid fragments and droplets by high-speed gas, and then most liquid fragments and droplets were separated at the conical section by centrifugal force and collected in the liquid circulation tank. Some liquid fragments and droplets contained in the gas ultimately escaped through the overflow pipe and impinged into LGC top and moved axially downward under the influence of gravity. In contrast, the remaining gas–liquid mixture passed through the LGC (8), where gas–liquid separation occurred due to differences in the gravitational and inertial forces acting on the two phases. The liquid entrainment was quantified using a volumetric sampling method. The entrained droplets and liquid film were intercepted by the LGC and drained through a dedicated outlet hole at the bottom. A flexible hose was connected to this outlet to guide the collected liquid into a beaker. To ensure data reliability, a rigorous protocol was followed. For each operating condition, the system was first allowed to stabilize for 5 min to ensure a steady gas–liquid flow. Subsequently, the entrained liquid was collected over a fixed sampling interval of 10 min. The volume of the collected liquid was measured using a graduated cylinder, and the entrainment rate was calculated. The liquid entrainment percentage was determined by calculating the ratio of the measured entrained liquid in the gas phase to QL at the inlet during the experiment. Additionally, the gas pressure gauge (8) at both the inlet and outlet was measured to the ΔP across the separator. All experimental runs were repeated three times under identical conditions to minimize random errors. If outliers were observed, three additional measurements were conducted. The final result was calculated as the arithmetic mean after excluding the data points with significant deviations. The experimental uncertainty is presented as error bars in the corresponding figures depicting the results.

3. Experimental Results

3.1. The Effect of Gas Flow Rate

In order to more accurately analyze the motion behavior of the liquid phase jet in the gas phase swirling flow field, the region near the liquid injection port was defined as the jet atomization zone. In this zone, the liquid first formed a coherent jet. It then rapidly destabilized under strong aerodynamic shear and impingement from the swirling gas, leading to breakup and atomization. The region beneath the LGC top cover was defined as the low-velocity stagnation zone. In this region, droplets and liquid fragments had sufficiently large inertia that they could not follow the sharply curved streamlines of the carrier flow and impinged upon the wall, thereby achieving separation.
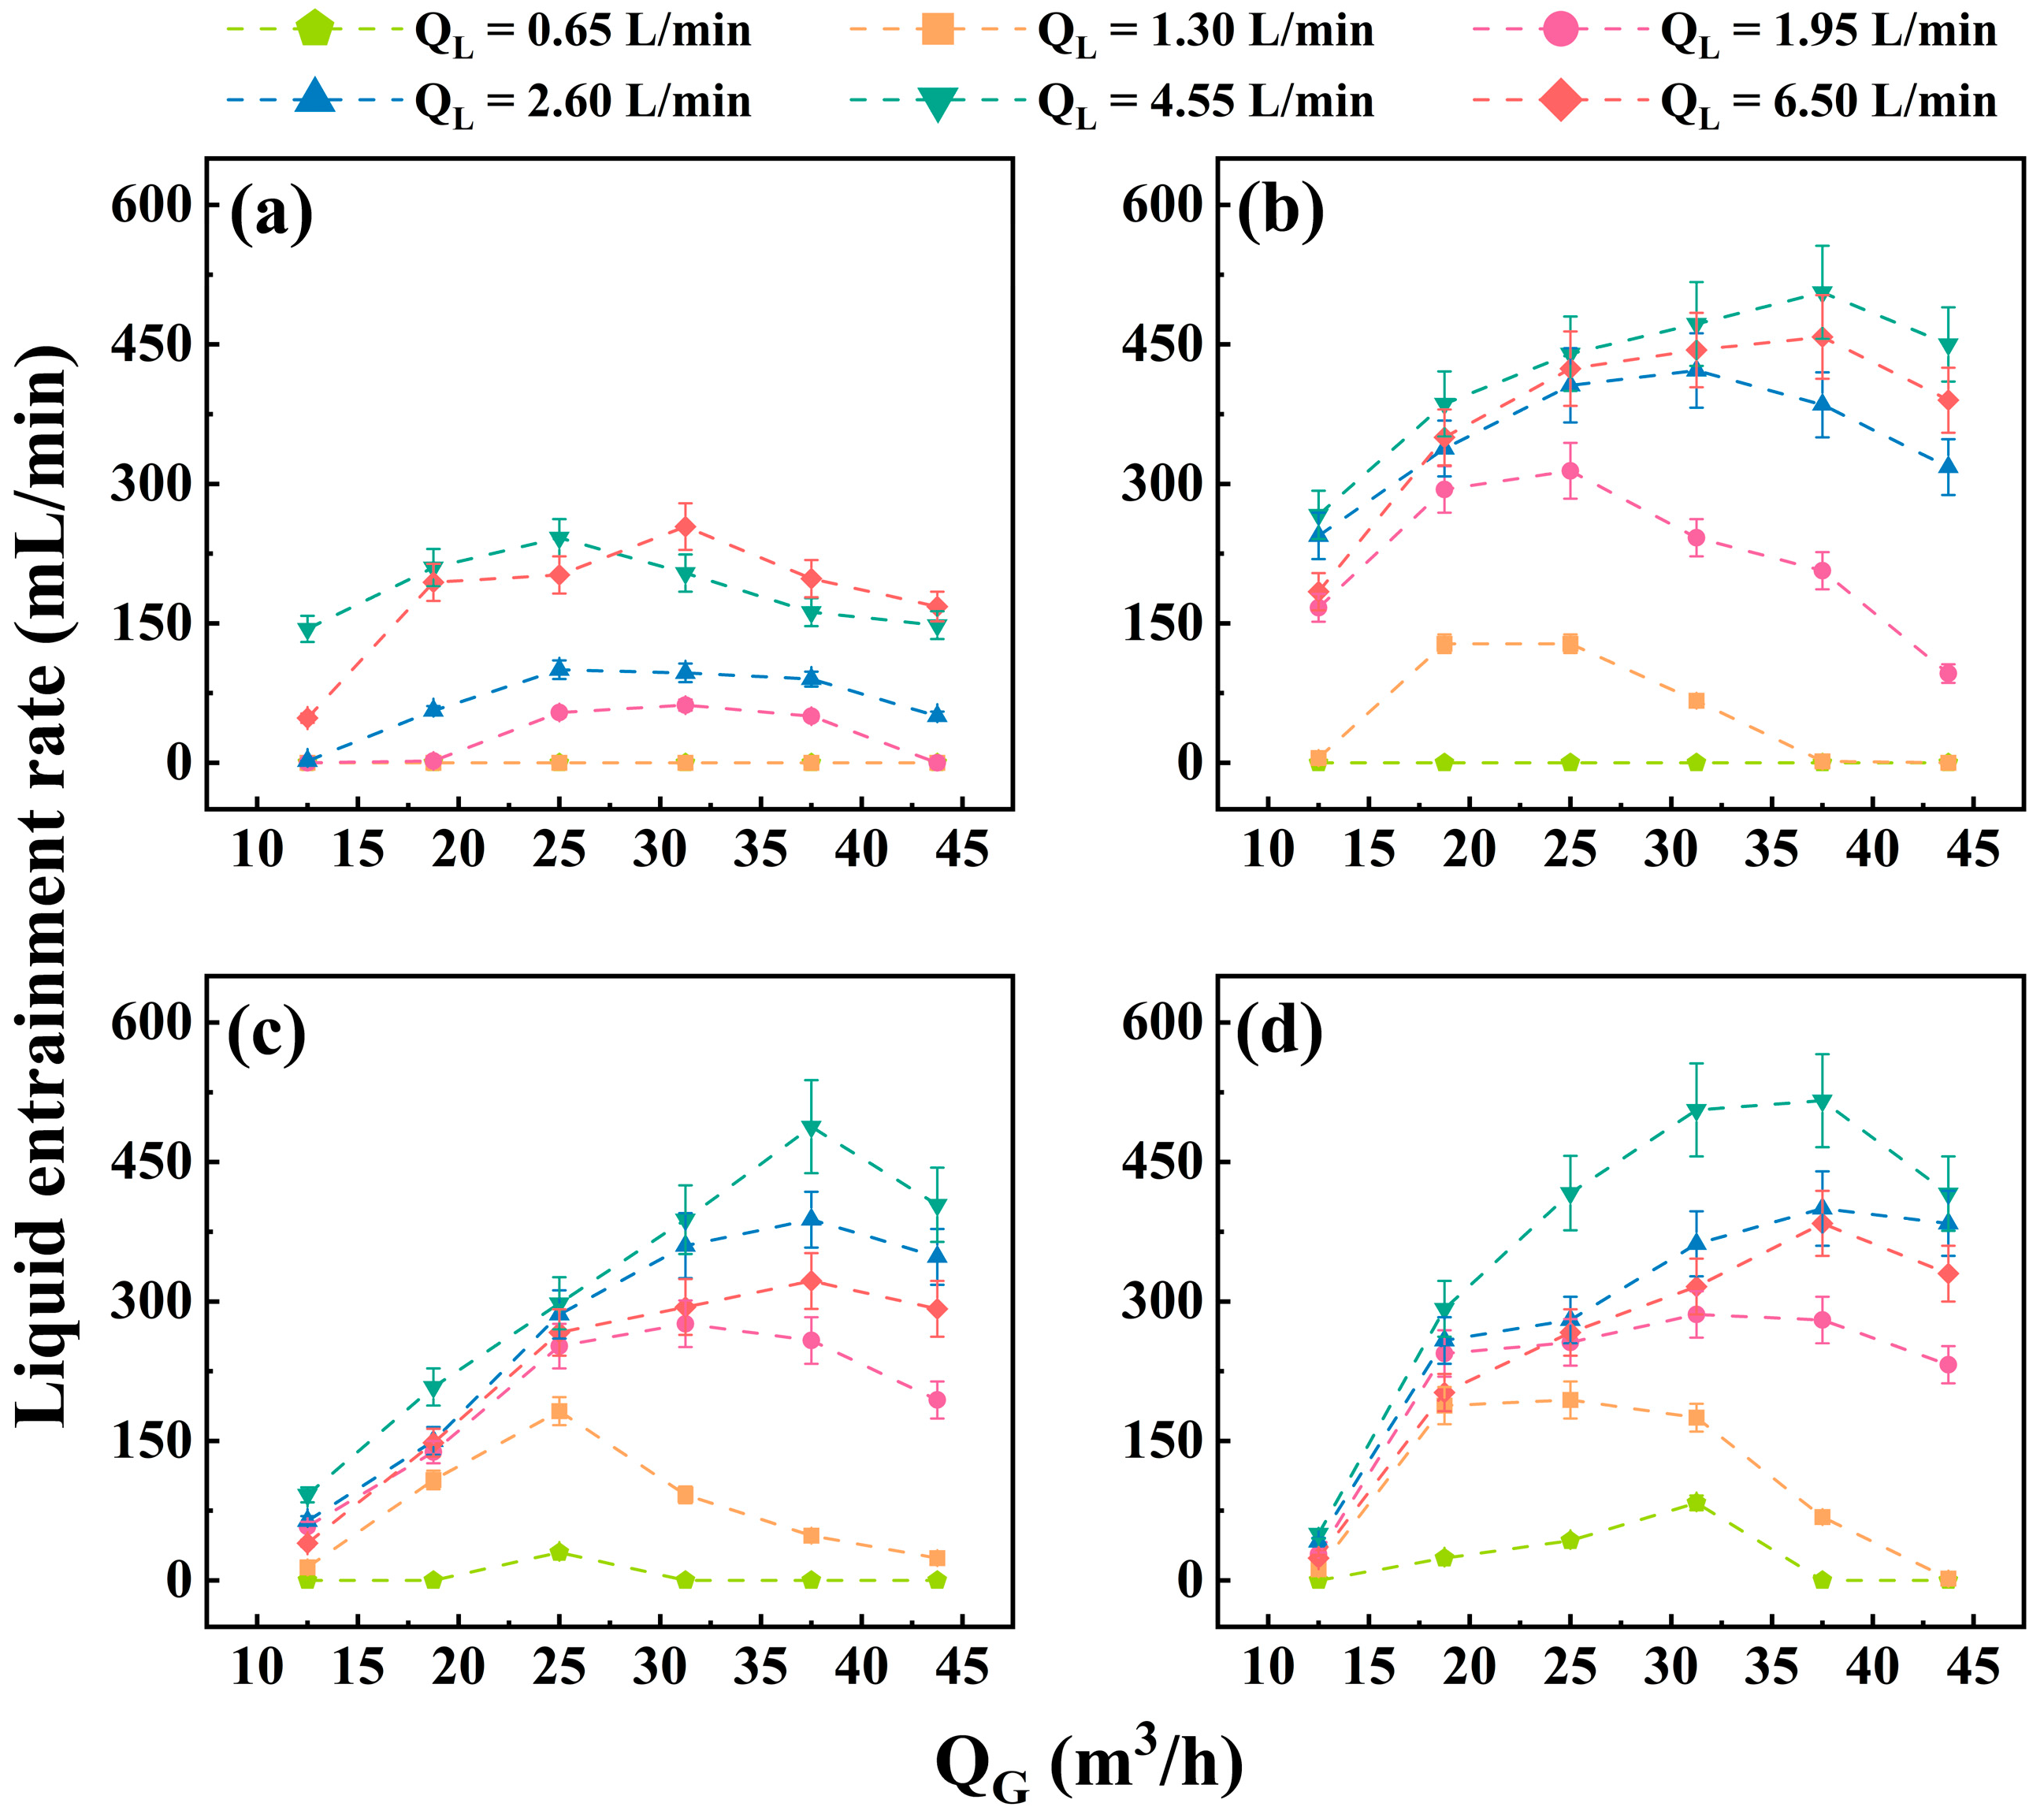
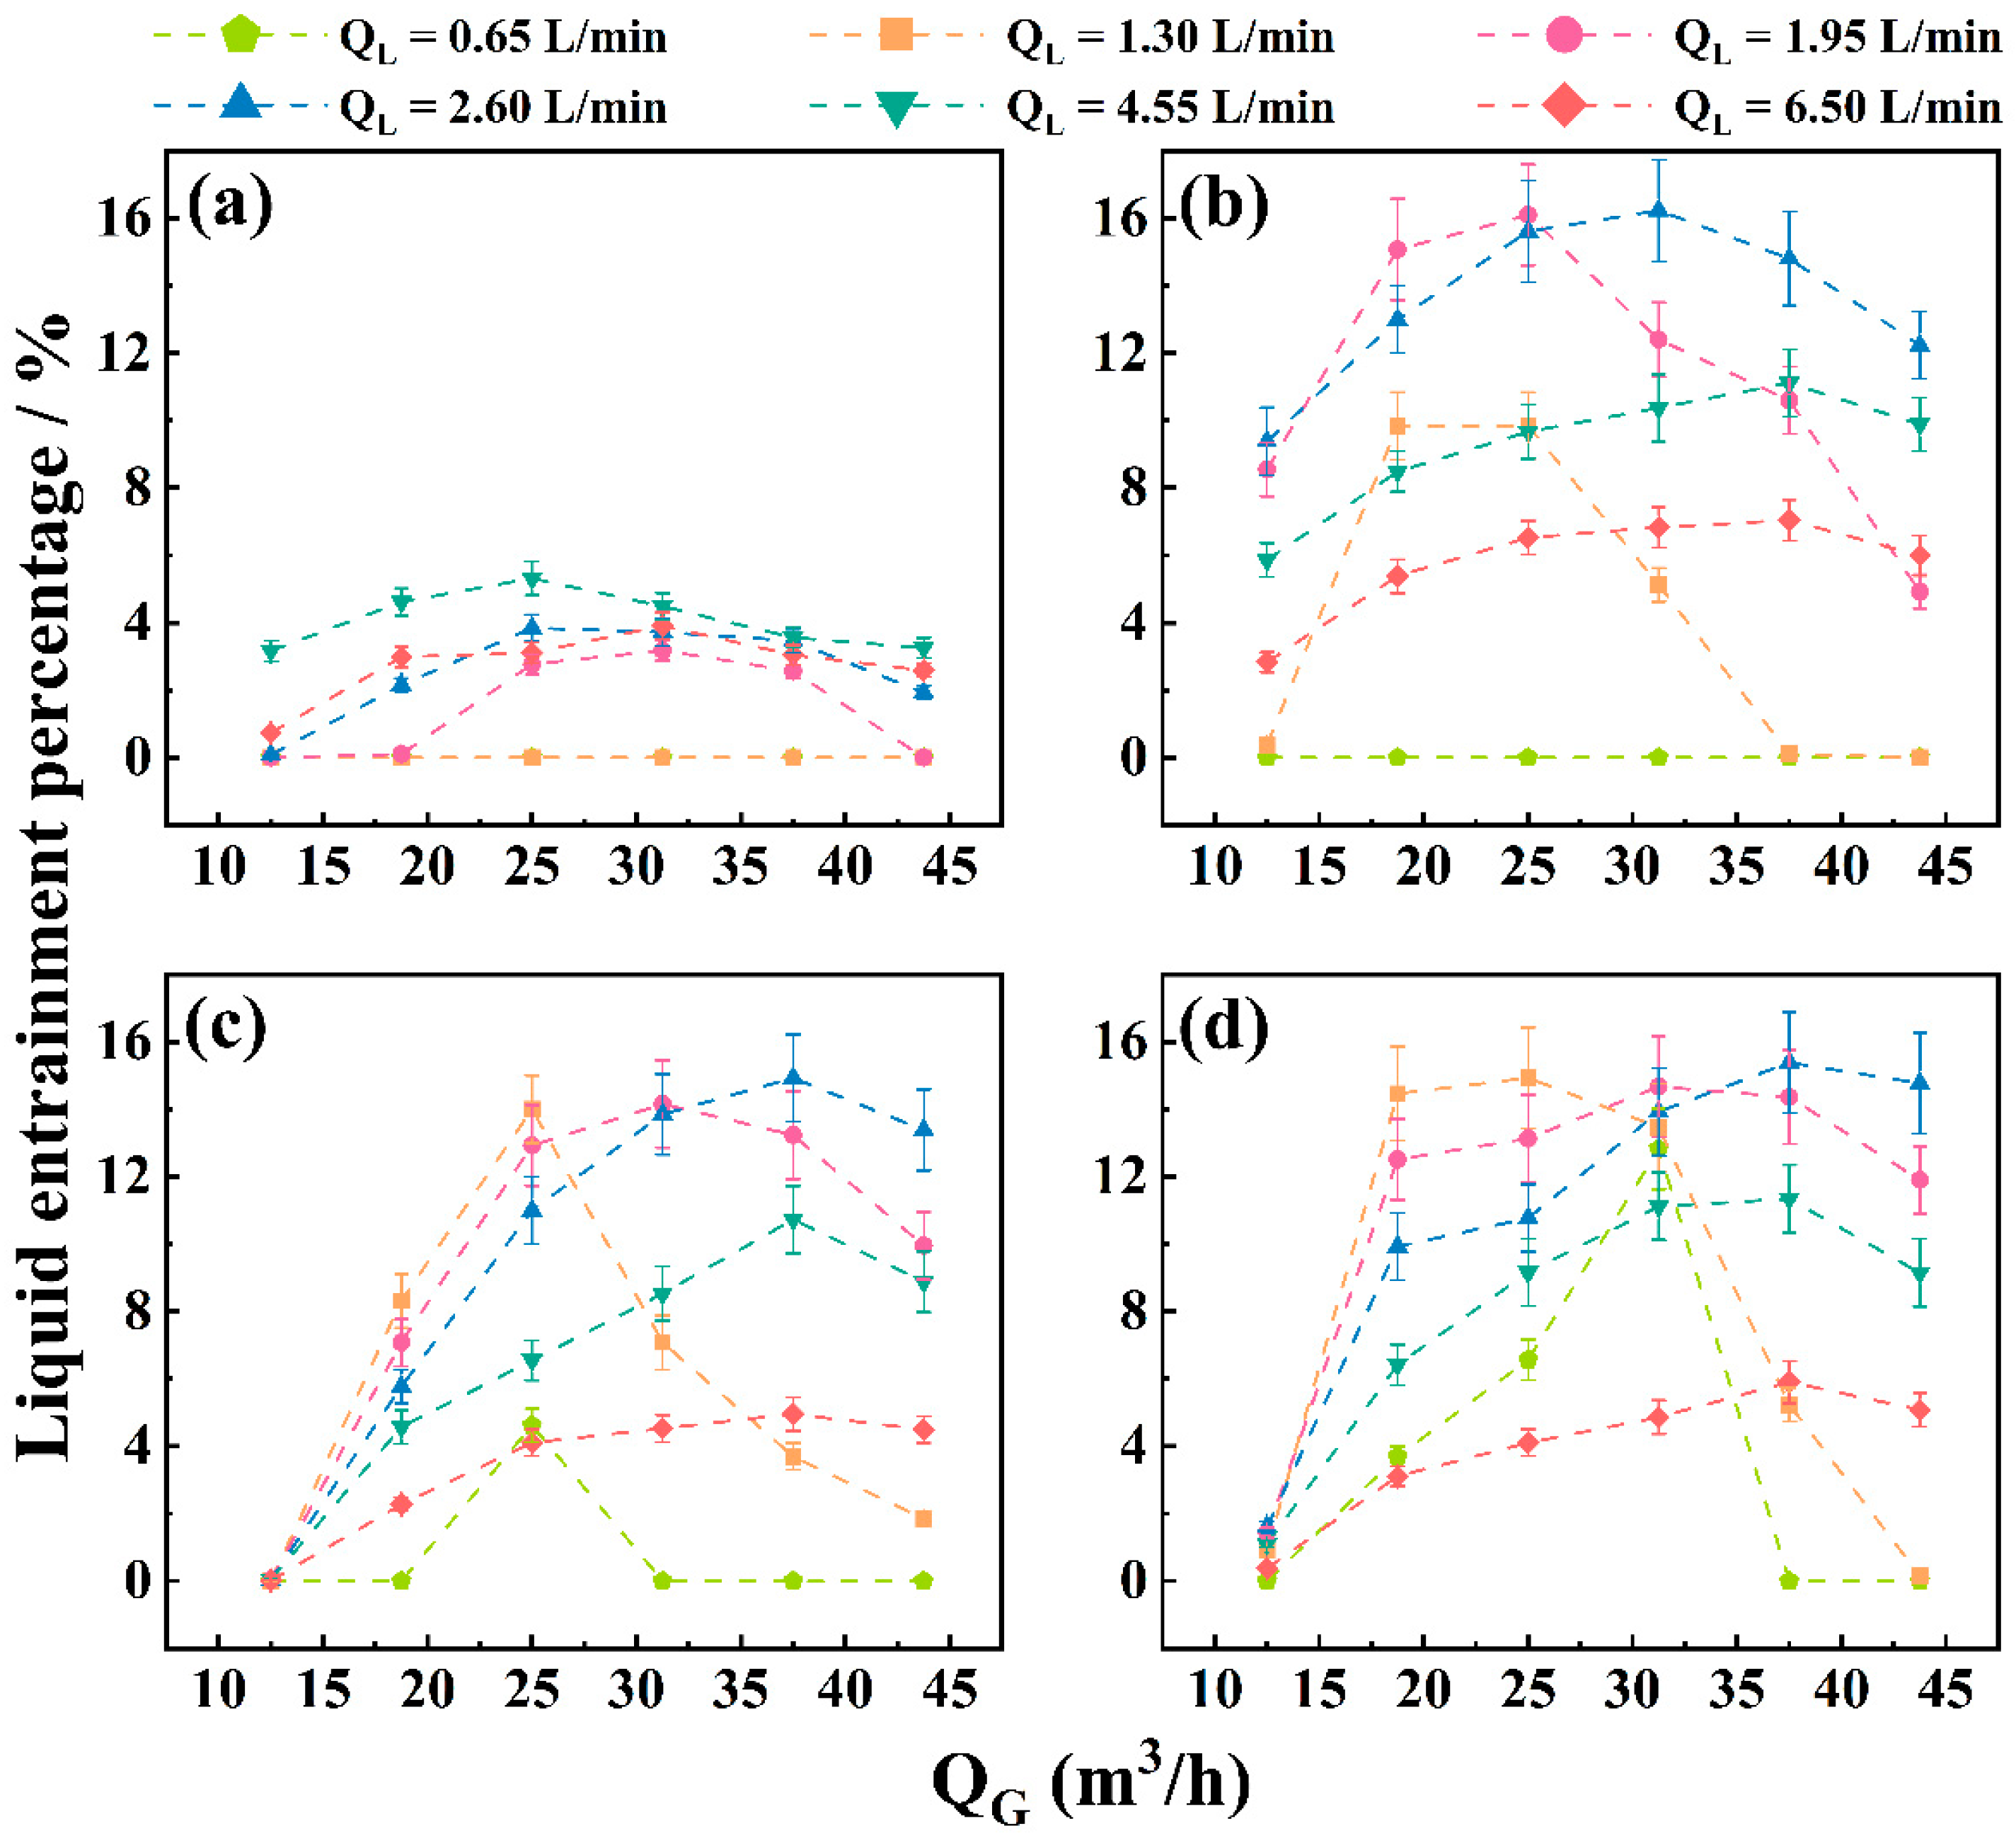
Figure 4 and Figure 5 illustrate the variation in liquid entrainment rate and percentage with QG at different insertion depths of the overflow pipe equipped with an LGC. The liquid entrainment rate exhibited similar trends across all insertion depths, initially increasing and then decreasing with QG. The maximum liquid entrainment rate was observed when QG approached approximately 37.5 m3/h. As QG gradually increased, the high-speed gas intensified interfacial turbulence at the gas–liquid interface, thereby increasing the interfacial contact area and promoting the breakup of the jet into droplets and liquid fragments (Figure S1). During the experiments, a pronounced upward wall-film behavior was observed along the inner surface of the overflow pipe (Figure S2). After the liquid impinged on the wall and coalesced into a liquid film, the negative pressure generated by rising swirling gas drove the film upward along the pipe wall. Under local intense shear and flow fluctuations, the upward film tended to rupture, generating ligaments and liquid fragments that were further carried by the gas stream. Consequently, more entrained liquid was carried with the gas stream and discharged through the overflow pipe. With further increases in inlet QG, the centrifugal force acting on the entrained liquid intensified, driving the liquid toward the cylinder wall and forming a liquid film that flowed downward under the influence of gravity, which ultimately reduced both the liquid entrainment rate and percentage. This effect was more pronounced at lower QL, resulting in the liquid entrainment rate and percentage reaching their minimum value at lower QG values.
The insertion depth of the overflow pipe significantly influenced the liquid entrainment rate. At an insertion depth ratio of 0.4, the liquid entrainment rate was notably lower, ranging from 0 to 254 mL/min. This reduction was attributed to the positioning of the overflow pipe just above the jet atomization zone. This configuration created a sufficient separation space, allowing liquid to be driven to the inner wall by centrifugal forces before reaching the overflow inlet. In contrast, as the insertion depth ratio increased from 0.6 to 1.0, the liquid entrainment rate increased substantially, ranging from 0 to 516 mL/min. This increase could be primarily attributed to the overflow pipe being situated within the jet atomization zone, where liquid directly impinged on the pipe. Concurrently, the high-velocity swirling gas exerted strong shear forces that disrupted the jet, enhancing gas–liquid contact and mixing, which resulted in significant liquid entrainment through the overflow pipe. The maximum liquid entrainment per unit liquid input reached 16.23% across the various insertion depths. Compared to traditional packed towers and spray towers, the GLAS operated at relatively higher inlet gas velocities, leading to an increased liquid entrainment percentage [31]. Therefore, selecting an appropriate intake velocity is an effective strategy for reducing liquid entrainment.

3.2. The Effect of Liquid Flow Rate

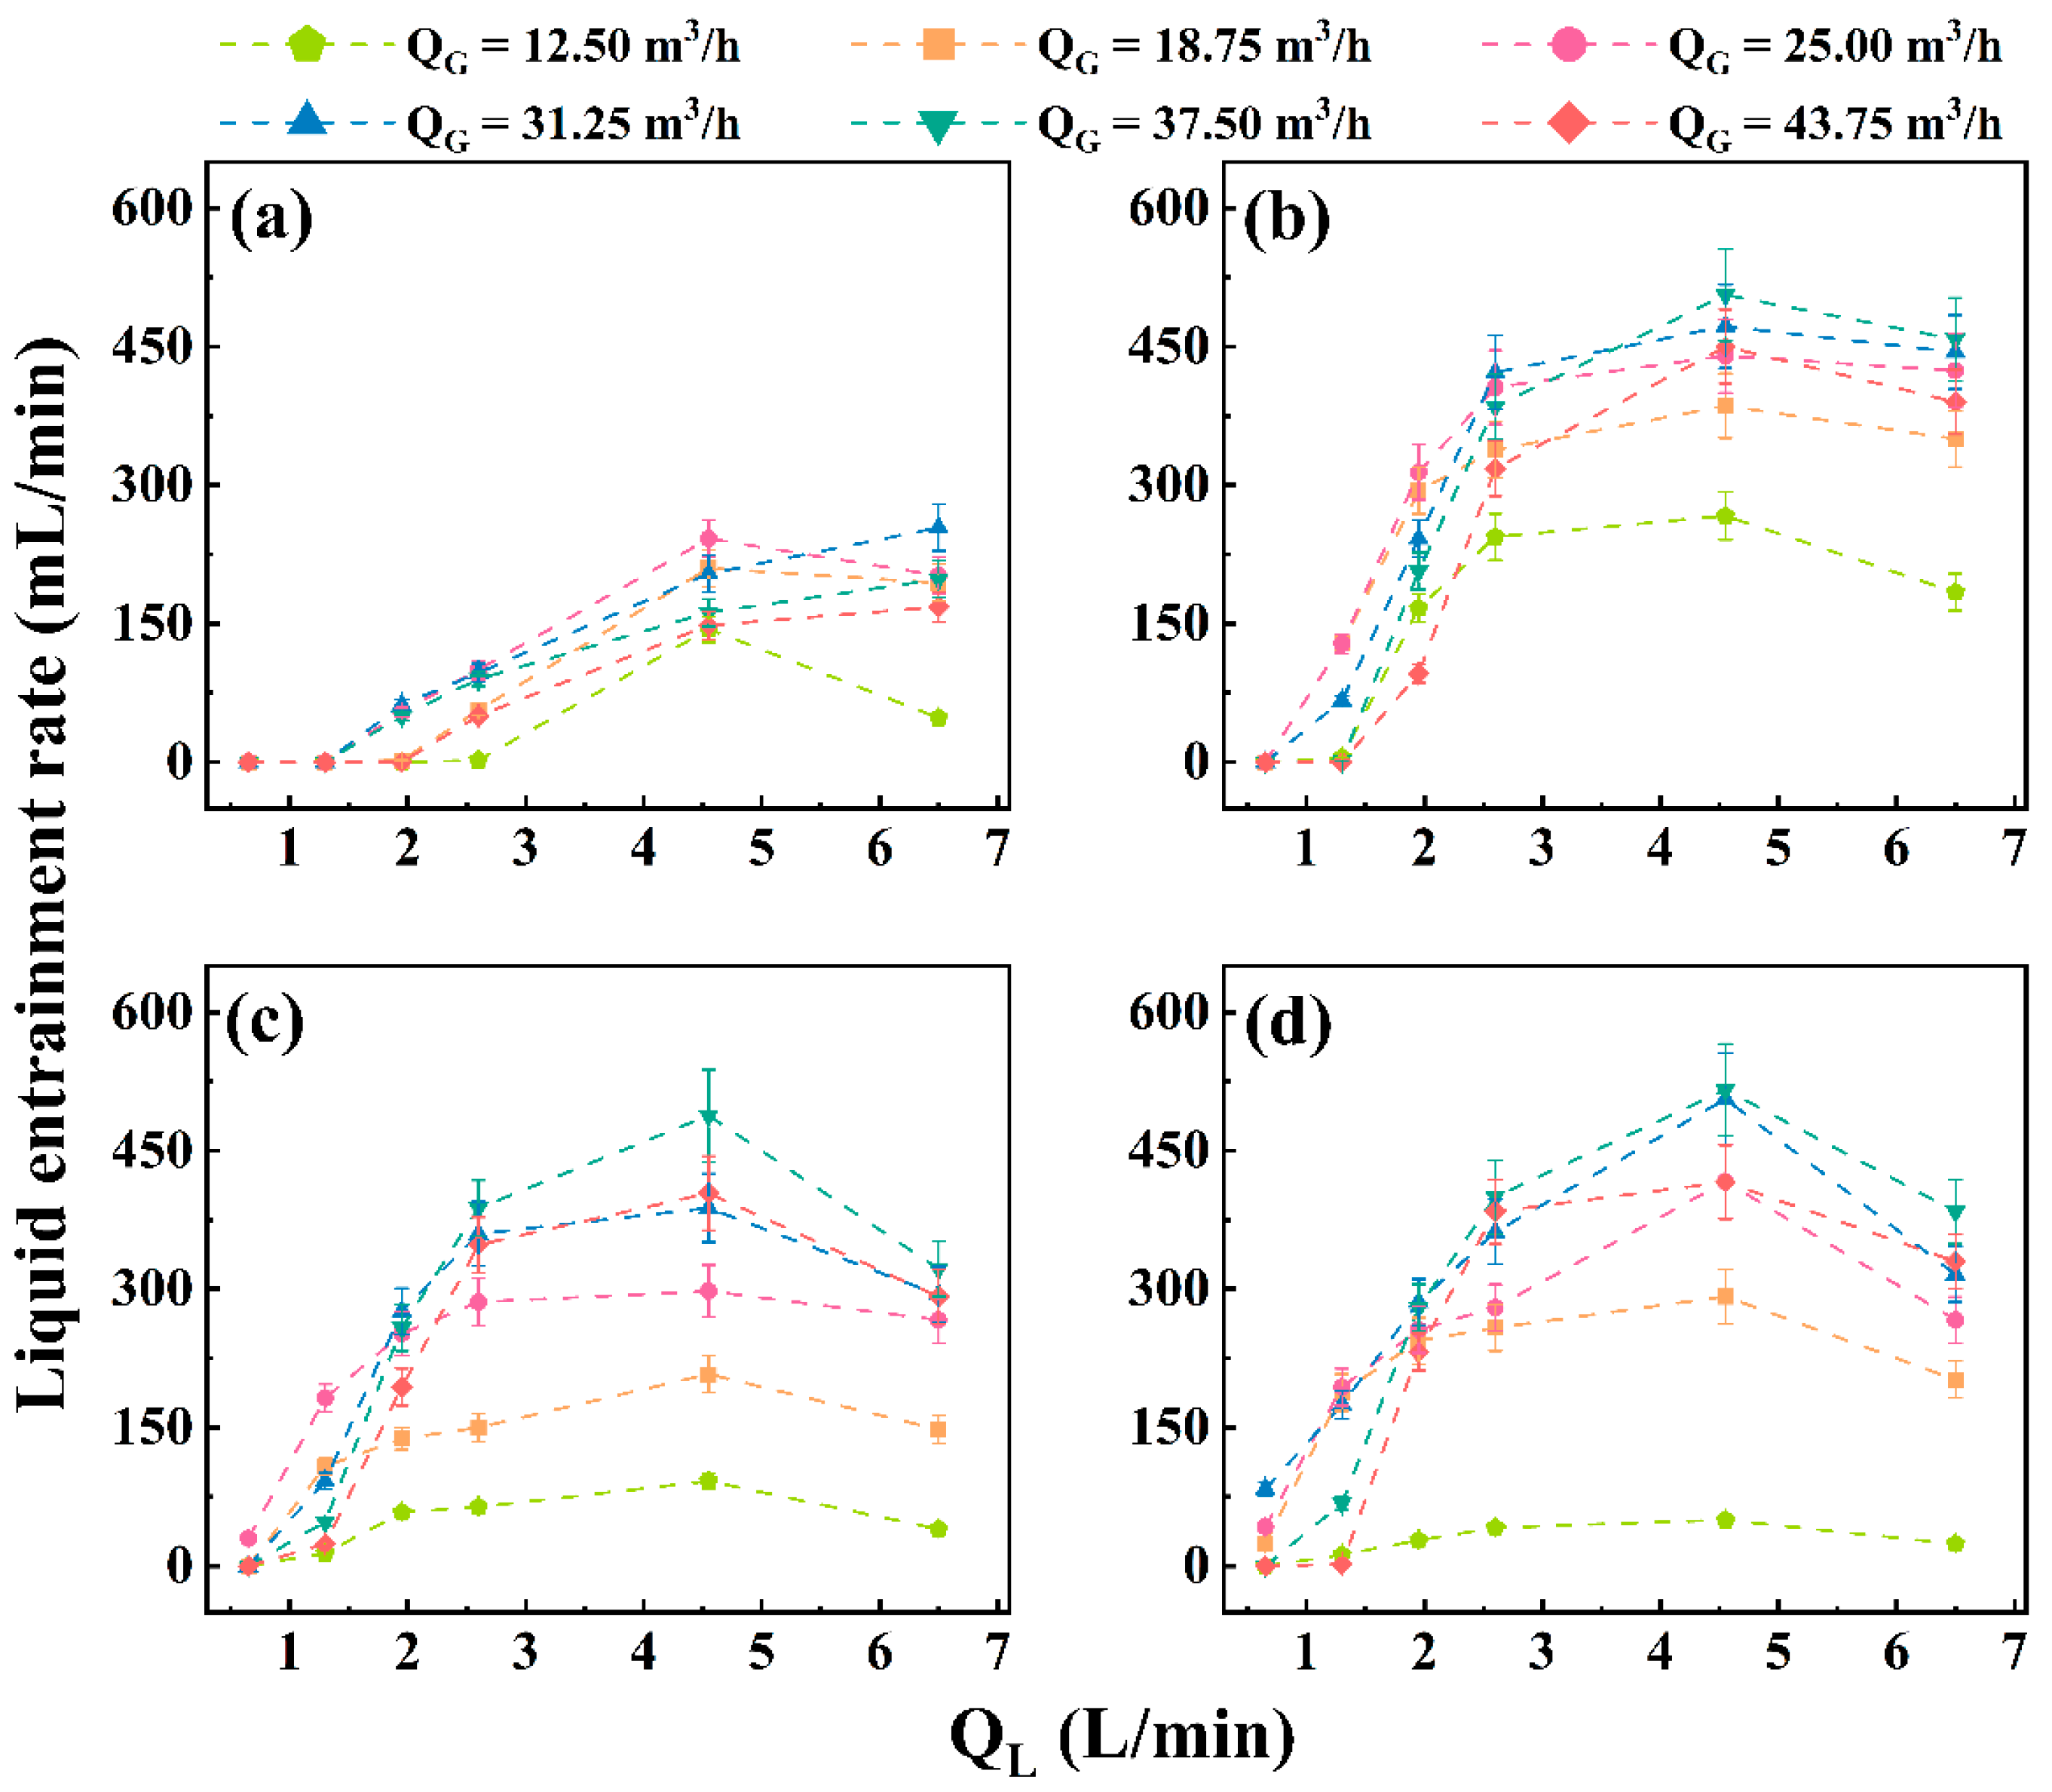
Figure 6 illustrates the variation in the liquid entrainment rate with QL at different insertion depths of the overflow pipe equipped with LGC. At the same insertion depths, the QG significantly influenced both the liquid entrainment rate and percentage. Specifically, the liquid entrainment rate in the overflow pipe initially increased and then decreased with increasing QL, reaching a maximum at QL = 4.55 L/min. In conditions of low QL, the liquid jets did not collide with the overflow pipe, and some droplets and liquid film were discharged through the overflow pipe, leading to an increase in the liquid entrainment rate. However, once QL exceeded 4.55 L/min, the stable jet began to flow downward under the influence of gravity, which reduced the liquid entrainment rate. Specifically, when the insertion ratio was 0.4, the overflow pipe was outside the jet atomization zone, and liquid entrainment was dominated by the negative-pressure suction of the gas core. Under high QG, the gas core became relatively stable. As QL increased, more liquid was continuously drawn into the gas core and carried out through the overflow pipe.
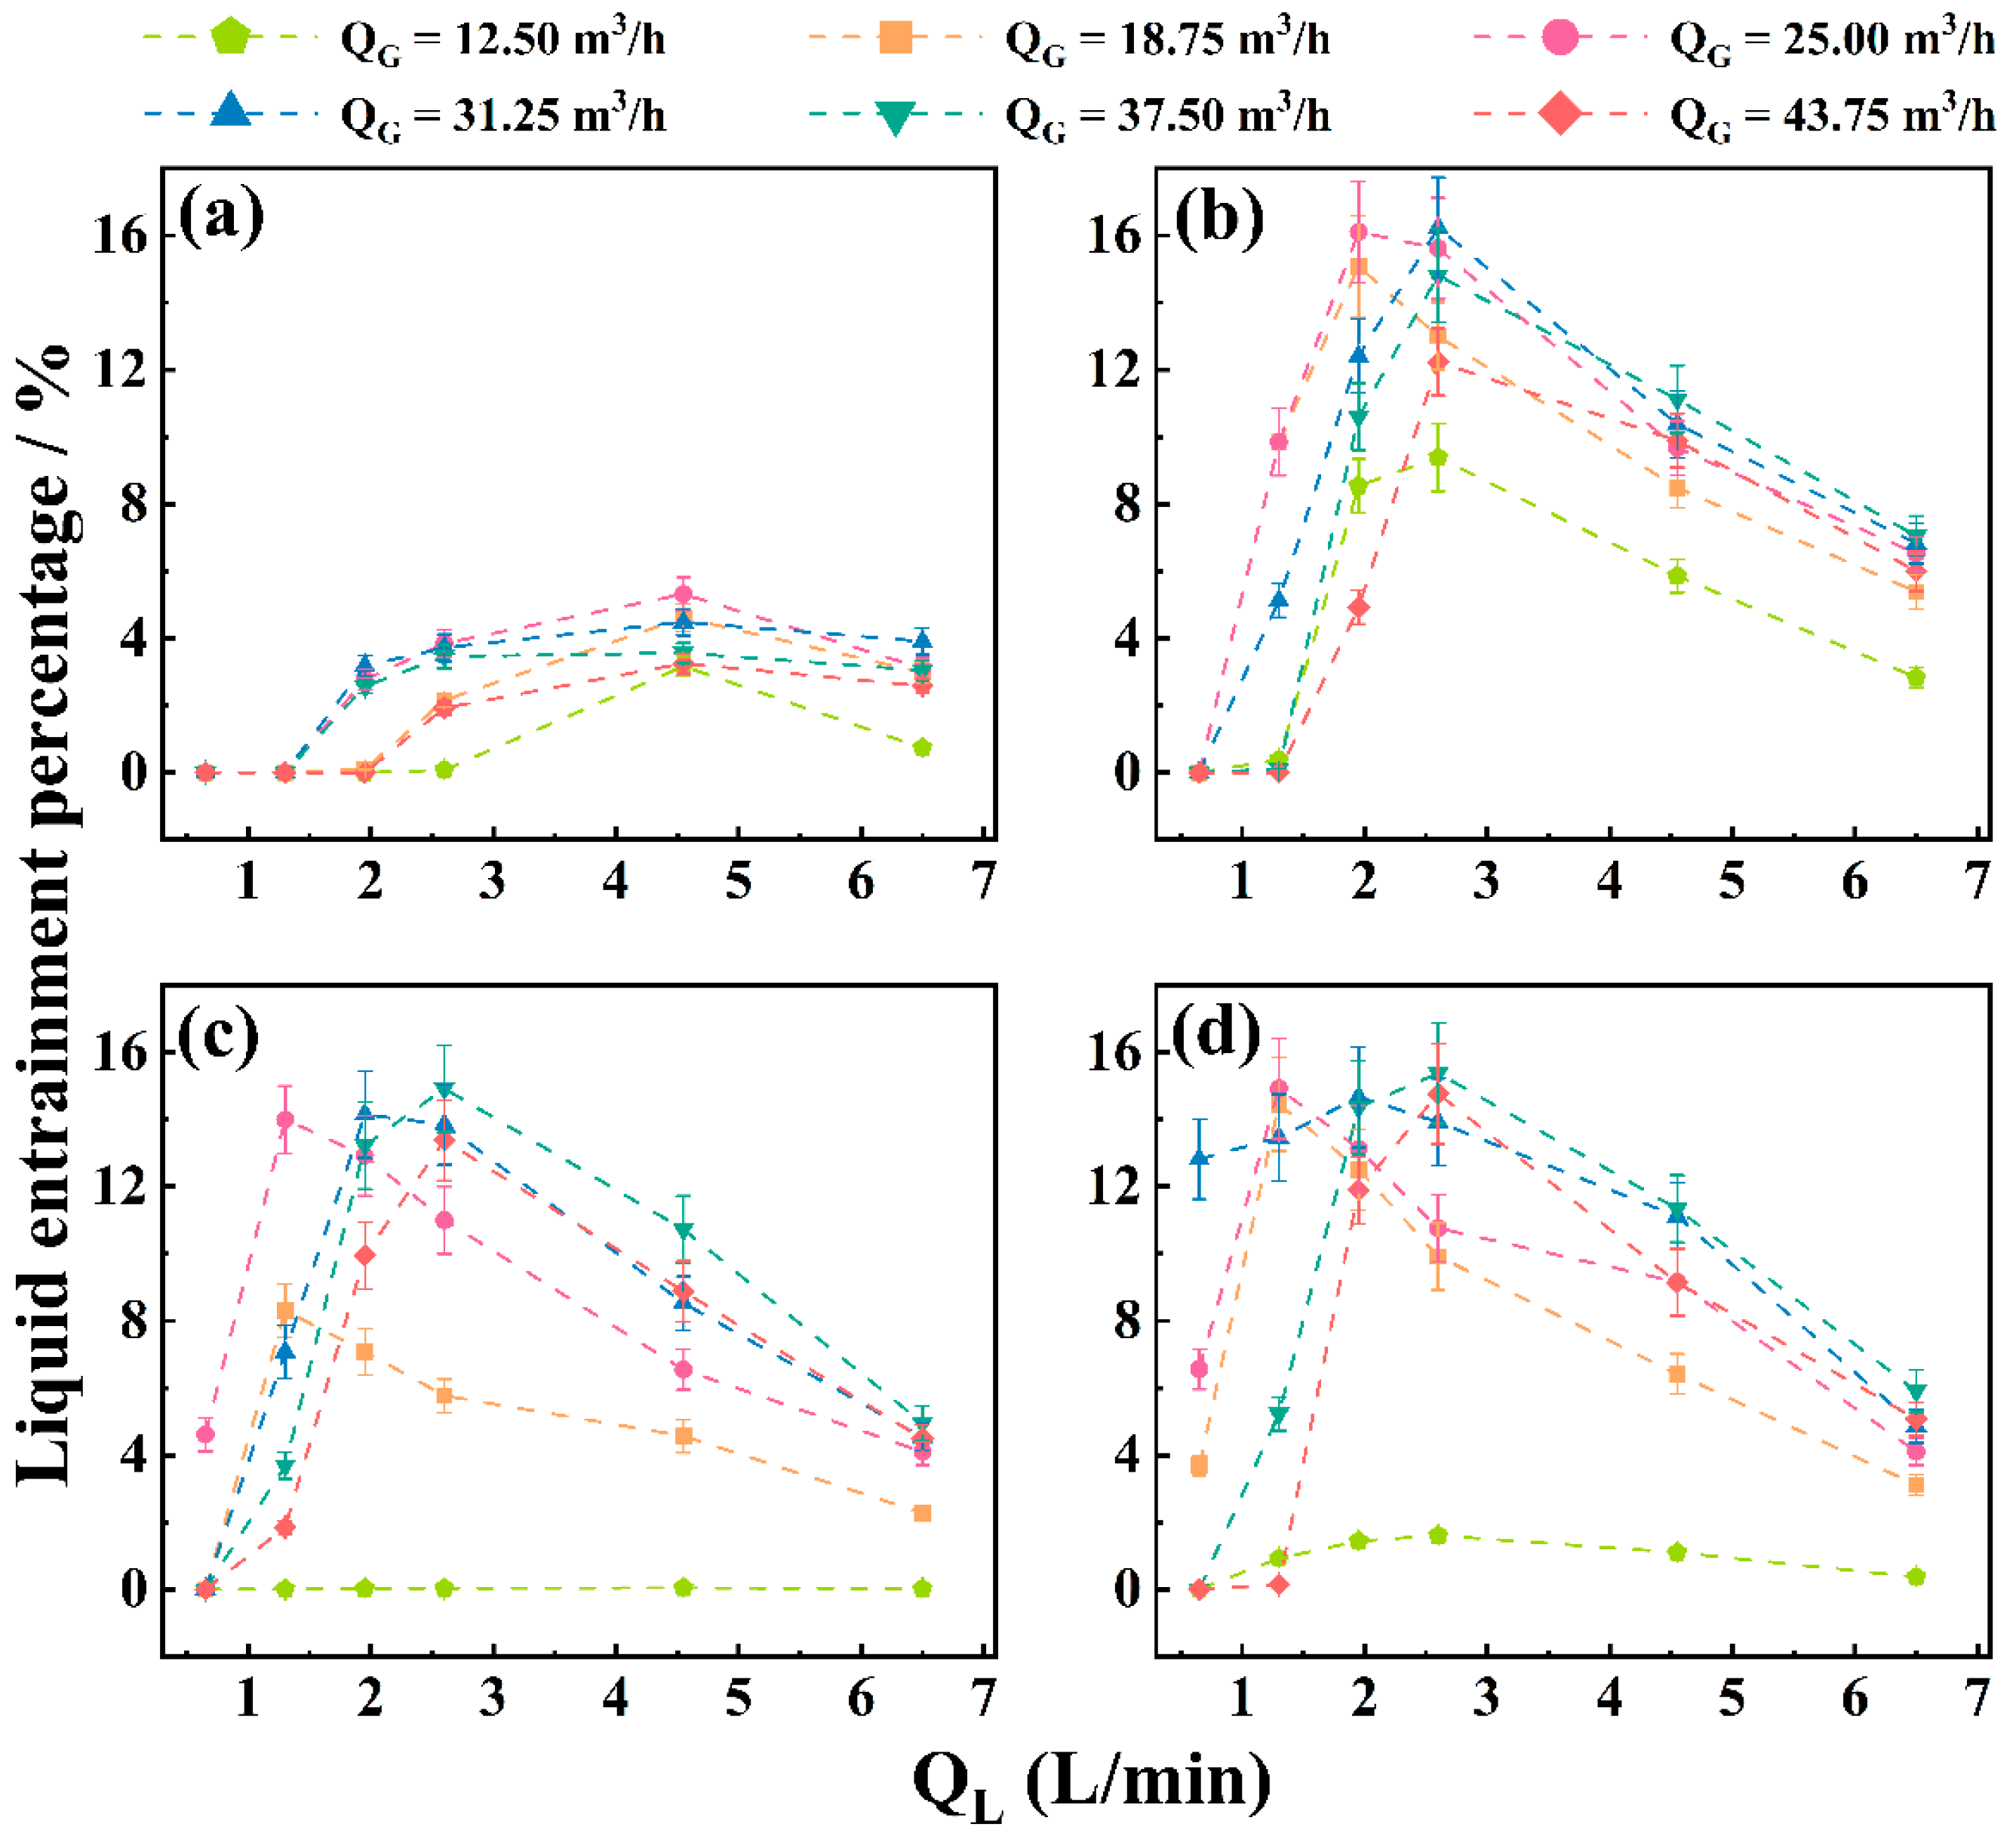
Figure 7 illustrates the variation in the liquid entrainment percentage in the overflow pipe with QL at different insertion depths equipped with LGC. When the insertion ratio of the overflow pipe ranged from 0.6 to 1.0, both the liquid entrainment rate and percentage initially increased and then decreased with increasing QL, reaching a maximum near QL = 4.55 L/min. As QL continued to rise, the liquid entering the flow field per unit time also increased, thereby elevating the gas–liquid separation load in the conical section. Consequently, the unseparated liquid phase became entrained with the gas phase, resulting in an increased liquid entrainment rate. With further increases in QL, the jet stabilized, leading to collisions between the liquid jets and the overflow pipe, which formed larger liquid masses that subsequently flowed downward under the influence of gravity, causing a decrease in the liquid entrainment rate. Regarding the liquid entrainment percentage, it peaked at approximately QL = 4.55 L/min when the insertion ratio was 0.4. Liquid entrainment through the overflow pipe occurred only when QL was sufficiently high to induce intense turbulence, which contributed to a delayed increase in the liquid entrainment percentage at an insertion ratio of 0.4. In contrast, peak values were observed at QL = 1.95–2.60 L/min for insertion ratios of 0.6 to 1.0. The lowest liquid entrainment rate and percentage observed at an insertion ratio of 0.4 can be attributed to the larger vertical separation space provided by the shallower insertion, which made it difficult for droplets and liquid fragments to reach the overflow pipe.

3.3. The Effect of Insertion Depths of the Overflow Pipe

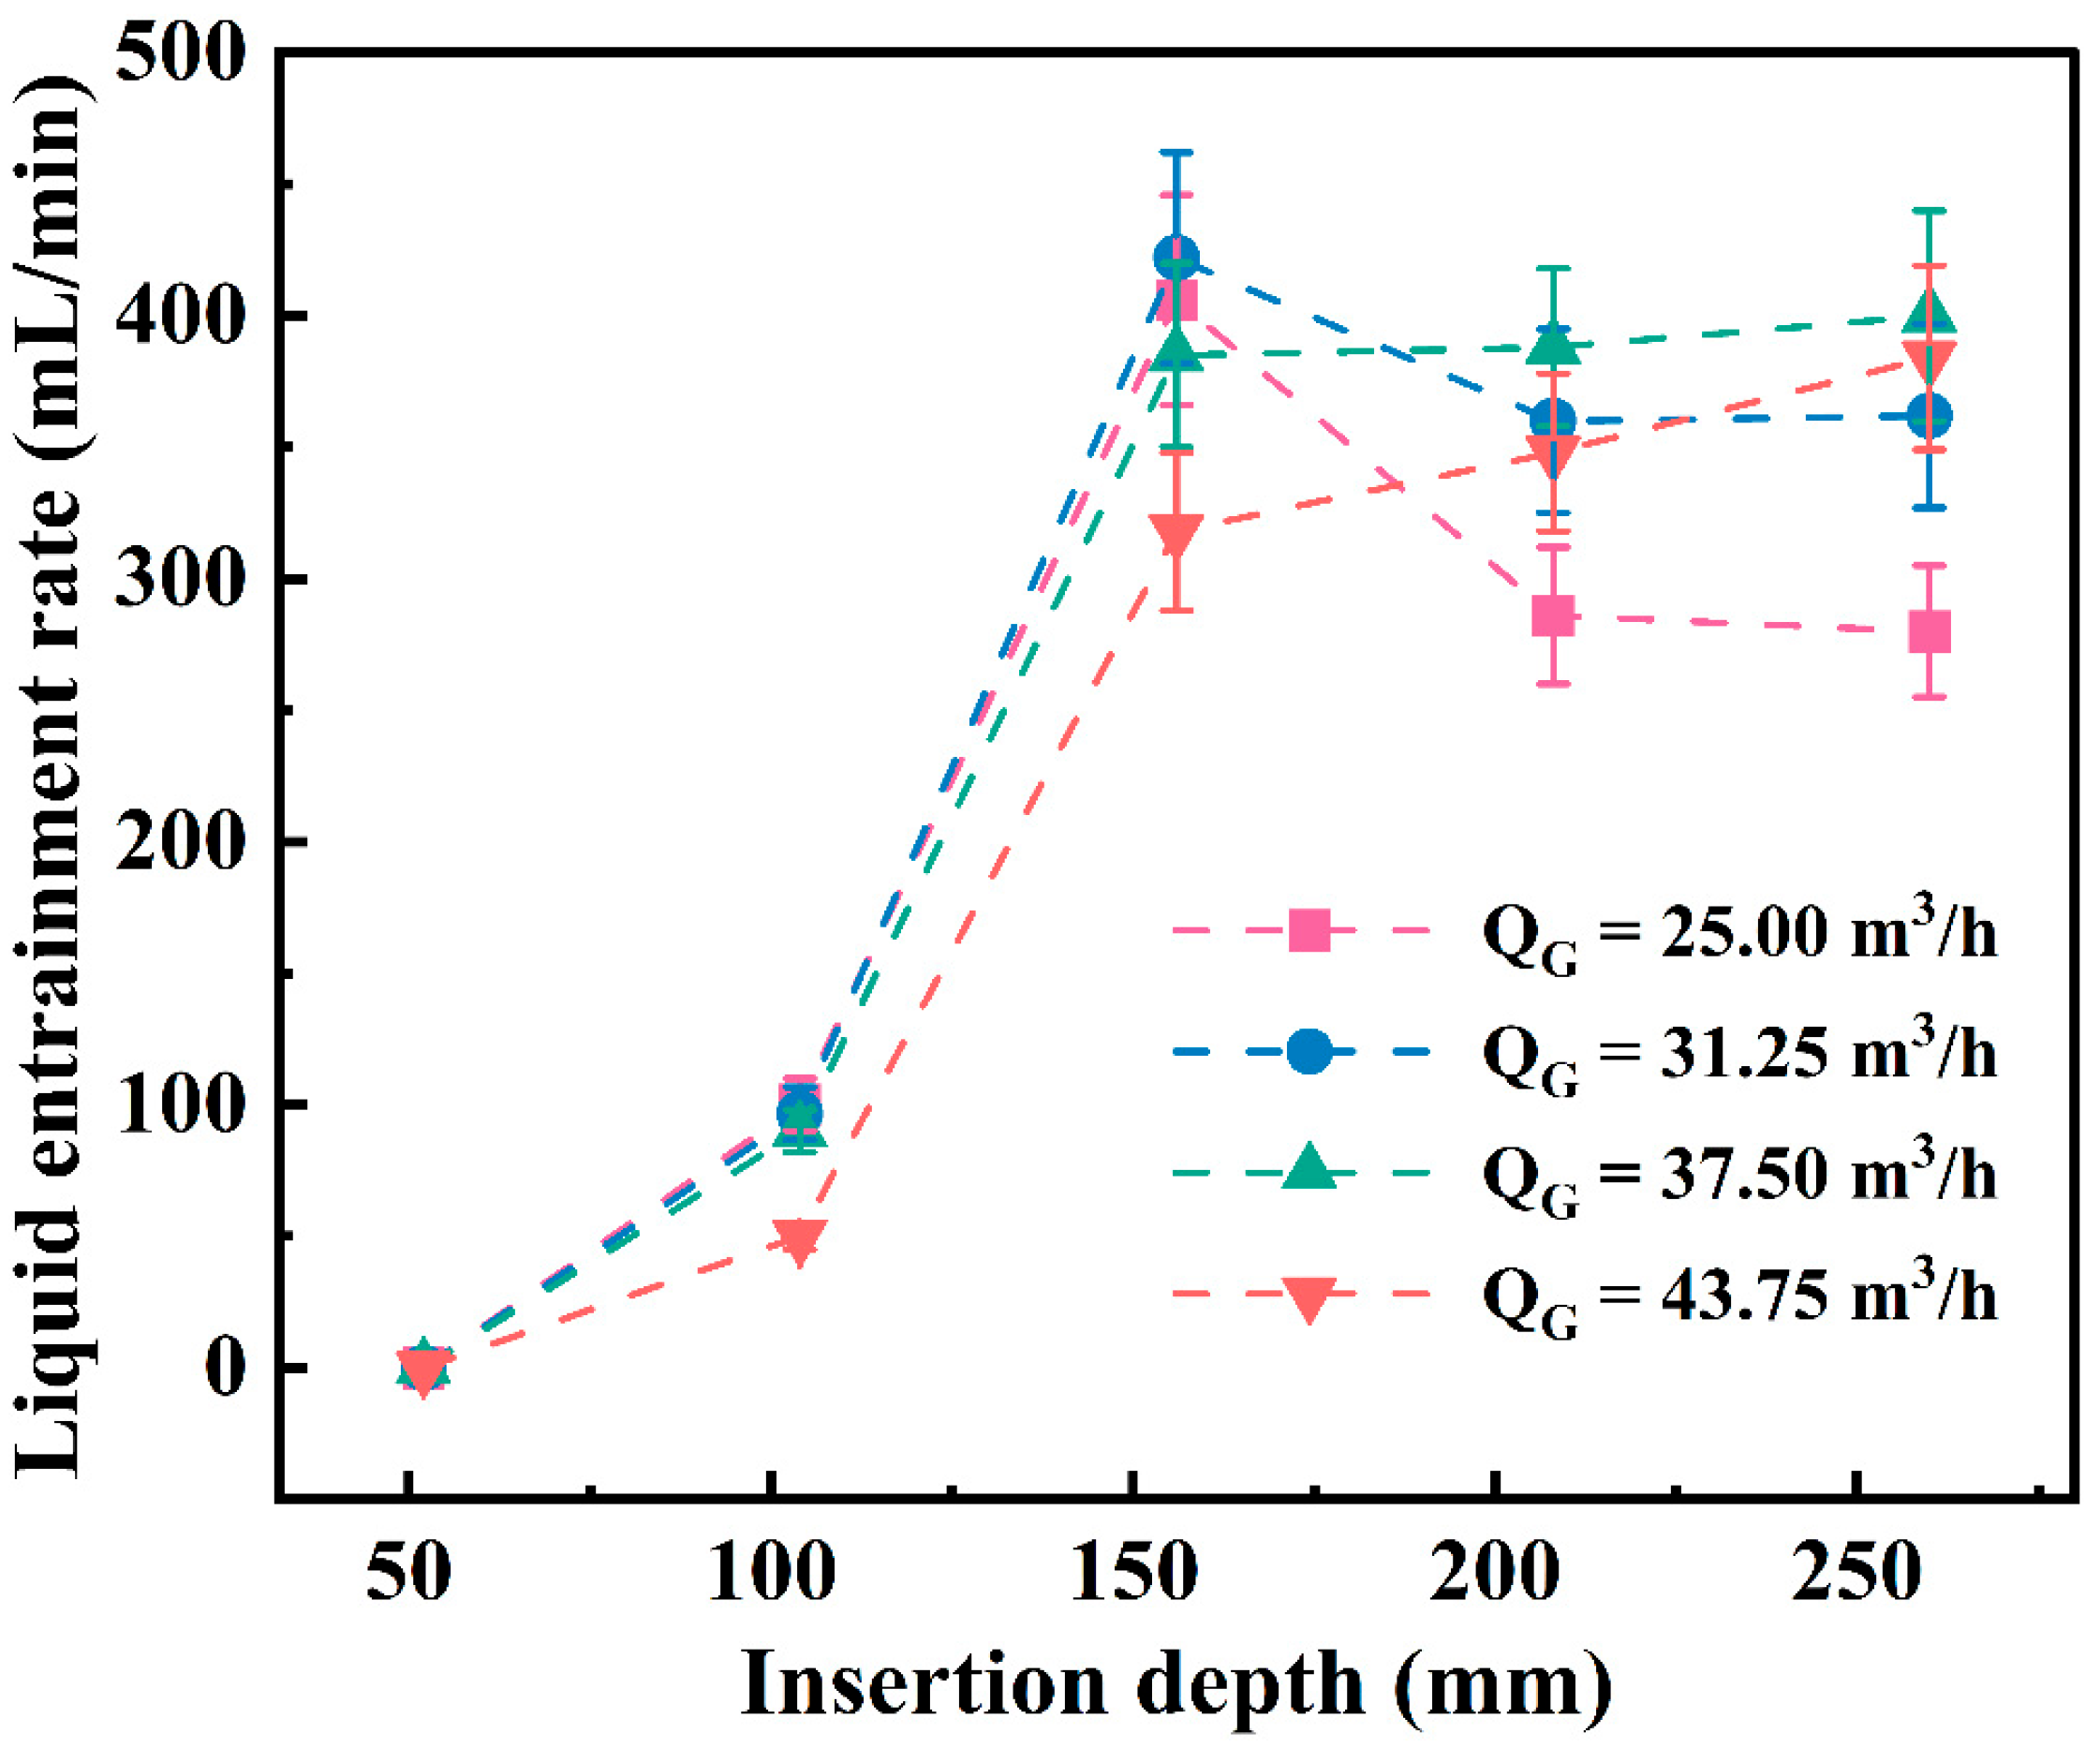
Figure 8 illustrates the effect of the overflow pipe insertion depth on the liquid entrainment rate at QL of 2.60 L/min with LGC installed. In the shallow insertion region (52–104 mm), where the bottom of the overflow pipe was located outside the jet atomization zone, the entrainment rate remained minimal. This observation indicated that the extended freeboard provided sufficient residence time for gravitational settling to dominate over aerodynamic drag, allowing droplets and liquid fragments generated by interfacial turbulence to settle back into the flow. However, a marked increase in entrainment occurred as the insertion depth increased from 104 mm to 156 mm. In this zone, the overflow pipe penetrated the high-intensity jet atomization zone, eliminating the vertical separation space and exposing the inlet directly to the turbulent jet atomization zone, which facilitated the immediate escape of high-momentum liquid. Notably, the trends diverged at deeper insertions (156–260 mm) depending on the QG. At higher QG, the entrainment rate increased slightly because the high-speed swirling gas promoted film entrainment and re-entrainment. The liquid that impacted the outer wall of the overflow pipe coalesced into a wall film, which was then sheared upward and intermittently stripped into fragments carried out with the gas stream. Conversely, the entrainment rate decreased significantly as the depth increased to 260 mm at lower QG, where the bottom of the overflow pipe reached the column-cone junction. This reduction can be attributed to a wall-film drainage mechanism, wherein liquid colliding with the outer surface of the deeply submerged overflow pipe coalesced into a liquid film. Due to the lower interfacial shear stress at low QG, the aerodynamic drag was insufficient to overcome gravity, allowing this liquid film to flow downward along the outer wall back into the conical section, thereby reducing the net liquid entrainment through the overflow pipe. Given that the insertion depth of the overflow pipe influences the gas–liquid mass transfer coefficient, it is essential to consider the insertion depth in conjunction with removal efficiency in industrial applications.

3.4. The Effect of LGC on Decreasing the Liquid Entrainment

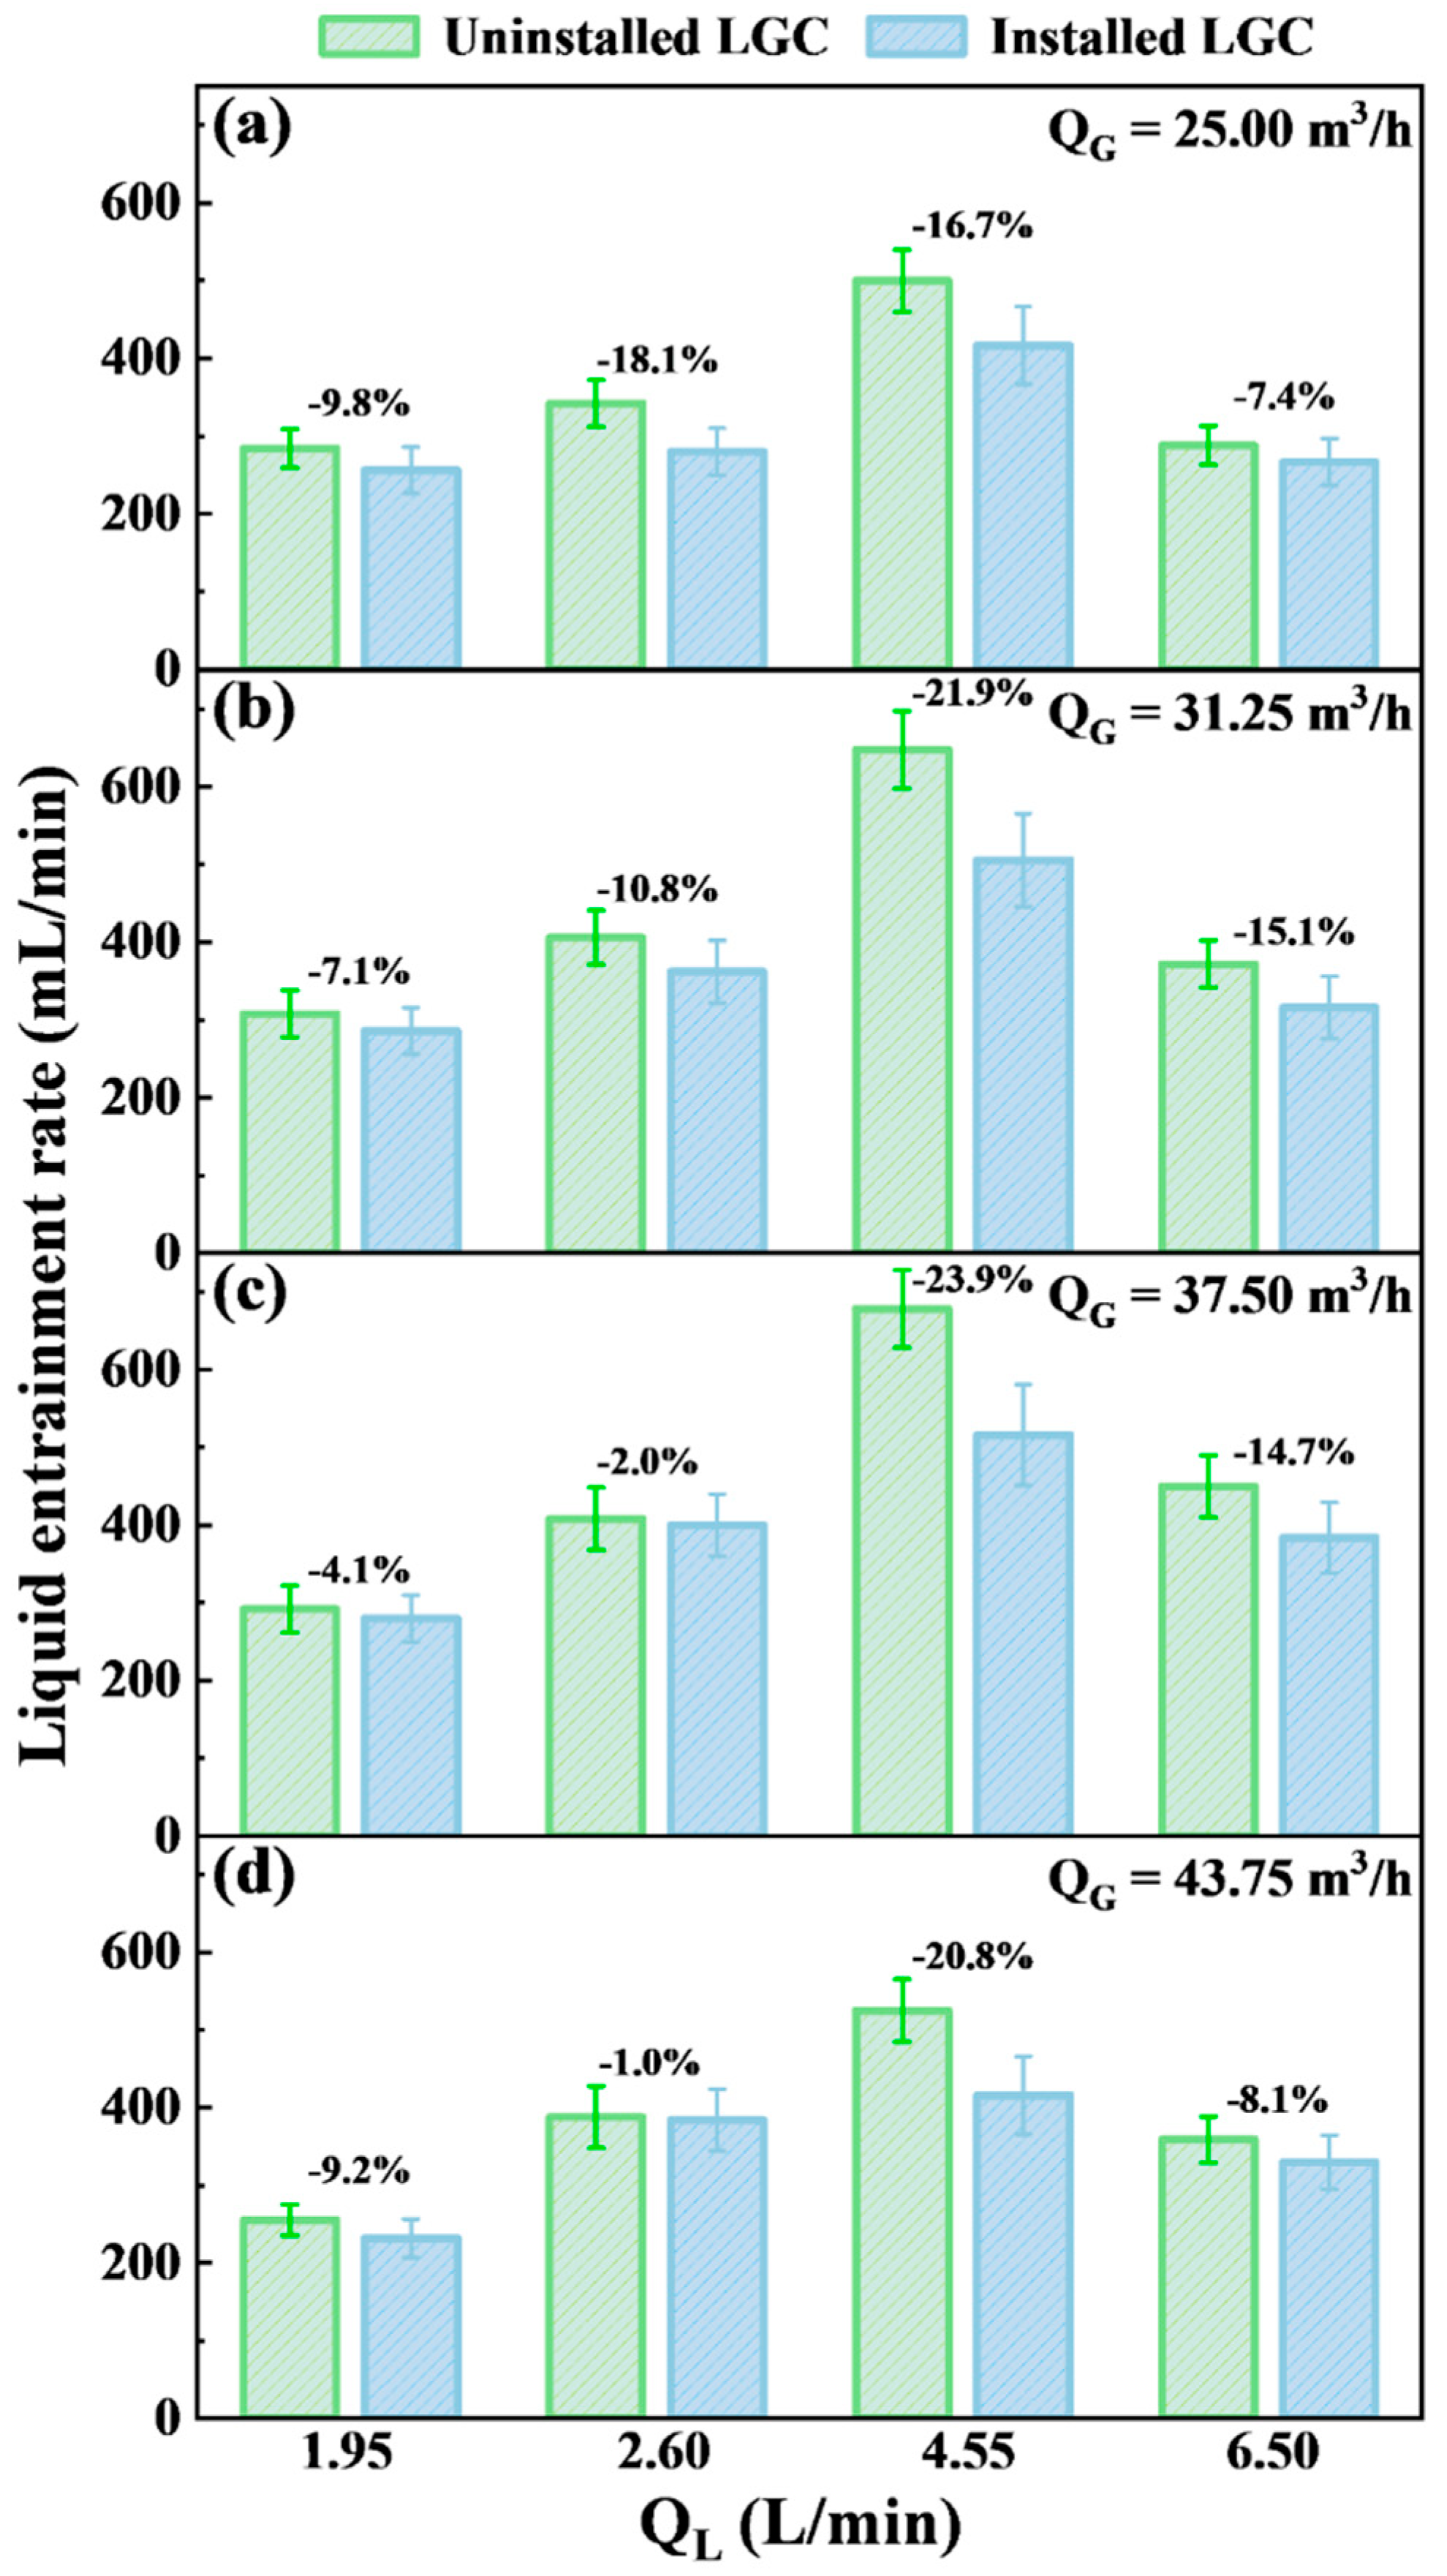
Figure 9 illustrates the influence of the LGC on the liquid entrainment rate. When the insertion ratio of the overflow pipe was 1, with QL ranging from 1.95 L/min to 6.50 L/min and QG from 25.00 m3/h to 43.75 m3/h, the liquid entrainment rate for the GLAS with LGC ranged from 232 mL/min to 516 mL/min. This represented a reduction of approximately 1.0% to 23.9% compared to the GLAS without LGC under identical operating conditions. The observed reduction in liquid entrainment may be attributed to the hydrodynamic interactions between the gas flow and the LGC. As the entrained liquid reached the upper region of the overflow pipe and collided with the LGC, it resulted in an instantaneous reduction in the axial velocity of the gas–liquid mixture to nearly zero. Consequently, some liquid fragments flowed downward directly under the effect of gravity, leading to liquid backflow and a decrease in liquid entrainment. Notably, the reduction in the liquid entrainment rate for GLAS with LGC initially increased with QL and then decreased, with the largest reduction occurring at QL = 4.55 L/min, where the reduction ranged from 16.7% to 23.9%. The maximum reduction in liquid entrainment rate was 23.9% for GLAS with LGC. This phenomenon can be primarily attributed to the decreased liquid carried by the gas at lower QL, resulting in a minimal inhibitory effect of the LGC on liquid entrainment. Conversely, at excessively high QL, the stable jet began to flow downward under the influence of gravity, which reduced the liquid entrainment rate. This led to a reduction in the liquid content escaping from the overflow pipe, thereby diminishing the effectiveness of the LGC. Therefore, the installation of LGC on the overflow pipe can effectively reduce liquid entrainment, particularly at medium QL commonly employed in GLAS.

3.5. The Effect of LGC on the Pressure Drop

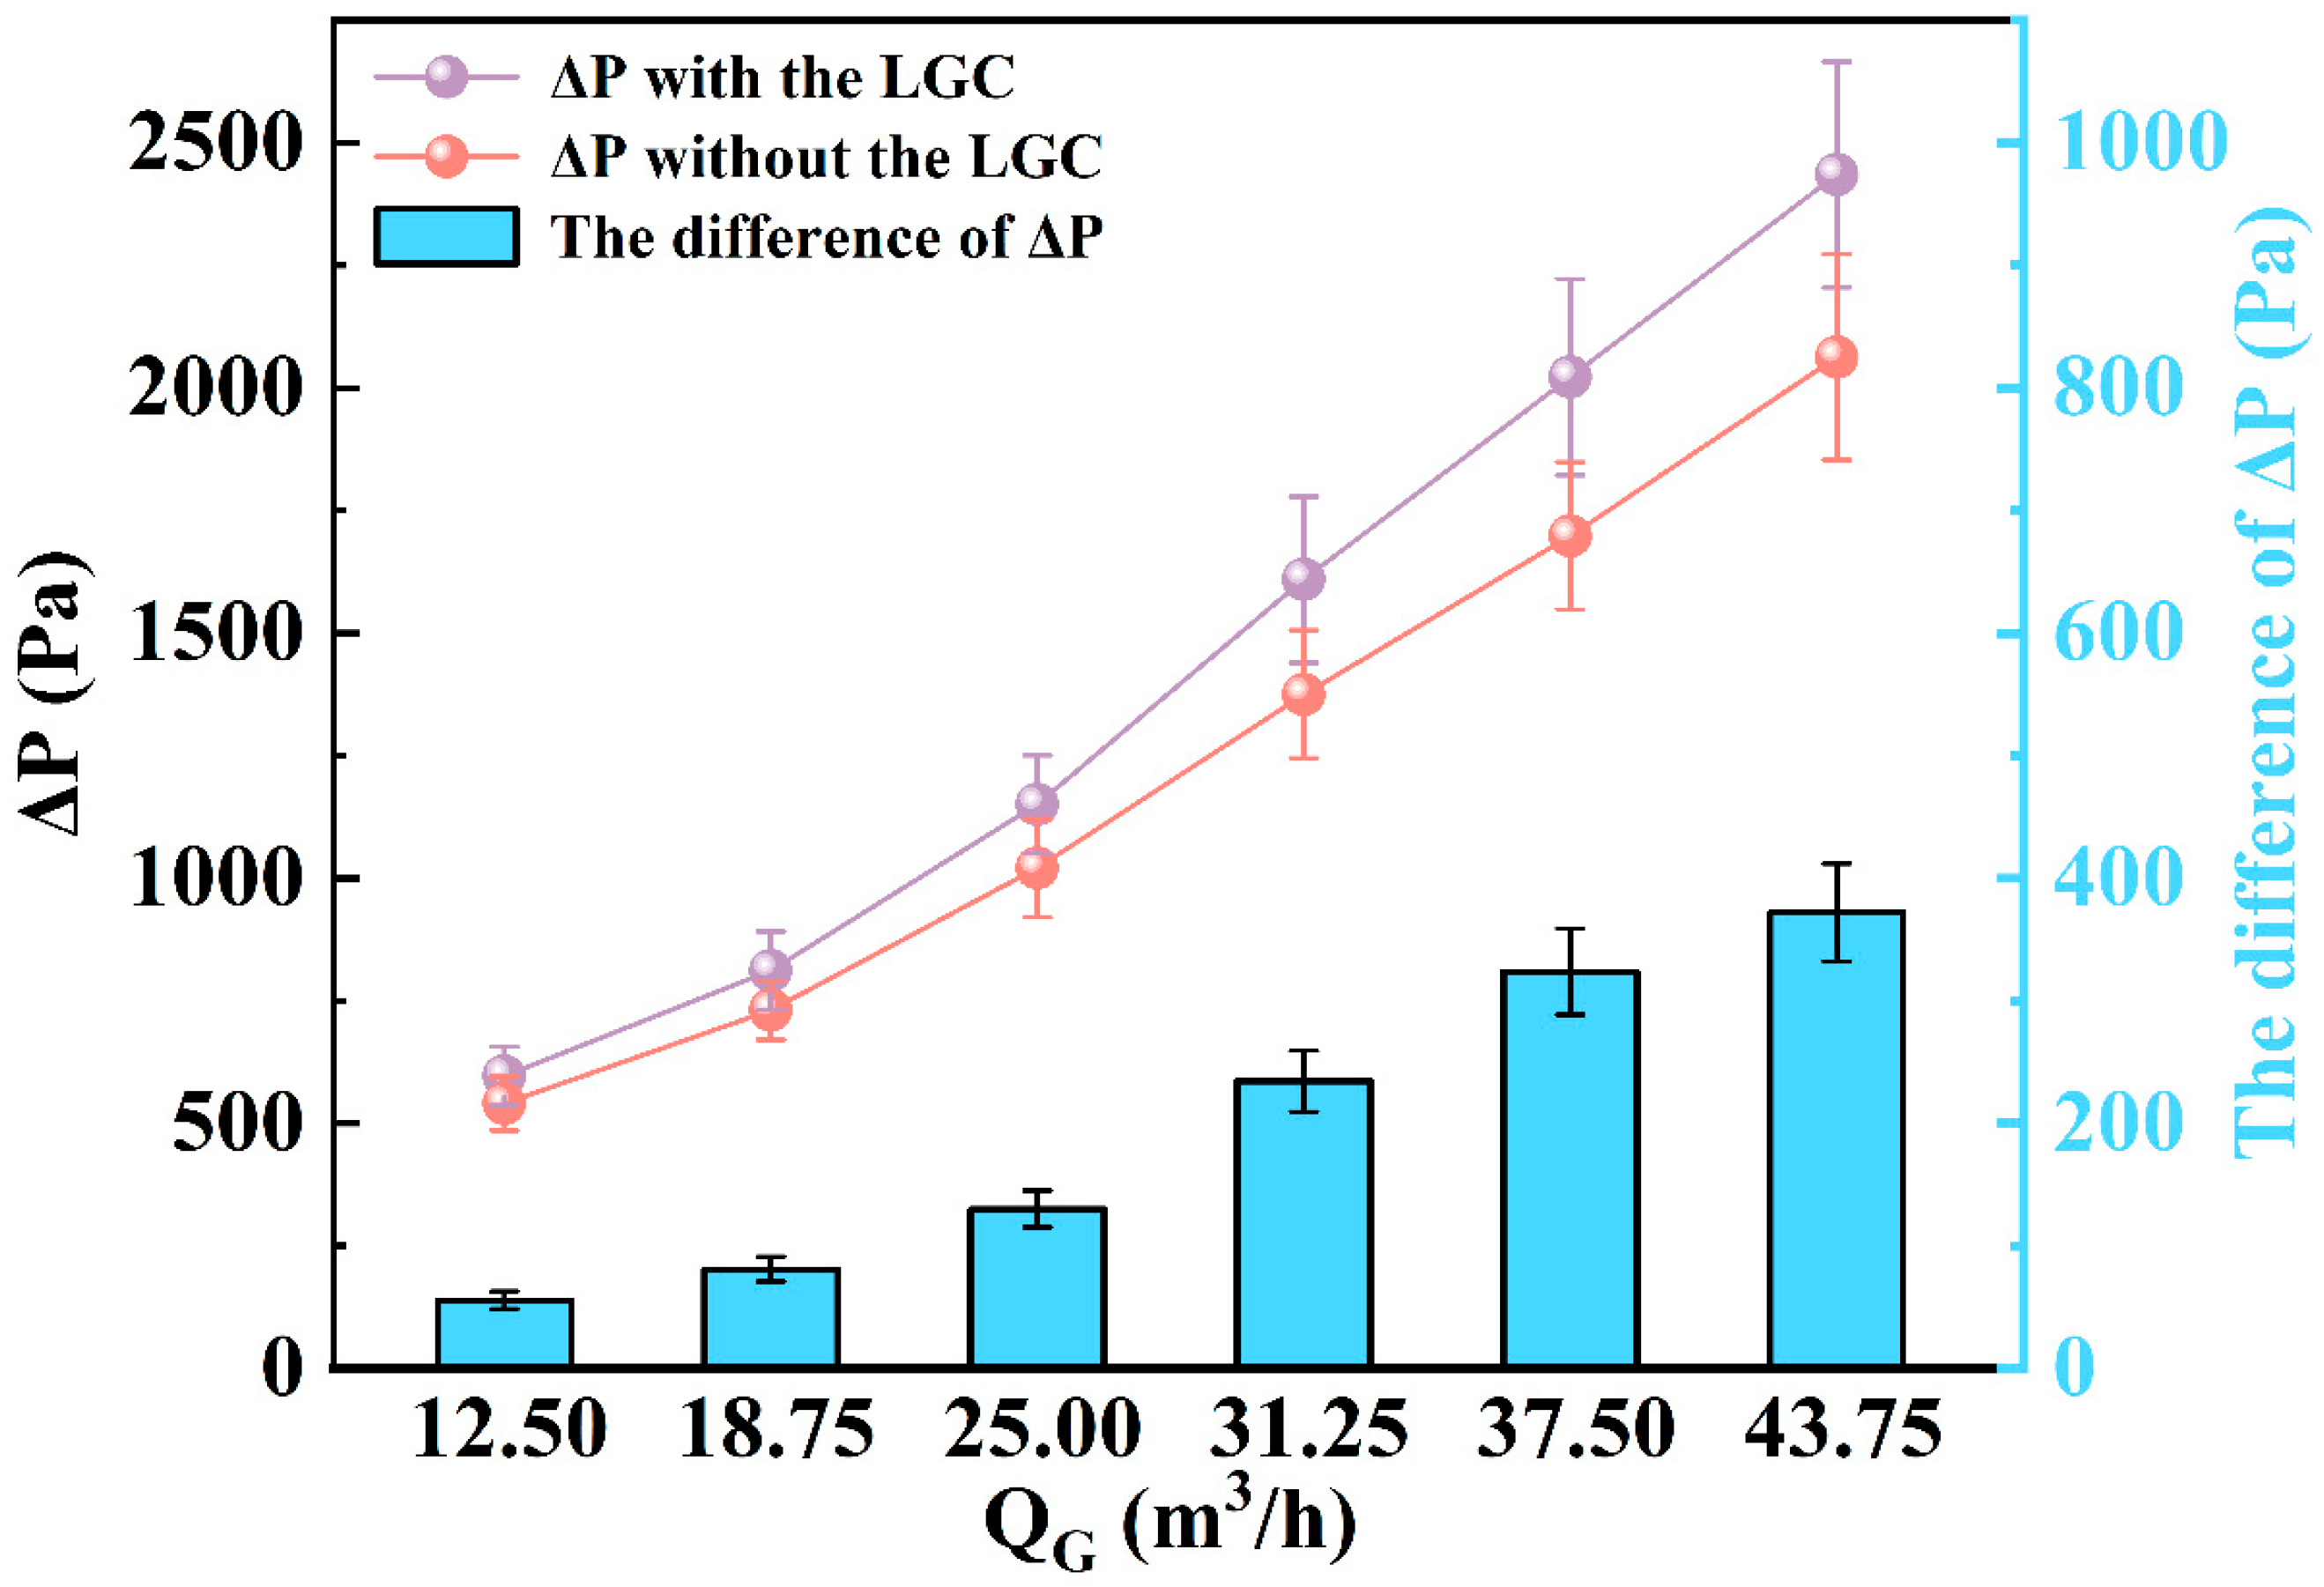
Figure 10 illustrates the effect of the LGC on the average pressure drop under various QG when S/H1 is 1. As QG increased from 12.5 m3/h to 43.75 m3/h, the pressure drops for the GLAS without LGC rose from 540.6 Pa to 2062.9 Pa, while for GLAS with LGC, it increased from 596.3 Pa to 2365 Pa. This increase can be attributed to the intensified impact and shearing effects of the high-speed gas on the GLAS side wall and the liquid column [32]. Compared to GLAS without LGC, the incremental rate of pressure drops for GLAS with LGC gradually increased with QG, with the difference values rising from 55.6 Pa to 302.1 Pa under the same operating conditions, indicating that the pressure drops associated with the LGC were relatively minor. Thus, the LGC not only reduced liquid entrainment from the overflow pipe but also had a minimal extra energy penalty. When compared with the GLAS without LGC, the pressure drops for GLAS with LGC increased by 10.3%, 15.9%, and 14.6% at QG values of 12.50 m3/h, 37.50 m3/h, and 43.75 m3/h, respectively. This suggested that the presence of the LGC has a negligible effect on the overall pressure drop, particularly at higher QG.
To rigorously evaluate the engineering feasibility of the LGC, a combined efficiency metric ( η ) is introduced, defined as the ratio of the relative entrainment reduction rate to the relative pressure drop penalty rate:
η = L E 0 L E / L E 0 / Δ P Δ P 0 / Δ P 0
where LE0 and LE are the liquid entrainment rates before and after installing the LGC, respectively; ΔP0 and ΔP are the corresponding pressure drops.
The calculated η values for gas flow rates of 25, 31.25, 37.5, and 43.75 m3/h are 1.33, 1.31, 1.5, and 1.42, respectively. It demonstrates that the benefit of entrainment reduction significantly outweighs the energy penalty, confirming the high practical value of the LGC. Therefore, the installation of an LGC on the overflow pipe of GLAS introduces only a small extra energy penalty, making it suitable for engineering applications.

3.6. Analysis of Correlation Coefficients Among Parameters

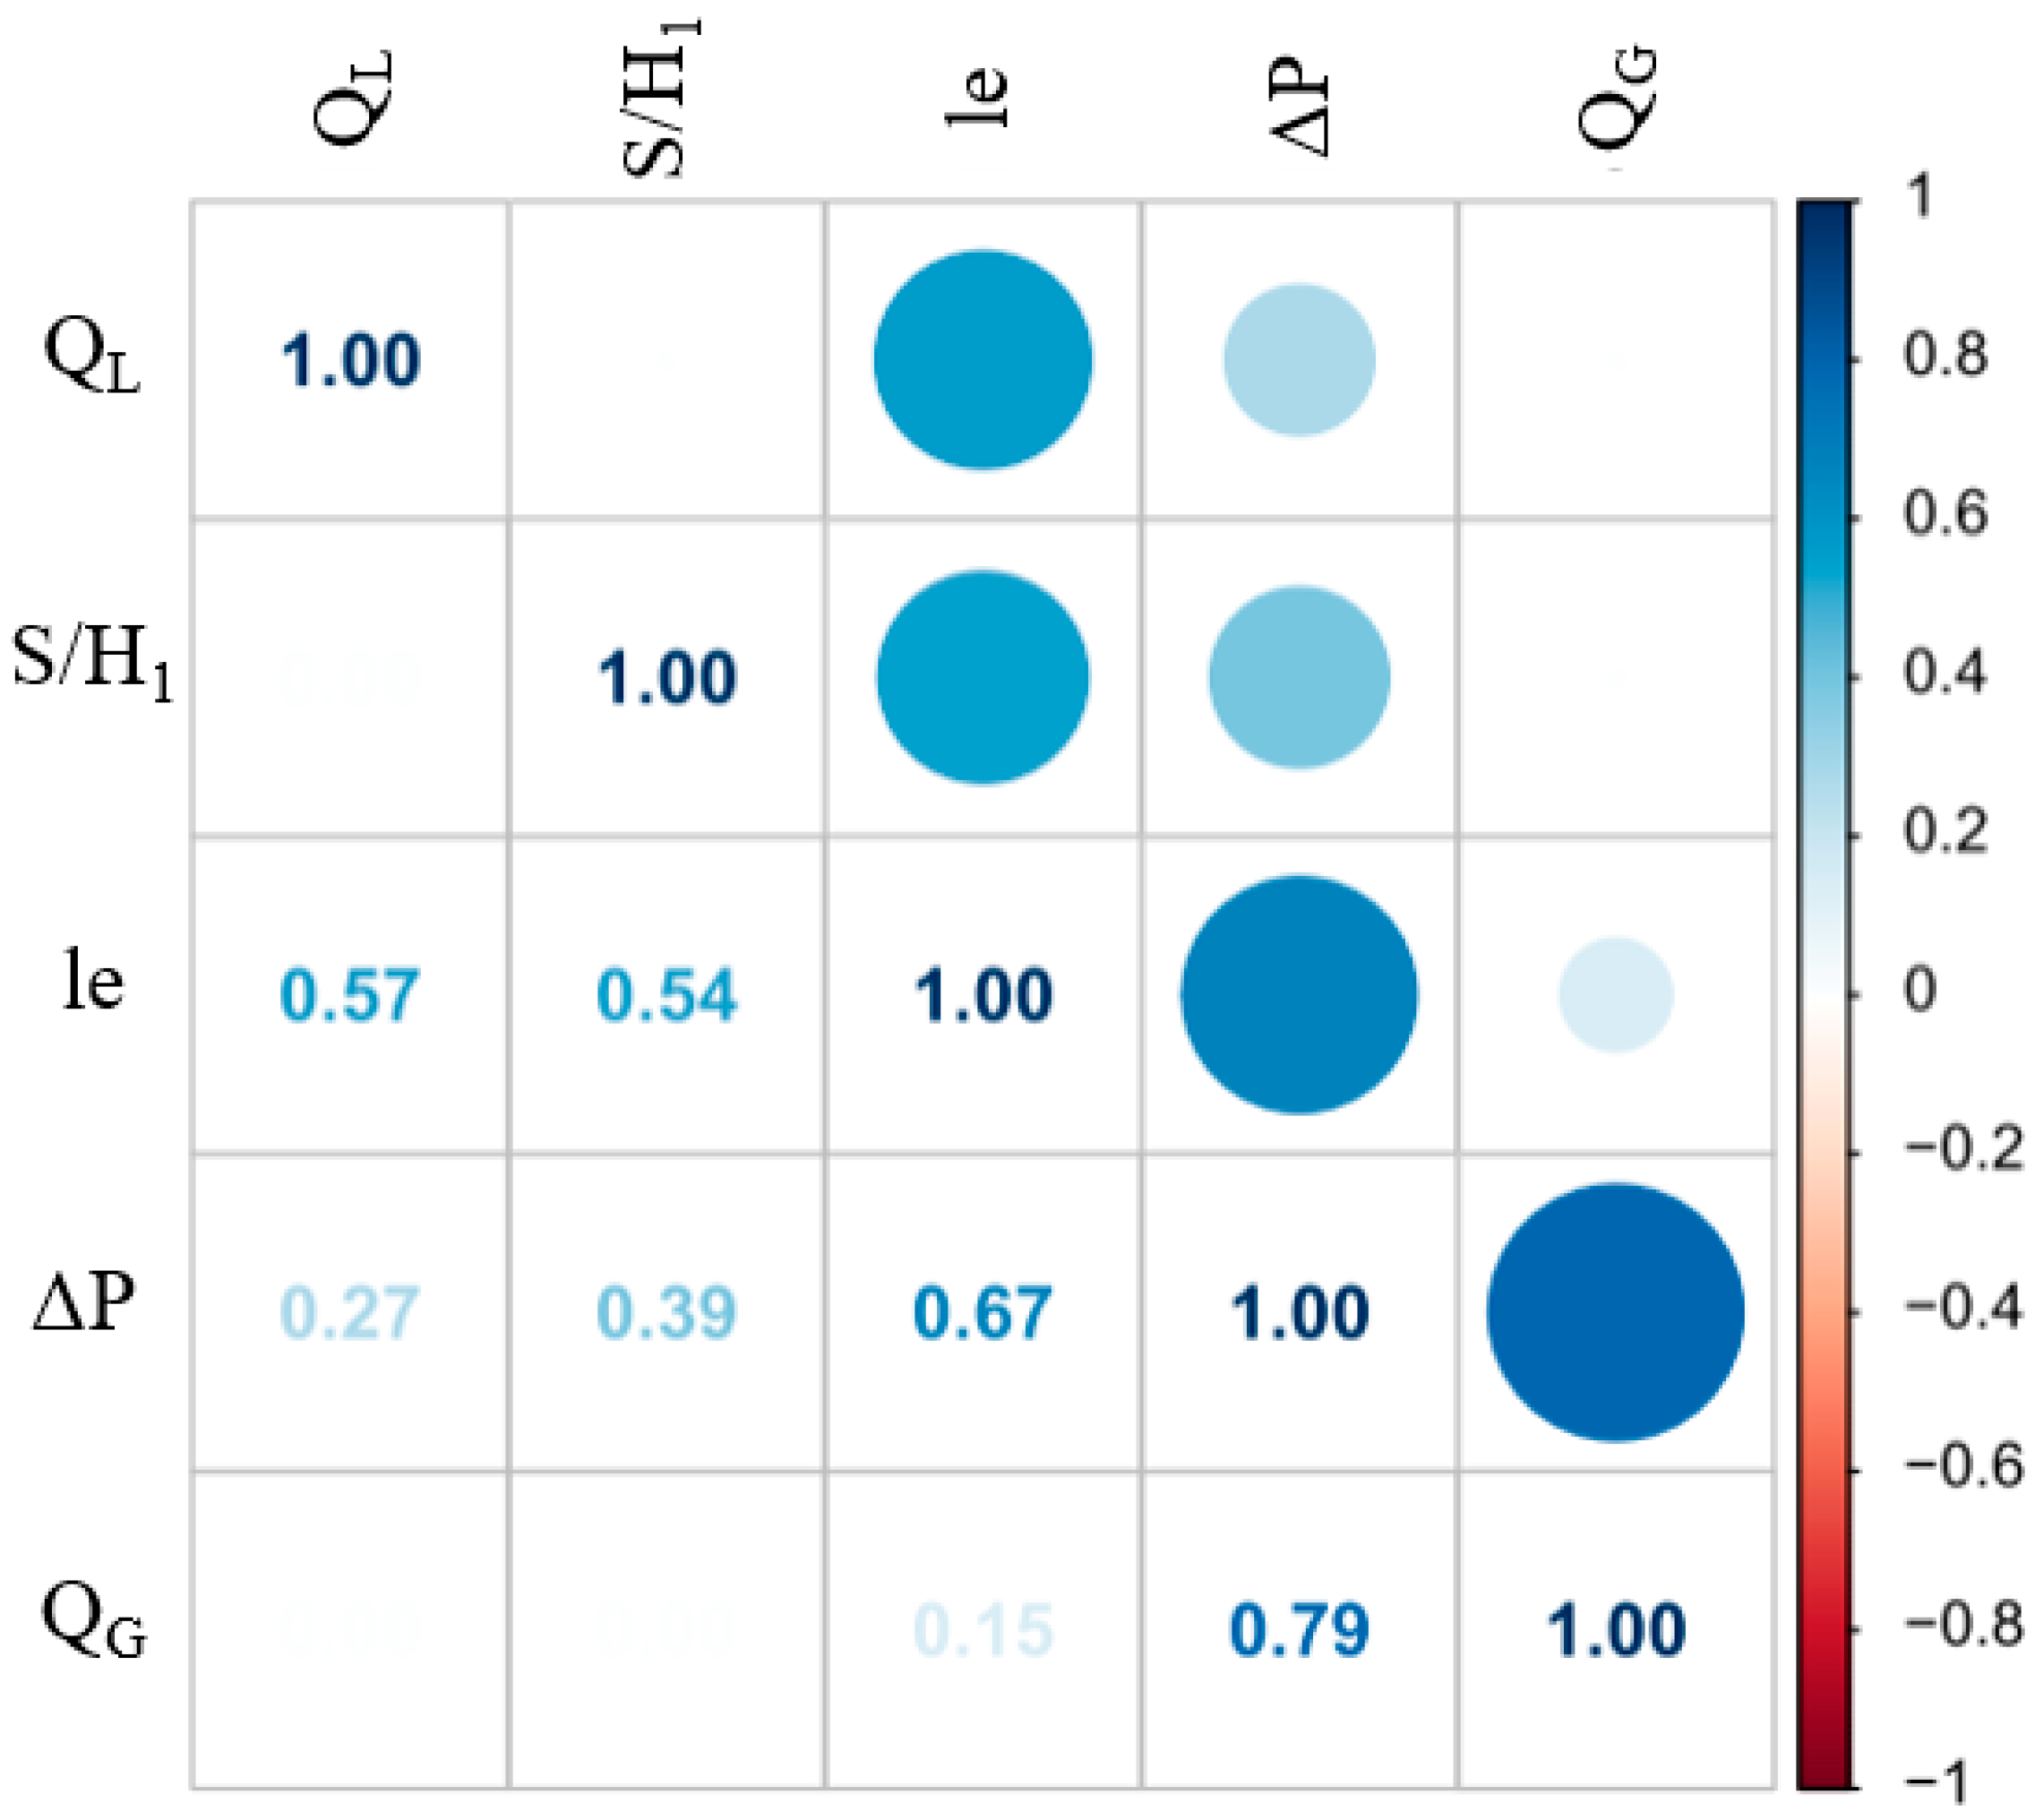
Figure 11 illustrates the correlation coefficients among key parameters for the GLAS with LGC, including LE, QL, S/H1, QG, and ΔP. The pressure drop exhibited a strong positive correlation with QG, yielding a correlation coefficient of 0.79 (p < 0.05). The increase in gas velocity intensified wall shear, turbulent dissipation, and local flow resistance, all contributing to the elevated pressure drop. Higher QG enhanced the negative pressure in the overflow pipe induced by the swirling gas-phase flow field [33]. A moderate positive correlation was observed between ΔP and the liquid entrainment rate (r = 0.67, p < 0.05), indicating that higher entrainment levels were often accompanied by higher pressure drops in the present dataset. However, ΔP was not the sole or dominant factor governing liquid entrainment. It should be noted that Pearson’s correlation coefficient reflects only linear dependence. Therefore, the low Pearson correlation between the liquid entrainment rate and QG (r = 0.15) does not indicate a weak influence of QG. Instead, it suggests a strongly non-linear and non-monotonic relationship. As QG increased, entrainment initially intensified due to stronger gas–liquid interaction and enhanced upward transport, but it subsequently decreased at higher QG when centrifugal effects became more pronounced. This non-linear trend weakened the Pearson correlation between QG and liquid entrainment. Moreover, moderate correlations were observed between the liquid entrainment rate and both QL (r = 0.57) and insertion depth (r = 0.54), indicating that an increase in QL and S/H1 significantly impacts the extent of entrainment. However, the relatively low correlations of ΔP with QL and insertion depth (r = 0.27 and 0.39, respectively) confirmed that ΔP was primarily influenced by gas-phase dynamics rather than liquid loading or structural configuration. Therefore, adjusting the insertion depth of the overflow pipe and installing the LGC represent effective strategies for reducing liquid entrainment while minimizing energy consumption.

4. Numerical Simulation

4.1. Model Selection

The VOF model is an Eulerian interface-capturing approach that solves a shared momentum equation and tracks the phase distribution through volume fractions on a fixed grid [34]. It is well suited for immiscible gas–liquid flows where a distinct interface, such as a liquid jet and wall films, must be resolved. In the GLAS, the flow features strong swirl, jet fragmentation, local recirculation, and strong oscillation changes in the two-phase interface. Therefore, VOF is adopted to capture the macroscopic interface evolution and liquid entrainment pathways, rather than droplet size statistics at micron scales. The VOF model more accurately captures the complex gas–liquid turbulent dynamics characterized by strong interfacial variations within the swirl spray separator [33,35].
Two-equation RANS closures have been widely used in cyclone-type separators. Yang et al. employed an RNG k-ε model to simulate a gas–liquid cylindrical cyclone and investigate its separation characteristics [36]. Alahmadi and Nowakowski applied a curvature-corrected k-ω SST model to predict the confined swirling flow in a cyclone separator [37]. Previous cyclone studies have shown that RSM and the Large Eddy Simulation (LES) model provide improved predictions for strong swirling flows, while LES is substantially more expensive for multi-parameter simulations [38,39]. The turbulence model was selected based on the strongly swirling field, highly anisotropic flow in the GLAS, and on accuracy–cost considerations. Therefore, the RSM was employed to investigate the effect of structural parameters on the turbulent flow within a swirl spray separator [40].
The numerical simulations were performed using the CFD ANSYS Fluent 2021. The VOF model was employed to capture the macroscopic gas–liquid interface behaviors. In this model, the Continuum Surface Force (CSF) model was utilized to account for surface tension effects, and the Wall Adhesion option was enabled to simulate the contact angle and wetting effects at the solid boundaries. To accurately predict the strongly swirling flow characterized by significant streamline curvature and anisotropic turbulence, the Linear Pressure–Strain method was adopted to model the pressure–strain term. Near-wall turbulence was treated using Standard Wall Functions.

4.2. Physical Model and Mesh Generation

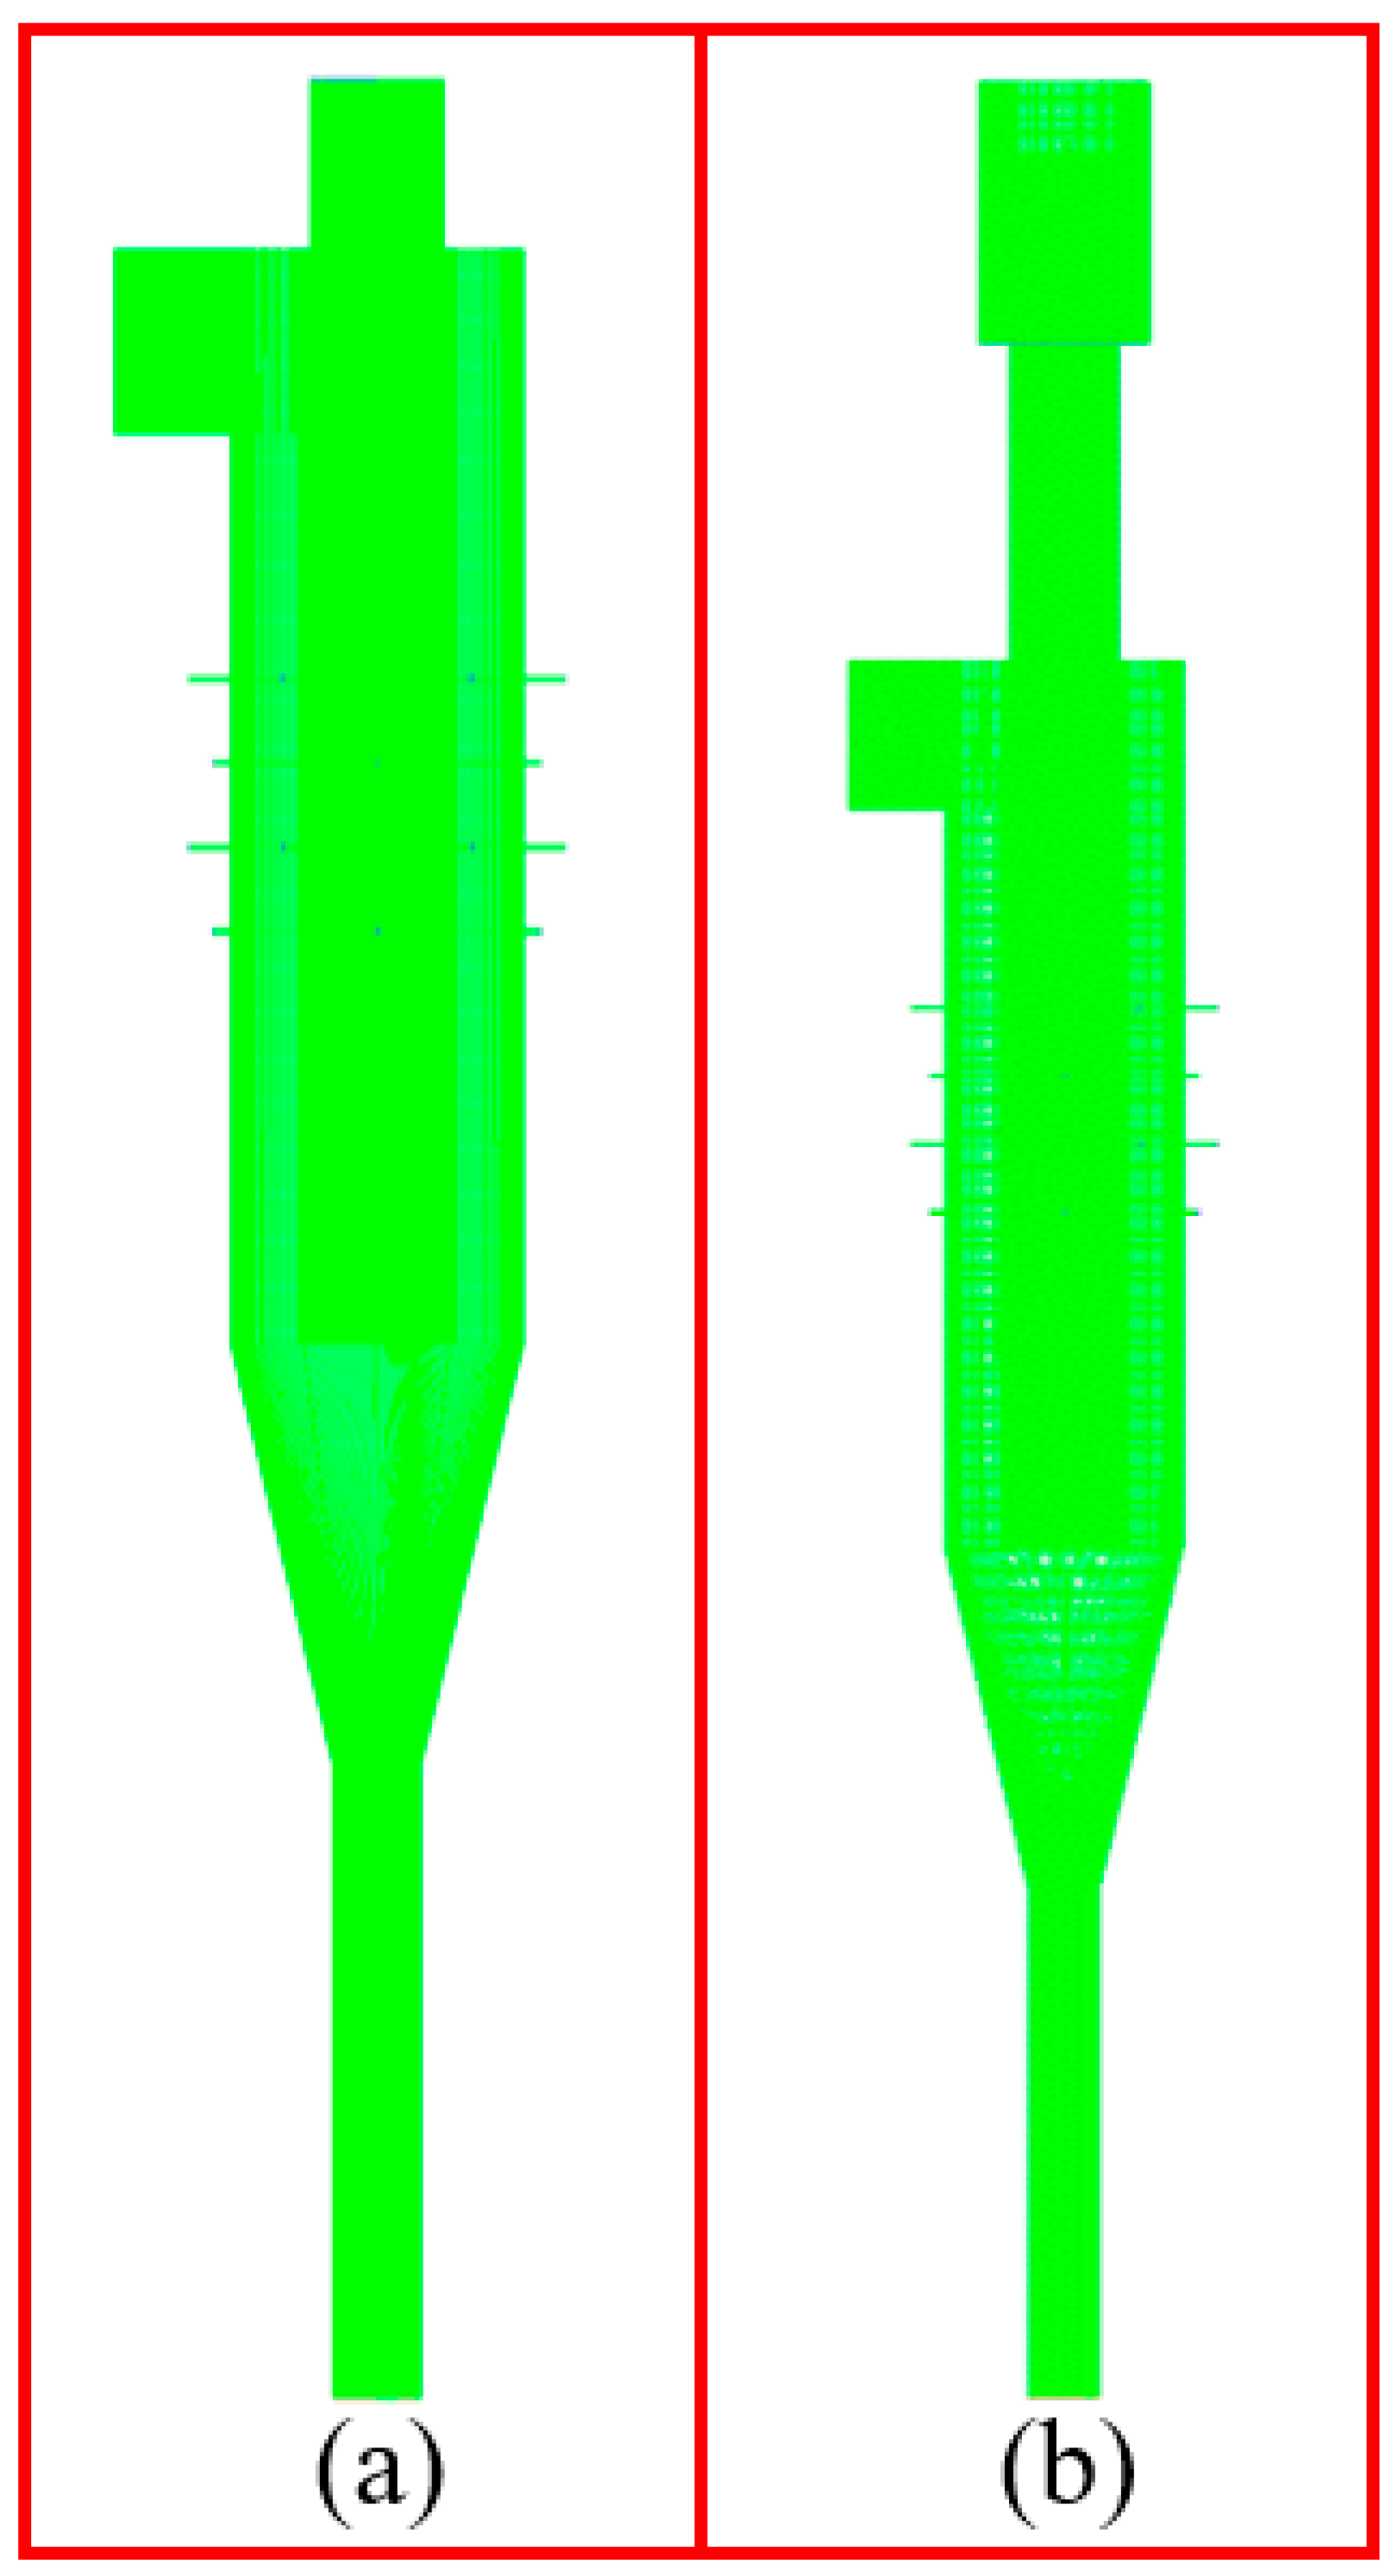
In this study, SolidWorks 2024 was used to construct the geometric model of the swirl spray separator. The fluid domain was extracted using SpaceClaim to generate the computational domain, as illustrated in Figure 12. The cylindrical jet hole with a diameter of 1.2 mm was equivalently represented as a cube with the same cross-sectional area. This geometric simplification was adopted to ensure the high orthogonal quality of the structured hexahedral mesh, which was critical for the convergence and stability of the VOF simulation. With the same liquid flow rate, the equivalent-area treatment kept the same mean exit velocity and thus preserved the overall jet injection strength. Moreover, the RSM turbulence model was sensitive to grid quality. The hole simplification allowed for a fully structured hexahedral mesh with superior orthogonality, which was important to ensure the convergence and numerical stability of the RSM-VOF coupling. A high-quality structured hexahedral mesh was generated using ANSYS ICEM CFD 2021, with a minimum orthogonal quality exceeding 0.3. Tetrahedral and other unstructured mesh types offer high levels of automation, often enabling near one-click mesh generation, thereby significantly reducing preprocessing time. However, such meshes typically exhibit lower mesh quality and numerical accuracy, necessitating a larger number of elements to achieve equivalent solution precision, which compromises computational efficiency. In contrast, hexahedral meshes demonstrate better anisotropy, lower numerical diffusion, and superior convergence behavior. When simulating boundary layers, hexahedral meshes enable the generation of prismatic boundary layers that more accurately resolve normal gradients, thereby offering enhanced capability for resolving complex near-wall flow predictions [41].

4.3. Boundary Condition

The operating temperature and ambient pressure were specified as 20 °C and 0.101 MPa, respectively. Air was designated as the gas phase and water as the liquid phase. QG was set at 25.00, 31.25, 37.50, and 43.75 m3/h, corresponding to inlet gas velocities of 3.54, 4.42, 5.31, and 6.19 m/s. QL was 1.95, 2.60, 4.55, and 6.50 L/min, yielding liquid velocities of 1.2, 1.6, 2.8, and 4.0 m/s at the spray orifices. Uniform velocity distributions were assumed at all inlets. The “Velocity inlet” boundary condition was applied to both gas and liquid inlets, while the “Outlet-vent” boundary condition was implemented at both liquid and gas outlets.

4.4. Grid Independence Verification and Reliability Verification

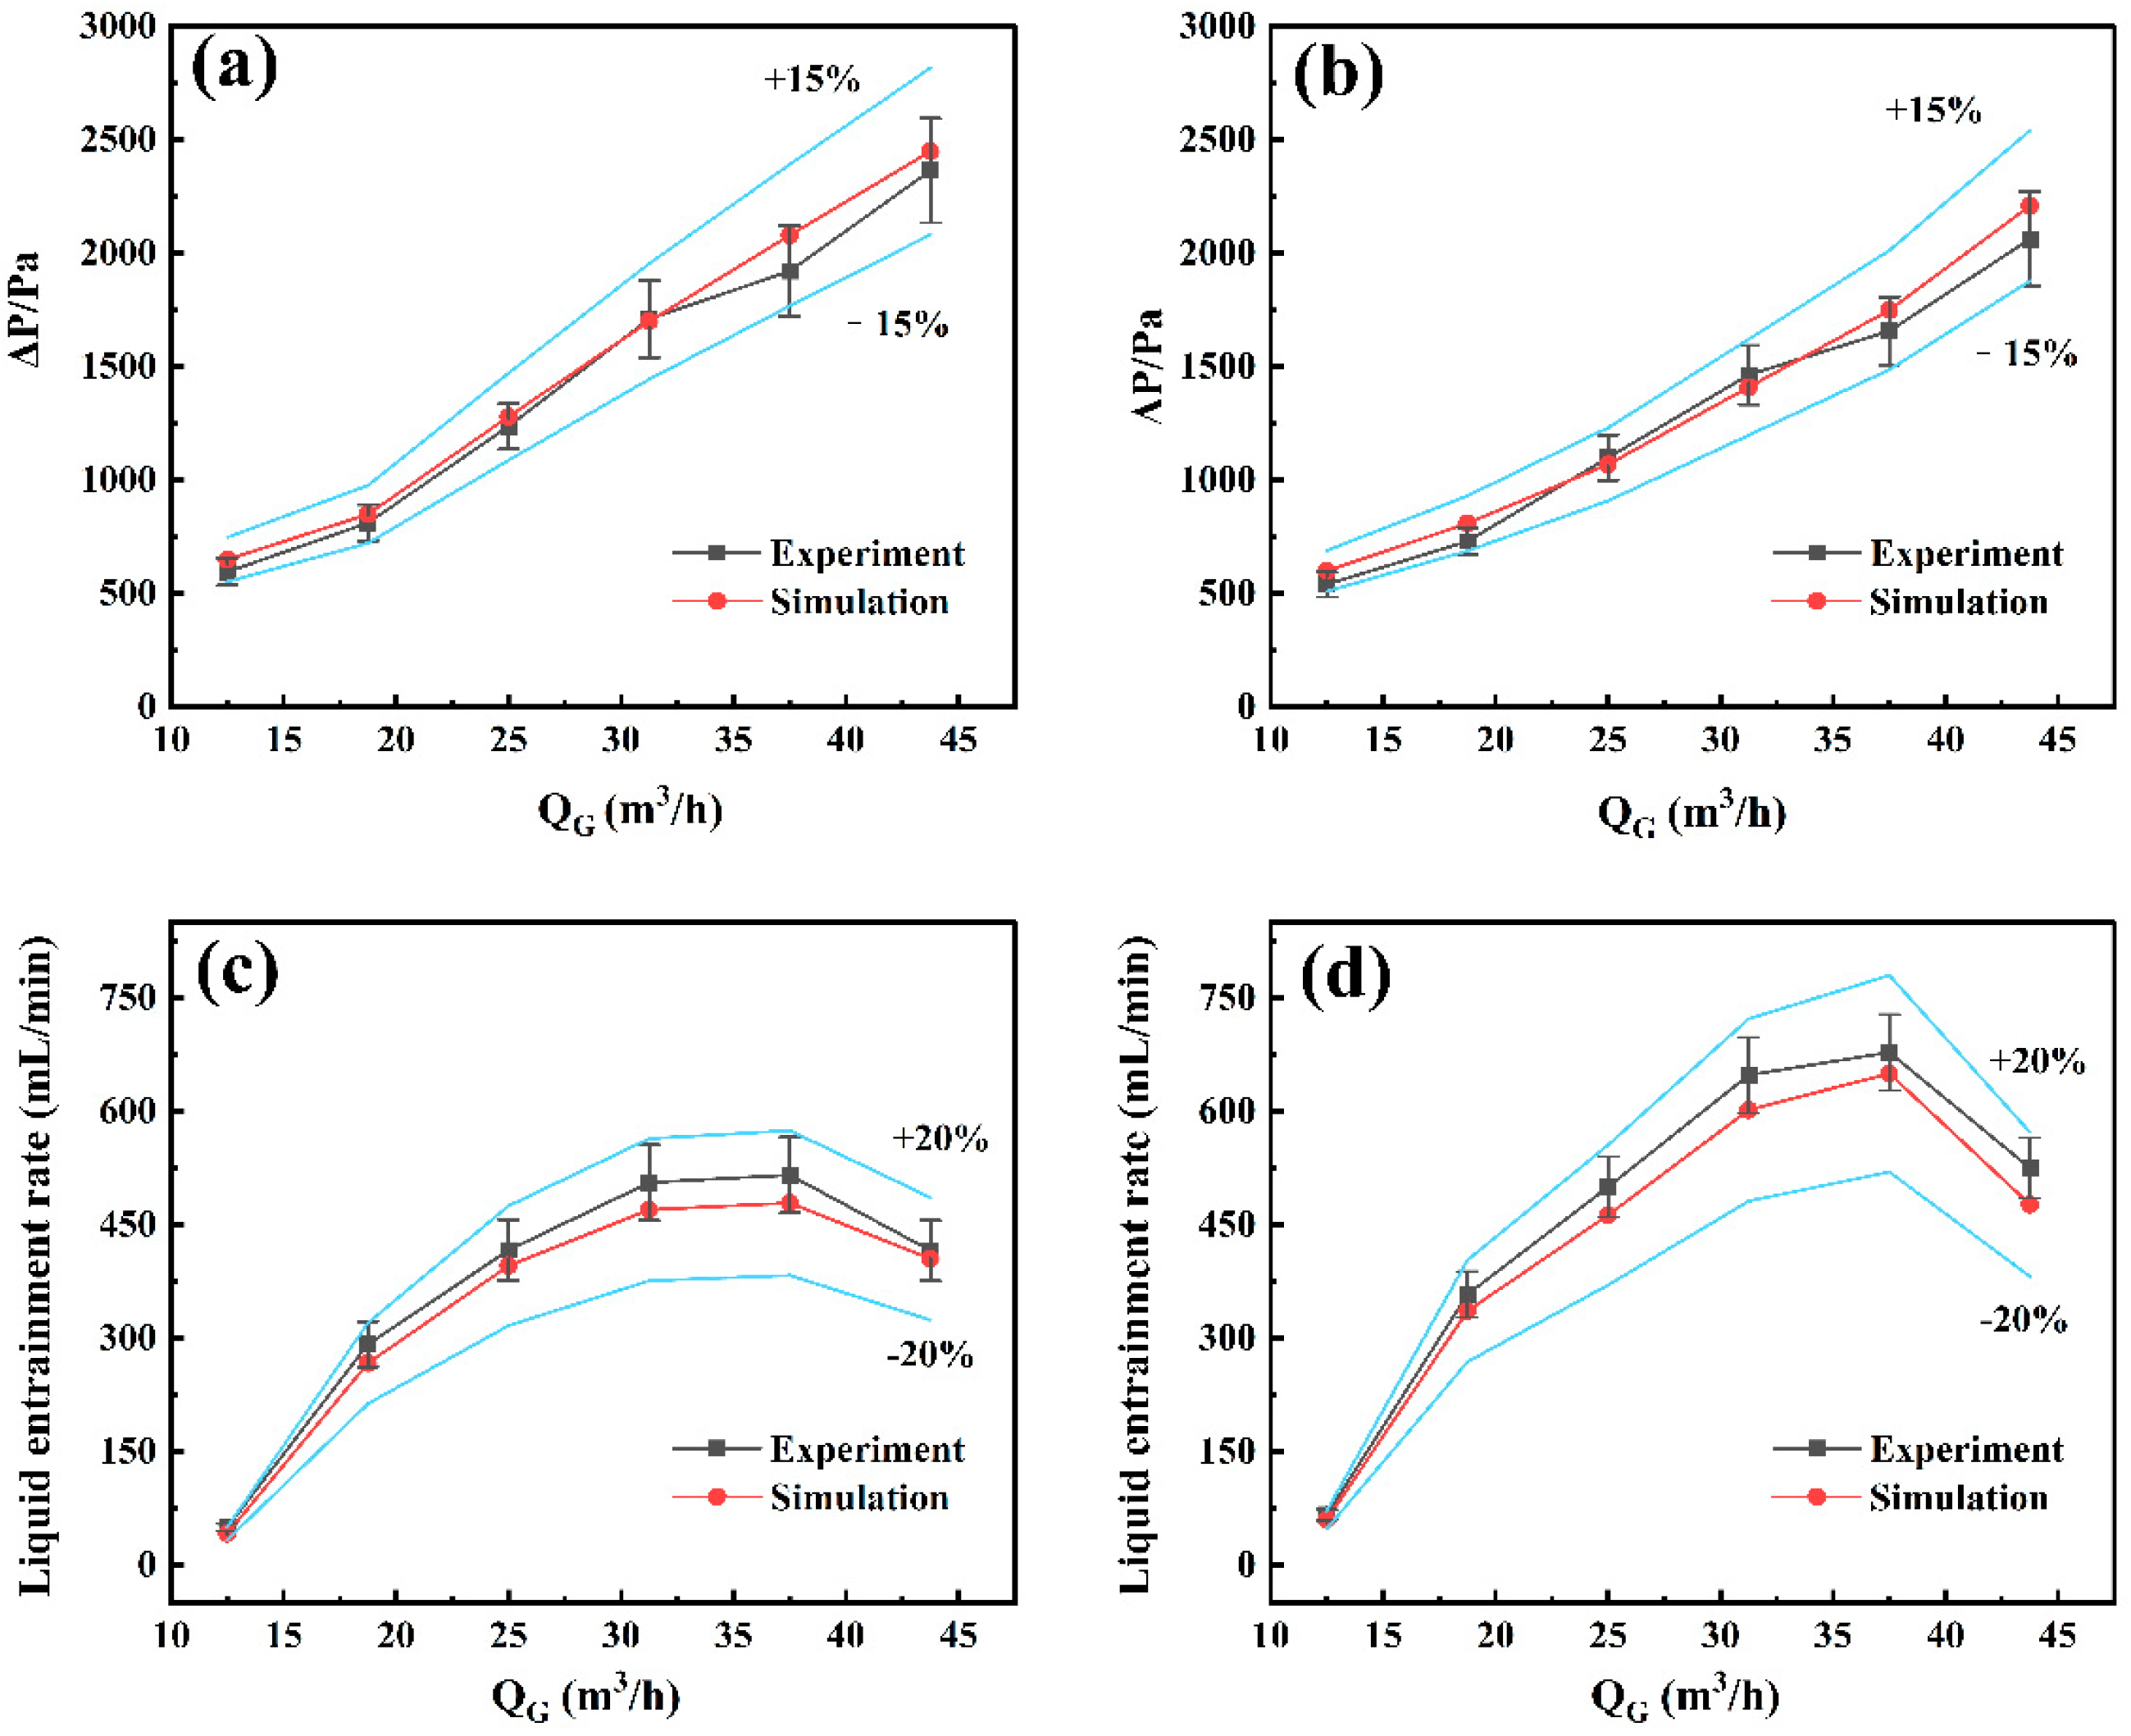
For the flow field model without an LGC, mesh sizes of approximately 5.0 × 10⁶, 7.0 × 10⁶, and 9.0 × 10⁶ elements were employed. For the model with an LGC, mesh sizes of approximately 5.0 × 10⁶, 8.0 × 10⁶, and 1.0 × 10⁷ elements were used. All meshes satisfied the minimum orthogonal quality criterion of 0.3. The impact of mesh sizes on simulation results was systematically evaluated. After 2000 iterations, under an inlet gas velocity of 4.42 m/s and a liquid jet velocity of 2.8 m/s, the tangential velocity distribution along a vertical line positioned 5 mm below the overflow pipe outlet was extracted. The resulting profiles for each mesh size are presented in Figure S3. The tangential velocity profiles along the Y-axis exhibited nearly identical distributions, indicating mesh independence. Consequently, the coarsest mesh was selected for subsequent simulations to optimize computational efficiency without compromising accuracy. Further validation of the model reliability was performed using both pressure drop and liquid entrainment rate. As shown in Figure 13a,b, when QG increased from 12.50 to 43.75 m3/h, the measured ΔP remained within ±15% of the simulated values for both cases with and without the LGC. More importantly, Figure 13c,d provided a direct quantitative comparison of the liquid entrainment rate at S/H1 = 1 when QL = 4.55 L/min for both cases with and without the LGC. The simulated entrainment rates agreed with the experiments within ±20% over the investigated QG range, and the model reproduced the non-monotonic trend. These results supported the reliability of the present CFD framework for predicting entrainment trends in the GLAS.

4.5. Numerical Simulation Results

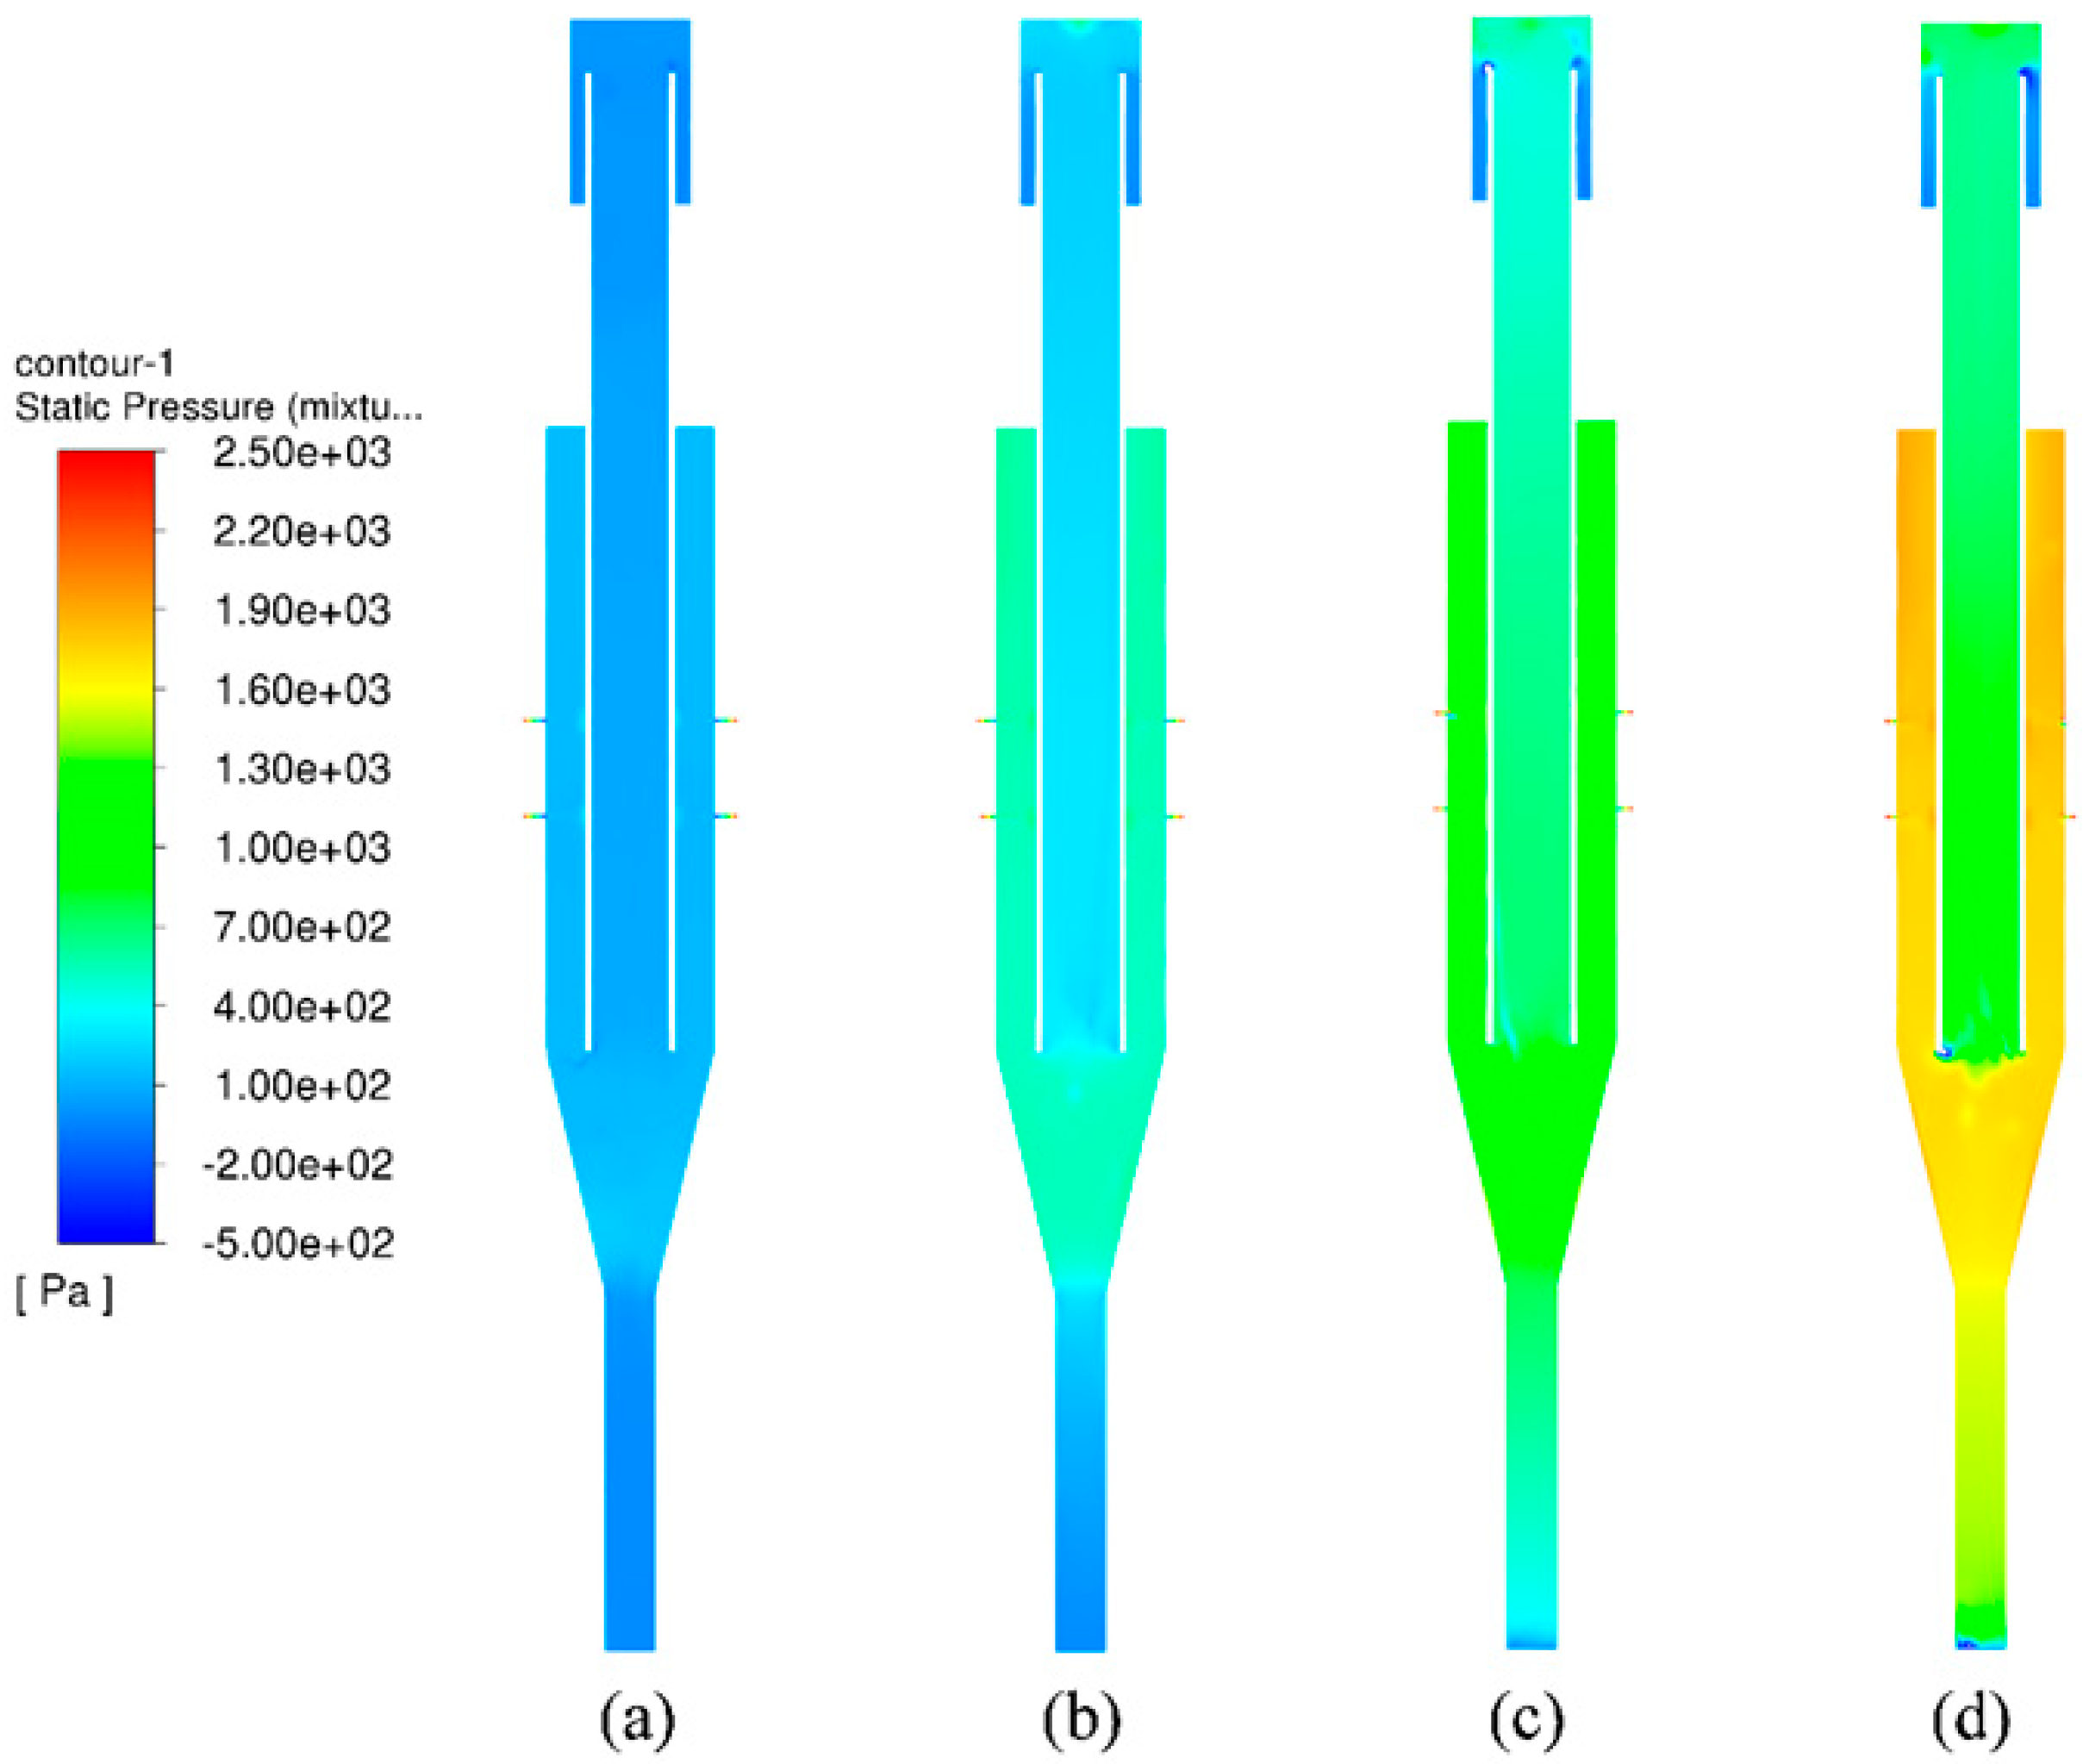
The Pressure field distributions of the GLAS are investigated under varying QG (25.00, 31.25, 37.50, and 43.75 m3/h) when QL is kept at 4.55 L/min, as shown in Figure 14. At QG = 25.00 m3/h, the field was dominated by relatively low pressure. A weak negative pressure region formed near the overflow pipe inlet, indicating limited suction at this stage. As a result, the liquid phase preferentially drained along the wall or accumulated slowly in the lower section, and the outlet liquid entrainment remained low. With increasing gas flow rate, both the spatial extent and magnitude of the negative pressure near the overflow pipe inlet increased. However, at the highest gas flow rate, this enhanced negative pressure did not translate into higher entrainment. Instead, entrainment decreased despite a continued increase in negative pressure, revealing a nonlinear relationship between pressure drop and entrainment. This trend indicated that pressure drop was not simply positively correlated with entrainment. At intermediate gas flow rates, an increase in pressure drop reflected stronger gas acceleration and interfacial shear, and the intensified local negative pressure enhanced the driving force for entraining droplets and film, thereby increasing entrainment. At the highest QG, although the pressure drop continued to rise, the stronger swirl and associated radial pressure gradient promoted liquid migration toward the wall and drainage, which reduced the liquid supply available in the core region to be entrained by suction. Consequently, the entrainment decreased.
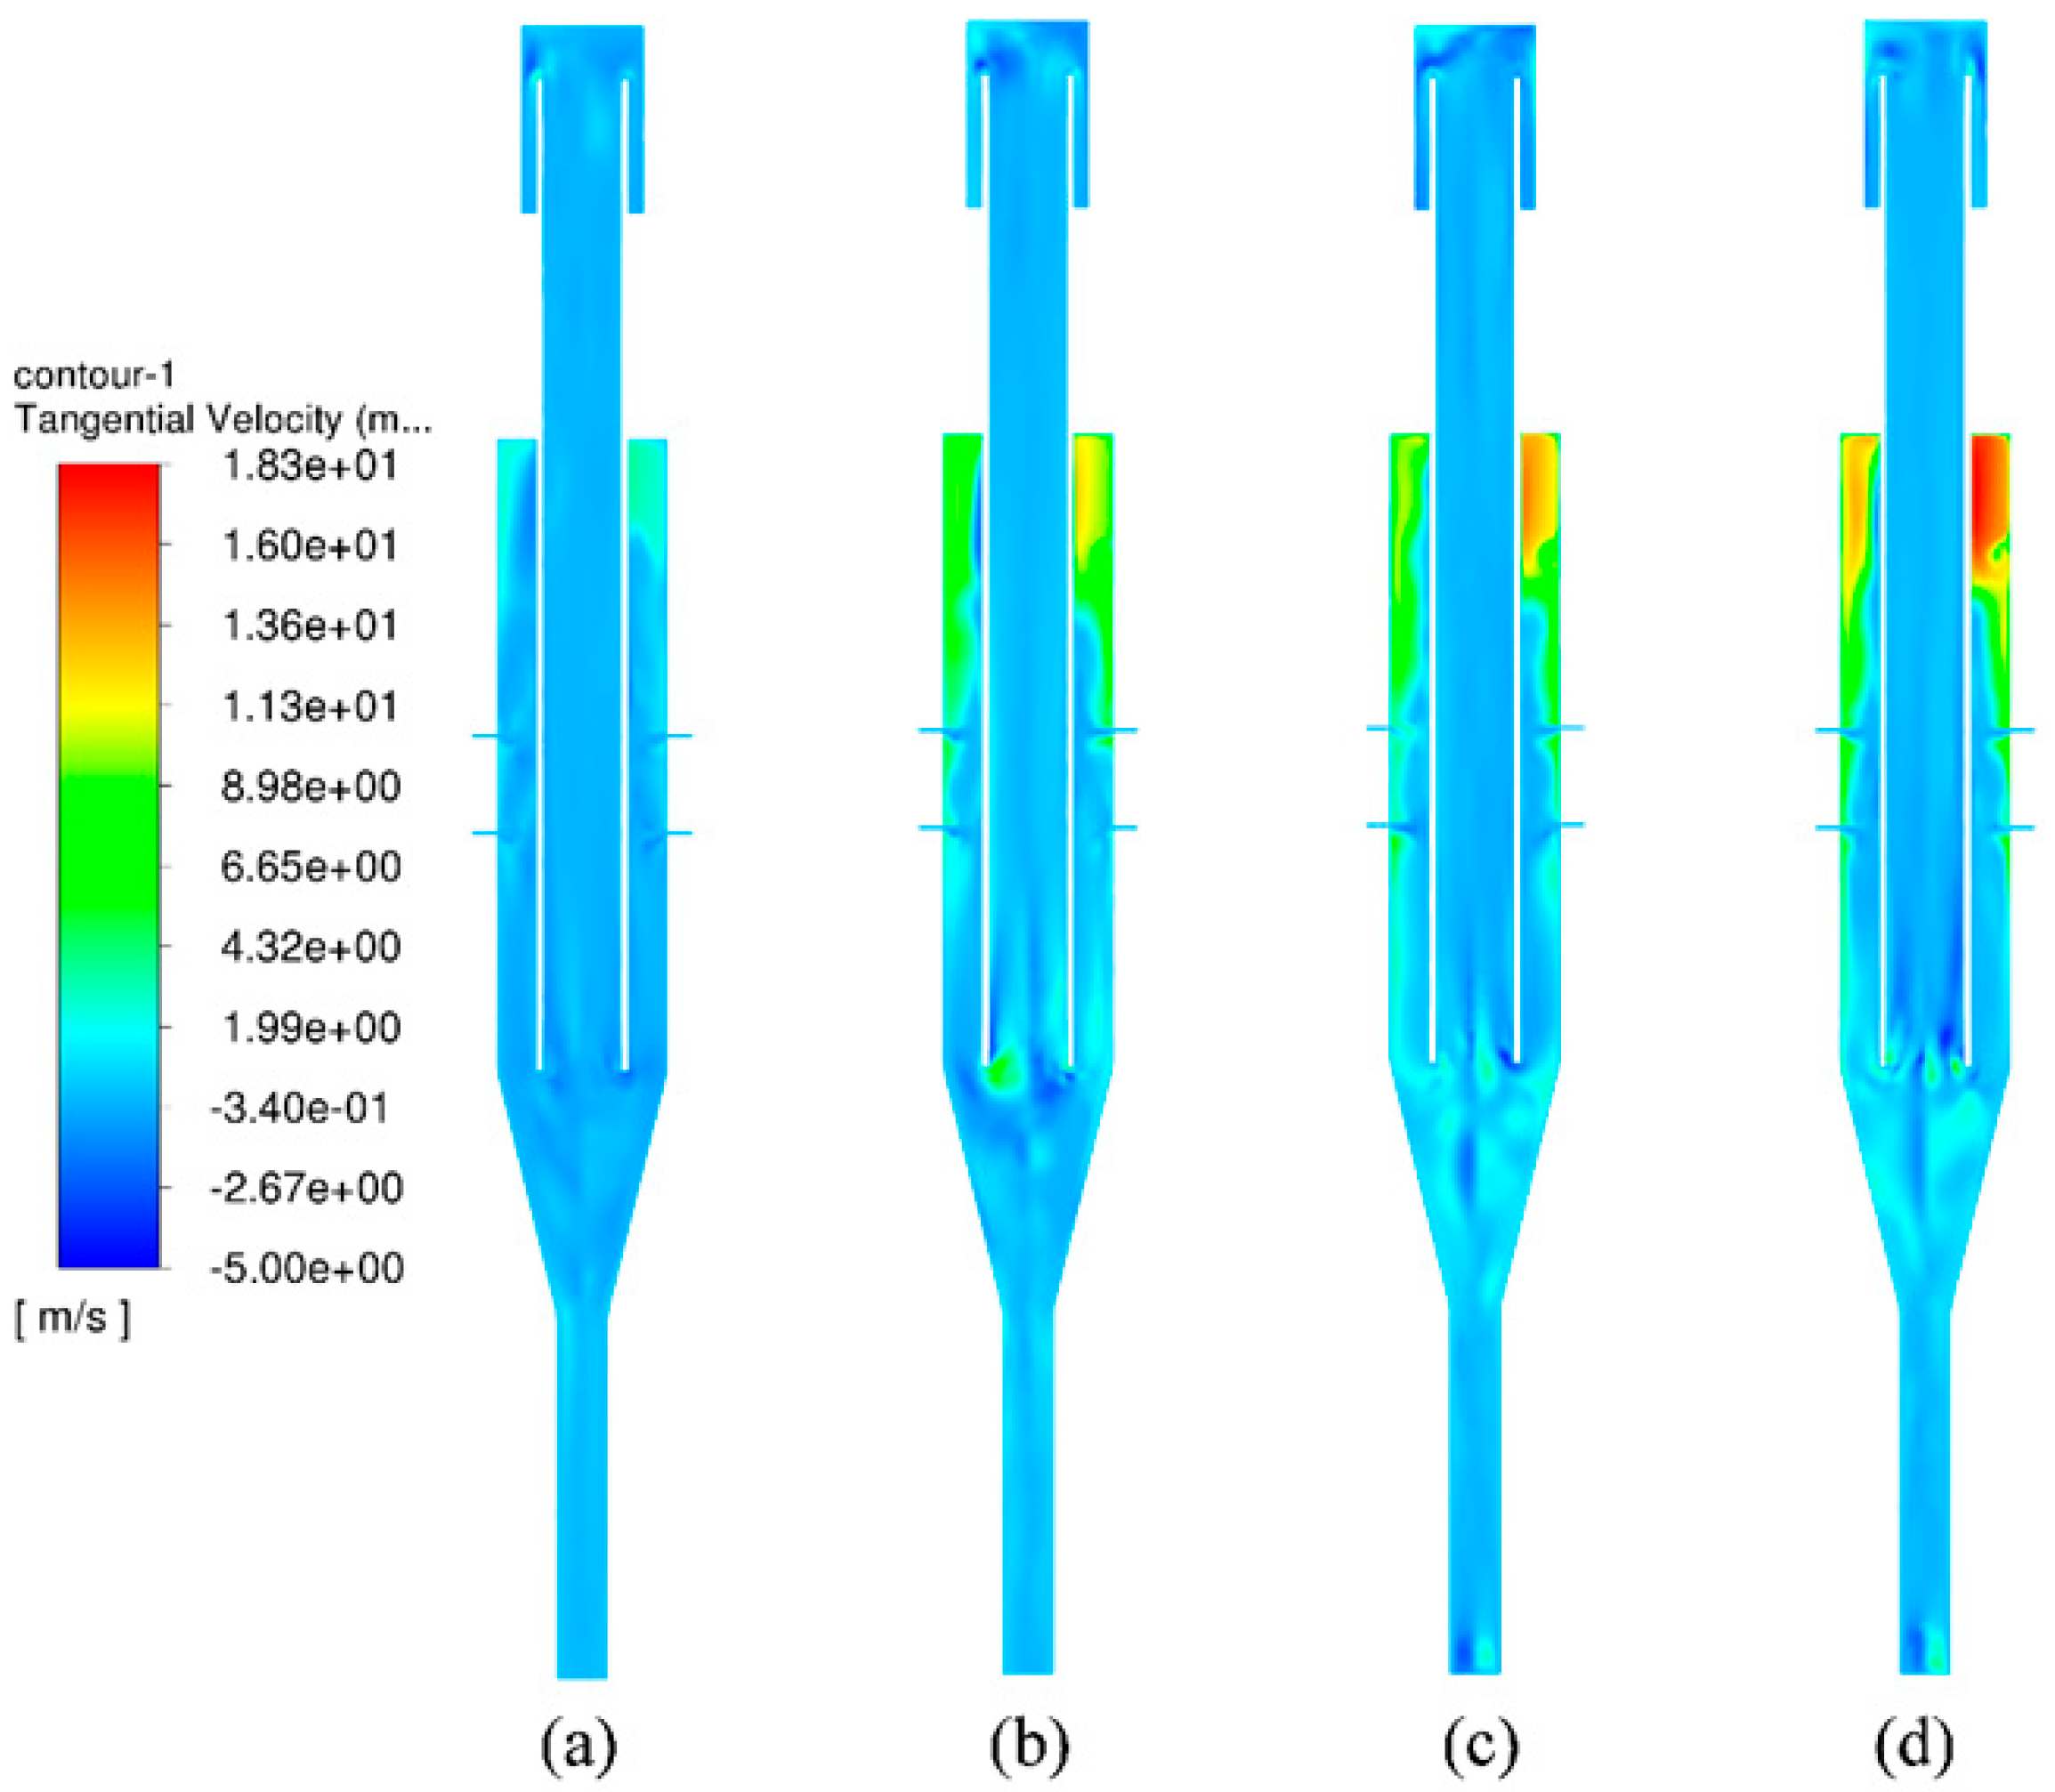
From the tangential velocity contours in Figure 15, increasing the gas flow rate from 25.00 to 43.75 m3/h progressively elevates the tangential velocity level in the outer swirling region. The high tangential velocities were primarily concentrated near the wall, indicating that the strengthening of swirl occurred mainly in the outer annular zone. After entering tangentially, the gas formed a downward helical flow that continuously impinged on the inner wall of the tube and the outer wall of the overflow pipe, inducing frictional dissipation and a stronger near-wall shear layer. When the swirl reached the jet atomization zone, the higher tangential velocity corresponded to intensified shear and disturbances, making the jet more prone to fragmentation into droplets and liquid lumps. This behavior was consistent with the experimentally observed increase in entrainment from low to intermediate gas flow rates. At the highest flow condition, the tangential velocity further increased, yet the entrainment did not continue to rise. The stronger swirl implied a larger centrifugal effect and a steeper radial pressure gradient, which promoted droplet and liquid lumps migration toward the wall and drainage. As a result, the liquid supply available in the core region to be carried to the outlet was reduced, offsetting the entrainment gain expected from enhanced shear-induced breakup.
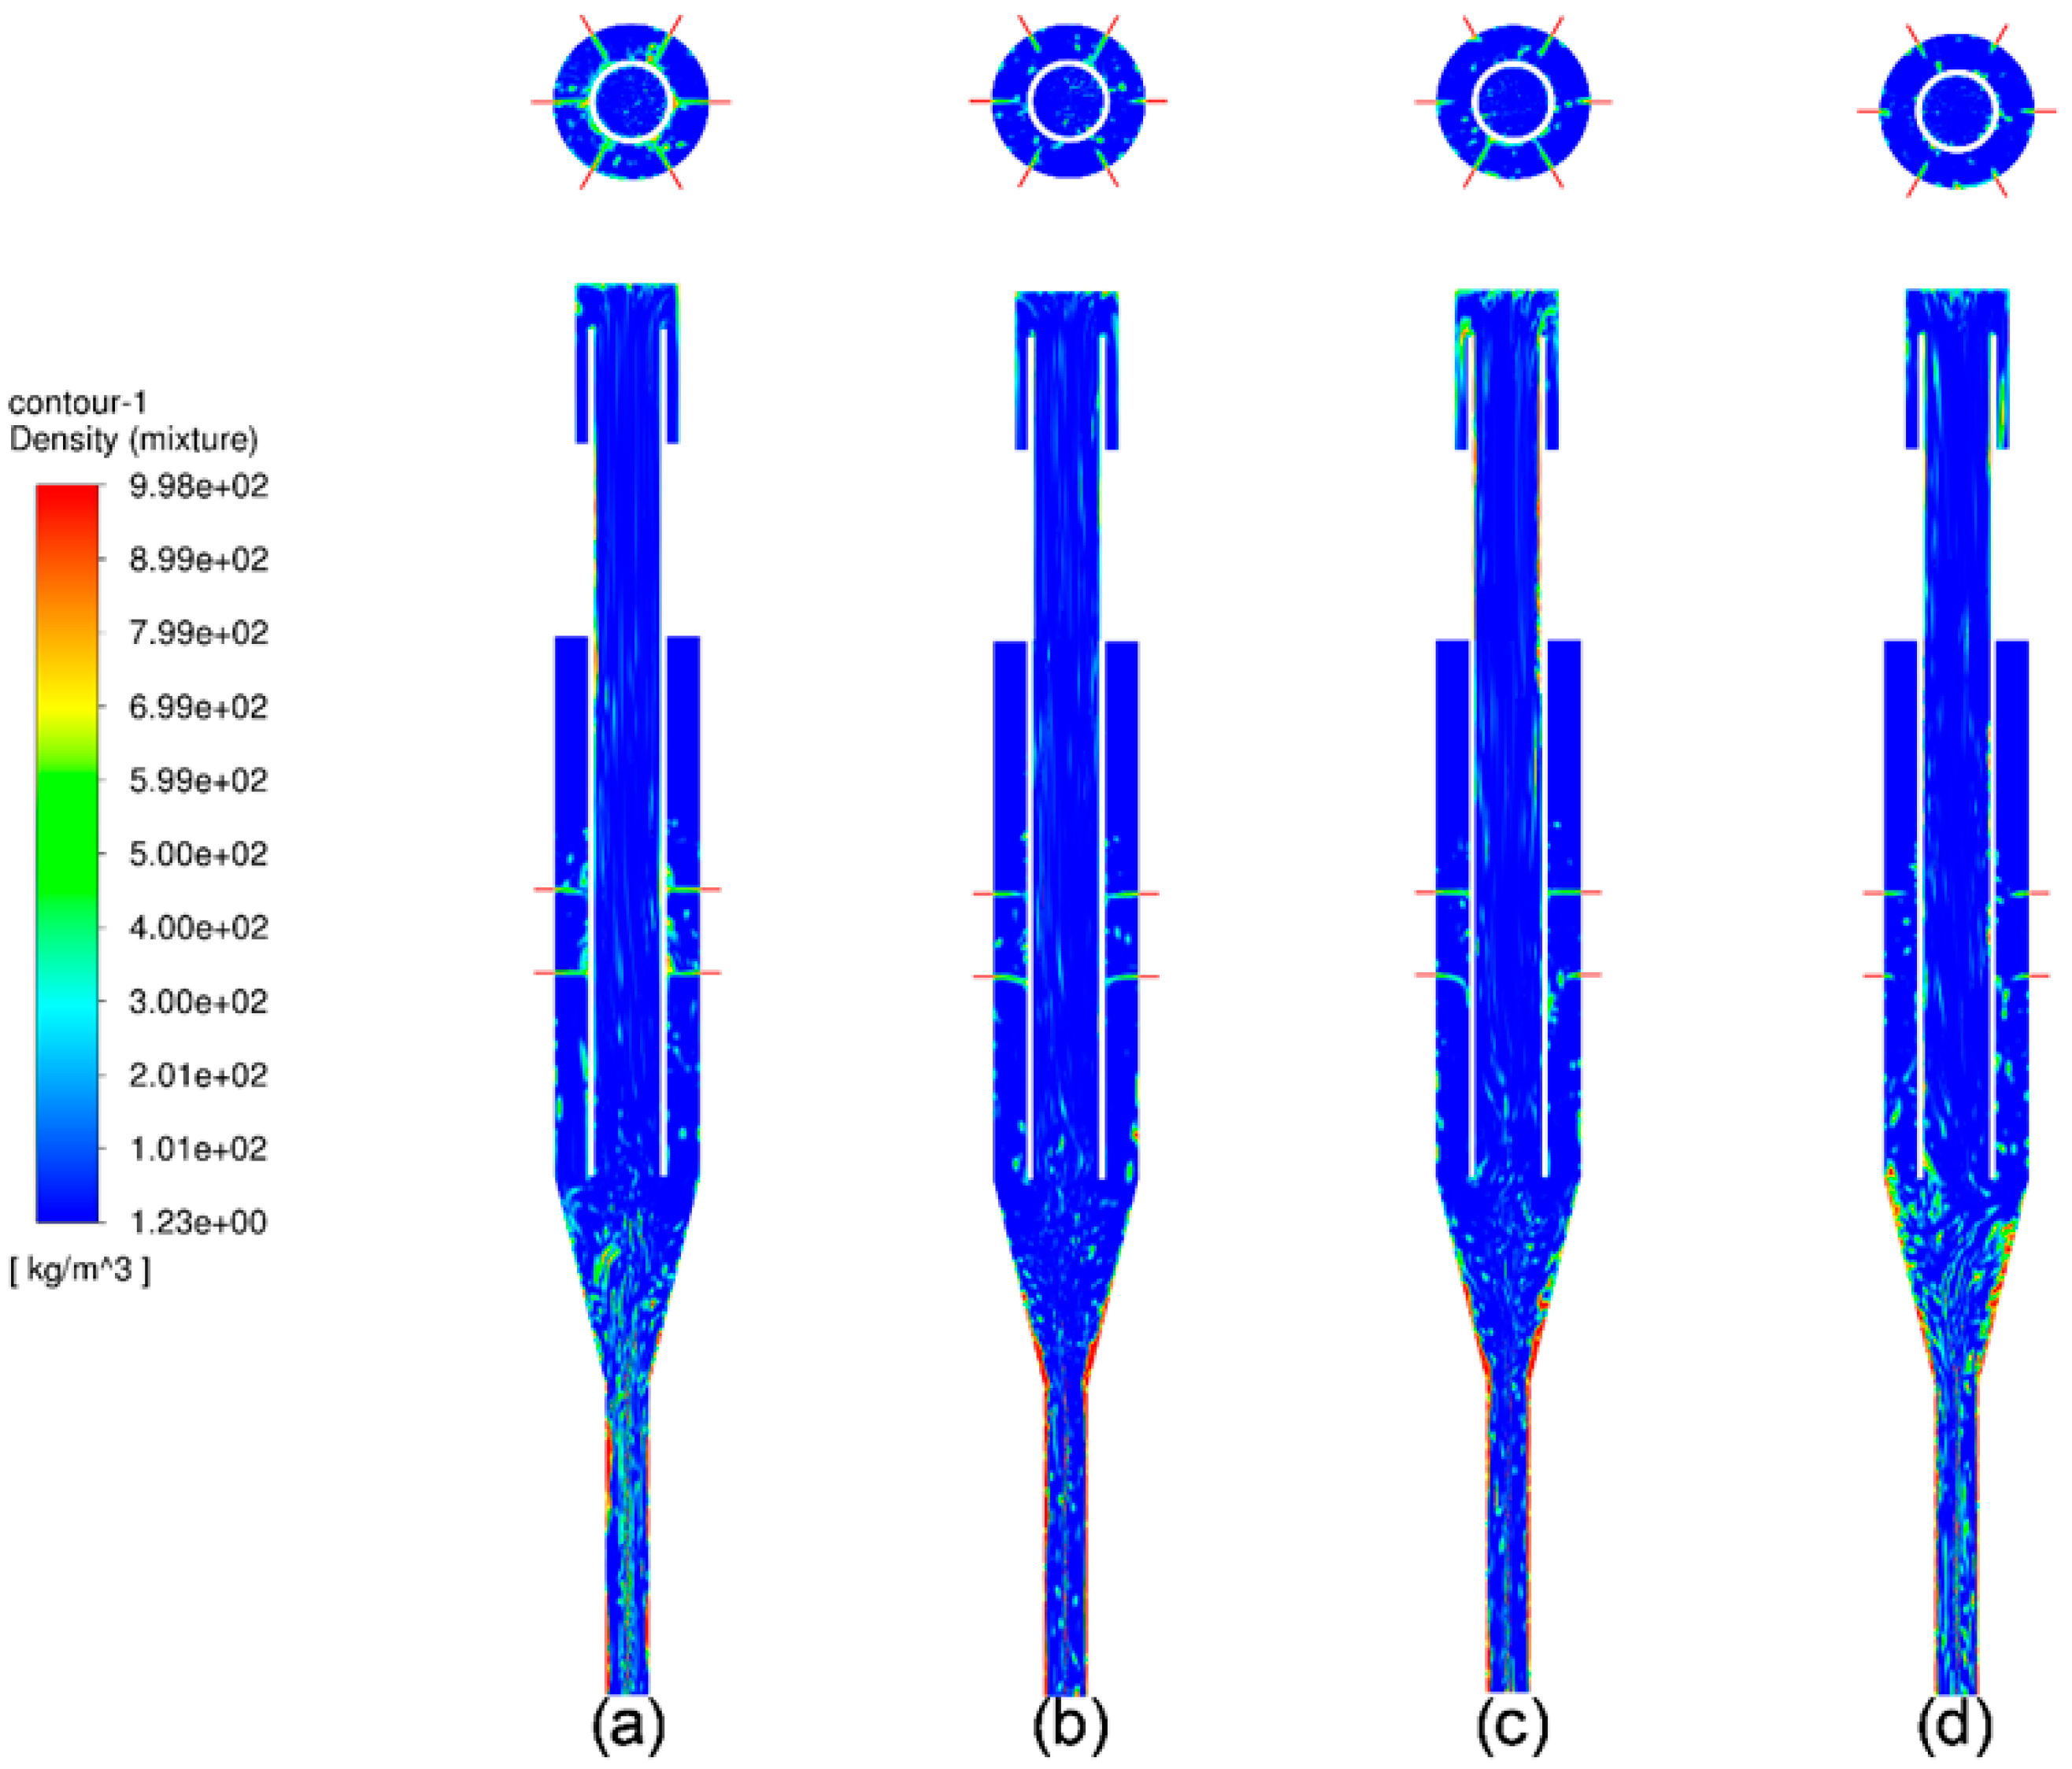
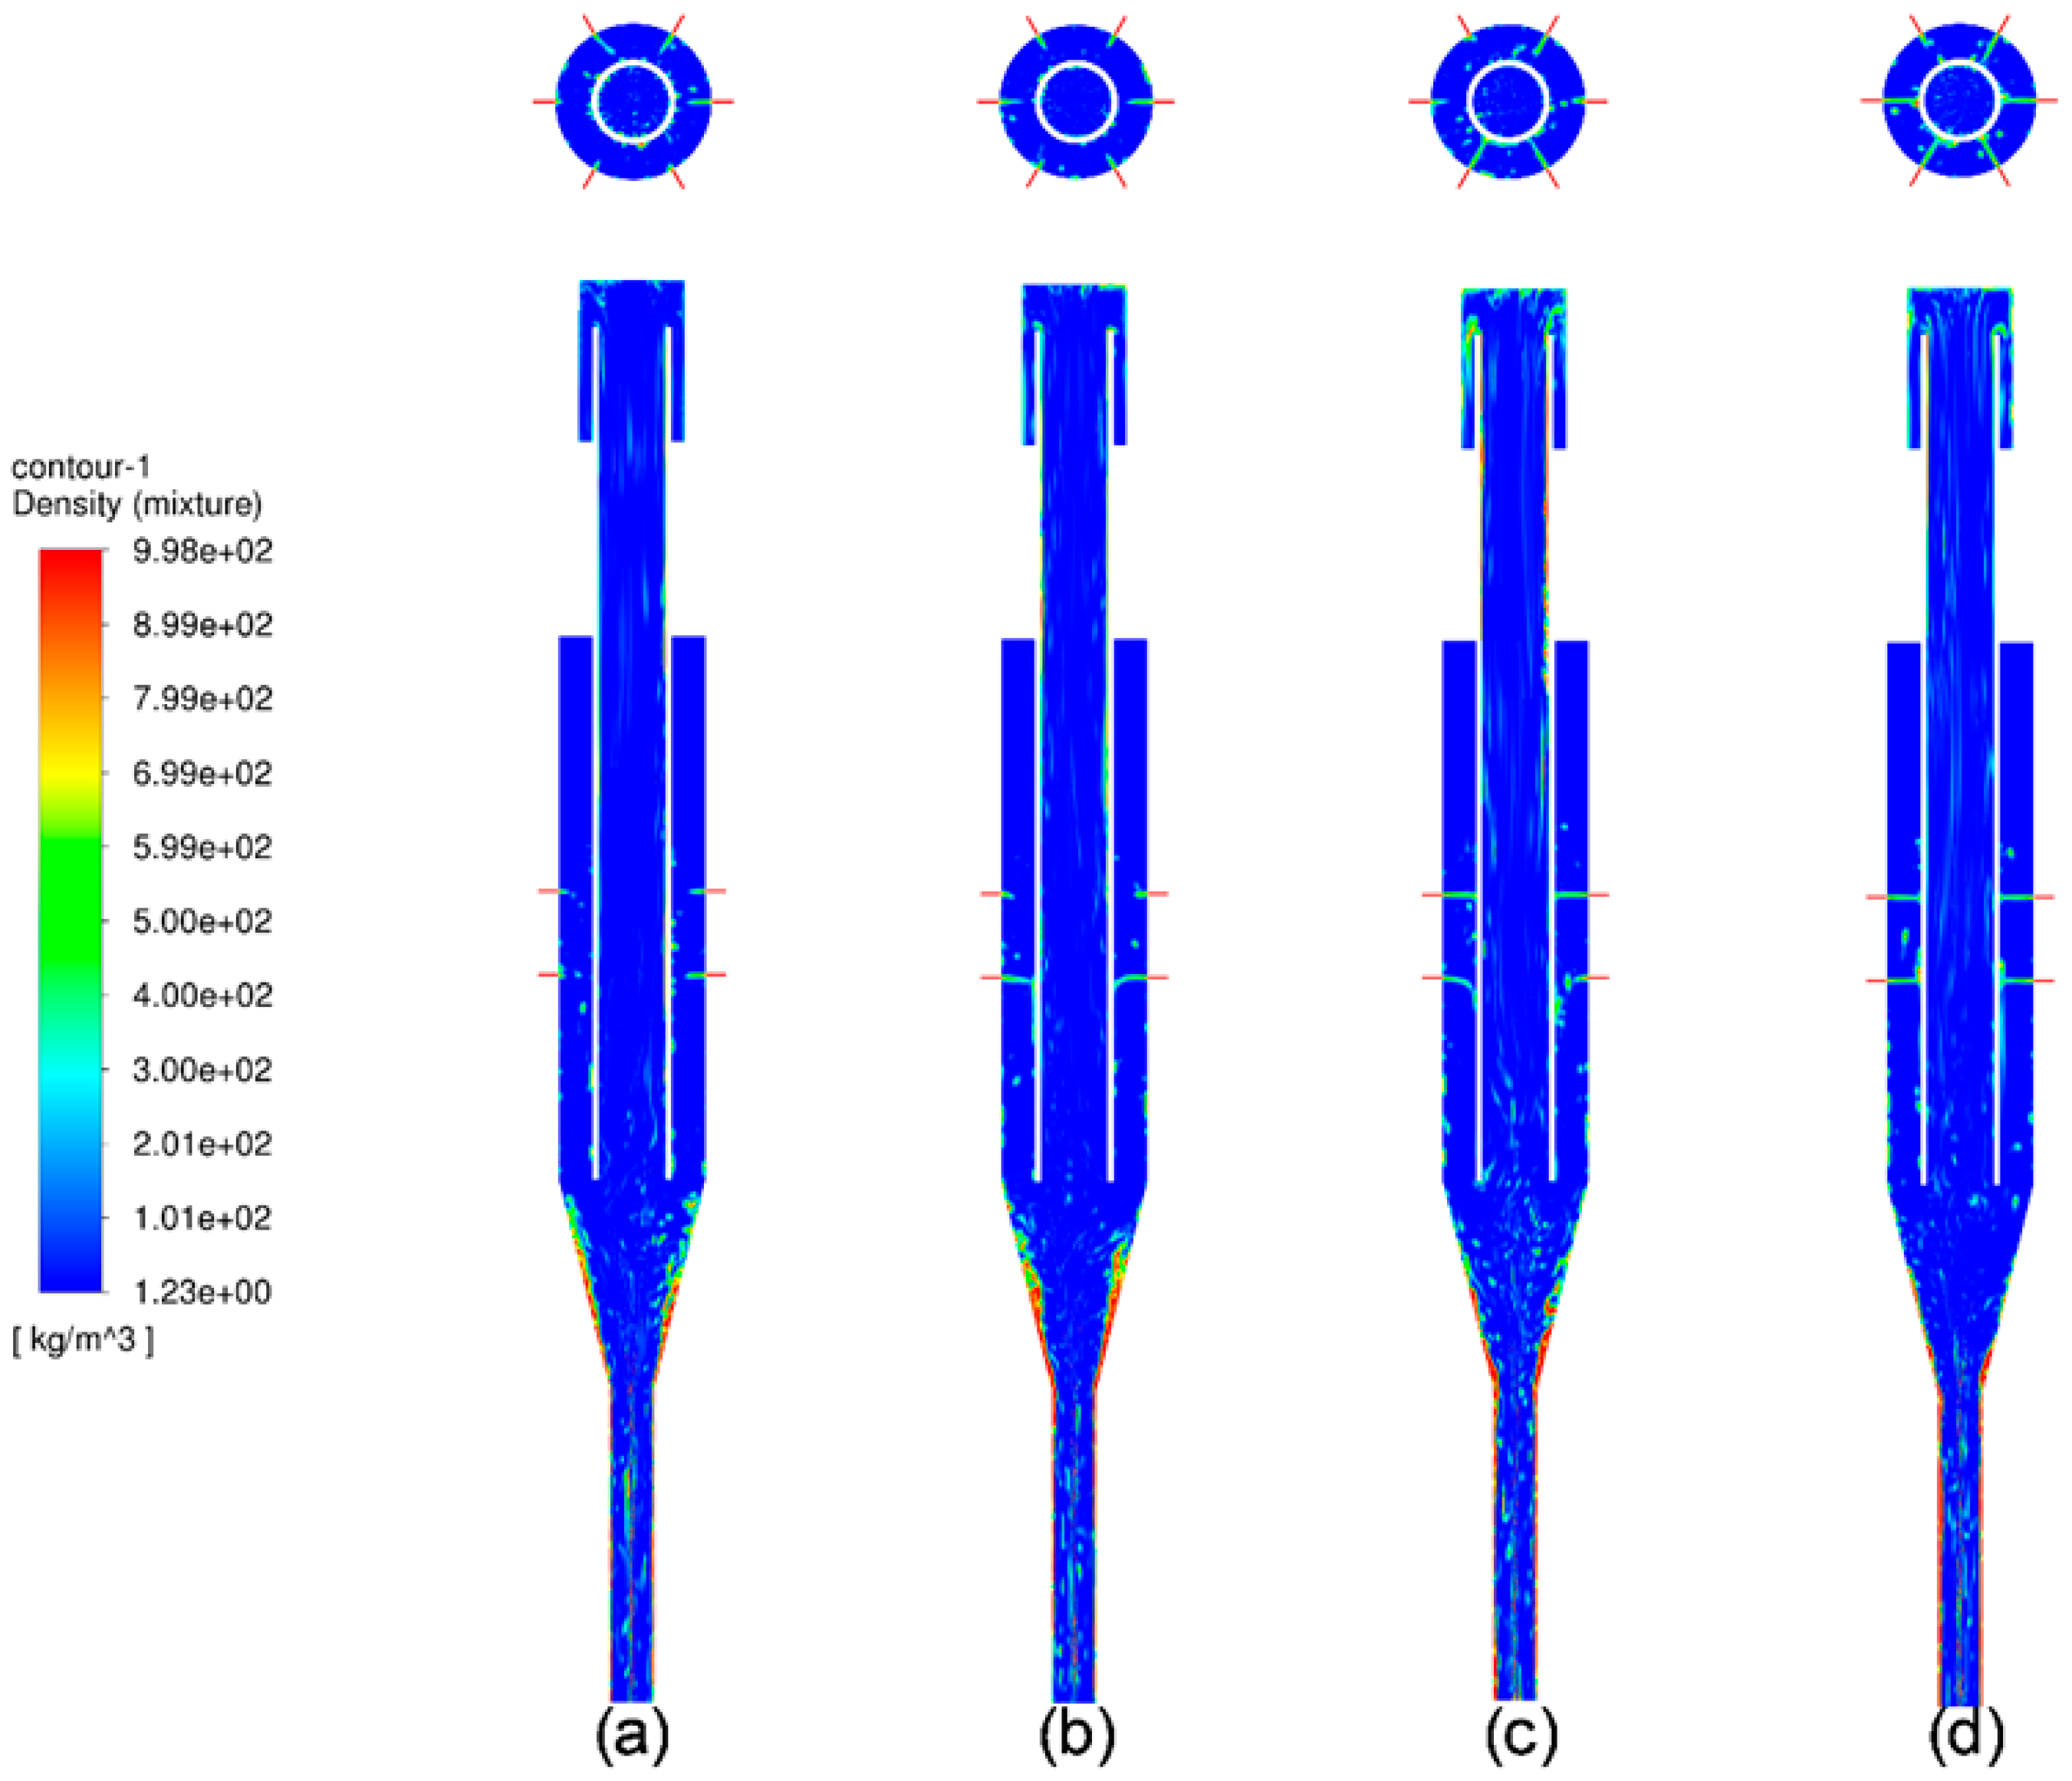
The gas–liquid two-phase distributions of the GLAS are investigated under varying QG (25.00, 31.25, 37.50, and 43.75 m3/h) when QL is kept at 4.55 L/min, as shown in Figure 16. The rising QG enhanced turbulent shear forces in the flow field, promoting more intense jet breakup and atomization of the liquid phase. It could be observed that the liquid jet breakup point shifted closer to the jet hole with the increase in QG, resulting in a shorter liquid column. At QG = 25.00 m3/h, the liquid jet impinged directly on the wall of the overflow pipe, leading to droplet splashing and liquid film flowing along the wall. Consistent with the experimental observations, the simulations suggested that the wall film on the overflow-pipe inner surface could be driven upward by negative pressure, providing a plausible pathway for film entrainment and re-entrainment. When the QG increased to 31.25 m3/h, the impact of the jet on the overflow pipe wall was mitigated; the splashing was reduced, and some of the liquid was atomized into droplets and fragmented into ligaments in the middle of the jet atomization zone without collision. The droplets and liquid fragments were entrained by the upward gas stream through the overflow pipe, leading to an initial increase in entrainment. At QG = 37.50 m3/h, more of the liquid jet was broken up before reaching the pipe wall, and a larger portion of the liquid entered the overflow pipe. This trend further increased the entrained liquid volume. However, at QG = 43.75 m3/h, the onset of jet breakup occurred very close to the jet hole, and the entrained liquid experienced stronger centrifugal forces within the swirling flow field. As a result, the droplets and liquid fragments were deflected toward the inner wall of the conical section and fell due to gravity, deteriorating the gas–liquid interaction and reducing liquid entrainment. The trend in liquid entrainment behavior predicted by the density distribution agreed well with experimental observations.
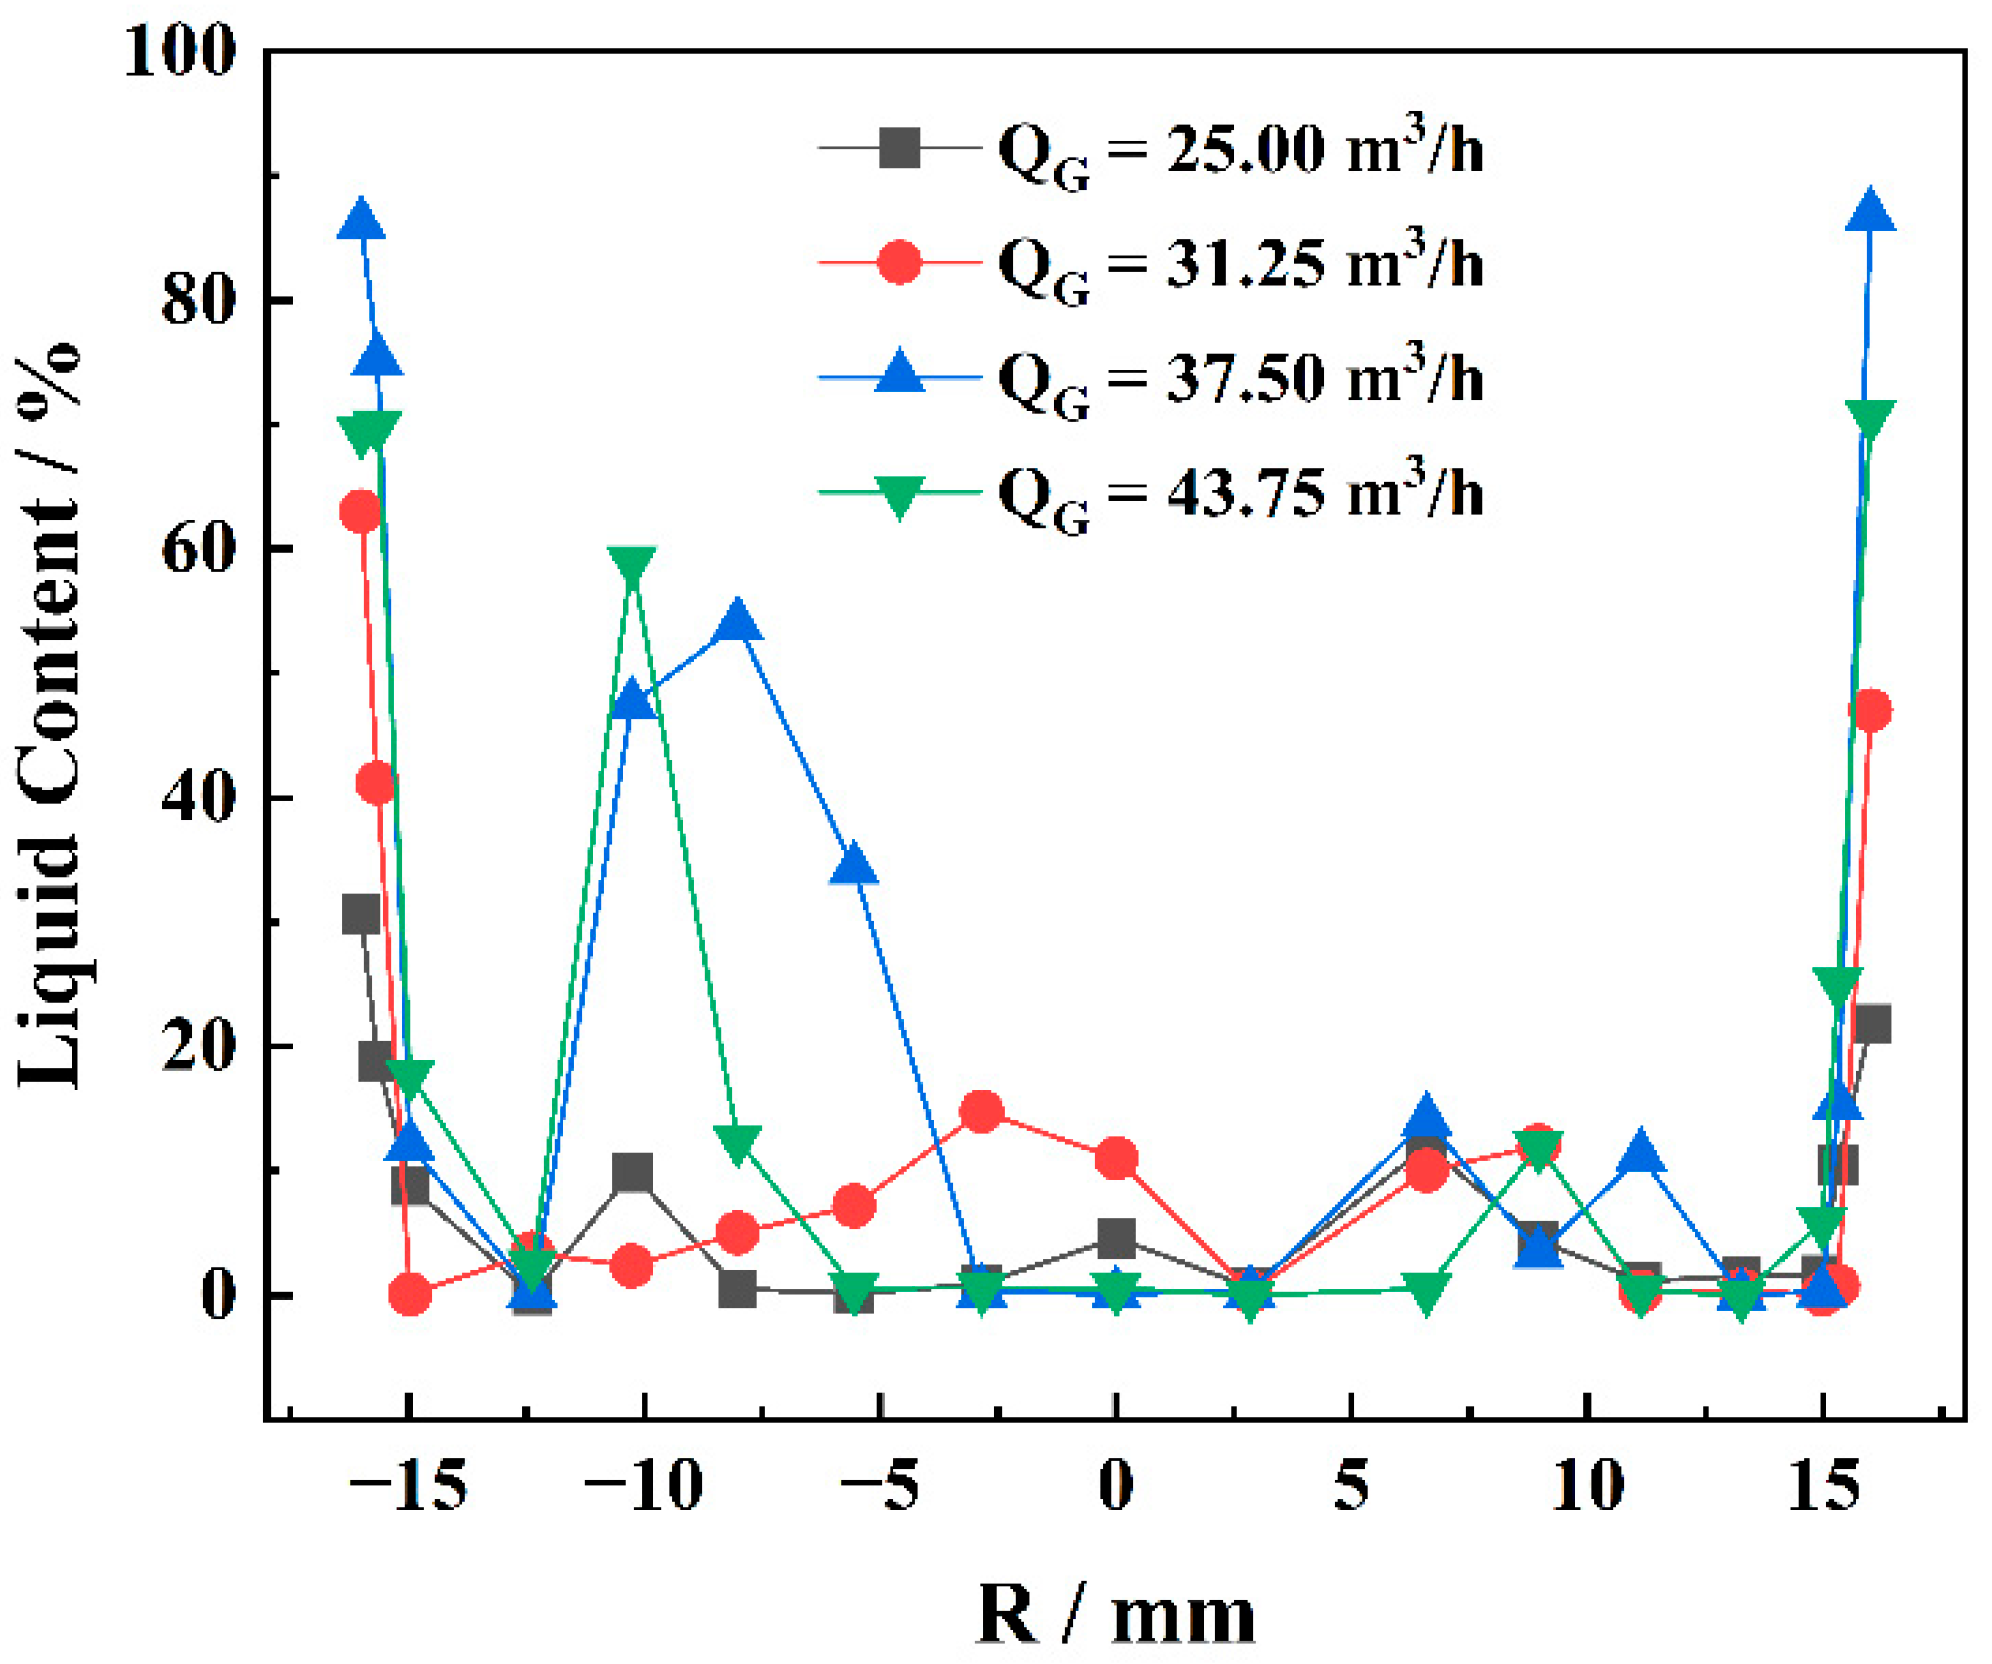
The change trend of phase content inside the overflow pipe located 40 mm below the top of the LGC for different QG is shown in Figure 17. The liquid content exhibited pronounced peaks near the inner wall of the overflow pipe, whereas the core region remained comparatively low. This was consistent with the experimentally observed wall-film entrainment, indicating that a large portion of the liquid phase persisted as a wall-attached film or near-wall liquid fragments. As QG increased, the overall liquid content in the overflow pipe region increased first from 25.00 to 37.50 m3/h and then decreased at 43.75 m3/h, mirroring the non-monotonic entrainment trend measured at the outlet.
The gas–liquid two-phase distributions of the GLAS are investigated under varying QL (1.95, 2.60, 4.55, and 6.50 L/min) when QG is kept at 37.50 m3/h, as shown in Figure 18. When QL = 1.95 L/min, the liquid jet velocity was relatively low, causing a portion of the jet to be deflected by the strong swirling flow and adhered to the inner wall of the cylindrical section, forming a liquid film that flowed downward along the wall. This hindered the mixing between liquid and the gas phase, resulting in minimal liquid entrainment through the overflow pipe. As the QL increased to 2.60 L/min, the jet velocity improved, reducing the fraction of liquid attaching to the inner wall of the cylindrical section. The jet exhibited deflection and partial atomization, with a portion of the liquid breaking into droplets and liquid fragments in the jet atomization zone, thereby increasing the entrainment rate. At QL = 4.55 L/min, further increases in QL intensified jet breakup and liquid entrainment. However, when the QL reached 6.50 L/min, the jet became more stable due to the high injection velocity, resulting in a straight liquid column directly impinging on the overflow pipe wall. A portion of the liquid again formed a film descending along the wall, leading to a decrease in entrained liquid volume. Overall, the entrainment trends indicated by the density distribution aligned well with the experimental observations as QL varied.
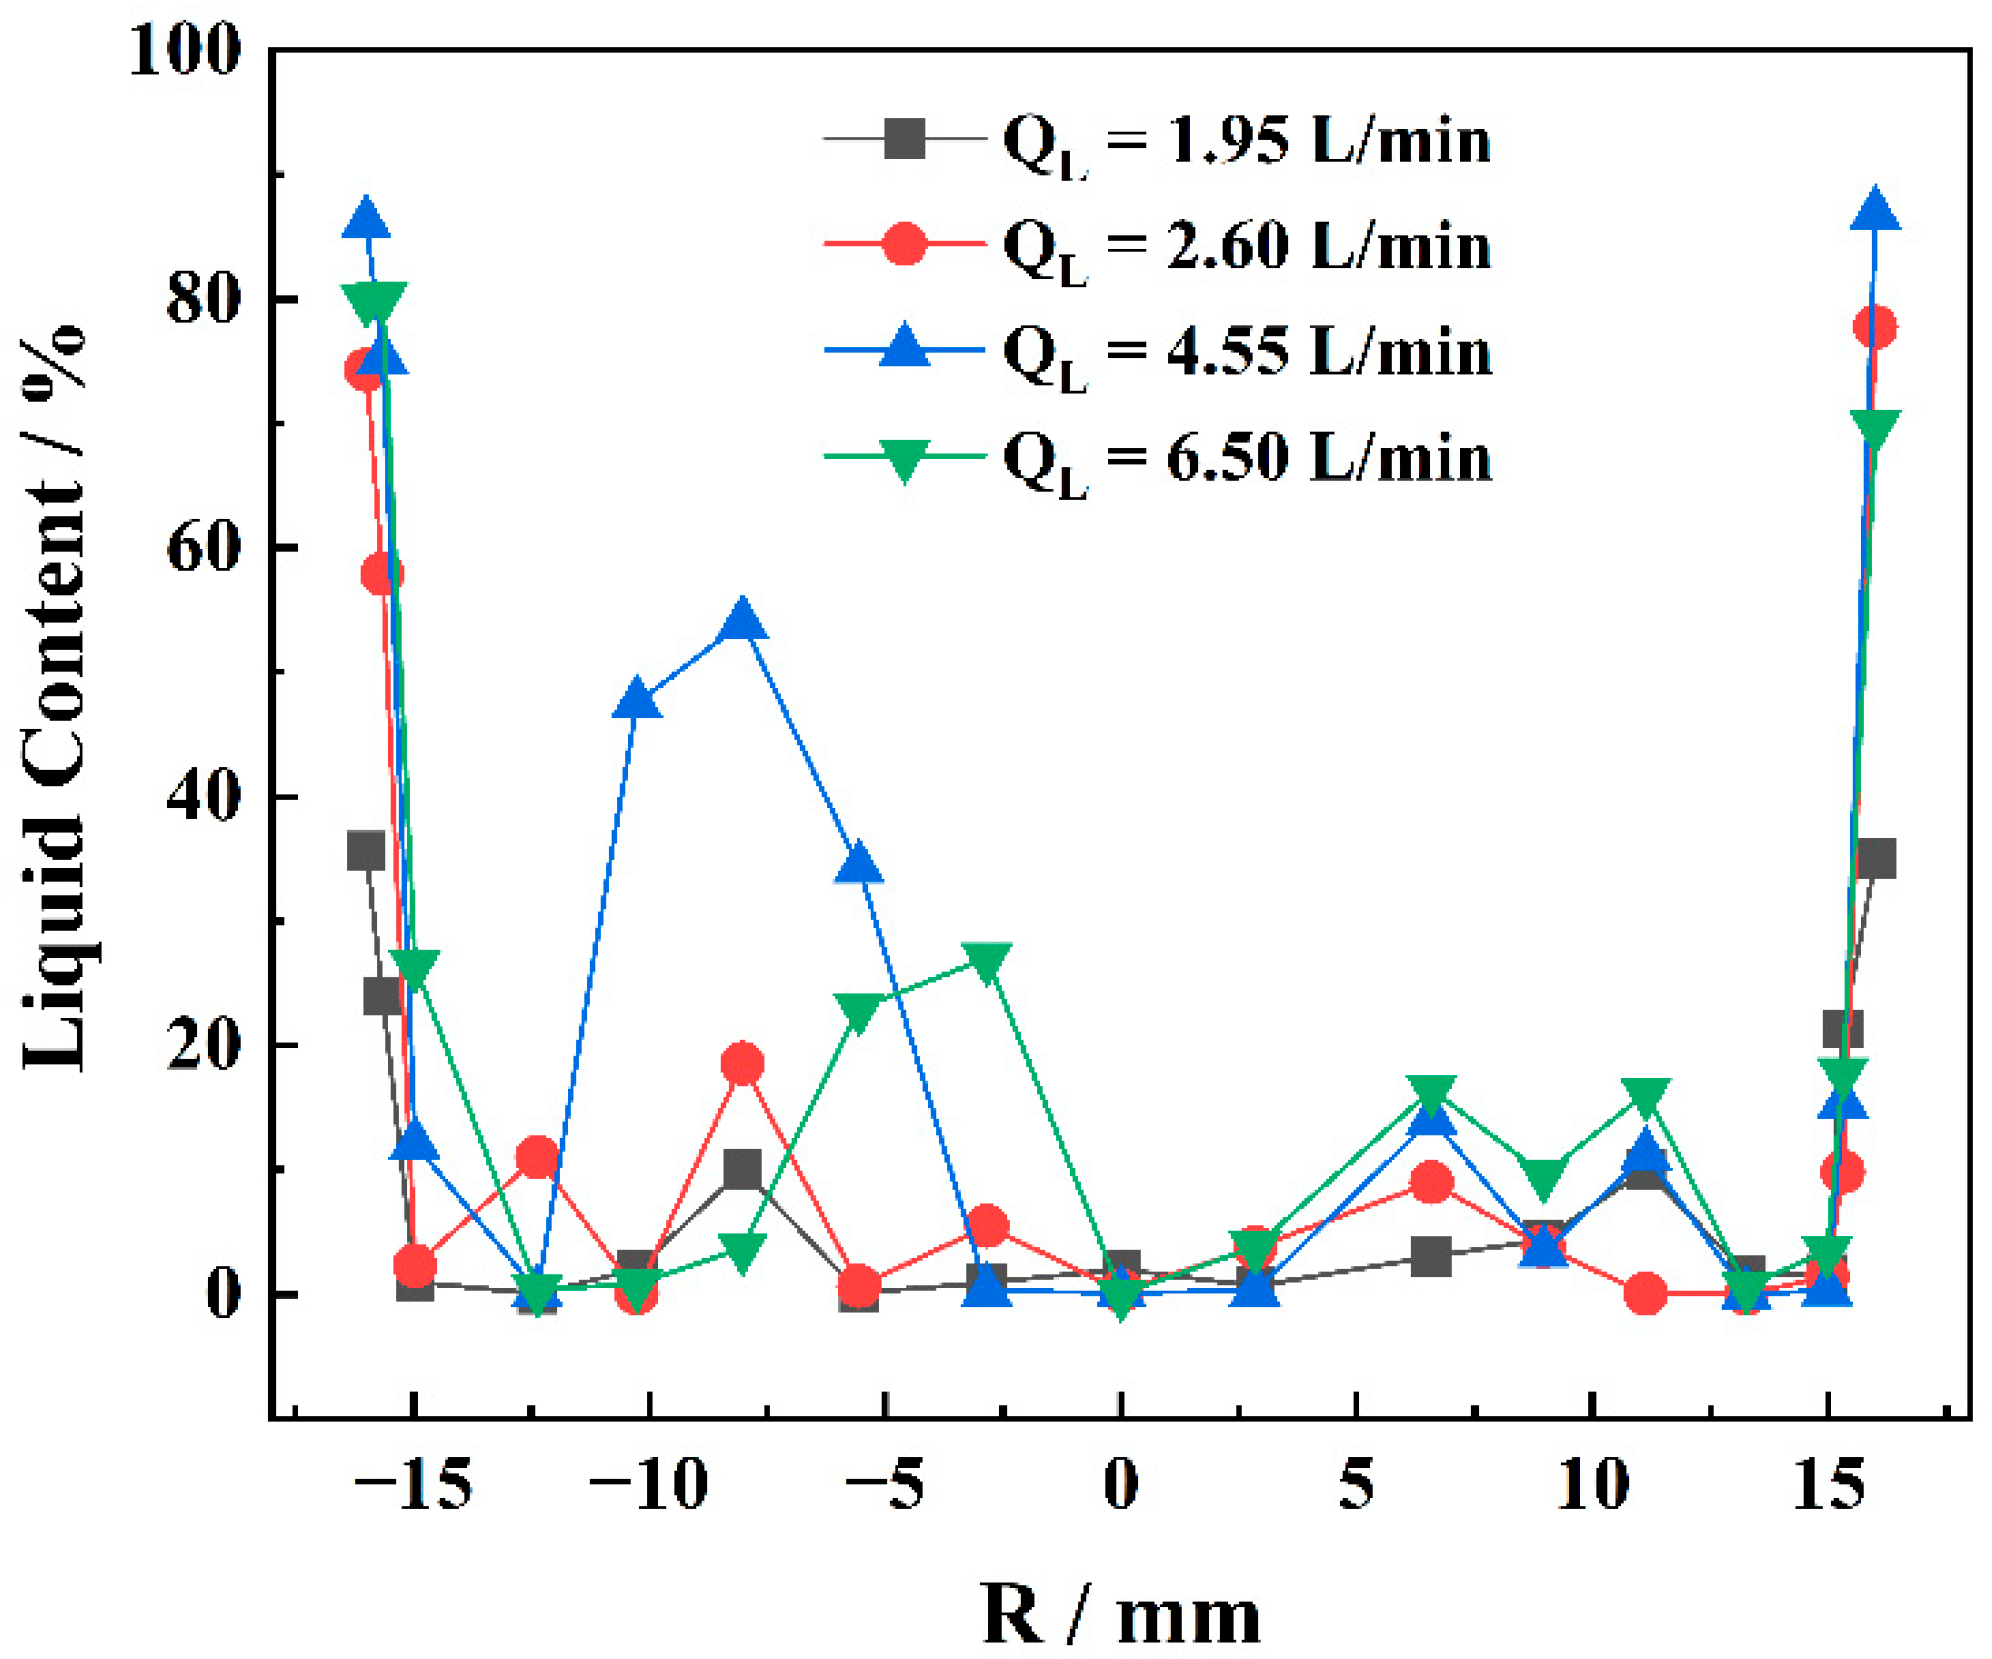
The change trend of phase content inside the overflow pipe located 40 mm below the top of the LGC for different QL is shown in Figure 19. In all cases, the liquid content was markedly elevated near the inner wall of the overflow pipe, whereas the central region remained relatively low. This was consistent with the experimentally observed wall-film entrainment, indicating that a substantial fraction of the liquid was transported upward as a near-wall film. As QL increased, the overall liquid presence in the overflow pipe region showed a non-monotonic response, first increasing and then decreasing, suggesting that the entrainment intensified at intermediate liquid loading but was partially suppressed at the highest liquid flow rate.
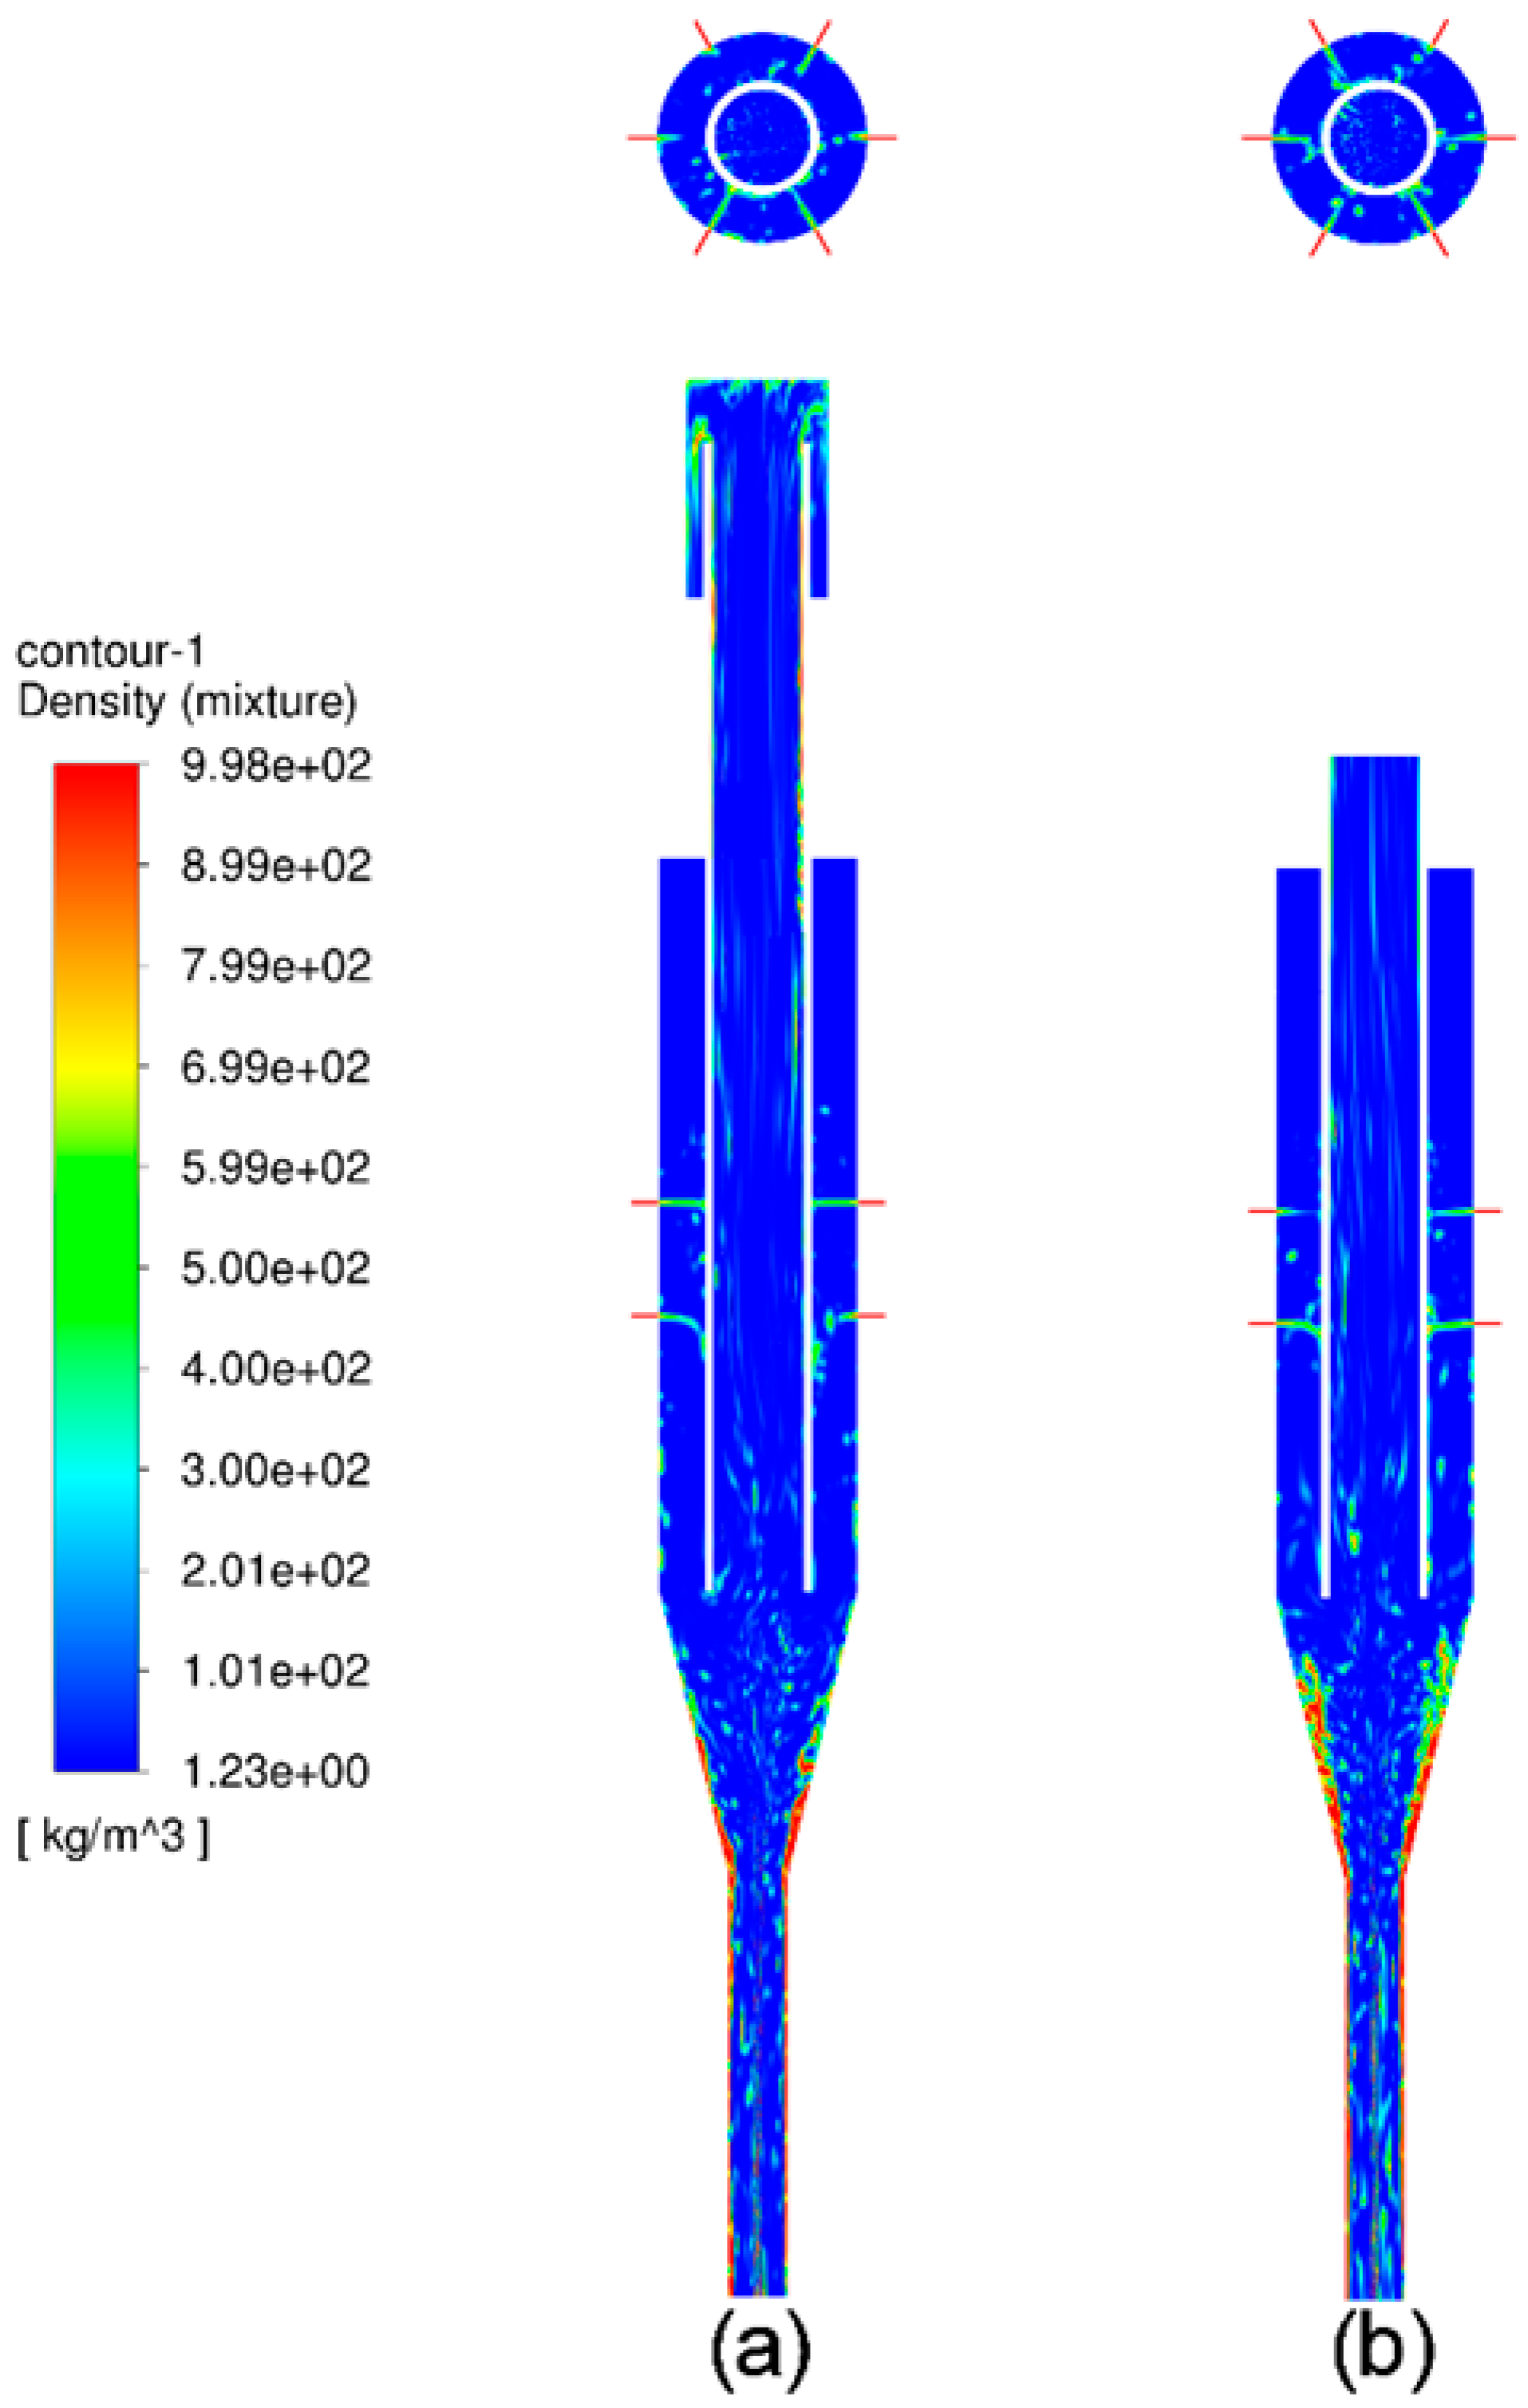
The gas–liquid two-phase distributions of the GLAS, with and without LGC, are compared at a constant QG of 37.50 m3/h and QL of 4.55 L/min, as shown in Figure 20. As for the GLAS installed with an LGC, the droplets, liquid fragments, and liquid film within the overflow pipe moved upward and collided with the top surface of the LGC, in which some fell back along the axis under the influence of gravity, so that a portion of the entrained liquid was separated by inertial impaction (Figure 20a). In contrast, entrained liquid could be observed exiting the overflow pipe and escaping when there was no LGC (Figure 20b). This result was consistent with the trend observed in Figure 9, confirming that the LGC could reduce the liquid entrainment efficiently.
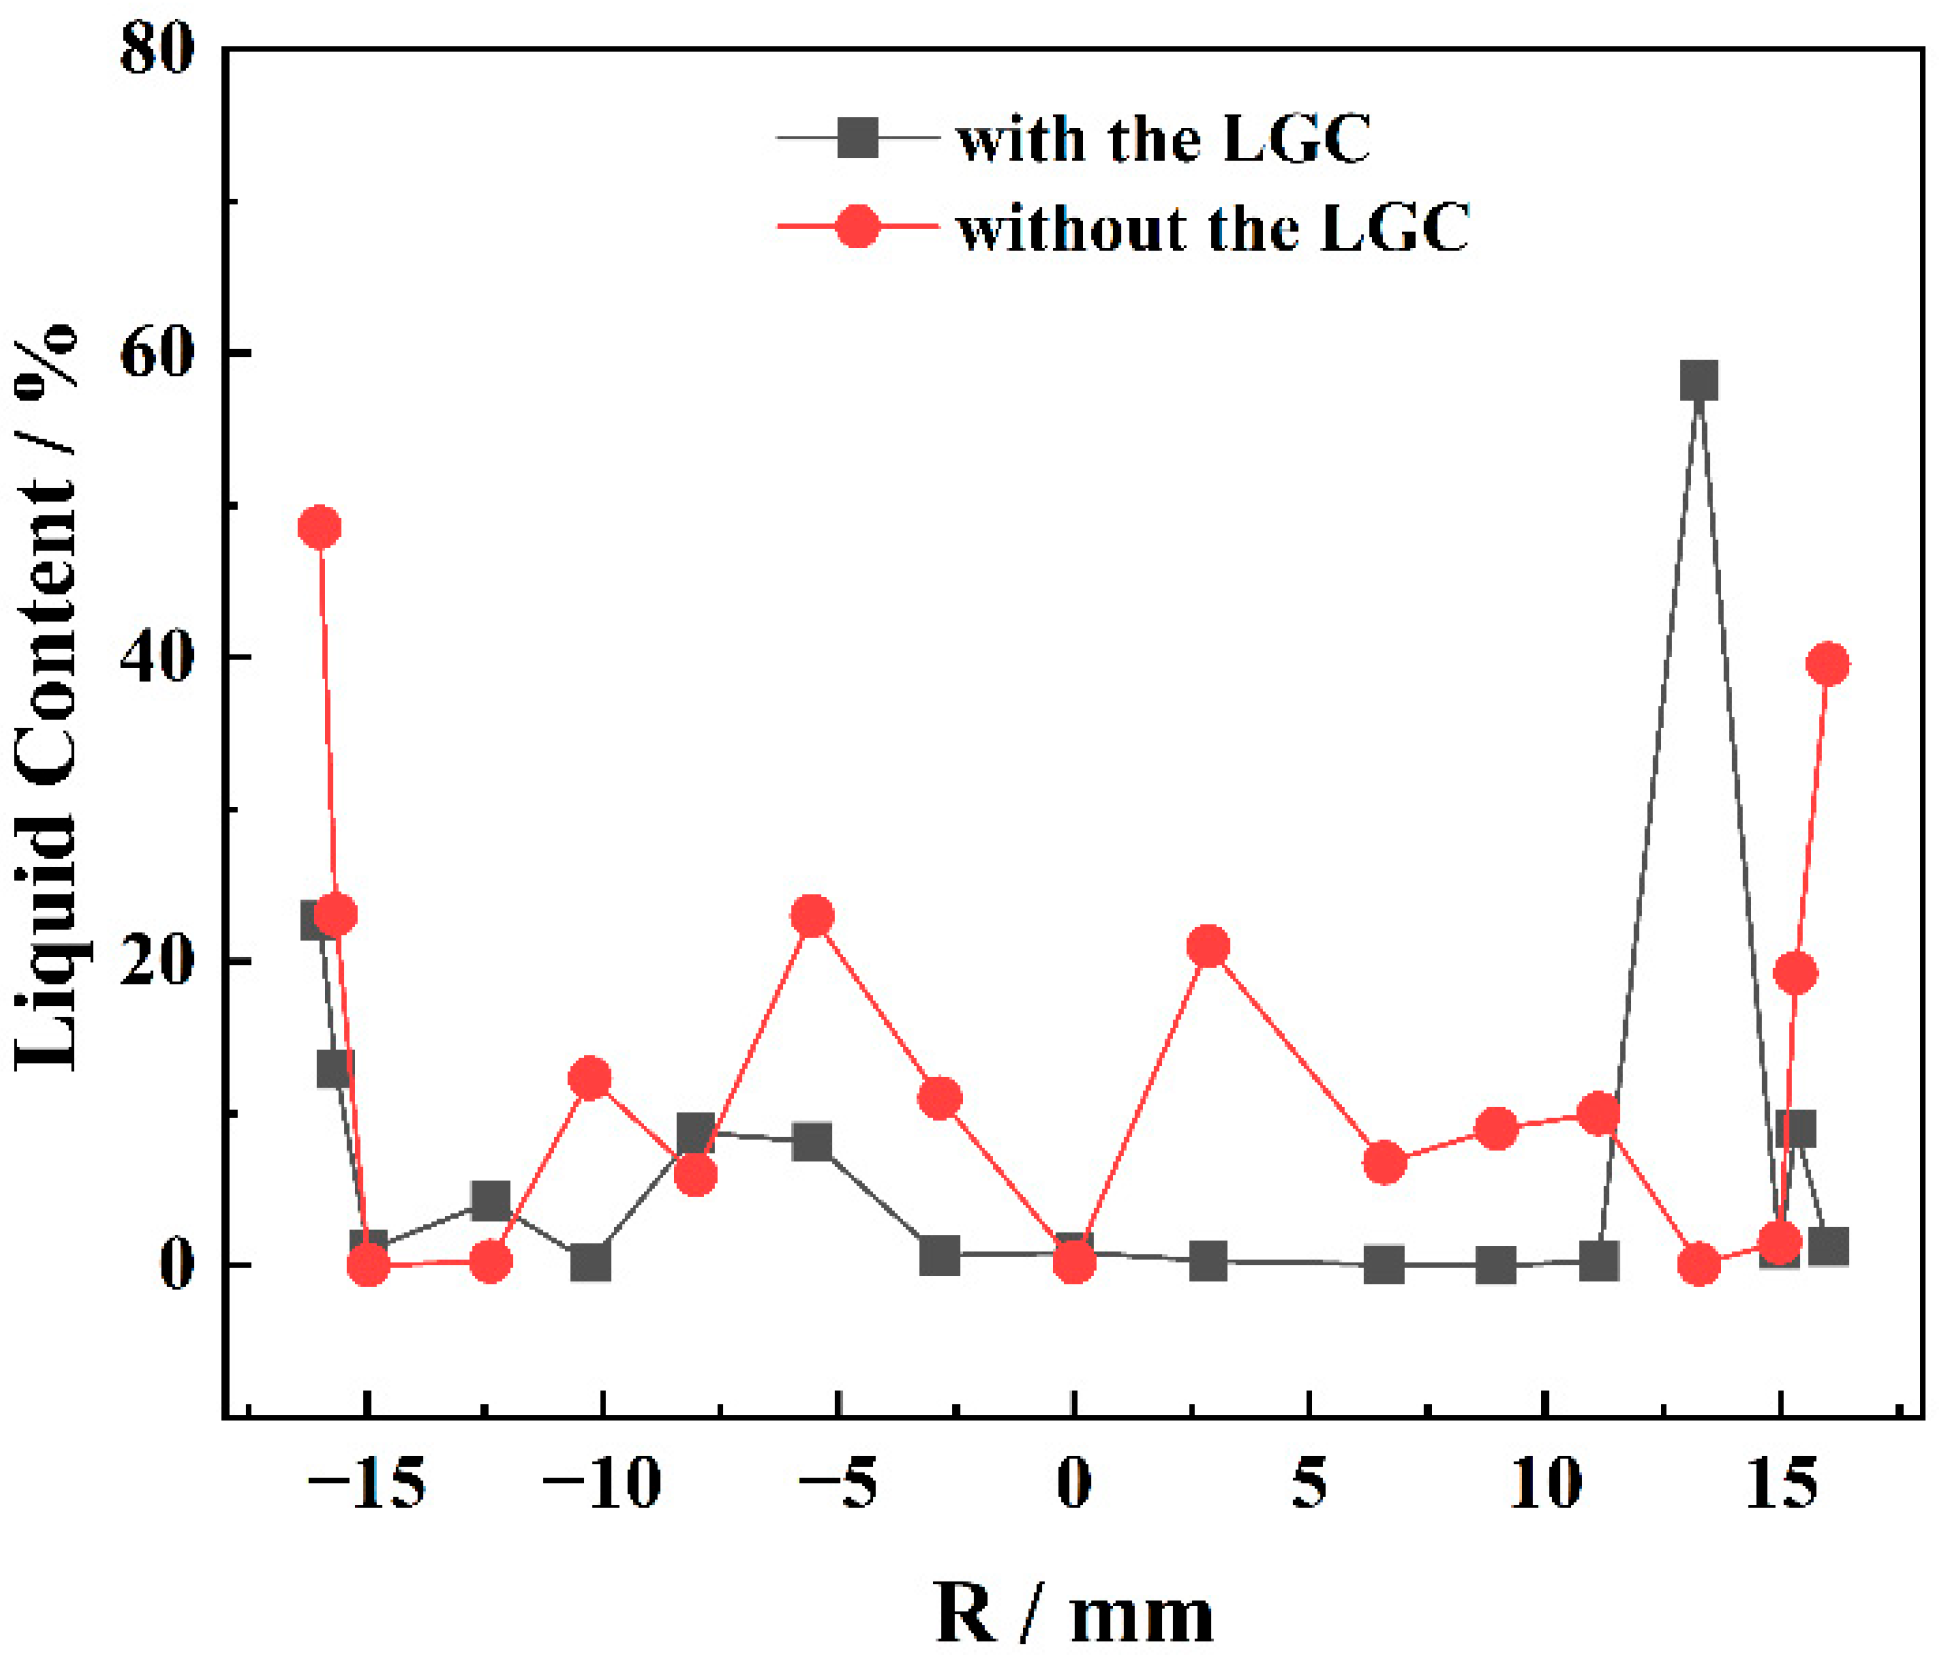
The change trend of phase content inside the overflow pipe located 210 mm above the inlet of the overflow pipe with and without the LGC is shown in Figure 21. In both configurations, the liquid content rose sharply near the inner wall of the overflow pipe, indicating that the liquid phase was preferentially transported in the near-wall region, consistent with wall-film entrainment. Notably, introducing the LGC reduced the overall liquid entrainment level, implying a lower liquid entrainment compared with the case without the LGC, even though localized near-wall peaks could still occur.
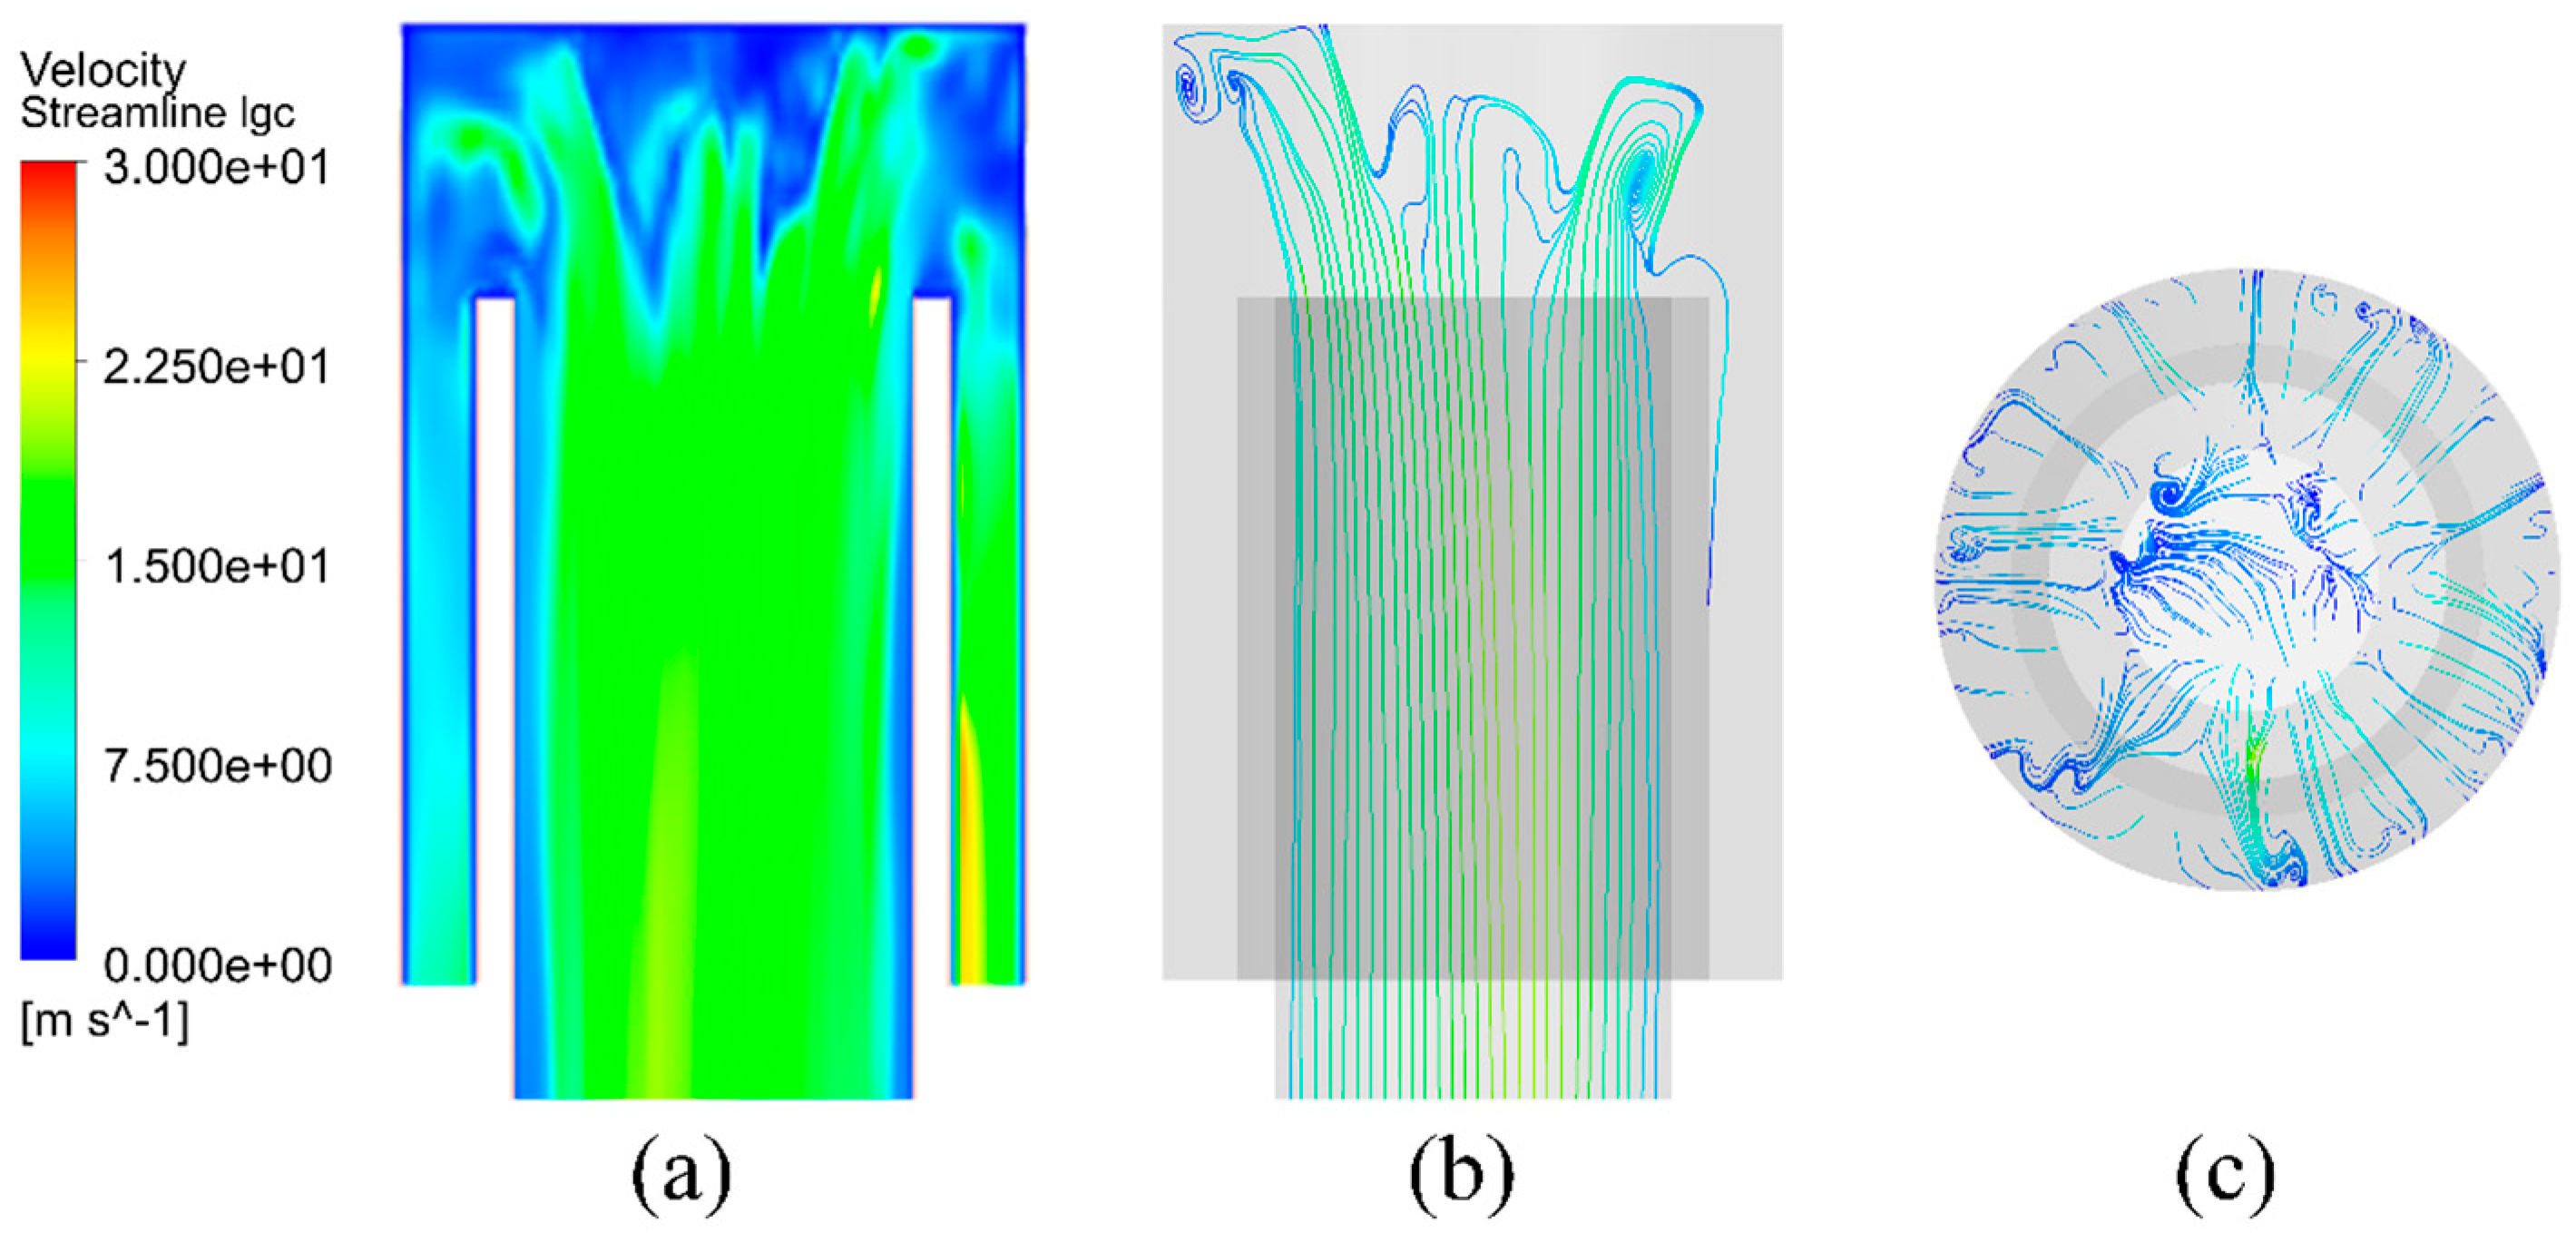
To elucidate the internal separation mechanism of the LGC, the gas–liquid mixture velocity distribution and streamline trajectories are analyzed, as shown in Figure 22. Figure 22a depicts the velocity magnitude contour of the LGC. A high-velocity jet atomization zone was evident within the overflow pipe, in contrast to a distinct low-velocity stagnation zone beneath the LGC top cap. This velocity profile corroborates the formation of the ‘stagnation layer’ postulated in the separation mechanism.
The 2D streamlines in Figure 22b visualize the inertial impaction process. The gas–liquid flow underwent an abrupt 90° turn beneath the top cap, flowing downward into the annular gap. Attributable to their higher inertia, the liquid failed to follow this sharp fluid streamline curvature and impinged upon the wall, thereby achieving separation. Furthermore, the top-view streamlines (Figure 22c) reveal a strong swirling flow field within the LGC. This indicated that, in addition to inertial impaction, the centrifugal force generated by the swirling flow drove liquid toward the sidewall for capture. These simulation results provide hydrodynamic evidence supporting the multi-stage separation mechanism proposed in this study.

4.6. Experimental–Numerical Comparison and Discussion

The experiments and CFD simulations were used in a complementary manner in this work. The experiments provided quantitative benchmarks for key performance metrics, while the simulations provided flow-field details that were difficult to measure directly and supported mechanism interpretation. As shown in Figure 13a,b, the RSM-VOF model predicted the pressure drop with good agreement for both cases with and without the LGC, with deviations within ±15% over the investigated QG range. More importantly, Figure 13c,d presented a direct quantitative comparison of the liquid entrainment rate at S/H1 = 1 and QL = 4.55 L/min. The predicted entrainment rates were within ±20% of the experimental values and reproduced the non-monotonic trend, indicating that the present CFD framework was capable of capturing the entrainment tendency under representative operating conditions.
Beyond output validation, the CFD results were used to interpret the experimentally observed trends. The pressure field and tangential velocity distributions showed that increasing QG strengthened the swirling flow and the associated pressure gradients in the overflow region, intensifying interfacial shear and disturbances in the jet atomization zone. Consistent with this, the two-phase fields indicated that the breakup point shifted closer to the jet hole and that more liquid fragments and droplets were transported toward the overflow pipe from low to intermediate QG, explaining the experimentally observed increase in entrainment. At the highest QG, the further enhancement of swirl implied stronger centrifugal action, which promoted liquid migration toward the wall and drainage. This reduced the liquid availability in this region that could be carried upward through the overflow pipe.
As shown in Figure 17 and Figure 19, the liquid content exhibited pronounced near-wall enrichment, which was consistent with the experimentally observed upward wall-film behavior along the overflow pipe inner surface. Moreover, the overall liquid level varied non-monotonically with QG and QL, mirroring the measured entrainment trends at the outlet. The effect of the LGC was also consistent between experiments and simulations. The density distributions indicated that the LGC intercepted and redirected the gas–liquid flow, while Figure 21 showed a lower overall liquid level inside the overflow pipe when the LGC was installed, in line with the experimentally measured entrainment reduction. The velocity and streamline results further explained this mitigation by revealing a low-velocity stagnation region and flow redirection beneath the LGC top cap, which enhanced inertial impaction and promoted liquid capture and drainage.
Overall, the experiments and simulations formed a closed loop. Experiments validated the key outputs, and CFD provided internally consistent flow field evidence to interpret the entrainment pathways and the mitigation mechanism of the LGC.

5. Conclusions

This study systematically investigated liquid entrainment in the GLAS through both experimental and numerical approaches, considering variations in QG, QL, the insertion depth of the overflow pipe, and whether to install an LGC. The results showed that increasing QG enhances turbulent shear and centrifugal forces, promoting earlier jet breakup. However, beyond a critical threshold, further increases in QG instead reduce liquid entrainment. Elevated QL initially increases entrainment via enhanced jet momentum. However, the stability of liquid jets improves when the QL is high enough, resulting in reduced dispersion and lower entrainment. Installing an LGC at the overflow pipe outlet serves as an effective control strategy. It physically blocks liquid escape upward, facilitates inertial impaction, and redirects flow toward the axial outlet, reducing liquid entrainment by up to 23.9% while maintaining the difference value of pressure drop of less than 302 Pa. The simulations further investigated the gas–liquid two-phase distributions in GLAS under various operating conditions, and agreed well with the experimental observations. These findings indicate that the LGC features a simple structure and effectively mitigates liquid entrainment within the GLAS with a minimal extra energy penalty. However, droplet size distributions were not measured in the present experiments. VOF is used to analyze macroscopic interface evolution and liquid entrainment pathways, but droplet size statistics are beyond the scope of the present simulations. Future work will include calibrated droplet size measurements using high-speed imaging near the overflow inlet and gas outlet. These data will be used to further verify entrainment mechanisms.

Supplementary Materials

The following supporting information can be downloaded at: https://www.mdpi.com/article/10.3390/pr14060929/s1, Figure S1: Liquid jet in GLAS at different gas flow rate conditions when QL is 2.60 L/min, (a) 25.00 m3/h, (b) 31.25 m3/h, (c) 37.50 m3/h, (d) 43.75 m3/h; Figure S2: Upward wall-film behavior in the overflow pipe; Figure S3: Influence of different grid numbers on tangential velocity distribution: (a) S/H1 = 1.0, without the LGC, (b) S/H1 = 1.0, with the LGC.

Author Contributions

Methodology, X.D., L.M.; software, Y.S., L.M.; validation, A.L., Y.S.; formal analysis, Y.S., L.M.; investigation, Z.Z., J.W.; resources, L.M.; data curation, Y.S.; writing—original draft preparation, Y.S.; writing—review and editing, L.M.; visualization, Y.Z.; supervision, A.L.; project administration, Y.Z.; funding acquisition, A.L. All authors have read and agreed to the published version of the manuscript.

Funding

This work was funded by the National Natural Science Foundation of China (42507148, 52300136), China Postdoctoral Science Foundation (2025M771249). The APC for this publication was paid by the authors from their own resources.

Data Availability Statement

The original contributions presented in this study are included in the article. Further inquiries can be directed to the corresponding author.

Acknowledgments

We acknowledge the support of Sichuan University for providing experimental site required for this work.

Conflicts of Interest

The authors declare that they have no known competing financial interests or personal relationships that could have appeared to influence the work reported in this paper.

Abbreviations

The following abbreviations are used in this manuscript:
GLASGas cyclone–liquid jet absorption separator
QGGas flow rate
QLAbsorbent flow rate
LGCLiquid-guiding cover
GLCCGas–liquid cylindrical cyclone
FGDFlue gas desulfurization
ΔPPressure drop
RSMReynolds Stress Model
DPMDiscrete Phase Model
LESLarge Eddy Simulation
VOFVolume of Fluid
CSFContinuum Surface Force

References

  1. Chen, W.; Hong, J.; Xu, C. Pollutants generated by cement production in China, their impacts, and the potential for environmental improvement. J. Clean. Prod. 2015, 103, 61–69. [Google Scholar] [CrossRef]
  2. Castro, R.d.P.V.d.; de Medeiros, J.L.; Araújo, O.d.Q.F.; Cruz, M.d.A.; Ribeiro, G.T.; de Oliveira, V.R. Fluidized bed treatment of residues of semi-dry flue gas desulfurization units of coal-fired power plants for conversion of sulfites to sulfates. Energy Convers. Manag. 2017, 143, 173–187. [Google Scholar] [CrossRef]
  3. Xing, G.; Li, S.; Wang, Y.; Zhang, Y.; Wang, W.; Wang, W.; Qi, L. From laboratory to industry: Preparation and mechanism analysis of organic additive-modified high-activity calcium hydroxide desulfurizer in low-temperature dry desulfurization. Sep. Purif. Technol. 2025, 370, 133262. [Google Scholar] [CrossRef]
  4. Kampa, M.; Castanas, E. Human health effects of air pollution. Environ. Pollut. 2008, 151, 362–367. [Google Scholar] [CrossRef]
  5. Zhong, Q.; Shen, H.; Yun, X.; Chen, Y.; Ren, Y.; Xu, H.; Shen, G.; Du, W.; Meng, J.; Li, W.; et al. Global sulfur dioxide emissions and the driving forces. Environ. Sci. Technol. 2020, 54, 6508–6517. [Google Scholar] [CrossRef]
  6. Shang, Y.; Sun, Z.; Cao, J.; Wang, X.; Zhong, L.; Bi, X.; Li, H.; Liu, W.; Zhu, T.; Huang, W. Systematic review of Chinese studies of short-term exposure to air pollution and daily mortality. Environ. Int. 2013, 54, 100–111. [Google Scholar] [CrossRef]
  7. Ding, X.; Li, Q.; Wu, D.; Liang, Y.; Xu, X.; Xie, G.; Wei, Y.; Sun, H.; Zhu, C.; Fu, H.; et al. Unexpectedly increased particle emissions from the steel industry determined by wet/semidry/dry flue gas desulfurization technologies. Environ. Sci. Technol. 2019, 53, 10361–10370. [Google Scholar] [CrossRef] [PubMed]
  8. Cordoba, P. Status of flue gas desulphurisation (FGD) systems from coal-fired power plants: Overview of the physic-chemical control processes of wet limestone FGDs. Fuel 2015, 144, 274–286. [Google Scholar] [CrossRef]
  9. Li, X.; Han, J.; Liu, Y.; Dou, Z.; Zhang, T.-A. Summary of research progress on industrial flue gas desulfurization technology. Sep. Purif. Technol. 2022, 281, 119849. [Google Scholar] [CrossRef]
  10. Ning, H.; Tang, R.; Li, C.; Gu, X.; Gong, Z.; Zhu, C.; Li, J.; Wang, K.; Yu, J. Recent advances in process and materials for dry desulfurization of industrial flue gas: An overview. Sep. Purif. Technol. 2025, 353, 128425. [Google Scholar] [CrossRef]
  11. Belka, M.; Cejpek, O.; Lizal, F.; Maly, M.; Jedelsky, J. Numerical modeling of CO2 capture in a spray tower with aqueous ammonia and full-cone atomizers. Int. J. Multiph. Flow 2025, 193, 105405. [Google Scholar] [CrossRef]
  12. Kumar, L.; Jana, S.K. Advances in absorbents and techniques used in wet and dry FGD: A critical review. Rev. Chem. Eng. 2022, 38, 843–880. [Google Scholar] [CrossRef]
  13. Rahimi, A.; Taheri, M.; Fathikalajahi, J. Prediction of pressure drop in a Venturi scrubber: Effect of liquid film and re-entrainment. Chem. Eng. Commun. 2004, 191, 315–334. [Google Scholar] [CrossRef]
  14. Cejpek, O.; Maly, M.; Prinz, F.; Hajek, O.; Belka, M.; Lindovsky, J.; Hajek, J.; Novosad, P.; Jedelsky, J. Pressure loss and droplet entrainment under spray absorber conditions. Sep. Purif. Technol. 2025, 354, 129339. [Google Scholar] [CrossRef]
  15. Kister, H.Z.; Jacobs, G.; Kister, A.A. Gas entrainment by liquid jets and cascades can unsettle towers. Chem. Eng. Res. Des. 2023, 191, 313–318. [Google Scholar] [CrossRef]
  16. Ananthanarayanan, N.V.; Viswanathan, S. Effect of nozzle arrangement on venturi scrubber performance. Ind. Eng. Chem. Res. 1999, 38, 4889–4900. [Google Scholar] [CrossRef]
  17. Quan, X.; Ye, C.; Xiong, Y.; Xiang, J.; Wang, F. Simultaneous removal of ammonia, P and COD from anaerobically digested piggery wastewater using an integrated process of chemical precipitation and air stripping. J. Hazard. Mater. 2010, 178, 326–332. [Google Scholar] [CrossRef]
  18. Liu, A.; Wang, L.; Wu, J.; Xiao, L.; Jiang, X.; Wang, L.; Ma, L.; Wang, H. Simultaneous removal of SO2 and NO from the flue gas of marine ships with a gas cyclone–liquid jet absorption separator. Ind. Eng. Chem. Res. 2022, 61, 10233–10242. [Google Scholar] [CrossRef]
  19. Lu, H.; Wang, H.; Liu, Y.; Wang, M.; Hu, J.; Yang, Q. Substance transfer behavior controlled by droplet internal circulation. Chem. Eng. J. 2020, 393, 124657–124664. [Google Scholar] [CrossRef]
  20. Wang, Y.-A.; Chen, J.-Y.; Yue, T.; Yang, Y.; Han, M.-S.; Yan, C.-Y. Measurement of thickness and analysis on flow characteristics of upper swirling liquid film in gas-liquid cylindrical cyclone. Exp. Therm. Fluid Sci. 2021, 123, 110331. [Google Scholar] [CrossRef]
  21. Xie, X.; Wang, Y.; Wang, J.; Li, Y.; Wang, J.; Zhou, Y.; Pan, Y.; Guo, L. Investigation on the formation mechanism and flow characteristics of liquid carry-over in gas–liquid cyclone separator. Phys. Fluids 2023, 35, 123317. [Google Scholar] [CrossRef]
  22. Kim, K.; Kim, W.-S.; Lee, J.-B. An experimental performance evaluation for a swirl-vane separator using an air-water test facility. Energies 2021, 14, 7072. [Google Scholar] [CrossRef]
  23. Berrio, J.C.; Pereyra, E.; Ratkovich, N. Computational fluid dynamics modeling of gas–liquid cylindrical cyclones, geometrical analysis. J. Energy Resour. Technol. 2018, 140, 092003. [Google Scholar] [CrossRef]
  24. Luo, X.; Ren, J.; Chen, T.; Wang, Y.; Lü, Y.; He, L. Influence of slug flow on flow fields in a gas–liquid cylindrical cyclone separator: A simulation study. Chin. J. Chem. Eng. 2020, 28, 2075–2083. [Google Scholar] [CrossRef]
  25. Wang, L.; Yang, Z.; Ma, L.; Peng, C.; Chen, E.; Li, Y.; Wang, H. Treatment of CS2 in waste gas from rubber refining by gas cyclone-liquid jet separator. Sep. Purif. Technol. 2021, 276, 119324–119339. [Google Scholar] [CrossRef]
  26. Quan, X.; Wang, F.; Zhao, Q.; Zhao, T.; Xiang, J. Air stripping of ammonia in a water-sparged aerocyclone reactor. J. Hazard. Mater. 2009, 170, 983–988. [Google Scholar] [CrossRef] [PubMed]
  27. Ma, L.; Duan, X.; Wu, J.; Li, J.; Peng, L.; Wang, L.; Xiao, L. Simultaneous desulfurization and denitrification of flue gas enabled by hydrojet cyclone. J. Clean. Prod. 2022, 377, 134205–134214. [Google Scholar] [CrossRef]
  28. Duan, X.; Wang, L.; Wu, J.; Liu, A.; Xiao, L.; Ma, L. Research on carbon dioxide capture and mass transfer in hydro-jet cyclone. Sep. Purif. Technol. 2024, 330, 125394–125408. [Google Scholar] [CrossRef]
  29. Ma, L.; Zhao, Z.-H.; Peng, L.; Yang, X.-J.; Fu, P.-B.; Liu, Y.; Huang, Y. Application of gas cyclone-liquid jet absorption separator for purification of tail gas containing ammonia. Environ. Technol. 2019, 40, 3392–3402. [Google Scholar] [CrossRef]
  30. Ma, L.; Peng, L.; Zhang, Z.; Tian, C. Influence of overflow port selection on the gas desulfurization of gas cyclone–liquid jet absorption separator. Asia-Pac. J. Chem. Eng. 2020, 15, e2462. [Google Scholar] [CrossRef]
  31. Wang, C.; Liu, M.; Liu, H.; Yang, Q.; Zhou, C.-A.; Song, L.; Ma, K.; Yue, H. Numerical analysis of CO2 absorption characteristics in industrial flue gas mineralization spray tower reactor. Sep. Purif. Technol. 2025, 354, 129051. [Google Scholar] [CrossRef]
  32. Yang, J.; Liu, C.; Li, S.; Sun, B.; Xiao, J.; Jin, Y. A new pressure drop model of gas–liquid cyclone with innovative operation mode. Chem. Eng. Process. Process Intensif. 2015, 95, 256–266. [Google Scholar] [CrossRef]
  33. Duan, X.; Cong, C.; Wang, L.; Liu, Y.; Zhao, Z.; Wu, J.; Ma, L. Spontaneous supergravity field drives liquid-phase microelements to enhance CO2 capture through self revolution coupling. Sep. Purif. Technol. 2025, 360, 131058. [Google Scholar] [CrossRef]
  34. Malgarinos, I.; Nikolopoulos, N.; Marengo, M.; Antonini, C.; Gavaises, M. VOF simulations of the contact angle dynamics during the drop spreading: Standard models and a new wetting force model. Adv. Colloid Interface Sci. 2014, 212, 1–20. [Google Scholar] [CrossRef]
  35. Wang, L.; Liu, W.; Yang, P.; Chang, Y.; Duan, X.; Xiao, L.; Hu, Y.; Wu, J.; Ma, L.; Wang, H. Study on effective phase interfacial area at different injection angles of hydro-jet cyclone. Chem. Eng. Sci. 2024, 284, 119336. [Google Scholar] [CrossRef]
  36. Yang, L.; Zhang, J.; Ma, Y.; Xu, J.; Wang, J. Experimental and numerical study of separation characteristics in gas-liquid cylindrical cyclone. Chem. Eng. Sci. 2020, 214, 115362. [Google Scholar] [CrossRef]
  37. Alahmadi, Y.H.; Nowakowski, A.F. Modified shear stress transport model with curvature correction for the prediction of swirling flow in a cyclone separator. Chem. Eng. Sci. 2016, 147, 150–165. [Google Scholar] [CrossRef]
  38. Lackmann, T.; Kerstein, A.R.; Oevermann, M. A representative linear eddy model for simulating spray combustion in engines (RILEM). Combust. Flame 2018, 193, 1–15. [Google Scholar] [CrossRef]
  39. Bianco, V.; Khait, A.; Noskov, A.; Alekhin, V. A comparison of the application of RSM and LES turbulence models in the numerical simulation of thermal and flow patterns in a double-circuit Ranque-Hilsch vortex tube. Appl. Therm. Eng. 2016, 106, 1244–1256. [Google Scholar] [CrossRef]
  40. Cui, G.; Jacobi, I. Prediction of the phase difference between large-scale velocity and Reynolds stress fluctuations in wall turbulence. J. Fluid Mech. 2023, 969, A13. [Google Scholar] [CrossRef]
  41. Li, H.; Ji, S.; Tan, X.; Li, Z.; Xiang, Y.; Lv, P.; Duan, H. Effect of Reynolds number on drag reduction in turbulent boundary layer flow over liquid–gas interface. Phys. Fluids 2020, 32, 122111. [Google Scholar] [CrossRef]
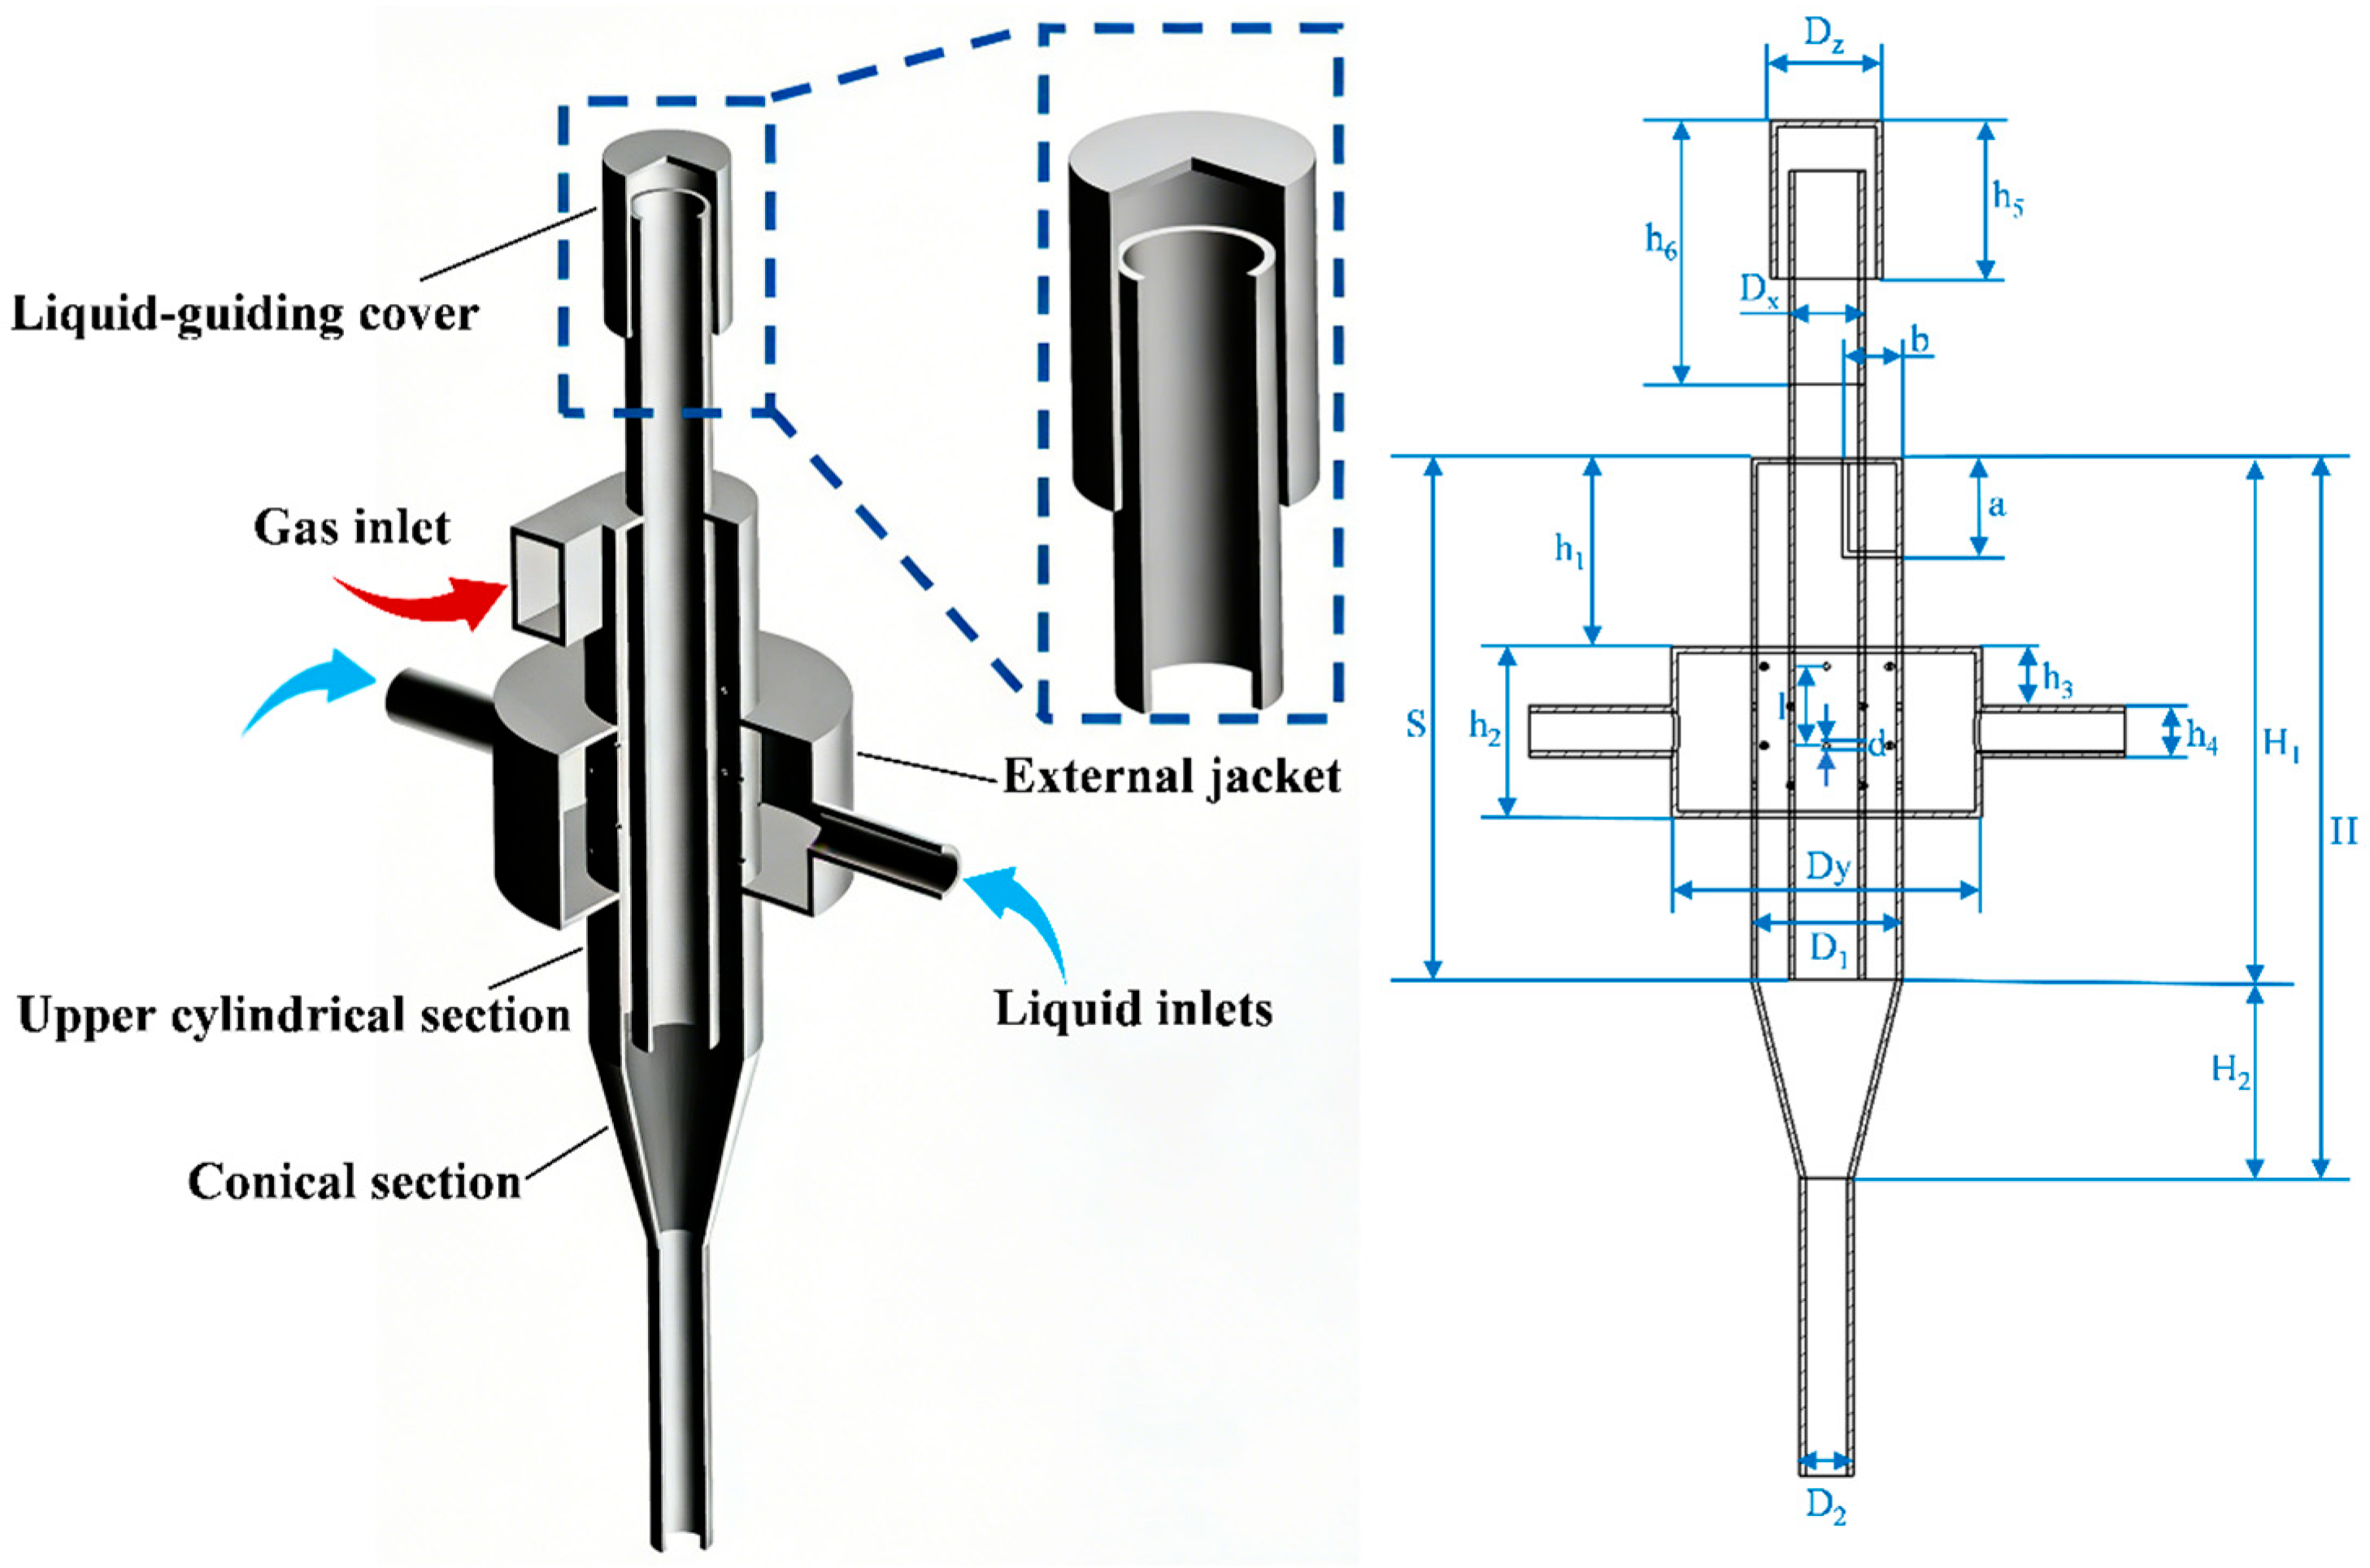
Figure 1. The structure and size of GLAS with an LGC.
Processes 14 00929 g001
Figure 2. The structure of the LGC.
Processes 14 00929 g002
Figure 3. The flowchart and photo of the experiment system.
Processes 14 00929 g003
Figure 4. The change in liquid entrainment rate with QG when installing an LGC: (a) S/H1 = 0.4, (b) S/H1 = 0.6, (c) S/H1 = 0.8, (d) S/H1 = 1.0.
Processes 14 00929 g004
Figure 5. The change in liquid entrainment percentage with QG when installing an LGC: (a) S/H1 = 0.4, (b) S/H1 = 0.6, (c) S/H1 = 0.8, (d) S/H1 = 1.0.
Processes 14 00929 g005
Figure 6. The change in liquid entrainment rate with QL when installing an LGC: (a) S/H1 = 0.4, (b) S/H1 = 0.6, (c) S/H1 = 0.8, (d) S/H1 = 1.0.
Processes 14 00929 g006
Figure 7. The change in liquid entrainment percentage with QL when installing an LGC: (a) S/H1 = 0.4, (b) S/H1 = 0.6, (c) S/H1 = 0.8, (d) S/H1 = 1.0.
Processes 14 00929 g007
Figure 8. The change in liquid entrainment rate with insertion depth at QL = 2.60 L/min when installing an LGC.
Processes 14 00929 g008
Figure 9. The comparison of the liquid entrainment rate for installing and uninstalling the LGC when S/H1 = 1: (a) QG = 25.00 m3/h, (b) QG = 31.25 m3/h, (c) QG = 37.50 m3/h, (d) QG = 43.75 m3/h.
Processes 14 00929 g009
Figure 10. The change in average ΔP and the difference in ΔP with QG.
Processes 14 00929 g010
Figure 11. The correlation coefficient graph of liquid flow rate, insertion depth, gas flow rate, liquid entrainment rate, and pressure drop.
Processes 14 00929 g011
Figure 12. Mesh of GLAS when S/H1 = 1: (a) without the LGC, (b) with the LGC.
Processes 14 00929 g012
Figure 13. Experimental and numerical simulation results of ΔP and liquid entrainment rate under different QG at S/H1 = 1.0 when QL = 4.55 L/min: (a) ΔP with the LGC, (b) ΔP without the LGC, (c) liquid entrainment rate with the LGC, and (d) liquid entrainment rate without the LGC.
Processes 14 00929 g013
Figure 14. Pressure field distributions at different gas flow rate conditions when QL is 4.55 L/min: (a) 25.00 m3/h, (b) 31.25 m3/h, (c) 37.50 m3/h, (d) 43.75 m3/h.
Processes 14 00929 g014
Figure 15. Tangential velocity field at different gas flow rate conditions when QL is 4.55 L/min: (a) 25.00 m3/h, (b) 31.25 m3/h, (c) 37.50 m3/h, (d) 43.75 m3/h.
Processes 14 00929 g015
Figure 16. Gas–liquid two-phase distributions at different gas flow rate conditions when QL is 4.55 L/min: (a) 25.00 m3/h, (b) 31.25 m3/h, (c) 37.50 m3/h, (d) 43.75 m3/h.
Processes 14 00929 g016
Figure 17. The change trend of phase content with R at different gas flow rate conditions when QL is 4.55 L/min.
Processes 14 00929 g017
Figure 18. Gas–liquid two-phase distributions at different liquid flow rate conditions when QG is 37.50 m3/h: (a) 1.95 L/min, (b) 2.60 L/min, (c) 4.55 L/min, (d) 6.50 L/min.
Processes 14 00929 g018
Figure 19. The change trend of phase content with R at different liquid flow rate conditions when QG is 37.50 m3/h.
Processes 14 00929 g019
Figure 20. Gas–liquid two-phase distributions in GLAS when QG is 37.50 m3/h, and QL is 4.55 L/min: (a) with the LGC, (b) without the LGC.
Processes 14 00929 g020
Figure 21. The change trend of phase content with R when QG is 37.50 m3/h, and QL is 4.55 L/min.
Processes 14 00929 g021
Figure 22. Distributions of the velocity field in the LGC when QG is 37.50 m3/h, and QL is 4.55 L/min: (a) velocity magnitude contour, (b) streamline of side view, (c) streamline of top view.
Processes 14 00929 g022
Table 1. Structure Dimensions of the GLAS (mm).
ParameterSize (mm)ParameterSize (mm)
H360D170
H1260D221
H2100Dx32
h195Dy156
h286DZ50
h327S52, 104, 156, 208, 260
h426l40
h580a50
h6130b40
d1.2
Table 2. Information on the Equipment Used in the Experimental System.
EquipmentModelRangeManufacturerAccuracy
Gas flowmeterLZB-10WB0.1–120 m3/sZhejiang Yuyao flowmeter factory, Yuyao, ChinaG 1.25
Liquid flowmeterWL-2510–100 L/minZhejiang Yuyao flowmeter factory, Yuyao, ChinaG 0.25
Liquid flowmeterZS-WL0.1–20 L/minZhejiang Yuyao flowmeter factory, Yuyao, ChinaG 0.25
Circulating water pump40WBZ20-250–20 m3/hTaizhou Kaiba Electromechanical Co., Ltd., Taizhou, China
High-pressure vortex blowerXGB-30000–390 m3/hTaizhou Jingxuan Electromechanical Co., Ltd., Taizhou, China
Gas pressure gaugeYB80A0–10,000 PaChangzhou Shengzhiyuan Instrument Co., Ltd., Changzhou, ChinaG 0.5
Liquid pressure gaugeYB-6Z0–3 MPaShanghai Mingyu Instrument Co., Ltd., Shanghai, ChinaG 0.5
Disclaimer/Publisher’s Note: The statements, opinions and data contained in all publications are solely those of the individual author(s) and contributor(s) and not of MDPI and/or the editor(s). MDPI and/or the editor(s) disclaim responsibility for any injury to people or property resulting from any ideas, methods, instructions or products referred to in the content.