Article

Emerging Spectrophotonic Technologies to Predict the Maturation Time of Swiss-Type Cheese: Dielectric Spectroscopy vs. Portable NIR


1
Grupo de Investigación en Tecnologias Emergentes Fotónicas—GITEF, Instituto de Investigación del Mejoramiento Productivo, Universidad Nacional Autónoma de Chota, Chota 06120, Peru
2
Escuela de Posgrado en Ingeniería, Universidad Nacional de Trujillo, Trujillo 13011, Peru
3
Facultad de Ingeniería de Industrias, Alimentarias y Biotecnología, Universidad Nacional de Frontera, Sullana 20100, Peru
4
Instituto Universitario de Ingeniería de Alimentos FOODUPV, Universitat Politècnica de València, Camino de Vera s/n, 46022 Valencia, Spain
*
Author to whom correspondence should be addressed.
Processes 2026, 14(6), 1022; https://doi.org/10.3390/pr14061022
Submission received: 9 February 2026 / Revised: 12 March 2026 / Accepted: 19 March 2026 / Published: 23 March 2026
(This article belongs to the Special Issue Innovative Food Processing and Quality Control)

Abstract

The cheese maturation process involves complex physicochemical and structural changes that directly influence its final quality and consumer acceptance. The development of non-destructive and rapid analytical techniques is therefore essential for monitoring these changes and optimizing quality control strategies. This study evaluated the potential of dielectric spectroscopy and near-infrared (NIR) spectroscopy as tools to predict properties associated with the quality of Swiss-type cheese during the maturation process. The cheese samples were matured for 60 days, and NIR profiles (900–1700 nm), dielectric profiles (401–106 Hz) and physical characteristics (color and texture) were obtained every 15 days. Based on these data, models were developed to predict the maturation time (days) and physical properties using partial least squares regression (PLSR). The performance of the model was evaluated using the determination coefficient ( R 2 ) and the root mean square error (RMSE). The results showed that dielectric spectroscopy provided a better fit for all the parameters evaluated ( R day 2 = 0.999 , R L * 2 = 0.912 , R a * 2 = 0.983 , R b * 2 = 0.982 , and R firmness 2 = 0.625 ), with prediction errors of RMSE day = 0.219 , RMSE L * = 1.184 , RMSE a * = 0.163 , RMSE b * = 0.308 , and RMSE firmness = 91.094 . In conclusion, dielectric spectroscopy combined with PLSR showed slightly superior performance to predict maturation time and physical changes in Swiss-type cheese.

1. Introduction

The industrialization of milk, especially the production of mature cheeses, is a vital sector to ensure food and nutritional security worldwide [1,2]. In recent decades, the production of these cheeses has grown steadily due to their high nutritional value and sensory characteristics, which are widely appreciated by consumers [3]. One of the initial stages in the development of sensory characteristics (flavor, smell and texture) in cheese production is curdling, this process depends on the quality of the milk, the starter culture (microflora), the production technology and storage conditions [4,5,6]. Similarly, during the transformation of curd into cheese, physical, chemical, and biochemical changes occur as a result of the degradation and metabolism of proteins, fats, and carbohydrates induced by enzymatic and microbiological activity [6,7,8,9,10,11].
The maturation time plays a critical role in the development of cheese quality, as it governs the progression of biochemical reactions such as proteolysis, lipolysis, and redistribution of moisture. These processes gradually modify the microstructure and chemical composition of cheese, leading to the development of key sensory attributes, including flavor, texture, and color [10,12,13,14]. However, monitoring the maturation process remains a significant challenge for the cheese industry. Ensuring appropriate and optimal conditions during ripening is essential to achieve the desired sensory characteristics and nutritional profile of the final product. Therefore, understanding the evolution of these physicochemical changes over time is fundamental for the development of reliable analytical approaches capable of monitoring cheese maturation rapidly and non-destructively.
Currently, the cheese industry uses traditional methods, objective and subjective, to monitor and control the quality of cheeses during the maturation process. Among the most commonly used methods to determine physicochemical properties are measurement of pH, acidity, protein content, moisture, and texture, etc., as well as determination of metabolites and/or chemical species using chromatography and electrophoresis techniques [6,11,15,16]. On the other hand, sensory analysis (subjective method) allows for the evaluation of consumer preferences and the sensory profile of cheese to be defined, including attributes such as color, aroma, flavor, and texture, to establish its degree of maturation and marketability [8,9,15]. However, conventional methods are labor-intensive, destructive, costly, require chemical inputs, require long analysis times, generate chemical waste, and require highly qualified personnel [9,17,18]. In this context, there is a need to develop rapid, viable, and non-destructive techniques for monitoring cheese maturation, in addition to being environmentally friendly.
In response to these limitations and the constant technological challenges facing the cheese industry, interest in the application of non-destructive, rapid, and accurate analytical techniques for monitoring cheese maturation has grown considerably in recent years. Among these techniques, near infrared (NIR) spectroscopy stands out for its ability to operate in the wavelength range of 800 to 2500 nm, allowing the characterization of radiation–matter interactions in solid and semi-solid food matrices through absorbance, transmittance, and reflectance measurements [19]. This information is associated with overtones and combination bands arising from molecular vibrations related to the stretching of the bonds O–H, N–H, and C–H [20]. Several studies have demonstrated the competitive advantages of NIR spectroscopy in the cheese industry, reporting applications in monitoring commercial cheese maturation [15,21], evaluating transglutaminase activity in semi-hard cheeses [22], predicting sensory attributes in Cheddar cheese [8], identifying chemical species during Cheddar cheese maturation [16], monitoring protein interactions throughout cheese maturation [23], and differentiation of maturation stages in Camembert cheese [7]. However, despite the large number of studies reported, there is still limited evidence on the ability of portable NIR equipment to directly and robustly predict the maturation time of cheese. In line with the physicochemical interpretations discussed above, recent studies have reported a rapid increase in the use of miniaturized spectrometers aimed at industrial applications, particularly due to their reduced size, low cost, and ease of integration into processing environments [24]. These characteristics make such devices especially attractive for the dairy sector, where real-time and non-destructive monitoring is highly desirable. In particular, NIR-based spectrometers have demonstrated strong predictive performance for monitoring cheese maturation, as they are sensitive to molecular changes associated with fatty acid composition [25], as well as to dehydration and proteolytic processes that occur during maturation [26].
However, dielectric spectroscopy (DS) is a technique based on the interaction of electromagnetic fields with matter across the electromagnetic spectrum. At the macroscopic level, Maxwell’s equations allow the interaction between matter and electric and magnetic fields to be described using the complex permittivity and permeability of the material [27,28]. In particular, dielectric permittivity is a complex property composed of the dielectric constant ( ε ), associated with the material’s ability to store electrical energy, and the loss factor ( ε ), related to the mechanisms of energy dissipation in the material [29,30]. Similarly, spectrometers based on determination of dielectric properties have also demonstrated considerable potential within the dairy sector [31]. Cheese is a complex food system that undergoes pronounced structural reorganization throughout maturation [32], involving changes in molecular mobility, phase distribution, and ionic conductivity. In this context, dielectric spectroscopy emerges as a robust alternative, as it is based on molecular rotation and polarization mechanisms under electromagnetic field excitation. Consequently, dielectric indicators provide valuable information related to the ability of the material to store and dissipate energy, which has been shown to correlate with key quality attributes and physicochemical transformations in cheese [33].
Dielectric spectroscopy in food is relatively recent, several authors have conducted research aimed at evaluating the salting process in cheese [34], characterization of different types of cheese [35,36], prediction of inorganic salt and moisture content [18], relationship between sensory attributes and dielectric properties [37], prediction of cheese texture and melting point [17], evaluation of structural and compositional changes induced by calcium [32], determination of milk coagulation time [38] and evaluation of quality parameters in Parmigiano cheese [39]. Although these studies demonstrate the high potential of dielectric spectroscopy as a non-destructive tool for the quality control of cheeses in the microwave range (0.3–20 GHz), there are still no conclusive reports in the scientific literature on monitoring the cheese maturation process in the radiofrequency range, where greater sensitivity is expected to physical and biochemical changes associated, in particular, with structural transformations of proteins.
The aforementioned spectrophotometric techniques, such as NIR spectroscopy and dielectric spectroscopy, generate large volumes of spectral information whose proper interpretation requires the use of advanced multivariate analysis tools. In this context, one of the most widely used methodologies is partial least squares regression (PLSR). This technique has been widely used in the analysis of NIR and dielectric spectra due to its ability to handle highly correlated data sets with a large number of spectral variables, which are common characteristics in complex food matrices [19,33,40,41]. Likewise, PLSR allows the development of robust predictive models that relate the information contained in the spectra to the physicochemical properties of the samples, even in the presence of instrumental noise or signal overlap, making it a key tool for the non-destructive evaluation of food quality.
Therefore, the objective of this research is to evaluate and compare the performance of dielectric spectroscopy and portable near-infrared (NIR) spectroscopy, coupled with partial least squares regression (PLSR) models, for predicting the maturation time of Swiss-type cheese. Additionally, this study was to analyze the ability of both techniques to capture the physicochemical and structural changes associated with the maturation process. In this context, the study aims to identify the advantages, limitations, and potential of these emerging spectrophotonic technologies as rapid and non-destructive tools for quality control in the cheese industry.

2. Materials and Methods

The experimental procedure is shown in Figure 1 and each step is explained in detail in the following paragraphs.

2.1. Samples

Twenty-four Swiss-type cheese samples, each with an approximate weight of 1 kg, were obtained from Industria Alimentaria Huacariz S.A.C. (Cajamarca, Peru). The samples corresponded to different maturation times (15, 30, 45 and 60 days) and were stored under controlled maturation conditions (15 °C and 80% relative humidity). Subsequently, the cheeses were transported in insulated containers at 4 °C to the Food Engineering Laboratory of the Universidad Nacional de Cajamarca and the laboratory of Emergent Technologies of the Universidad Nacional Autónoma de Chota. Before physical and spectrophotometric analyses, the samples were stabilized at room temperature (18 ± 0.5 °C).

2.2. Data Acquisitions and Pre-Treatment

The following sections provide detailed information on the procedure for obtaining NIR and dielectric spectral profiles as well as data preprocessing.

2.2.1. NIR

The near-infrared (NIR) spectra were acquired using a miniaturized portable spectrometer based on digital light processing (DLP) technology, operating in the spectral range of 900 to 1700 nm. The system uses the TIDA-00554 sensor (Texas Instruments, Texas-USA) [1], which integrates a digital micromirror device (DMD) for wavelength selection and a single-element InGaAs detector for spectral signal capture.
This design allows for high-performance measurements to be obtained in a portable and low-cost format, compared to conventional architectures that use InGaAs array detectors or rotating grating systems, which are more expensive and less mechanically robust. The wavelengths were selected within the operating range (900–1700 nm), and each NIR spectrum consisted of 228 reflectance values, acquired at equidistant intervals across the spectral range supported by the spectrometer [42].
The processing and control of the different components of the system was carried out using a Raspberry Pi 4 board, which acted as the central control unit. The software was implemented in the Python, v.3.9.19 programming language, using specialized libraries for signal processing and the development of deep learning models.
In particular, the Scikit-learn, v. 1.6 libraries were used for prediction and classification tasks, NumPy, v. 2.0.2 for the efficient handling of matrices and numerical arrays, Pandas, v. 2.3 for reading and organizing datasets, Tkinter, v. 8.5 for the development of graphical user interfaces, Matplotlib, v. 3.9 for the visualization of results, and OS for the management of operating system directories and files. The system was powered by a 7.4 V battery to ensure the portability of the prototype.

2.2.2. Dielectric Profiles Extraction

Swiss cheese dielectric properties in the radio frequency range (low frequency) were measured using the parallel-plate technique with a 16451B dielectric test fixture (Keysight, Boeblingen, Germany), connected via a coaxial cable to an E4990A impedance analyzer (Keysight, Boeblingen, Germany). Before dielectric measurements, the equipment was turned on for 30 min to allow for the stabilization of electronic circuits and subsequently calibrated under open and short-circuit conditions, as recommended by the manufacturer, to minimize noise during dielectric data acquisition [29,43].
Swiss cheese samples were shaped into a cylindrical geometry using a meat slicer (B250B3, Santiago, Chile) and a stainless-steel punch, yielding twenty cheese disks. The samples were then placed in the center between the two parallel electrodes of the dielectric sensor. Dielectric measurements, including dissipation factor (D) and equivalent parallel capacitance ( C p ), were performed over a frequency range of 40 Hz to 1 MHz, with 401 discrete frequency points and a bandwidth of 1 kHz. Five replicate measurements were conducted for each cheese disk at different maturation times.
  • Signal pretreatment
    Once the values of D and Cp were obtained, the dielectric properties such as the dielectric constant ( ϵ ) and the loss factor ( ϵ ) were calculated using Equations (1) and (2) [43]:
    ϵ = t a . C p π . ( d a ) 2 . ϵ 0
    D t = D = t a n ( δ )
    where ϵ is the dielectric constant; Cp, equivalent parallel capacitance (F); D, dissipation factor; D t , sample dissipation factor; t a , average sample thickness (m); d, upper electrode diameter (m) [ 38 × 10 3 ]; ϵ 0 , 8.854 × 10 12 (F/m).

2.2.3. Pre-Treatment Spectral

To minimize the effects of light scattering in the NIR spectra and air gaps in the dielectric spectra, caused by surface irregularities and/or interferences in Swiss cheese samples, the Savitzky–Golay (Equation (3)) preprocessing method was applied:
y j o = i = m m C i , Y j + i N
where Y is the original profile; Y 0 the smoothed profile; C the coefficient of the i t h of the y-profile; N the number of convolution stages.

2.3. Physical Characterization

The color (CIE L*a*b*) and texture of Swiss-type cheese were characterized during the maturation process, as detailed below.

2.3.1. Color Characterization

Color measurements were performed using a portable Konica Minolta CR-20 colorimeter (Konica Minolta Inc., Osaka, Japan), equipped with a 45°/0° measurement geometry, standard illuminant D65, and a standard 2° observer. The equipment allowed for direct acquisition of colorimetric parameters in the CIELAB color space (L*, a*, and b*). Before measurements, the colorimeter was calibrated according to the manufacturer’s recommendations using the standard white reference supplied by Konica Minolta, and the calibration was periodically verified during the test to ensure instrumental stability and reproducibility of the results. Each sample was cut transversely to obtain flat and homogeneous surfaces; subsequently, the measurement surfaces were carefully cleaned with lint-free paper to remove surface moisture or greasy residues that could affect reflectance [44].

2.3.2. Texture Characterization

According to Sultana et al. [45], the cheese samples were cut into cylindrical specimens (20 × 20 mm) and the firmness tests were performed at room temperature. The samples were then subjected to a single compression to 60% of their original height using a cylindrical probe with a diameter of 20 mm and the displacement speed was set at 2 mm/s. Firmness measurements (maximum force (N) recorded during the first compression cycle) were performed using a TA.XTplusC texture analyzer (Texture Technologies Corp., South Hamilton, MA, USA).

2.4. Modeling Building

Partial least squares regression (PLSR) was used to model the relationship between NIR and dielectric spectral data and the physical properties (color and texture) of the samples. This multivariate statistical approach is widely used when working with highly collinear high-dimensional spectral datasets, as it allows the construction of a linear predictive model that relates a response variable ( Y ) to a large set of predictor variables ( X ), as described in Equation (4) [33,41]:
Y = X β + E
In this model, X represents the predictor matrix ( n × m ) that contains the NIR and dielectric spectral variables, where n corresponds to the number of samples and m the spectral variables (wavelengths for the NIR spectra and frequencies for the dielectric spectra). The vector Y ( n × 1 ) contains the reference physics measurements, β ( m × 1 ) denotes the vector of regression coefficients, and E represents the residual error vector.
For modeling of relationships, the PLS_Toolbox software, v. 9.51 (Eigenvector Research) was used; the analysis was conducted using the default parameters of the software, specifically with the number of components fixed at seven.

2.5. Statistical Evaluation

Texture and color data (L*a*b*) were analyzed using a one-way analysis of variance (ANOVA). Subsequently, Tukey’s multiple comparison test was applied with a significance level of α = 0.05 , using R statistical software, v. 4.4.0 (R Foundation for Statistical Computing, Vienna, Austria). Differences were considered statistically significant when p < 0.05 . Treatments that do not share the same letter indicate statistically significant differences according to the Tukey’s test.
In addition, a Principal Component Analysis (PCA) was performed to explore the underlying structure and variability of the Near-Infrared (NIR) and dielectric spectral data, and to identify potential clustering patterns among samples. Before the analysis, the spectral data were preprocessed to minimize baseline shifts and scattering effects. PCA was conducted in the R statistical environment (R Foundation for Statistical Computing, Vienna, Austria) using the stats and factoextra packages.
Finally, predictive models were developed using complete NIR and dielectric spectral datasets, applying a five-fold (k-fold) cross-validation strategy to reduce the risk of overfitting. The analysis was performed using MATLAB, v. 2025a software in combination with the PLS_Toolbox version 9.2.1 (Eigenvector Research Inc., Wenatchee, WA, USA). The performance of the PLSR models was evaluated using the coefficient of determination ( R 2 ) and the root mean square error (RMSE), as defined in Equations (5) and (6), according to previous studies [33].
R c v 2 = i = 1 n y ^ i y i 2 i = 1 n y ^ i y ¯ 2
RMSE cv = 1 n i = 1 n y i y ^ i 2
where y ^ i and y i are the predicted and reference values of the sample ith, respectively, and y ¯ represents the mean reference values across all samples.

3. Results and Discussion

3.1. Color Parameters (CIE L*a*b*) and Texture in Cheese Maturation

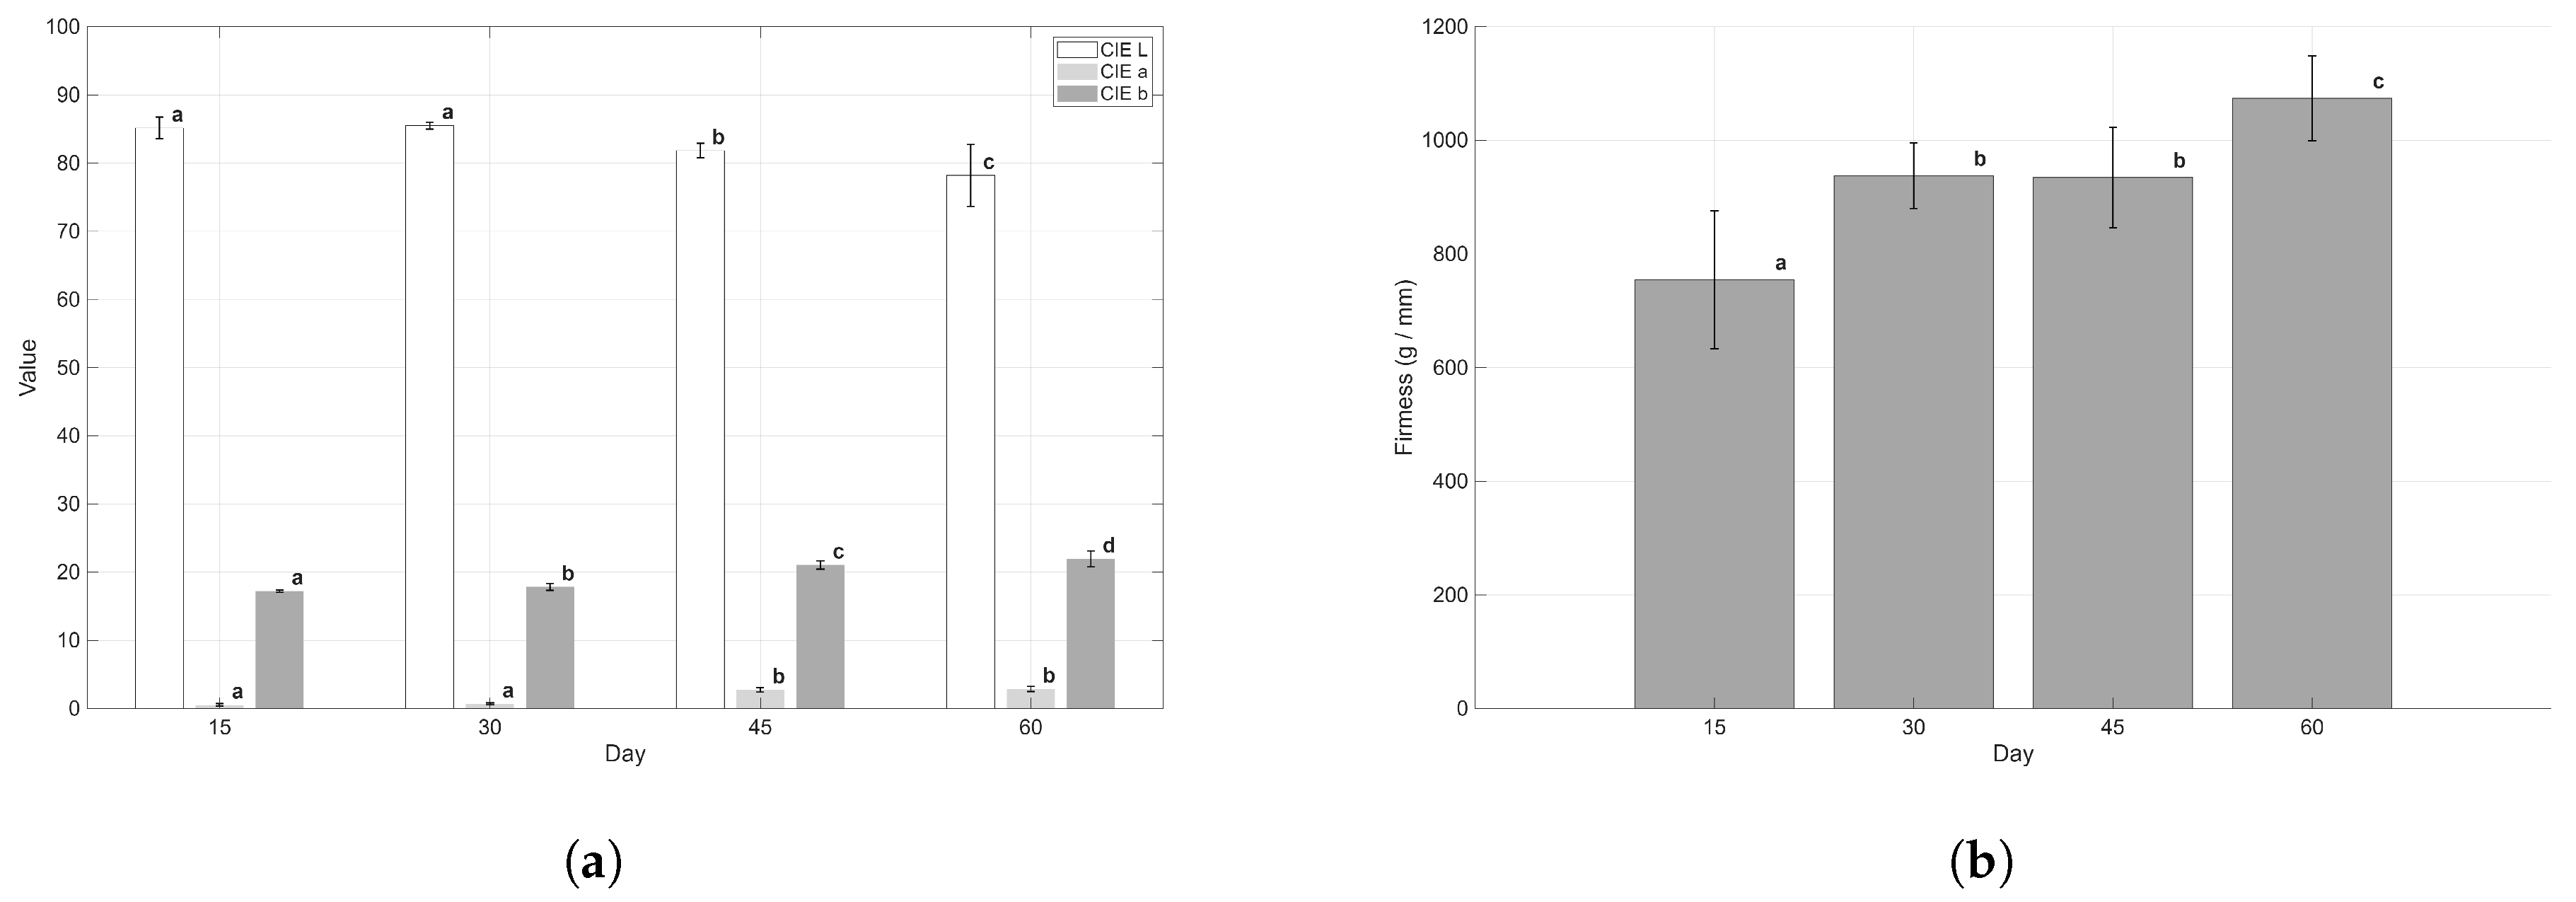
Figure 2 reveals significant changes in the physical variables of Swiss-type cheese throughout the maturation process. In general, a progressive variation in mean values is observed as a function of maturation time, with statistically significant differences between the evaluated periods, as determined by the Tukey post hoc test ( p < 0.05 ). The presence of different letters above the bars indicates the formation of homogeneous groups, which confirms that maturation time has a significant effect on the physical behavior of the product.
The evolution of color parameters and textural characteristics during cheese maturation reflects a series of physicochemical and biochemical transformations that occur within the matrix; so, their mean values are collected in the Table 1. As shown in Figure 2a, the progressive decrease in luminosity (L*) indicates a gradual loss of the characteristic white appearance, which can be attributed to moisture loss, protein network densification, and increased light scattering caused by structural rearrangements of casein micelles [46,47,48,49]. In parallel, the a* parameter remained positive throughout the maturation period and increased with time, suggesting a shift towards reddish tones. This behavior is likely associated with enzymatic reactions, such as proteolysis and lipolysis, which generate chromophoric compounds and modify pigment–matrix interactions [50,51].
This phenomenon is consistent with that reported by other authors, who attribute the increase in the value of a* to more reddish tones during cheese maturation to the production of chromophoric compounds, such as porphyrins, lipid oxidation products and microbial pigments [12,52]. Similarly, a continuous increase in the parameter b* indicates a progressive intensification of yellow coloration during maturation. This trend is consistent with previous studies reporting that yellowness (b*) reflects primarily carotenoids associated with the fat fraction, whose expression may be influenced by water loss and redistribution of the lipid phase. In addition, oxidative reactions that occur during ripening may also contribute to color changes [13,14]. These color changes are consistent with previous studies reporting that maturation time, maturation techniques, manufacturing technology, additives, and microflora activity significantly influence the perceived color of cheese [53], and align with the requirement that processed cheeses exhibit a uniform and glossy surface [54]. Regarding textural properties, the increase in firmness observed in Figure 2b can be mechanistically explained by moisture reduction, enhanced protein–protein interactions, and progressive breakdown and reorganization of the protein–fat matrix, leading to a more compact and rigid structure as maturation progresses.

3.2. Spectral Profiles

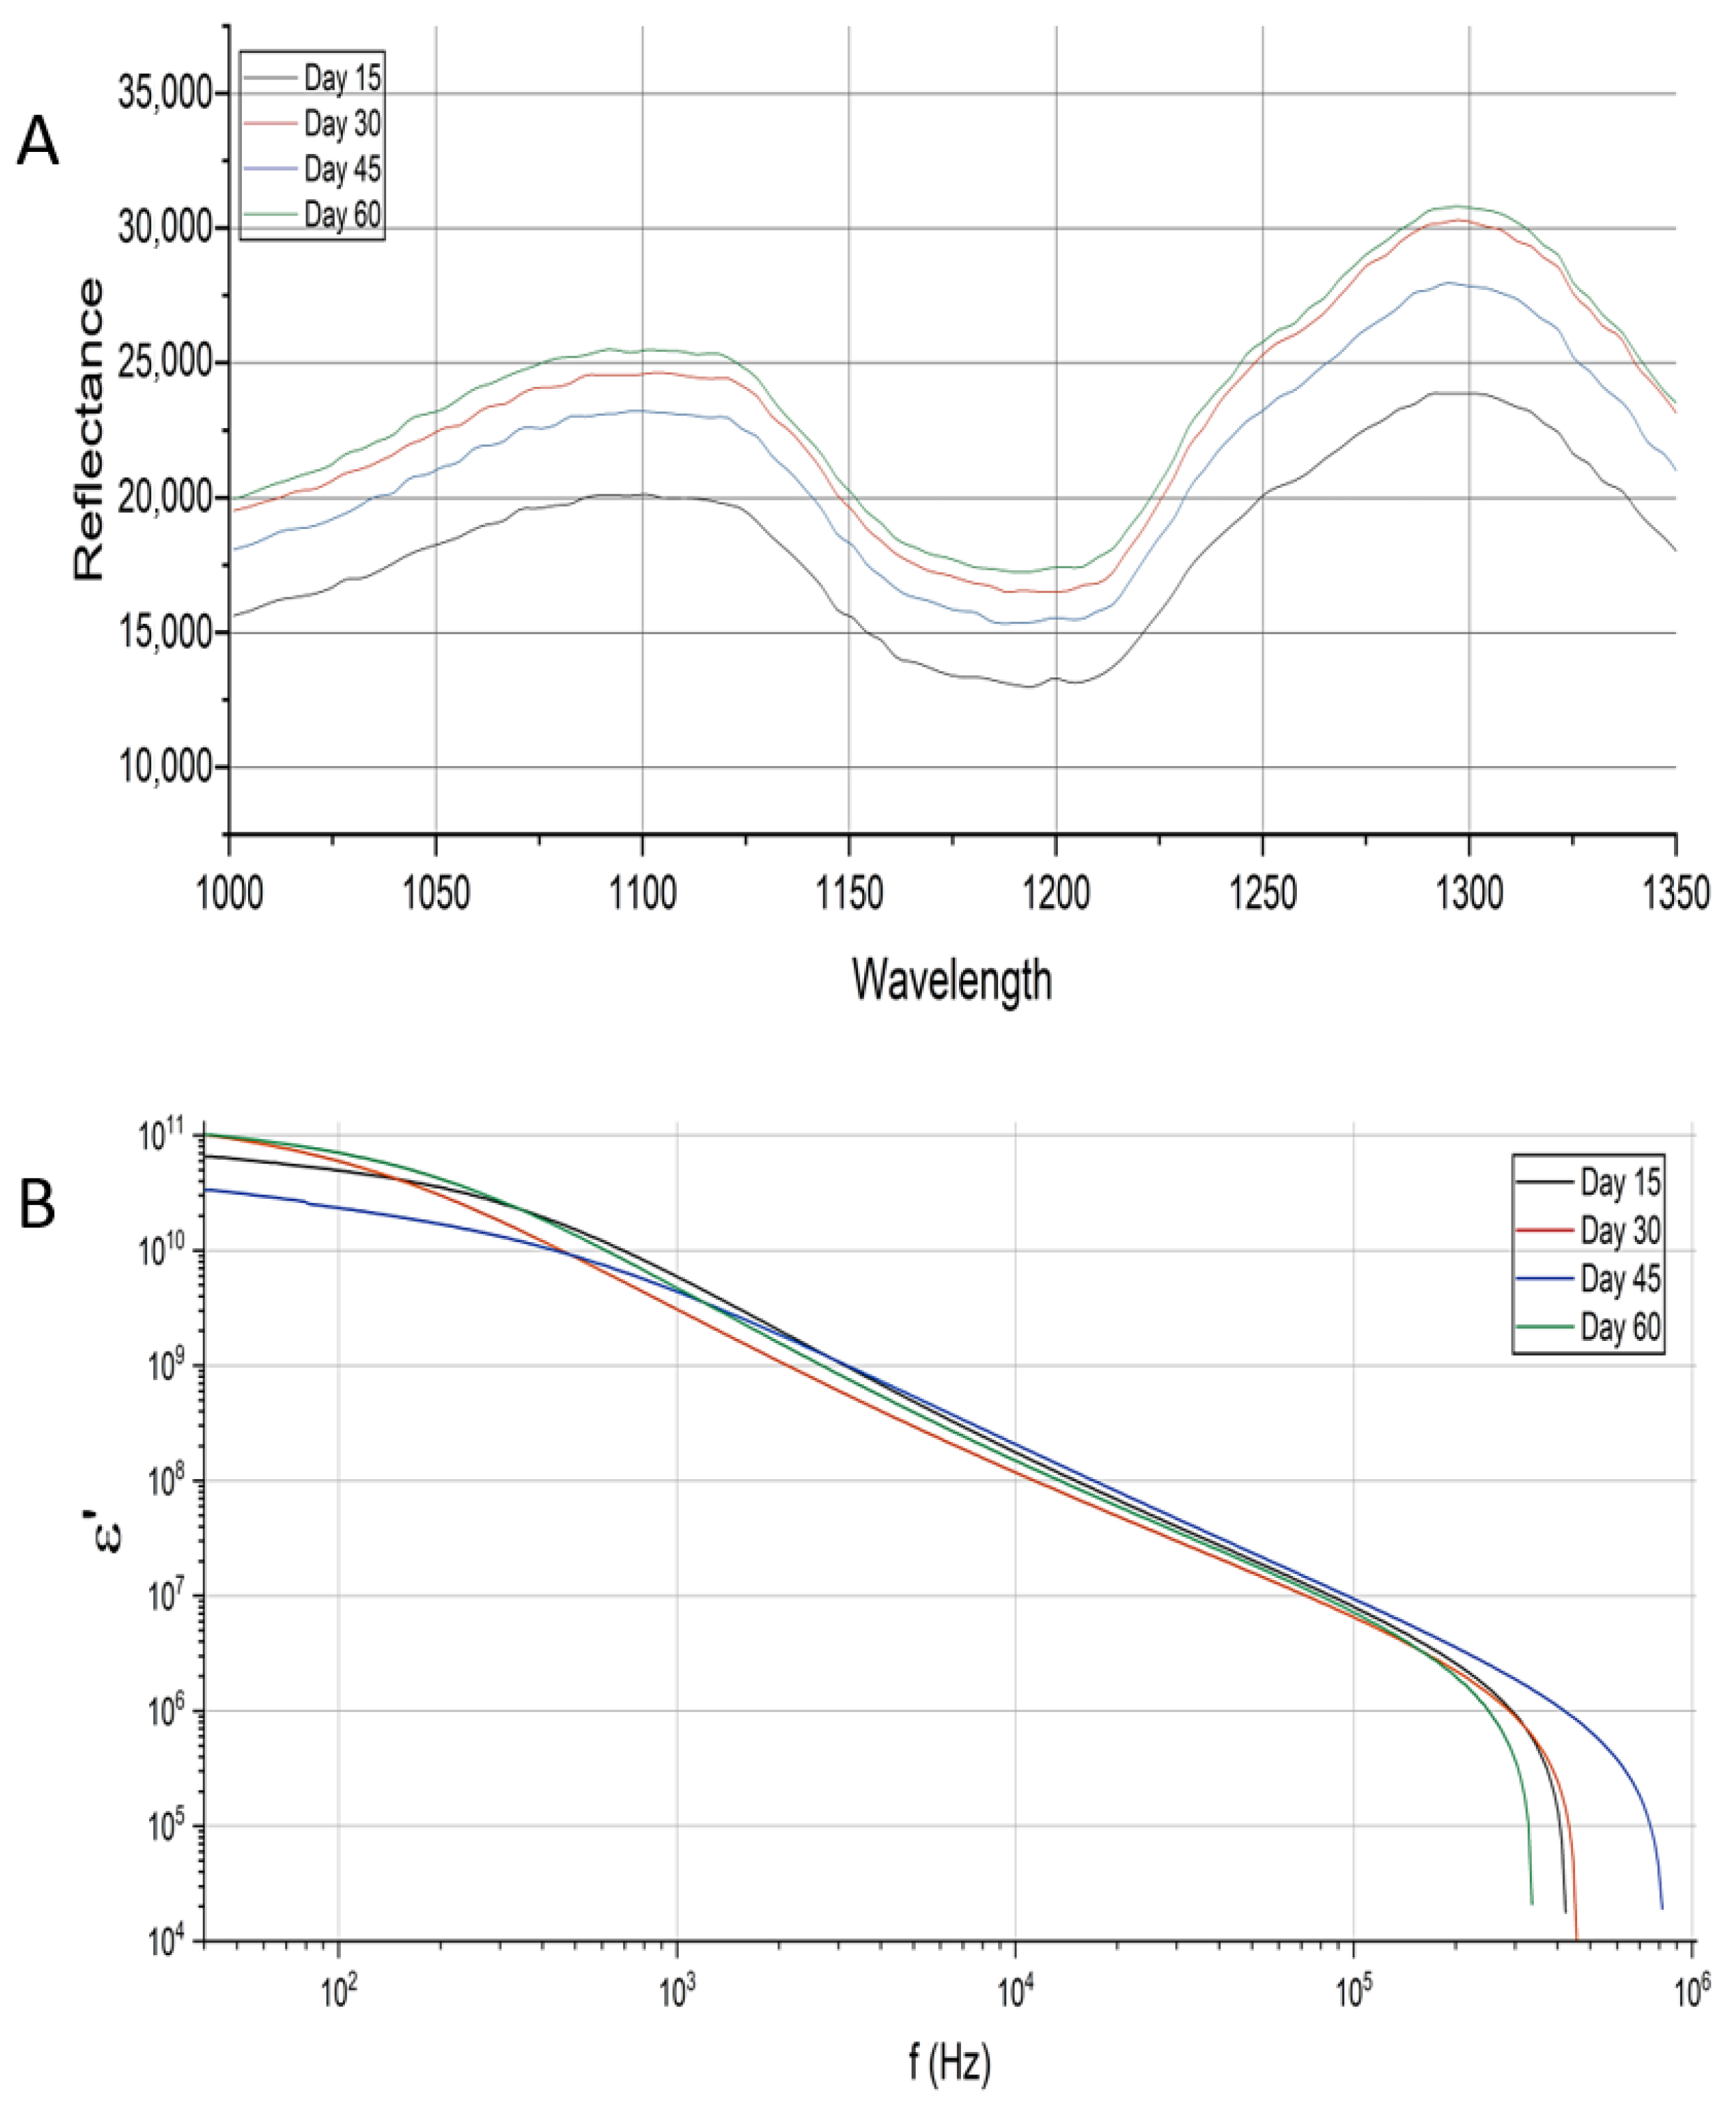
The variations observed in both NIR and dielectric spectra throughout the maturation process can be directly associated with physicochemical transformations occurring within the cheese matrix. In the NIR region (Figure 3A), changes in spectral intensity and band shape are mainly related to variations in water, fat, and protein content. Specifically, the absorption features associated with the O–H stretching and combination bands reflect the progressive reduction in moisture content due to syneresis and evaporation during maturation. Simultaneously, spectral contributions related to the C–H bonds (range 1130–1240 nm) indicate lipid redistribution and concentration effects [55], while the related bands N–H and C=O (1135–1200 nm) are influenced by proteolytic reactions that modify the protein structure and molecular environment [56,57].
The results of dielectric spectroscopy (Figure 3B) further support these findings by revealing significant changes in the dielectric constant ( ε ) throughout the frequency range as maturation progresses. The decrease in ε at low frequencies can be attributed to the reduction in free and bound water, which decreases dipolar polarization and ionic mobility within the cheese matrix [18,35]. At higher frequencies, the dielectric response is influenced by interfacial polarization and molecular relaxation processes associated with proteins and lipids, whose structural rearrangement during maturation leads to altered dielectric behavior [34].
The NIR sensor used in this study corresponds to a low-cost device, which still showed significant potential for determining variables linked to light absorption at specific wavelengths. These features are directly related to intrinsic compositional and structural changes in the cheese matrix, such as moisture loss, protein breakdown, and lipid redistribution, reinforcing the suitability of NIR spectroscopy as a practical absorption tool for maturation assessment.
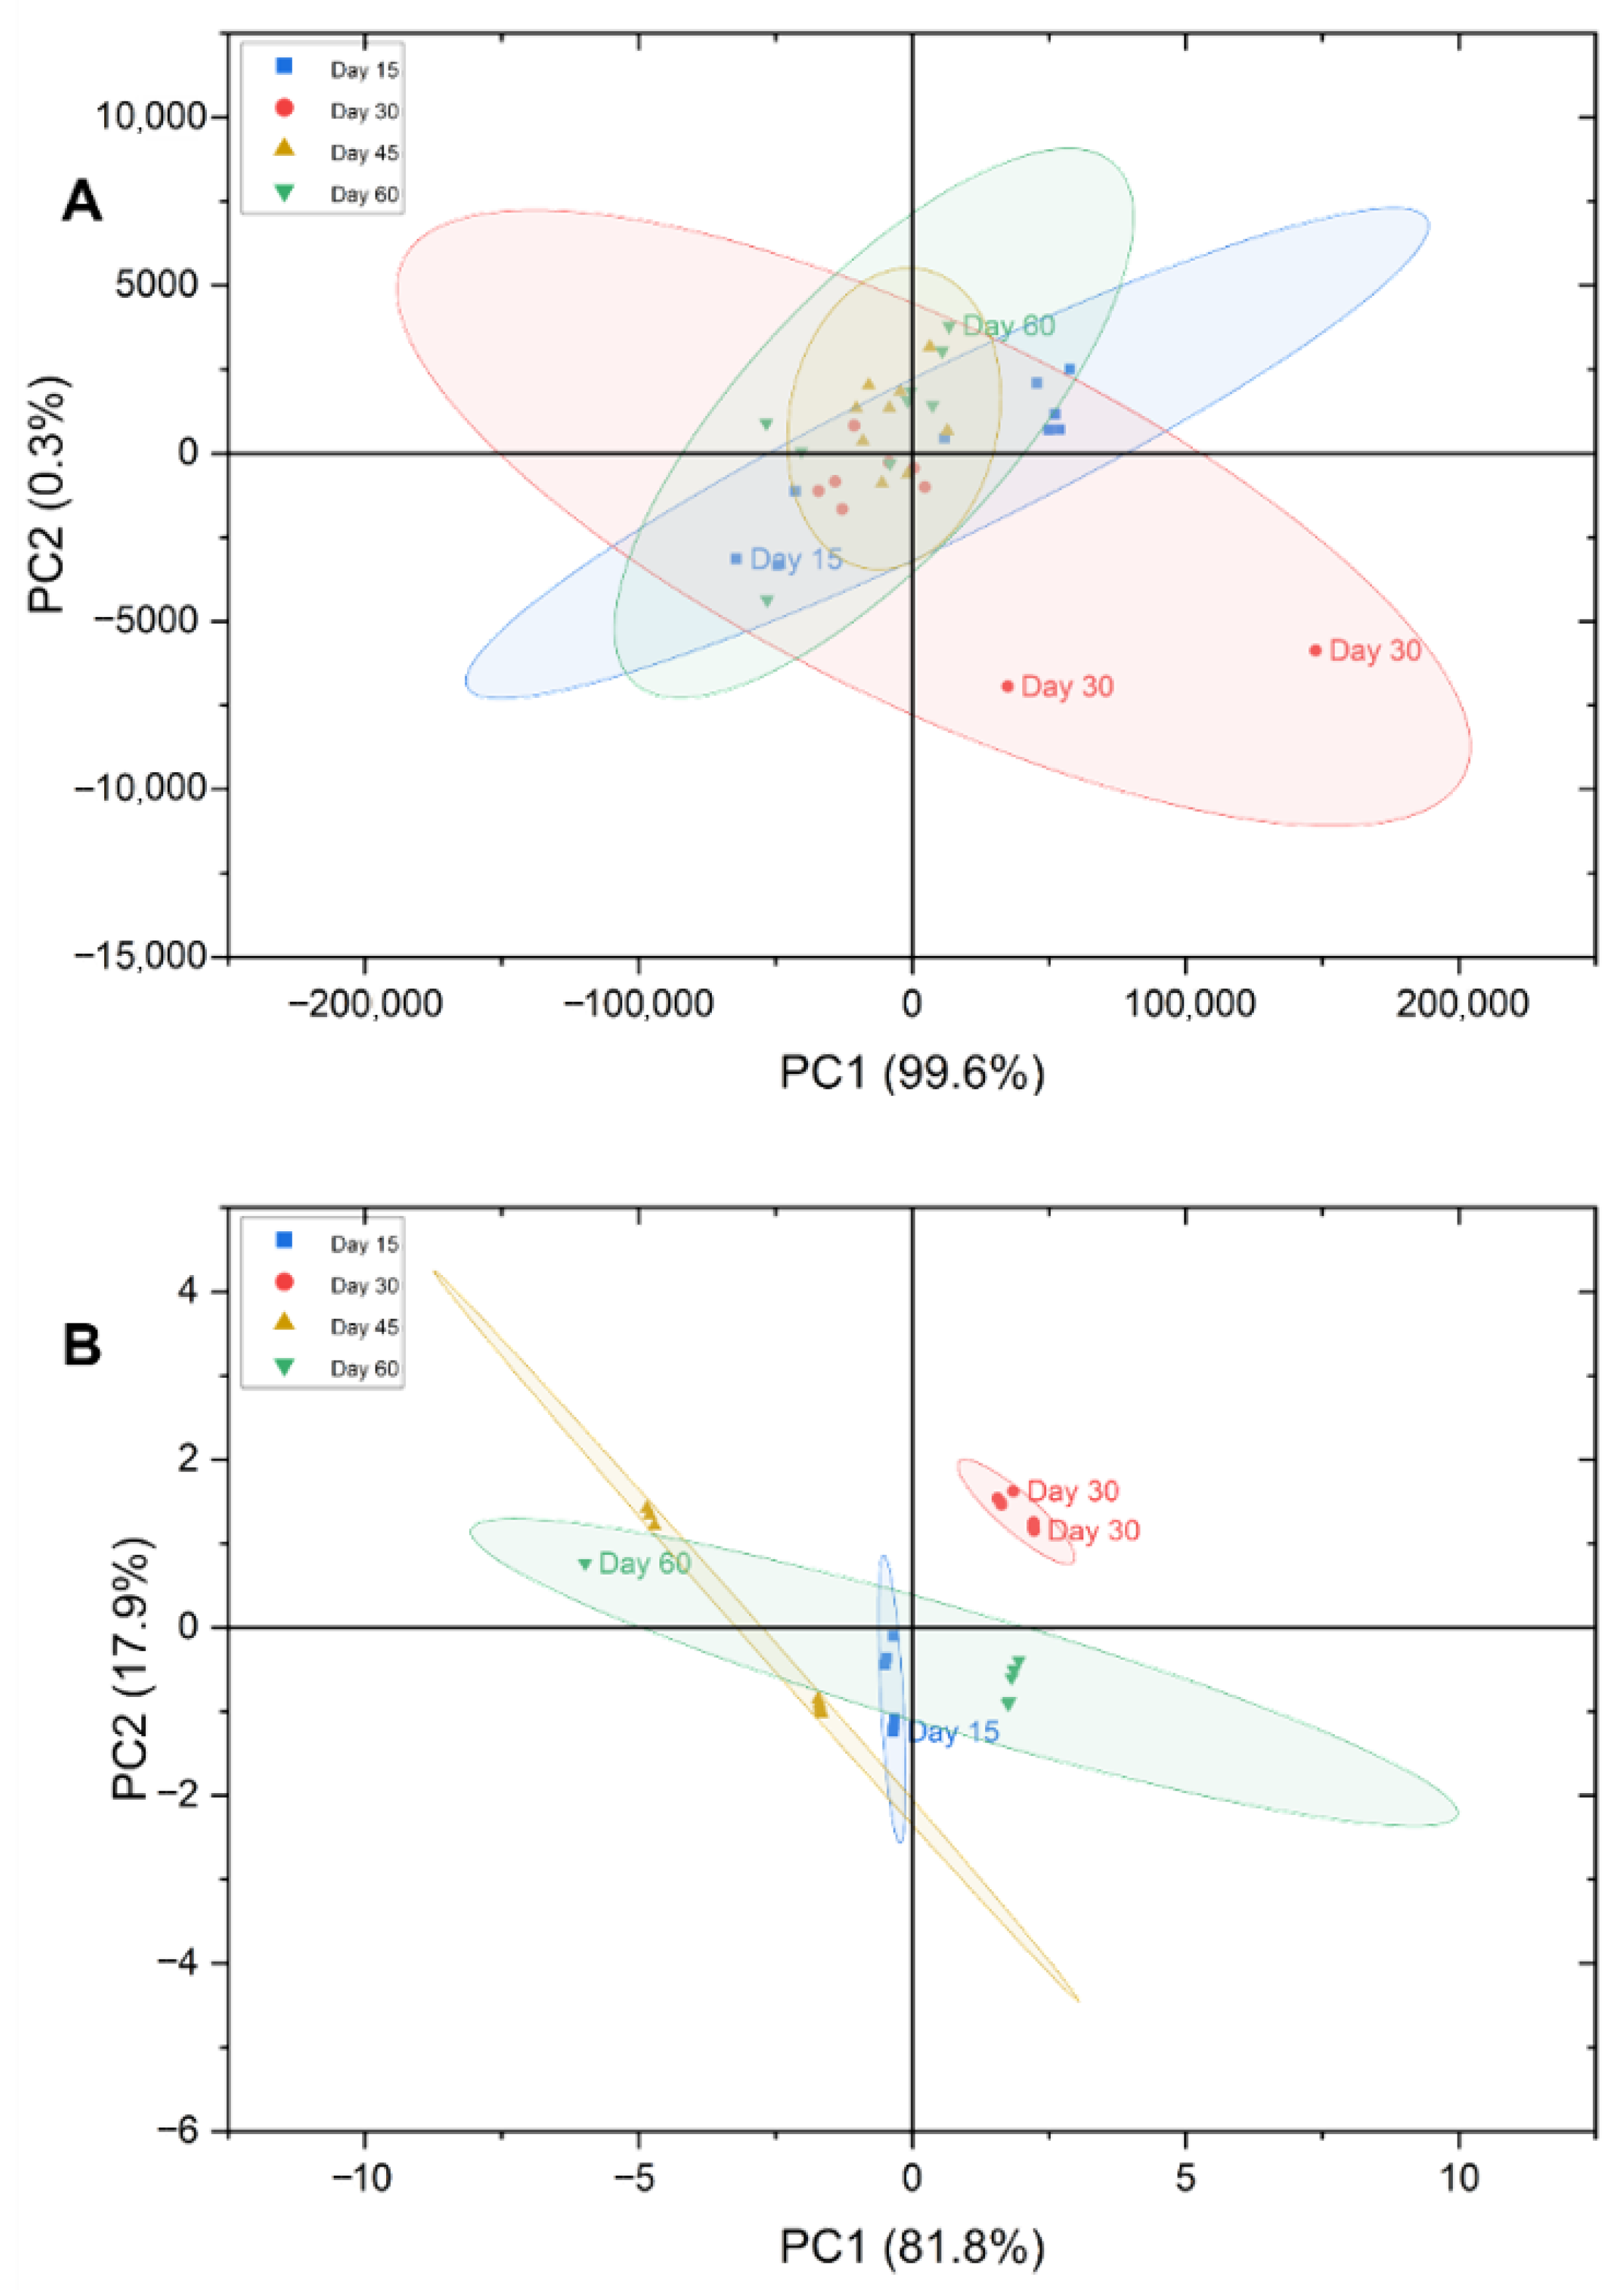
Principal component analysis (PCA) was performed using the full spectral range of both NIR and dielectric spectroscopies, after data normalization, in order to explore the main sources of spectral variability associated with cheese maturation. The two-dimensional score plots of the first two principal components (PC1 and PC2) are presented in Figure 4.
The PCA results showed that the NIR spectra explained a higher percentage of the total variance of Swiss-type cheese samples (99.9%), followed by the dielectric spectra (99.7%). For the NIR measurements, a noticeable overlap among samples corresponding to different maturation days was observed in the PC1–PC2 space, suggesting that factors other than maturation time, such as color and textural attributes, also contributed to the spectral variability of the cheese samples. In contrast, the PCA performed on dielectric spectra showed a lower degree of overlap between maturation stages, allowing for clearer discrimination among samples along the maturation process.

3.3. Predictive Models

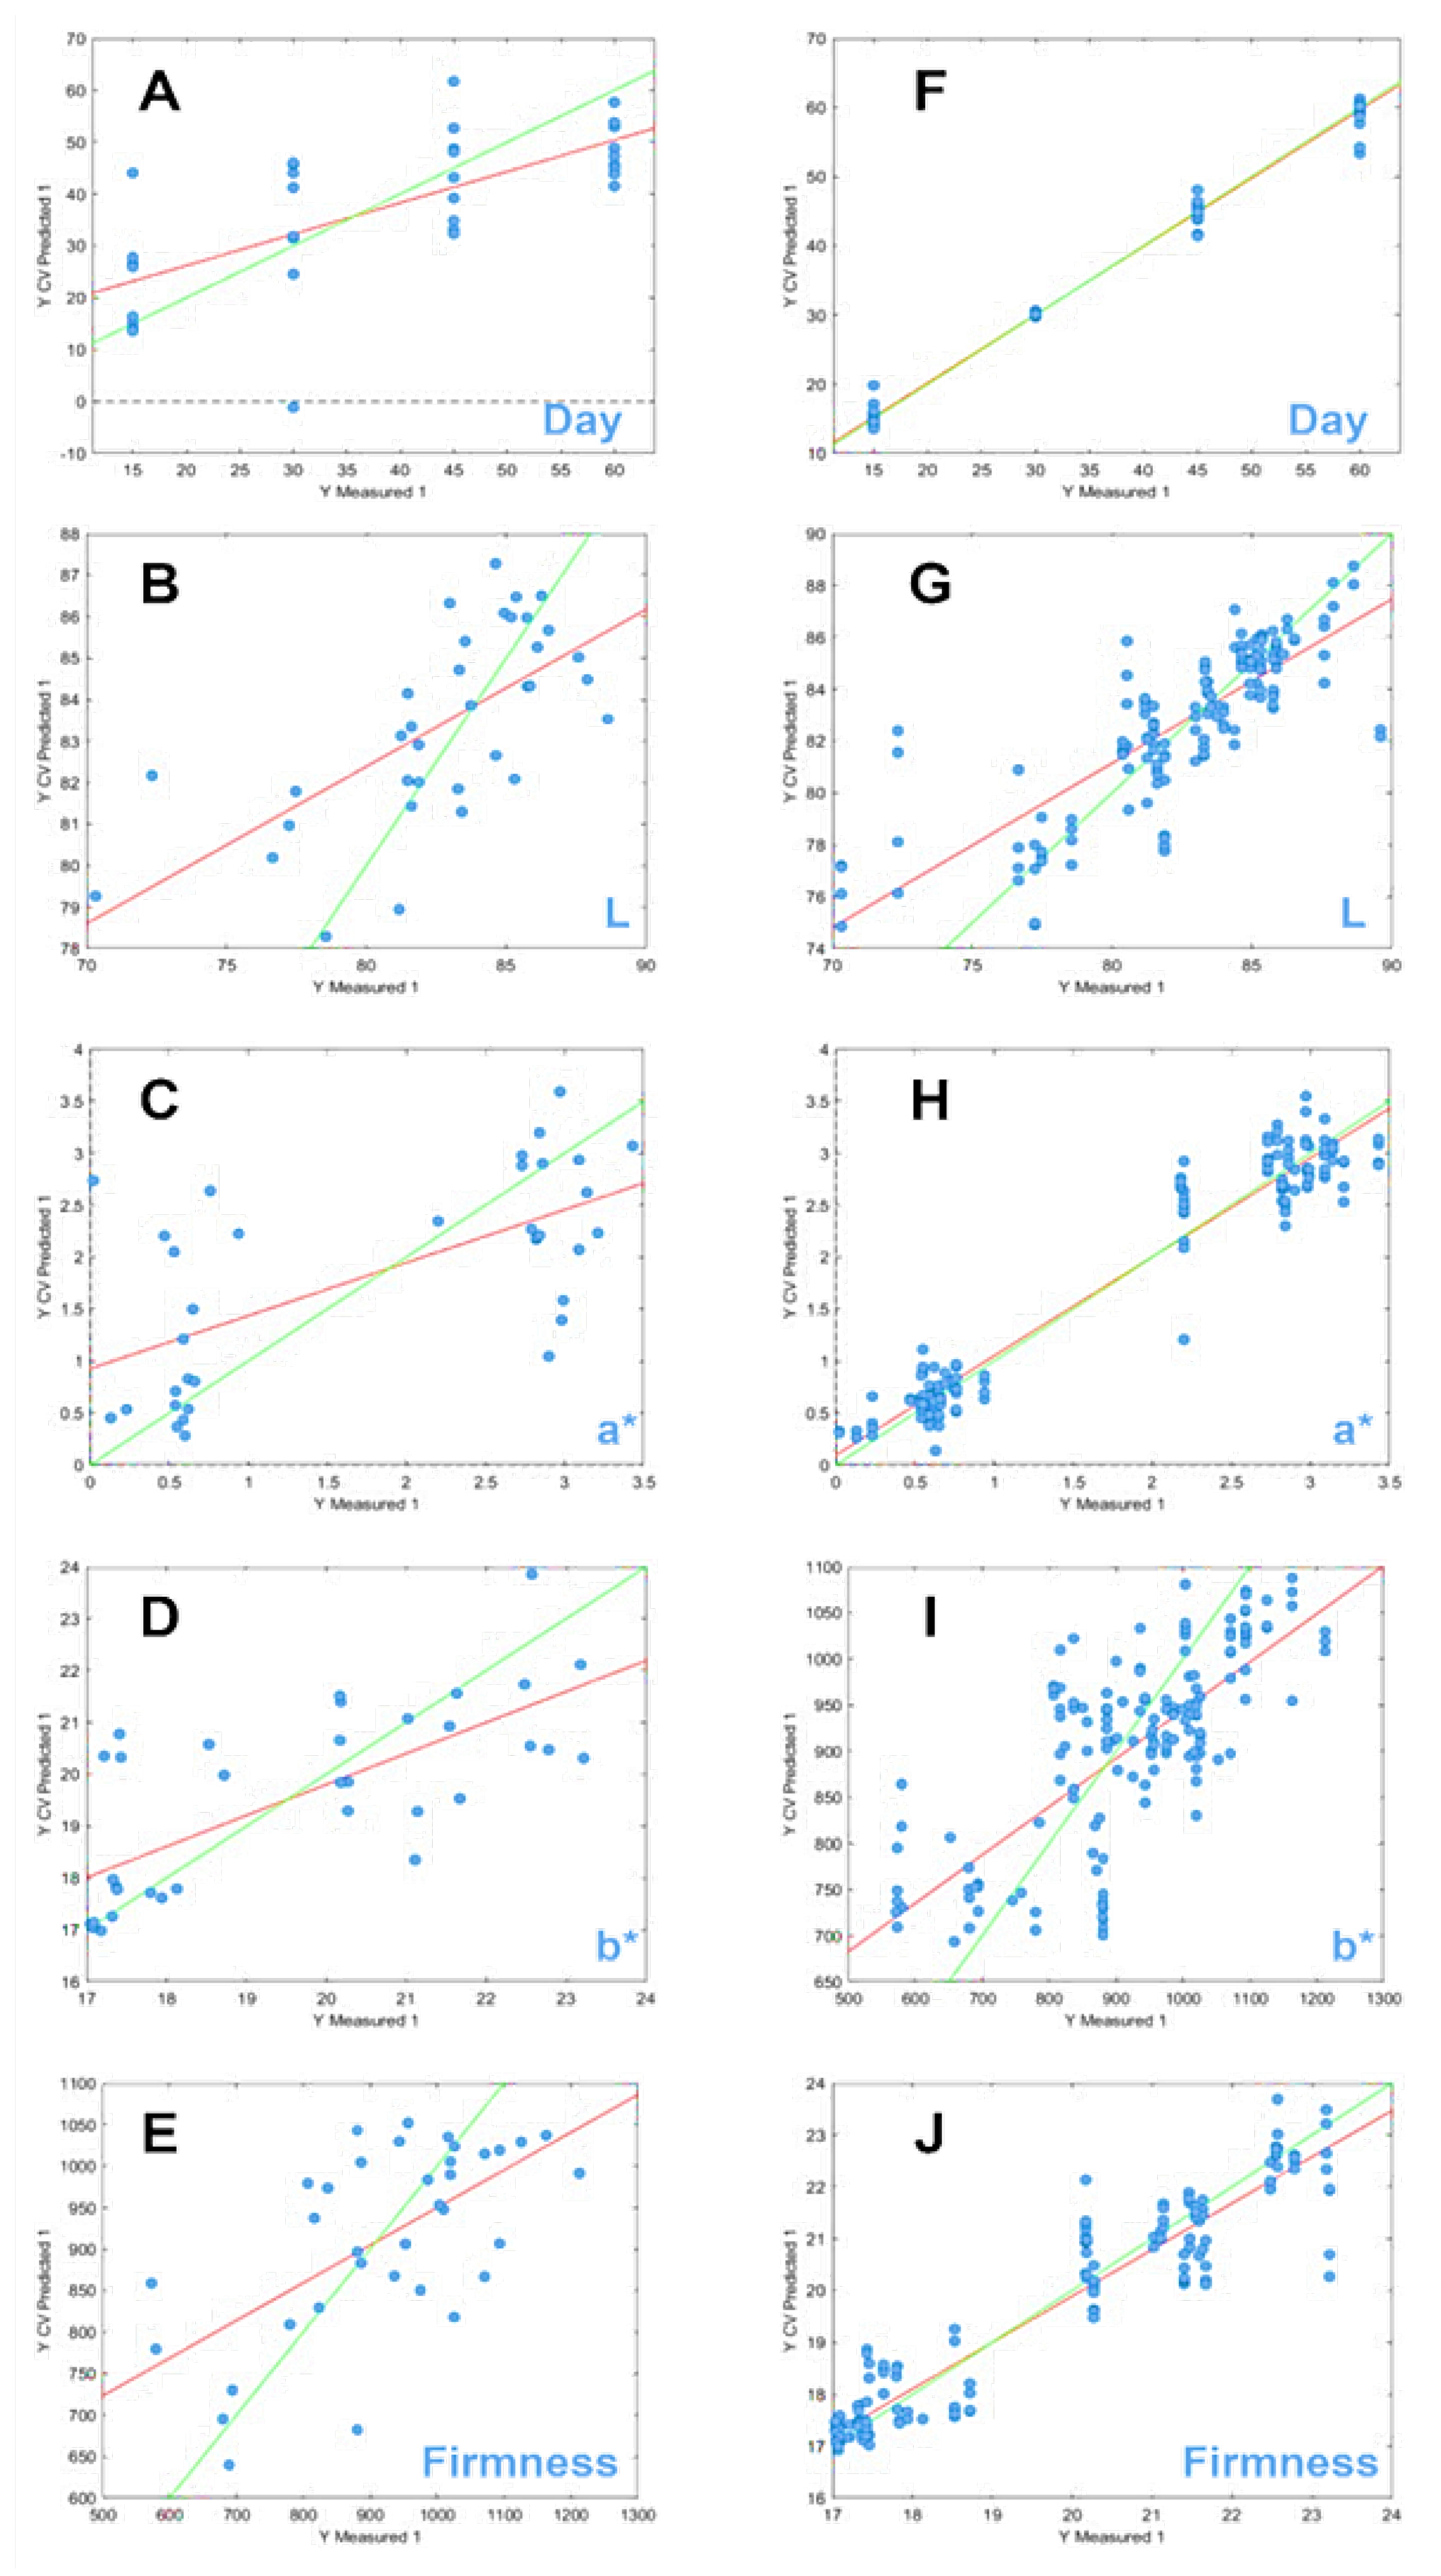
Partial least squares regression (PLSR) models were developed to compare the predictive performance of near-infrared (NIR) and dielectric spectroscopy for estimating maturation days, color parameters in the CIELAB space (L*, a*, and b*), and firmness of Swiss-type cheese. The predictive results obtained using the entire spectral range are summarized in Table 2, while the corresponding regression plots are presented in Figure 5. Table 2 summarizes the predictive performance of the PLSR models developed using NIR and dielectric spectroscopy. The models based on dielectric spectroscopy consistently showed higher coefficients of determination ( R c v 2 ) and lower prediction errors ( R M S E c v ) than those obtained from the NIR data for most of the variables.
In general, dielectric spectroscopy showed better predictive performance compared to NIR, as evidenced by higher coefficients of determination ( R c v 2 ) and lower root mean square errors ( R M S E c v ) for most of the variables. In particular, dielectric-based models achieved excellent accuracy in predicting maturation days ( R c v 2 = 0.999), as well as the chromatic parameters a* and b*, indicating a strong sensitivity to physicochemical changes occurring during cheese maturation. For the L* parameter, dielectric spectroscopy also outperformed NIR, although both techniques showed moderate to high predictive capability. In contrast, the firmness prediction exhibited lower R c v 2 values and higher R M S E c v for both spectroscopic methods, suggesting that the textural properties are more challenging to model and may be influenced by additional structural factors not fully captured by the spectral information alone. In general, PLSR models demonstrated a strong ability to discriminate between cheese maturation stages, achieving high R c v 2 values and relatively low R M S E c v values, particularly for maturation time and color parameters.

4. Conclusions

In this study, dielectric spectroscopy and NIR spectroscopy combined with partial least squares regression (PLSR) were successfully applied to predict quality attributes during the Swiss-type cheese maturation process. Spectral datasets were obtained directly from the production line of a commercial manufacturer, considering maturation time, color parameters in the CIELAB space (L*, a* and b*), and firmness as response variables.
The results demonstrated that both spectroscopic approaches were capable of non-destructively capturing the physicochemical changes associated with cheese maturation. However, dielectric spectroscopy exhibited superior predictive performance compared to NIR spectroscopy. In particular, PLSR models based on dielectric data achieved very high coefficients of determination for maturation time ( R c v 2 = 0.999 ), as well as for the color parameters L* ( R c v 2 = 0.912 ), a* ( R c v 2 = 0.983 ), and b* ( R c v 2 = 0.982 ), while moderate predictive performance was observed for firmness ( R c v 2 = 0.625 ).
These findings confirm the strong potential of dielectric spectroscopy as a rapid, non-destructive, and robust technique for quality control of Swiss-type cheese maturation, especially under industrial conditions. In addition, the integration of advanced spectroscopic techniques with chemometric tools represents a promising strategy for real-time monitoring and process optimization in the dairy industry.

Author Contributions

Conceptualization, T.C., Y.C., M.C.-G., P.J.F. and W.C.; methodology, T.C., Y.C., J.G., M.C.-G., P.J.F. and W.C.; software, T.C., M.J. and W.C.; validation, T.C., M.C.-G., P.J.F. and W.C.; formal analysis, T.C., M.C.-G., P.J.F. and W.C.; investigation, T.C., Y.C., J.G. and M.J.; resources, W.C.; data curation, T.C. and W.C.; writing—original draft preparation, T.C., Y.C., J.G., M.C.-G., P.J.F. and W.C.; writing—review and editing, T.C., M.C.-G., P.J.F. and W.C.; supervision, M.C.-G., P.J.F. and W.C.; project administration, W.C.; funding acquisition, W.C. All authors have read and agreed to the published version of the manuscript.

Funding

This research was funded by the project “Cheese-tester: multisensor dielectrico para el monitoreo de maduración de queso tipo suizo”, financed by Agreement No. PE501086869-2024—CONCYTEC.

Data Availability Statement

The original contributions presented in this study are included in the article. Further inquiries can be directed to the corresponding author.

Acknowledgments

The authors are grateful for the support given to this work by the project “Cheese-tester: multisensor dielectrico para el monitoreo de maduración de queso tipo suizo”, financed by Agreement No. PE501086869-2024—CONCYTEC. Additional support was received from the project “Creation of the Food Safety Research Laboratory” at the Universidad Nacional de Frontera, funded under the Unique Investment Code No. 2439545.

Conflicts of Interest

The authors declare no conflicts of interest.

References

  1. Consonni, R.; Cagliani, L. Ripening and geographical characterization of Parmigiano Reggiano cheese by 1H NMR spectroscopy. Talanta 2008, 76, 200–205. [Google Scholar] [CrossRef] [Scilit] [PubMed]
  2. García Varela, A.M.; Costa, W.P.d.; Batista, D.R.O.; Carvalho, V.S.; Piura, W.P.; Cunha Júnior, L.C. Assessment of industrial cheese ripening using near infrared spectroscopy technique: A scoping review protocol. PLoS ONE 2025, 20, e0335523. [Google Scholar] [CrossRef] [Scilit] [PubMed]
  3. Kraggerud, H.; Næs, T.; Abrahamsen, R.K. Prediction of sensory quality of cheese during ripening from chemical and spectroscopy measurements. Int. Dairy J. 2014, 34, 6–18. [Google Scholar] [CrossRef] [Scilit]
  4. Coker, C.; Crawford, R.; Johnston, K.; Singh, H.; Creamer, L. Towards the classification of cheese variety and maturity on the basis of statistical analysis of proteolysis data—A review. Int. Dairy J. 2005, 15, 631–643. [Google Scholar] [CrossRef] [Scilit]
  5. Aprea, E.; Romanzin, A.; Corazzin, M.; Favotto, S.; Betta, E.; Gasperi, F.; Bovolenta, S. Effects of grazing cow diet on volatile compounds as well as physicochemical and sensory characteristics of 12-month-ripened Montasio cheese. J. Dairy Sci. 2016, 99, 6180–6190. [Google Scholar] [CrossRef] [Scilit]
  6. Chen, Y.; MacNaughtan, W.; Jones, P.; Yang, Q.; Williams, H.; Foster, T. Selection of potential molecular markers for cheese ripening and quality prediction by NMR spectroscopy. LWT 2021, 136, 110306. [Google Scholar] [CrossRef] [Scilit]
  7. del Campo, S.M.; Picque, D.; Cosío-Ramírez, R.; Corrieu, G. Middle infrared spectroscopy characterization of ripening stages of Camembert-type cheeses. Int. Dairy J. 2007, 17, 835–845. [Google Scholar] [CrossRef] [Scilit]
  8. Downey, G.; Sheehan, E.; Delahunty, C.; O’Callaghan, D.; Guinee, T.; Howard, V. Prediction of maturity and sensory attributes of Cheddar cheese using near-infrared spectroscopy. Int. Dairy J. 2005, 15, 701–709. [Google Scholar] [CrossRef] [Scilit]
  9. Seratlic, S.; Guha, B.; Moore, S. Advances in Spectroscopic Methods for Predicting Cheddar Cheese Maturity: A Review of FT-IR, NIR, and NMR Techniques. NDT 2024, 2, 392–416. [Google Scholar] [CrossRef] [Scilit]
  10. Shi, H.; Guo, J.; Yang, X.; Han, X.; He, J.; Zhang, J.; Wu, R.; Wu, J. Production of unsaturated fatty acids in an internal-ripened cheese. Food Res. Int. 2026, 227, 118308. [Google Scholar] [CrossRef] [Scilit]
  11. Leclercq-Perlat, M.N.; Saint-Eve, A.; Picque, D.; Trelea, I.C. Microbiological, physicochemical, and sensory changes throughout ripening of an experimental soft smear-ripened cheese in relation to salt concentrations. J. Dairy Sci. 2024, 107, 6393–6411. [Google Scholar] [CrossRef] [Scilit] [PubMed]
  12. Ferraz, A.R.; Pintado, C.S.; Serralheiro, M.L. A Global Review of Cheese Colour: Microbial Discolouration and Innovation Opportunities. Dairy 2024, 5, 768–785. [Google Scholar] [CrossRef] [Scilit]
  13. Astuti, F.; Setyawardani, T.; Santosa, S. The physical characteristics of cheese made of milk, colostrum and both during the ripening. J. Indones. Trop. Anim. Agric. 2021, 46, 75–83. [Google Scholar] [CrossRef] [Scilit]
  14. D’Incecco, P.; Limbo, S.; Hogenboom, J.; Rosi, V.; Gobbi, S.; Pellegrino, L. Impact of Extending Hard-Cheese Ripening: A Multiparameter Characterization of Parmigiano Reggiano Cheese Ripened up to 50 Months. Foods 2020, 9, 268. [Google Scholar] [CrossRef] [Scilit]
  15. Priyashantha, H.; Höjer, A.; Saedén, K.H.; Lundh, Å.; Johansson, M.; Bernes, G.; Geladi, P.; Hetta, M. Use of near-infrared hyperspectral (NIR-HS) imaging to visualize and model the maturity of long-ripening hard cheeses. J. Food Eng. 2020, 264, 109687. [Google Scholar] [CrossRef] [Scilit]
  16. Dewantier, G.R.; Torley, P.J.; Blanch, E.W. Identifying Chemical Differences in Cheddar Cheese Based on Maturity Level and Manufacturer Using Vibrational Spectroscopy and Chemometrics. Molecules 2023, 28, 8051. [Google Scholar] [CrossRef] [Scilit]
  17. Amamcharla, J.; Metzger, L. Prediction of process cheese instrumental texture and melting characteristics using dielectric spectroscopy and chemometrics. J. Dairy Sci. 2015, 98, 6004–6013. [Google Scholar] [CrossRef] [Scilit]
  18. Fagan, C.C.; Everard, C.; O’Donnell, C.P.; Downey, G.; O’Callaghan, D.J. Prediction of Inorganic Salt and Moisture Content of Process Cheese Using Dielectric Spectroscopy. Int. J. Food Prop. 2005, 8, 543–557. [Google Scholar] [CrossRef] [Scilit]
  19. Castro, W.; Saavedra, M.; Castro, J.; Tech, A.R.B.; Chuquizuta, T.; Avila-George, H. Using recurrent neural networks to identify broken-cold-chain fish fillet from spectral profiles. Neural Comput. Appl. 2024, 36, 4377–4386. [Google Scholar] [CrossRef] [Scilit]
  20. Ozaki, Y.; Genkawa, T.; Futami, Y. Near-Infrared Spectroscopy. In Encyclopedia of Spectroscopy and Spectrometry, 3rd ed.; Lindon, J.C., Tranter, G.E., Koppenaal, D.W., Eds.; Academic Press: Oxford, UK, 2017; pp. 40–49. [Google Scholar] [CrossRef] [Scilit]
  21. Alinaghi, M.; Nilsson, D.; Singh, N.; Höjer, A.; Saedén, K.H.; Trygg, J. Near-infrared hyperspectral image analysis for monitoring the cheese-ripening process. J. Dairy Sci. 2023, 106, 7407–7418. [Google Scholar] [CrossRef] [Scilit]
  22. Darnay, L.; Králik, F.; Oros, G.; Koncz, Á.; Firtha, F. Monitoring the effect of transglutaminase in semi-hard cheese during ripening by hyperspectral imaging. J. Food Eng. 2017, 196, 123–129. [Google Scholar] [CrossRef] [Scilit]
  23. Mazerolles, G.; Devaux, M.-F.; Duboz, G.; Duployer, M.-H.; Riou, N.M.; Dufour, É. Infrared and fluorescence spectroscopy for monitoring protein structure and interaction changes during cheese ripening. Lait 2001, 81, 509–527. [Google Scholar] [CrossRef] [Scilit]
  24. Beć, K.B.; Grabska, J.; Huck, C.W. Principles and applications of miniaturized near-infrared (NIR) spectrometers. Chem.—Eur. J. 2021, 27, 1514–1532. [Google Scholar] [CrossRef] [Scilit] [PubMed]
  25. Reis, M.G.; Agnew, M.; Jacob, N.; Reis, M.M. Comparative evaluation of miniaturized and conventional NIR spectrophotometer for estimation of fatty acids in cheeses. Spectrochim. Acta Part A Mol. Biomol. Spectrosc. 2022, 279, 121433. [Google Scholar] [CrossRef] [Scilit]
  26. Malegori, C.; Oliveri, P.; Mustorgi, E.; Boggiani, M.A.; Pastorini, G.; Casale, M. An in-depth study of cheese ripening by means of NIR hyperspectral imaging: Spatial mapping of dehydration, proteolysis and lipolysis. Food Chem. 2021, 343, 128547. [Google Scholar] [CrossRef] [Scilit]
  27. Tomas-Egea, J.A.; Castro-Giraldez, M.; Colom, R.J.; Fito, P.J. New technique for determining the critical freezing temperatures of chicken breast based on radiofrequency photospectrometry. J. Food Eng. 2022, 333, 111155. [Google Scholar] [CrossRef] [Scilit]
  28. Reyes, A.; Yarlequé, M.; Castro, W.; Chuquizuta, S. Determination of dielectric properties of the red delicious apple and its correlation with quality parameters. In 2017 Progress in Electromagnetics Research Symposium-Fall (PIERS-FALL); IEEE: Piscataway, NJ, USA, 2017; pp. 2067–2072. [Google Scholar]
  29. Chuquizuta, T.; Castro, W.; Castro-Giraldez, M.; Fito, P. Non-invasive monitoring of goldenberry freezing using infrared thermography and radiofrequency dielectric spectroscopy. Innov. Food Sci. Emerg. Technol. 2025, 104, 104134. [Google Scholar] [CrossRef] [Scilit]
  30. Kumari, K.; Chakraborty, S.; Kishore, A.; John, H.; Sinha, C. Dielectric Spectroscopy: Process and Quality Monitoring of Dairy Products: A Review. Agric. Res. 2025, 14, 47–69. [Google Scholar] [CrossRef] [Scilit]
  31. Parhi, A.; Verma, A.; Nair, P.K.; Sharma, P. Invited Review: Manufacture and quality control of mozzarella cheese—Scientific and technological advances. J. Dairy Sci. 2025, 108, 11802–11823. [Google Scholar] [CrossRef] [Scilit]
  32. Smith, J.; Carr, A.; Golding, M.; Reid, D.; Zhang, L. Assessing the use of dielectric spectroscopy to analyse calcium induced compositional and structural changes in a model cheese. Procedia Food Sci. 2011, 1, 1833–1840. [Google Scholar] [CrossRef] [Scilit]
  33. Chuquizuta, T.; Peralta, M.; Medina, S.; Arteaga, H.; Oblitas, J.; Chavez, S.G.; Castro, W.; Castro-Giraldez, M.; Fito, P.J. Dielectric spectroscopy for the prediction of pork quality during the post-mortem time. J. Food Compos. Anal. 2025, 148, 108128. [Google Scholar] [CrossRef] [Scilit]
  34. Velázquez-Varela, J.; Castro-Giraldez, M.; Cuibus, L.; Tomas-Egea, J.; Socaciu, C.; Fito, P. Study of the cheese salting process by dielectric properties at microwave frequencies. J. Food Eng. 2018, 224, 121–128. [Google Scholar] [CrossRef] [Scilit]
  35. Everard, C.; Fagan, C.; O’Donnell, C.; O’Callaghan, D.; Lyng, J. Dielectric properties of process cheese from 0.3 to 3 GHz. J. Food Eng. 2006, 75, 415–422. [Google Scholar] [CrossRef] [Scilit]
  36. Kumari, K.; Chakraborty, S.K.; Sudhakar, A.; Kishore, A. Dielectric spectroscopy-based characterisation of different types of Paneer (Indian cottage cheese) in terms of texture, microstructure and functional groups. Int. J. Dairy Technol. 2023, 76, 4–14. [Google Scholar] [CrossRef] [Scilit]
  37. Kubis, I.; Krivanek, I.; Gajdusek, S. The relationships between the chemical, dielectric and sensory properties of Edam cheese during ripening. Czech J. Food Sci. 2001, 19, 85–89. [Google Scholar] [CrossRef] [Scilit]
  38. Dobozi, R.; Jákói, Z.P.; Csanádi, J.; Beszédes, S. Investigating the Acid- and Enzyme-Induced Coagulation of Raw Milk Using Dielectric and Rheological Measurements. Appl. Sci. 2023, 13, 6185. [Google Scholar] [CrossRef] [Scilit]
  39. Cevoli, C.; Ragni, L.; Gori, A.; Berardinelli, A.; Caboni, M.F. Quality parameter assessment of grated Parmigiano–Reggiano cheese by waveguide spectroscopy. J. Food Eng. 2012, 113, 201–209. [Google Scholar] [CrossRef] [Scilit]
  40. Xiang, Q.; Xia, Y.; Song, J.; Nazmus Saqib, M.; Zhong, F. Characterization of the key nonvolatile metabolites in Cheddar cheese by partial least squares regression (PLSR), reconstitution, and omission. Food Chem. 2023, 403, 134034. [Google Scholar] [CrossRef] [Scilit]
  41. Castro, W.; Oblitas, J.; Nuñez, L.; Yoplac, I.; Avila-George, H.; De-la Torre, M. Adulterant estimation in paprika powder using deep learning and chemometrics through near-infrared spectroscopy. Neural Comput. Appl. 2024, 36, 14263–14273. [Google Scholar] [CrossRef] [Scilit]
  42. Oblitas-Cruz, J.; Cieza-Rimarachin, Y.; Cruz-Oblitas, J. Evaluation of the maturation of Swiss-type cheese in a prototype system of NIR spectroscopy and artificial intelligence; [Evaluación de la maduración de queso tipo suizo en un sistema prototipo de espectroscopía NIR e inteligencia artificial]. In Proceedings of the LACCEI International Multi-Conference for Engineering, Education and Technology, Mexico City, Mexico, 16–18 July 2025. [Google Scholar] [CrossRef] [Scilit]
  43. Castro, W.; Gamboa, P.; Ruiz-Mejía, L.; Arce, T.; Avila-George, H.; Chuquizuta, T. Dataset of dielectric spectra and physicochemical parameters of Creole chicken breast meat. Data Brief 2025, 63, 112183. [Google Scholar] [CrossRef] [Scilit]
  44. Çavdaroğlu, E.; Topçuoğlu, M.; Koşar, D.; Acar, E.; Polat, N.Y.; Berk, B.; Çavdaroğlu, Ç.; Yemenicioğlu, A. Harnessing pulse proteins as soy protein substitutes in spreadable cheese analogues: Exploring correlations among protein techno-functionality, and cheese textural, rheological and sensory properties. Food Hydrocoll. 2026, 171, 111780. [Google Scholar] [CrossRef] [Scilit]
  45. Sultana, T.; Adib, S.S.; Al Emam, M.; Imran, A.; Oishee, F.F.; ur Rashid, M.H.; Abunaser, M.; Islam, M.A. Characterization of artisanal Bangladeshi Austagram cheese: Physicochemical, colour, textural, sensorial, and functional properties. Int. Dairy J. 2025, 166, 106226. [Google Scholar] [CrossRef] [Scilit]
  46. Milovanovic, B.; Djekic, I.; Miocinovic, J.; Djordjevic, V.; Lorenzo, J.M.; Barba, F.J.; Mörlein, D.; Tomasevic, I. What Is the Color of Milk and Dairy Products and How Is It Measured? Foods 2020, 9, 1629. [Google Scholar] [CrossRef] [Scilit] [PubMed]
  47. Metzger, L.; Barbano, D.; Rudan, M.; Kindstedt, P.; Guo, M. Whiteness Change During Heating and Cooling of Mozzarella Cheese. J. Dairy Sci. 2000, 83, 1–10. [Google Scholar] [CrossRef] [Scilit] [PubMed]
  48. Kayihura, J.F. Partitioning of casein and fat in Cheddar cheese manufacturing as affected by cheese milk standardisation: A review. Int. J. Dairy Technol. 2024, 77, 35–49. [Google Scholar] [CrossRef] [Scilit]
  49. Raak, N.; Pedersen, J.S.; Corredig, M. Structural and colloidal changes of casein micelles induced by membrane concentration and their dependence on the milieu exchange conditions. Colloids Surf. A Physicochem. Eng. Asp. 2023, 670, 131580. [Google Scholar] [CrossRef] [Scilit]
  50. Marchesini, G.; Balzan, S.; Segato, S.; Novelli, E.; Andrighetto, I. Colour traits in the evaluation of the ripening period of Asiago cheese. Ital. J. Anim. Sci. 2009, 8, 411–413. [Google Scholar] [CrossRef] [Scilit]
  51. Nedomová, Š.; Kilián, L.; Pytel, R.; Kumbár, V. Effect of ripening time on colour and texture properties in cheese. Slovak J. Food Sci. 2017, 11, 296–301. [Google Scholar] [CrossRef] [Scilit]
  52. Esmaeilzadeh, P.; Mizani, M.; Ehsani, M.R.; Givianrad, M.H. Characterization of a traditional ripened cheese, Kurdish Kope cheese: Proteolysis, microstructural, and rheological characteristics. J. Food Sci. 2025, 90, e70107. [Google Scholar] [CrossRef] [Scilit]
  53. Khattab, A.R.; Guirguis, H.A.; Tawfik, S.M.; Farag, M.A. Cheese ripening: A review on modern technologies towards flavor enhancement, process acceleration and improved quality assessment. Trends Food Sci. Technol. 2019, 88, 343–360. [Google Scholar] [CrossRef] [Scilit]
  54. Thomareis, A.S.; Chatziantoniou, S.E. Chapter 13—Quality and testing of processed cheese: Defects, QA, and QC. In Processed Cheese Science and Technology; El-Bakry, M., Mehta, B.M., Eds.; Woodhead Publishing: Cambridge, UK, 2022; pp. 349–426. [Google Scholar] [CrossRef] [Scilit]
  55. da Silva Medeiros, M.L.; Freitas Lima, A.; Correia Gonçalves, M.; Teixeira Godoy, H.; Fernandes Barbin, D. Portable near-infrared (NIR) spectrometer and chemometrics for rapid identification of butter cheese adulteration. Food Chem. 2023, 425, 136461. [Google Scholar] [CrossRef] [Scilit]
  56. Lénárt, J.; Szigedi, T.; Dernovics, M.; Fodor, M. Application of FT-NIR spectroscopy on the determination of the fat and protein contents of lyophilized cheeses. Acta Aliment. 2012, 41, 351–362. [Google Scholar] [CrossRef] [Scilit]
  57. Hourant, P.; Baeten, V.; Morales, M.T.; Meurens, M.; Aparicio, R. Oil and Fat Classification by Selected Bands of Near-Infrared Spectroscopy. Appl. Spectrosc. 2000, 54, 1168–1174. [Google Scholar] [CrossRef] [Scilit]
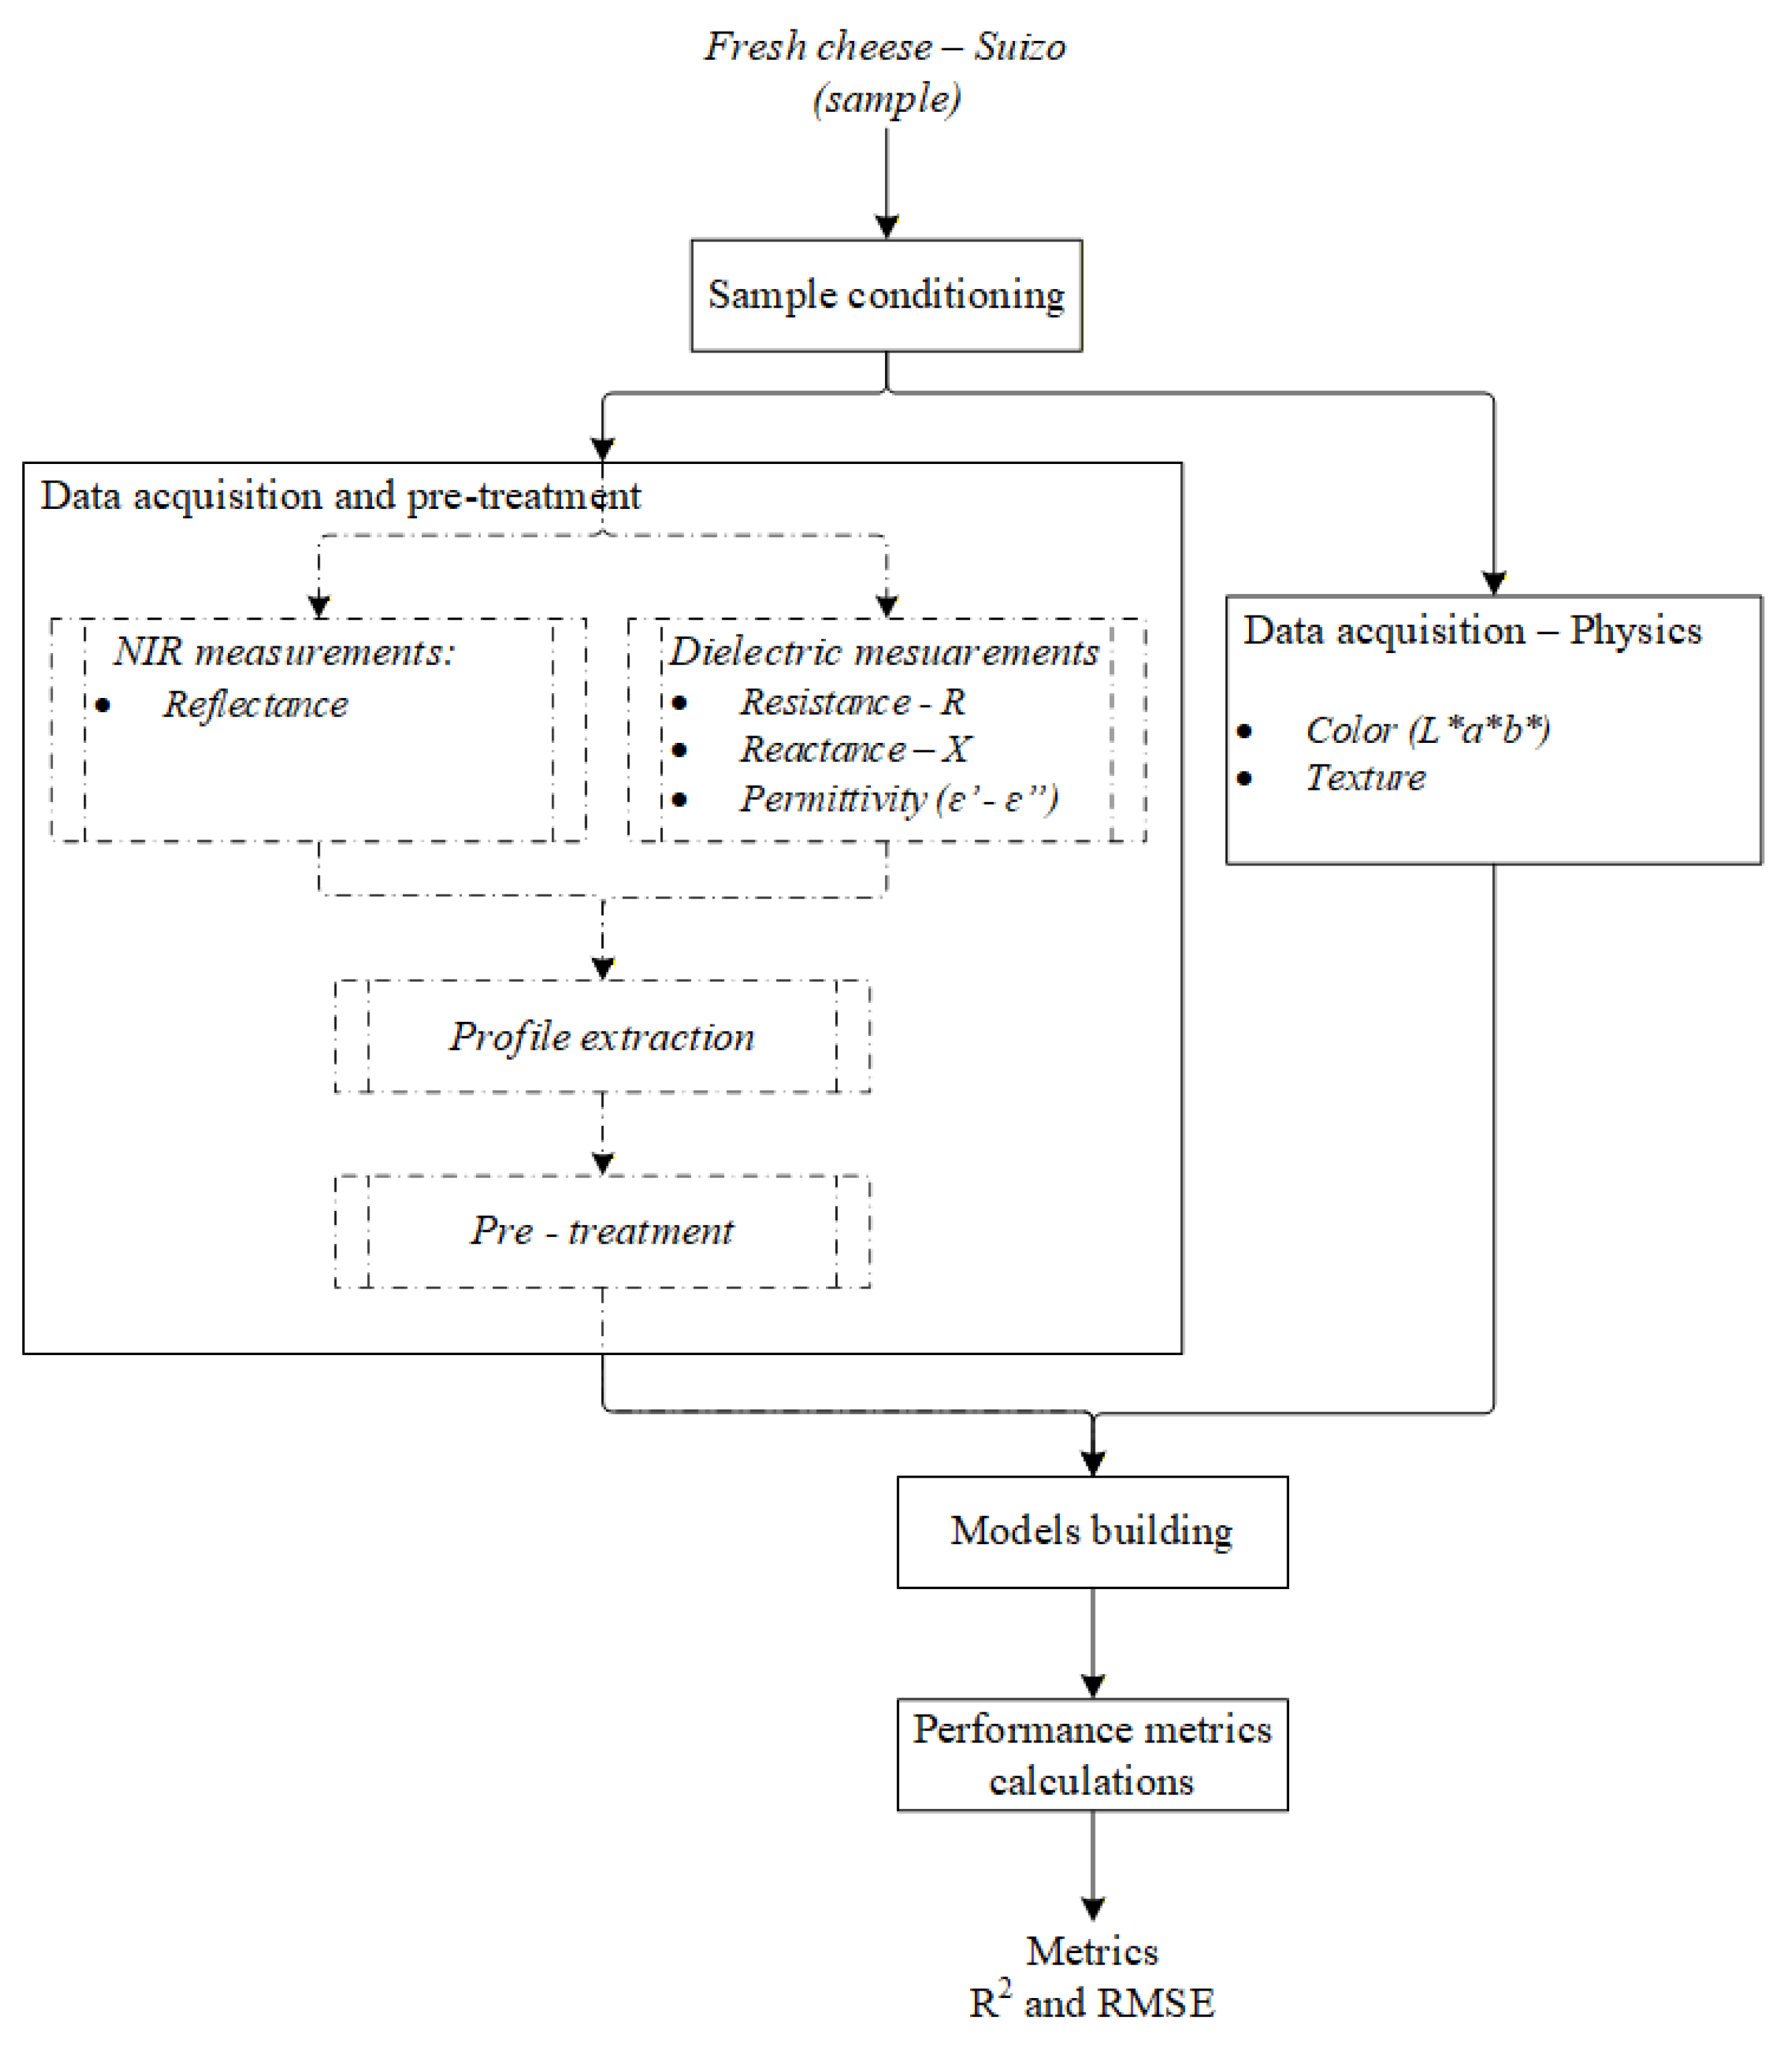
Figure 1. Experimental procedure for monitoring the maturation of Swiss cheese.
Processes 14 01022 g001
Figure 2. Evaluation of maturation parameters: (a) color parameters; (b) firmness. a,b,c,d Different letter indicates different homogeneous group.
Processes 14 01022 g002
Figure 3. Mean spectral profiles ((A): NIR, (B): Dielectric constant).
Processes 14 01022 g003
Figure 4. PCA scores of butter-based cheese maturation ((A): NIR spectroscopy and (B): dielectric spectroscopy).
Processes 14 01022 g004
Figure 5. Graphs of predicted vs. reference values using calibration samples obtained by PLSR for NIR spectroscopy (AE) and dielectric spectroscopy (FJ).
Processes 14 01022 g005
Table 1. Mean values for color and textural characteristics.
ParameterDays
15304560
CIE L85.14 ± 1.59 a85.5 ± 0.51 a81.82 ± 1.08 b78.2 ± 4.53 c
CIE a*0.52 ± 0.19 a0.67 ± 0.13 a2.73 ± 0.34 b2.88 ± 0.36 b
CIE b*17.22 ± 0.16 a17.84 ± 0.50 a21.06 ± 0.6 a21.95 ± 1.15 a
Firmess (g/mm)754.58 ± 121.53 a937.76 ± 57.68 b934.52 ± 88.5 c1074.09 ± 74.68 d
a,b,c,d Different letter indicates different homogeneous group.
Table 2. Descriptive analysis of prediction indicators for NIR and dielectric spectroscopy models.
VariableNIRDS ( ε )
R cv 2 RMSE cv R cv 2 RMSE cv
Days 0.827 ± 0.09 7.242 ± 0.95 0.999 ± 0.04 0.219 ± 0.09
L * 0.679 ± 0.07 2.38 ± 0.05 0.912 ± 0.06 1.184 ± 0.09
a * 0.764 ± 0.07 0.609 ± 0.05 0.983 ± 0.05 0.163 ± 0.05
b * 0.891 ± 0.08 0.731 ± 0.06 0.982 ± 0.05 0.308 ± 0.02
Firmness 0.607 ± 0.07 97.244 ± 8.37 0.625 ± 0.05 91.094 ± 5.24
Disclaimer/Publisher’s Note: The statements, opinions and data contained in all publications are solely those of the individual author(s) and contributor(s) and not of MDPI and/or the editor(s). MDPI and/or the editor(s) disclaim responsibility for any injury to people or property resulting from any ideas, methods, instructions or products referred to in the content.