Article

CFD Investigation of CO2 Capture Process with K2CO3 Sorbents in a Bubbling Fluidized Bed

1
College of Electromechanical Engineering, Qingdao University of Science and Technology, Qingdao 266061, China
2
State Key Laboratory of Mesoscience and Engineering, Institute of Process Engineering, Chinese Academy of Sciences, Beijing 100190, China
3
School of Chemical Engineering, University of Chinese Academy of Sciences, Beijing 100049, China
4
China Resources Zizhu Pharmaceutical Co., Ltd., Beijing 100024, China
*
Authors to whom correspondence should be addressed.
Processes 2026, 14(6), 1003; https://doi.org/10.3390/pr14061003
Submission received: 6 March 2026 / Revised: 18 March 2026 / Accepted: 18 March 2026 / Published: 21 March 2026
(This article belongs to the Section Chemical Processes and Systems)

Abstract

This study employs a Computational Fluid Dynamics (CFD) approach based on the Two-Fluid Model (TFM) to investigate the CO2 capture characteristics in a bubbling fluidized bed reactor using potassium carbonate (K2CO3) as the sorbent. The simulations are conducted at five superficial gas velocities ranging from 1.5 to 3.5 times the minimum bubbling velocity (umb = 0.26 m/s), with a particle diameter of 0.4 mm, particle density of 2300 kg/m3, and an initial solid volume fraction of 0.55. The gas mixture consists of CO2, H2O, and N2 at a molar ratio of 0.1:0.1:0.8 and a temperature of 343 K. First, the numerical simulation was validated against experimental data reported in the literature, confirming its accuracy in quantitatively describing the adsorption process. Subsequently, the distributions of CO2 concentration and adsorption reaction rate in both the bubble phase and the emulsion phase were analyzed under different superficial gas velocities. The simulation results indicate that CO2 concentration and adsorption reaction rate in both phases decrease along the bed height. Compared to the emulsion phase, the bubble phase exhibits higher CO2 concentration and gas temperature but a lower adsorption reaction rate. As the gas velocity increases, CO2 concentration rises in both the bubble and emulsion phases, accompanied by an increase in the proportion of the bubble phase, and a higher CO2 concentration at the reactor outlet. Further comparison of CO2 concentrations in the bubble and emulsion phases at the upper part of the bed with the outlet concentration reveals that the outlet CO2 primarily originates from the unadsorbed portion within the bubble phase, while the contribution from unadsorbed CO2 in the emulsion phase is almost negligible.

1. Introduction

The rapid development of industrialized economies has brought about significant challenges, particularly regarding global warming, which is increasingly affecting people worldwide. The greenhouse effect, primarily driven by excessive CO2 emissions, is now recognized as a major contributor to contemporary climate change [1,2]. In response to growing concerns over global warming, attention has shifted towards strategies aimed at reducing CO2 emissions [3,4]. One promising approach involves replacing carbon-based fuels with clean energy sources to achieve energy conservation and emission reduction goals. However, this transition requires substantial time and financial investment, making it a challenging task in the short term [5]. Carbon Capture and Storage (CCS) technology offers a flexible approach to reduce greenhouse gas emissions and could potentially lower overall mitigation costs. As a result, CCS is considered an effective solution for mitigating CO2 emissions [6]. Among CCS technologies, post-combustion capture has garnered significant scholarly attention due to its use of both physical and chemical methods to capture CO2 emissions [7]. Alkali metal-based sorbents offer the benefits of both chemical and physical adsorption in the CO2 capture process [8,9]. Alkali metal-based sorbents help overcome the limitations of chemical adsorption, such as equipment corrosion and high energy demands during sorbent regeneration, while addressing the drawbacks of physical adsorption, including low adsorption capacity and poor CO2 selectivity [10,11,12]. Specifically, potassium carbonate (K2CO3) is widely used in post-combustion CO2 capture for large-volume flue gas streams because of its low cost, reduced energy requirements, and suitability for moderate- to low-temperature operations [13]. And different types of reactors based on potassium carbonate have been proposed [14,15,16,17,18]. Among the various reactor configurations, the bubbling fluidized bed (BFB) reactors have attracted considerable research attention from researchers due to its enhanced gas–solid phase mixing and superior heat and mass transfer characteristics [19].
With the continuous advancement of mathematical methods and significant improvements in computational capabilities, Computational Fluid Dynamics (CFD) has become an invaluable tool in investigating the CO2 capture process. Nouri et al. [20] explored CO2 removal from flue gas using alkali metal-based sorbents with the Two-Fluid Model (TFM), examining how factors like gas velocity and solid sorbent flux impact CO2 capture efficiency. Their findings showed that reducing the dry gas velocity and increasing the solid sorbent flux improved CO2 capture efficiency. Chalermsinsuwan et al. [21] investigated the effects of inlet gas velocity, particle size, and K2CO3 loading on CO2 capture in a Circulating Fluidized Bed (CFB) reactor. Their TFM simulation results indicated that K2CO3 loading and gas velocity were pivotal in determining CO2 capture performance. Thummakul et al. [22] analyzed the impact of inlet gas velocity and reactant concentration on CO2 capture in a Circulating Turbulent Fluidized Bed (CTFB) reactor using the TFM approach. Their simulations identified optimal operating parameters—specifically, a combination of high CO2 and H2O concentrations—that led to the highest CO2 removal efficiency (93.4%) at elevated inlet gas velocities. Shen et al. [23] numerically investigated CO2 capture in reactors integrating bubbling transport and bubbling fluidized beds. Their findings showed that increasing sorbent circulation rate and steam concentration enhanced CO2 capture efficiency. Wang et al. [24] examined the impact of particle clustering on chemical reaction simulations in a CFB reactor using the TFM. Their study revealed that non-uniform particle distribution due to clustering significantly influenced CO2 capture efficiency, with the dense phase being more favorable for reactions than the lean phase. Zhang et al. [25] used a CFD-DEM model to investigate CO2 capture by K2CO3 in a BFB reactor, analyzing gas flow, particle motion, and chemical reaction processes. Their results showed that CO2 concentration was lower near the wall compared to the bubble phase in the central zone. Additionally, they found that bubbles in the fluidized bed played a dual role: promoting mixing to enhance the reaction, while also acting as transient gas channels that could reduce reaction efficiency. Ayobi et al. [26] assessed the impact of H2O concentration on kinetic models using the TFM approach. Combining experimental and simulation data, they demonstrated that inlet CO2 and H2O concentrations significantly affected the chemical reaction, with kinetic models that incorporated H2O concentration in the reaction rate expression showing better agreement with experimental results.
In bubbling fluidized bed reactors, both the bubble phase and the emulsion phase coexist [27]. A portion of the gas flows through the bed as discrete bubbles, and the characteristics and spatiotemporal evolution of these bubbles significantly influence the heat and mass transfer between the gas and solid phases, which, in turn, governs the overall performance of the chemical reaction [28]. As a result, many researchers have explored the relationship between bubble dynamics and chemical reactions. Kong et al. [29] investigated the methanation process in a BFB reactor using a CFD-DEM approach, focusing on how parameters such as inlet gas velocity, particle size, and operating temperature affect bubble behavior. Their simulation results showed that reducing inlet gas velocity and operating temperature, while increasing particle size, led to a lower volume fraction of the bubble phase relative to the emulsion phase. This change enhanced interphase heat and mass transfer, which promoted a higher methane concentration in the product gas. Su et al. [30] simulated heat transfer in calcium looping for thermochemical energy storage, using CaCO3 with a CFD-DEM approach. Their findings indicated that heat transfer in the bubble phase fluctuated significantly compared to the emulsion phase, emphasizing the considerable impact of bubble dynamics on both heat transfer and the calcination reaction. Wang et al. [31] simulated the multiphase flow and thermochemical behaviors during char combustion in a BFB reactor. They demonstrated that bubbles significantly influence chemical reaction rates and product distribution by enhancing particle mixing, regulating mass transfer pathways, altering local reactant concentrations, and creating heterogeneous reaction zones. Wu et al. [32] used numerical simulations to investigate the interphase exchange effects between the bubble and emulsion phases under high-temperature conditions. Their results showed that pressure variations affected bubble characteristics—such as size, frequency, and velocity—which influenced reactant distribution. Furthermore, bubbles directly impacted the progression of chemical reactions through gas exchange behavior, facilitating mass transfer between the bubble and emulsion phases.
While numerical simulations have provided valuable insights into the relationship between bubble dynamics and heat and mass transfer characteristics in BFB, most studies on K2CO3-based CO2 capture bubbling fluidized bed systems have primarily focused on the macro-scale performance of reactors and strategies to enhance CO2 capture efficiency [33,34,35]. The detailed linkage between bubble dynamics and the CO2 adsorption performance within BFBs remains underexplored. A thorough understanding of how these factors interact is essential for optimizing and improving the design of BFB reactors for CO2 capture. To address this gap, this study uses the Eulerian–Eulerian Two-Fluid Model (TFM) to investigate the chemical reaction process of CO2 adsorption by potassium carbonate particles in a BFB. The study begins with model validation, which includes both hydrodynamic and chemical reaction processes. It then explores the effects of various operating conditions on gas–solid interactions within the BFB, establishing a relationship between bubble dynamics and chemical reactions. The findings aim to provide a solid theoretical foundation to enhance CO2 capture performance in these systems.

2. Mathematical Model

2.1. Gas–Solid Two-Phase Flow

Conservation at mass:
t ε s ρ s +   ·   ε s ρ s υ s = 0
t ε g ρ g +   ·   ε g ρ g υ g = 0
where i = g, s denotes the gas phase and solid phase, respectively; ε represents the volume fraction of each phase; and the constraint εg + εs = 1 holds. Where ρ denotes density, v represents the velocity vector.
Conservation of momentum:
t ( ε s ρ s v s ) +   ·   ( ε s ρ s v s v s ) = ε s p +   ·   τ s + ε s ρ s g + β g s ( v g v s )
t ( ε g ρ g v g ) +   ·   ( ε g ρ g v g v g ) = ε g p +   ·   τ g + ε g ρ g g β g s ( v g v s )
where τ is the stress tensor, expressed as
τ s = ε s μ s v s + ( v s ) T ε s ξ s 2 3 μ s   ·   v s I
τ g = ε g μ g v g + ( v g ) T ε g ξ g 2 3 μ g   ·   v g I
The solid phase pressure, solid phase shear viscosity and solid phase bulk viscosity are expressed as
p s = ε s ρ s Θ s 1 + 2 g 0 ε s ( 1 + e )
μ s = 10 ρ s d p π Θ s 96 g 0 ε s ( 1 + e ) 1 + 4 5 g 0 ε s ( 1 + e ) 2 + 4 5 ρ s d p g 0 ε s ( 1 + e ) Θ s π
ξ s = 4 3 ρ s d p g 0 ε s ( 1 + e ) Θ s π
g 0 = 1 ε s ε s , max 1 3 1
where β represents the gas–solid interphase drag coefficient, calculated using the Gidaspow drag model, and is expressed as
β = 150 ( 1 ε g ) 2 u g ε g d p 2 + 1.75 1 ε g d p | v g v s | ε g < 0.8 β = 3 4 C d ρ g ε g ( 1 ε g ) d p | v g v s | ε g 2.65 ε g 0.8
C d = 24 R e ( 1 + 0.45 R e 0.687 ) Re < 1000 C d = 0.44 Re 1000
R e = ρ g ε g | v g v s | d p μ g
Conservation of energy:
t ( ε s ρ s h s ) +   ·   ( ε s ρ s v s h s ) = ε s p t + τ s : v s + S s + Q g s
t ( ε g ρ g h g ) +   ·   ( ε g ρ g v g h g ) = ε g p t + τ g : v g + S g Q g s
where Qgs and Qsg describe the interphase heat exchange:
Q s g = Q g s = h s g ( T s T g ) = 6 k g ε s ε g Nu d p 2 ( T s T g )
Nu = ( 1 10 ε g + 5 ε g 2 ) 1 + 0.7 Re 0.2 Pr 0.333 + Re 0.7 1.33 2.4 ε g + 1.2 ε g 2
Conservation of species:
t ( ε s ρ s y i ) +   ·   ( ε s ρ s v s y i ) = ε s J i + r
t ( ε g ρ g y i ) +   ·   ( ε g ρ g v g y i ) = ε g J i + r

2.2. Chemical Reaction Model

The chemical reaction equation for K2CO3 capturing CO2 is
  K 2 CO 3 ( s ) + CO 2 ( g ) + H 2 O ( g ) 2 KHCO 3 ( s ) ,   Δ H 298 K = 145 kJ / ( gmol CO 2 )
The carbonation reaction is reversable. However, due to the lack of chemical reaction data for the regeneration of K2CO3 solid sorbent, following the relevant works reported in the literature [21,26,33,35], only the absorption reaction was considered in this work:
r = k reaction C CO 2 C H 2 O ε s
k reaction = 55 exp 3609 T g R
where CCO2 and CH2O denote the concentrations of carbon dioxide and water vapor, respectively, and R is the gas constant.

2.3. Simulation Setup

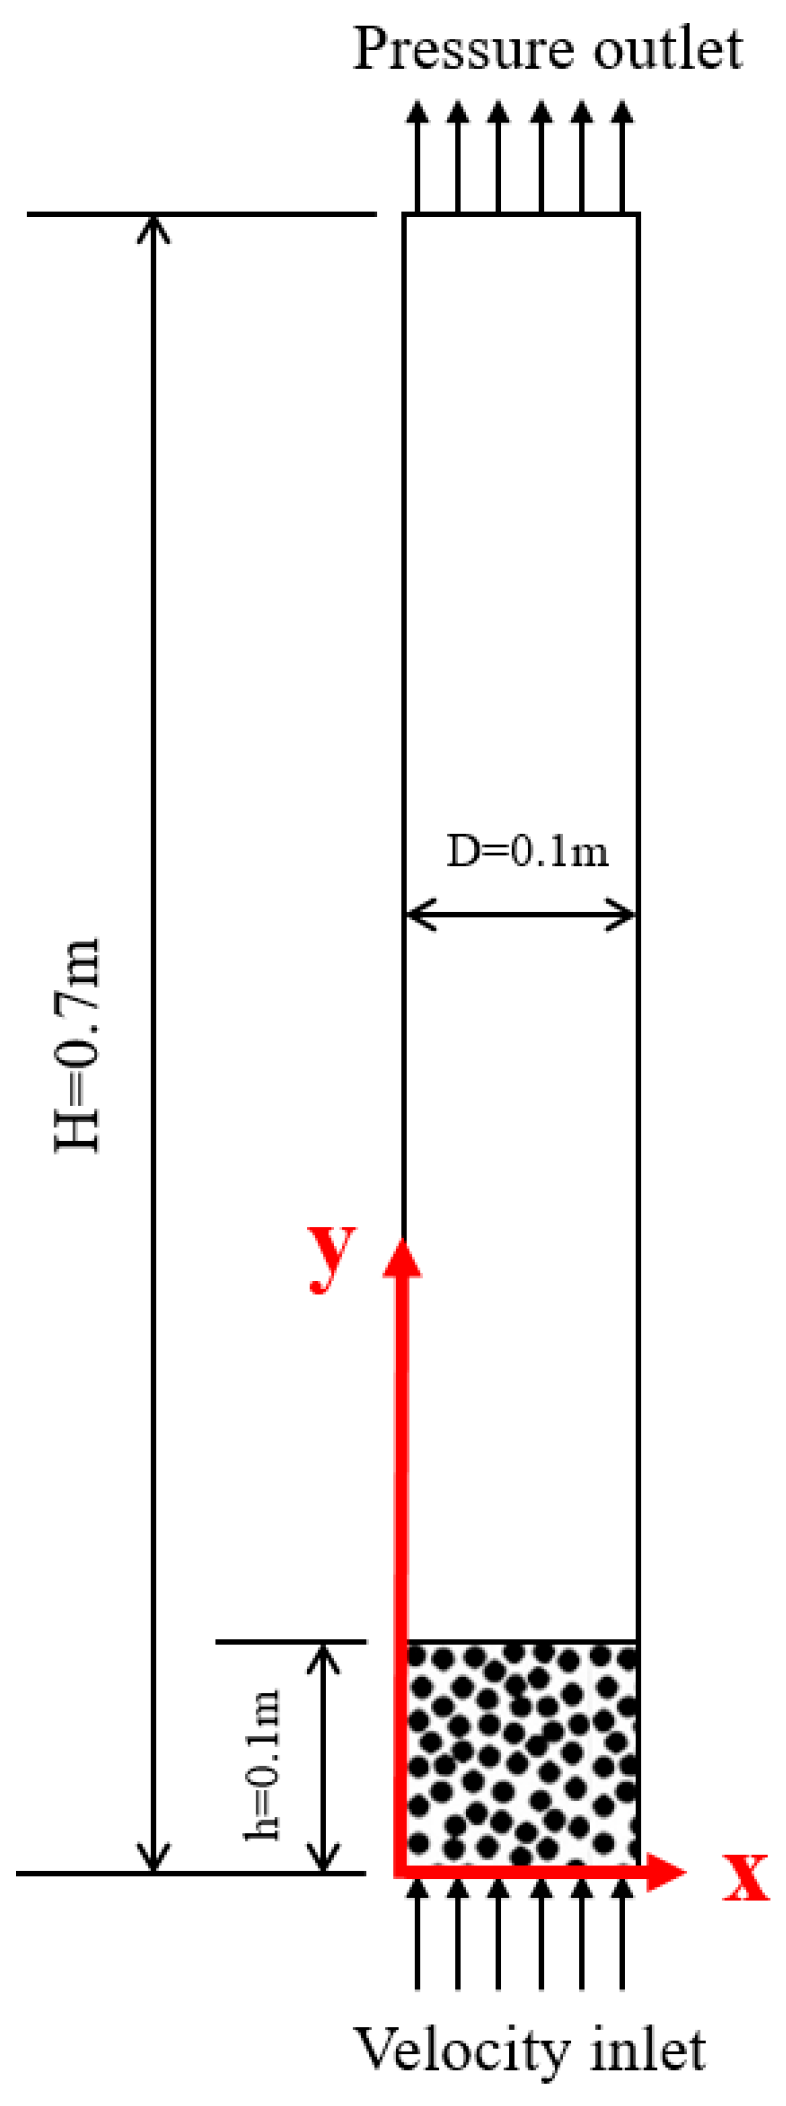
In this work, the adsorption process of CO2 in a BFB was investigated using the ANSYS FLUENT software (v.2022R2). Figure 1 presents a schematic diagram of the two-dimensional bubbling fluidized bed reactor used in this study. Two-dimensional (2D) BFB reactor with an inner diameter of 0.1 m and height of 0.7 m was considered. Initially, the bottom of the bed was patched with solids to an initial packing height of 0.1 m and a solid volume fraction of 0.55. The solid particles had a diameter of 0.4 mm and a density of 2300 kg/m3. The simulation domain was uniformly discretized using a grid size of 1 mm. As demonstrated in our previous work [36], this mesh resolution is sufficiently fine in yielding grid-independent results. The solids were first fluidized with N2 gas at a temperature of 343 K for 5 s. Subsequently, the inlet gas was switched to a gaseous mixture consisting of CO2, H2O and N2 with a molar ratio of 0.1:0.1:0.8 to initiate the adsorption reaction. The minimum fluidization velocity calculated based on the properties of the solids and the gaseous mixture umb is 0.26 m/s. Five fluidization velocities, 1.5 umb, 2.0 umb, 2.5 umb, 3.0 umb, and 3.5 umb, were considered in this work. In all the simulations, a uniform inlet velocity profile was specified for the gas phase at the bottom of the bed, and a constant pressure boundary condition was imposed at the upper outlet. No-slip boundary conditions were applied at the walls for the gas phase, while a partial slip boundary wall condition was employed for the solid phase. Table 1 summarizes the main parameter settings used in the simulation.

3. Results and Discussions

3.1. Model Validation

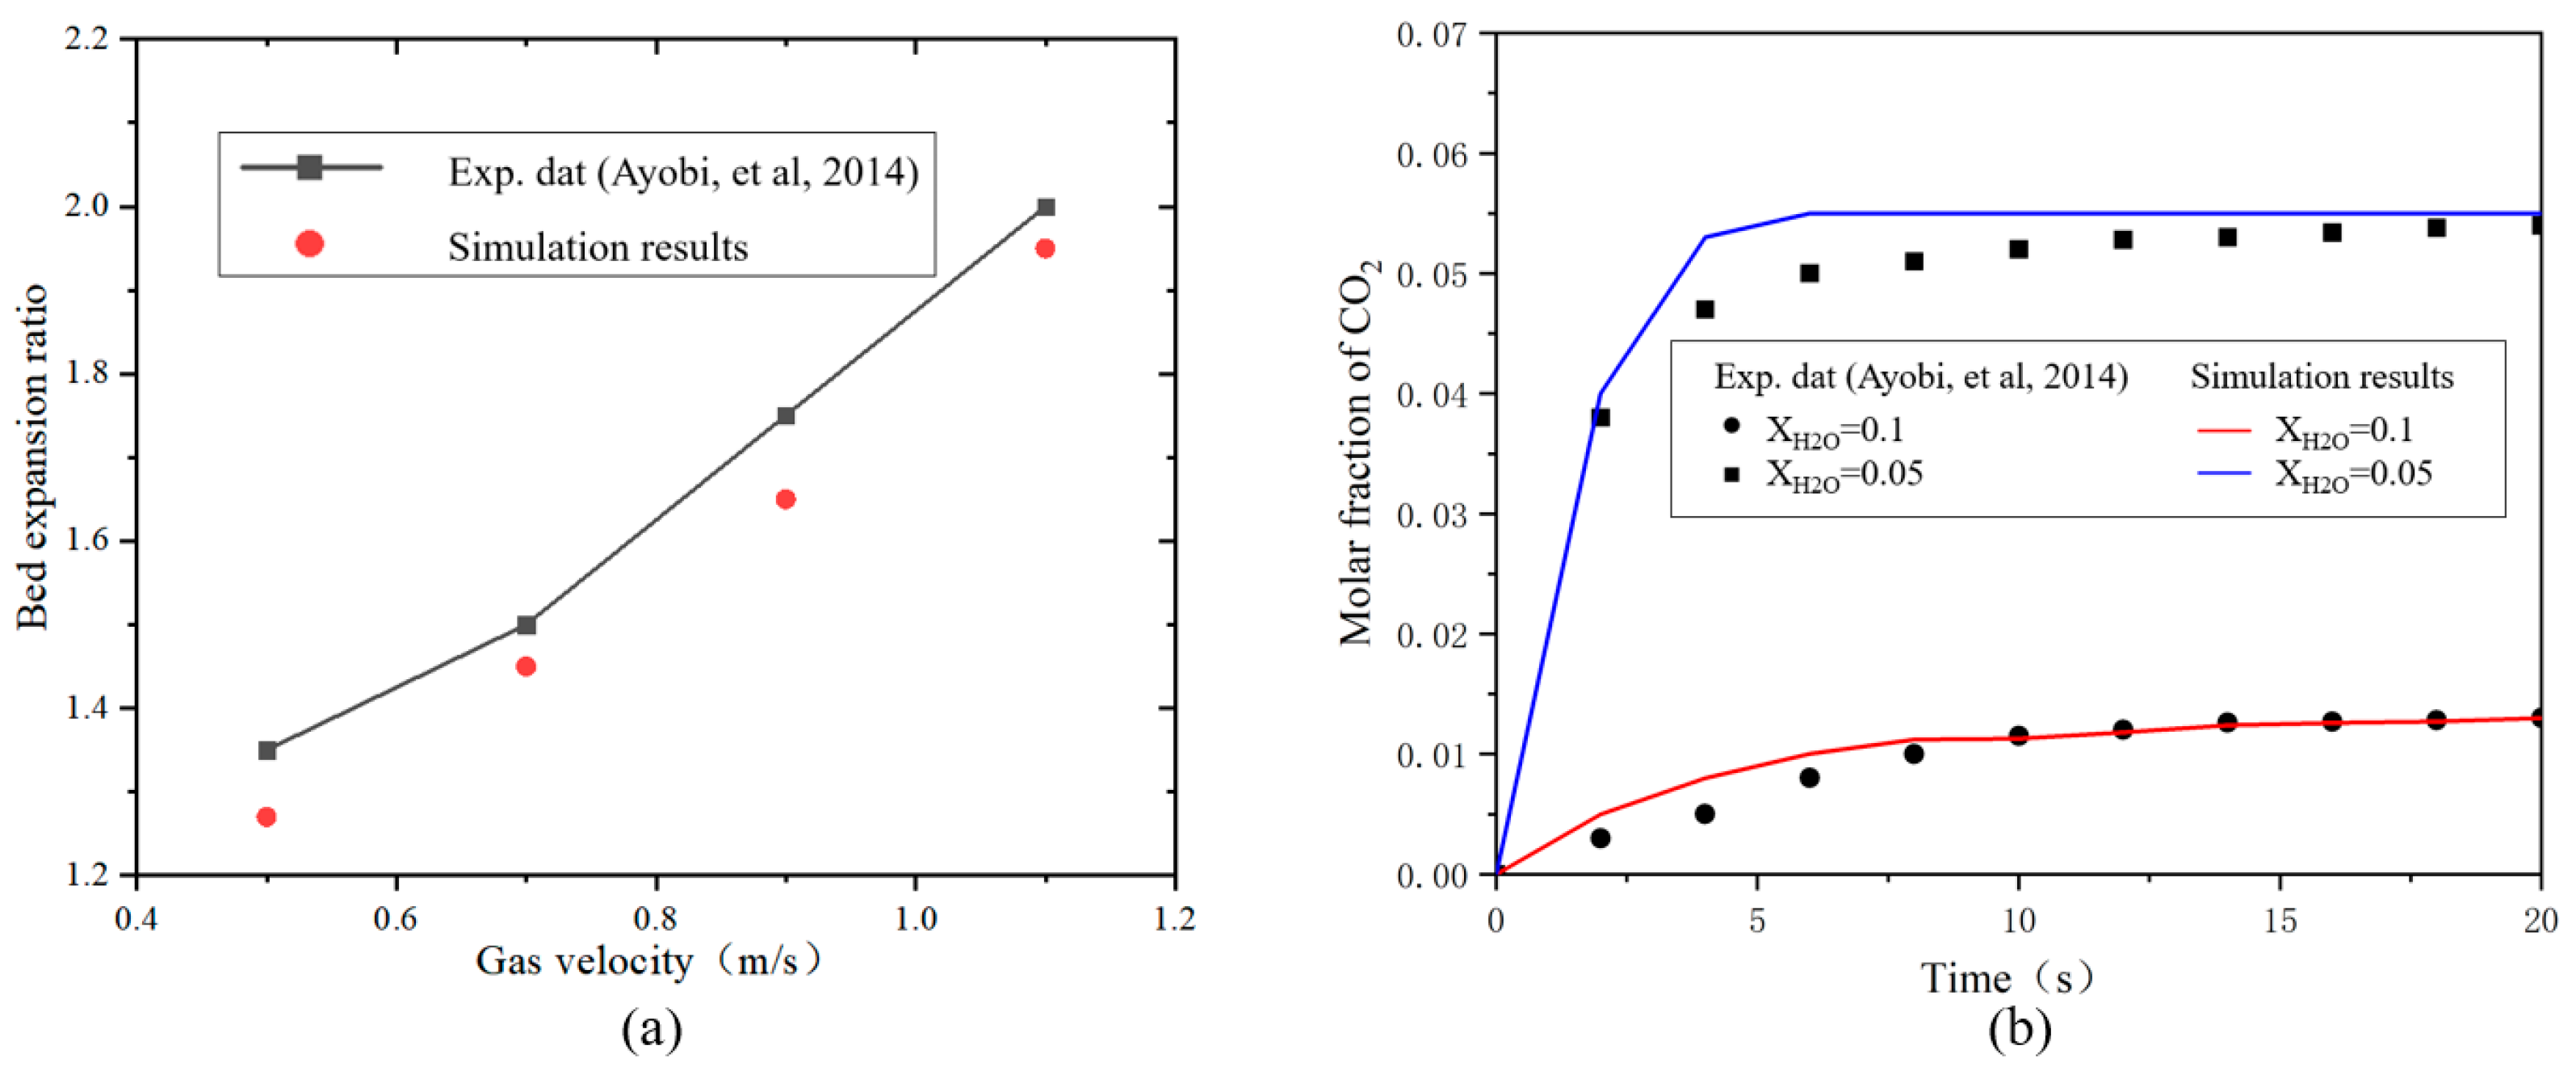
Prior to performing numerical simulations, the model developed in this study was validated to ensure the reliability of the results. Because of the complex gas–solid interphase interactions and heterogeneous chemical reactions occurring within the BFB reactor, the validation focused on two key aspects: hydrodynamics and chemical reaction kinetics. For this purpose, the experimental results reported by Ayobi et al. [26] were used as references. The cylindrical BFB system employed by Ayobi et al. has been adopted by various researchers to validate the quantitative accuracy of both 2D [26,34] and 3D [33,35] simulation results. In their experiments, a heated gas mixture of CO2, H2O, and N2 was continuously introduced into the fluidized bed, and the time-averaged bed height as well as the CO2 concentration at the bed outlet were measured. Following the approach of Chalermsinsuwan [21], 2D simulations were performed in the present work. The bed expansion ratio was determined by calculating the temporally averaged solid volume fraction along the bed height. Figure 2a compares the predicted and experimentally measured bed expansion ratio. The bed expansion ratio increases with gas velocity, and both experimental and simulated results exhibit similar trends. Although minor deviations are observed, the maximum relative error remains below 10%, confirming that the model can reliably predict the expanded bed height. The discrepancies may be attributed to the particle size distribution in the experiments, whereas an average particle diameter was used in the simulations. For validation of the chemical reaction kinetics, Figure 2b presents the comparison between numerical predictions and experimental measurements under CO2 adsorption conditions. For both cases of CH2O = 0.05 and CH2O = 0.1, the CO2 mole fraction at the outlet initially increases and subsequently stabilizes. The simulation results are in good agreement with the experimental data, confirming the validity of the model for simulating CO2 adsorption on potassium carbonate.

3.2. Adsorption Reaction Performance

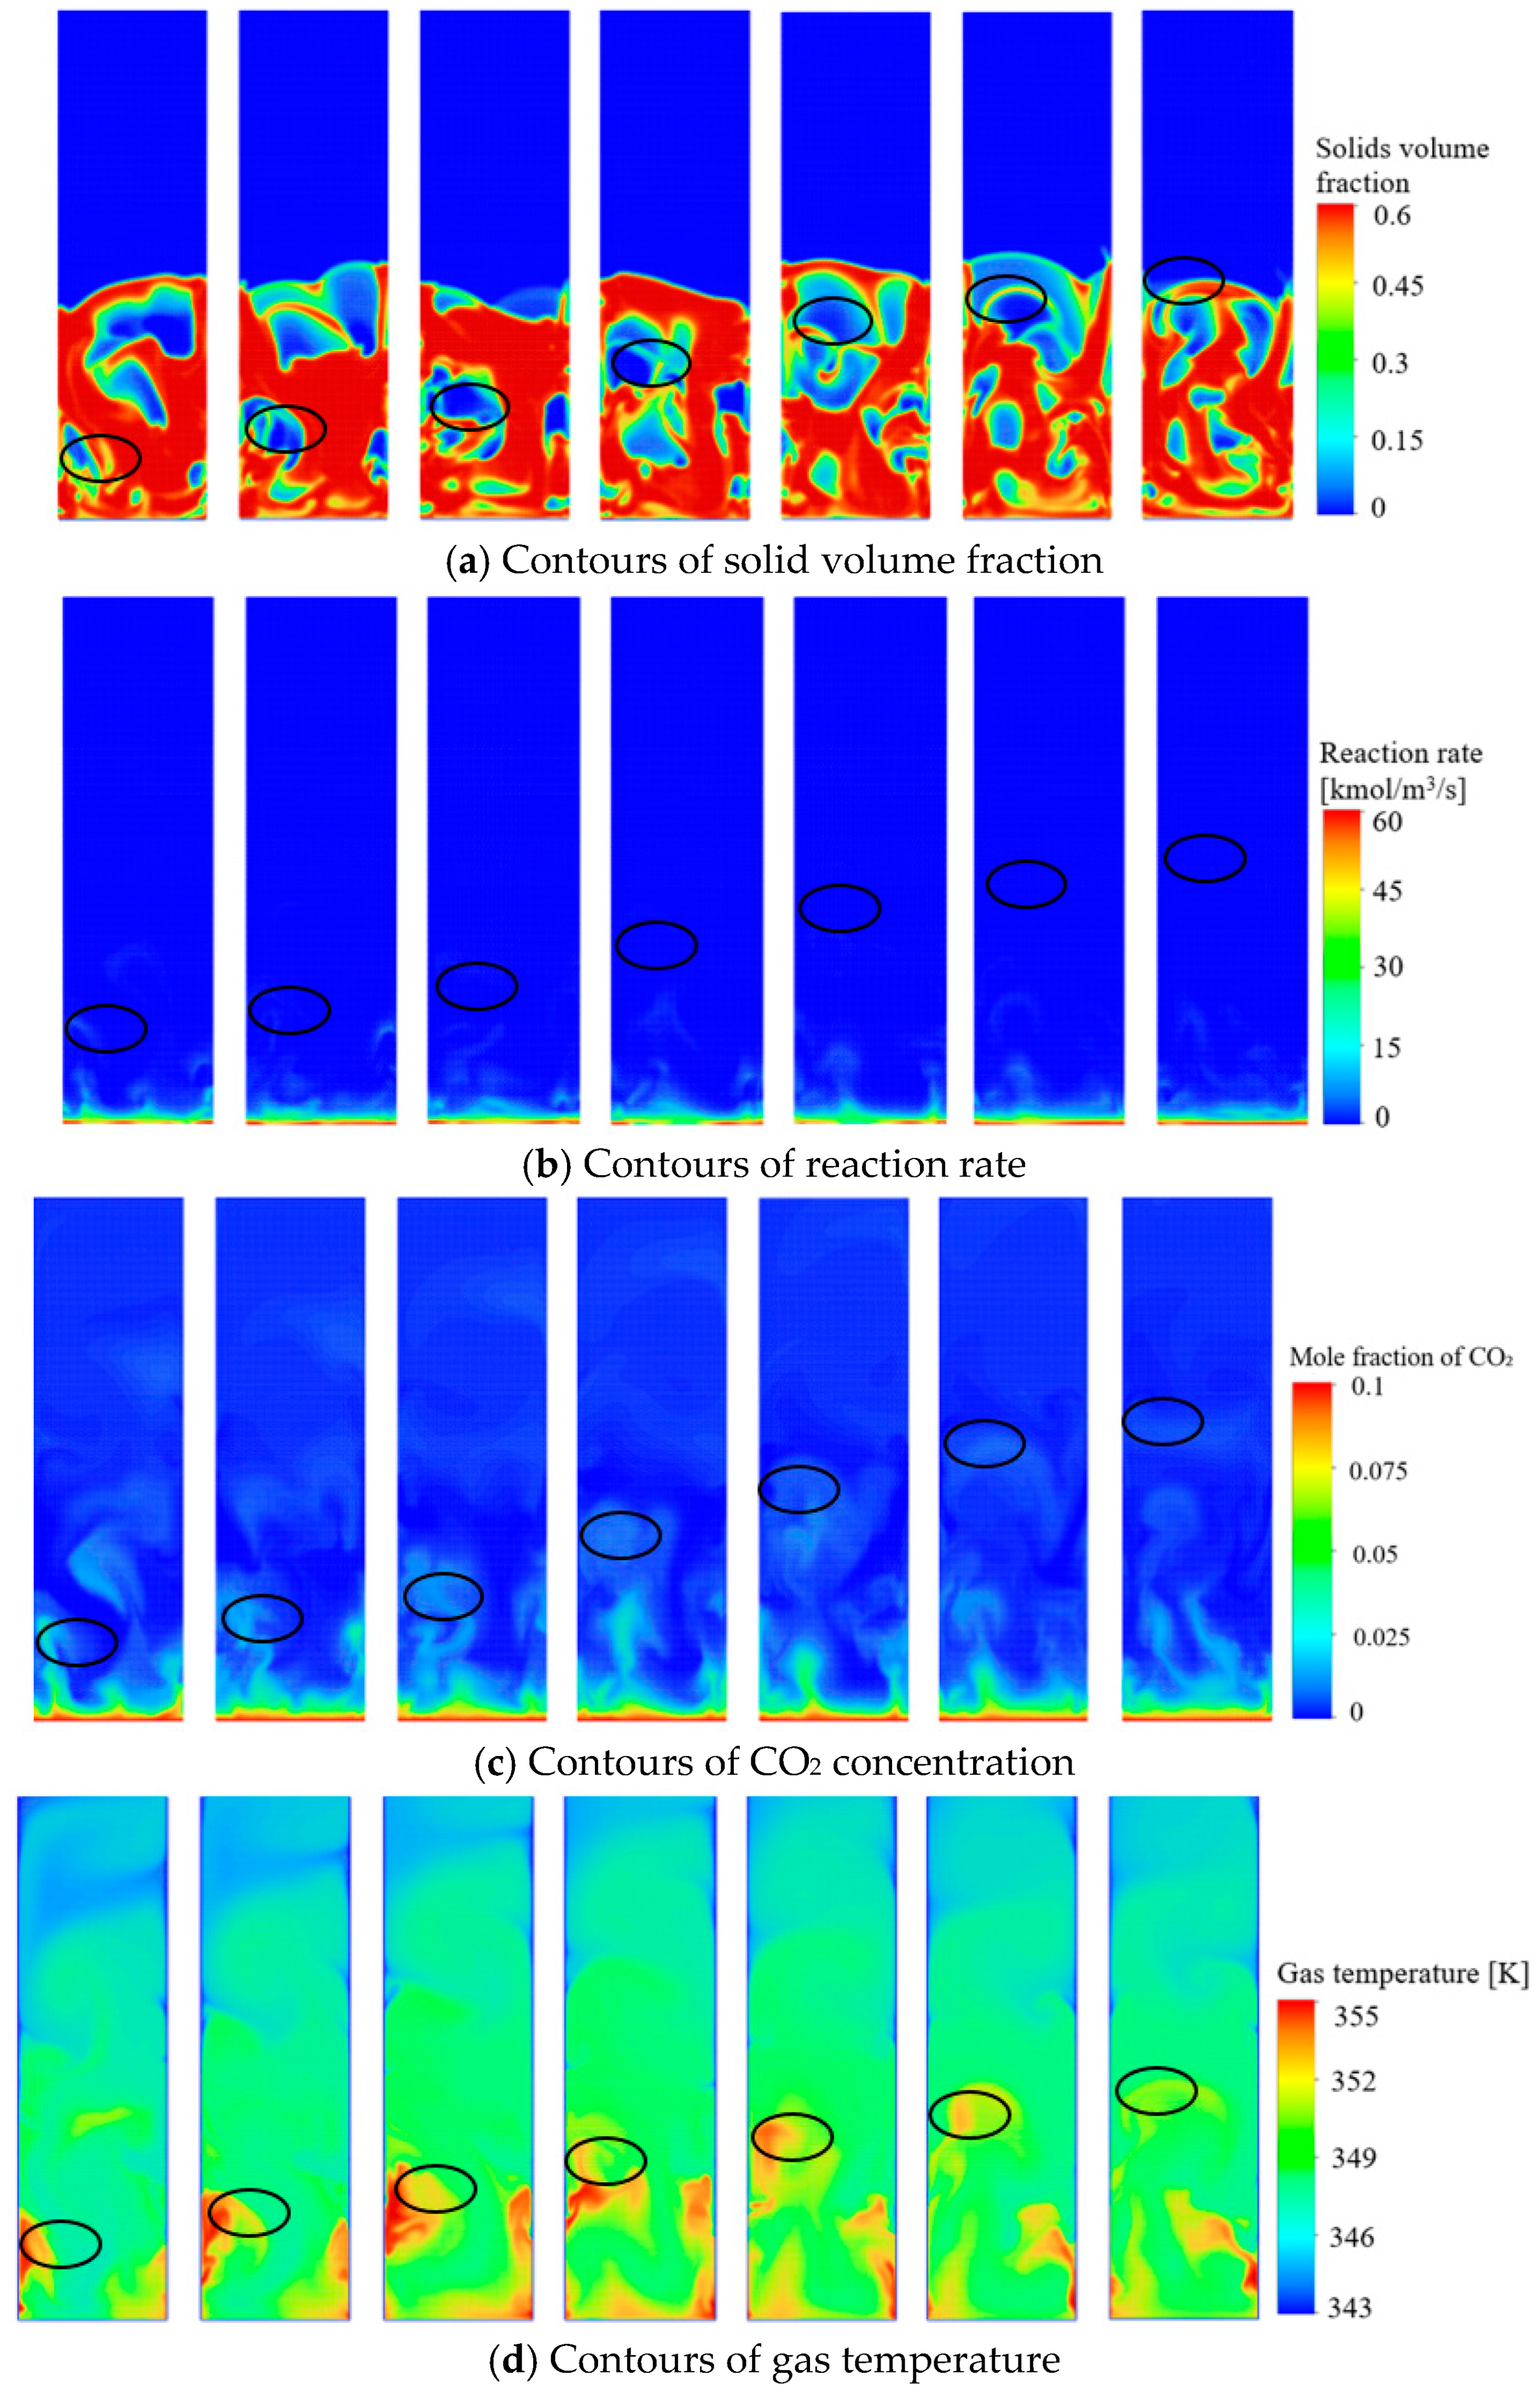
Figure 3 presents typical results illustrating the temporal evolution of the spatial distributions of solid volume fraction, reaction rate, CO2 concentration and gas temperature. As shown in Figure 3a, under the investigated conditions, the bed operates in a typical bubbling fluidization state: small bubbles are continuously generated at the bottom and gradually coalesce and grow during their ascent (see the bubble highlighted by the black circles in Figure 3a), leading to a progressive increase in bubble size along the bed height. Figure 3b shows that the CO2 adsorption reaction primarily occurs near the bed inlet, with the reaction rate inside the bed being significantly lower than that in the inlet region. This is mainly attributed to the higher solid volume fraction and CO2 concentration in this region, which favor the adsorption reaction (see Equation (21)), resulting in rapid CO2 consumption near the inlet. Influenced by the adsorption reaction, the CO2 concentration exhibits a spatial distribution characterized by high values at the bottom and low values in the upper part, as depicted in Figure 3b. It can be found from Figure 3c that the spatial distribution of CO2 concentration presents a pronounced non-uniform feature. By comparing Figure 3a and Figure 3c, a clear correspondence can be observed between regions of high CO2 concentration and the locations of bubbles: the CO2 concentration in the bubble phase is clearly higher than that in the emulsion phase. This is because the adsorption of CO2 by K2CO3 is a heterogeneous reaction, and the solid volume fraction (i.e., the K2CO3 content) in the bubble phase is much lower than that in the emulsion phase, which prevents the CO2 within the bubbles from being effectively adsorbed. The adsorption of CO2 by K2CO3 is exothermic. Consequently, the gas temperature inside the bed is higher than the inlet gas temperature (343 K), as shown in Figure 3d. Figure 3d indicates that the gas temperature distribution within the bed is also markedly non-uniform. Although the K2CO3 adsorption reaction mainly occurs neat the bed inlet, the high-temperature region is not concentrated there. A comparison of Figure 3a, Figure 3c and Figure 3d reveals that, similar to the CO2 concentration, the gas temperature in the bubble phase is higher than that in the emulsion phase (see the regions marked by black circles). This may be attributed to a lower heat transfer rate in the bubble phase because of the low solid volume fraction compared to the emulsion phase. The heat released by the adsorption reaction cannot be promptly transferred to the emulsion phase, leading to the heat accumulation and a consequent temperature rise within the bubbles.
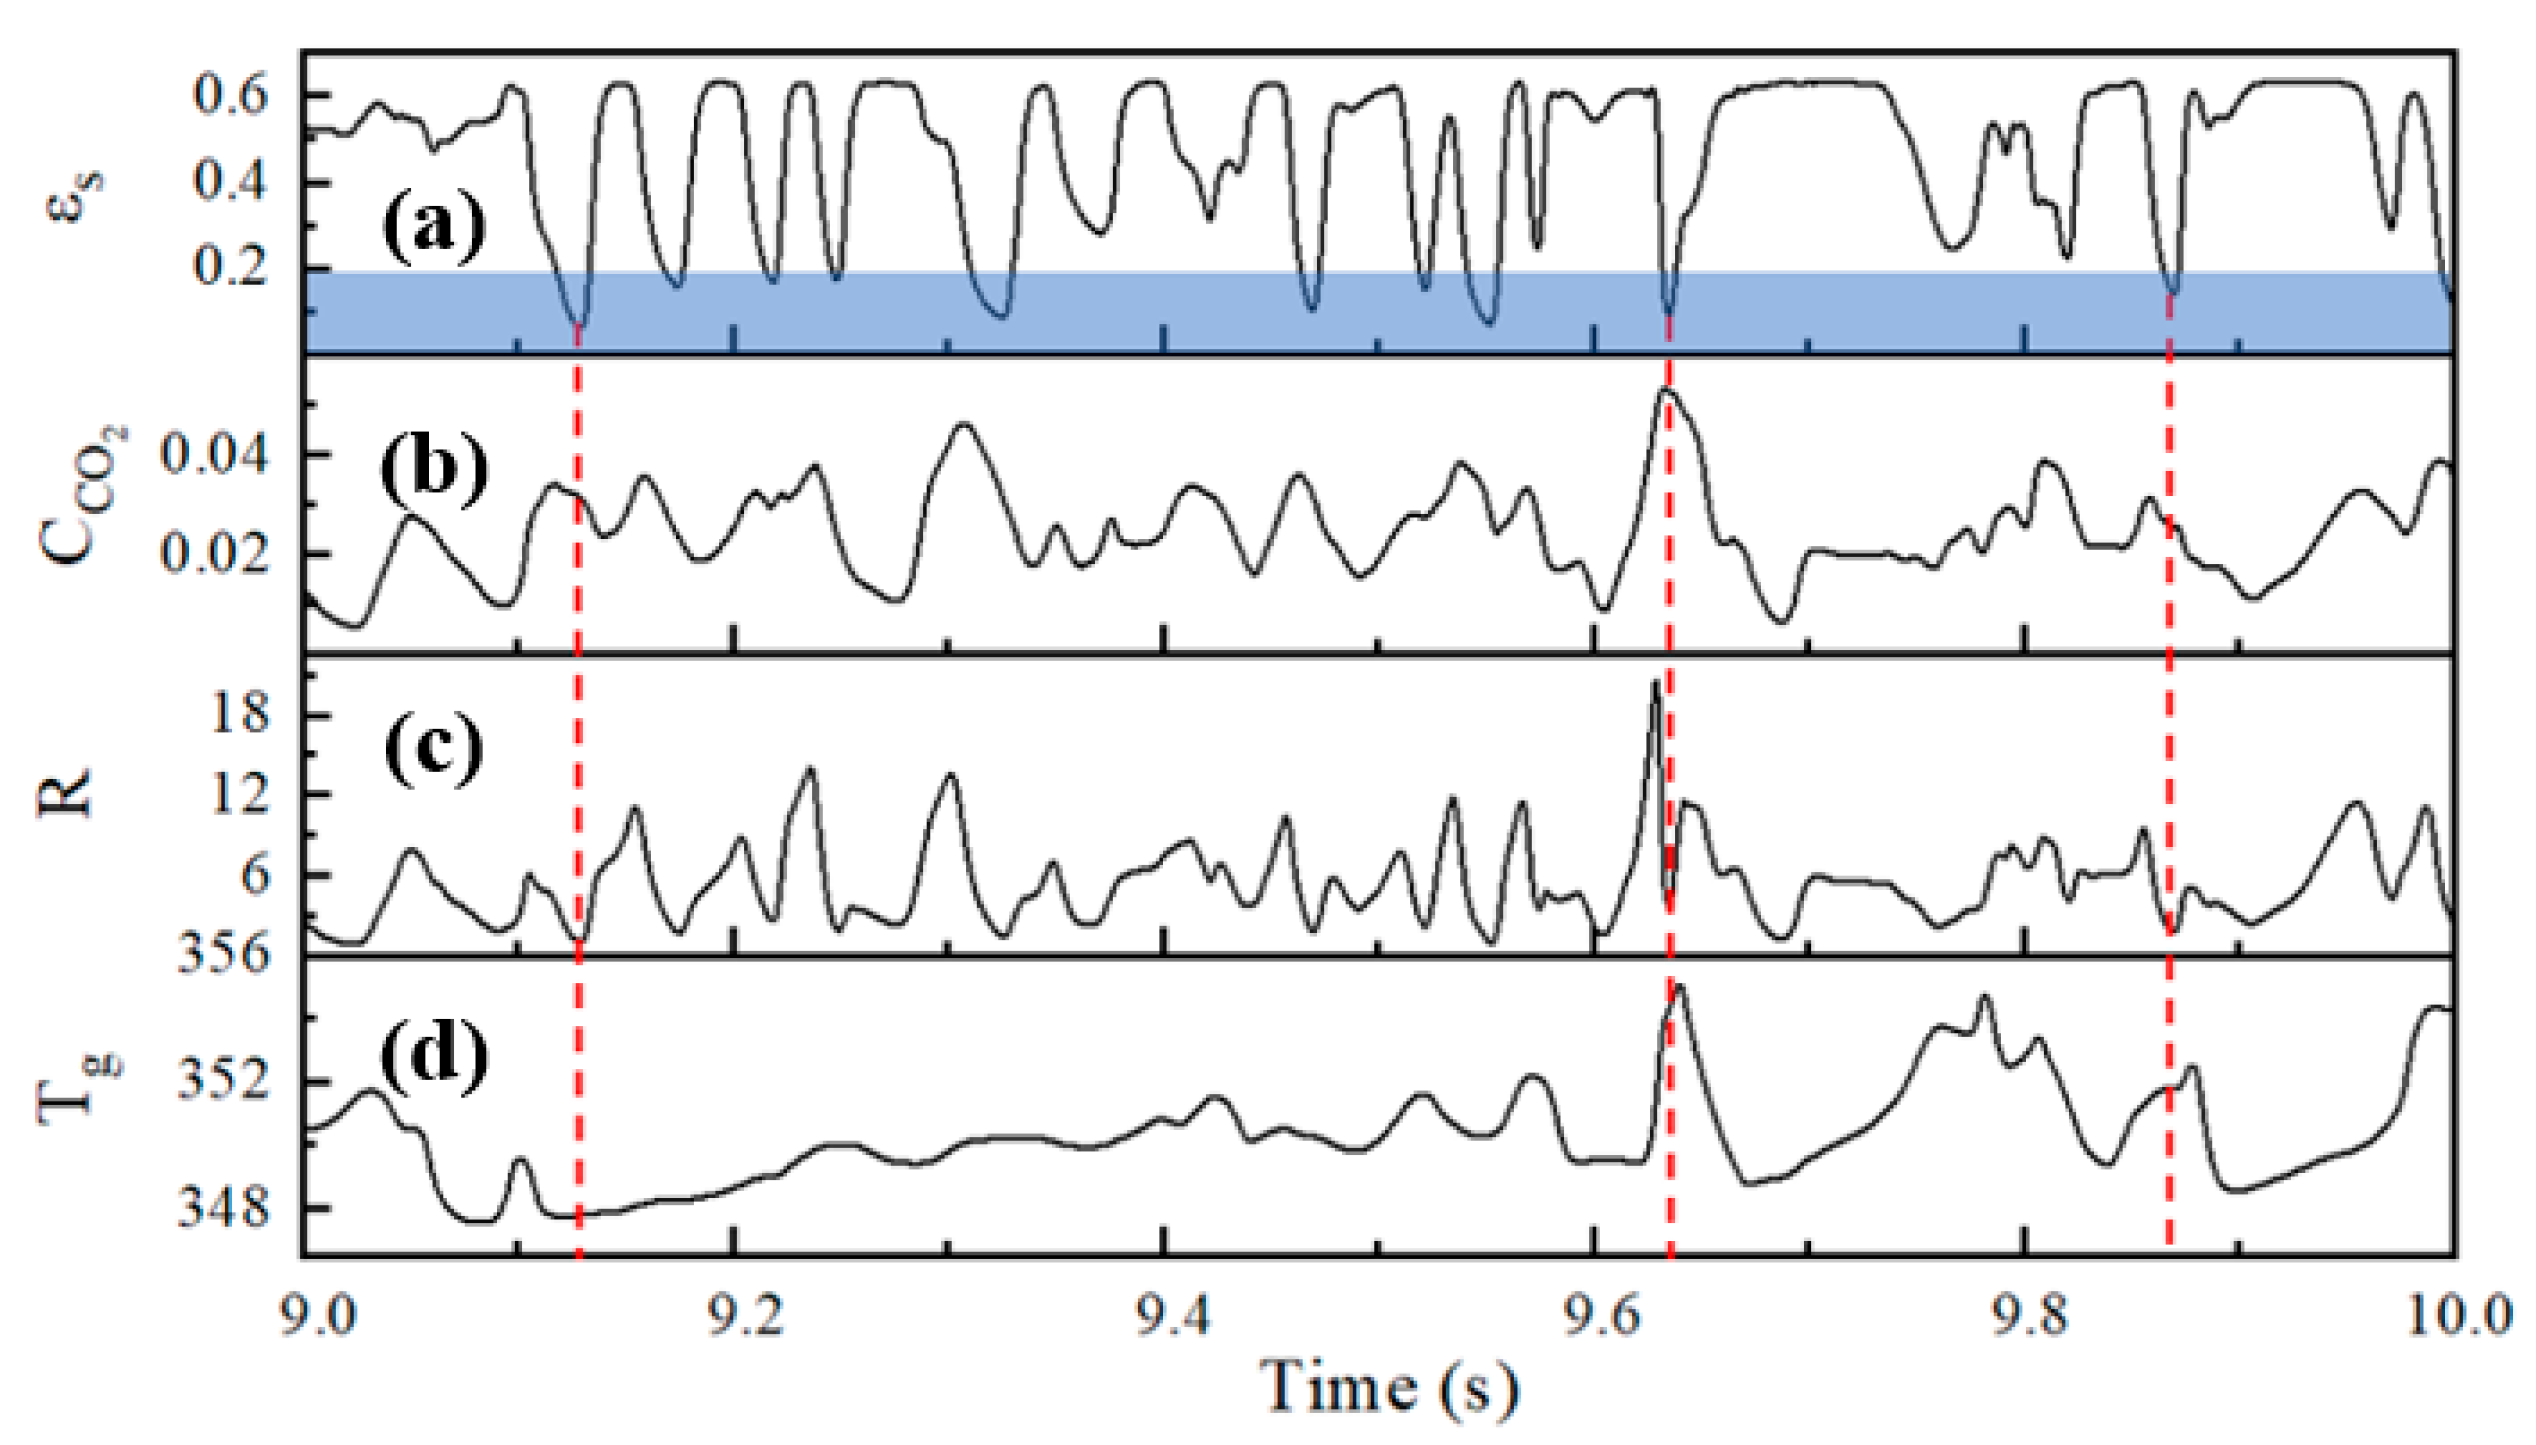
To further quantitatively evaluate the relationship between bubble dynamics and CO2 adsorption characteristics, the temporal variations in solid volume fraction, reaction rate, CO2 concentration, and gas temperature at local positions were monitored, with typical results shown in Figure 4. As expected, the solid volume fraction at the local position exhibits significant fluctuations over time. Currently, there is no consensus on the critical solid volume fraction used to distinguish between the bubble phase and the emulsion phase. In the literature, researchers have typically adopted different threshold values ranging from 0.1 to 0.3 to differentiate the two phases [37]. In this study, a critical solid volume fraction of 0.2 was employed to define the bubble phase, as indicated by the shaded regions in Figure 4a. Based on this threshold, a total of 10 bubbles passed through the monitoring point during the time interval shown in Figure 4.
A clear positive correlation can be observed between the solid volume fraction (Figure 4a) and the adsorption reaction rate (Figure 4c): a low solid volume fraction corresponds to a low reaction rate, indicating that the adsorption reaction rate in the bubble phase is lower than that in the emulsion phase, as illustrated by the time instances marked with red dashed lines in the figure. Similarly to the reaction rate, low solid volume fractions generally correspond to higher CO2 concentrations (Figure 4b), although this correlation is less pronounced than that between solid volume fraction and reaction rate. Compared to the other three parameters, the gas temperature exhibits relatively milder fluctuations over time. Nevertheless, it can still be observed that, overall, the gas temperature at the monitoring point is slightly higher when a bubble passes through, as shown by the two rightmost dashed lines in the figure. All these results suggest that there exists an intrinsic linkage between the bubble dynamics and adsorption efficiency.

3.3. Distributions of CO2 Concentration and Reaction Rate

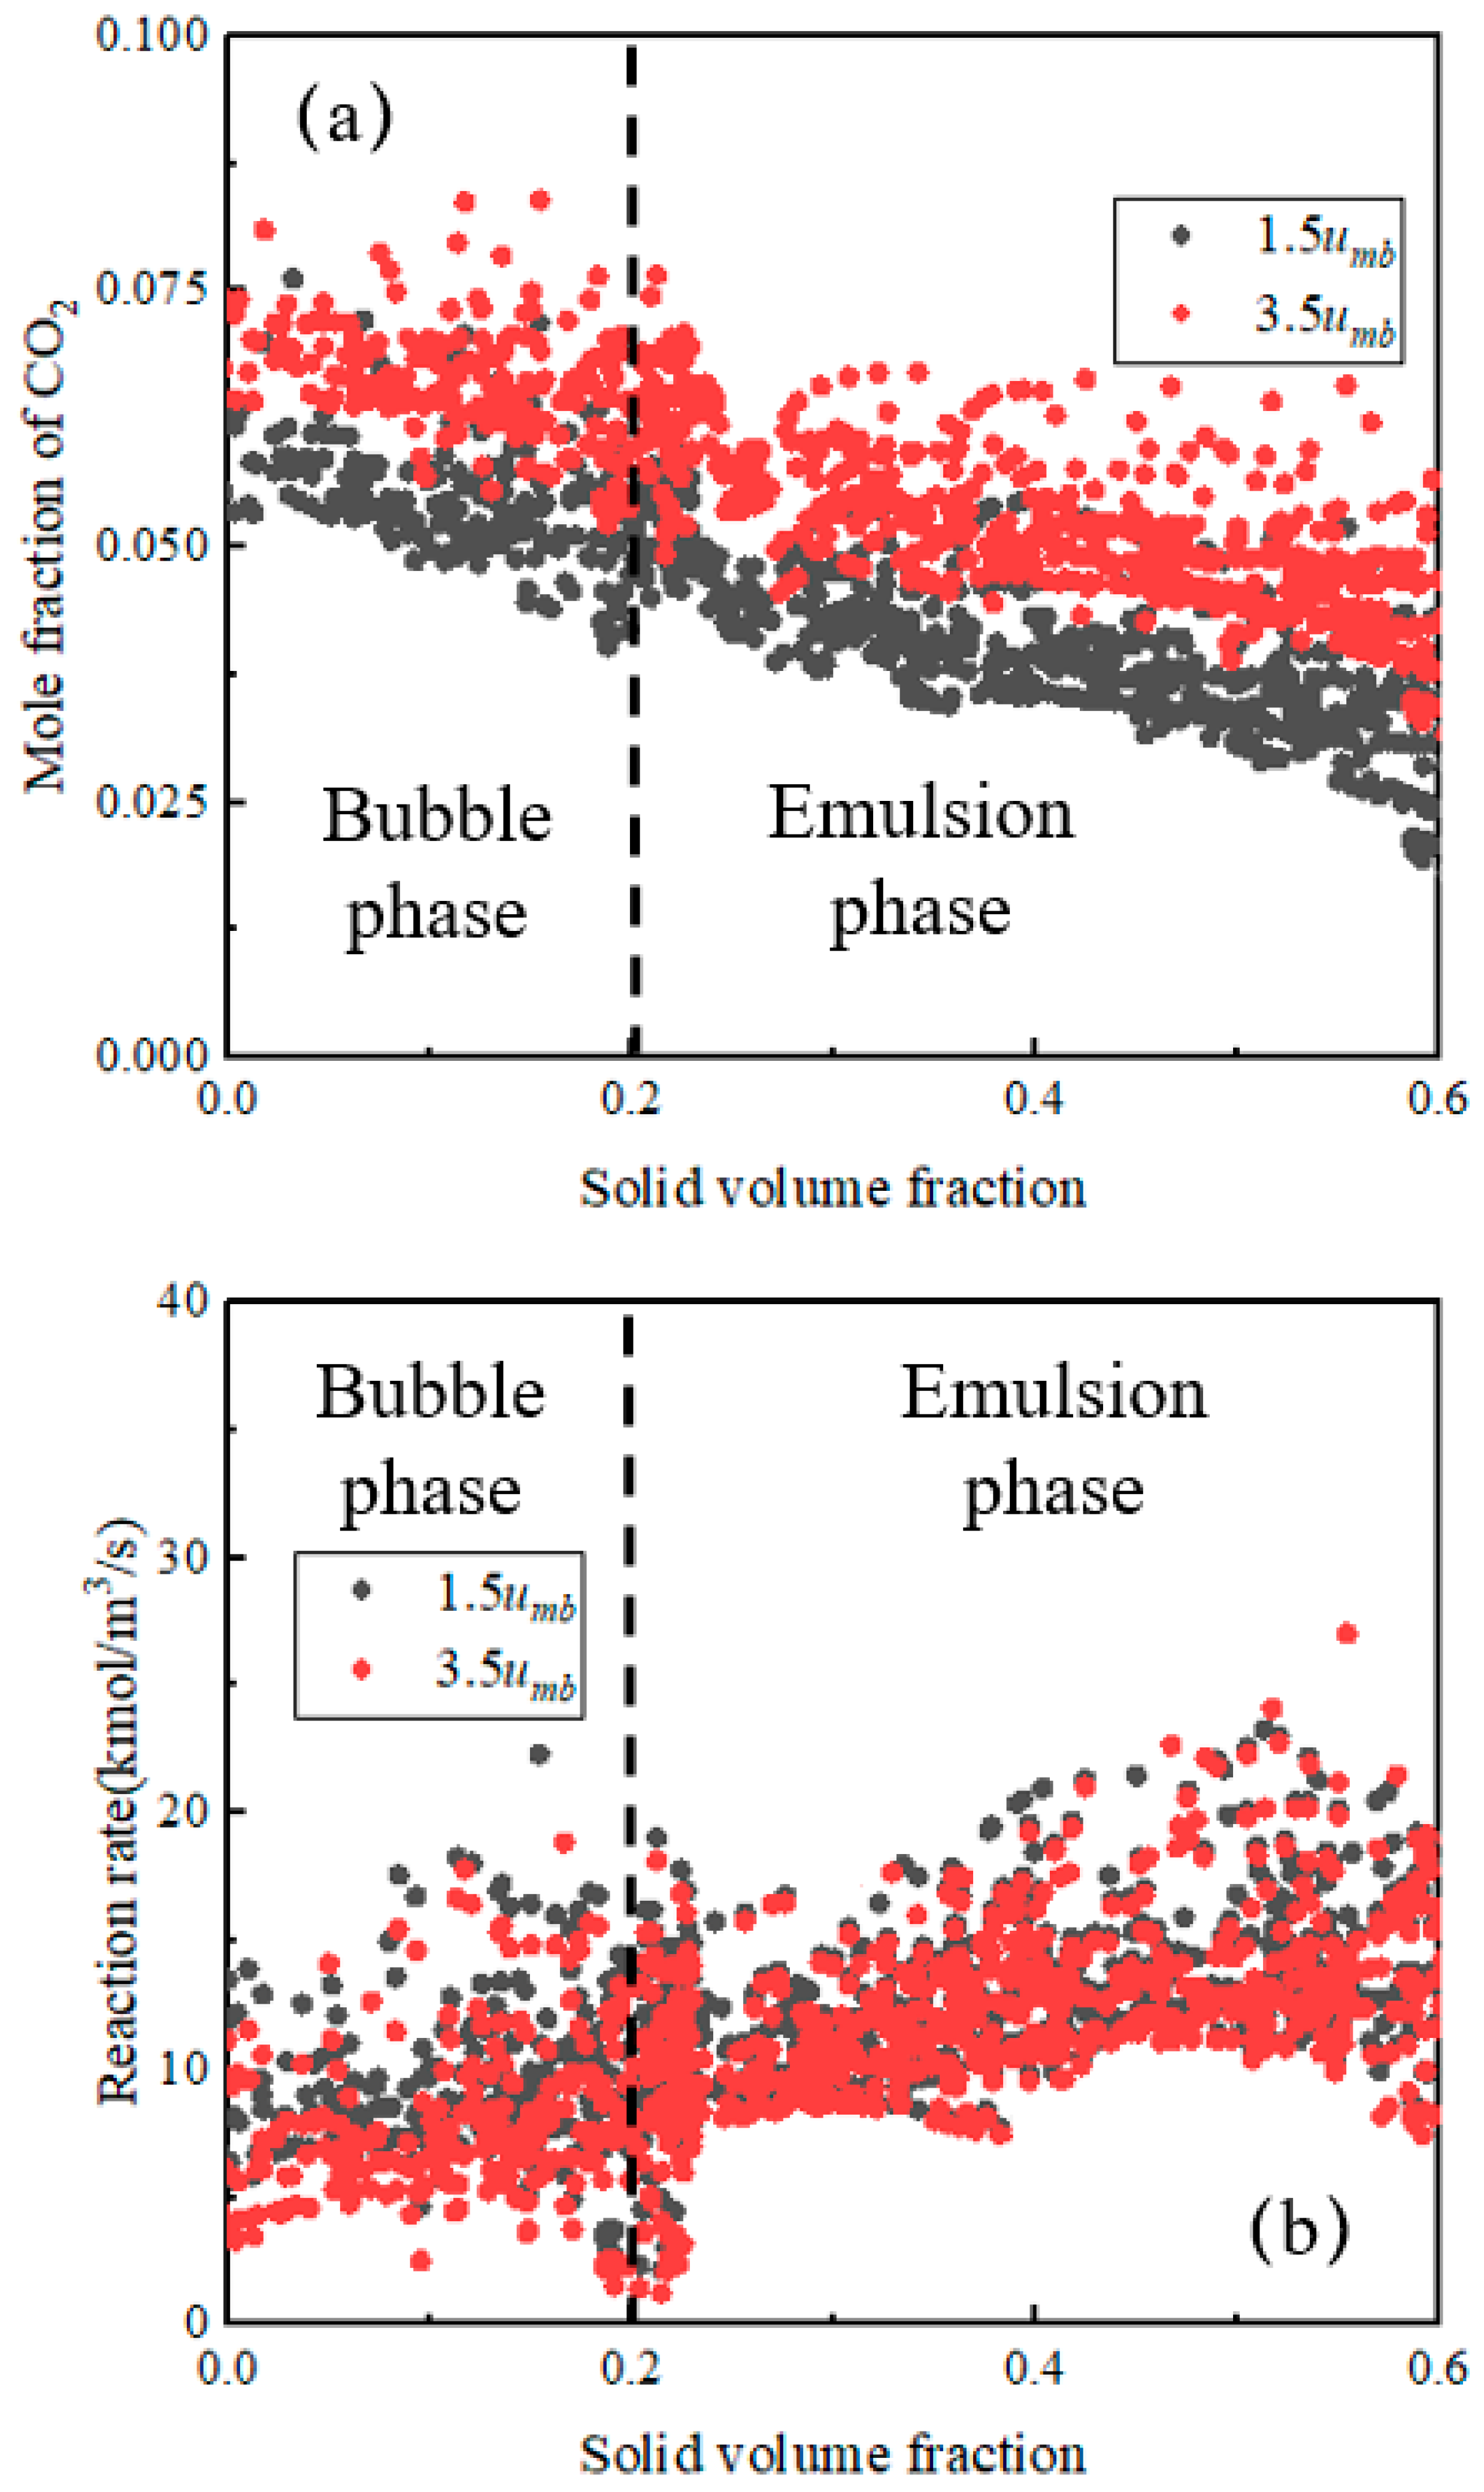
As shown in Figure 2, CO2 can still be detected at the reactor outlet during the CO2 adsorption process by K2CO3. In bubbling fluidized bed, the gas phase can be divided into a bubble phase and an emulsion phase [27]. The CO2 entering the reactor from the inlet is distributed between these two phases and reacts chemically with K2CO3 during its upward flow. To investigate the contributions of the emulsion phase and the bubble phase to the CO2 concentration at the reactor outlet, this study statistically analyzed the distribution of CO2 concentration and the adsorption reaction rate within the bed, as shown in Figure 5. The data points in Figure 5 correspond to the solids volume fraction and CO2 concentration/reaction rate in different grids within the computational domain. It should be noted that the grids included in the statistical analysis are all located inside the bottom reaction zone. The specific statistical procedure is as follows: First, the average height of the solid bed is determined based on the axial distribution of the spatiotemporally averaged solid volume fraction within the bed. Then, during the statistical analysis, only grid information where the centroid position of the grid is below the average bed height is extracted. For clarity, Figure 5 only present the results for two inlet velocity conditions, with sample data from 50 distinct time instants selected for each condition. We have carefully checked that increasing the number of sampling instants does not alter the qualitative trend shown in the figures, and the statistical results for other inlet velocity conditions investigated in this study are consistent with the variation trends shown in Figure 5.
It can be observed from Figure 5a that there is an overall negative correlation between CO2 concentration and solid volume fraction: grids with higher solid volume fraction exhibit lower CO2 concentration, and vice versa. This result is consistent with the results shown in Figure 3 and Figure 4, where the CO2 concentration in the bubble phase (solid volume fraction less than 0.2) is higher than that in the emulsion phase. Figure 5a indicates that, qualitatively, an increase in the superficial gas velocity does not change the fundamental relationship between CO2 concentration and solids volume fraction. However, quantitatively, as the superficial gas velocity increases, the CO2 concentration in both the bubble phase and the emulsion phase rises. Different from the CO2 concentration distribution, the adsorption reaction rate shows an overall positive correlation with solids volume fraction: grids with higher solids volume fraction have higher reaction rates, and vice versa, as shown in Figure 5b. From Figure 5b, it can be seen that, qualitatively, an increase in superficial gas velocity also does not alter this correlation. However, quantitatively, as the superficial gas velocity increases, the adsorption reaction rate in the bubble phase exhibits a slight decrease, while that in the emulsion phase does not change significantly. According to Equation (21), the reaction rate for CO2 adsorption by K2CO3 is a function of CO2 concentration and solids volume fraction. Although the CO2 concentration in the bubble phase is generally higher than that in the emulsion phase, their concentration ratio is lower than the ratio of solids holdup in the emulsion phase compared to that in the bubble phase. This results in the product of CO2 concentration and solids volume fraction in the bubble phase being smaller than that in the emulsion phase. Therefore, in an average sense, the reaction rate is higher in the emulsion phase.
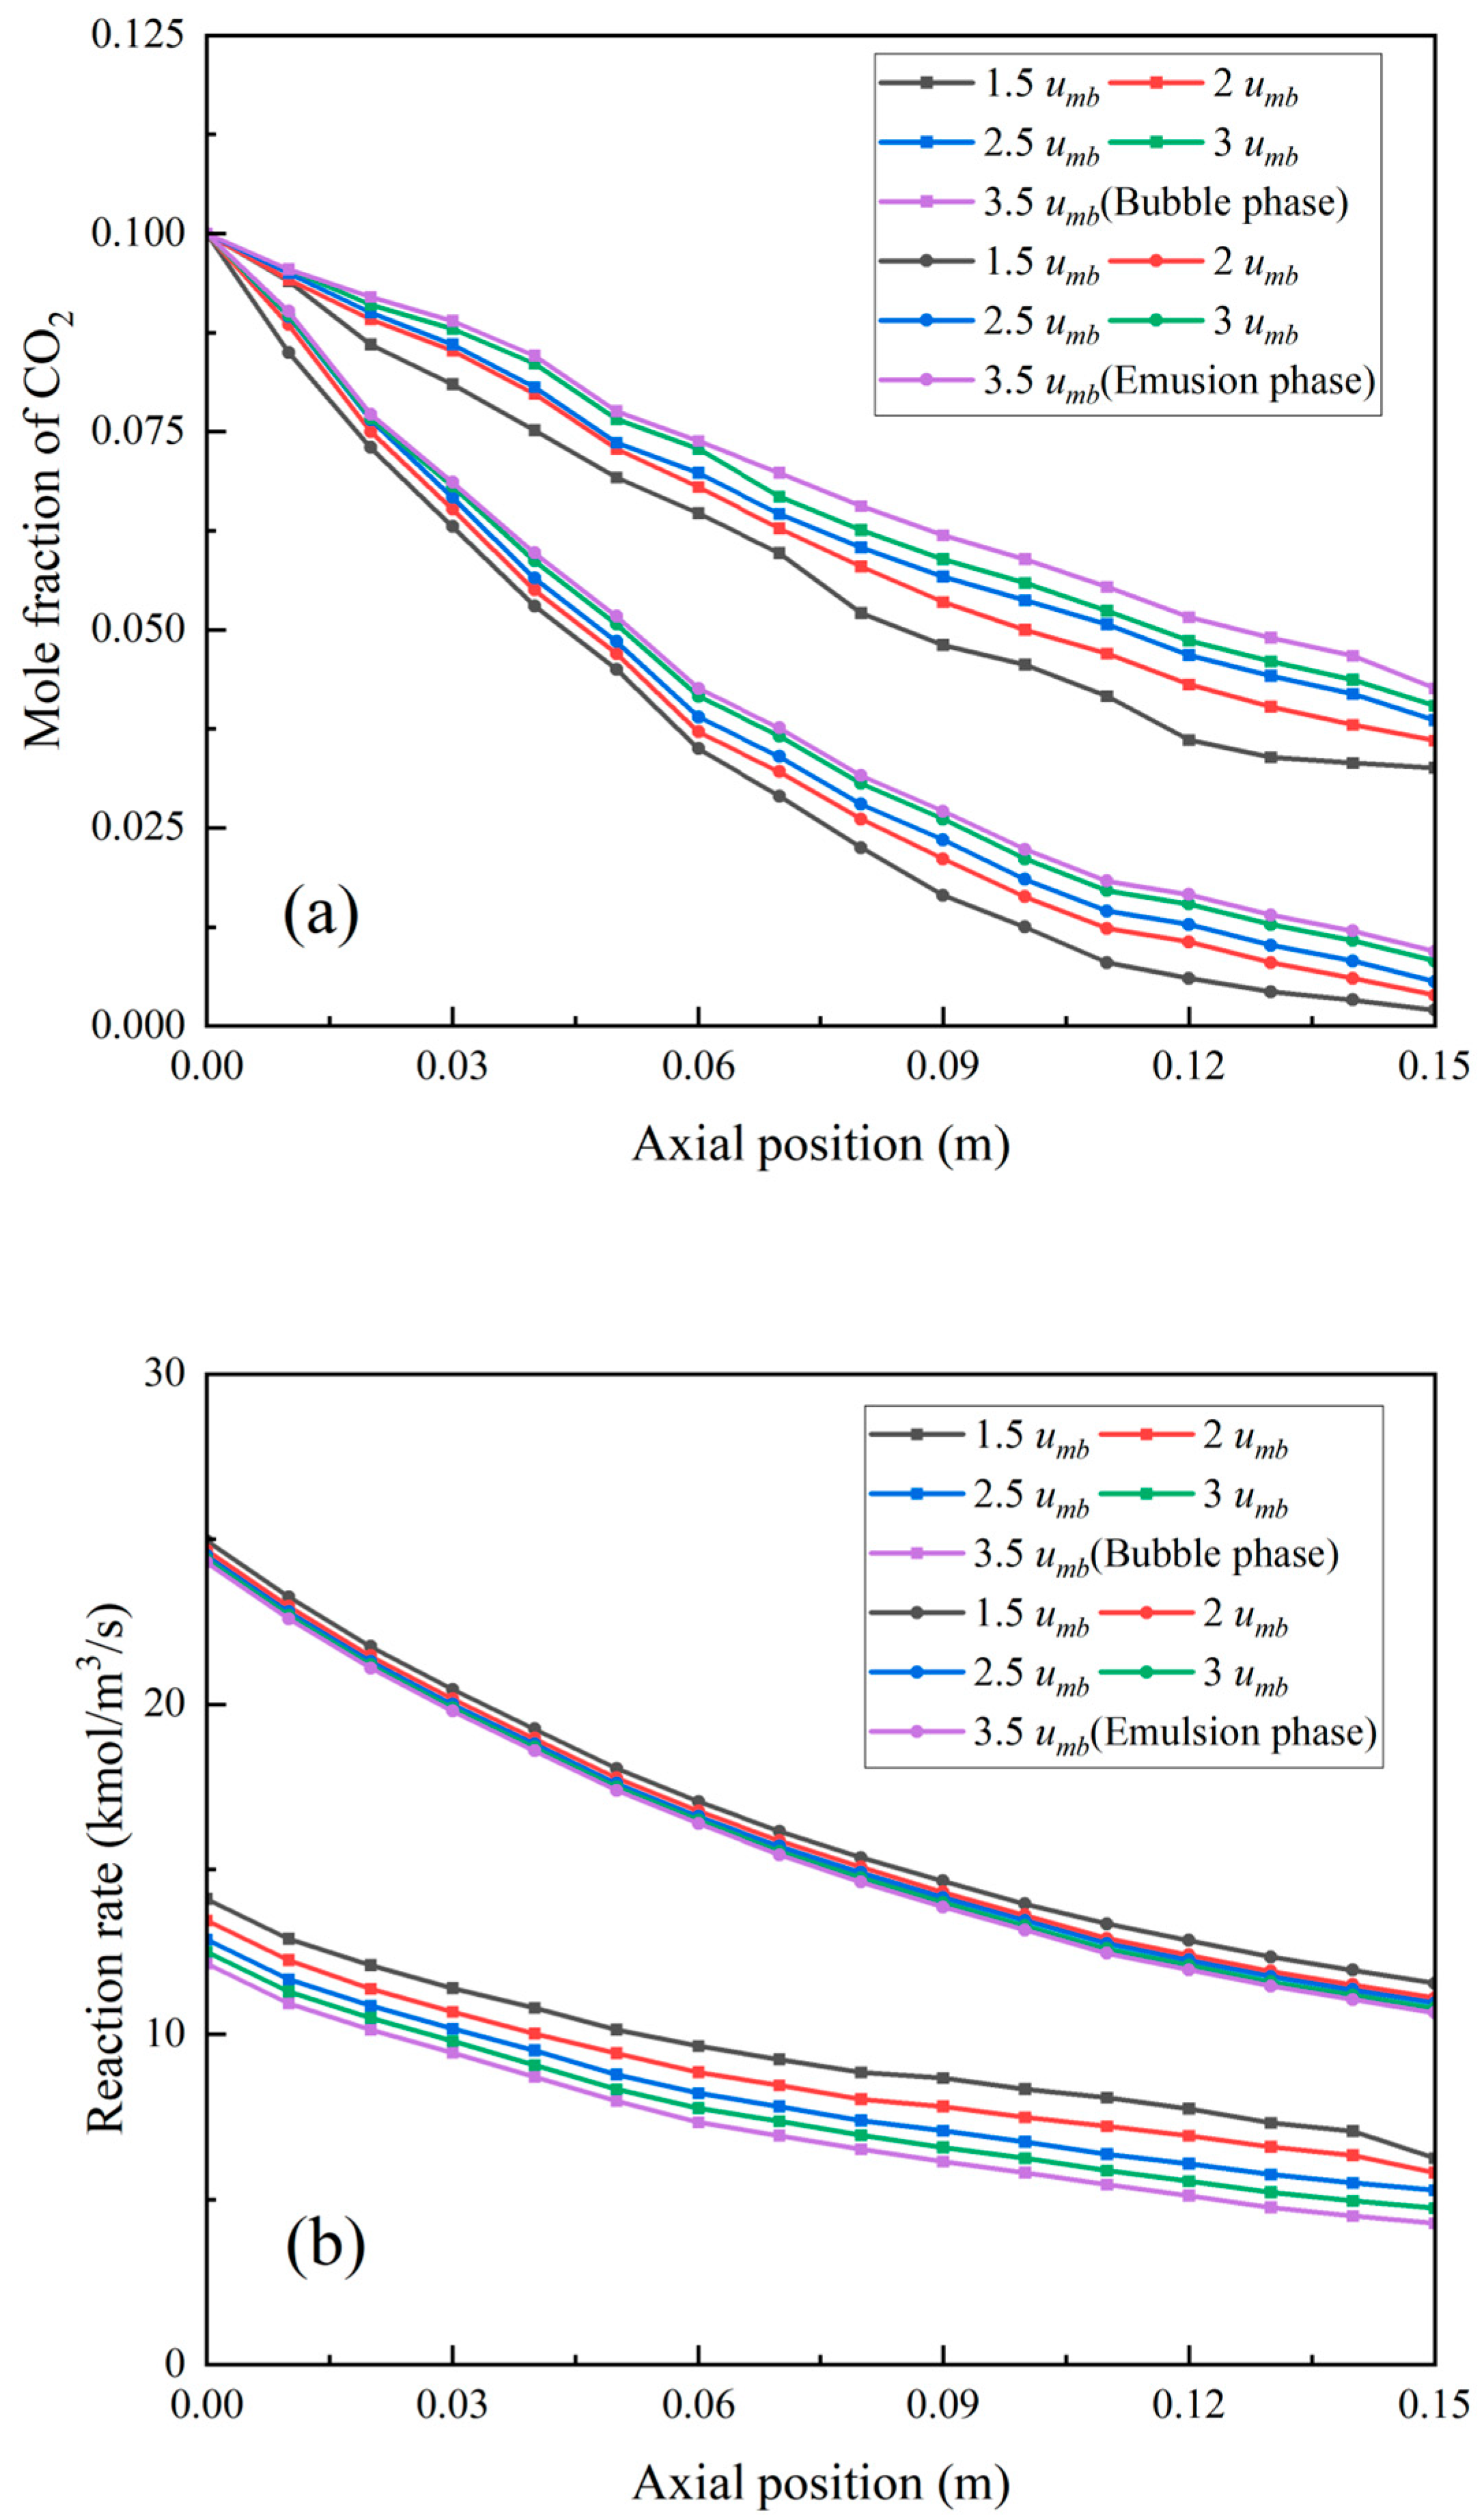
Figure 6 compares the axial distributions of the spatiotemporally averaged CO2 concentrations and adsorption reaction rates in the bubble phase and the emulsion phase under different superficial gas velocities. As shown in Figure 6a, under the investigated parameter conditions, the average CO2 concentration in the bubble phase is consistently higher than that in the emulsion phase across the whole axial range. The CO2 concentration in the bubble phase decreases monotonically along the bed height. In contrast, the CO2 concentration in the emulsion phase initially decreases rapidly (at a rate faster than that in the bubble phase), followed by a gradual decline. Furthermore, the CO2 concentrations in both phases increase with increasing superficial gas velocity. Figure 6b demonstrates that, similar to the CO2 concentration, the adsorption reaction rates in both the bubble phase and the emulsion phase decrease along the bed height, with the rate in the emulsion phase decreasing more rapidly. Compared to the bubble phase, the adsorption reaction rate in the emulsion phase is less sensitive to changes in superficial gas velocity, whereas the reaction rate in the bubble phase exhibits a decreasing trend as the gas velocity increases.
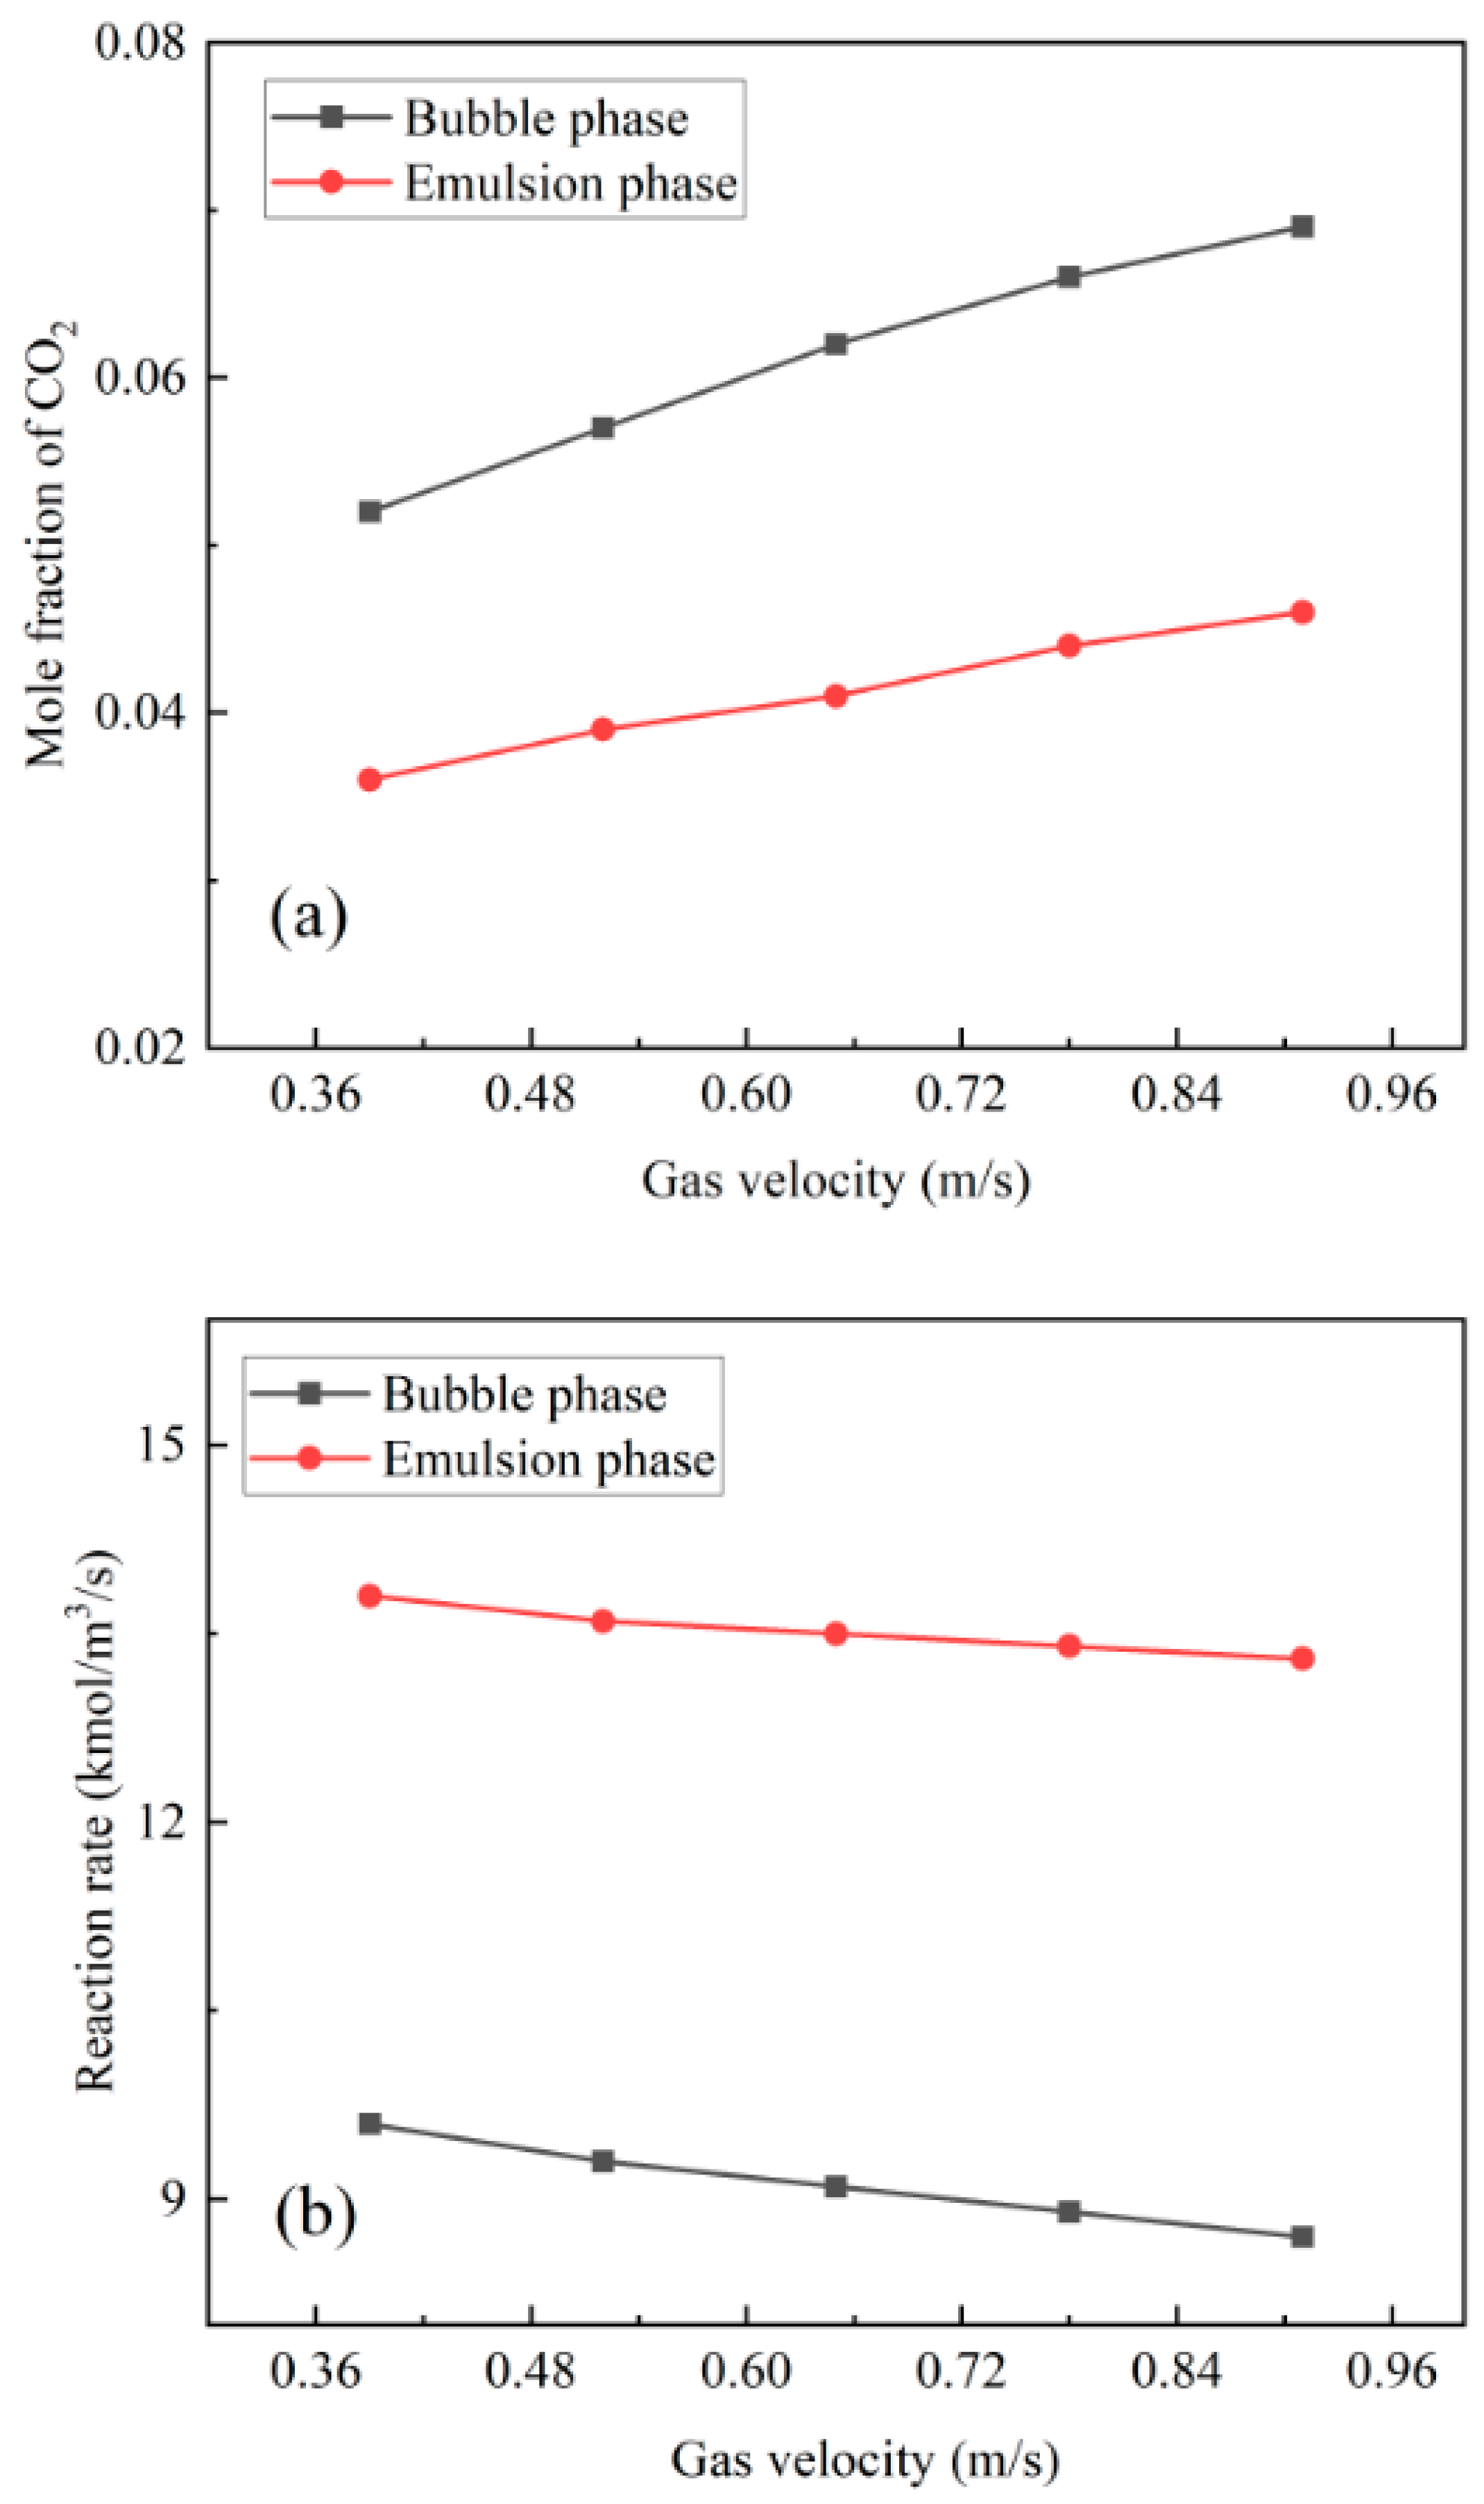
Figure 7 show the trends of average CO2 concentration and reaction rate in the bubble phase and emulsion phase as functions of superficial gas velocity, respectively. As the superficial gas velocity increases, the average CO2 concentration in both phases shows an upward trend, with a larger increase in the bubble phase compared to the emulsion phase. Conversely, the adsorption reaction rate in both phases decreases with an increase in superficial gas velocity, with a more significant decrease observed in the bubble phase. This phenomenon can be primarily attributed to two factors. On one hand, the increase in superficial gas velocity leads to a decrease in the overall solids volume fraction in the bed, thereby weakening the intensity of the adsorption reaction (see Equation (21)). On the other hand, a higher gas velocity shortens the residence time of the gas in the bed. Combined with the decreased adsorption reaction rate, this means that CO2 cannot be fully adsorbed within the bed, resulting in an increase in the CO2 concentration inside the bed.

3.4. Adsorption Efficiency

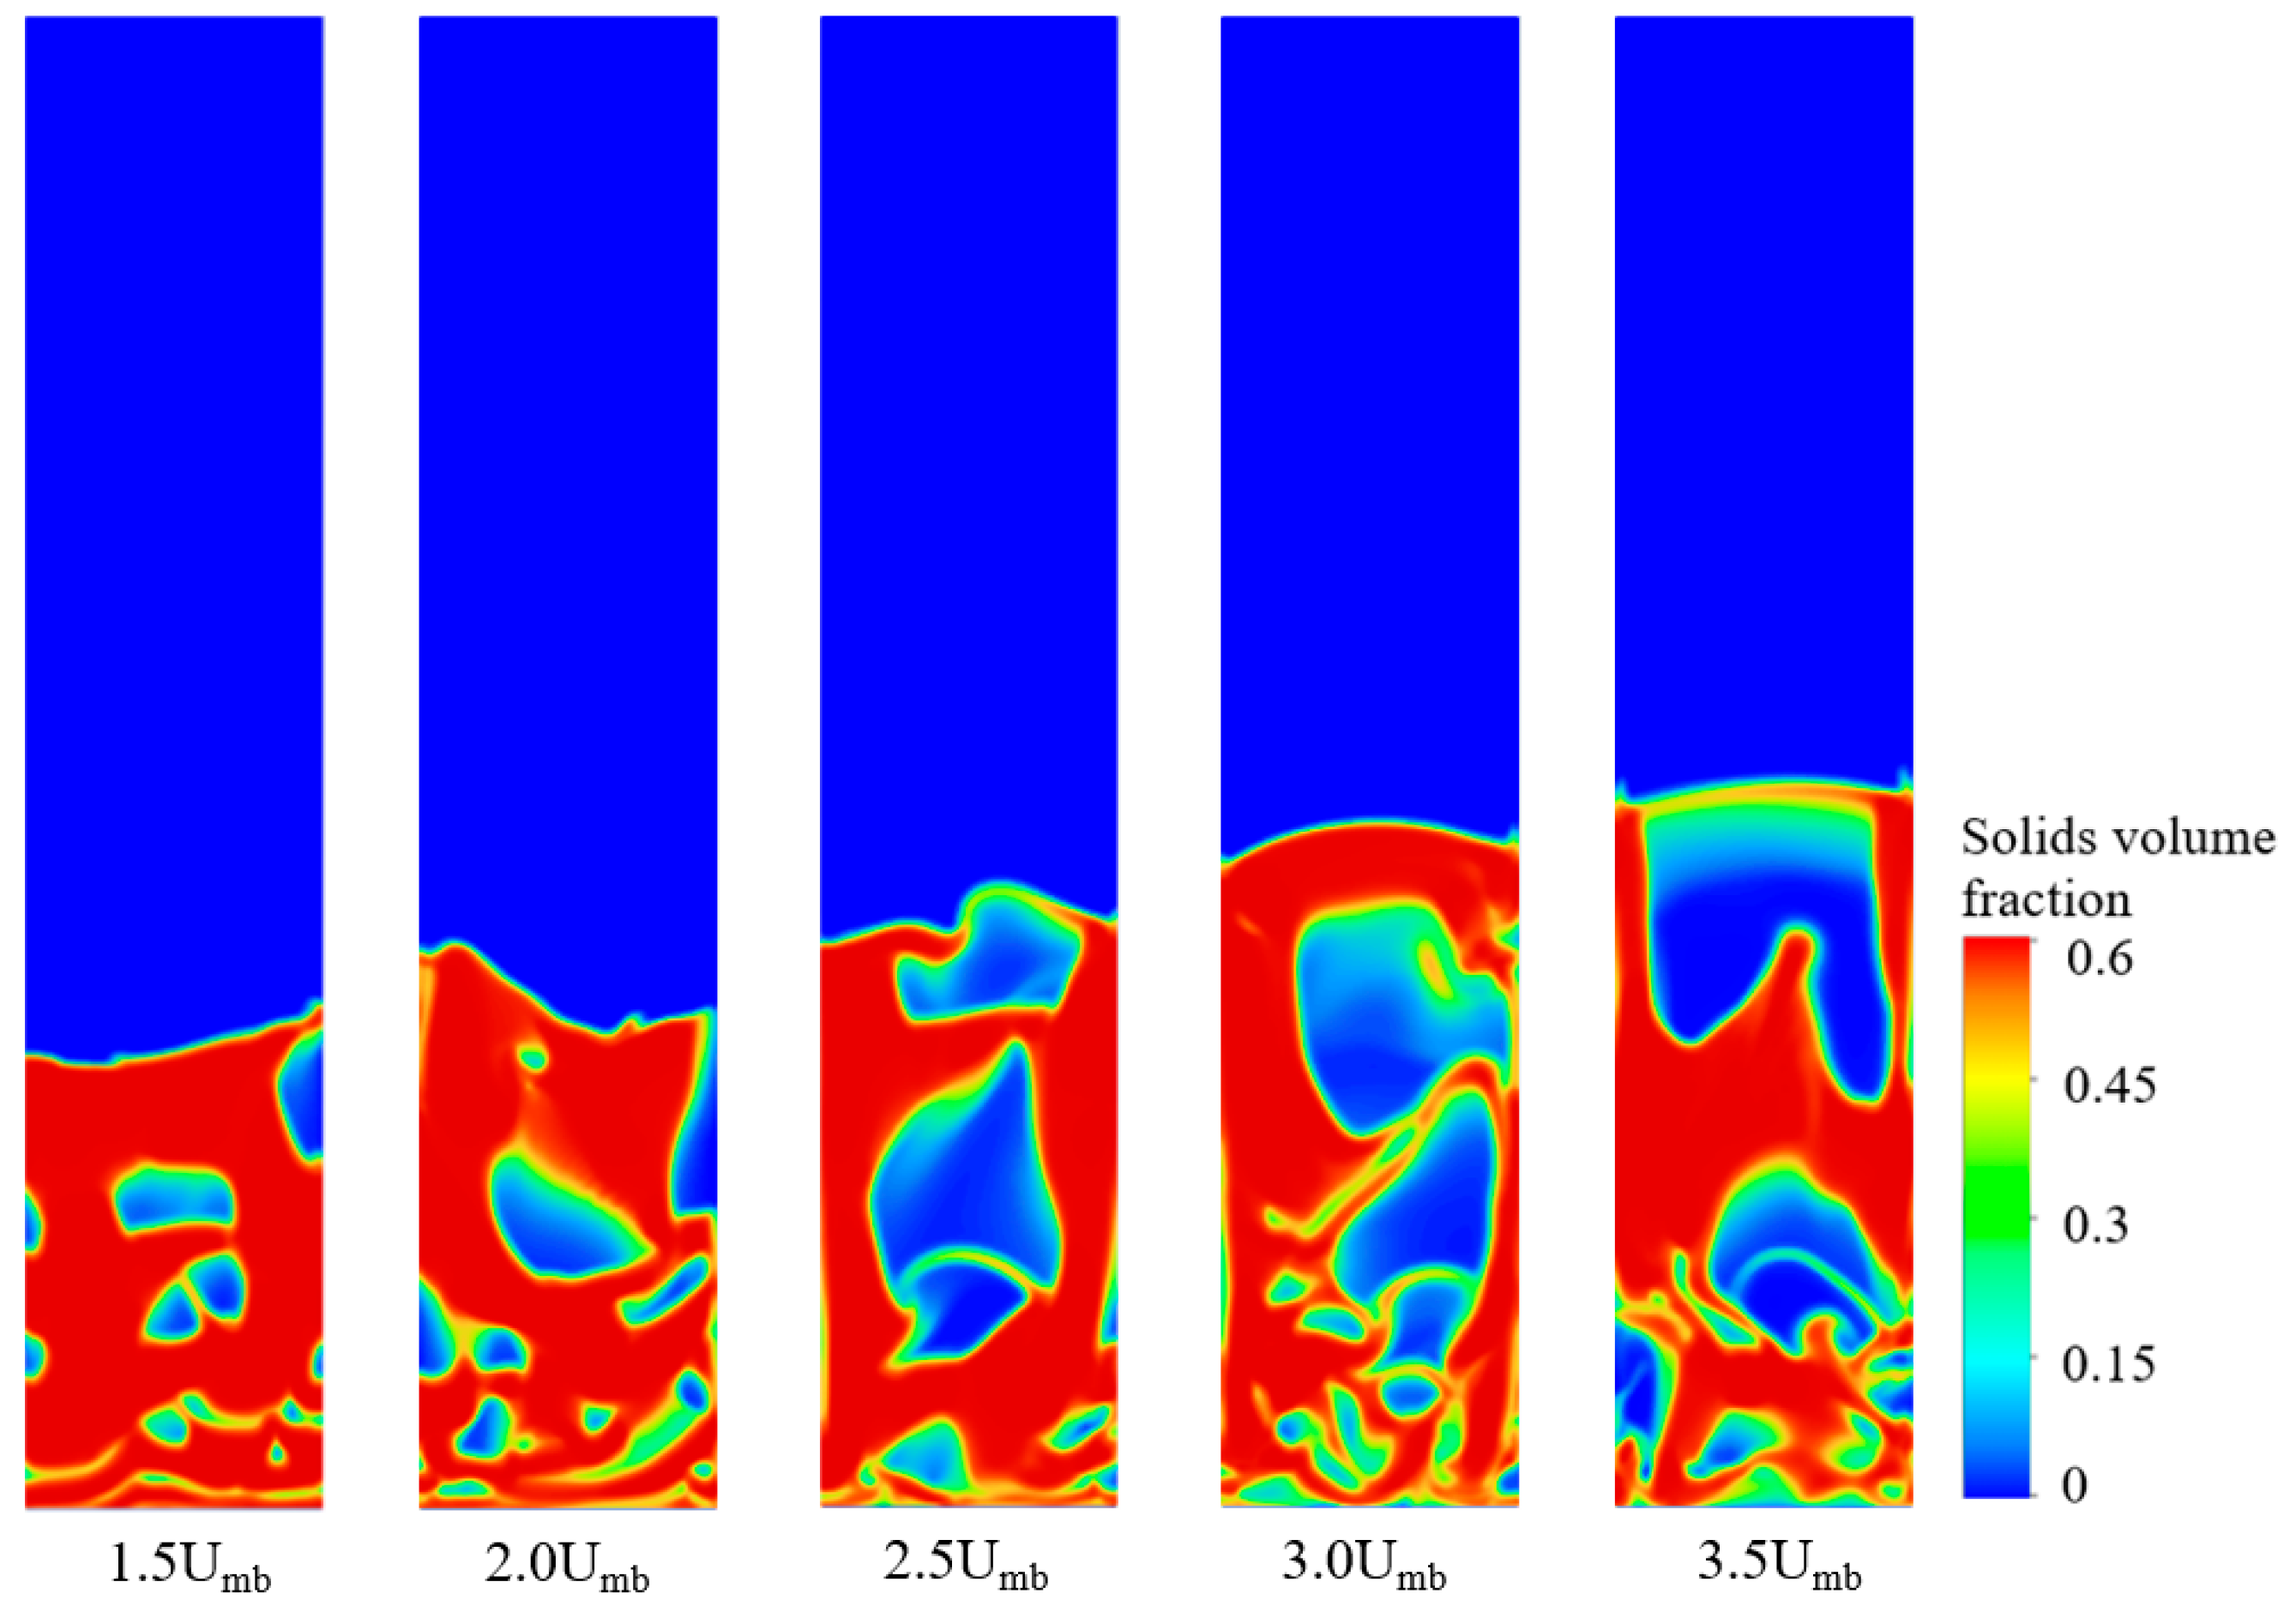
The CO2 concentration at the outlet of a bubbling bed reactor is influenced not only by the CO2 concentrations in the bubble phase and the emulsion phase within the bed but also by the volume fractions of these two phases. Figure 8 presents typical spatial distributions of solids holdup for the five inlet gas velocities investigated in this study. It can be observed that as the inlet gas velocity increases, both the bed height and the bubble size within the bed exhibit an increasing trend.
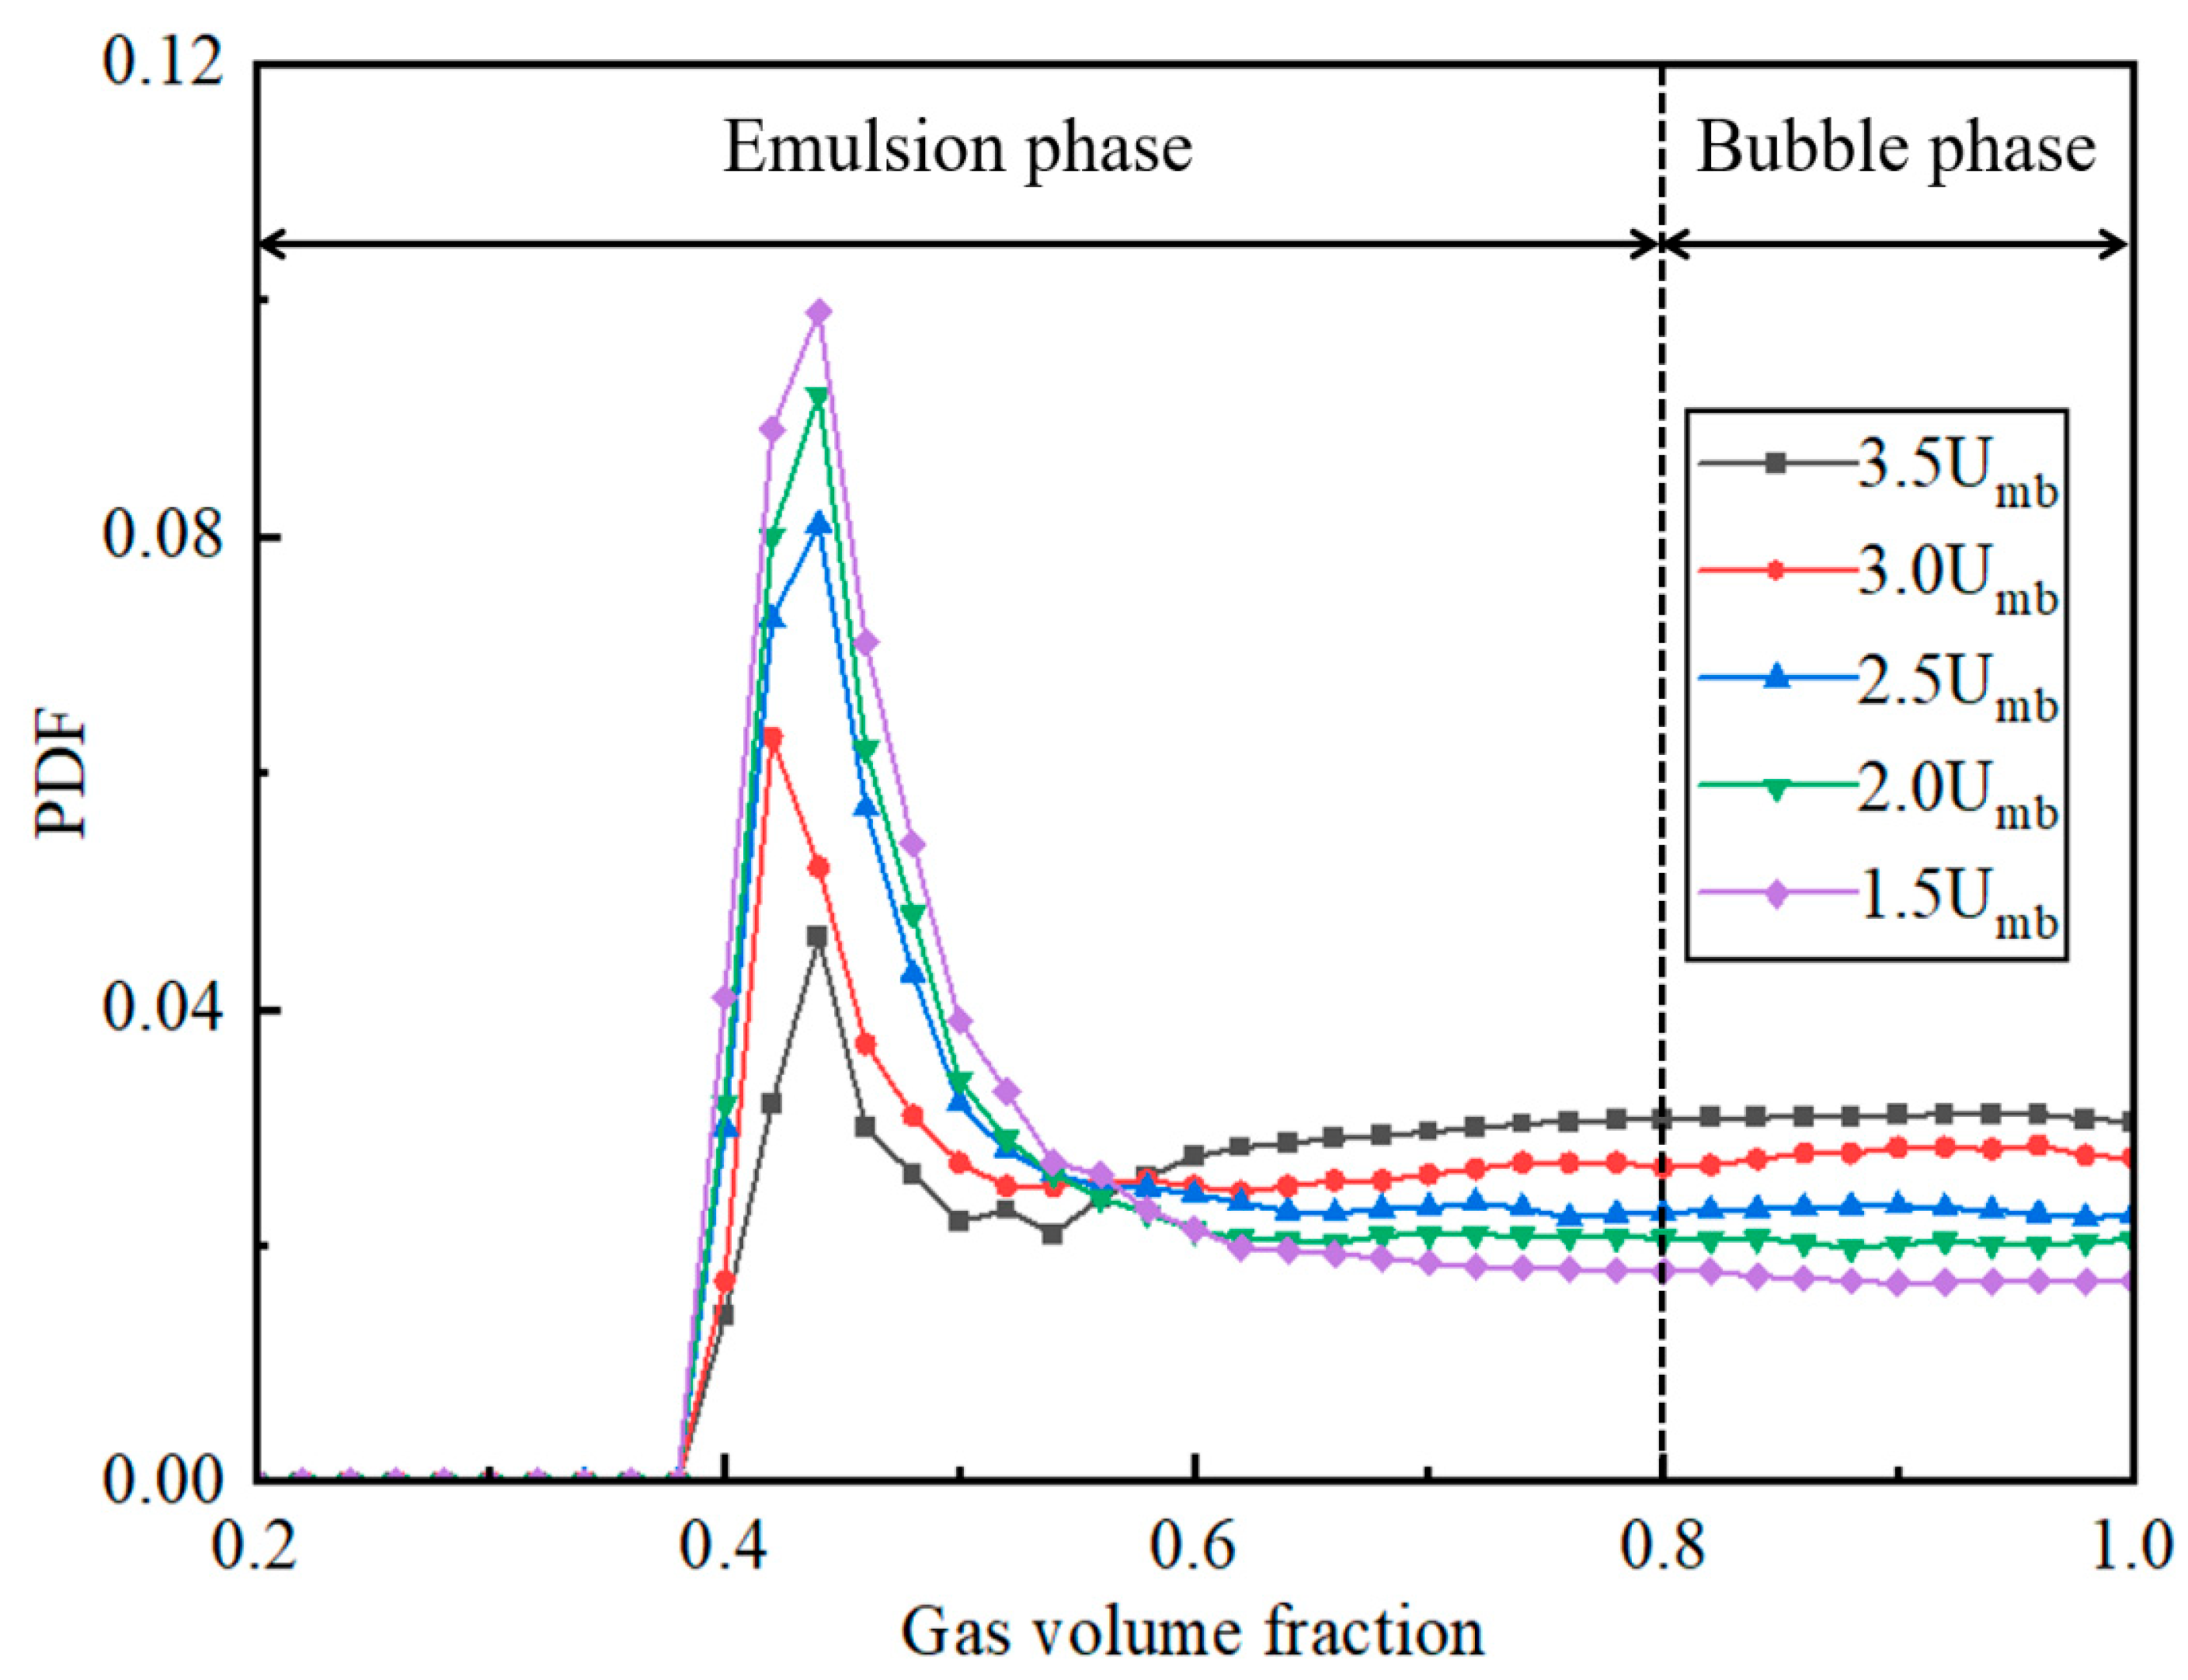
To further quantify the distribution of the bubble phase and the emulsion phase within the bed, this study statistically analyzed the probability distribution of voidage, with the results shown in Figure 9. Consistent with the statistical method used for Figure 5, the analysis only considered the voidage of grids whose centroid positions were below the average bed height. The probability distribution of voidage was calculated based on the following formula:
PDF i = k S i A k ρ g , k k FRB A k ρ g , k ε k ε i Δ ε 2 , ε i + Δ ε 2 k S i FRB : freeboard
where Ak represents the area of the computational grid k. For the statistical calculation, the voidage ranging from 0 to 1 was evenly divided into 50 intervals. As shown in Figure 9, the solids holdup within the bed exhibits a unimodal distribution with a long tail. As the superficial gas velocity increases, the volume fraction of grids with a voidage greater than 0.8 gradually increases, indicating a progressive increase in the proportion of the bubble phase and a corresponding decrease in the proportion of the emulsion phase.
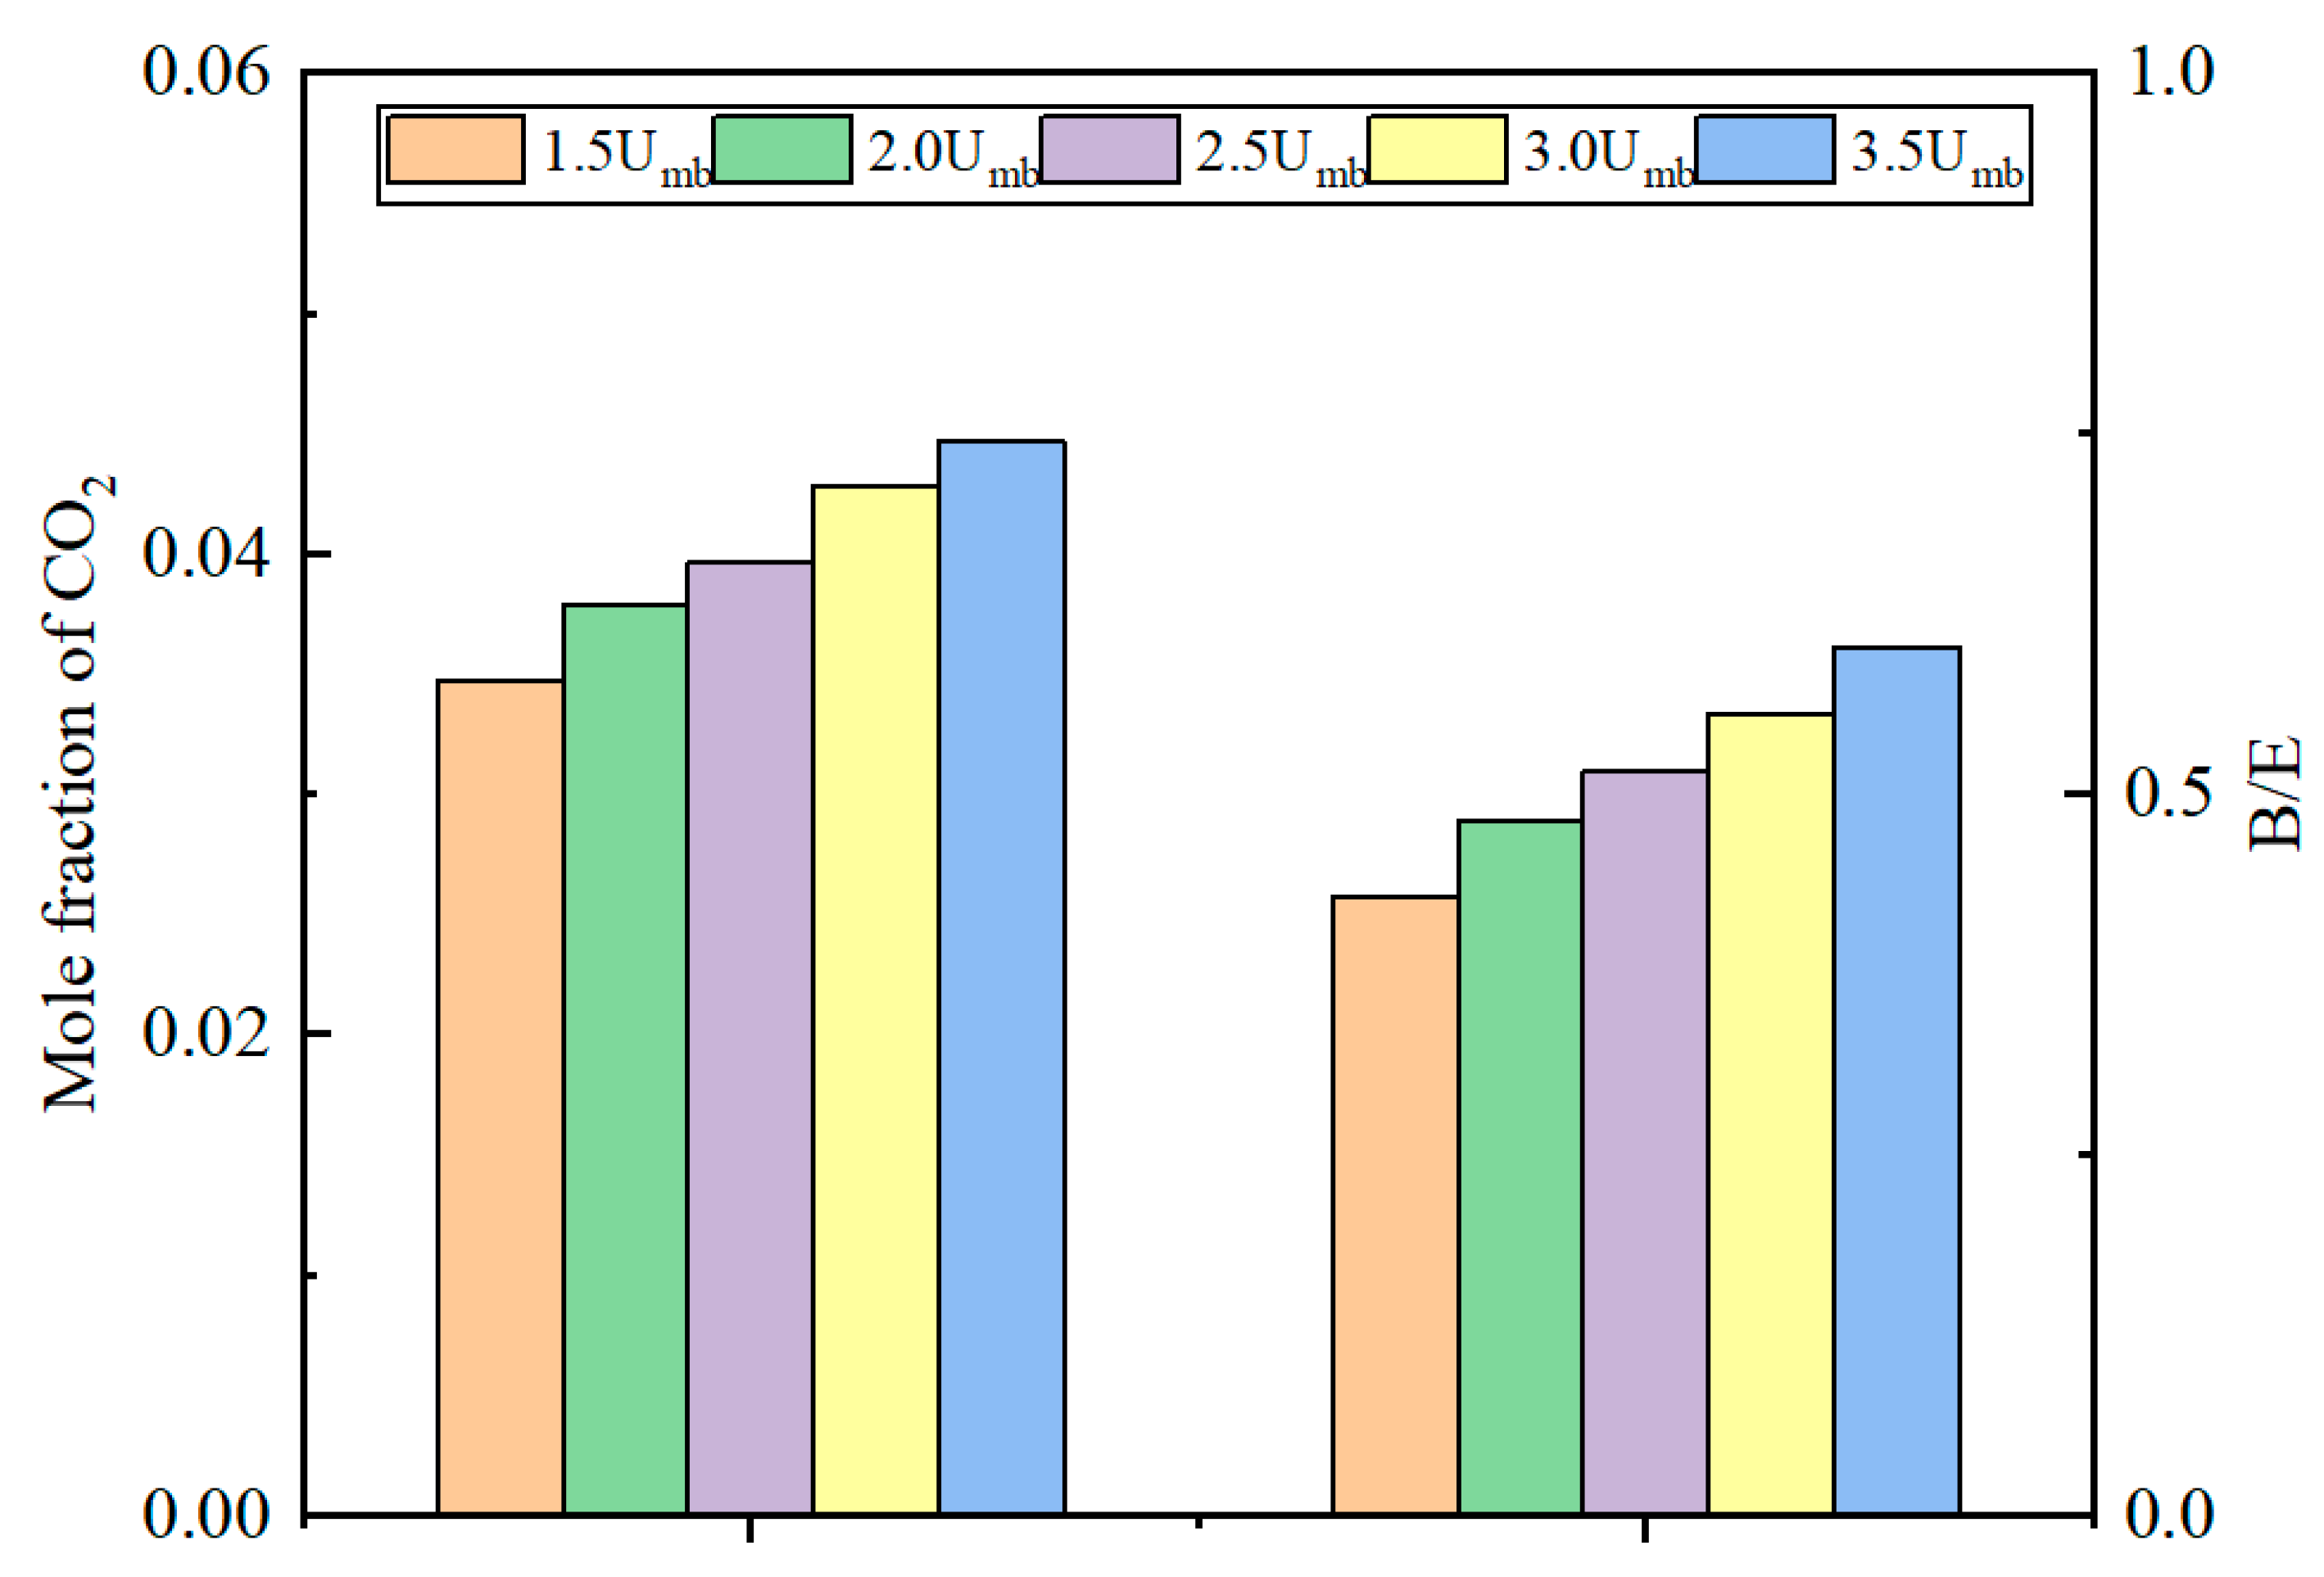
Figure 10 summarizes the area ratio of bubble-phase grids to emulsion-phase grids (B/E) within the bed under different gas velocities, while also presenting the CO2 concentration at the reactor outlet. It can be seen that, within the investigated parameter range, B/E increases approximately linearly with the inlet gas velocity, with the volume occupied by the bubble phase being about half that of the emulsion phase. Similarly to B/E, the CO2 concentration at the reactor outlet also increases approximately linearly with the inlet gas velocity. A comparison of Figure 10 and Figure 6a reveals that the CO2 concentration at the reactor outlet is comparable to that in the bubble phase in the upper part of the solid bed and is significantly higher than that in the emulsion phase. As shown in Figure 6a, at an axial height of 0.15 m, as the inlet gas velocity increases from 1.5 umb to 3.5 umb, the average mole fractions of CO2 in the bubble phase are 0.0328, 0.0352, 0.0386, 0.0411, and 0.0436, respectively; those in the emulsion phase are 0.0021, 0.0039, 0.0056, 0.0074, and 0.0094, respectively; and those at the reactor outlet are 0.0347, 0.0379, 0.0396, 0.0428, and 0.0445, respectively. Such results indicate that the CO2 detected at the reactor outlet primarily originates from unadsorbed CO2 within the bubble phase inside the bed, while the contribution of unadsorbed CO2 from the emulsion phase is almost negligible. From this perspective, to enhance the CO2 adsorption efficiency in a bubbling fluidized bed and reduce the CO2 concentration at the reactor outlet, it is essential to minimize the proportion of the bubble phase within the bed as much as possible.

4. Conclusions

In this work, the Eulerian–Eulerian Two-Fluid Model (TFM) was employed to numerically investigate the CO2 adsorption characteristics of potassium-based solid sorbents in a bubbling fluidized bed. First, the accuracy of the TFM simulations in quantitatively describing the adsorption process was validated against experimental data reported in the literature, and the simulation results showed good agreement with the experimental measurements. Based on this, the CO2 adsorption behaviors in the bubble phase and the emulsion phase within the bed were examined under different superficial gas velocities.
The simulation results indicate that, compared to the emulsion phase, the bubble phase exhibits higher CO2 concentration and gas temperature, but a lower adsorption reaction rate. Along the bed height, both CO2 concentration and adsorption reaction rate in the two phases show a decreasing trend, with a more significant decline observed in the emulsion phase. As the superficial gas velocity increases, the CO2 concentration in both the bubble and emulsion phases rises. The adsorption reaction rate in the emulsion phase is relatively insensitive to changes in gas velocity, whereas that in the bubble phase decreases with increasing gas velocity. Furthermore, an increase in superficial gas velocity leads to a higher volume fraction of the bubble phase within the bed, resulting in an elevated CO2 concentration at the reactor outlet.
A further comparison of CO2 concentrations in the bubble and emulsion phases at the upper part of the bed with the outlet concentration reveals that the CO2 emitted from the reactor mainly originates from the unadsorbed portion in the bubble phase, while the contribution from the unadsorbed CO2 in the emulsion phase is almost negligible. These results indicate that suppressing the expansion of the bubble phase is key to improving CO2 adsorption efficiency and reducing the CO2 concentration at the reactor outlet in a bubbling fluidized bed. This study provides a theoretical basis and optimization direction for the design and improvement of bubbling fluidized bed reactors using potassium-based sorbents for CO2 adsorption.

Author Contributions

Y.G. (Yida Ge): Data curation (equal); Formal analysis (equal); Investigation (equal); Methodology (equal); Software (equal); Validation (equal); Visualization (equal); Writing—original draft (equal); A.M.: Data curation (equal); Formal analysis (equal); Investigation (equal); Methodology (equal); Visualization (equal); Writing—original draft (equal); A.A.: Formal analysis (equal); Investigation (equal); Methodology (equal); Software (equal); Validation (equal); X.P.: Formal analysis (equal); Investigation (equal); Methodology (equal); Software (equal); Validation (equal); Y.G. (Yan Gao): Supervision (supporting). Z.D.: Investigation (equal); Methodology (equal); Supervision (equal). X.L.: Conceptualization (lead); Data curation (equal); Formal analysis (equal); Funding acquisition (lead); Investigation (equal); Methodology (equal); Project administration (lead); Resources (lead); Supervision (equal); Writing—original draft (equal); Writing—review and editing. All authors have read and agreed to the published version of the manuscript.

Funding

The authors acknowledge the financial support from The National Key Research and Development Program of China, Grant No. 2022YFB4101703.

Data Availability Statement

The data that support the findings of this study are available from the corresponding author upon reasonable request.

Conflicts of Interest

Author Yan Gao was employed by China Resources Zizhu Pharmaceutical Co., Ltd. The remaining authors declare that the research was conducted in the absence of any commercial or financial relationships that could be construed as a potential conflict of interest.

Nomenclature

AKinetic validation coefficienttTime, s
CdDrag coefficientTTemperature, K
dpSolid particle diameterumbMinimum bubbling velocity, m/s
eRestitution coefficient between solid particlesugInlet gas velocity, m/s
gGravity acceleration, m/s2vVelocity, m/s
g0Radial distribution functionyMass fraction
hSpecific enthalpy, J/kgβgsGas and solid phases interphase drag coefficient, kg/(m3s)
IUnit tensorεVolume fraction
jiSpecies i flux, kg/(m3s)μsSolid viscosity, kg/(ms)
pPressure, kPaμgGas viscosity, kg/(ms)
QgsIntensity of heat exchange between phases, J/(m3s)ϴGranular temperature, m2/s2
rChemical reaction rate, kmol/(m3s)ρDensity, kg/m3
RUniversal gas constant, J/(kgmolK)τStress tensor, Pa
ReReynolds NumberξBulkviscosity, kg/(ms)

References

  1. Ganopolski, A.; Winkelmann, R.; Schellnhuber, H.J. Critical insolation–CO2 relation for diagnosing past and future glacial inception. Nature 2016, 529, 200–203. [Google Scholar] [CrossRef] [PubMed]
  2. Malhotra, V.M. Reducing CO2 emissions. Concr. Int. 2006, 28, 42–45. [Google Scholar]
  3. Breault, R.W.; Huckaby, E.D. Parametric behavior of a CO2 capture process: CFD simulation of solid-sorbent CO2 absorption in a riser reactor. Appl. Energy 2013, 112, 224–234. [Google Scholar] [CrossRef]
  4. Barelli, L.; Bidini, G.; Gallorini, F. CO2 capture with solid sorbent: CFD model of an innovative reactor concept. Appl. Energy 2016, 162, 58–67. [Google Scholar] [CrossRef]
  5. Covert, T.; Greenstone, M.; Knittel, C.R. Will we ever stop using fossil fuels? J. Econ. Perspect. 2016, 30, 117–138. [Google Scholar] [CrossRef]
  6. Qin, C.; Yin, J.; Ran, J.; Zhang, L.; Feng, B. Effect of support material on the performance of K2CO3-based pellets for cyclic CO2 capture. Appl. Energy 2014, 136, 280–288. [Google Scholar] [CrossRef]
  7. Li, J.; Hitch, M. Carbon dioxide adsorption isotherm study on mine waste for integrated CO2 capture and sequestration processes. Powder Technol. 2016, 291, 408–413. [Google Scholar] [CrossRef]
  8. Lee, S.C.; Choi, B.Y.; Ryu, C.K.; Ahn, Y.S.; Lee, T.J.; Kim, J.C. The effect of water on the activation and the CO2 capture capacities of alkali metal-based sorbents. Korean J. Chem. Eng. 2006, 23, 374–379. [Google Scholar] [CrossRef]
  9. Lee, S.C.; Kim, J.C. Dry potassium-based sorbents for CO2 capture. Catal. Surv. Asia 2007, 11, 171–185. [Google Scholar] [CrossRef]
  10. Lee, S.C.; Chae, H.J.; Lee, S.J.; Choi, B.Y.; Yi, C.K.; Lee, J.B.; Ryu, C.K.; Kim, J.C. Development of regenerable MgO-based sorbent promoted with K2CO3 for CO2 capture at low temperatures. Environ. Sci. Technol. 2008, 42, 2736–2741. [Google Scholar] [CrossRef]
  11. Lee, S.C.; Kwon, Y.M.; Park, Y.H.; Lee, W.S.; Park, J.J.; Ryu, C.K.; Yi, C.K.; Kim, J.C. Structure effects of potassium-based TiO2 sorbents on the CO2 capture capacity. Top. Catal. 2010, 53, 641–647. [Google Scholar] [CrossRef]
  12. Wang, S.; Yan, S.; Ma, X.; Gong, J. Recent advances in capture of carbon dioxide using alkali-metal-based oxides. Energy Environ. Sci. 2011, 4, 3805–3819. [Google Scholar] [CrossRef]
  13. Hayashi, H.; Taniuchi, J.; Furuyashiki, N.; Sugiyama, S.; Hirano, S.; Shigemoto, N.; Nonaka, T. Efficient recovery of carbon dioxide from flue gases of coal-fired power plants by cyclic fixed-bed operations over K2CO3-on-carbon. Ind. Eng. Chem. Res. 1998, 37, 185–191. [Google Scholar] [CrossRef]
  14. You, Y.Y.; Liu, X.J.; Liu, T.L. Numerical investigations of CO2 sorption and recovery process from wet flue gas by using K2CO3/Al2O3 in a fixed bed. Energy Fuels 2018, 32, 725–735. [Google Scholar] [CrossRef]
  15. Wang, W.; Yu, Y.; Li, B.; Xiong, J.; Wei, G.; Yang, X.; Deng, B.; Li, M.; Peng, S.; Liu, H. Morphology engineering-driven high-performance potassium-based CO2 adsorbents: Interface design and structure-activity relationship study. J. Environ. Chem. Eng. 2025, 13, 118143. [Google Scholar] [CrossRef]
  16. Jaiboon, O.-A.; Chalermsinsuwan, B.; Mekasut, L.; Piumsomboon, P. Effect of flow patterns/regimes on CO2 capture using K2CO3 solid sorbent in fluidized bed/circulating fluidized bed. Chem. Eng. J. 2013, 219, 262–272. [Google Scholar] [CrossRef]
  17. Ju, Y.; Oh, H.T.; Lee, C.H. Sensitivity analysis of CO2 capture process in cyclic fluidized-bed with regeneration of solid sorbent. Chem. Eng. J. 2020, 379, 122291. [Google Scholar] [CrossRef]
  18. Boonprasop, S.; Sangteerasintop, S.; Chalermsinsuwan, B.; Piumsomboon, P. Optimum operating parameters of CO2 sorption in turbulent fluidized bed regime using potassium carbonate supported on gamma alumina solid sorbent. RSC Adv. 2018, 8, 39678–39690. [Google Scholar] [CrossRef]
  19. Zhao, C.; Chen, X.; Zhao, C.; Wu, Y.; Dong, W. K2CO3/Al2O3 for capturing CO2 in flue gas from power plants. Part 3: CO2 capture behaviors of K2CO3/Al2O3 in a bubbling fluidized-bed reactor. Energy Fuels 2012, 26, 3062–3068. [Google Scholar] [CrossRef]
  20. Nouri, M.; Rahpaima, G.; Nejad, M.M.; Imani, M. Computational simulation of CO2 capture process in a fluidized-bed reactor. Comput. Chem. Eng. 2018, 108, 1–10. [Google Scholar] [CrossRef]
  21. Chalermsinsuwan, B.; Piumsomboon, P.; Gidaspow, D. A computational fluid dynamics design of a carbon dioxide sorption circulating fluidized bed. AIChE J. 2010, 56, 2805–2824. [Google Scholar] [CrossRef]
  22. Thummakul, T.; Gidaspow, D.; Piumsomboon, P.; Chalermsinsuwan, B. CFD simulation of CO2 sorption on K2CO3 solid sorbent in novel high flux circulating-turbulent fluidized bed riser: Parametric statistical experimental design study. Appl. Energy 2017, 190, 122–134. [Google Scholar] [CrossRef]
  23. Shen, Y.; Ma, J.; Liu, D.; Wu, Y.; Zhong, J.; Chen, X.; Wu, Y.; Liang, C. Two-dimensional full-loop simulation of CO2 capture process in a novel dual fluidized bed system. Fuel Process. Technol. 2020, 205, 106429. [Google Scholar] [CrossRef]
  24. Wang, S.; Wang, Q.; Chen, J.; Liu, G.; Lu, H.; Sun, L. Assessment of CO2 capture using potassium-based sorbents in circulating fluidized bed reactor by multiscale modeling. Fuel 2016, 164, 66–72. [Google Scholar] [CrossRef]
  25. Zhang, Z.; Liu, D.; Zhuang, Y.; Meng, Q.; Chen, X. CFD-DEM modeling of CO2 capture using alkali metal-based sorbents in a bubbling fluidized bed. Int. J. Chem. React. Eng. 2014, 12, 441–449. [Google Scholar] [CrossRef]
  26. Ayobi, M.; Shahhosseini, S.; Behjat, Y. Computational and experimental investigation of CO2 capture in gas–solid bubbling fluidized bed. J. Taiwan Inst. Chem. Eng. 2014, 45, 421–430. [Google Scholar] [CrossRef]
  27. Lu, L.; Konan, A.; Benyahia, S. Influence of grid resolution, parcel size and drag models on bubbling fluidized bed simulation. Chem. Eng. J. 2017, 326, 627–639. [Google Scholar] [CrossRef]
  28. Liu, X.; Wang, S.; Du, Y.; Zheng, M.; Yang, S.; Wang, H. CFD study of the thermochemical characteristics of mesoscale bubbles in a BFB gasifier. Adv. Powder Technol. 2021, 32, 2605–2620. [Google Scholar] [CrossRef]
  29. Kong, D.; Wang, S.; Luo, K.; Yu, J.; Fan, J. Bubble dynamics and thermochemical characteristics of bubbling fluidized bed methanation. Fuel 2023, 338, 127292. [Google Scholar] [CrossRef]
  30. Su, Z.; Jiang, H.; Li, X.; Du, X.; Liang, C.; Duan, L.; Chen, H.; Chen, X. Investigation of mechanisms for heat transfer and reaction in indirectly heated CaCO3 thermochemical energy storage based on CFD-DEM. Powder Technol. 2025, 452, 120506. [Google Scholar] [CrossRef]
  31. Wang, S.; Shen, Y. Particle-scale study of heat and mass transfer in a bubbling fluidised bed. Chem. Eng. Sci. 2021, 240, 116655. [Google Scholar] [CrossRef]
  32. Wu, W.; Duan, L.; Li, L.; Yang, Z.; Liu, D.; Anthony, E.J. The gas interchange between bubble and emulsion phases in a pressurized fluidized bed by computational fluid dynamics simulations. Ind. Eng. Chem. Res. 2021, 60, 4142–4152. [Google Scholar] [CrossRef]
  33. Wang, S.; Hu, B.; Jin, C.; Yang, X.; Zhang, K. Dense discrete phase model simulations of CO2 capture process in a fluidized bed absorber with potassium-based solid sorbent. Powder Technol. 2019, 345, 260–266. [Google Scholar] [CrossRef]
  34. Wang, S.; Kuang, G.; Shao, B.; Chen, X.; Xie, L.; Ma, Y. Numerical simulation on adsorption of CO2 using K2CO3 particles in the bubbling fluidized bed. Asia-Pac. J. Chem. Eng. 2024, 19, e3041. [Google Scholar] [CrossRef]
  35. Ren, H.; Zhang, H.; Li, W.; Tang, Z.; Zhang, D. Simulation of CO2 capture process in gas-solid bubbling fluidized bed by computational mass transfer. J. Environ. Chem. Eng. 2022, 10, 108548. [Google Scholar] [CrossRef]
  36. Geng, S.; Qian, Y.; Zhan, J.; Zhang, H.; Xu, G.; Liu, X. Prediction of solids residence time distribution in cross-flow bubbling fluidized bed. Powder Technol. 2017, 320, 555–564. [Google Scholar] [CrossRef]
  37. Liu, X.; Zhu, C.; Geng, S.; Yao, M.; Zhan, J.; Xu, G. Two-fluid modeling of Geldart A particles in gas–solid micro-fluidized beds. Particuology 2015, 21, 118–127. [Google Scholar] [CrossRef]
Figure 1. Schematic diagram of the two-dimensional bubbling fluidized bed.
Processes 14 01003 g001
Figure 2. Comparisons between simulation results and experimental data reported by Ayobi et al. [26] (a) Bed expansion ratio. (b) Temporal evolutions of CO2 molar fraction at outlet.
Processes 14 01003 g002
Figure 3. Contour distributions of various physical quantities during the carbonation process inside the reactor: (a) Solid volume fraction; (b) Reaction rate; (c) CO2 concentration; (d) Gas static temperature. ug = 2.0 umb.
Processes 14 01003 g003
Figure 4. (ad) Temporal evolutions of solid volume fraction, reaction rate, CO2 mole fraction, and gas temperature monitored at (0.05 m, 0.05 m). ug = 2.0 umb.
Processes 14 01003 g004
Figure 5. Variations in CO2 concentration (a) and reaction rate (b) with solid volume fraction (expressed as multiples of the minimum bubbling velocity umb = 0.26 m/s).
Processes 14 01003 g005
Figure 6. Axial distributions of the spatiotemporally averaged CO2 concentrations (a) and adsorption reaction rates (b) in the bubble phase and the emulsion phase at different gas velocities (expressed as multiples of the minimum bubbling velocity umb = 0.26 m/s).
Processes 14 01003 g006
Figure 7. Variations in CO2 concentration (a) and reaction rate (b) with gas velocity.
Processes 14 01003 g007
Figure 8. Snapshots on the solid volume fraction distribution at various gas velocity.
Processes 14 01003 g008
Figure 9. Distributions of gas volume fraction inside the solid bed.
Processes 14 01003 g009
Figure 10. Variations in CO2 concentration at the outlet and the area ratio of bubble-phase grids to emulsion-phase grids.
Processes 14 01003 g010
Table 1. Summary of the simulation conditions.
ParameterValue
Bed height (m)0.7
Bed width (m)0.1
Initial packing height (m)0.1
Initial solid volume fraction0.5
Particle diameter (mm)0.4
Particle density (kg/m3)2300
Inlet gas compositionCO2:H2O:N2 = 0.1:0.1:0.8
Gas temperature at the inlet (K)343
Inlet gas velocity, ug1.5 umb, 2.0 umb, 2.5 umb, 3.0 umb, 3.5 umb
Specularity coefficient0.1
Packing limit0.63
Frictional packing limit0.55
Time step0.0001
Disclaimer/Publisher’s Note: The statements, opinions and data contained in all publications are solely those of the individual author(s) and contributor(s) and not of MDPI and/or the editor(s). MDPI and/or the editor(s) disclaim responsibility for any injury to people or property resulting from any ideas, methods, instructions or products referred to in the content.