Article

Research on Enhanced Gas Recovery by CO2/N2 Injection in Tight Sandstone Gas Reservoirs

1
PetroChina Changqing Oilfield Exploration & Development Research Institute, Xi’an 710021, China
2
National Engineering Laboratory for Exploration and Development of Low-Permeability Oil & Gas Fields, Xi’an 710021, China
3
State Key Laboratory of Oil and Gas Reservoir Geology and Exploitation, Southwest Petroleum University, Xindu, Chengdu 610500, China
4
Huairou Laboratory, Huairou, Beijing 101400, China
*
Authors to whom correspondence should be addressed.
Processes 2026, 14(5), 868; https://doi.org/10.3390/pr14050868
Submission received: 5 February 2026 / Revised: 1 March 2026 / Accepted: 6 March 2026 / Published: 8 March 2026
(This article belongs to the Topic Petroleum and Gas Engineering, 2nd edition)

Abstract

CO2-enhanced gas recovery (CO2-EGR) is a crucial technology for achieving both natural gas production increase and CO2 geological storage. While pure CO2 flooding demonstrates favorable recovery performance, the technical challenges and high costs associated with purifying CO2 remain significant. CO2 purification from exhaust gas incurs prohibitive costs, while direct injection of an unpurified CO2–N2 mixture can greatly cut engineering expenditure. Nitrogen also provides synergistic pressure support, working with CO2 to drive natural gas displacement. Therefore, from an economic and practical standpoint, employing impure CO2 mixtures (e.g., CO2–N2) for flooding presents a more advantageous approach. To clarify the factors influencing the recovery enhancement in tight sandstone gas reservoirs using CO2–N2 mixtures, long-core flooding experiments were conducted at 100 °C. This study systematically investigates the impact patterns of three key factors—injection timing, injection rate, and injection gas composition—on the enhanced recovery of tight sandstone gas reservoirs. The experimental results indicate that: (1) Advancing the injection timing significantly improves the recovery performance for both CO2 and N2 flooding. However, the cumulative recovery factor (sum of the depletion recovery and the incremental recovery from gas injection) shows a declining trend. (2) The enhanced recovery effect exhibits a trend of first increasing and then decreasing with the increase in injection rate. When the injection rate exceeds 0.05 mL/min, it tends to cause premature breakthrough of the injected gas, thereby reducing the displacement efficiency. (3) As the proportion of CO2 in the injected gas increases, the enhanced recovery effect shows a nonlinear rise. The highest incremental recovery (17.02%) was achieved with pure CO2 flooding, while pure N2 flooding yielded the lowest result (14.64%). The research findings, from a macroscopic perspective, elucidate the influence patterns of three distinct factors on enhancing gas recovery in tight sandstone reservoirs, thereby providing theoretical foundation and scientific guidance for the development of such reservoirs. In summary, the injection timing, injection rate and CO2 proportion in injected gas are the key controlling factors for gas flooding enhanced recovery in tight sandstone reservoirs. This study clarifies the macroscopic influence law of each factor, and the optimized development parameters proposed can provide direct theoretical support and technical guidance for the on-site application of gas flooding in tight sandstone reservoirs.

1. Introduction

As the cleanest and lowest-carbon fossil energy source, natural gas serves as an indispensable component in the construction of China’s new energy system. In 2024, China’s natural gas output attained 2464 × 108 m3, with apparent consumption surpassing 4000 × 108 m3 and natural gas imports totaling 1817 × 108 m3, which resulted in an external dependence rate of 42%. Accordingly, the task of safeguarding energy security remains arduous [1]. Given this context, accelerating the development of natural gas has become a core priority in China’s energy development strategy [2]. As a key constituent of unconventional natural gas, tight sandstone gas has gradually emerged as an increasingly prominent strategic element in the natural gas resource structure. Enhancing its recovery efficiency is widely acknowledged as a critical breakthrough for the efficient exploitation of unconventional natural gas resources in China [3,4]. Nevertheless, the development of tight sandstone gas reservoirs poses three major technical bottlenecks: inadequate recovery efficiency, rapid production decline, and limited economic viability. Therefore, systematic investigation into the key influencing factors and their intrinsic action mechanisms for improving tight sandstone gas recovery holds profound significance for the effective development and rational utilization of China’s tight gas resources [5]. CO2-Enhanced Gas Recovery (CO2-EGR) represents a critical technological pathway for realizing the synergistic development of natural gas production enhancement and CO2 geological sequestration. However, the utilization of pure CO2 flooding is accompanied by notable challenges, including high purification difficulty and substantial costs. Consequently, the adoption of a CO2/N2 mixed system for flooding demonstrates greater advantages in terms of economic feasibility [6].
Scholars at home and abroad have conducted extensive research on the mechanism of enhancing gas reservoir recovery efficiency via CO2/N2 injection. The physical properties of the injected gas exert a direct influence on the gas reservoir recovery performance. CO2 and CH4 exhibit significant differences in density and viscosity: the injected CO2 tends to settle preferentially at the bottom of the gas reservoir and drives natural gas toward production wells through gravitational differentiation, thereby improving recovery efficiency [7]. Studies have indicated that the diffusion coefficient of N2 is higher than that of CO2, and nitrogen is more likely to mix with methane. Therefore, the injection of CO2/N2 mixed gas can also effectively enhance CH4 recovery efficiency [8].
The selection of gas injection parameters exerts a significant influence on the effectiveness of CO2/N2 in enhancing gas reservoir recovery efficiency. Gas injection timing has been identified as one of the key factors affecting recovery efficiency, and an earlier injection timing generally contributes to better development performance. In particular, when CO2 is in a supercritical state, its recovery enhancement effect on tight gas reservoirs is superior to that in a non-supercritical state [9,10,11,12,13,14]. Furthermore, when the injection pressure exceeds a certain threshold, the gain in recovery efficiency is no longer significant, and it is necessary to optimize pressure control to achieve a balance between economic feasibility and recovery performance [15]. An increase in injection rate can expand the sweep range of CO2 in the core and more effectively displace natural gas in micro-pores, thereby increasing the ultimate recovery efficiency [16,17,18]. However, there exists an optimal threshold for the gas injection rate; exceeding this threshold will reduce the recovery efficiency due to premature gas breakthrough [19].
Reservoir conditions and injection schemes also have a significant impact on the effectiveness of CO2/N2 injection in enhancing gas reservoir recovery efficiency, with complex action mechanisms that jointly determine the ultimate efficiency of the displacement process. Luo et al. [20] pointed out through numerical simulation that strong reservoir heterogeneity can accelerate the formation of CO2 preferential channels, leading to shortened breakthrough time and reduced CH4 recovery efficiency. In contrast, Zhao et al. and Wu Jiaqi et al. [21,22] found that the development of a complex fracture network can expand the sweep volume, significantly improve CH4 recovery efficiency, and delay CO2 breakthrough. Fan et al. [23] proposed a strategy of progressive CO2 injection increment through numerical simulation, which can maintain a high CH4 production rate while inhibiting matrix swelling, resulting in an 8% to 12% increase in recovery efficiency.
In response to the above issues, this study takes the tight sandstone gas reservoir of the Sulige Gas Field in the Ordos Basin as the research object. Through long core flooding experiments of CO2/N2 injection under different conditions, the impact characteristics of different gas injection parameters on recovery efficiency enhancement are systematically analyzed, aiming to provide a theoretical basis for the efficient development of tight sandstone gas reservoirs by CO2 injection.
Although CO2/N2 injection has been extensively studied in kerogen-rich shales, tight sandstone reservoirs exhibit distinct geomechanical responses (e.g., negligible matrix swelling). Furthermore, previous experimental studies heavily relied on crushed rock samples, which fail to capture the complex multiphase flow dynamics in intact, ultra-low permeability pore-throat networks. This study uniquely employs a 35.8 cm intact long-core physical simulation at actual reservoir conditions (100 °C) to quantitatively evaluate the macroscopic displacement efficiency, specifically focusing on the critical operational parameter of injection timing during depletion.

2. Overview of the Study Area

2.1. Geological Characteristics of the Sulige Gas Field

The Ordos Basin is a large-scale sedimentary Basin characterized by relatively weak tectonic deformation, multi-cyclic evolution, and the development of diverse sedimentary systems, covering an area of approximately 25 × 104 km2. The regional structure of the Sulige Gas Field is gentle, presenting an overall west-dipping monocline with a Formation dip angle generally less than 1°. The major pay zones of the gas field are the 8th member of the Shihezi Formation (He 8 Member) and the 1st member of the Shanxi Formation (Shan 1 Member). The sand bodies of the main pay zones have a width ranging from 0.5 to 3 km, predominantly exhibiting two superposition patterns: lateral juxtaposition and vertical incised stacking. Within the area, the gas-bearing intervals feature good continuity, while the boundary reservoirs are tight, rendering the gas pools relatively isolated. The regional caprocks consist of widely distributed Mudstones and sandy mudstones of the Upper Shihezi Formation, with a cumulative thickness of over 100 m. Meanwhile, the locally developed thick interlayers of the Lower Shihezi Formation serve as the direct caprocks. The basement is composed of lacustrine dark mudstones, coal seams, and tight limestones, which together constitute an effective sealing system. The study area is located in the eastern region, where the target formation is the He 8 Member of the Lower Shihezi Formation in the Upper Paleozoic, one of the main pay zones of the Sulige Gas Field in the Ordos Basin. The reservoirs of the He 8 Member exhibit strong heterogeneity, which is mainly reflected in the pore types dominated by primary residual intergranular pores and secondary lithic dissolution pores. The pore-throat structure is complex, belonging to the low porosity-fine to micro-throat type. According to the high-pressure mercury intrusion data, the throat radius is mainly distributed between 0.05 and 1.0 μm, with a median radius generally less than 0.5 μm. Observations of cast thin sections show that the pore connectivity is moderately poor, and the microscopic heterogeneity is significant [24]. In terms of reservoir physical properties, the overall physical properties of the He 8 Member reservoirs in this area are poor. Based on the statistics of a large number of core experimental data, the porosity ranges from 6% to 12% with an average of 8.5%, and the permeability ranges from 0.1 to 2.0 mD with an average of 0.6 mD. The porosity-permeability relationship shows a positive correlation, but the data points are scattered, indicating strong physical property heterogeneity within the reservoirs. The rock types are dominated by Quartz sandstones, followed by lithic quartz sandstones. From west to east, the quartz content gradually decreases, while the lithic content increases correspondingly. The clay minerals are mainly Illite and Kaolinite, with a small amount of Chlorite.

2.2. Brief Overview of Gas Reservoir Development

The Sulige Gas Field is situated in the northwest of the Yishan Slope in the Ordos Basin, serving as a typical representative of multi-gas layer superposition and development in the Upper Paleozoic. After the launch of systematic exploration in 1999, a major breakthrough was achieved in this area via Well Su-6 in 2000. This discovery marked the official entry of the Sulige Gas Field into the stage of large-scale exploration and development, laying a resource foundation for the development of onshore tight gas in China. The development of the Sulige Gas Field can be divided into three key stages: Appraisal Stage (2001–2006): During this stage, the geological characteristics of the gas field, namely low permeability, low pressure and low abundance, were clarified. A technical system centered on well location optimization and rapid drilling was established, providing a basis for the economic and efficient development of the gas field. Production Ramp-up Stage (2007–2013): The gas production achieved leapfrog growth, with an annual output increase of over 30 × 108 m3 for six consecutive years. By popularizing horizontal well technology and standardized construction mode, the annual gas production reached 135 × 108 m3 in 2012, making it the largest onshore integrated gas field in China. Stable Production Stage (2014–present): The gas field has entered a period of high and stable production. In 2024, the annual gas production stabilized at 300 × 108 m3, accounting for approximately 58% of the total domestic tight gas output. It has maintained an annual gas production exceeding 30 billion cubic meters for three consecutive years, continuously guaranteeing the security of energy supply [25].
As the largest tight Sandstone gas field in China, after achieving the leap of an annual gas production exceeding 30 billion cubic meters, the Sulige Gas Field has now entered the stage of intensive development, with the core objectives of extending the stable production period and improving the ultimate recovery factor. At present, production maintenance and potential tapping mainly rely on conventional technical means such as well pattern infill and optimization, reservoir stimulation technologies including multi-stage fracturing of horizontal wells, water drainage gas recovery, and surface pressure boosting. Although these technologies have achieved remarkable results, they still face fundamental challenges, such as low sweep efficiency caused by strong reservoir heterogeneity, scattered distribution of remaining gas that is difficult to produce, and the balance between the cost and benefit of technical measures. In particular, existing technologies are difficult to effectively mobilize a large amount of isolated remaining gas between wells and layers, which restricts the further improvement of the recovery factor. Therefore, developing new enhanced recovery technologies such as gas injection (e.g., CO2, N2) for energy supplement has become an inevitable trend. By supplementing formation energy and effectively displacing and replacing remaining gas, these technologies are expected to increase the recovery factor by an additional 5% to 7%. Moreover, combined with carbon capture, utilization and storage (CCUS), they can provide a key technical replacement for the green, efficient and sustainable development of the gas field.

3. Experimental Materials and Methods

3.1. Experimental Materials

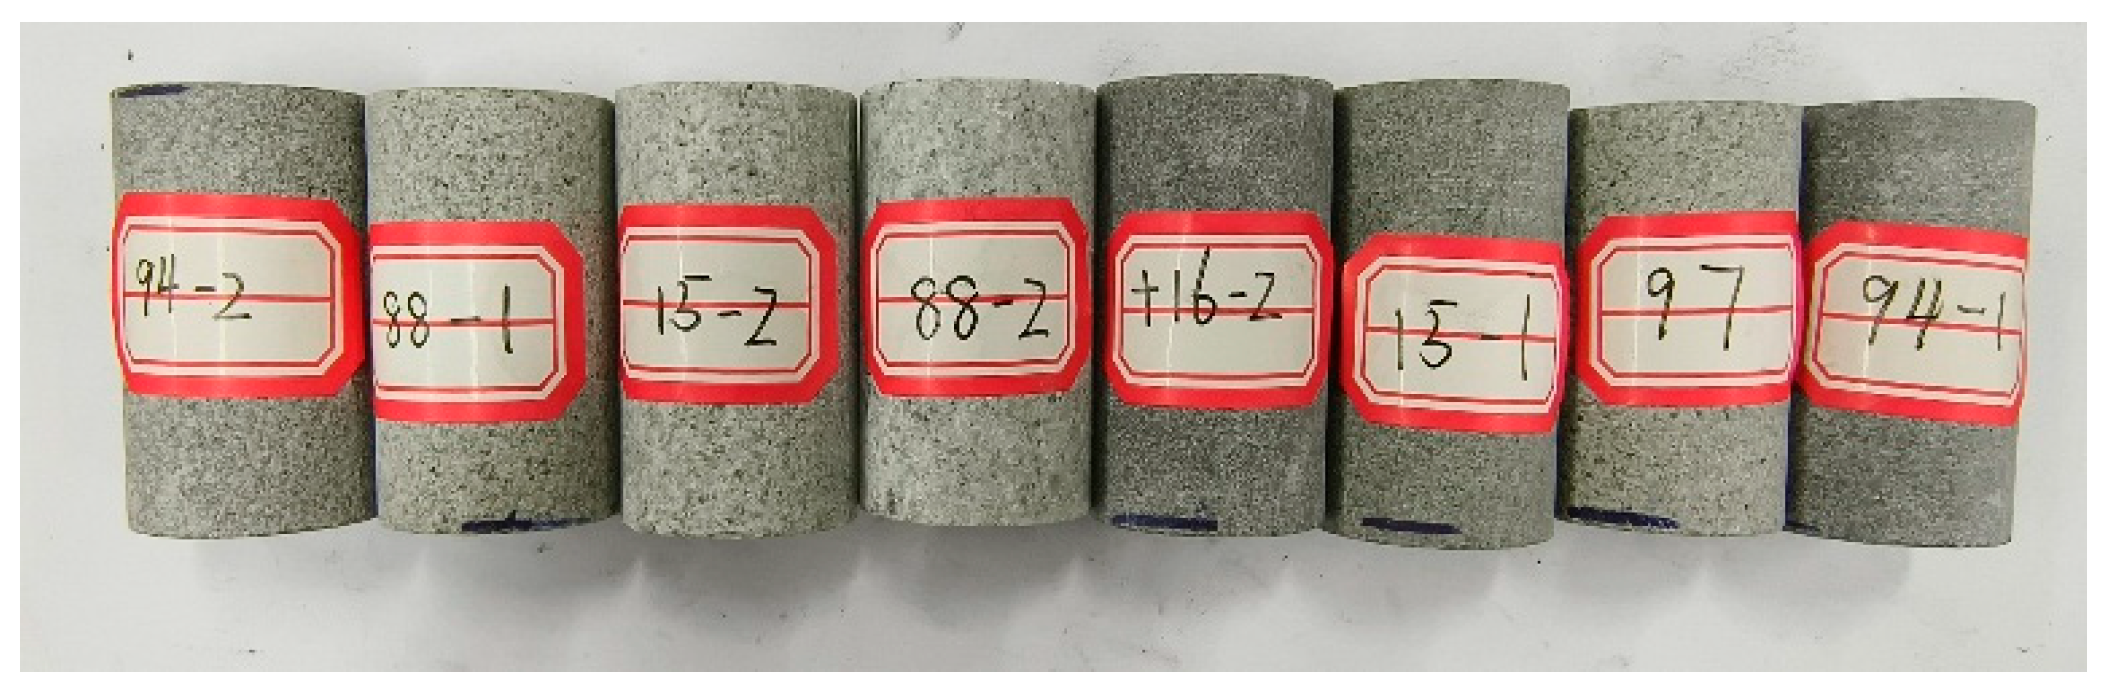
The cores (Figure 1) used in this study were collected from the Sulige Gas Field in the Ordos Basin, with the specific strata being Member He 8 and Member Shan 1, which are classified as Class I reservoirs in the gas field. The quartz content of the cores ranges from 88.7% to 92.4%, and the clay mineral content varies between 11.3% and 7.6%. In addition, the porosity of the cores is in the range of 6.4% to 9.33%, and the permeability is 0.199–0.48 mD. Detailed parameters are listed in Table 1.
The gas components employed in the experiments include high-purity CO2 (with a purity of 99.95%), CH4, N2, and three types of CO2–N2 mixed gases with different proportions, and the uncertainty of the gas components is less than 2%.

3.2. Experimental Instruments and Methods

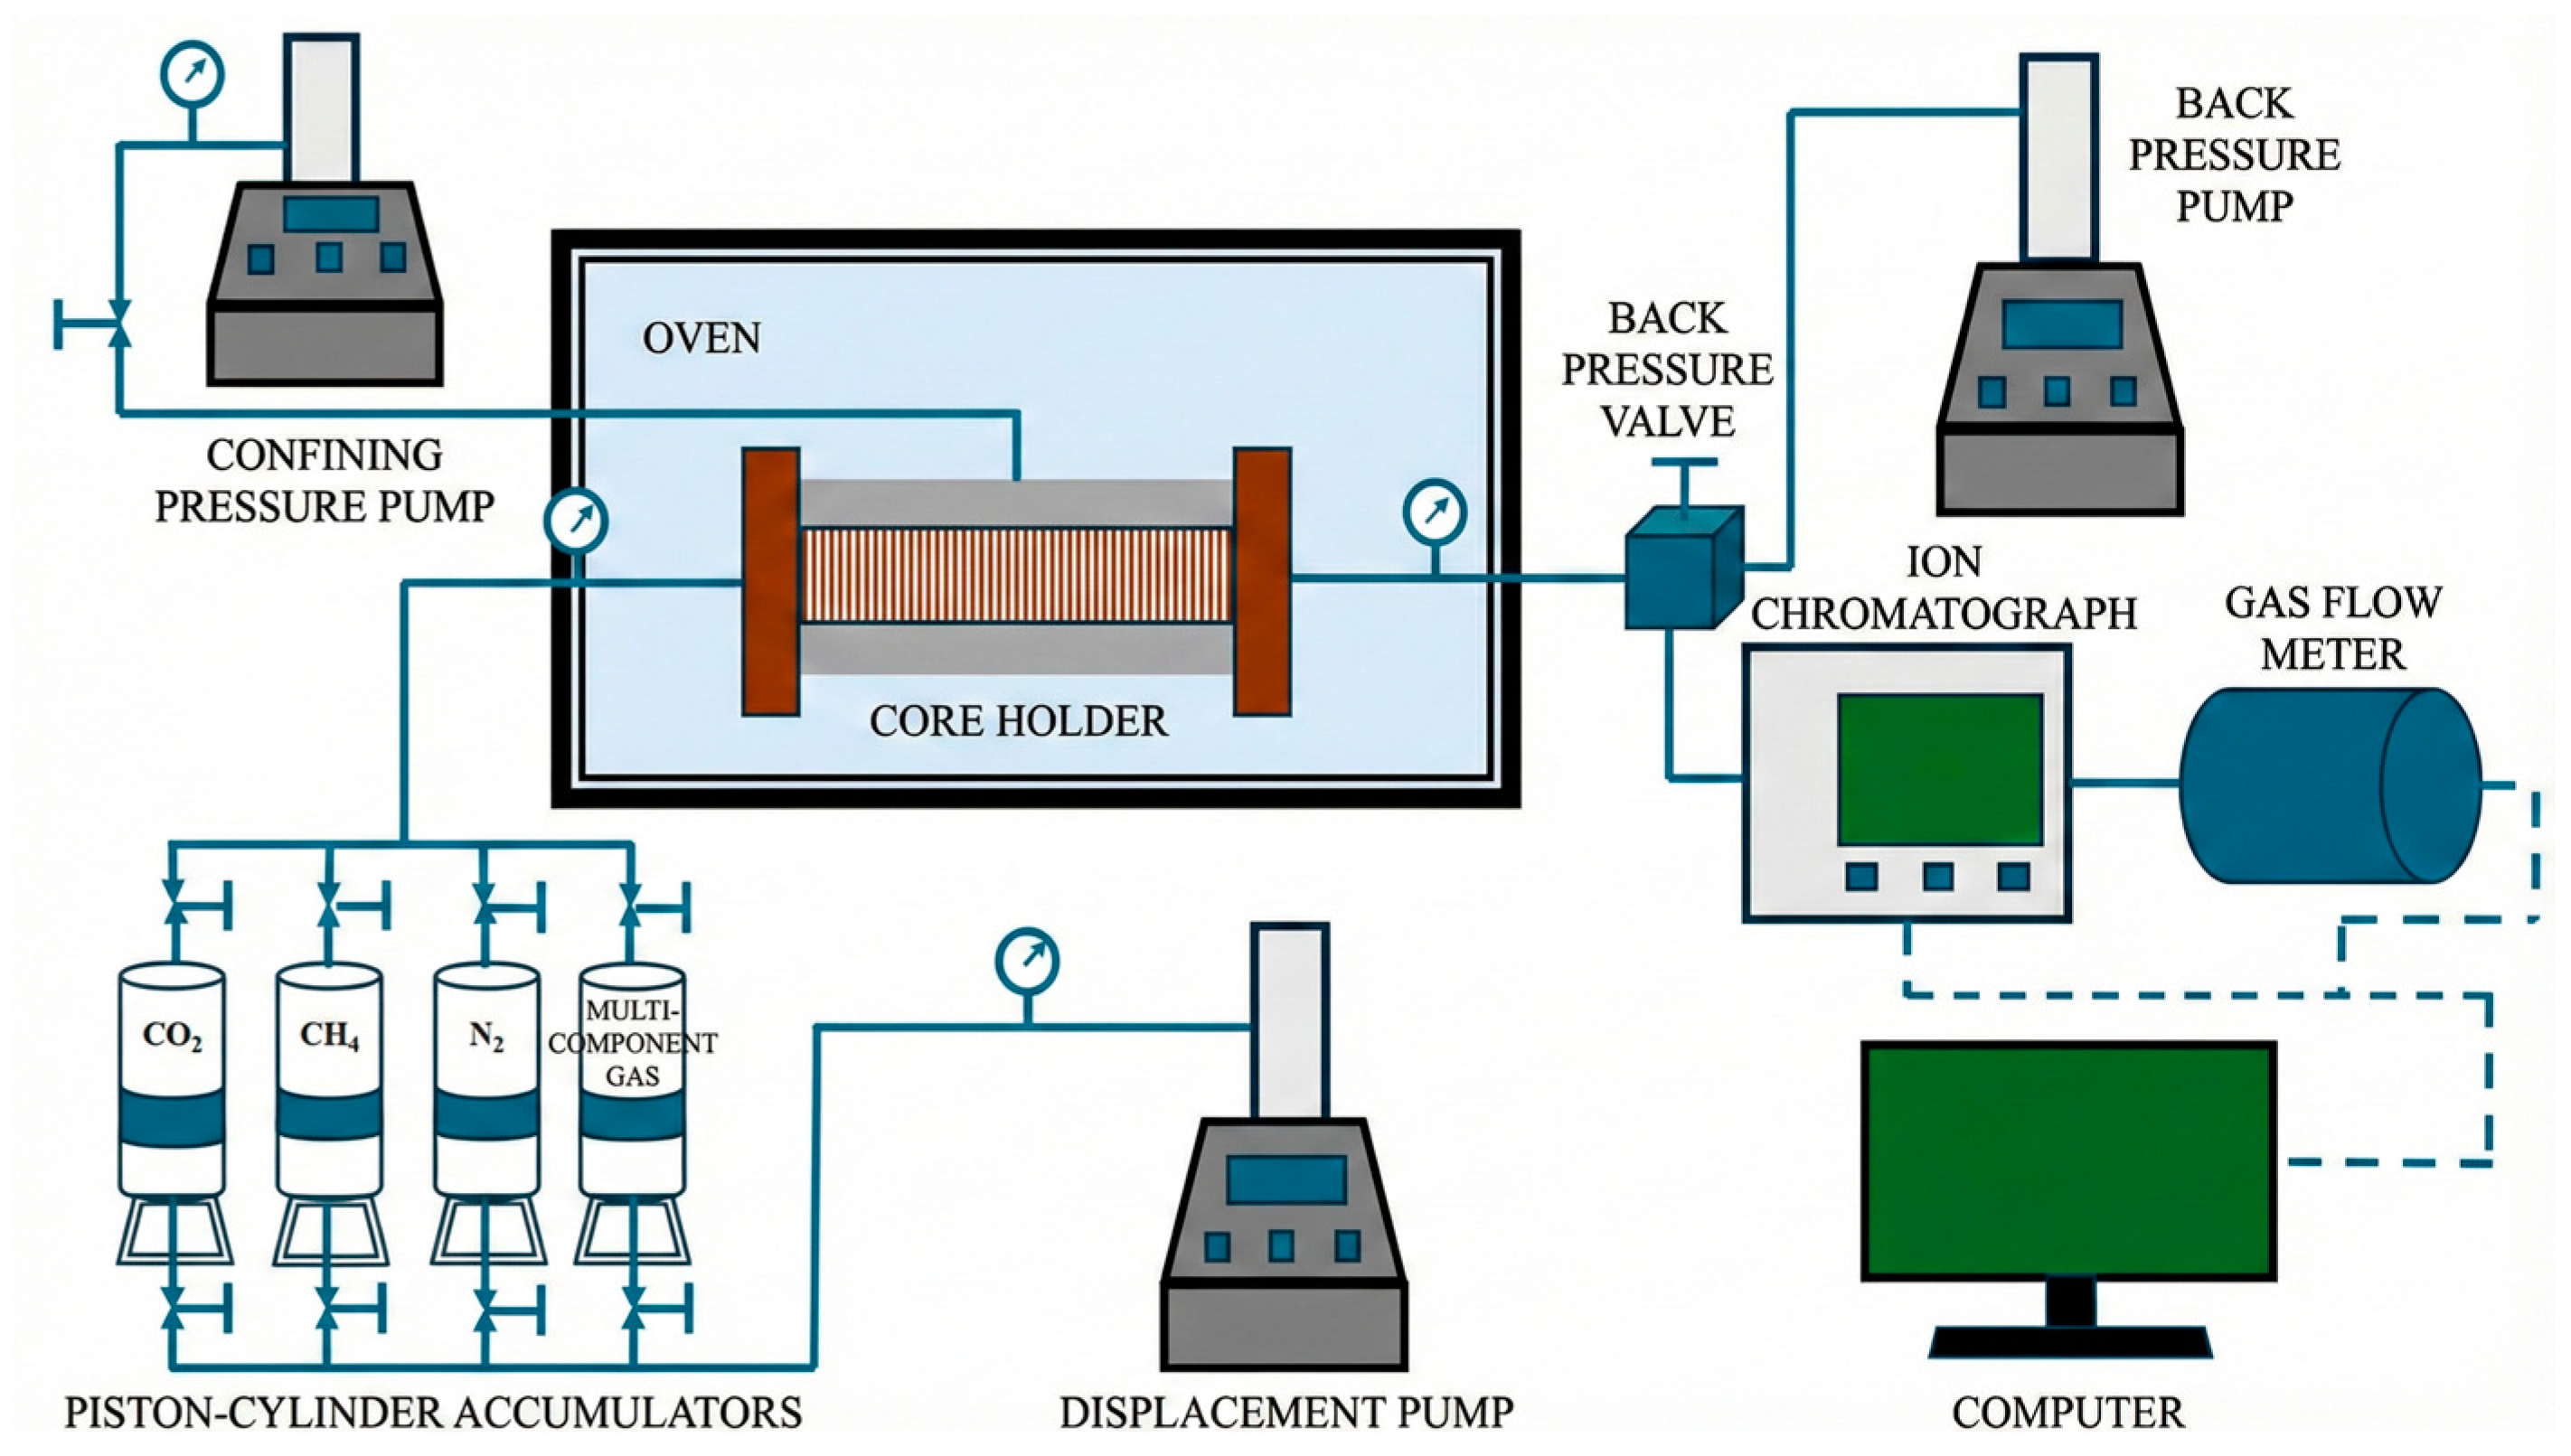
The equipment for the long-core displacement experiment consists of three constant-rate and constant-pressure pumps, a long core holder, a thermostatic oven, a back-pressure valve, a gas flowmeter, a gas chromatograph, three piston-type intermediate containers, gas cylinders, temperature and pressure sensors, and a data acquisition system. A schematic diagram of the experimental setup is shown in Figure 2, and the detailed experimental procedures are as follows.
(1) Core Sorting and Packing
The core sorting was determined according to the iterative calculation of the harmonic mean of permeability, as expressed in Equation (1). Specifically, the harmonic mean of the permeability of all core samples was first calculated, and the core sample with permeability closest to this value was placed at the initial position at the outlet end of the core holder. After removing the selected core sample, the new harmonic mean of permeability of the remaining core samples was calculated iteratively for sequential sorting until all core samples were arranged in a permeability gradient. Microporous filter papers were placed between adjacent core samples to mitigate the end effect. During packing, the sorted core samples were encapsulated in a fluororubber sleeve and then fixed in the core holder. The long core sample was a dry core spliced from eight core plugs, with a total length of 35.819 cm.
L K ¯ = L 1 K 1 + L 2 K 2 + + L i K i + + L n K n = i = 1 n L i K i
where L is total length of the core, cm. K ¯ is harmonic mean permeability of the core, mD. L i is length of the ith core samples, cm. K i is permeability of the ith core samples, mD.
(2) Experimental System Connection and Initialization
The inlet end of the core holder was connected to piston-type intermediate containers loaded with different gases, and the bottom of each container was linked to a displacement pump. The outlet end was connected in sequence to a back-pressure valve (connected to a back-pressure pump), a gas chromatograph, and a gas flowmeter. The top of the core holder was connected to a confining pressure pump to simulate the overburden pressure. During system initialization, the confining pressure was set to be 3 MPa higher than the inlet pressure at all times, and CH4 was introduced into the core holder to test the airtightness of the system. The specific connection mode is shown in Figure 2.
(3) Temperature and Pressure Equilibration
The temperature of the oven was set to the reservoir temperature of 100 °C, and the core was heated uniformly by holding this temperature for at least 4 h. Subsequently, the displacement pump pressurized CH4 to 27 MPa (initial formation pressure) in constant pressure mode, and this pressure was maintained for more than 8 h to ensure that the core pores were fully saturated with CH4.
(4) Depletion Recovery Simulation
The CH4 injection was shut off to simulate the formation depletion process, and the system pressure was reduced to the target pressure (e.g., 11 MPa or 5 MPa), providing initial conditions for the subsequent CO2 displacement.
(5) CO2 Injection and Displacement
CO2 was injected into the piston-type intermediate container and pressurized to the experimental pressure, after which the displacement pump was switched to constant flow mode (e.g., 0.05 mL/min). The inlet valve was opened to initiate CO2 displacement, during which the back-pressure control mode was adopted to maintain a constant pressure at the production end (e.g., 5 MPa). The variations in pressure and flow rate were monitored in real time. (It should be noted that the pressure difference referred to in this experiment specifically denotes the pressure differential between the gas injection end and the production end of the long-core model. Among these, the “maximum pressure difference” refers to the peak pressure differential observed during the gas injection and displacement stage.)
(6) Experimental Data Acquisition and Breakthrough Determination
During the displacement process, time, inlet pressure, flow rate, and produced gas composition (measured by gas chromatograph) were continuously recorded. The onset of CO2 breakthrough was marked when the volume fraction of CH4 in the produced gas decreased to 95%. The experiment was terminated when the CH4 volume fraction dropped to 5%, which was regarded as a complete breakthrough (i.e., the experimental abandonment condition was reached). At this moment, the pressure at the production end of the system was defined as the abandonment pressure of this experiment.
A total of 17 groups of long-core displacement experiments were designed and conducted at 100 °C, including experiments with different CO2 injection timings, different CO2 injection rates, and different gas injection compositions. Detailed experimental parameters are listed in Table 2.

4. Analysis of Effects of CO2/N2 Injection on Enhancing Recovery Efficiency of Tight Sandstone Gas Reservoirs

4.1. Effects of CO2/N2 Injection Timing

In the process of CO2/N2-enhanced gas recovery (CO2/N2-EGR), the selection of gas injection timing directly affects the cumulative gas recovery factor. As the formation pressure at the time of injection increases, the physical property differences between CO2/N2 and CH4 increase significantly, which is conducive to forming a stable displacement front and thereby improving displacement efficiency. However, premature gas injection may lead to insufficient utilization of original reservoir energy, while increasing development costs and reducing economic benefits [26]. Under the condition of reservoir temperature of 100 °C, eight groups of displacement experiments with different gas injection timings were conducted to systematically analyze the influence law of gas injection timing on CH4 recovery factor.

4.1.1. Analysis of Enhanced Recovery Efficiency and Cumulative Recovery Efficiency Under Different Injection Timing

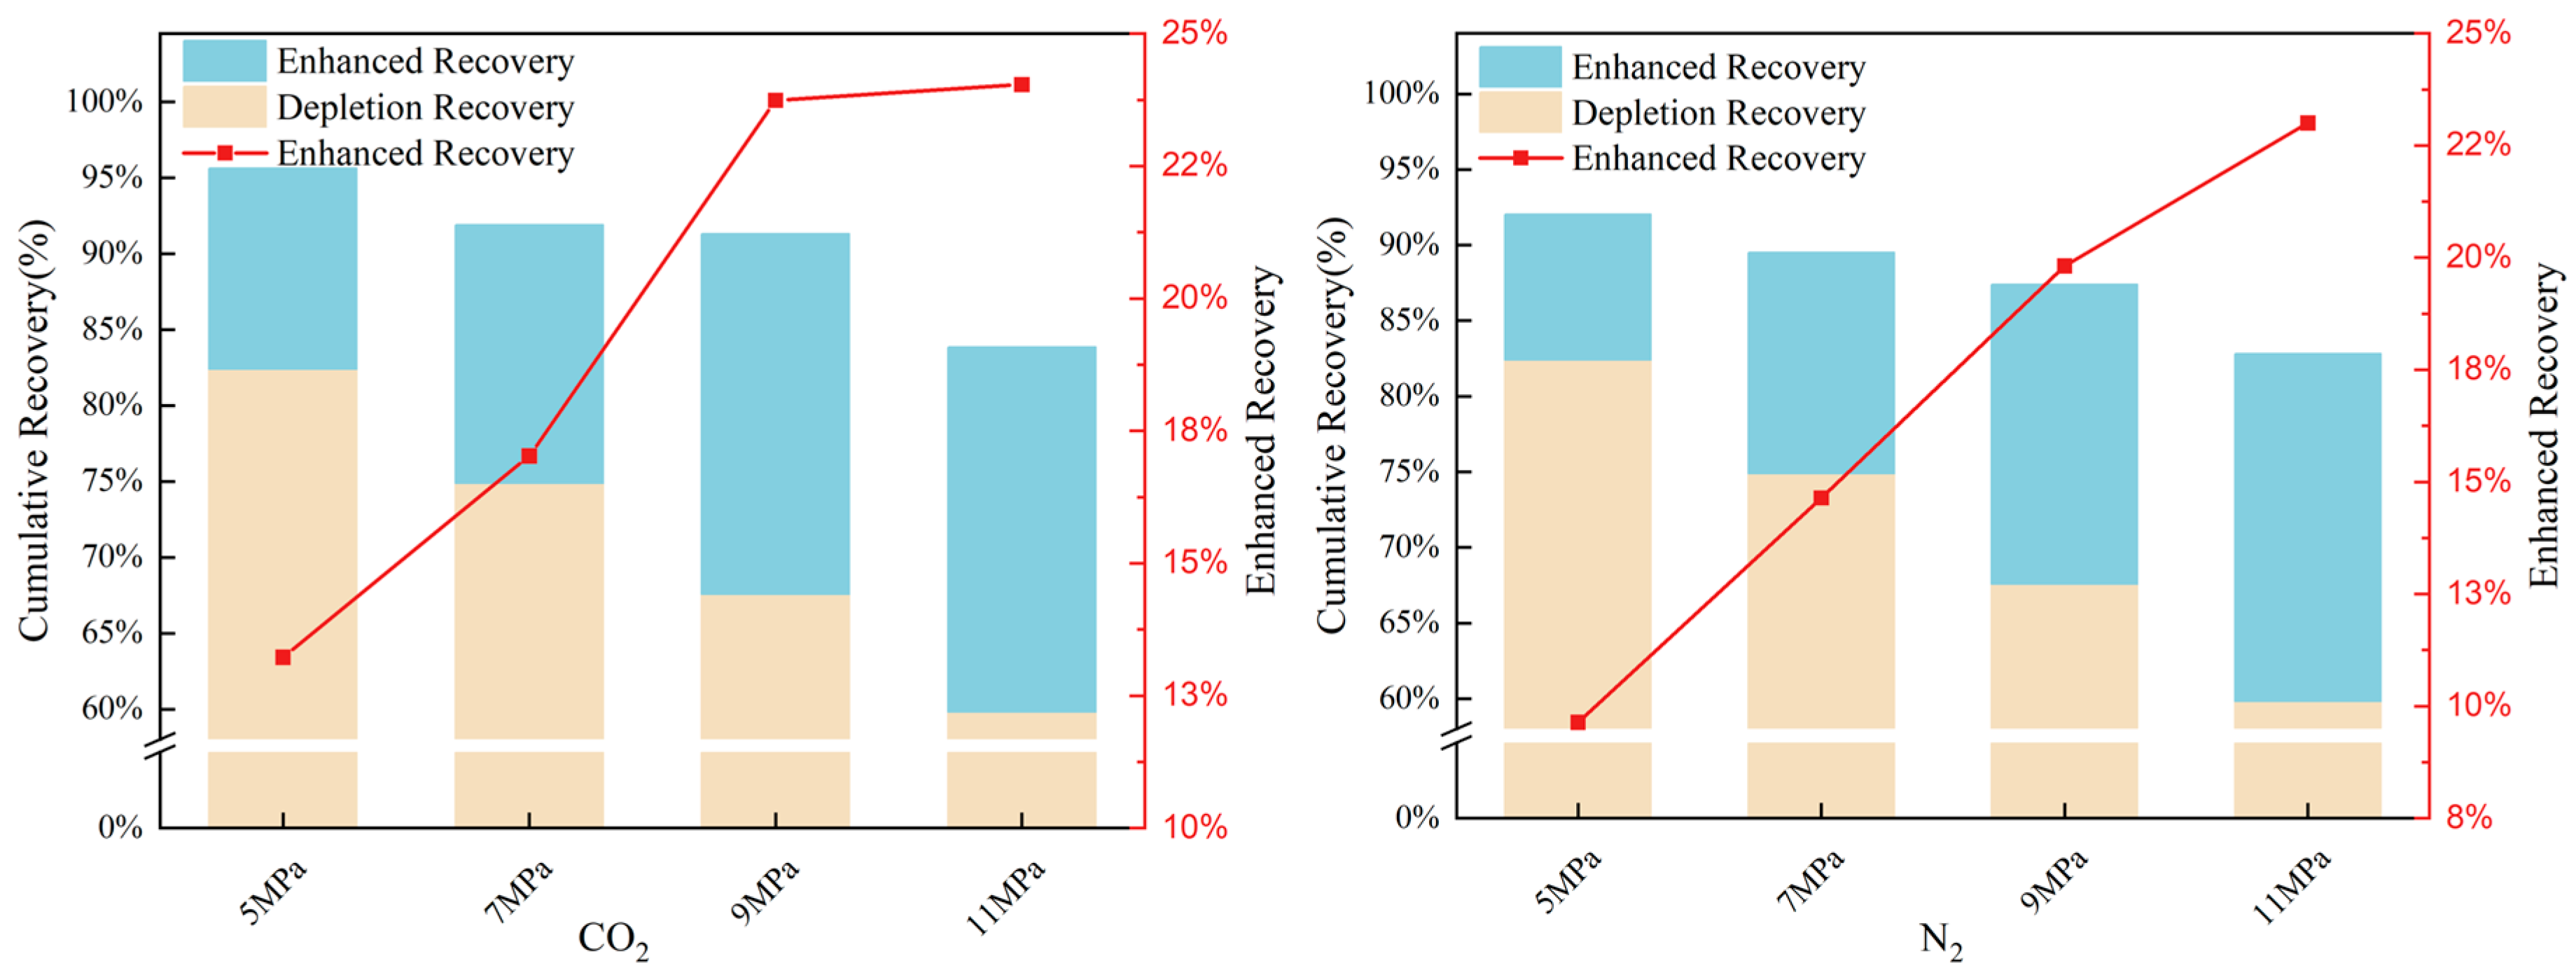
Figure 3 illustrates the effects of different gas injection timings on recovery enhancement and cumulative recovery factor. As the gas injection timing is advanced, the enhanced recovery effects of both CO2 and N2 are significantly strengthened. When the reservoir is depleted to 11 MPa (with an abandonment pressure of approximately 11.25 MPa), the depletion recovery factor reaches 59.82%, and the recovery increments induced by switching to CO2 and N2 injection are 24.03% and 23.00%, respectively. In contrast, when the depletion proceeds to 5 MPa (with an abandonment pressure of around 5.55 MPa), the depletion recovery factor rises to 82.41%, whereas the corresponding recovery increments of CO2 and N2 injection are only 13.22% and 9.64%, respectively. Elastic depletion development is the most efficient development method for tight sandstone gas reservoirs, which relies on the expansion energy of natural gas itself to produce reserves. This method has no problems of gas channeling and invalid circulation of injected gas, with the highest recovery efficiency and the lowest cost. The early gas injection scheme artificially terminates the depletion development when there is still a large amount of reserves that can be efficiently produced through elastic expansion, and switches to gas flooding with lower displacement efficiency. Although gas flooding brings a higher incremental recovery, it cannot make up for the loss of recovery in the depletion stage. In contrast, the late gas injection scheme first maximizes the utilization of formation elastic energy, produces the majority of reserves through high-efficiency depletion development, and then uses gas flooding to produce the remaining hard-to-recover reserves. The increase in recovery in the depletion stage far exceeds the loss of incremental recovery from gas flooding, so the total cumulative recovery is higher.
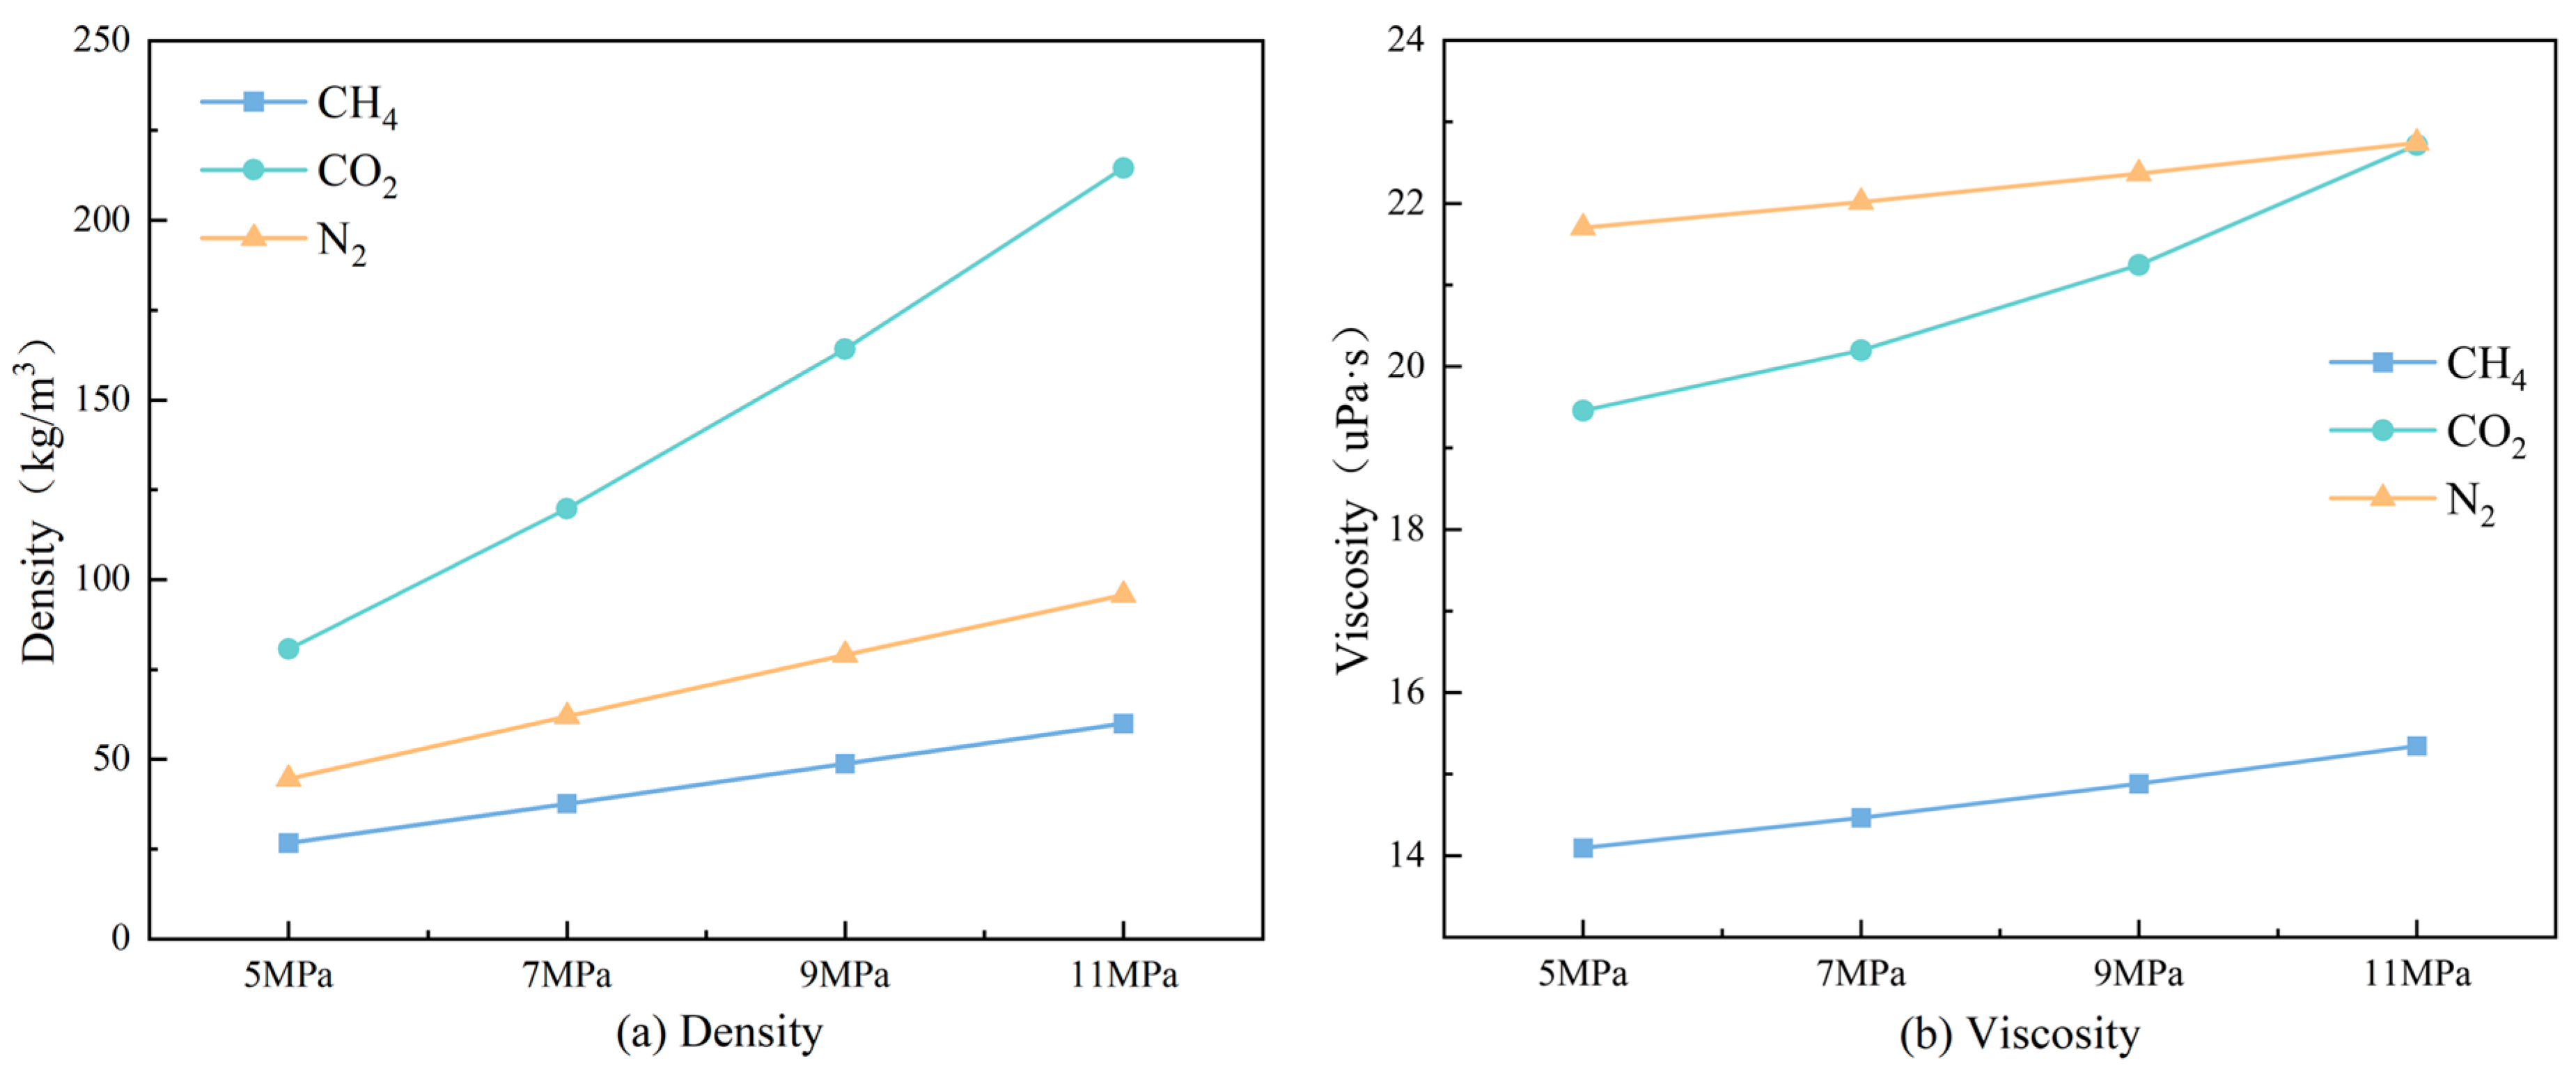
Figure 4 presents the differences in density and viscosity among CO2, N2, and CH4 at various pressures under the temperature condition of 100 °C. With the increase in pressure, the differences in physical properties between the injected gases and CH4 become more pronounced, which is conducive to inhibiting gas-phase miscibility [27,28], thereby forming a stable piston-like displacement front and improving the displacement performance [29]. At low formation pressures, not only is the remaining recoverable CH4 reserve limited, but miscibility between gases is also prone to occur, resulting in poor displacement efficiency and thus restricting the amplitude of recovery improvement. When gas injection is performed earlier, the pressure at the injection end rises slowly and stabilizes at a low level, reflecting sufficient reservoir energy, low seepage resistance, and favorable gas mobility. Conversely, delayed gas injection leads to a rapid increase in the injection-end pressure to a higher steady value, indicating a significant rise in seepage resistance under the low-energy state. Nevertheless, this also forces the injected gases to overcome higher capillary forces, mobilizing the residual gas trapped in microscopic pores and thereby enhancing the CH4 recovery factor. In addition, the overall enhanced recovery performance of CO2 is superior to that of N2.
The cumulative recovery factor exhibits a decreasing trend with the advancement of gas injection timing. Gas injection at the depletion pressure of 5 MPa yields the highest cumulative recovery factors, reaching 95.63% for CO2 injection and 92.04% for N2 injection, respectively. In comparison, the cumulative recovery factors are only 83.85% and 82.82% when CO2 and N2 are injected at the depletion pressure of 11 MPa. The experimental results demonstrate that although early gas injection is beneficial for enhancing displacement efficiency [22], it fails to fully utilize the original formation energy of the gas reservoir, resulting in a decline in cumulative recovery factor. Therefore, it is recommended that supercritical CO2 be injected after sufficient depletion development of the gas reservoir, so as to synergistically optimize the utilization of formation energy and the effect of recovery improvement.

4.1.2. Analysis of Variation in CH4 Gas Production Rate Under Different Injection Timing

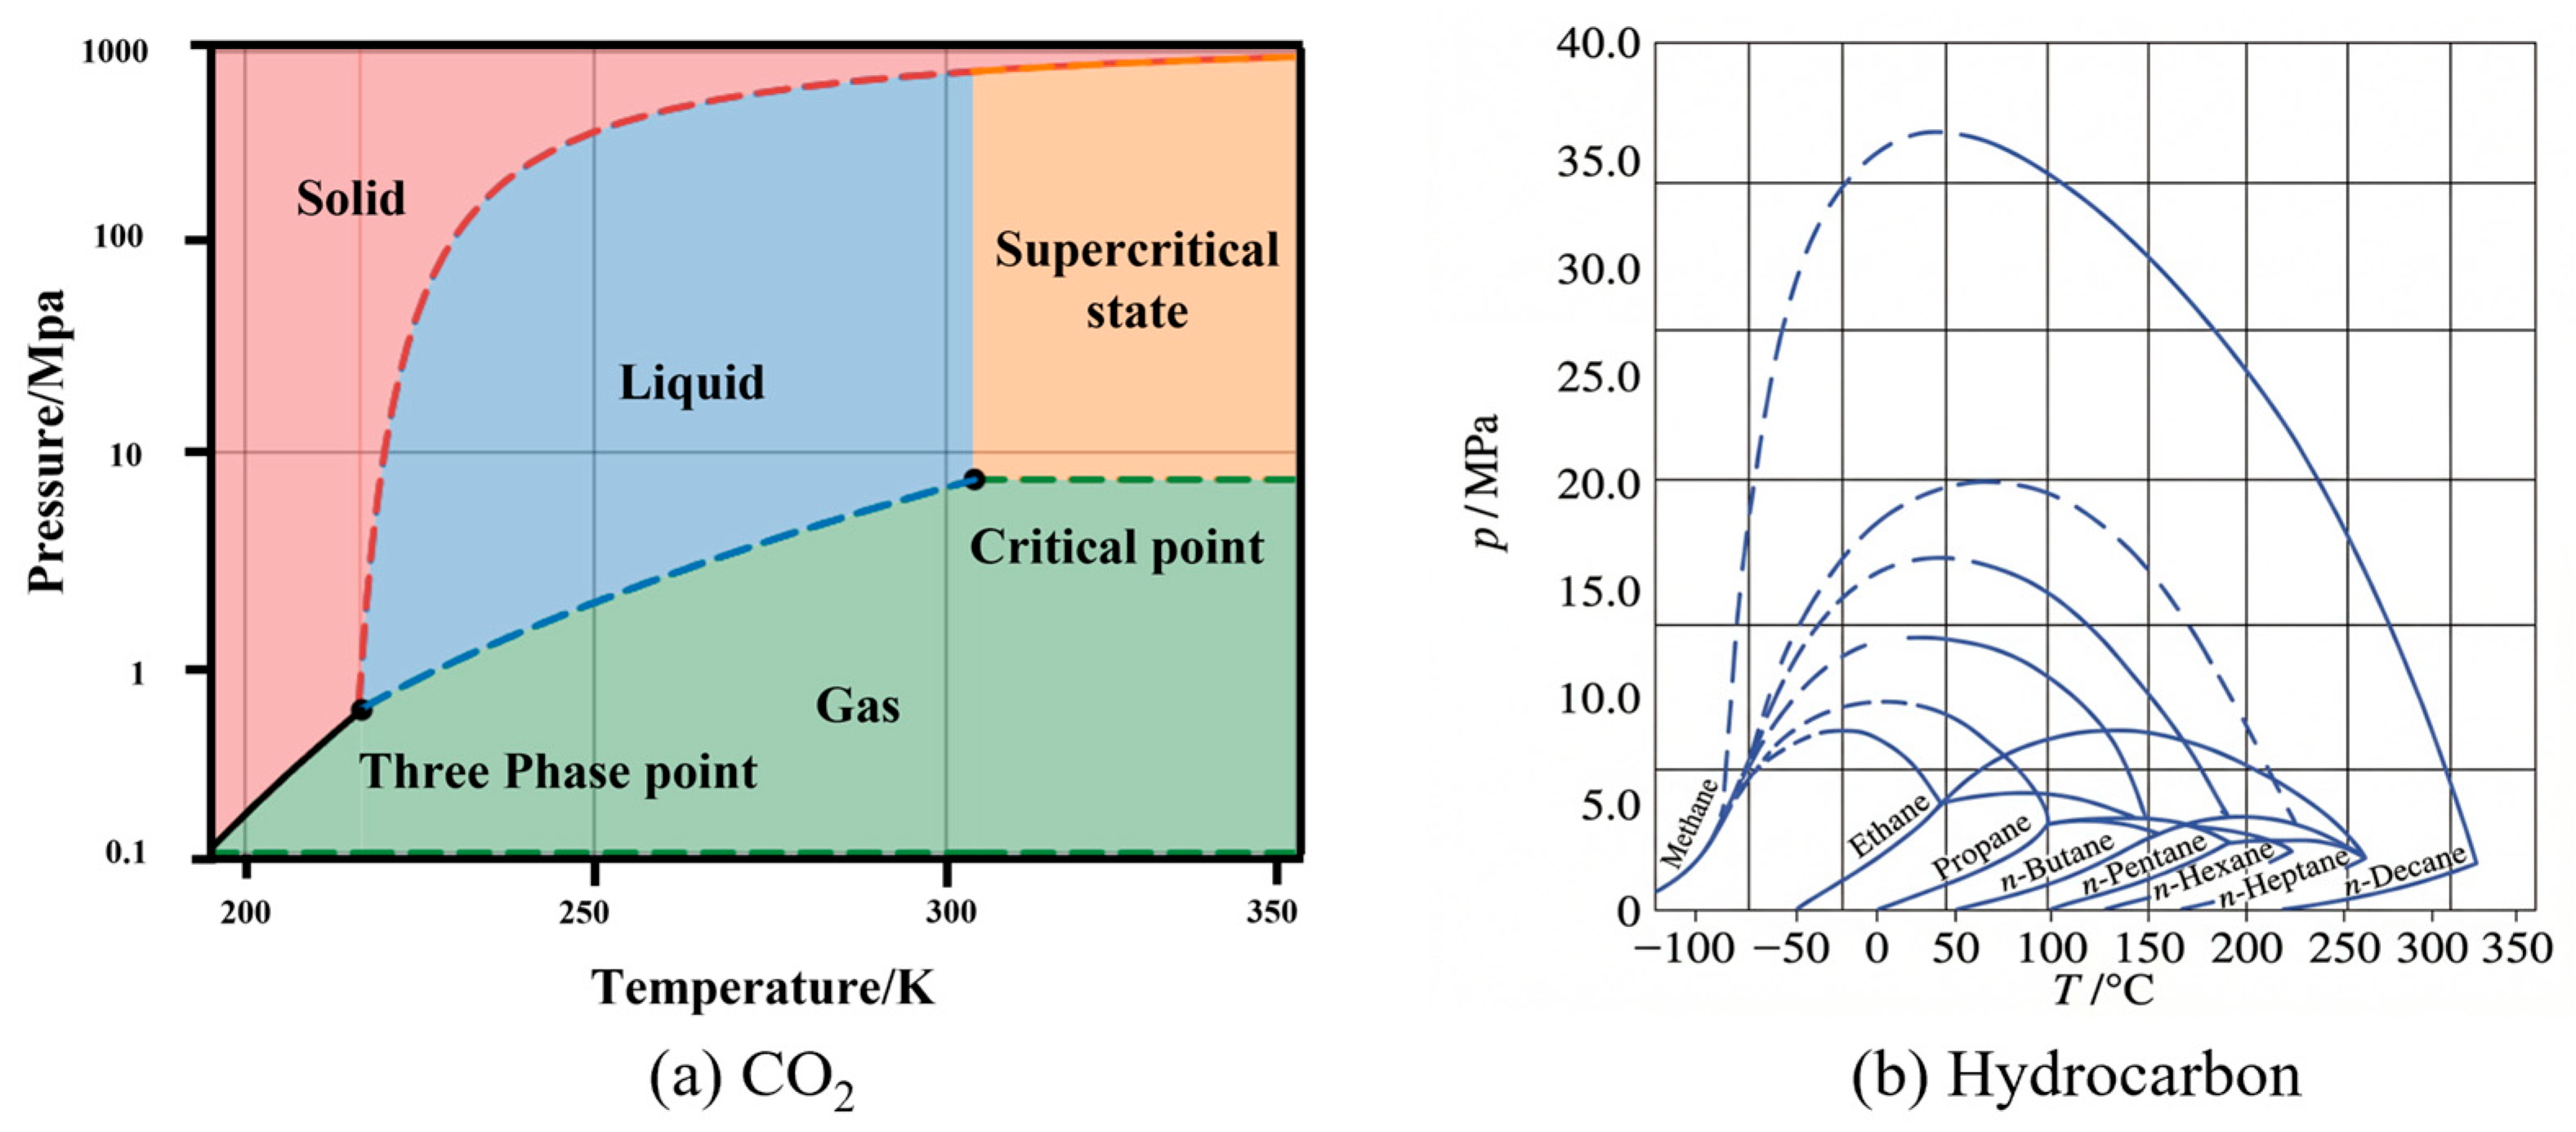
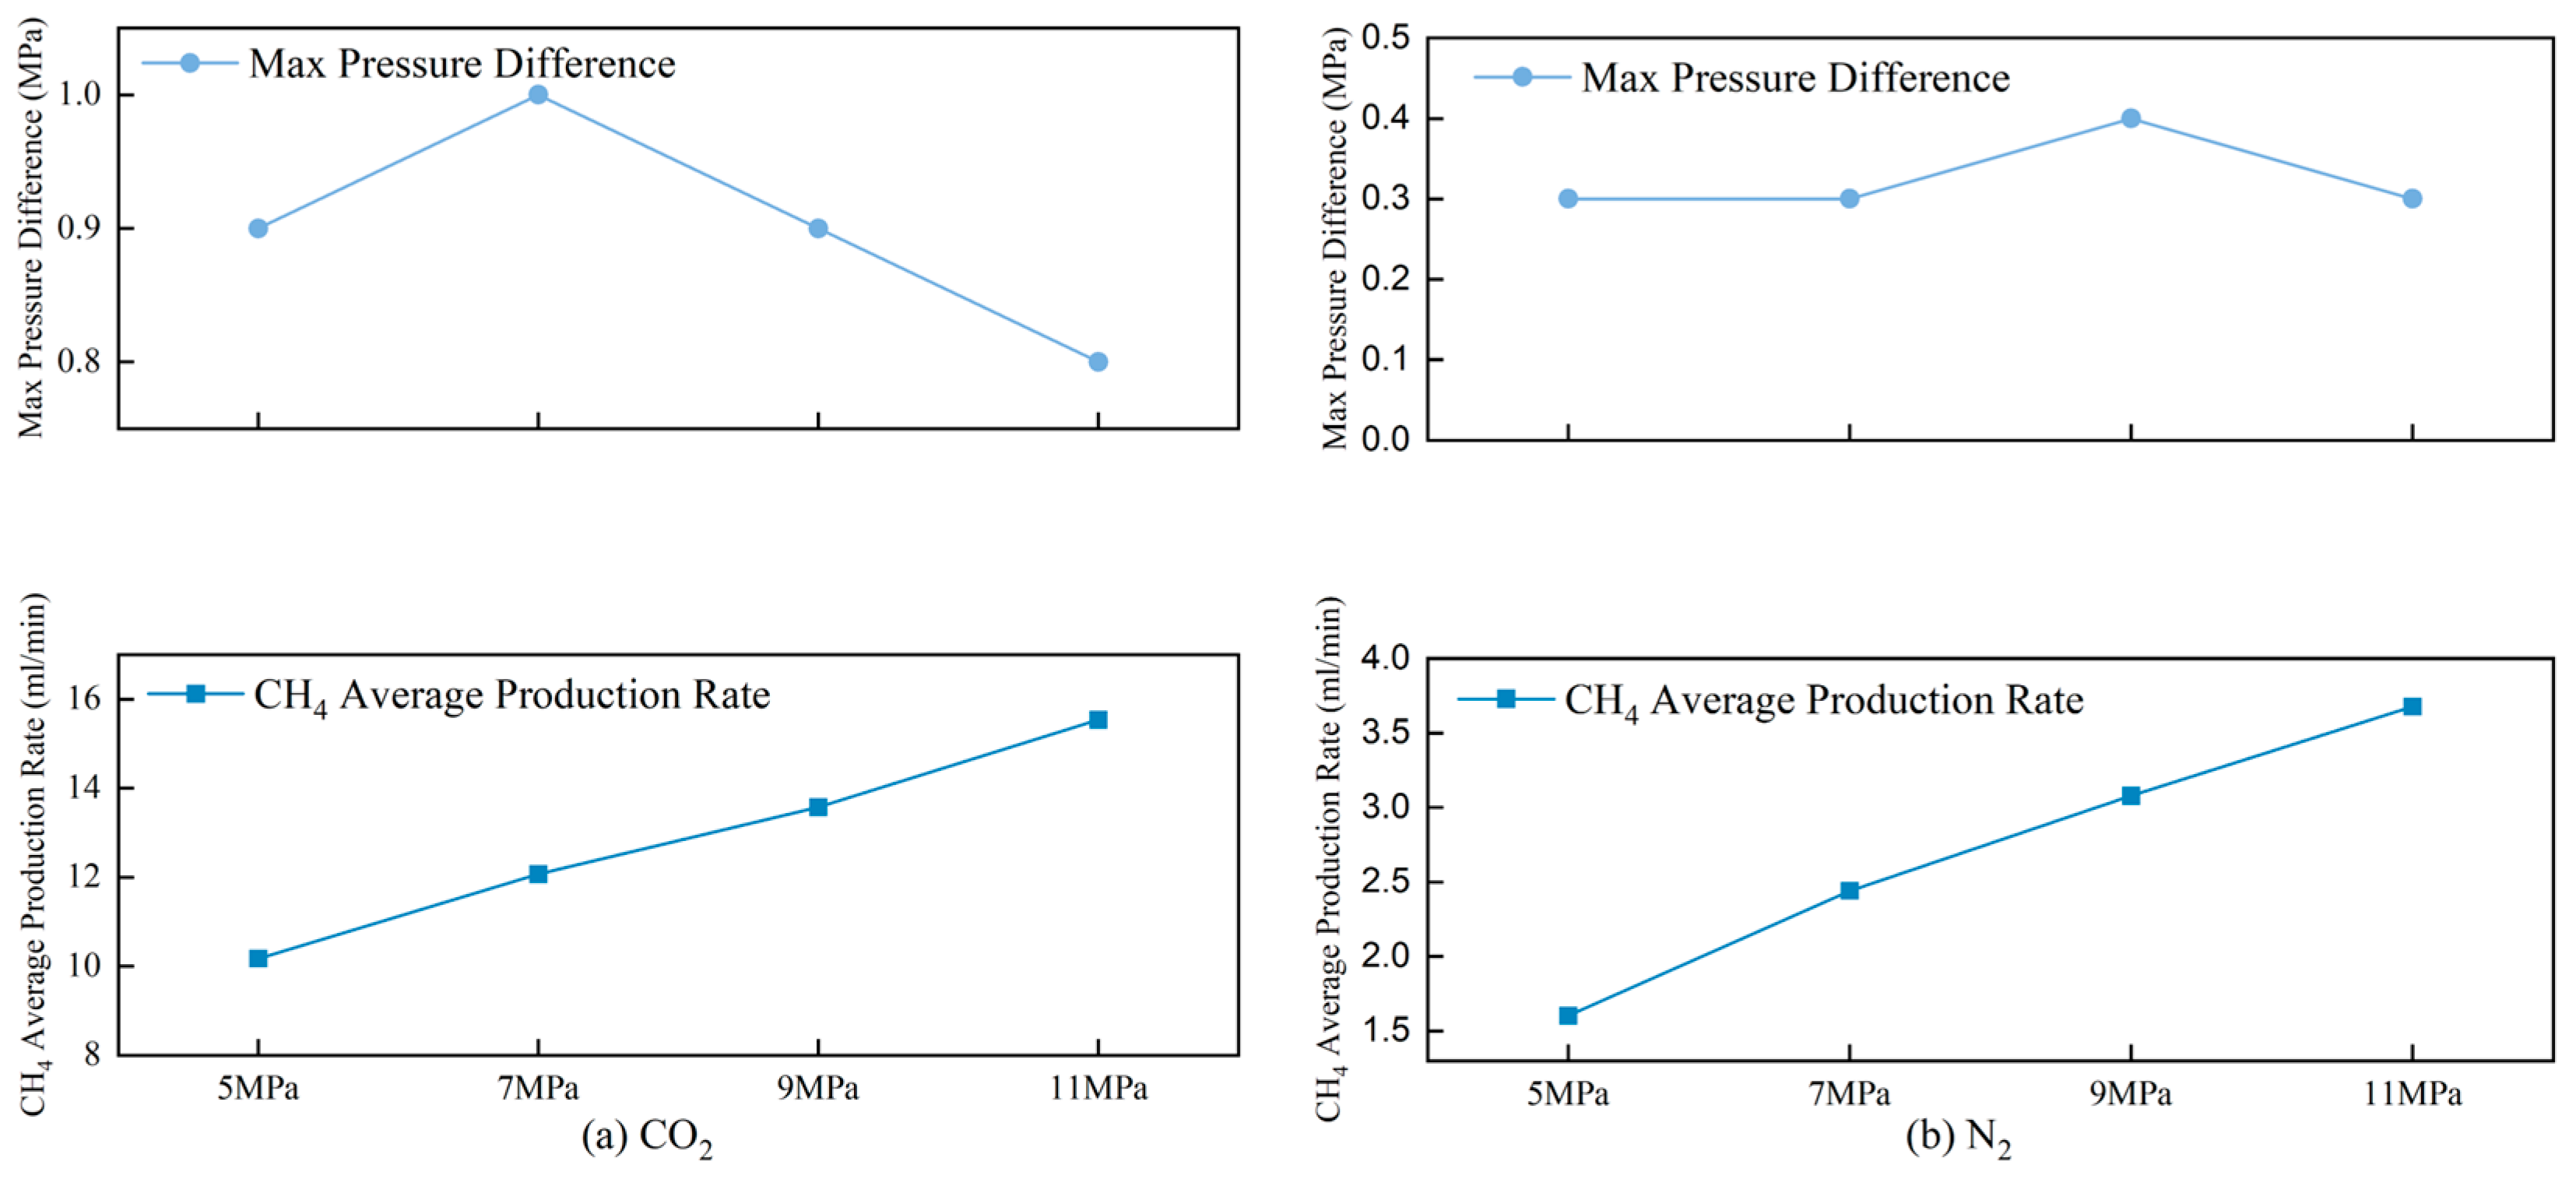
Figure 5 illustrates the effects of different gas injection timings on the average CH4 production rate and pressure differential. As the gas injection timing is advanced, the average CH4 production rate increases significantly, whereas the pressure differential shows no obvious variation under different gas injection timings. When gas injection is conducted after depletion to 11 MPa, the average CH4 production rates corresponding to CO2 and N2 displacement are 15.53 mL/min and 3.68 mL/min, respectively. In contrast, when gas injection is implemented after depletion to 5 MPa, the values decrease to 10.17 mL/min and 1.60 mL/min, respectively. During the injection of the two gases, the maximum pressure differentials between the injection end and production end are 1.0 MPa (for CO2) and 0.4 MPa (for N2), respectively. A comparison indicates that both the pressure differential and CH4 production rate during CO2 injection are significantly higher than those during N2 injection. This is mainly attributed to the fact that the density of CO2 is higher than that of N2. In particular, when the gas injection timing is advanced, CO2 exists in a supercritical state (as shown in Figure 6), with a density closer to that of liquids. As a result, a larger volume of CO2 can be injected within the same time frame, leading to higher efficiency in replenishing reservoir energy and a more pronounced displacement effect. In addition, the increased viscosity of supercritical CO2 helps to slow down its migration rate and mitigate gas miscibility, thereby enhancing the CH4 production rate [30].

4.1.3. Analysis of Breakthrough Timing Under Different Injection Timing

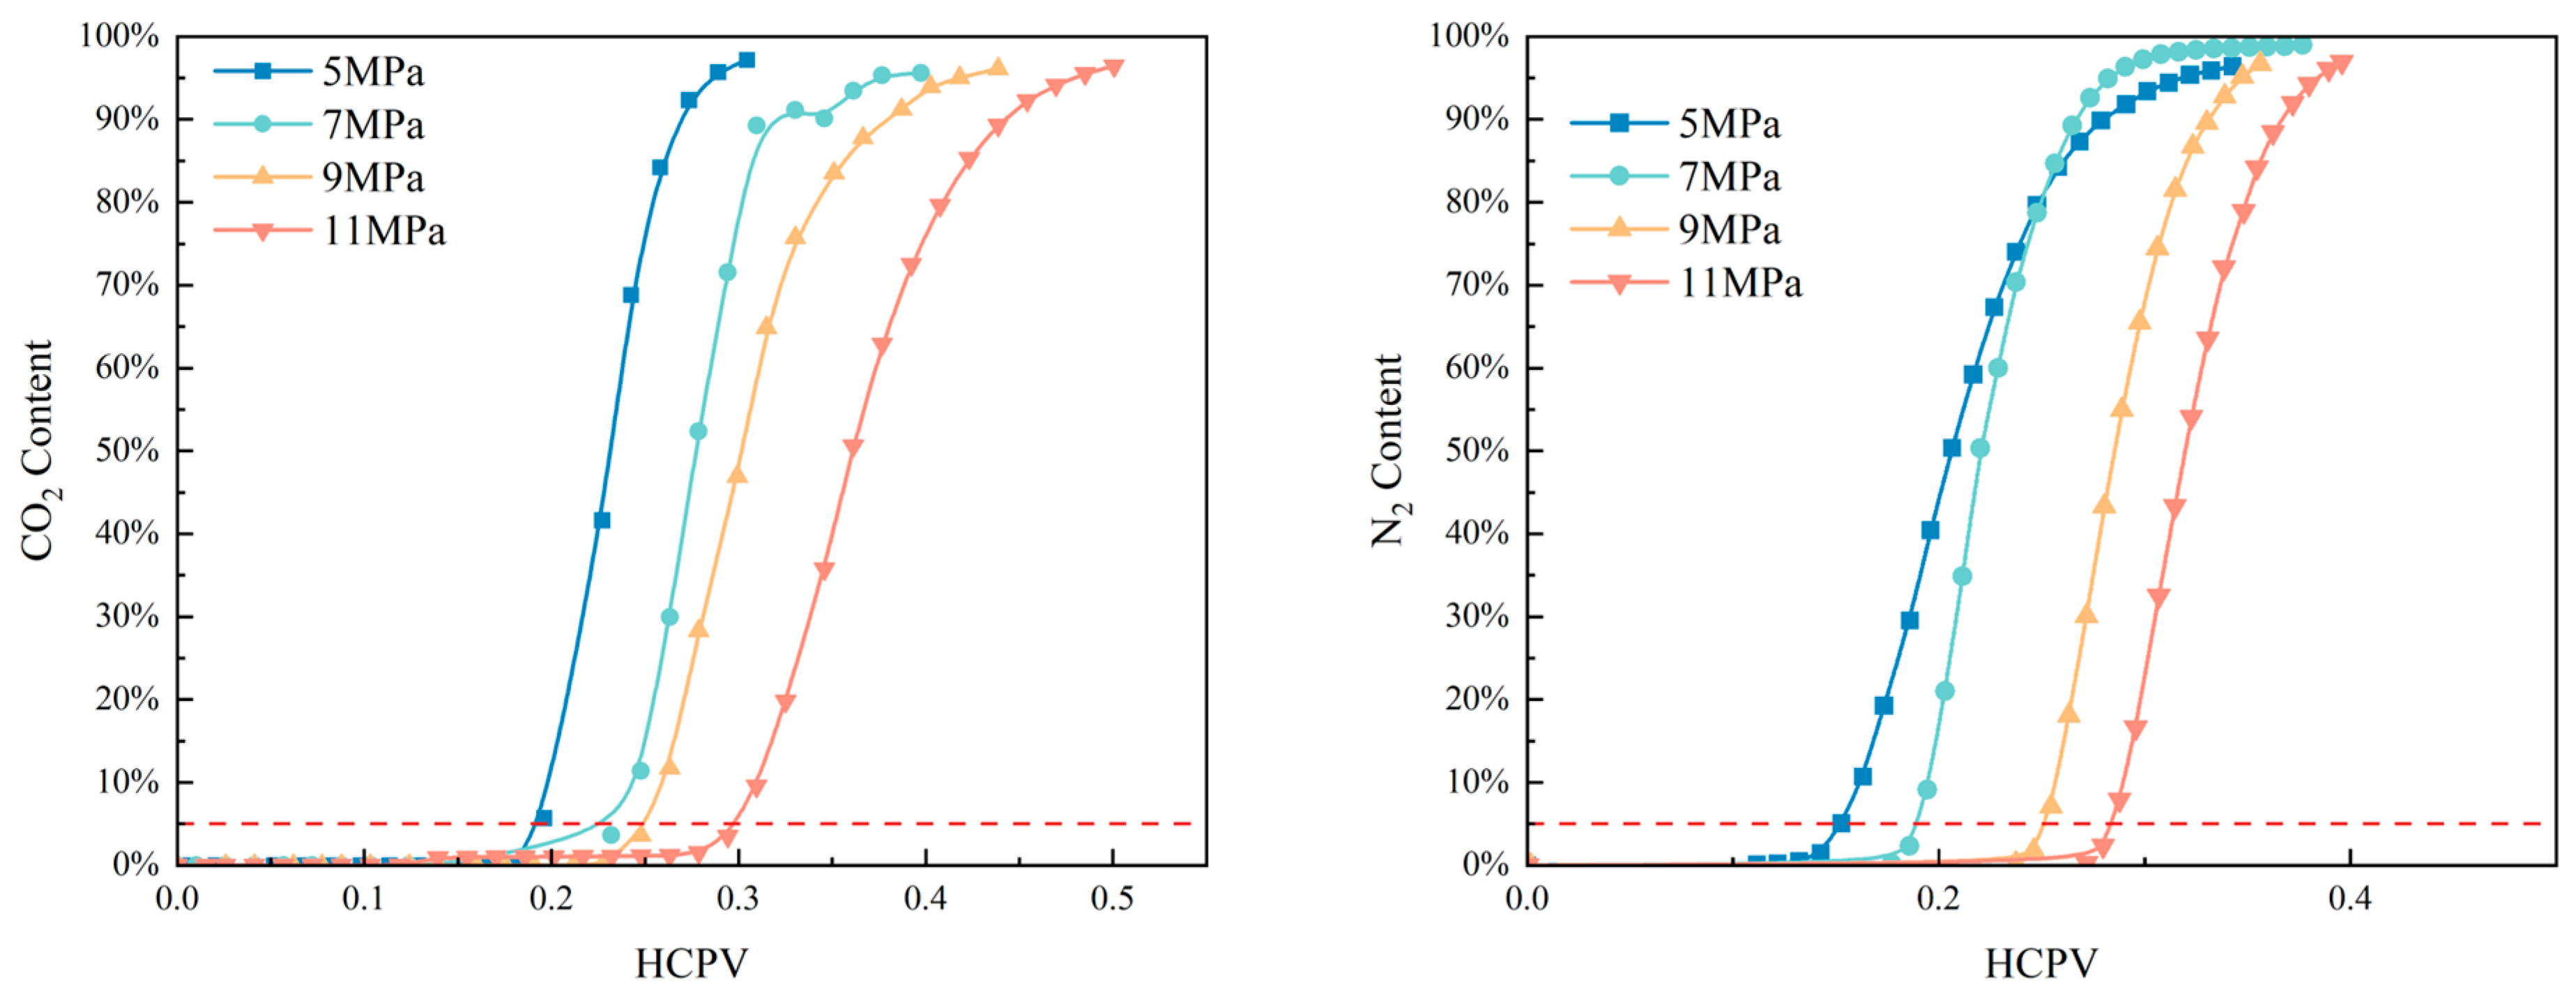
Figure 7 depicts the variations in CO2 and N2 compositions under different gas injection timings, while Figure 8 presents the variations in CO2 and N2 compositions as well as the injection volumes at key nodes. The inset graphs in the upper left corner of Figure 8a,b illustrate the initial gas production time corresponding to different gas injection timings. It can be observed that as the gas injection timing is advanced, the breakthrough times of CO2 and N2 displacement are correspondingly delayed, whereas the initial gas production time is advanced with the earlier gas injection timing. The criterion is set as follows: gas breakthrough initiates at an injected gas content of 5%, and full gas breakthrough is achieved at 95%. When gas injection is conducted at 5 MPa, the breakthrough times of CO2 and N2 are 0.19 HCPV (Hydrocarbon Pore Volume) and 0.17 HCPV, respectively; in contrast, when injection is performed at 11 MPa, the breakthrough times are extended to 0.30 HCPV and 0.28 HCPV, respectively.
In low-pressure environments, CO2/N2 tends to be miscible with CH4, resulting in slow pressure buildup at the displacement front and delayed initial gas production time. Meanwhile, earlier gas breakthrough occurs, which shortens the CH4 production duration. On the contrary, at high pressures, the differences in physical properties between CO2/N2 and CH4 are significantly enhanced. Such distinct physical property differences can effectively inhibit the mixing of CO2/N2 and CH4. Additionally, the high-viscosity CO2/N2 exhibits reduced migration rate and diffusivity in the pores, thereby delaying its breakthrough and facilitating the improvement of CO2/N2 displacement uniformity. The results in Figure 6 indicate that the maximum pressure differentials during N2 injection are generally lower than those during CO2 injection, suggesting that N2 displacement takes effect more rapidly. Correspondingly, both the initial gas production time and the breakthrough time of N2 displacement are earlier than those of CO2 displacement.

4.2. Effects of CO2/N2 Injection Rate

In the process of CO2/N2-enhanced gas recovery (CO2/N2-EGR), the selection of gas injection rate exerts a significant influence on enhanced recovery efficiency [32]. When the gas injection rate is excessively low, insufficient displacement energy will be supplied, resulting in an insignificant enhanced recovery effect [33]. Whereas an excessively high gas injection rate tends to induce premature gas breakthrough, which is unfavorable for uniform gas displacement and even inhibits the improvement of recovery factor. Therefore, optimizing the CO2 injection rate is of great importance. Under the conditions of a reservoir temperature of 100 °C and an injection pressure of 7 MPa, 6 groups of displacement experiments with different gas injection rates were conducted to systematically analyze the influence law of gas injection rate on CH4 recovery factor.

4.2.1. Analysis of Enhanced Recovery Efficiency Under Different Injection Rates

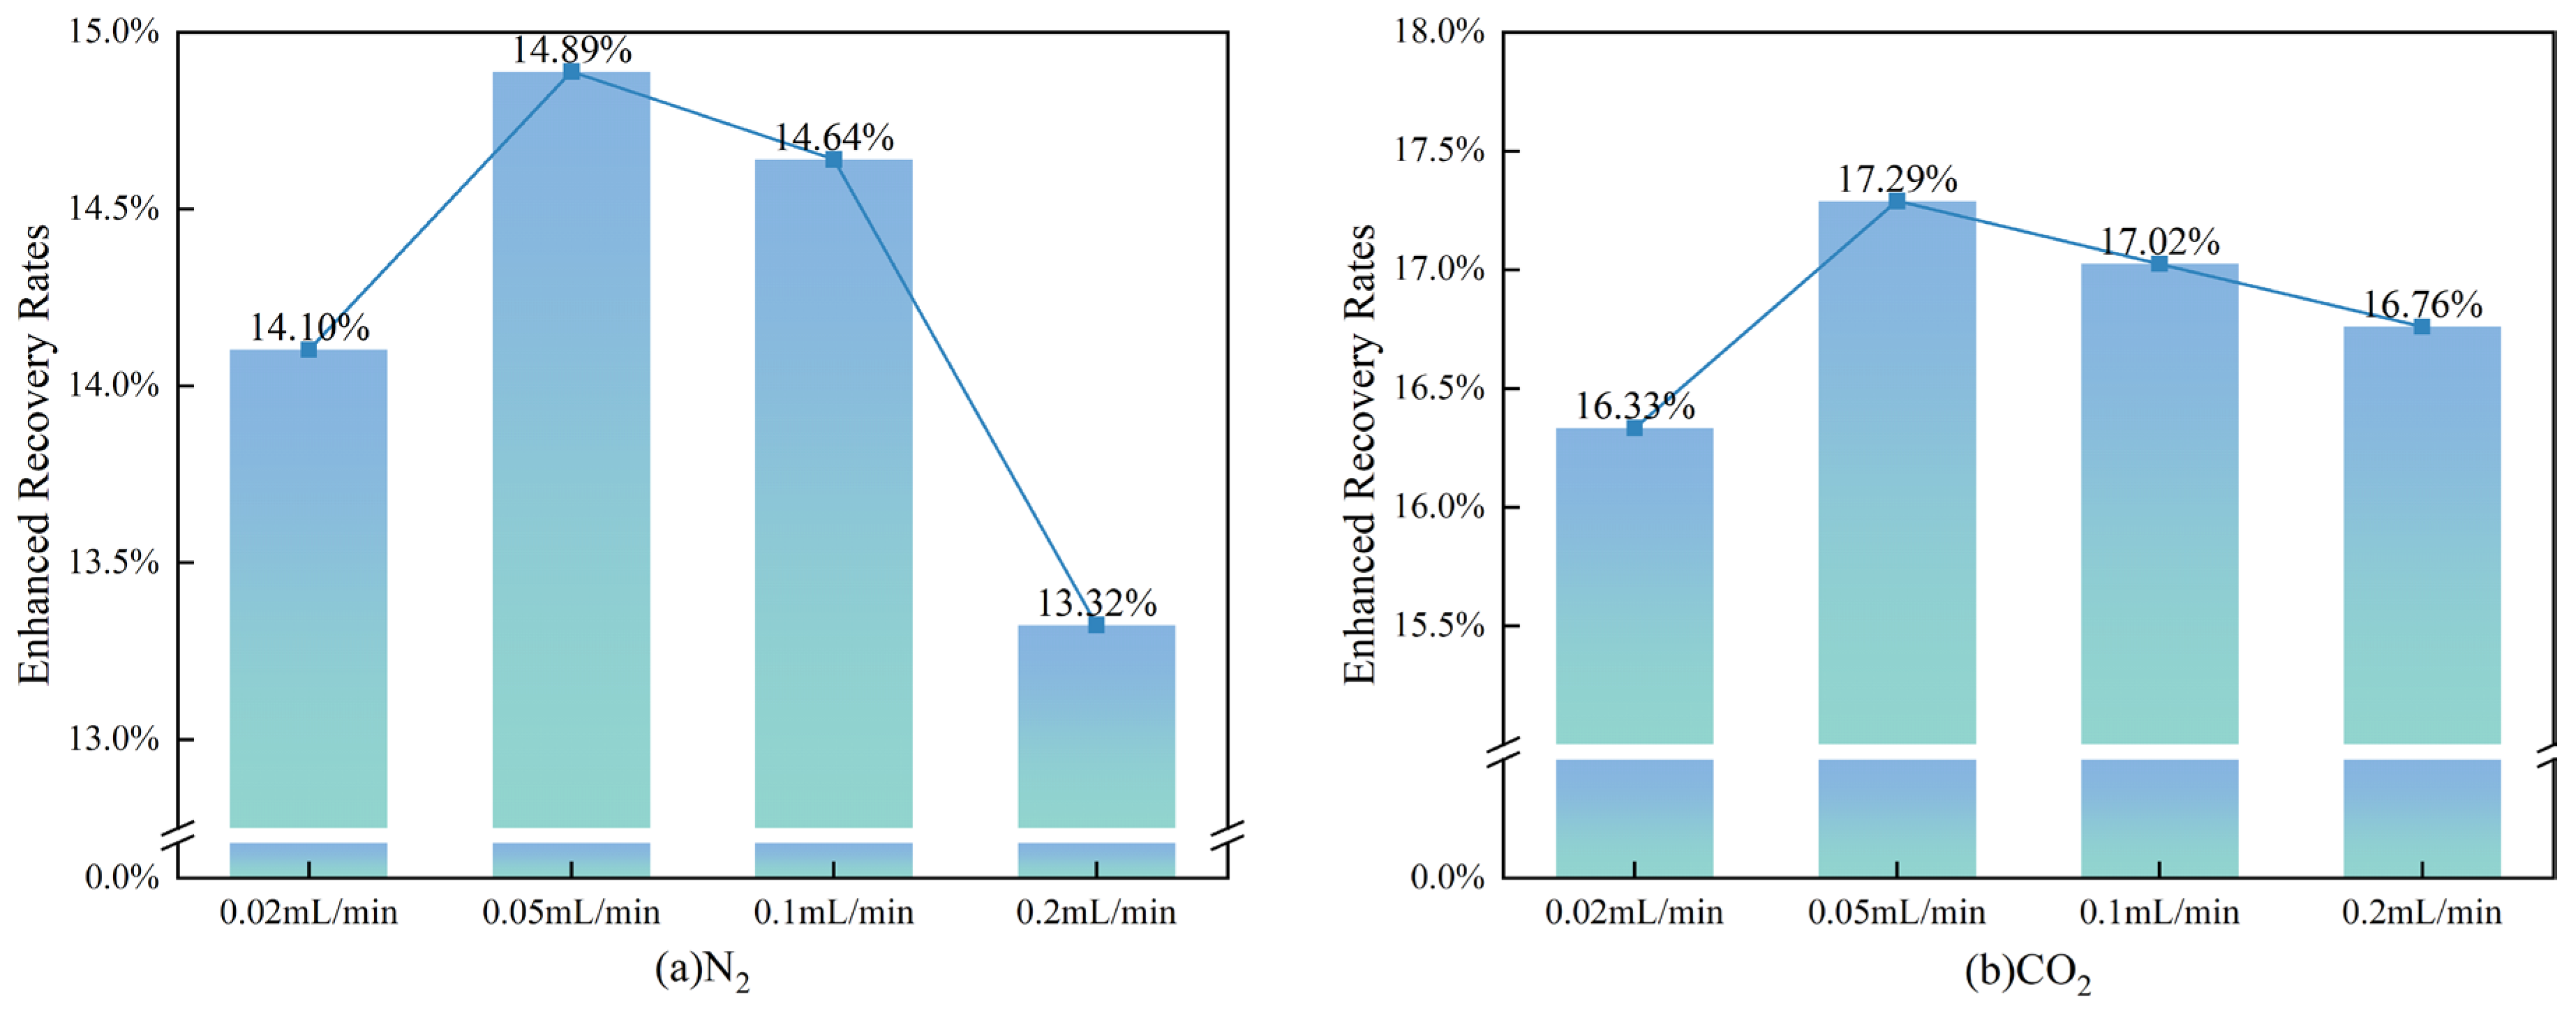
Figure 9 illustrates the influence of different gas injection rates on the enhanced recovery effect. With the increase in gas injection rate, the enhanced recovery effects of both CO2 and N2 exhibit a trend of first increasing and then decreasing. When the injection rate is set at 0.05 mL/min, CO2 and N2 achieve the optimal enhanced recovery performance, with the recovery increments reaching 17.29% and 14.89%, respectively. In contrast, either excessively low or high injection rates result in inferior enhanced recovery efficiency.
At relatively low injection rates, the contact time between CO2/N2 and CH4 is prolonged, the miscible displacement range is expanded, and the interfacial tension is significantly reduced, thereby decreasing the flow resistance. Additionally, the low displacement velocity facilitates more sufficient displacement of CH4 trapped in micropores by CO2/N2, which increases the proportion of injected gas occupying the pore throats and thus improves the ultimate recovery factor to a certain extent. At the optimal injection rate, the pressure at the injection end rises steadily, corresponding to efficient and stable displacement.
When the injection rate is excessively high, the injection pressure rises sharply and then quickly reaches a plateau, which directly verifies the occurrence of viscous fingering—the injected gas channels through a limited number of preferential pathways, leading to a large amount of energy being consumed in ineffective circulation. Macroscopically, this phenomenon is characterized by high pressure yet low sweep efficiency. Overall, the enhanced recovery performance of CO2 is superior to that of N2, which is mainly attributed to CO2’s stronger adsorption and displacement capacity as well as its excellent miscibility, thus enabling it to exhibit more significant performance in enhancing gas recovery.

4.2.2. Analysis of Variation in CH4 Gas Production Rate Under Different Injection Rates

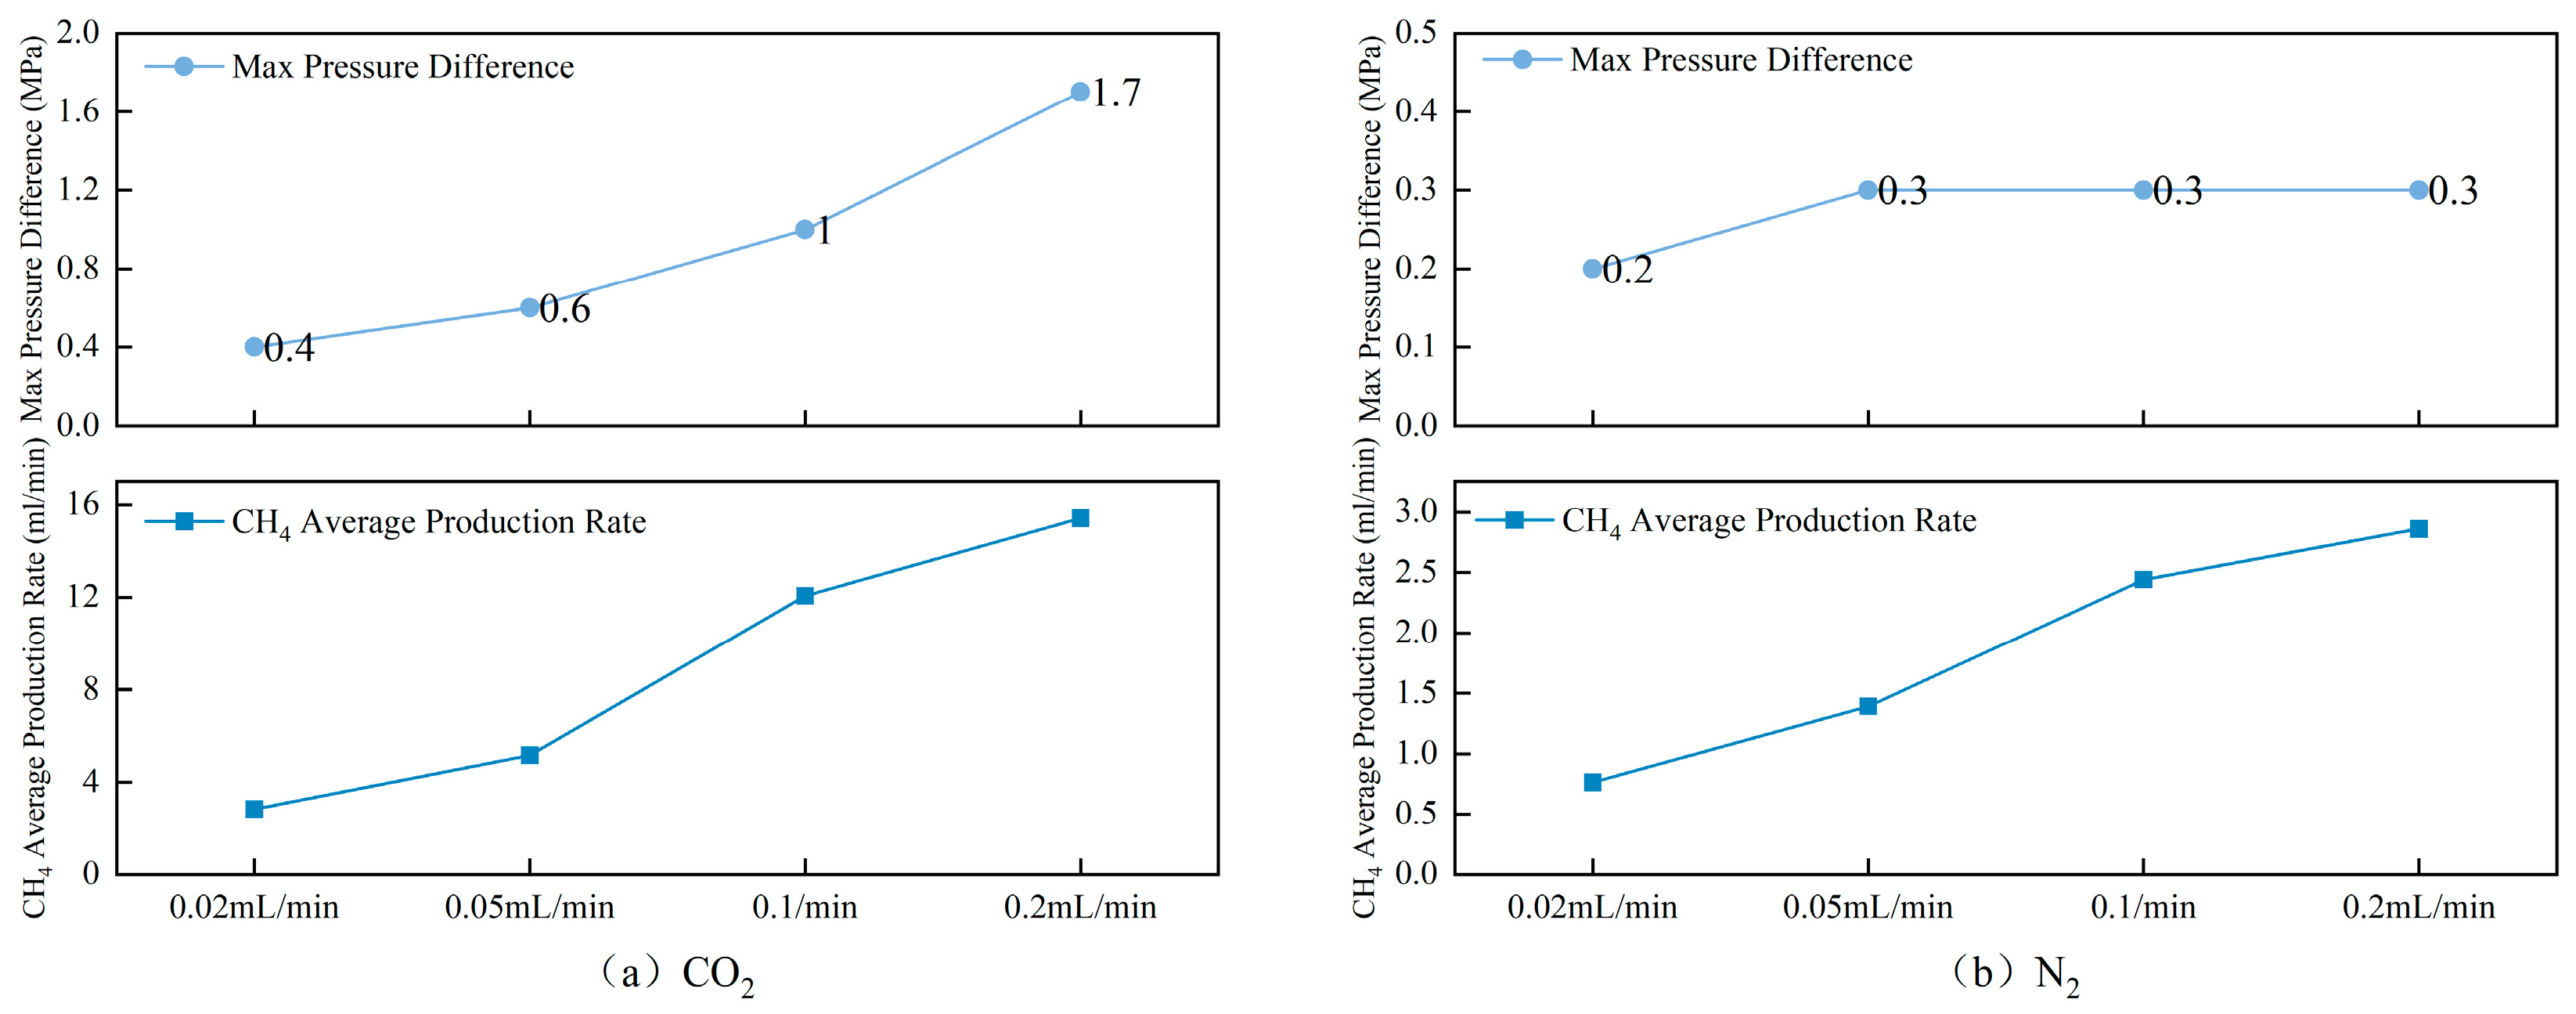
Figure 10 depicts the variations in the average CH4 production rate and pressure differential under different gas injection rates. The average CH4 production rate specifically refers to the mean value of CH4 production during the gas injection displacement stage, spanning from the initiation of gas injection to the point where the CH4 content in the produced gas drops below 5%. The average CH4 production rate increases significantly with the rise in gas injection rate, whereas the pressure differential shows no obvious variation under different gas injection timings. At a gas injection rate of 0.2 mL/min, the average CH4 production rates corresponding to CO2 and N2 injection are 15.41 mL/min and 2.86 mL/min, respectively; in contrast, at an injection rate of 0.02 mL/min, the values decrease to 2.84 mL/min and 0.76 mL/min, respectively. The maximum pressure differentials during the injection of the two gases are 1.7 MPa (for CO2) and 0.3 MPa (for N2), respectively.
A comparison demonstrates that both the pressure differential and CH4 production rate during CO2 injection are significantly higher than those during N2 injection. This is mainly because the plug-type displacement mode of CO2 enables it to sweep the reservoir more effectively, but it also means that a higher pressure differential is required to drive the relatively uniform displacement front. In contrast, N2 is more prone to gas channeling, forming high-speed flow pathways, which conversely reduces the subsequent displacement pressure.

4.2.3. Analysis of Breakthrough Timing Under Different Injection Rates

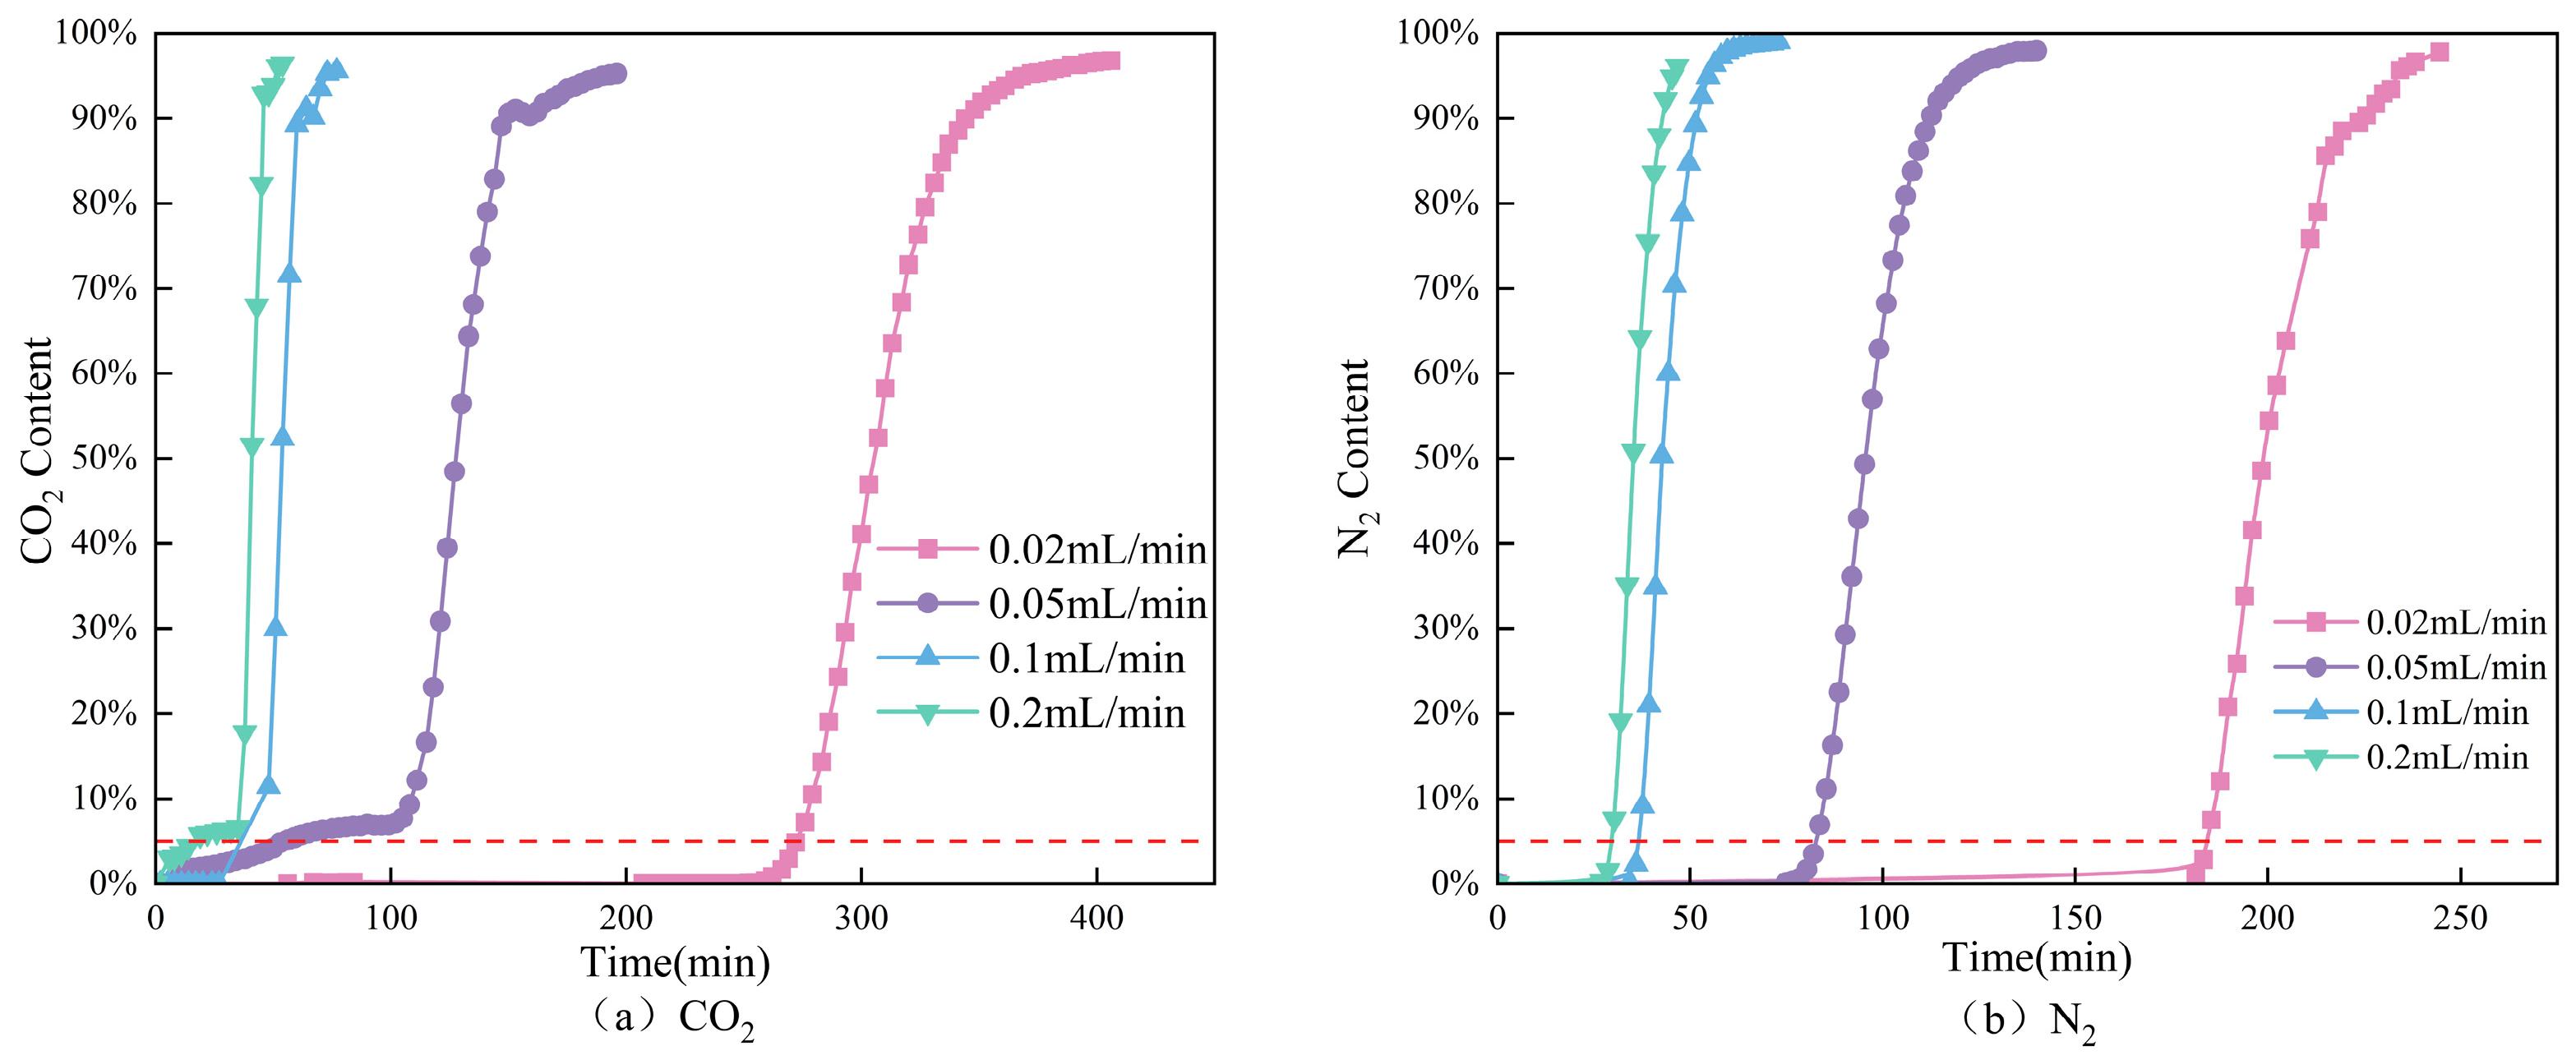
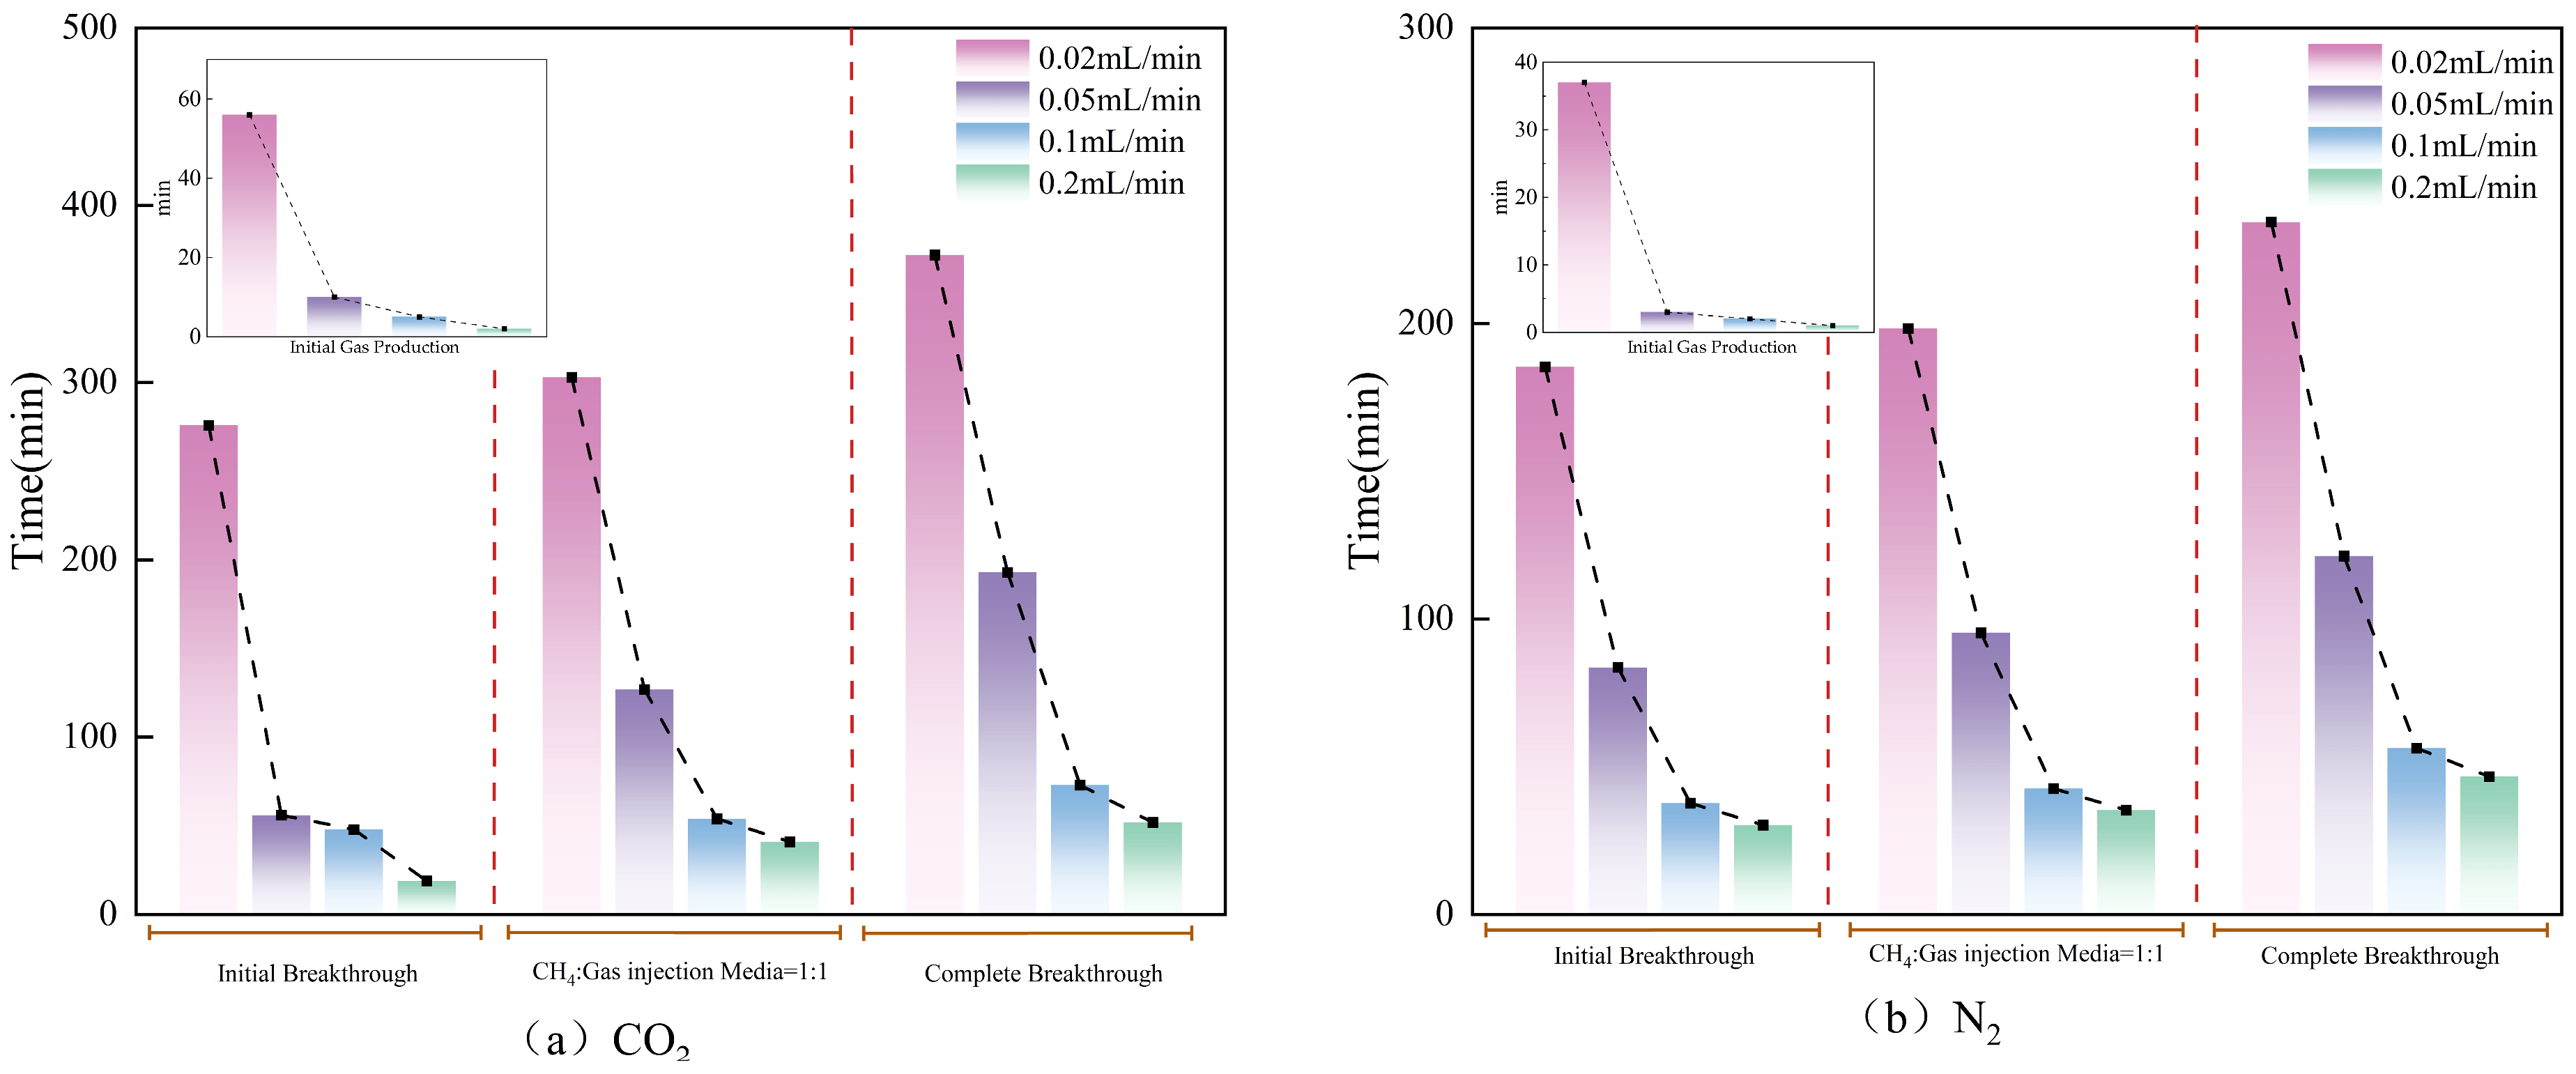
Figure 11 and Figure 12 illustrate the compositional variations and breakthrough times of CO2 and N2 under different gas injection rates, respectively. Both the initial gas production time and the breakthrough initiation time are advanced with the increase in gas injection rate. It is analyzed that under high injection rate conditions, the injected gas tends to form preferential flow paths more readily, thus advancing the initial gas production time. At relatively low injection rates, insufficient displacement energy slows down the migration and diffusion of CO2/N2 in the pores, thereby delaying their breakthrough times. When the displacement rate increases but remains below the threshold value, the injection pressure gradient increases gradually, which is conducive to improving the displacement uniformity of CO2/N2, promoting the faster migration of CO2/N2 toward the production end, and shortening the breakthrough time.

4.3. Effects of Gas Injection Compositions

In the process of gas injection displacement, the selection of injected gas composition also exerts an influence on enhanced recovery efficiency. Carbon dioxide (CO2) is typically derived from tail gas and flue gas generated by fuel combustion [34], which are mixed gases with high impurity content and complex compositions. The use of pure CO2 for displacement would lead to greater difficulty and higher costs in CO2 purification; thus, the adoption of impure CO2 for displacement can effectively address this issue. To this end, under the conditions of a reservoir temperature of 100 °C, an injection pressure of 7 MPa, and an injection rate of 0.1 mL/min, five groups of displacement experiments with different gas compositions were conducted to systematically analyze the influence law of injected gas composition on CH4 recovery factor.

4.3.1. Analysis of Enhanced Recovery Efficiency Under Different Gas Injection Compositions

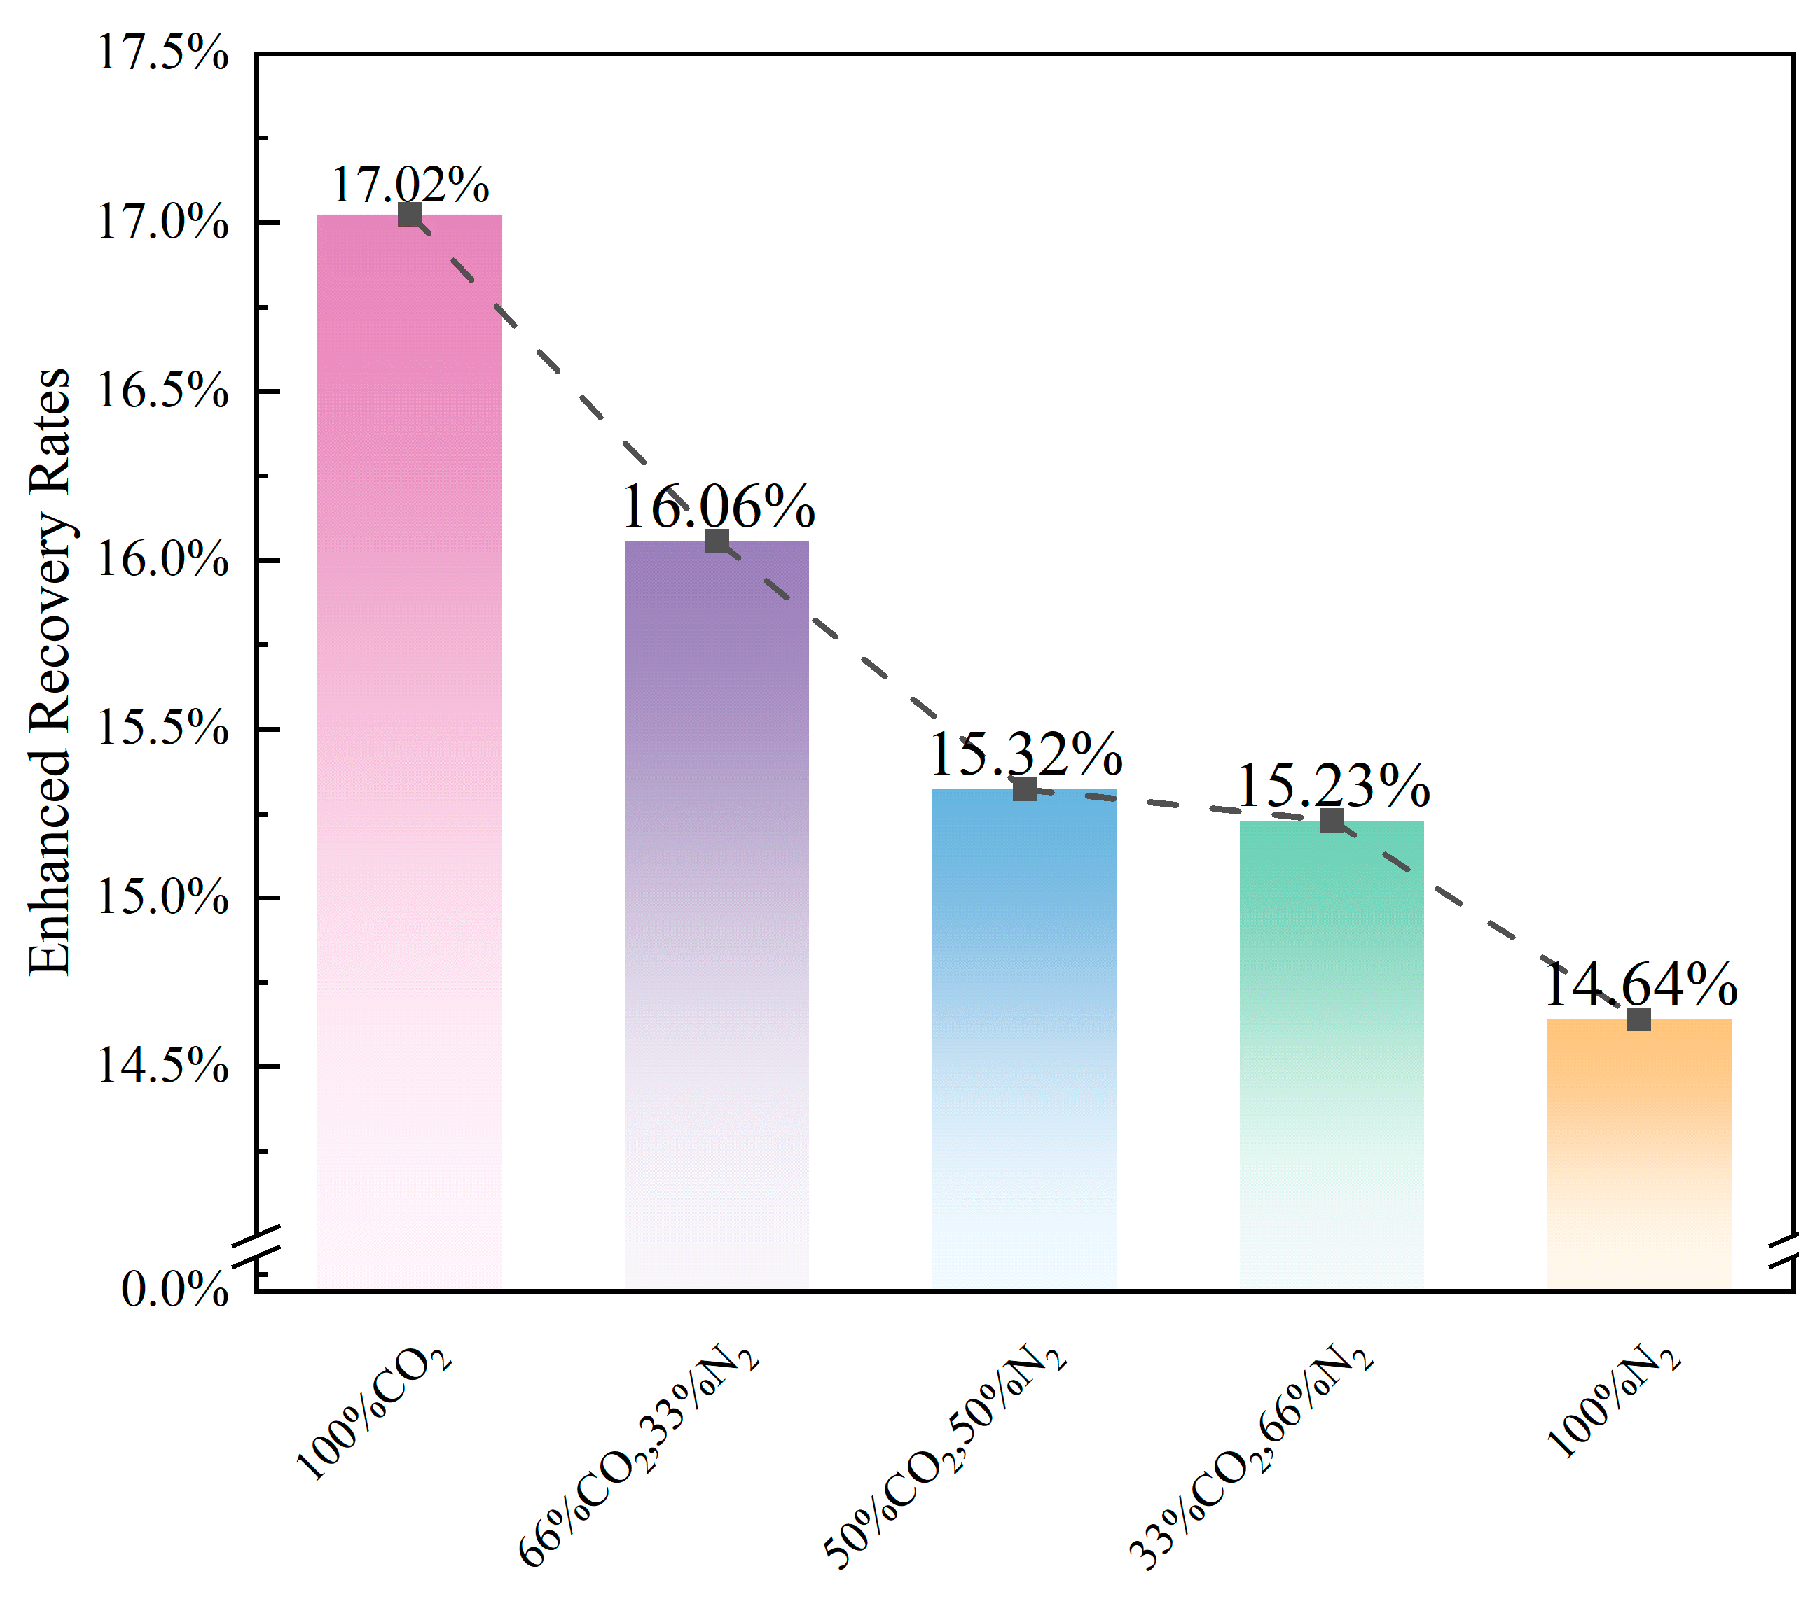
Figure 13 illustrates the influence of injected gas mixtures with different proportions on the enhanced recovery effect. When pure CO2 is used as the injected gas, the optimal enhanced recovery performance is achieved, with the recovery increment reaching 17.02%. In contrast, pure N2 yields the poorest displacement effect, corresponding to a recovery increment of only 14.64%. With the increase in CO2 proportion in the injected gas mixture, the enhanced recovery effect exhibits a gradual upward trend. Concurrently, the pressure at the injection end increases significantly as the CO2 proportion rises.
Beyond the viscosity difference, this phenomenon is mainly attributed to the competitive adsorption effect of CO2. CO2 molecules are adsorbed on the surface of pore throats, which is equivalent to temporarily reducing the effective radius of pore throats and thereby increasing the flow resistance. This additional pressure “consumption” is precisely the macro-mechanical manifestation of the microscopic process where CO2 displaces the adsorbed CH4. Analysis indicates that an increase in CO2 proportion elevates the CO2 content in the pore fluid, which contributes to a more uniform advancement of the displacement front. Meanwhile, CO2 displacement is characterized by a relatively long breakthrough time, which helps to expand the sweep range and mitigate the fingering phenomenon, thus displacing the CH4 in pores more effectively. The higher the CO2 proportion, the more pronounced the aforementioned effects, and consequently, the better the enhanced recovery performance. Overall, pure CO2 delivers the optimal displacement effect. However, the engineering application of pure CO2 is confronted with challenges of high purification difficulty and elevated costs. Therefore, the adoption of CO2/N2 mixed gases with an appropriate proportion for displacement can ensure the enhanced recovery effect while achieving cost reduction and efficiency improvement.
Our results show that pure CO2 yields a higher incremental recovery (17.02%) than pure N2 (14.64%) in tight sandstone. This directly contrasts with numerical simulations of shale reservoirs by Li & Elsworth (2019) [35], who reported that pure N2 could increase shale gas recovery by 80%, compared to only 20% for pure CO2 due to severe CO2-induced matrix swelling restricting fracture permeability. Because tight sandstone lacks substantial kerogen, the matrix swelling effect is minimized; thus, the higher density and viscosity of supercritical CO2 dominate the displacement efficiency. Additionally, Du et al. (2019) [36] reported absolute product recoveries of 52.90% (CO2) and 41.60% (N2) using crushed shale samples in a fixed bed. While our study confirms the positive correlation between CO2 fraction and recovery, our absolute incremental values (14–17%) are significantly more realistic for field applications, as the 35.8 cm intact long-core preserves the natural seepage resistance and structural heterogeneity that crushed samples eliminate.
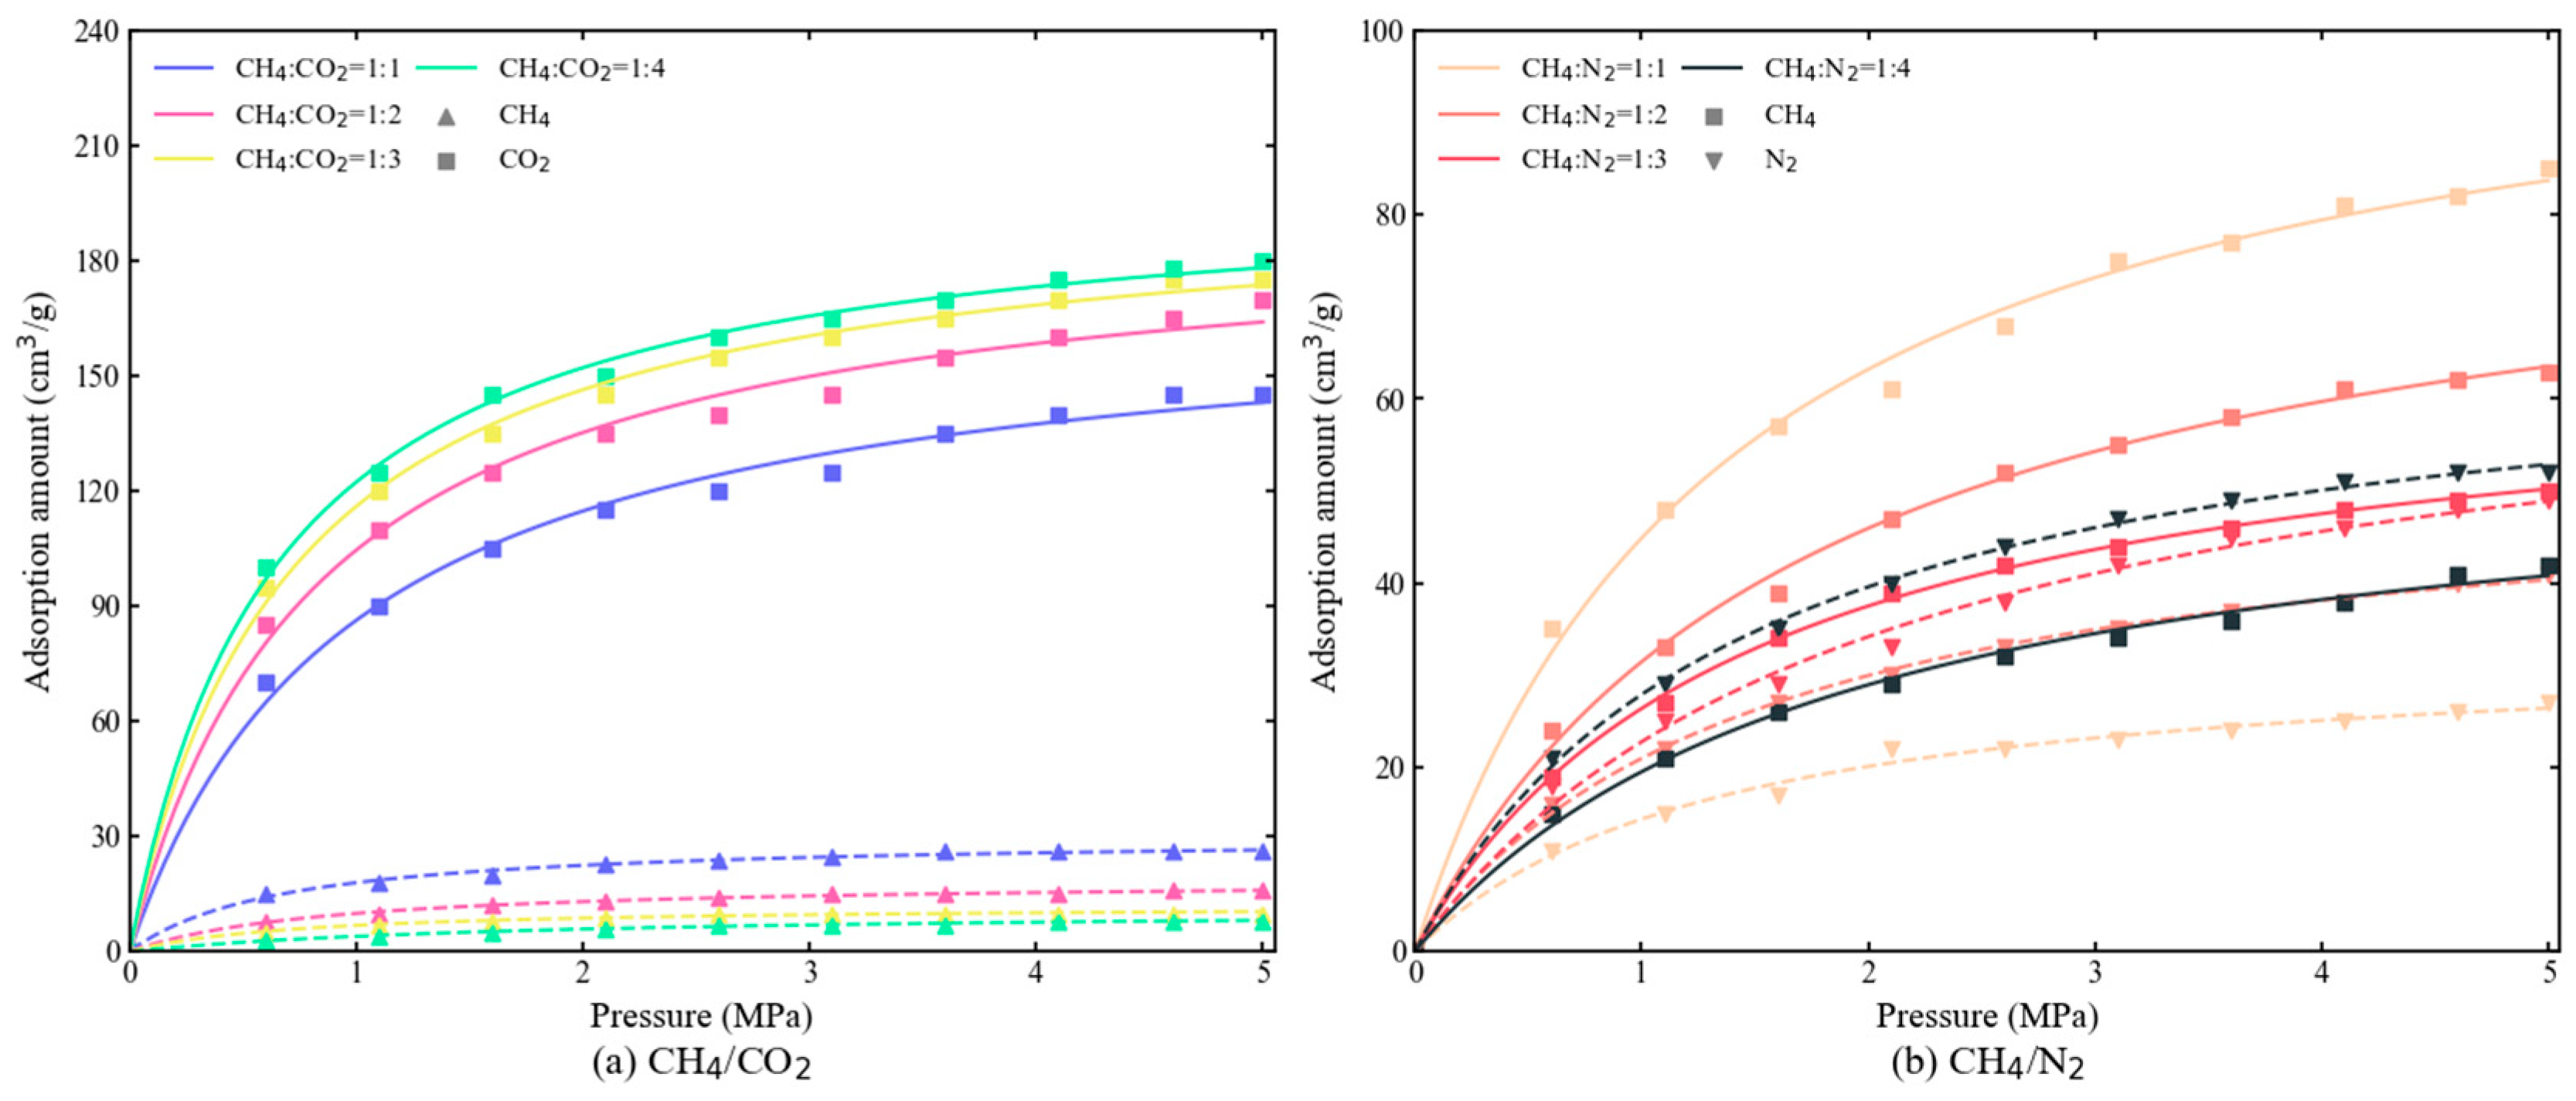
The pressure-dependent adsorption behavior of CH4/CO2 and CH4/N2 mixtures matched that of their respective single-component gases [37]. As shown in Figure 14a, increasing CO2 proportion in CH4/CO2 mixtures enhanced CO2 adsorption while suppressing CH4 adsorption. For CH4/N2 mixtures (Figure 14b), CH4 adsorption was higher than N2 at CH4/N2 ratios above 1:3, equal at the 1:3 critical ratio, and lower than N2 at ratios below 1:3. This crossover confirms that N2, despite its weaker intrinsic adsorption affinity, can outcompete CH4 and dominate the adsorption process once its relative concentration exceeds the 1:3 threshold [38].

4.3.2. Analysis of Variation in CH4 Gas Production Rate Under Different Gas Injection Compositions

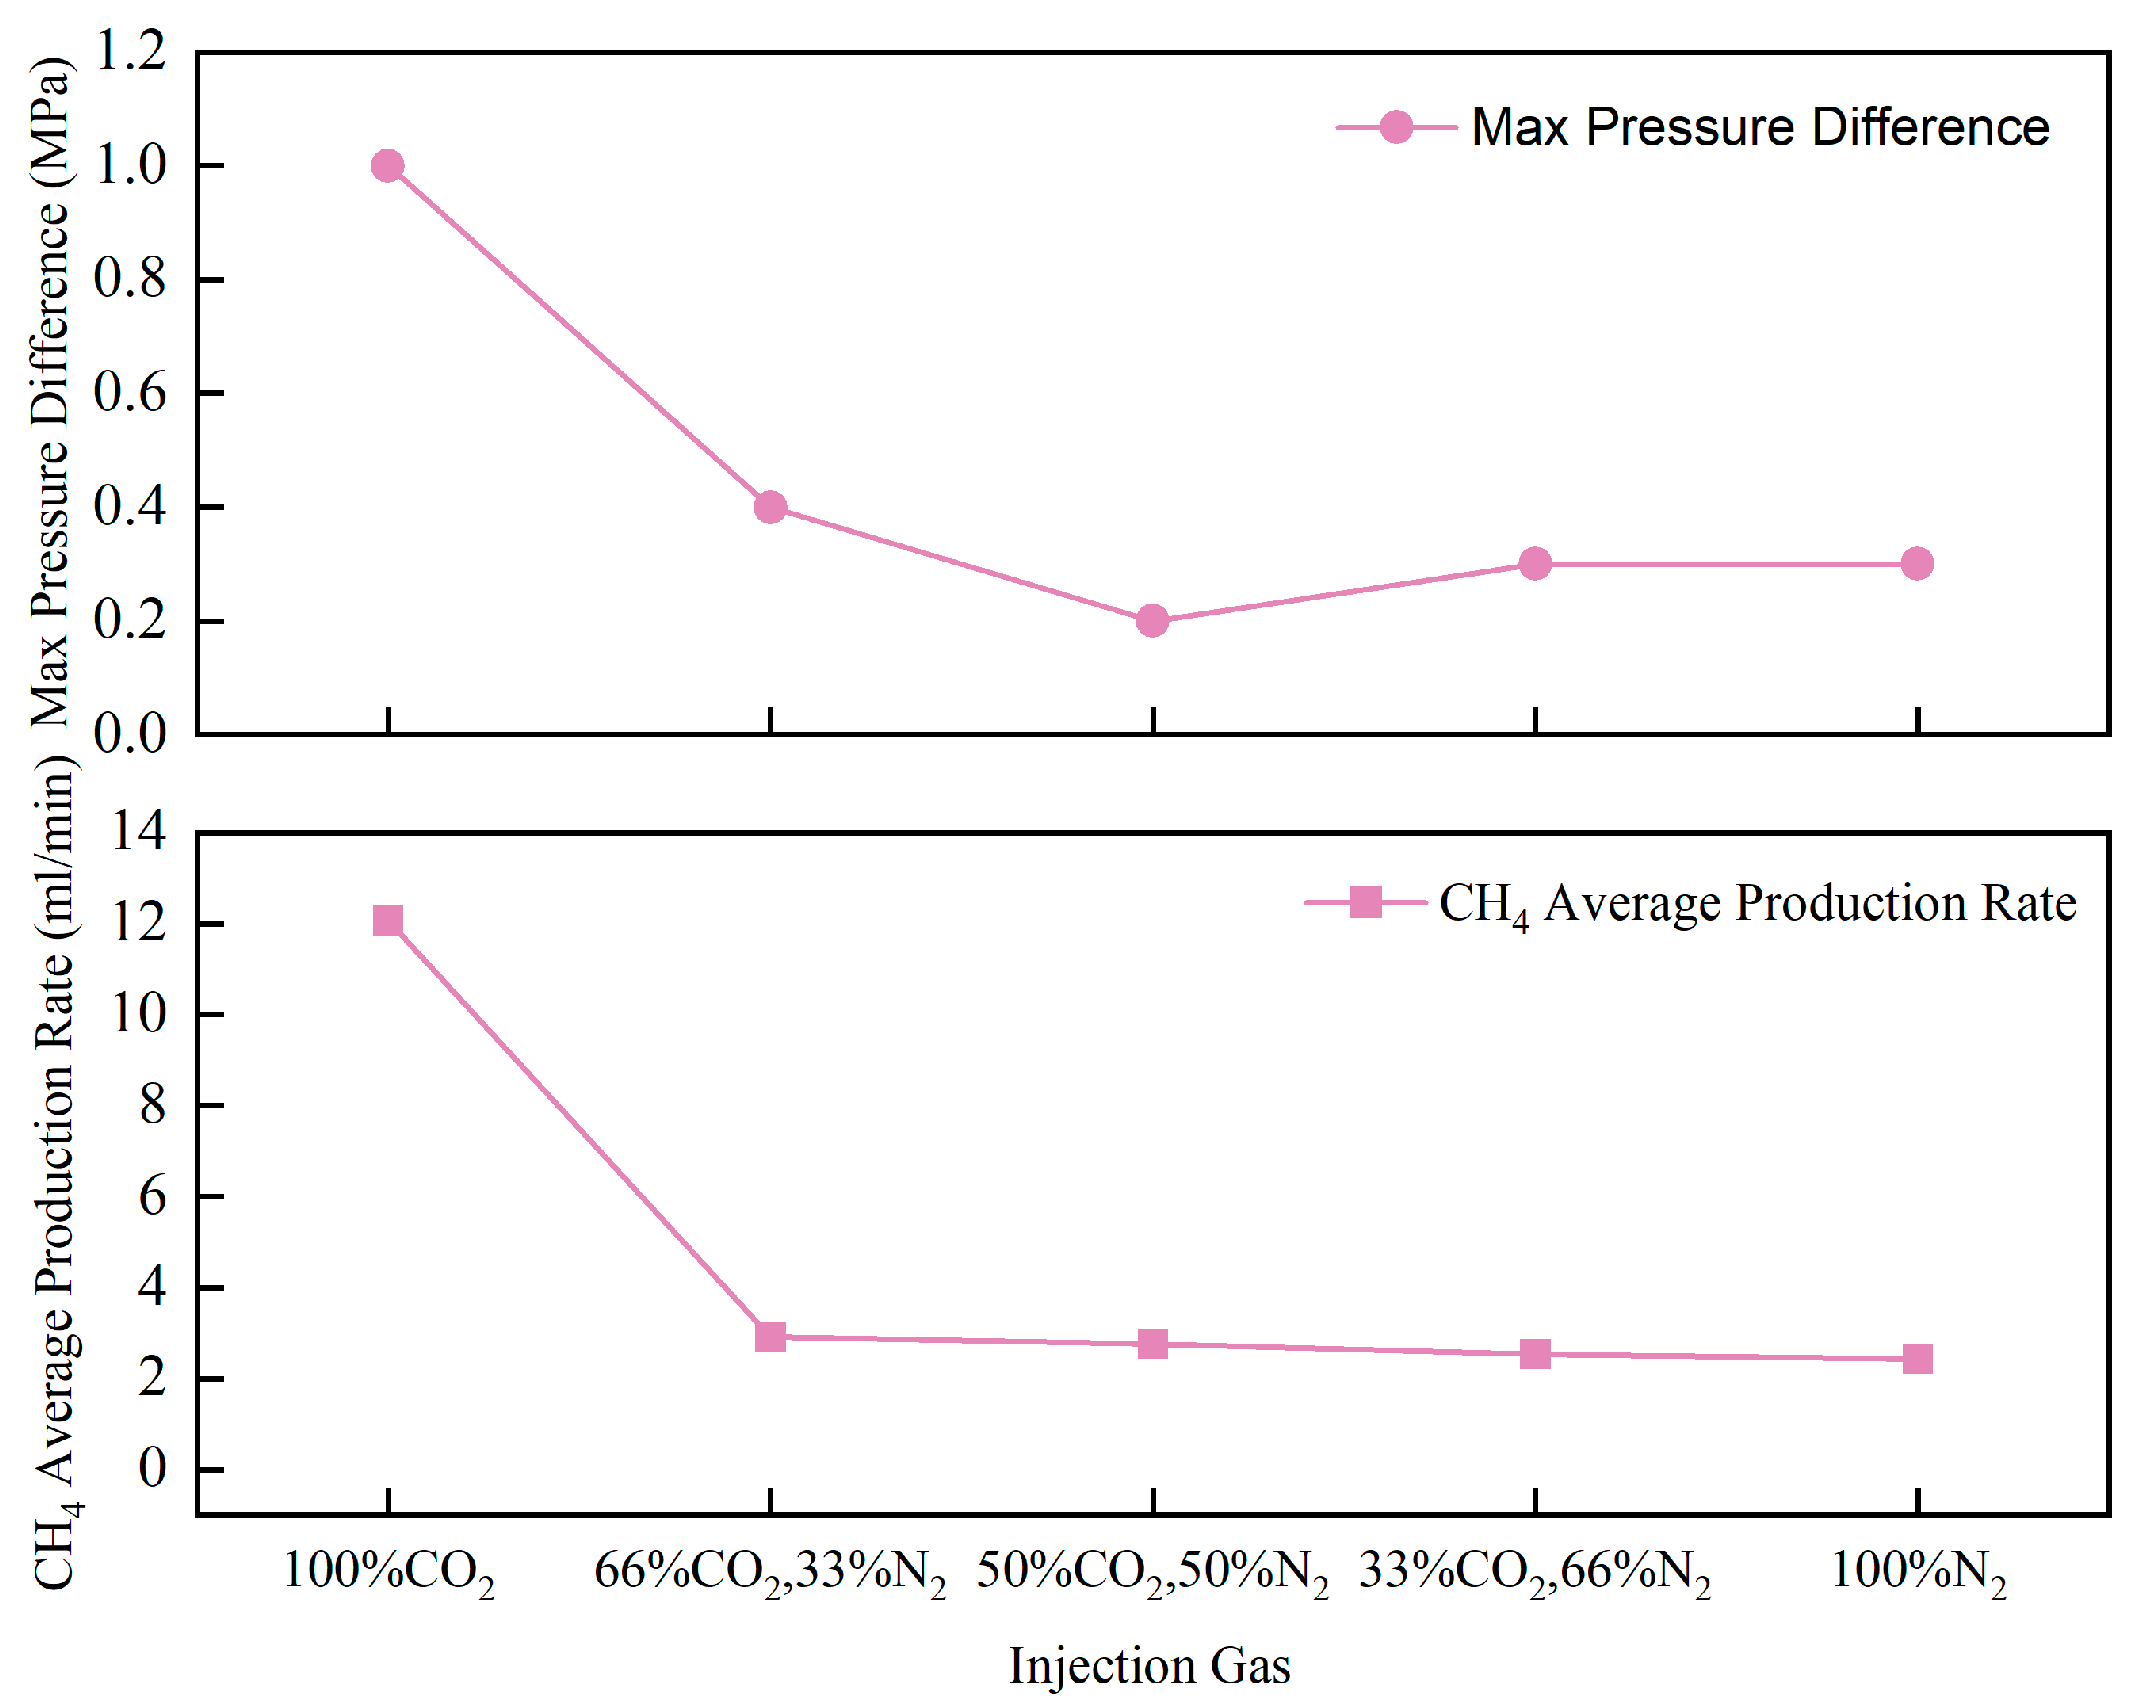
Figure 15 depicts the variations in the average CH4 production rate and pressure differential under different injected gas compositions. With the increase in CO2 content in the injected gas, the average CH4 production rate increases gradually. The pressure differential reaches its maximum during pure CO2 displacement, whereas it shows no obvious variation as the CO2 content decreases in the mixed gas. The average CH4 production rate is 12.07 mL/min for pure CO2 displacement and only 2.44 mL/min for pure N2 displacement.
The comparison results indicate that pure CO2 displacement is significantly superior to impure CO2 displacement in terms of both pressure differential and CH4 production rate. This is mainly because CO2 advances in a plug-type displacement mode, which enables it to sweep the reservoir more effectively, but it also requires a higher displacement pressure to drive the relatively uniform displacement front. In contrast, N2 features a high diffusion coefficient and is prone to gas channeling, forming preferential flow paths and thus leading to a reduction in displacement pressure. Overall, the higher the CO2 content in the injected gas, the better the displacement efficiency.

4.3.3. Analysis of Breakthrough Timing Under Different Gas Injection Compositions

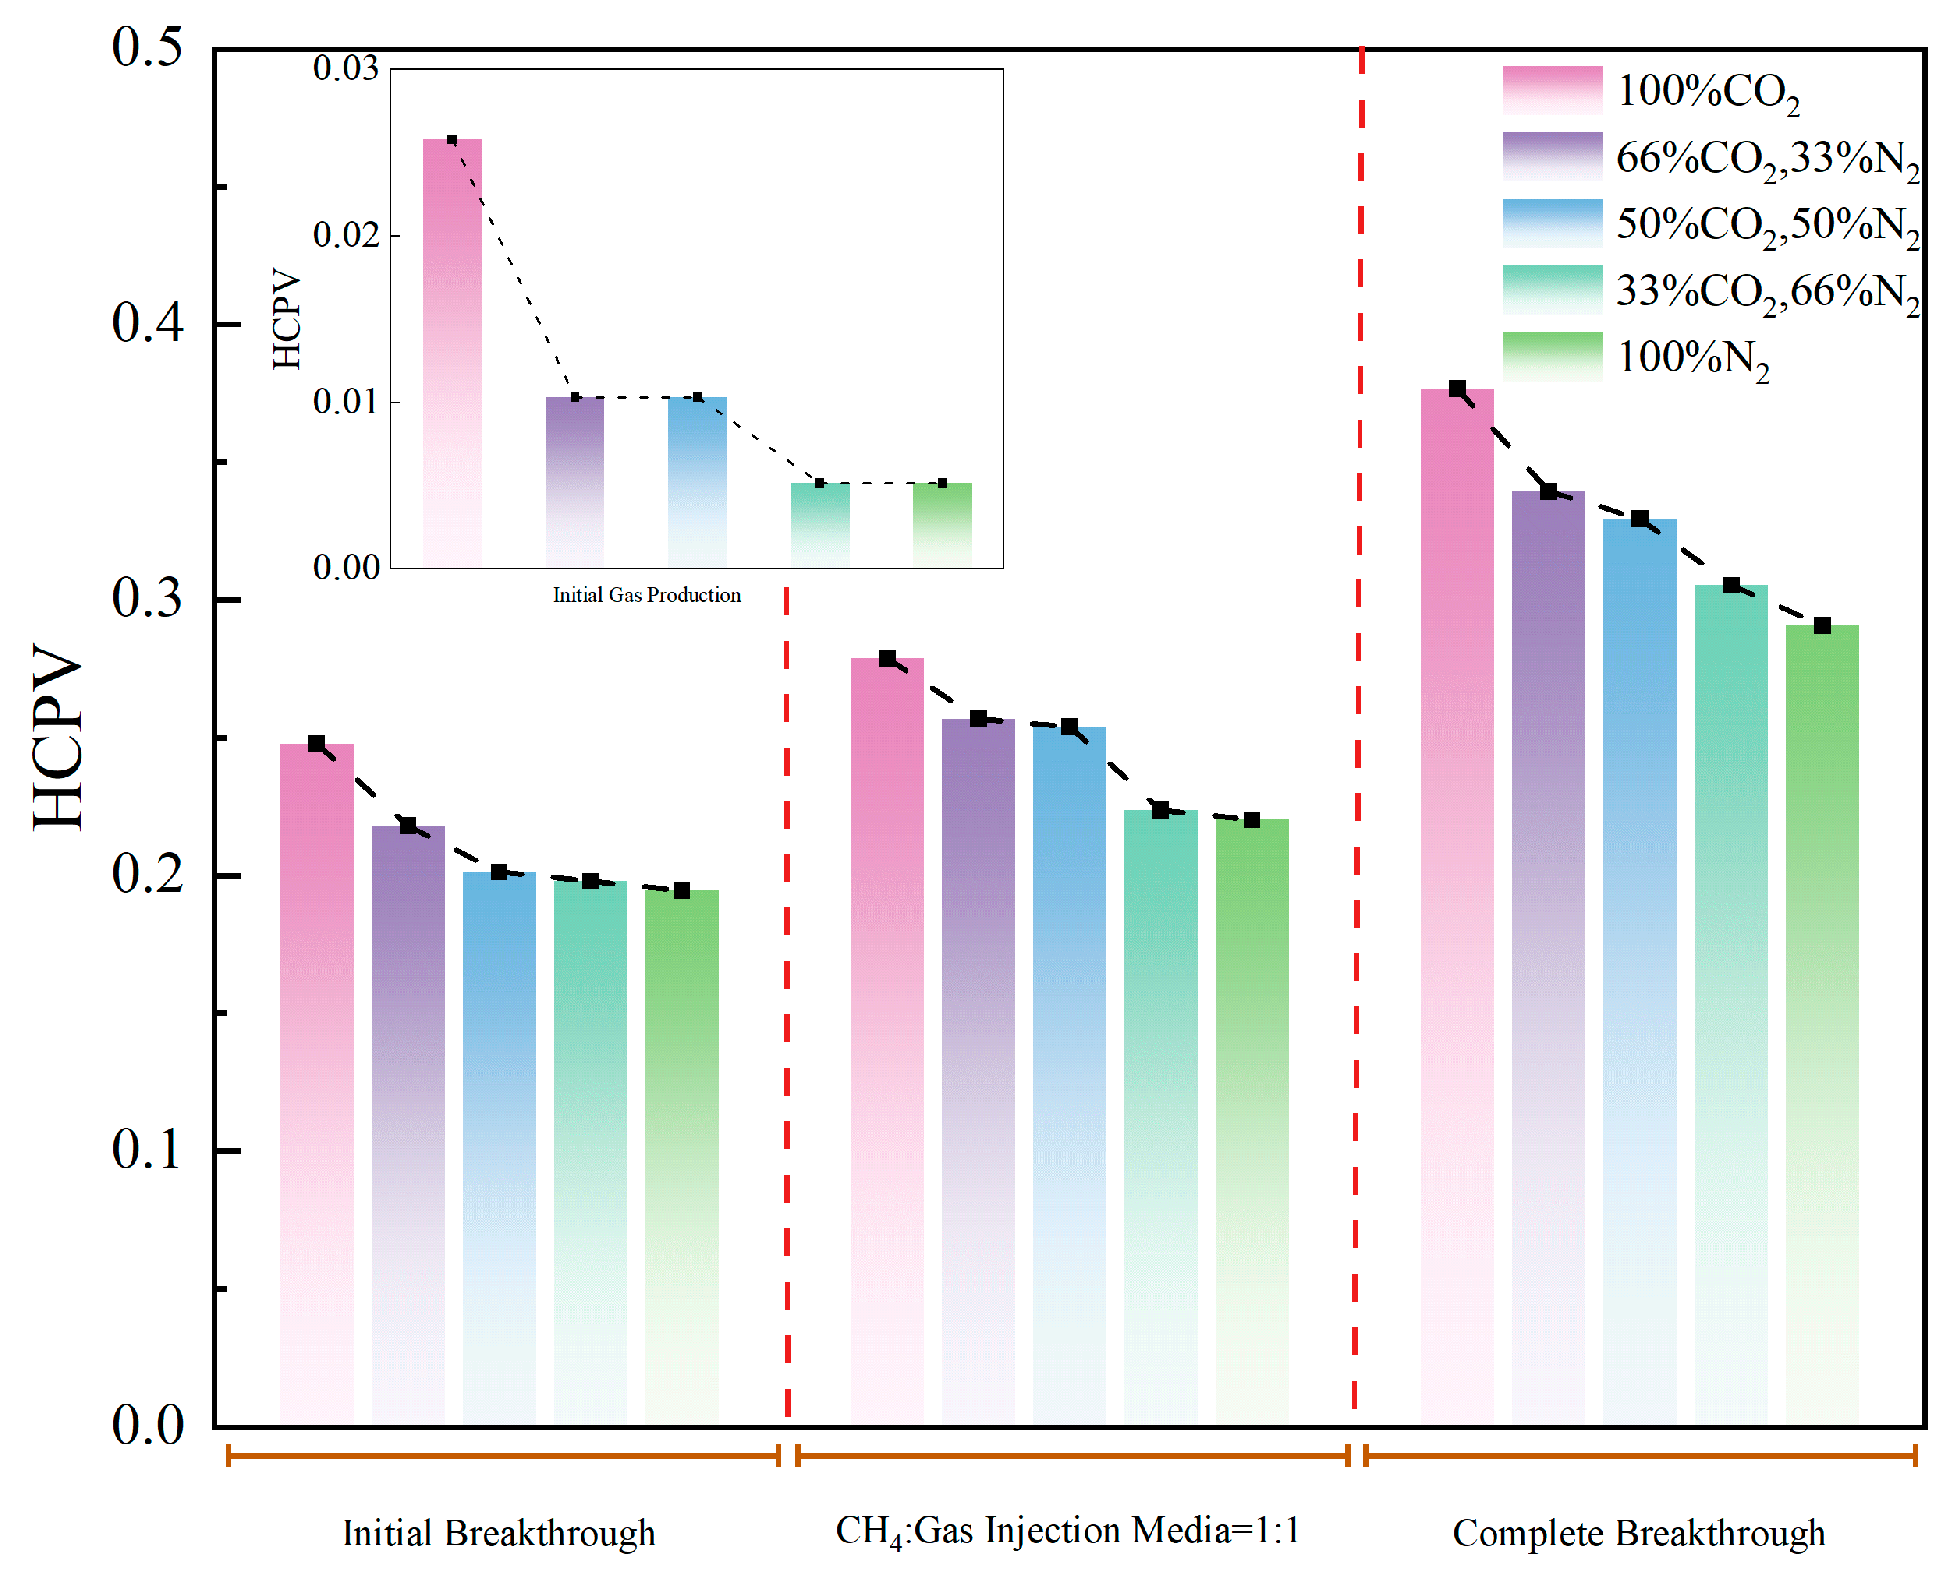
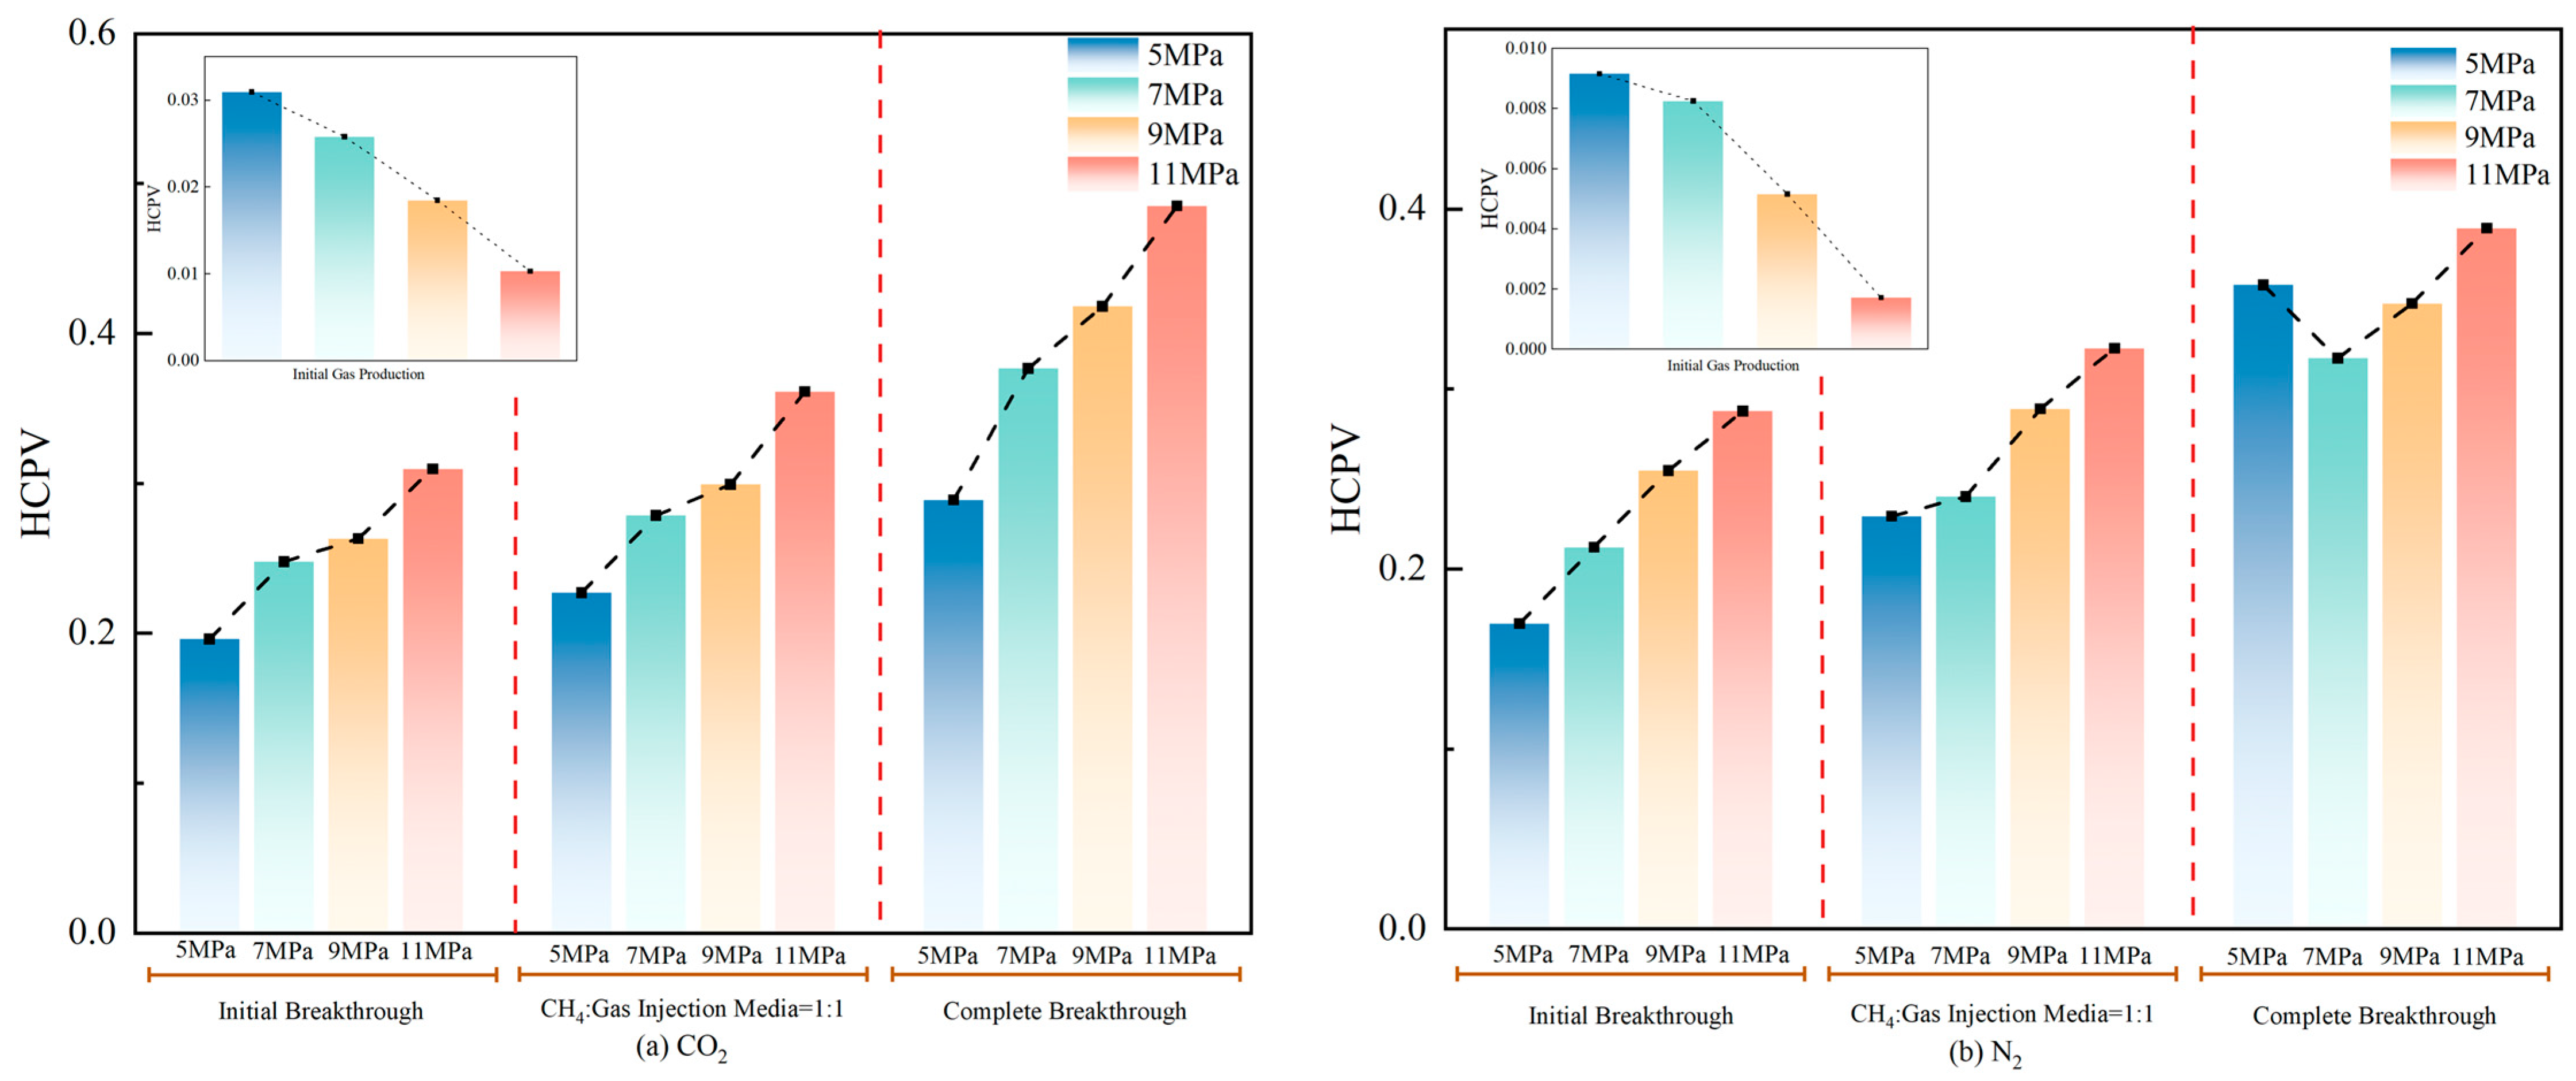
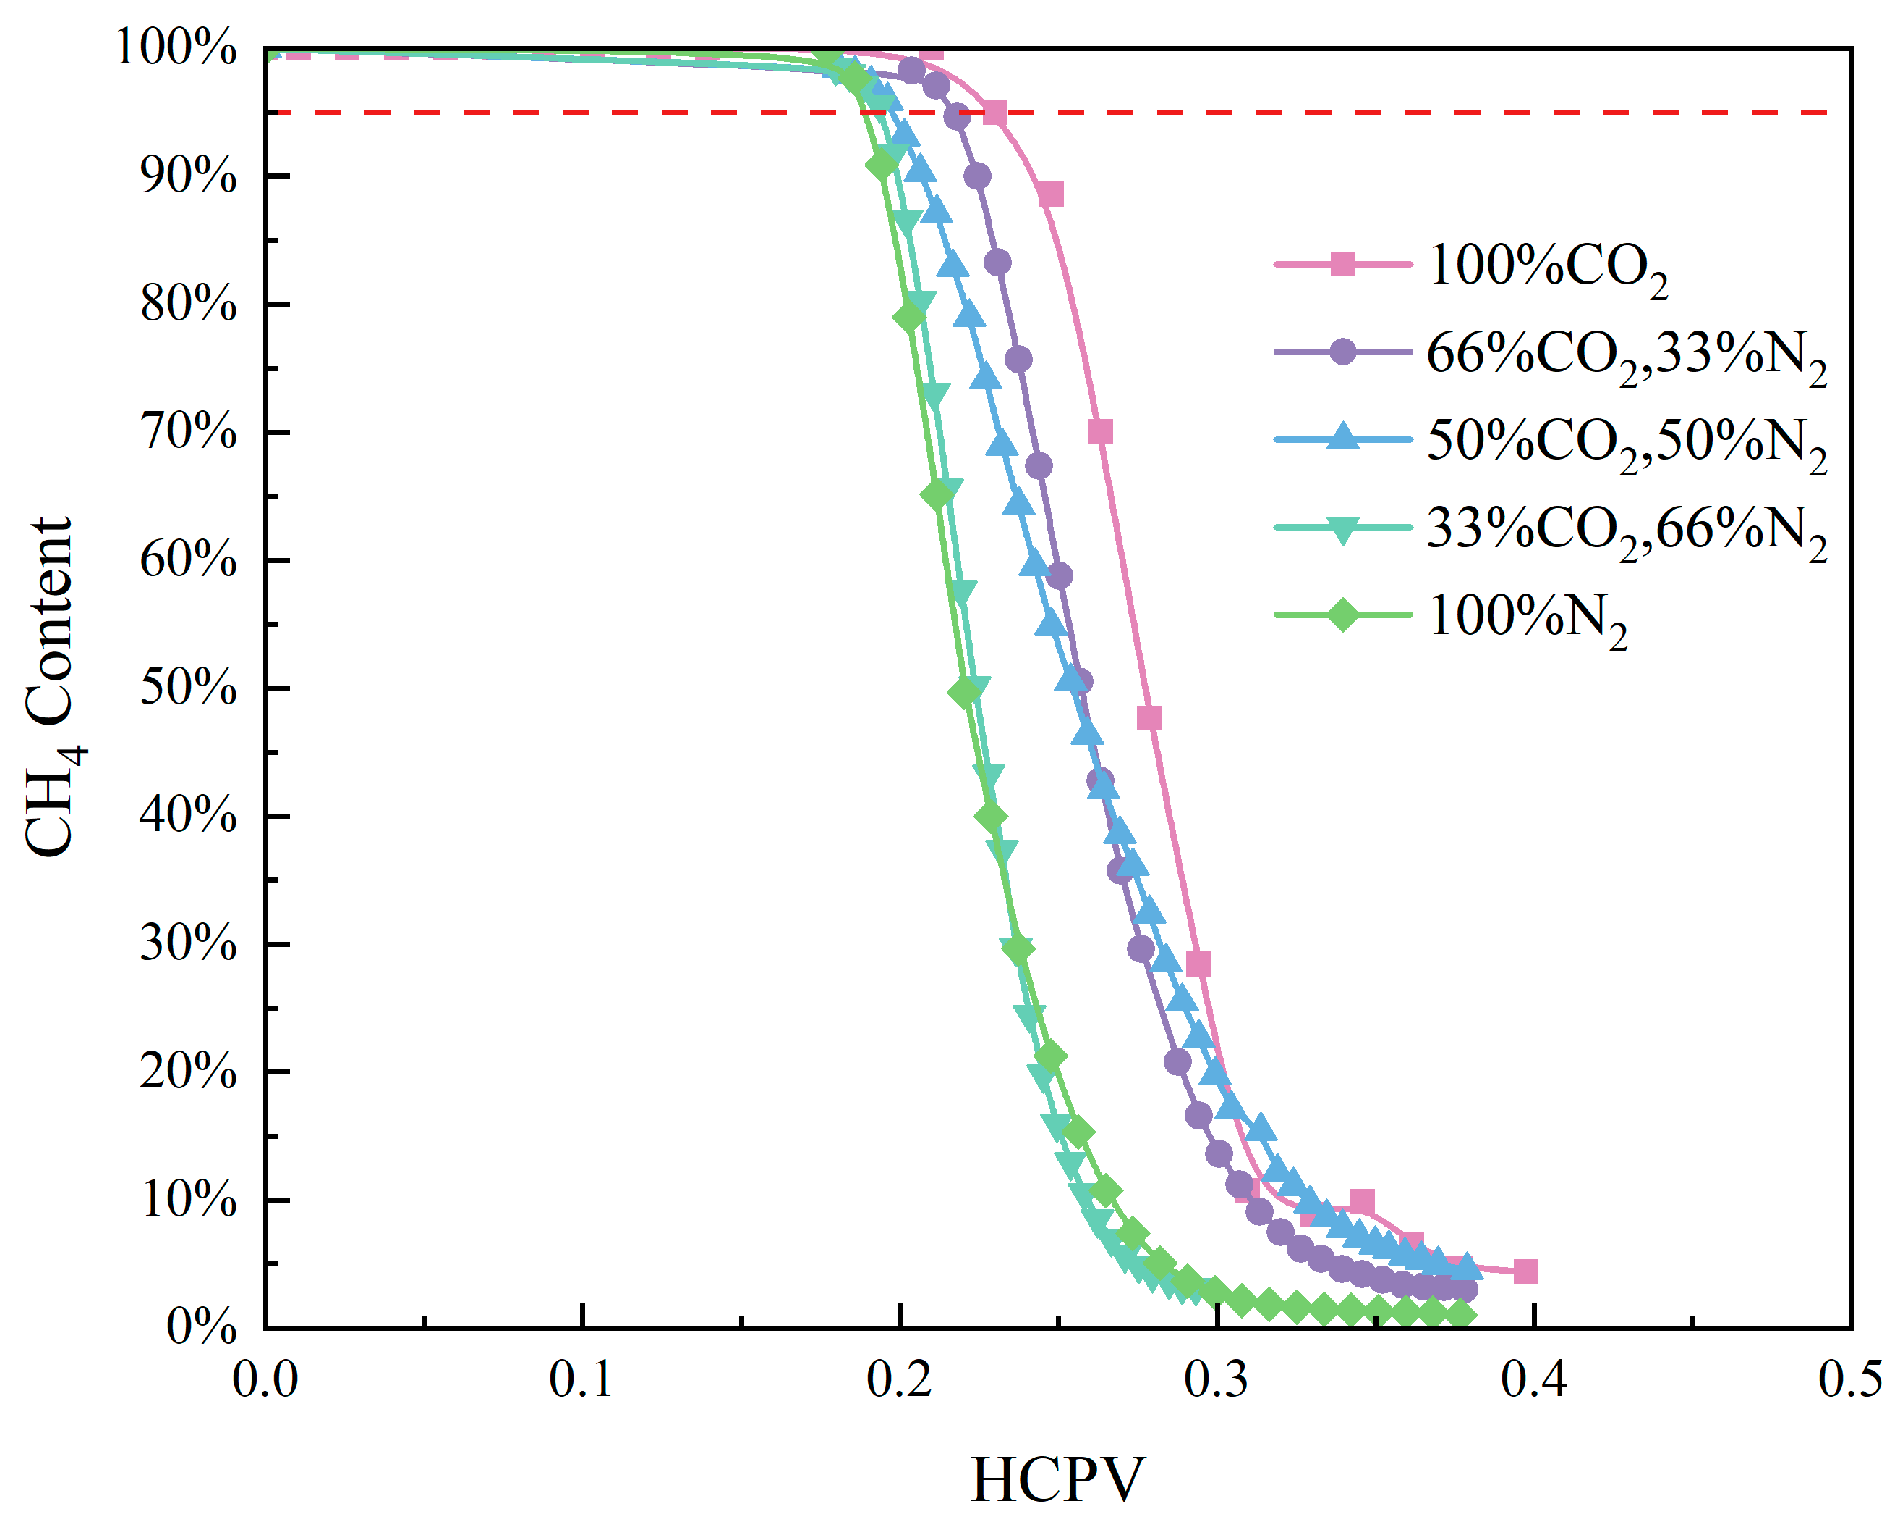
Figure 16 and Figure 17 illustrate the variations in CH4 content and breakthrough time under different injected gas compositions, respectively. With the increase in the CO2 proportion in the injected gas, both the initial gas production time and breakthrough time are correspondingly delayed. Specifically, breakthrough occurs at 0.24 HCPV for pure CO2 displacement, whereas it takes place at 0.19 HCPV for pure N2 displacement.
Analysis indicates that as the N2 proportion increases, the miscibility between the injected gas and CH4 decreases, leading to premature gas channeling and shortened breakthrough time. The results presented in Figure 13 show that the maximum pressure differentials of mixed gas displacement with N2 addition are generally lower than those of pure CO2 displacement, which further demonstrates that mixed gas displacement with N2 takes effect more rapidly, with both its initial gas production time and breakthrough time being earlier than those of pure CO2 displacement.
This study macroscopically observed that N2 breaks through earlier (0.19 HCPV) than CO2 (0.24 HCPV). This quantitatively aligns with the microscopic mechanisms identified by Du et al. (2019) [36], who used the Coats-Smith dispersion-capacitance model to demonstrate that the longitudinal dispersion coefficient of N2 is more than 5 times higher than that of CO2, leading to premature gas breakthrough and excessive mixing. Our intact long-core tests successfully validate this rapid breakthrough phenomenon at a macroscopic engineering scale.

5. Conclusions

This study systematically uses CO2–N2 mixtures, and long-core flooding experiments were conducted at 100 °C to investigate the impact patterns of three key factors—injection timing, injection rate, and injection gas composition—on the enhanced recovery of tight sandstone gas reservoirs. The main conclusions reached are as follows:
(1) During the process of CO2/N2 displacement for natural gas recovery, the earlier the gas injection timing, the higher the CH4 production rate and the greater the amplitude of recovery improvement, whereas the cumulative recovery factor decreases conversely. Therefore, it is necessary to maximize the synergistic effect of gas displacement while achieving high energy utilization efficiency, so as to realize the optimization of cumulative recovery factor. This finding provides a quantitative reference range for field determination of gas injection timing and corrects the one-sided understanding that “the earlier the gas injection, the better”, and premature gas injection fails to fully utilize the original formation energy of the natural gas reservoir for depletion development.
(2) During the process of CO2/N2 displacement for natural gas recovery, the average CH4 production rate increases with the rise in gas injection rate, and the extent of CH4 recovery improvement exhibits a trend of first increasing and then decreasing. This indicates that there exists an optimal injection rate range, which can provide a key direction for the optimization of field operation schemes: specifically, field design should determine the optimal injection intensity between “insufficient energy supplement” and “premature gas breakthrough” through numerical simulation or pilot tests.
(3) During the process of CO2/N2 displacement for natural gas recovery, both the average CH4 production rate and the extent of recovery improvement show a nonlinear increasing trend with the rise in CO2 proportion in the injected gas. Overall, pure CO2 displacement delivers the optimal effect. However, the engineering application of pure CO2 is confronted with the problems of high purification difficulty and elevated costs. Thus, the adoption of CO2/N2 mixed gas with an appropriate proportion for displacement can ensure the enhanced recovery effect while achieving cost reduction and efficiency improvement.

Author Contributions

Conceptualization, L.L., J.L., P.L., B.F. and Y.W.; Methodology, L.L., J.L., P.L., B.F. and Y.W.; Software, J.Z.; Validation, L.L., J.L., P.L., C.C. and Y.Z.; Investigation, H.Z. and J.H.; Data curation, H.Z. and J.H.; Writing—original draft, J.Z.; Writing–review and editing, Z.W.; Visualization, J.Z. and Z.W.; Supervision, C.C. and Y.Z.; Project administration, Y.Z.; Funding acquisition, B.F. and Y.W. All authors have read and agreed to the published version of the manuscript.

Funding

This research is supported by the National Key R&D Program of China (Grant No.2023YFF0614104), the PetroChina Company Limited Project (Grant No. 2023ZZ25YJ05), the National Science and Technology Major Project (Grant No. 2025ZD1404307, 2025ZD1405503), the National Natural Science Foundation of China (52474047).

Data Availability Statement

The original contributions presented in this study are included in the article. Further inquiries can be directed to the corresponding authors.

Conflicts of Interest

The authors declare that they have no known competing financial interests or personal relationships that could have appeared to influence the work reported in this paper.

References

  1. Fan, D.; Wang, Z.; Wang, Y.; Han, Z.; Li, W.; Bai, Y.; Bo, X.; Li, J. Analysis and outlook of the situation of domestic and international oil and gas resources in 2024. China Min. Mag. 2025, 34, 46–54. [Google Scholar]
  2. Zhang, L.; Cao, C.; Wen, S.; Zhao, Y.; Peng, X.; Wu, J. Thoughts on the development of CO2-EGR under the background of carbon peak and carbon neutrality. Nat. Gas Ind. 2023, 43, 13–22. [Google Scholar] [CrossRef] [Scilit]
  3. Liao, H. Experiment and numerical simulation of enhancing tight sandstone gas recovery by CO2 flooding. Daqing Pet. Geol. Dev. 2025, 44, 101–106. [Google Scholar]
  4. Qu, P. Large Reserves of Tight Gas Provide Confidence for Stable Production. China Energy News, 21 April 2025. [CrossRef]
  5. Zhu, H.; Cao, C.; Zhang, L.; Zhao, Y.; Peng, X.; Zhao, Z.; Chen, X. Mechanism and development direction of CO2-enhanced gas recovery. Pet. Reserv. Eval. Dev. 2024, 14, 975–980. [Google Scholar] [CrossRef]
  6. Ajoma, E.; Saira; Sungkachart, T.; Ge, J.; Le-Hussain, F. Water-saturated CO2 injection to improve oil recovery and CO2 storage. Appl. Energy 2020, 266, 114853. [Google Scholar] [CrossRef] [Scilit]
  7. Jing, S.; He, J.; Zhou, X. Study on the mechanism and influencing factors of enhancing tight gas recovery by CO2 injection. J. Chongqing Univ. Sci. Technol. (Nat. Sci. Ed.) 2014, 16, 91–94. [Google Scholar]
  8. Zhang, Y.; Liu, S.; Chen, M.; Xu, S. Experimental study on dispersion characteristics and CH4 recovery efficiency of CO2, N2 and their mixtures for enhancing gas recovery. J. Pet. Sci. Eng. 2022, 216, 1107–1156. [Google Scholar] [CrossRef] [Scilit]
  9. Du, J.; Zhao, Y.; Guo, P.; Zhao, Q. Experimental study on enhancing recovery by CO2 flooding in tight gas reservoirs of northern Hubei. Sci. Technol. Eng. 2020, 20, 6459–6465. [Google Scholar]
  10. Jiang, Y.; Bai, G.; Zhou, X.; Wang, S.; Wang, L.; Fan, C. Experimental study on factors influencing CH4 displacement by CO2 injection in coal seams. China Saf. Sci. J. 2022, 32, 113–121. [Google Scholar]
  11. Li, L.; Liang, W.; Li, Z.; He, W. Experimental study on enhanced coalbed methane recovery by heated CO2 flooding. J. China Coal Soc. 2017, 42, 2044–2050. [Google Scholar]
  12. Liu, Z.; Cheng, Y.; Wang, Y.; Wang, L.; Li, W. Experimental investigation of CO2 injection into coal seam reservoir at in-situ stress conditions for enhanced coalbed methane recovery. Fuel 2019, 236, 709–716. [Google Scholar] [CrossRef] [Scilit]
  13. Ye, L.; Gao, S.; Wei, Y.; Liu, H.; Zhu, W.; An, W. Experimental study on enhancing recovery by CO2 injection after water flooding in a low-permeability bottom-water gas reservoir. In Proceedings of the 33rd National Natural Gas Academic Conference (2023) (05: New Energy & Energy Saving); Natural Gas Professional Committee of CPS; RIPED; PetroChina; University of Chinese Academy of Sciences: Beijing, China, 2023; pp. 80–92. [Google Scholar]
  14. Liu, Z.; Jia, Y.; Liang, B.; Chen, C.; Niu, J.; Guo, Y.; Yu, Q.; Li, Q. Mechanism of microscale gas-water retention and enhanced gas recovery by CO2 injection in tight sandstone reservoirs: A case study of Daniudi Gas Field, Ordos Basin. Oil Gas Geol. 2025, 46, 261–272. [Google Scholar]
  15. Jukić, L.; Vulin, D.; Lukić, M.; Sedlar, D.K. Enhanced gas recovery and storability in a high CO2 content gas reservoir. Int. J. Greenh. Gas Control 2022, 117, 103662. [Google Scholar] [CrossRef] [Scilit]
  16. Wang, F.; Liu, Y.; Hu, C.; Wang, Y.; Shen, A.; Liang, S. Experimental study on feasibility of enhanced gas recovery through CO2 flooding in tight sandstone gas reservoirs. Processes 2018, 6, 214. [Google Scholar] [CrossRef] [Scilit]
  17. Tang, Y.; Zhang, C.; Du, Z.; Cui, S.; Ma, Y.; Mi, H. Experiments on gas recovery enhancement and storage by CO2 flooding. Reserv. Eval. Dev. 2015, 5, 34–40+49. [Google Scholar]
  18. Turta, A.; Sim, S.; Singhal, A.; Hawkins, B. Basic Investigations on Enhanced Gas Recovery by Gas-Gas Displacement. J. Can. Pet. Technol. 2008, 47, PETSOC-08-10-39. [Google Scholar] [CrossRef] [Scilit]
  19. Ma, H.; Yang, Y.; Zhang, Y.; Li, Z.; Zhang, K.; Xue, Z.; Zhan, J.; Chen, Z. Optimized schemes of enhanced shale gas recovery by CO2-N2 mixtures associated with CO2 sequestration. Energy Convers. Manag. 2022, 268, 116062. [Google Scholar] [CrossRef] [Scilit]
  20. Luo, F.; Xu, R.N.; Jiang, P.X. Numerical investigation of the influence of vertical permeability heterogeneity in stratified formation and of injection/production well perforation placement on CO2 geological storage with enhanced CH4 recovery. Appl. Energy 2013, 102, 1314–1323. [Google Scholar] [CrossRef] [Scilit]
  21. Zhao, E.; Jin, Z.; Li, G.; Zhang, K.; Zeng, Y. Feasibility of CO2 storage and enhanced gas recovery in depleted tight sandstone gas reservoirs within multi-stage fracturing horizontal wells. Pet. Sci. 2024, 21, 4189–4203. [Google Scholar] [CrossRef] [Scilit]
  22. Wu, J.; Du, X.; Bai, Y.; Xv, B.; Wang, S. Study on main controlling factors of enhanced recovery and storage effect by CO2 injection in tight gas reservoirs. Pet. New Energy 2025, 37, 92–102. [Google Scholar]
  23. Fan, C.; Elsworth, D.; Li, S.; Chen, Z.; Luo, M.; Song, Y.; Zhang, H. Modelling and optimization of enhanced coalbed methane recovery using CO2/N2 mixtures. Fuel 2019, 253, 1114–1129. [Google Scholar] [CrossRef] [Scilit]
  24. Wu, X.; Li, J.; Wang, Q.; Meng, X.; Ying, M.; Wang, J.; Zhang, Z. Pore structure characteristics of tight sandstone gas reservoirs, taking the Sulige area of Ordos Basin as an example. J. Phys. Conf. Ser. 2025, 3048, 012117. [Google Scholar] [CrossRef] [Scilit]
  25. Wang, J.; Zhang, C.; Li, J.; Li, Y.; Li, X.; Liu, P.; Lu, J. Understanding and suggestions for stable production of tight sandstone gas reservoir development in Sulige Gas Field. Nat. Gas Ind. 2021, 41, 100–110. [Google Scholar]
  26. Song, X.; Wang, F.; Ma, D.; Gao, M.; Zhang, Y. Progress and prospects of CO2 capture, oil displacement, and storage technologies in CNPC. Pet. Explor. Dev. 2023, 50, 206–218. [Google Scholar] [CrossRef] [Scilit]
  27. Tang, R.; Hou, D.; Wang, Y.; Zhu, H.; Gong, F. Molecular simulation of CO2–hydrocarbon minimum miscibility pressure in tight reservoir nanopores under varying wettability conditions. Chem. Eng. Sci. 2025, 321, 122730. [Google Scholar] [CrossRef] [Scilit]
  28. Chen, Z.; Li, R.; Du, Y.; Wang, X.; Zhang, X.; Yang, H.; Shi, J. Minimum miscibility pressure determination considering three-hydrocarbon-phase displacements for CCUS applications in tight/shale formations. Appl. Therm. Eng. 2025, 286, 129317. [Google Scholar] [CrossRef] [Scilit]
  29. Xu, S. Study on Dispersion Mechanism and Natural Gas Recovery Characteristics in CO2 Enhanced Gas Recovery. Master’s Thesis, Dalian University of Technology, Dalian, China, 2024. [Google Scholar]
  30. Hou, D.; Gong, F.; Chen, B.; Liang, S.; Su, J. Gas recovery enhancement and CO2 storage effects by CO2 flooding in bottom water sandstone gas reservoir. Nat. Gas Ind. 2024, 44, 93–103. [Google Scholar]
  31. Yang, S.L. Phase State of Hydrocarbon System. China Encyclopedia. Available online: https://www.zgbk.com/ecph/words?SiteID=1&ID=415683 (accessed on 4 February 2026).
  32. Wang, Y. Numerical Simulation Study on CO2 Storage in Shale Reservoirs. Master’s Thesis, Xi’an Shiyou University, Xi’an, China, 2023. [Google Scholar]
  33. Zhu, Q.; Wu, K.; Zhang, S.; Cheng, S.; Wang, T.; Liu, Q.; Li, J.; Chen, Z. Microscopic mechanism of enhancing natural gas recovery by CO2 injection in tight sandstone gas reservoirs. Nat. Gas Ind. 2024, 44, 135–145. [Google Scholar]
  34. Xiong, B.; Chen, J.; Li, K.; Zhang, C.; Jin, X. Progress in CO2 capture and utilization technologies from industrial emission gases. Low-Carbon Chem. Chem. Eng. 2023, 48, 9–18. [Google Scholar]
  35. Li, Z.; Elsworth, D. Controls of CO2–N2 gas flood ratios on enhanced shale gas recovery and ultimate CO2 sequestration. J. Pet. Sci. Eng. 2019, 179, 1037–1045. [Google Scholar] [CrossRef] [Scilit]
  36. Du, X.; Gu, M.; Liu, Z.; Zhao, Y.; Sun, F.; Wu, T. Enhanced shale gas recovery by the injections of CO2, N2, and CO2/N2 mixture gases. Energy Fuels 2019, 33, 5091–5101. [Google Scholar] [CrossRef] [Scilit]
  37. Jia, J.; Wang, D.; Li, B.; Wu, Y.; Zhao, D. Molecular simulation study on the effect of coal metamorphism on the competitive adsorption of CO2/CH4 in binary system. Fuel 2023, 335, 127046. [Google Scholar] [CrossRef] [Scilit]
  38. Bai, G.; Zhang, H.; Zhang, X.; Fan, C.; Wang, J.; Wei, J.; Zhang, Y. Simulation study of competitive adsorption of CH4/CO2 and CH4/N2 in anthracite coal. Energy Rep. 2024, 12, 6082–6092. [Google Scholar] [CrossRef] [Scilit]
Figure 1. Sandstone Core Sample.
Processes 14 00868 g001
Figure 2. Schematic of the long-core test apparatus.
Processes 14 00868 g002
Figure 3. Comparison of Gas Recovery Rates under Different Gas Injection Timings.
Processes 14 00868 g003
Figure 4. Comparison of Gas Density and Viscosity. The two viscosity curves of CO2 and N2 intersect at 11 MPa, which is caused by the difference in critical properties between the two gases; the viscosity of CO2 in the near-supercritical region increases with pressure at a much higher rate than that of N2 in the region far from the critical point, and finally, their viscosity values become equal at 11 MPa.
Processes 14 00868 g004
Figure 5. Changes in Average CH4 Production Rate and Pressure Difference under Different Gas Injection Timings. (a) Under CO2 injection, (b) under N2 injection.
Processes 14 00868 g005
Figure 6. Phase Diagram. (a) CO2 Phase Diagram, (b) Hydrocarbon Phase Diagram [31].
Processes 14 00868 g006
Figure 7. Compositional Changes in CO2 and N2 under Different Gas Injection Timings.
Processes 14 00868 g007
Figure 8. Key Injection Volumes of CO2 and N2 under Different Injection Timings. (a) Under CO2 injection, (b) under N2 injection.
Processes 14 00868 g008
Figure 9. Comparison of Enhanced Recovery Rates under Different Gas Injection Rates. (a) Under N2 injection, (b) under CO2 injection.
Processes 14 00868 g009
Figure 10. Variation in Average CH4 Production Rate and Pressure Difference under Different Gas Injection Rates. (a) Under CO2 injection, (b) Under N2 injection.
Processes 14 00868 g010
Figure 11. Compositional Changes in CO2 and N2 under Different Gas Injection Rates. (a) Under CO2 injection, (b) Under N2 injection.
Processes 14 00868 g011
Figure 12. Breakthrough Times of CO2 and N2 under Different Gas Injection Rates. (a) Under CO2 injection, (b) Under N2 injection.
Processes 14 00868 g012
Figure 13. Comparison of Enhanced Recovery Rates with Different Injection Gas Compositions.
Processes 14 00868 g013
Figure 14. Variation in CH4 adsorption amount with pressure for mixed gas systems under different molar ratios. (a) CH4/CO2 mixtures; (b) CH4/N2 mixtures [37,38].
Processes 14 00868 g014
Figure 15. Changes in Average CH4 Production Rate and Pressure Difference with Different Injection Gas Compositions.
Processes 14 00868 g015
Figure 16. Variation in CH4 Content with Different Gas Injection Compositions. The red dashed line denotes the 95% threshold, which is defined in this study as the onset of breakthrough.
Processes 14 00868 g016
Figure 17. Breakthrough Times of CO2 and N2 under Different Gas Injection Compositions. Three stages are defined in this study: Initial breakthrough, 1:1 ratio of CH4 to injected gas, and complete breakthrough.
Processes 14 00868 g017
Table 1. Properties of the Sandstone Core.
Core SortingLength/mmDiameter/mmDry Weight/gPermeability/mDPorosity/%Core Pore Volume/(cm3)
144.0324.9251.030.3779.21.976
243.7724.9251.660.2138.051.719
342.5124.9950.880.417.061.472
445.4524.9253.770.2088.691.926
543.2925.0051.970.4596.41.359
645.3124.9553.300.1998.361.851
749.9424.8957.850.488.832.146
843.8924.9250.940.4449.331.997
Table 2. Experimental Design.
No.Influencing FactorsGas Injection Timing/MPaGas Injection Rate/mL/minGas Injection Components
CO2N2
1Gas Injection Timing50.1100%0%
270.1100%0%
390.1100%0%
4110.1100%0%
550.10%100%
670.10%100%
790.10%100%
8110.10%100%
9Gas Injection Rate70.02100%0%
1070.05100%0%
1170.2100%0%
1270.020%100%
1370.050%100%
1470.20%100%
15Gas Injection Components70.166.56%33.44%
1670.149.98%50.02%
1770.133.33%33.67%
Disclaimer/Publisher’s Note: The statements, opinions and data contained in all publications are solely those of the individual author(s) and contributor(s) and not of MDPI and/or the editor(s). MDPI and/or the editor(s) disclaim responsibility for any injury to people or property resulting from any ideas, methods, instructions or products referred to in the content.