1. Introduction
Ethylene, hailed as the “mother of the petrochemical industry,” has its production capacity serving as a key indicator of a nation’s petrochemical development level. Among the various production routes for ethylene, the tubular furnace steam cracking process remains overwhelmingly dominant. Its core equipment—the ethylene cracking furnace—is consequently the focal point of energy consumption and a technological bottleneck within the entire production unit. The cracking furnace tubes, which directly facilitate the high-temperature cracking reactions of hydrocarbon feedstocks, operate under severe conditions with temperatures ranging from 800 °C to 1200 °C for extended periods [
1,
2]. During this process, the feed inevitably undergoes complex secondary reactions, leading to the formation and deposition of coke on the inner walls of the tubes—a phenomenon known as “coking” [
3,
4]. The resulting coke layer acts as an added insulating barrier between the inner and outer tube walls, significantly impeding heat transfer. This necessitates a marked increase in the Tube Metal Temperature (TMT) to maintain the required cracking depth [
5,
6]. Such elevated temperatures not only drastically increase fuel consumption but also accelerate carburization aging and creep damage in the tubes, shortening their service life. More critically, uneven coking can cause localized overheating. Furthermore, the spalling of the coke layer can directly block the tubes, leading to a sharp increase in pressure drop [
7,
8]. In severe cases, this can trigger catastrophic incidents such as tube ruptures, forcing unplanned shutdowns of the entire production line and resulting in substantial economic losses and safety risks.
Therefore, conducting real-time, precise, and reliable monitoring of the operational status of cracking furnace tubes, and subsequently implementing intelligent diagnosis and early warning for thermal anomalies and coking-related degradation, has become a core challenge in ensuring the “safe, stable, long-term, full-capacity, and optimal” operation of ethylene plants [
9,
10]. Traditional monitoring methods, such as periodic manual inspections using handheld infrared thermometers, suffer from high labor intensity, scattered data, strong subjectivity, and significant safety hazards. In recent years, with the cross-integration and rapid advancement of sensing technologies, the Internet of Things (IoT), big data, and artificial intelligence (AI), the monitoring and diagnostic technologies for cracking furnace tubes are undergoing a profound intelligent transformation [
4,
11].
To this end, this paper conducts a systematic review that seeks to address two pivotal questions: what is the current state of intelligent monitoring and early-warning diagnosis technologies for ethylene cracking furnace tubes, and what are their limitations and future development directions? Centered on tube degradation mechanisms, our analysis critically surveys the spectrum of monitoring methods—from traditional to emerging—and the evolution of diagnostic modeling paradigms, from mechanistic to data-driven and hybrid approaches. We provide an in-depth commentary across the dimensions of sensing, diagnosis, and system integration, followed by a dialectical examination of prevailing challenges and a forward-looking discussion on emerging trends.
By offering a holistic and structured analysis across the entire technology chain, this review distinguishes itself from existing works that often concentrate on an isolated damage mode (e.g., carburization) [
12], a single technology (e.g., infrared thermography) [
13], or a specific platform implementation [
14,
15]. Moving beyond this distinction, the core contribution and unique perspective of this review lie in its integrated “panoramic technology stack” lens and the “quantitative-critical-roadmap” tripartite framework. It not only fills a recognized gap for a comprehensive reference that synthesizes the technological landscape of intelligent monitoring and diagnosis for ethylene cracking furnace tubes, but also provides: (1) a quantitative Technology Readiness Level (TRL) assessment of key monitoring methods under the explicit constraint of ~1000 °C service temperature, offering a pragmatic benchmark for technology selection; (2) a critical synthesis that reveals the intrinsic complementarity and limitations of disparate sensing-diagnosis approaches; and (3) a forward-looking, phased integration roadmap (e.g., near-term fusion of dominant infrared with offline data, toward future digital-twin-driven synthesis) guiding the evolution from standalone solutions to intelligent systemic diagnostics. Thus, this work will not only chart the current technological frontier but also provide a valuable and strategic framework to guide future research and innovation, ultimately contributing to safer, more efficient, and more intelligent operation of ethylene cracking furnaces.
2. Methodology of Literature Review
2.1. Search Strategy
A comprehensive search was performed across major academic databases, including Web of Science, Engineering Village (EI), Scopus, and China National Knowledge Infrastructure (CNKI). The search utilized a combination of keywords related to the target equipment (“ethylene cracking furnace tube,” “pyrolysis furnace tube”), functions (“health monitoring,” “condition monitoring,” “coking diagnosis,” “early warning”), and specific technologies (“infrared thermography,” “acoustic emission,” “fiber Bragg grating,” “digital twin”). The publication timeframe was primarily focused on the last two decades (2004–2024) to capture modern technological evolution.
2.2. Screening and Inclusion Criteria
The retrieved literature was screened based on titles and abstracts. Studies were included if they presented original research, reviews, or significant case studies directly pertaining to the monitoring, diagnosis, or predictive maintenance of ethylene cracking furnace tubes. Publications that discussed non-destructive testing techniques in generic contexts without application to cracking furnaces were excluded.
3. State Monitoring Technology for Furnace Tubes: Multi-Source Sensing and Comparative Analysis of Pros and Cons
Accurate perception of furnace tube status is the prerequisite for effective diagnosis and early warning. Based on the measurement principles and contact methods, existing monitoring technologies can be broadly categorized into non-contact and contact types. Each has its own strengths and weaknesses, and together they constitute a multi-dimensional information sensing network for assessing furnace tube health.
3.1. Non-Contact Monitoring Technologies
Non-contact technologies are widely used in furnace tube temperature field monitoring due to their advantages of not interfering with the measured object and having fast response times.
- (1)
Infrared Temperature Measurement Technology
This technology is based on Planck’s blackbody radiation law, deducing the temperature of an object by measuring the intensity of infrared radiation emitted from its surface. Wu Haibin et al. [
16] conducted in-depth research on infrared imaging technology based on colorimetric temperature measurement theory. By selecting two adjacent wavelength bands and calculating the ratio of their radiant energy, they effectively compensated for the effects of variations in the object’s surface emissivity, significantly improving the accuracy of furnace tube surface temperature measurements in complex furnace environments.
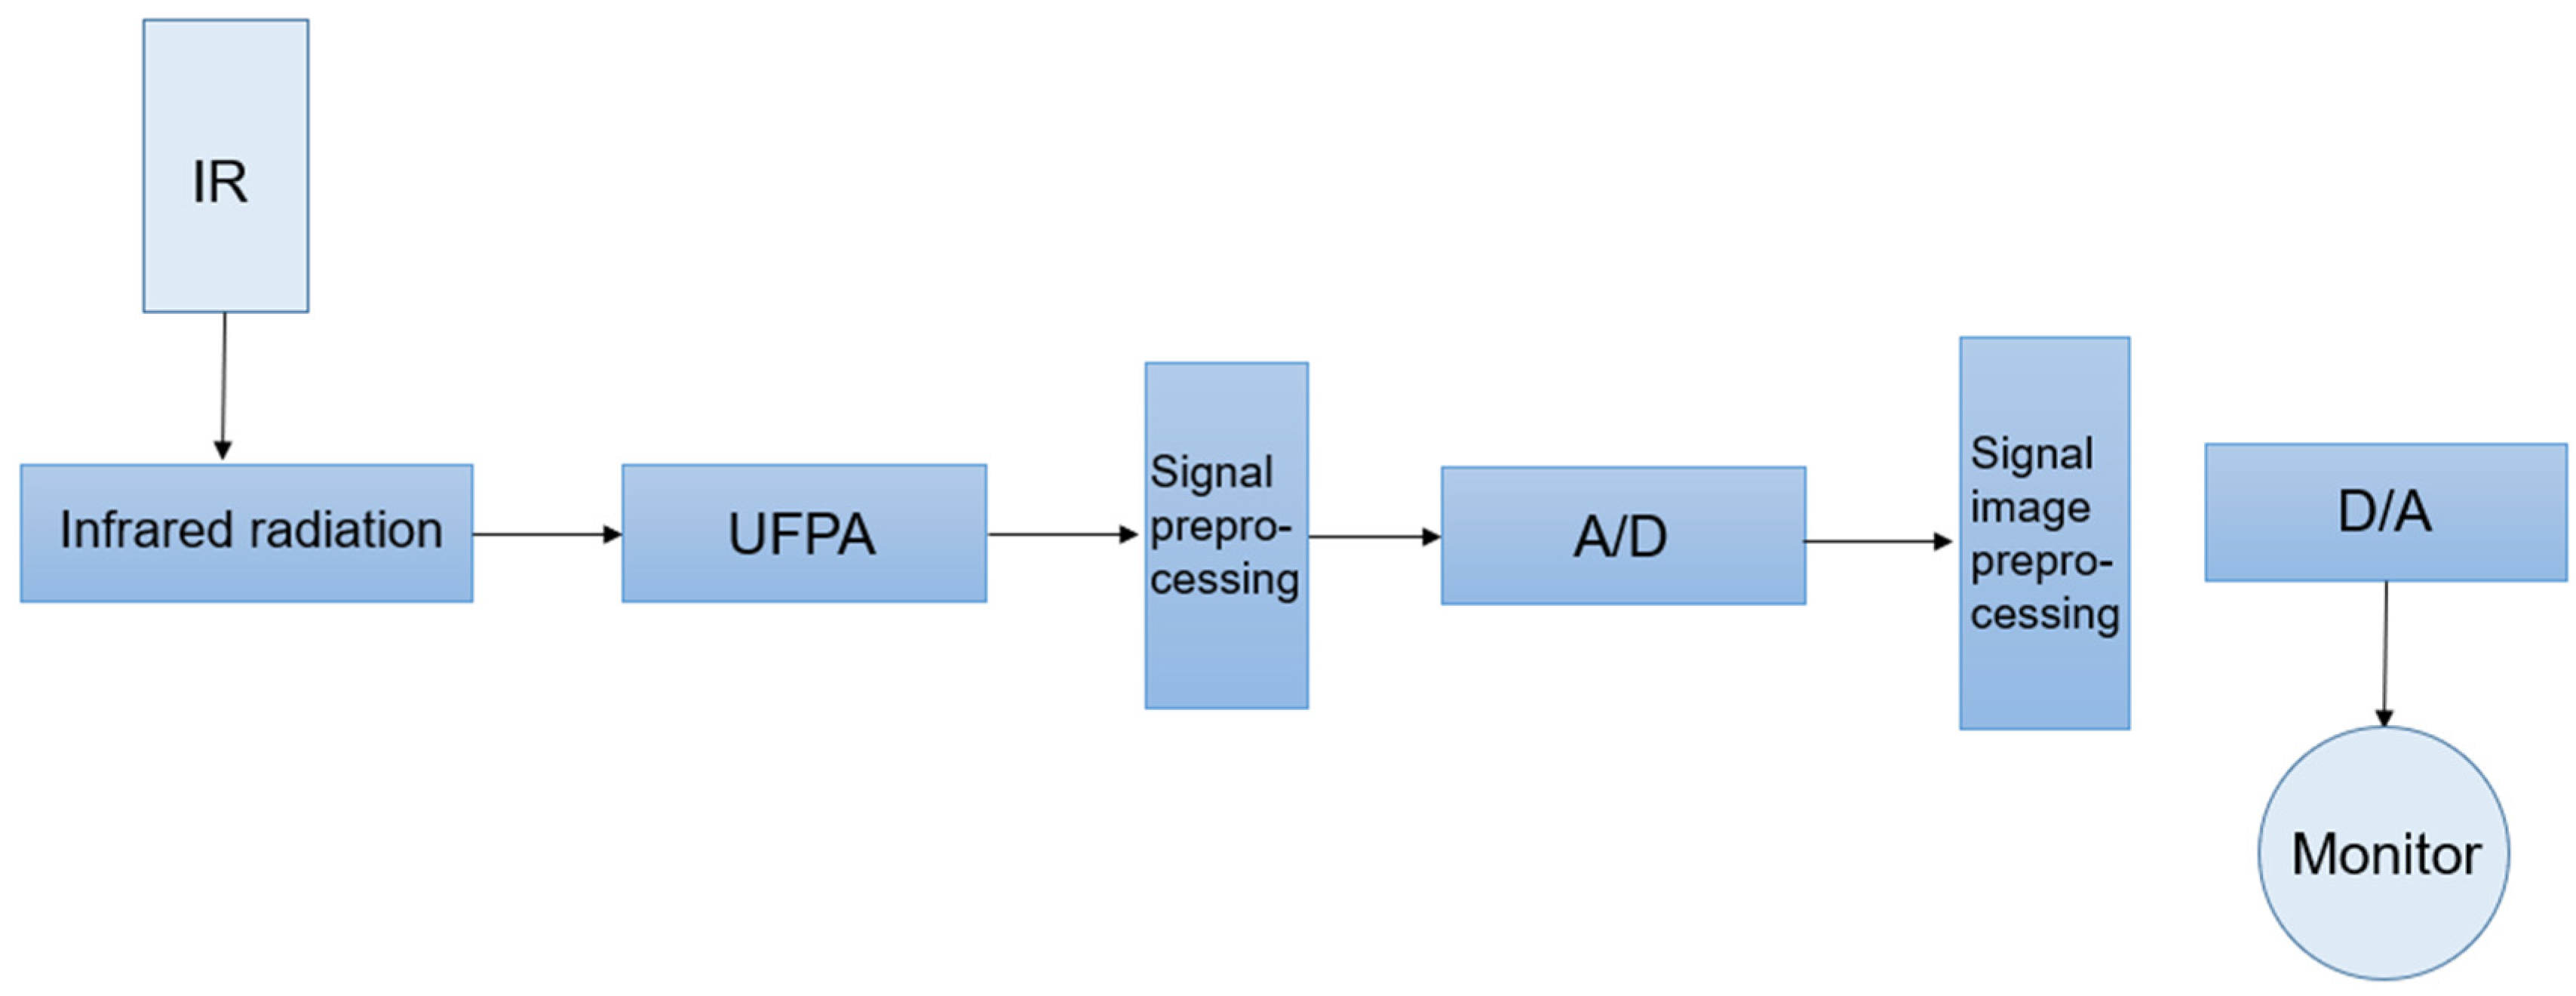
As shown in
Figure 1, a practical infrared imaging system for furnace tube monitoring, as implemented in petrochemical plants, typically comprises an optical path system, an uncooled infrared focal plane array (or CCD), a signal processing system, and a video display unit.
Figure 1 schematically illustrates the core working principle and data flow of such a system: the high-temperature probe captures radiation from the furnace interior; the optical system focuses it onto the detector; the generated charge signal is amplified, digitized via a high-speed image acquisition card, and finally processed by a computer to convert the radiation data into a temperature field image. This conversion from raw radiation to accurate temperature critically depends on correcting for several key process parameters. The most significant is the target’s surface emissivity, which defines the fundamental relationship between its true temperature and radiated power, and typically ranges from 0.6 to 0.9 for aged furnace tubes [
16]. Additionally, the attenuation of radiation by the furnace atmosphere (flue gas, dust) must be accounted for, where the transmittance can often fall below 0.8 in harsh conditions. The detector’s operational wavelength band (e.g., 3~5 µm or 8~14 µm for most high-temperature applications) [
17] must also be suited to both the thermal radiation peak and the transmission windows of the medium. Therefore, this system can obtain calibrated temperature distribution images of the entire radiant surface, thereby achieving global monitoring. However, the accuracy of this technology is significantly affected by the absorption and scattering of radiation by media such as furnace flue gas, dust, and water vapor. Additionally, high-precision infrared thermal imagers are expensive to procure and maintain.
- (2)
Acoustic Emission (AE) Monitoring Technology
Acoustic Emission (AE) technology is a dynamic non-destructive testing method. It diagnoses internal damage in materials by capturing the transient elastic waves released when the material undergoes plastic deformation, crack propagation, or coke layer spallation under stress or temperature changes. This technology is highly sensitive to active defects (such as developing cracks), enabling early warning and source location [
18,
19].
Shi Dongwang et al. [
20] proposed and developed a three-dimensional acoustic emission detection scheme based on a hierarchical sensor network. This system employs a three-layer, multi-point sensor array for monitoring liquefied natural gas (LNG) storage tanks. Through signal processing techniques combining wavelet packet denoising and dynamic threshold filtering, it suppresses background noise and accurately extracts leakage characteristic signals. A neural network is utilized to establish a mapping model between AE features and leakage states, significantly improving the accuracy and anti-interference capability of leakage identification. The system outputs the leakage probability and spatial coordinates in real time, enabling the visualization, graded warning, and closed-loop management of the LNG storage tank’s safety status.
However, the AE signals are inherently weak and extremely susceptible to being overwhelmed by complex on-site mechanical and fluid noise. This imposes stringent requirements on the placement and quantity of sensors. Furthermore, signal interpretation is highly dependent on expert experience, making it difficult to achieve quantitative and precise diagnostics. For the monitoring of ethylene cracking furnace tubes in high-temperature environments, the practical difficulty of deploying AE sensors inside the furnace itself remains a significant challenge.
3.2. Contact/Embedded Monitoring Technologies
Contact-based technologies typically provide more direct and precise localized information but face challenges related to installation difficulty and high-temperature durability.
- (1)
Fiber Bragg Grating (FBG) Sensors
Fiber Bragg Grating (FBG) sensors operate by detecting the shift in the central wavelength of the grating caused by changes in temperature or strain [
21]. They possess unique advantages such as intrinsic explosion-proof capability, immunity to electromagnetic interference, corrosion resistance, and ease of achieving quasi-distributed measurements. These characteristics make them highly suitable for harsh environments like cracking furnaces, which feature strong electromagnetic fields and high temperatures [
22]. Researchers have attempted to embed them within the tube wall or attach them to the outer surface to obtain more accurate temperature and strain information. However, the core challenge lies in the long-term ultra-high-temperature environment, where the gratings may experience degradation, and protective coatings may fail [
23,
24], leading to performance degradation or even complete sensor failure. Furthermore, the installation process is complex, and the initial investment cost is high.
- (2)
Ultrasonic Thickness Measurement Technology
Ultrasonic thickness measurement calculates material thickness by measuring the echo time of ultrasonic waves propagating through it. It is a traditional and effective method for monitoring wall thinning of furnace tubes caused by high-temperature oxidation and carburization. This technology offers high measurement accuracy and provides an intuitive reflection of corrosion conditions on the tube wall [
25]. However, its disadvantages are equally evident: it generally requires execution during shutdowns for maintenance, making continuous online monitoring difficult; measurement results are significantly affected by the surface condition of the tube wall (such as roughness and temperature); and conducting a comprehensive inspection of densely arranged structures like cracking furnace tubes is time-consuming and labor-intensive [
26].
Table 1 summarizes the advantages and disadvantages of the four furnace tube monitoring technologies discussed above, including their cost-effectiveness profiles. This integrated comparison underscores that technology selection must balance technical performance with economic viability, where the highest accuracy does not always translate to the best value for a given application.
3.3. Technology Readiness Assessment and Comprehensive Comparison
To move beyond qualitative comparisons of merits and flaws, this section introduces two dimensions—Technology Readiness Level (TRL) and Industrial Applicability—to conduct a quantitative evaluation and critical synthesis of the monitoring technologies mentioned above. TRL (Levels 1–9) is used to measure the maturity of a technology, from the discovery of its principle to its industrialization. Industrial Applicability comprehensively assesses its reliability, maintenance costs, integration difficulty, and impact on production. Based on literature analysis and industrial practice research,
Table 2 presents an evaluation table for the four key technologies.
The comparative assessment above indicates that there is no single “all-in-one” monitoring technology. Current industrial applications primarily rely on high-TRL infrared thermometry for global monitoring, combined with offline ultrasonic “spot checks.” Emerging technologies such as acoustic emission and fiber optic sensing—with relatively lower TRL—represent a shift from “monitoring macro states” toward “sensing microscopic damage mechanisms.” The current landscape of “combining high and low TRL technologies in primary and auxiliary roles” fundamentally stems from the inherent differences in the physical principles on which these technologies rely and the dimensions of information they capture. Therefore, the future development of these technologies should not focus on simple replacement. Instead, efforts should shift toward effectively integrating these multi-dimensional and multi-scale sources of information [
22,
28], which aligns with the emerging paradigm of intelligent system integration [
30], with the aim of constructing a perception system that is more comprehensive and reliable than any single technology alone.
4. Intelligent Coking Diagnosis Models for Furnace Tubes: The Convergent Evolution from Mechanism to Data
Merely acquiring monitoring data is far from sufficient. The core of intelligent diagnosis lies in how to extract key information reflecting the coking status of furnace tubes from this data. The development of diagnostic models clearly reveals an evolutionary path from purely mechanism-driven approaches to data-driven ones, and ultimately to their integration.
4.1. Mechanism-Based Models
Early research primarily focused on establishing chemical reaction kinetic models and heat/mass transfer models for coking. For instance, Albright [
31] systematically proposed three major coking mechanisms: catalytic coking on external surfaces, homogeneous gas-phase coking, and radical coking, laying the theoretical foundation for building mechanistic models. Subsequent researchers built upon this, combining computational fluid dynamics (CFD) methods to construct complex two-dimensional or even three-dimensional models in an attempt to precisely simulate the entire process of fluid flow, heat transfer, and coke formation and deposition within furnace tubes [
32,
33]. These ‘white-box’ models have clear physical significance, possessing strong extrapolation capabilities and explanatory power for the underlying phenomena. However, their fatal weakness lies in the extreme complexity of the hydrocarbon cracking reaction system, which involves numerous radical reactions. Many key kinetic parameters, especially those related to high-temperature coking, are difficult to obtain accurately through experiments, leading to inherent uncertainty in model predictions [
34,
35]. Furthermore, high-fidelity CFD models coupled with detailed reaction mechanisms incur an enormous computational cost. A complete simulation often requires days or even weeks [
33], which completely fails to meet the minute-level or even second-level response requirements of industrial sites for online real-time diagnosis and early warning [
34]. This severely limits their application in practical operational guidance.
4.2. Data-Driven Intelligent Diagnostic Models
With the maturation of industrial big data and artificial intelligence (AI) technologies, data-driven “black-box” or “gray-box” models have become a research hotspot. These models do not delve deeply into complex internal physicochemical processes but instead learn the mapping relationship between inputs (such as TMT, pressure, flow rate) and outputs (coking degree) directly from historical data.
- (1)
Machine Learning and Deep Learning Models
Convolutional Neural Networks (CNNs) have proven to be powerful tools for image recognition and feature extraction in industrial monitoring. In the specific context of furnace tube monitoring [
36], Zhao et al. [
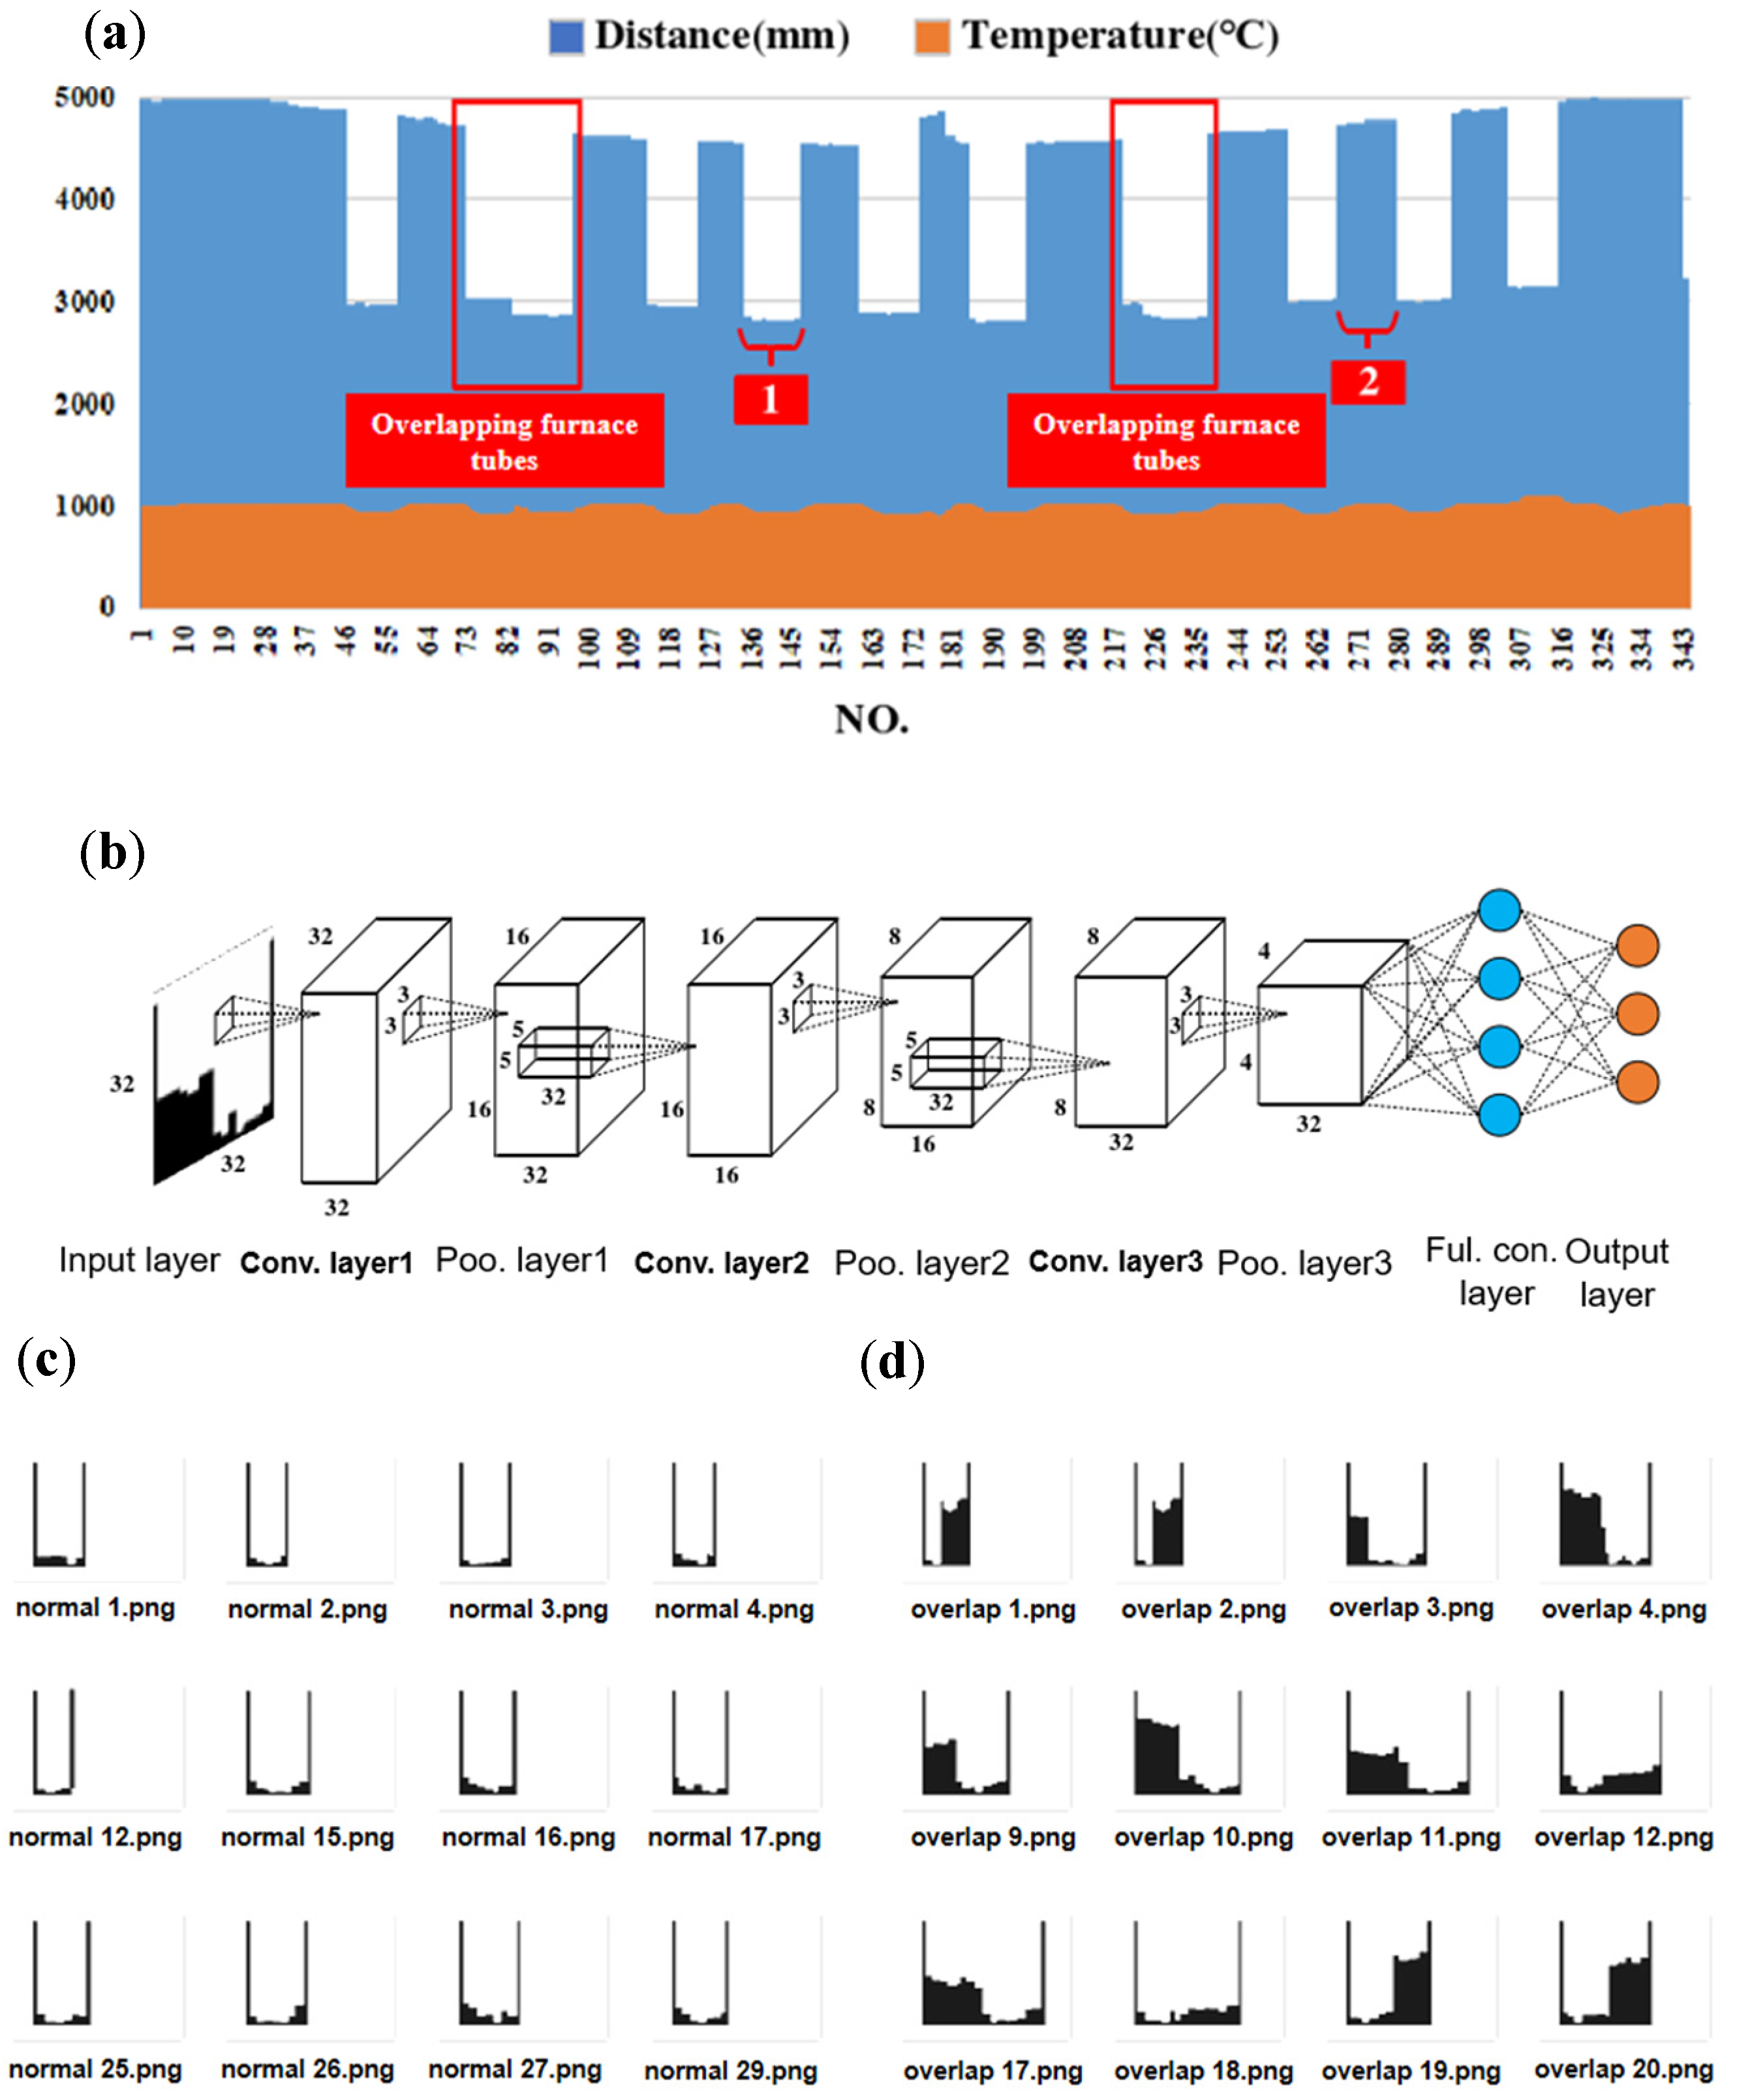
37] applied a CNN-based method to address the challenge of identifying overlapping tubes within the field of view of an infrared camera. As shown in
Figure 2, by converting one-dimensional distance and temperature data into two-dimensional feature maps and leveraging CNN’s powerful image feature extraction capabilities, this method achieves high-precision, automated discrimination between normal and overlapping furnace tubes. In the temperature calculation stage, the Density-Based Spatial Clustering of Applications with Noise (DBSCAN) algorithm is further employed, effectively eliminating noise data caused by measurement edge effects. Consequently, it achieves precise measurement of the furnace tube’s external surface temperature, providing a high-quality data foundation for subsequent diagnosis.
- (2)
Fuzzy Neural Networks and Intelligent Optimization Algorithms
To overcome the shortcomings of purely neural network models, such as strong “black-box” characteristics and poor interpretability, researchers have introduced fuzzy logic systems. Zuo Xiaolai [
10], in industrial practice, achieved online assessment of coking degree by monitoring the deviation (ΔT) between the furnace tube outlet temperature (COT) and the average COT of this group of furnace tubes. This method is simple and effective, but its threshold setting often relies on experience. To address this, Zhao Junfeng [
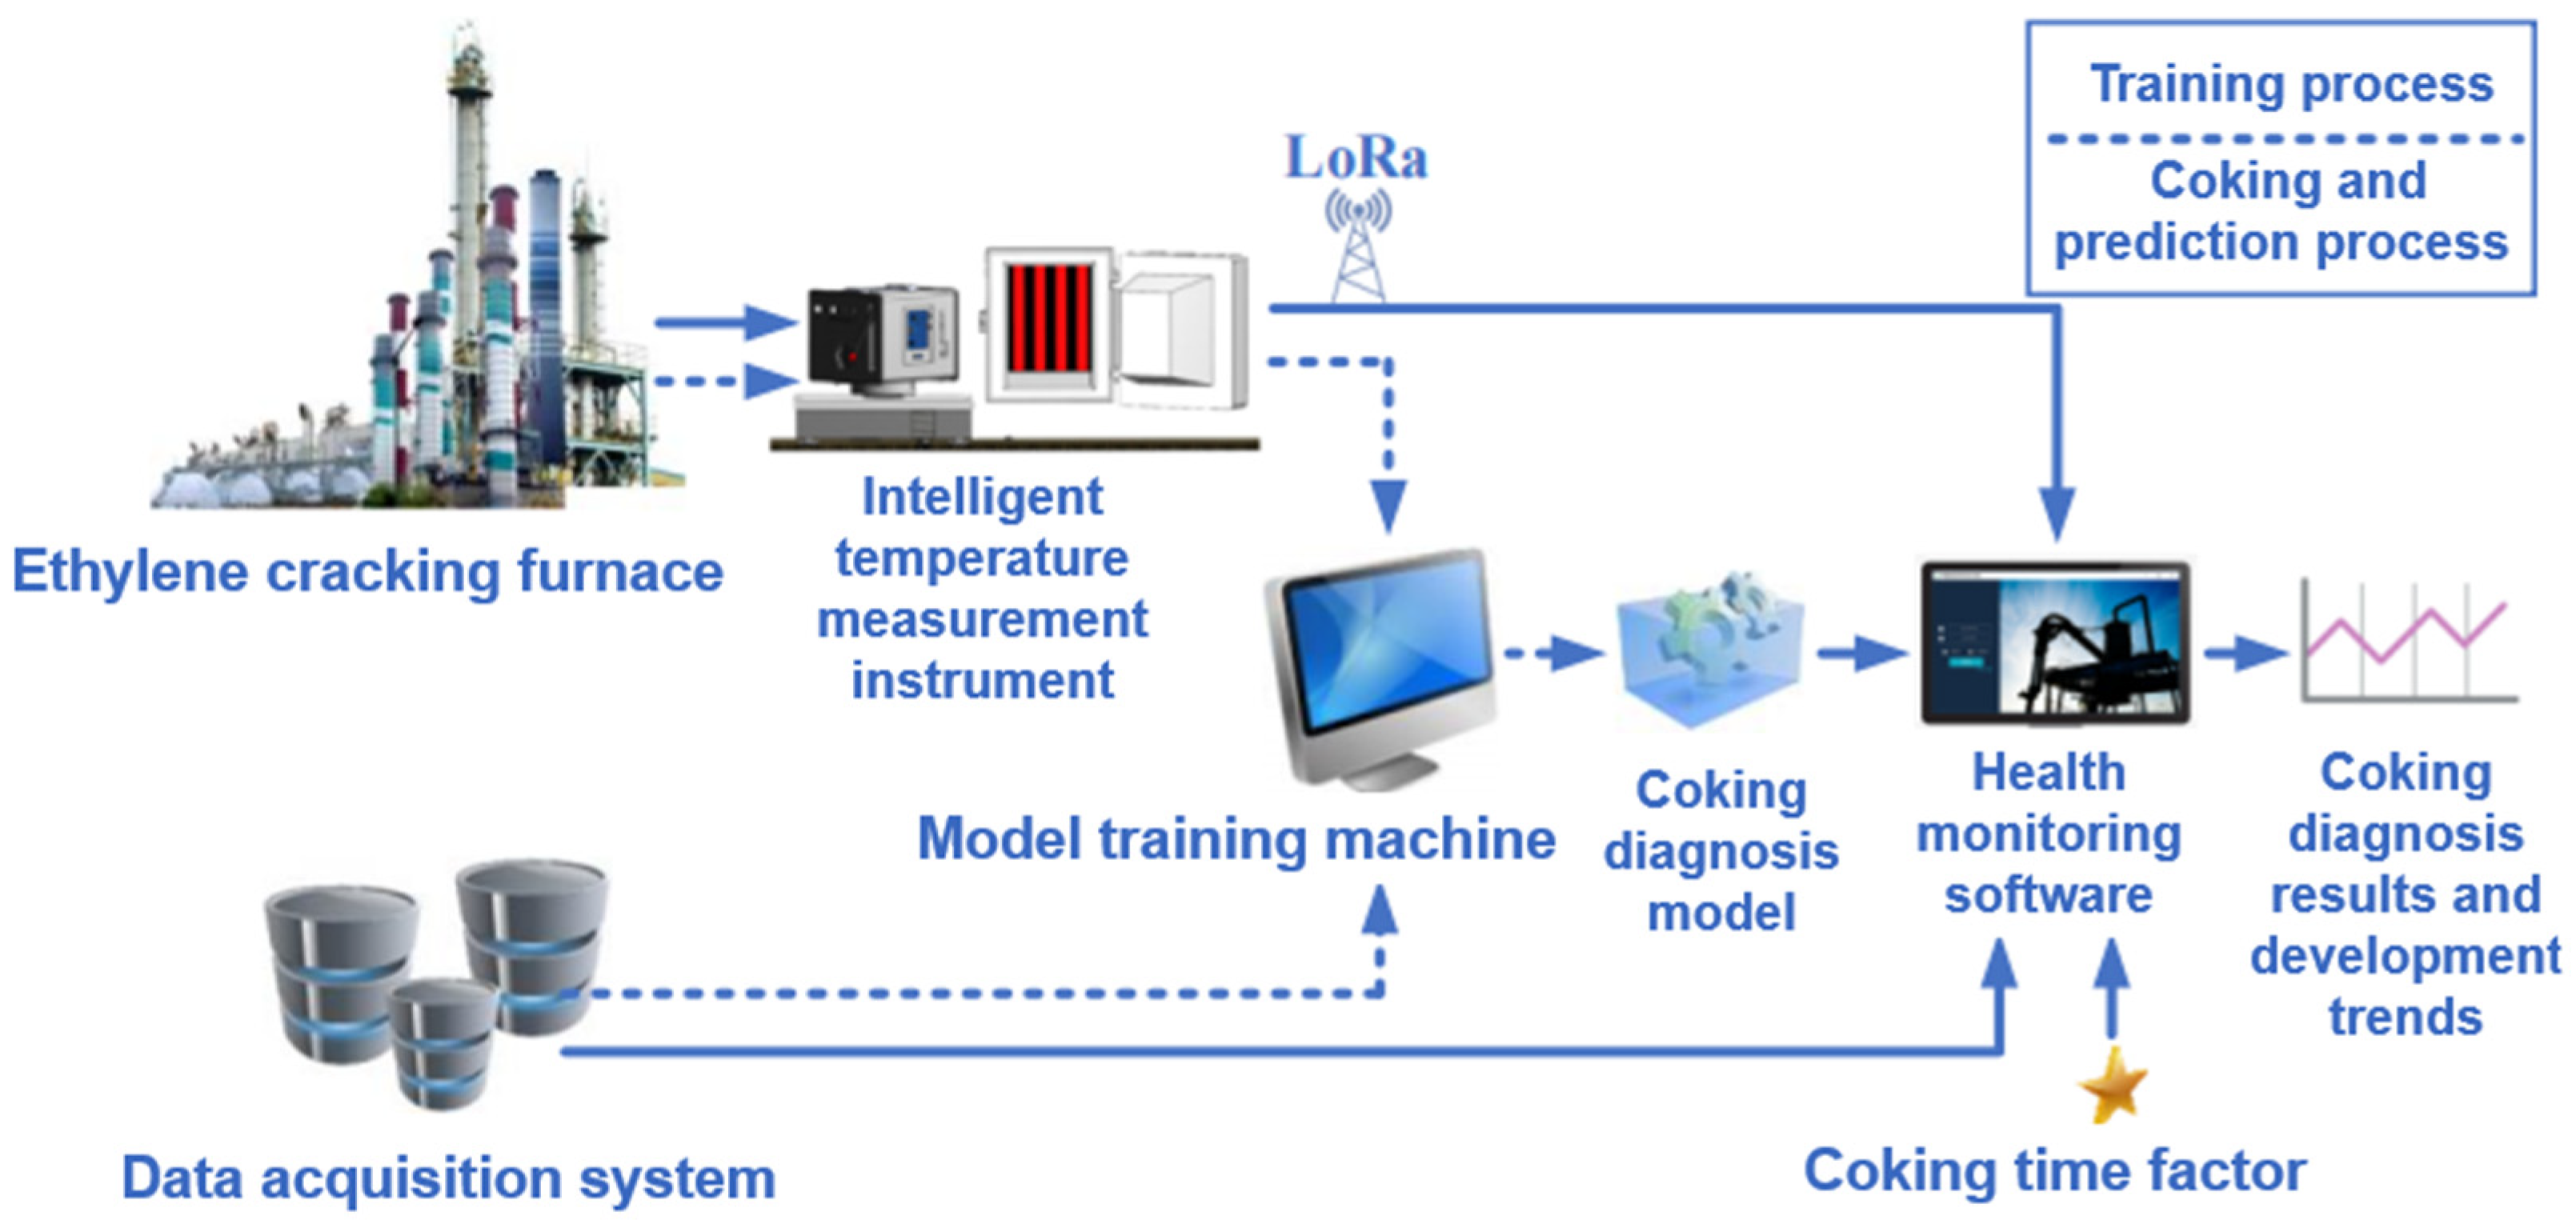
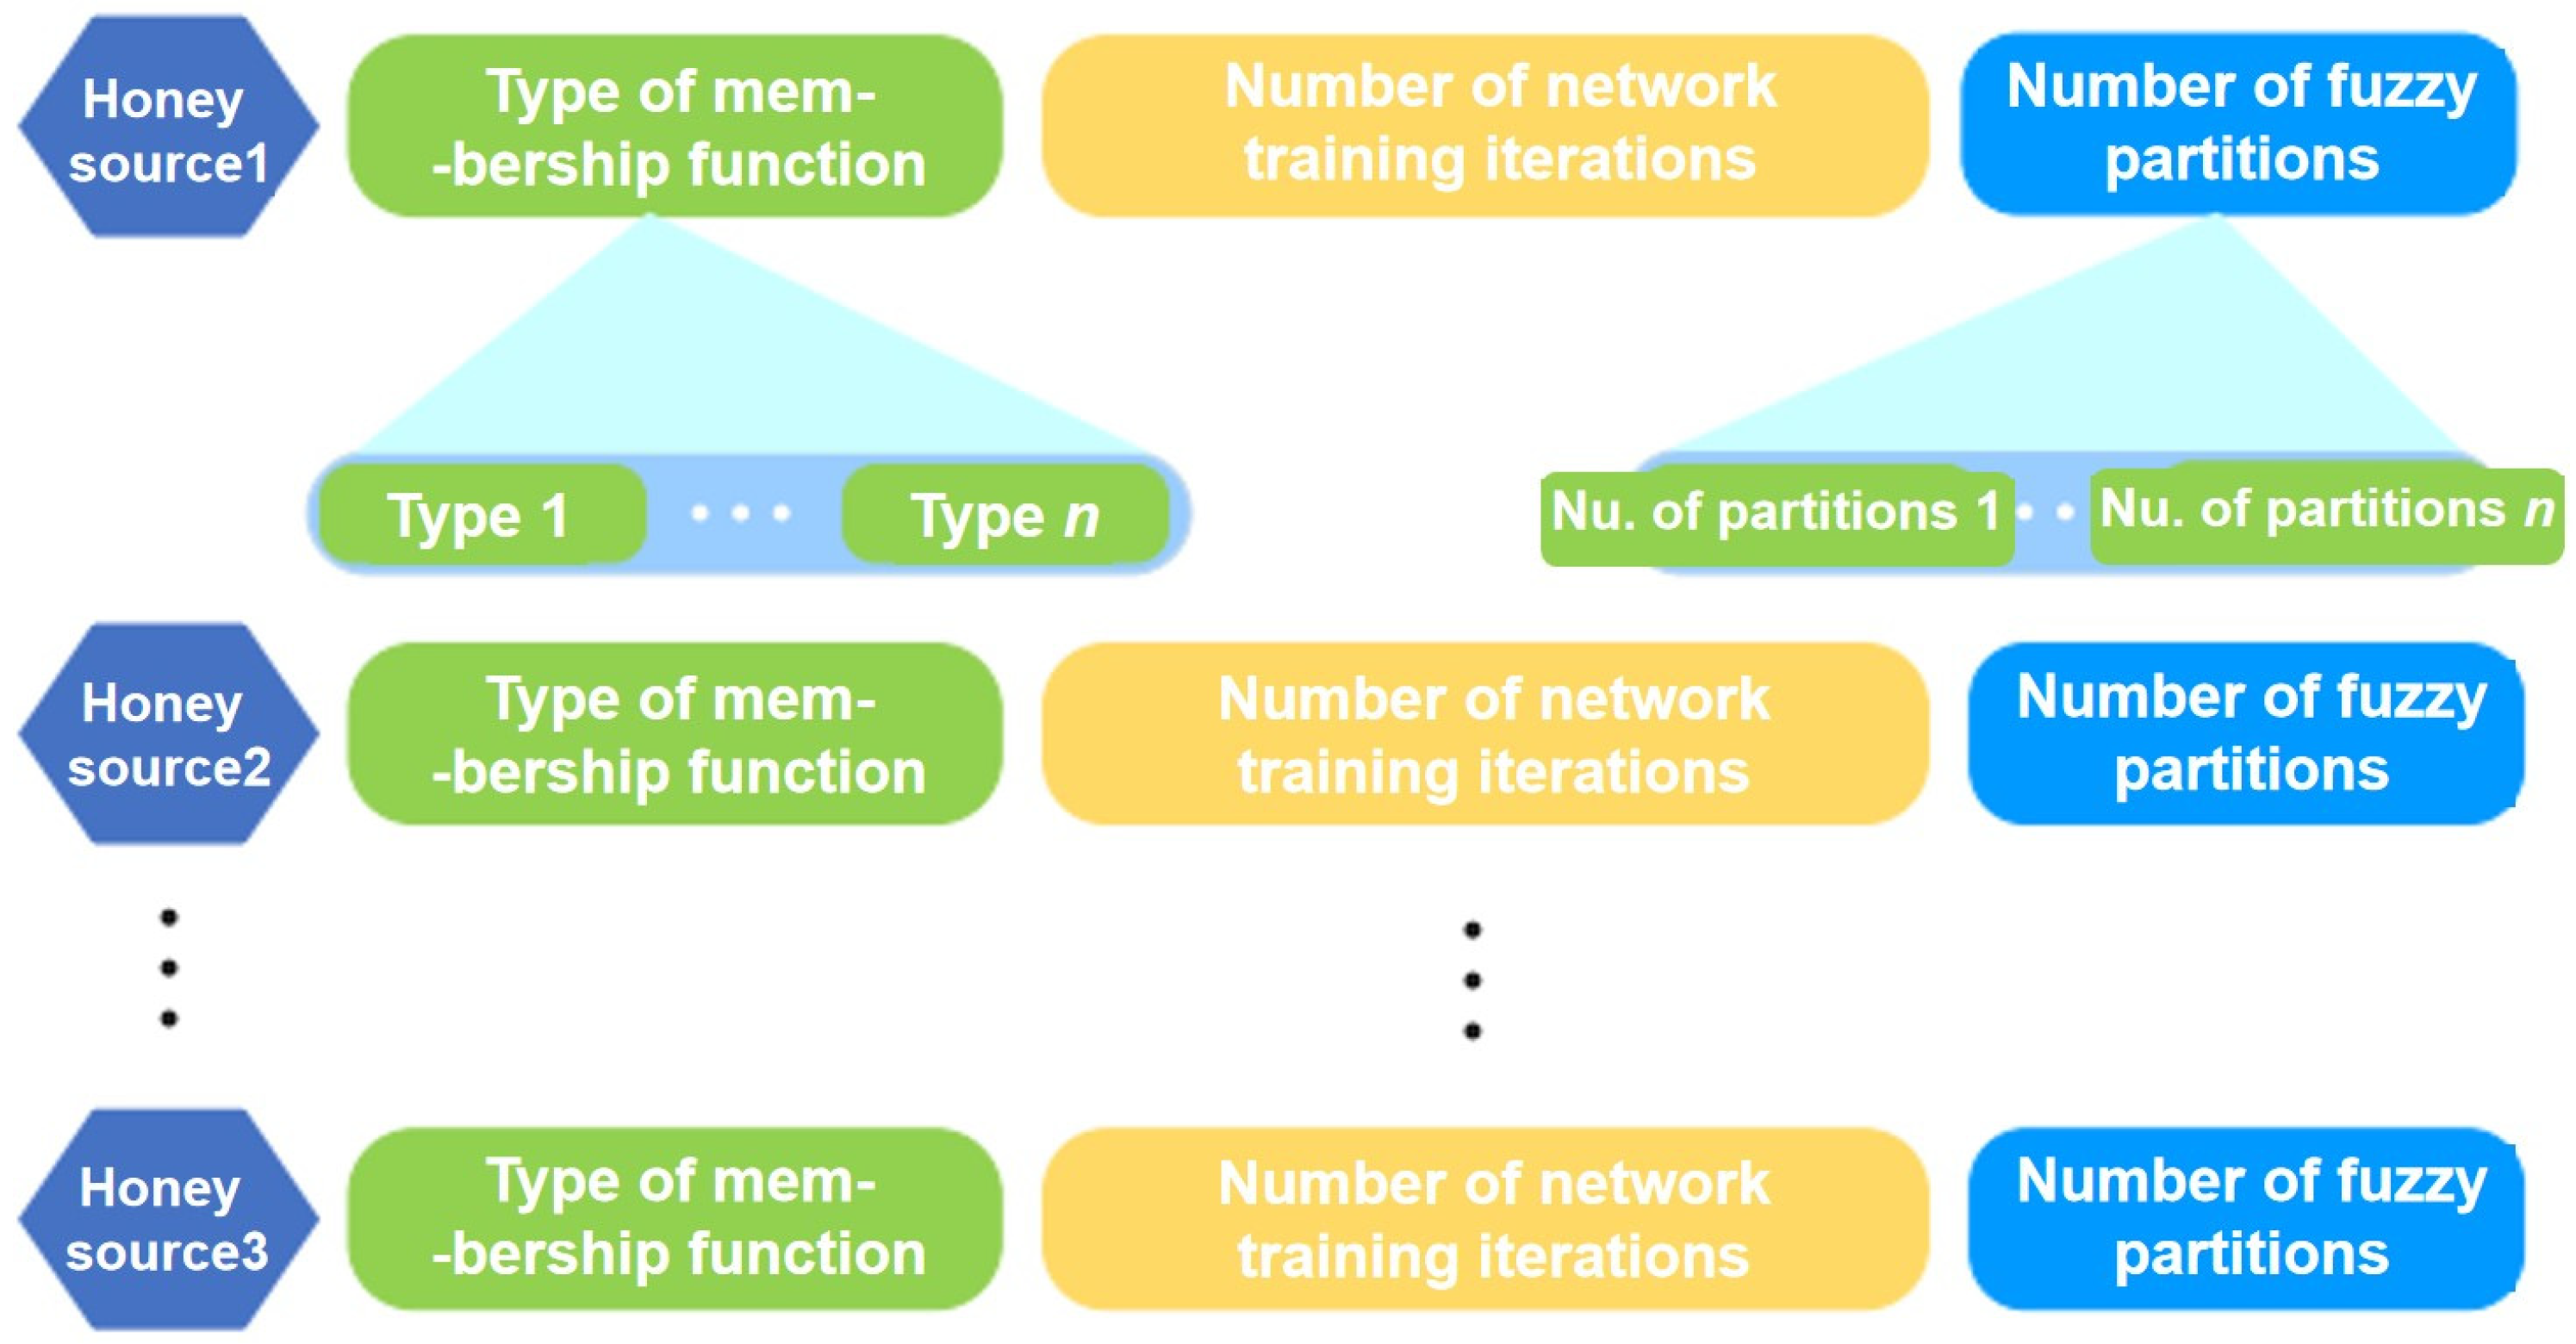
37] further proposed the ABC-ANFIS-CTF integrated diagnostic and prediction method. The core of this method is the Adaptive Neuro-Fuzzy Inference System (ANFIS), which can automatically generate fuzzy rules in the “IF-THEN” form from data, combining the easy-to-understand nature of fuzzy logic with the self-learning capability of neural networks. More critically, to address the difficulty in manually setting ANFIS structural parameters (such as membership function types and number of fuzzy partitions), the efficient swarm intelligence optimization algorithm Artificial Bee Colony (ABC) was introduced for automatic optimization. This significantly improved the model’s training efficiency and diagnostic accuracy. Furthermore, by introducing the Coking Time Factor (CTF) to model the time series trends of key parameters like TMT and absolute pressure ratio, the method achieved the function of predicting future coking levels in furnace tubes. This represents a leap from post-event diagnosis to pre-warning. The system framework is shown in
Figure 3.
- (3)
Hybrid Mechanism-Data Modeling
Moving beyond purely data-driven approaches, hybrid models that integrate mechanistic knowledge with deep learning present a promising frontier for enhancing physical interpretability. For instance, Lin Qizhao et al. [
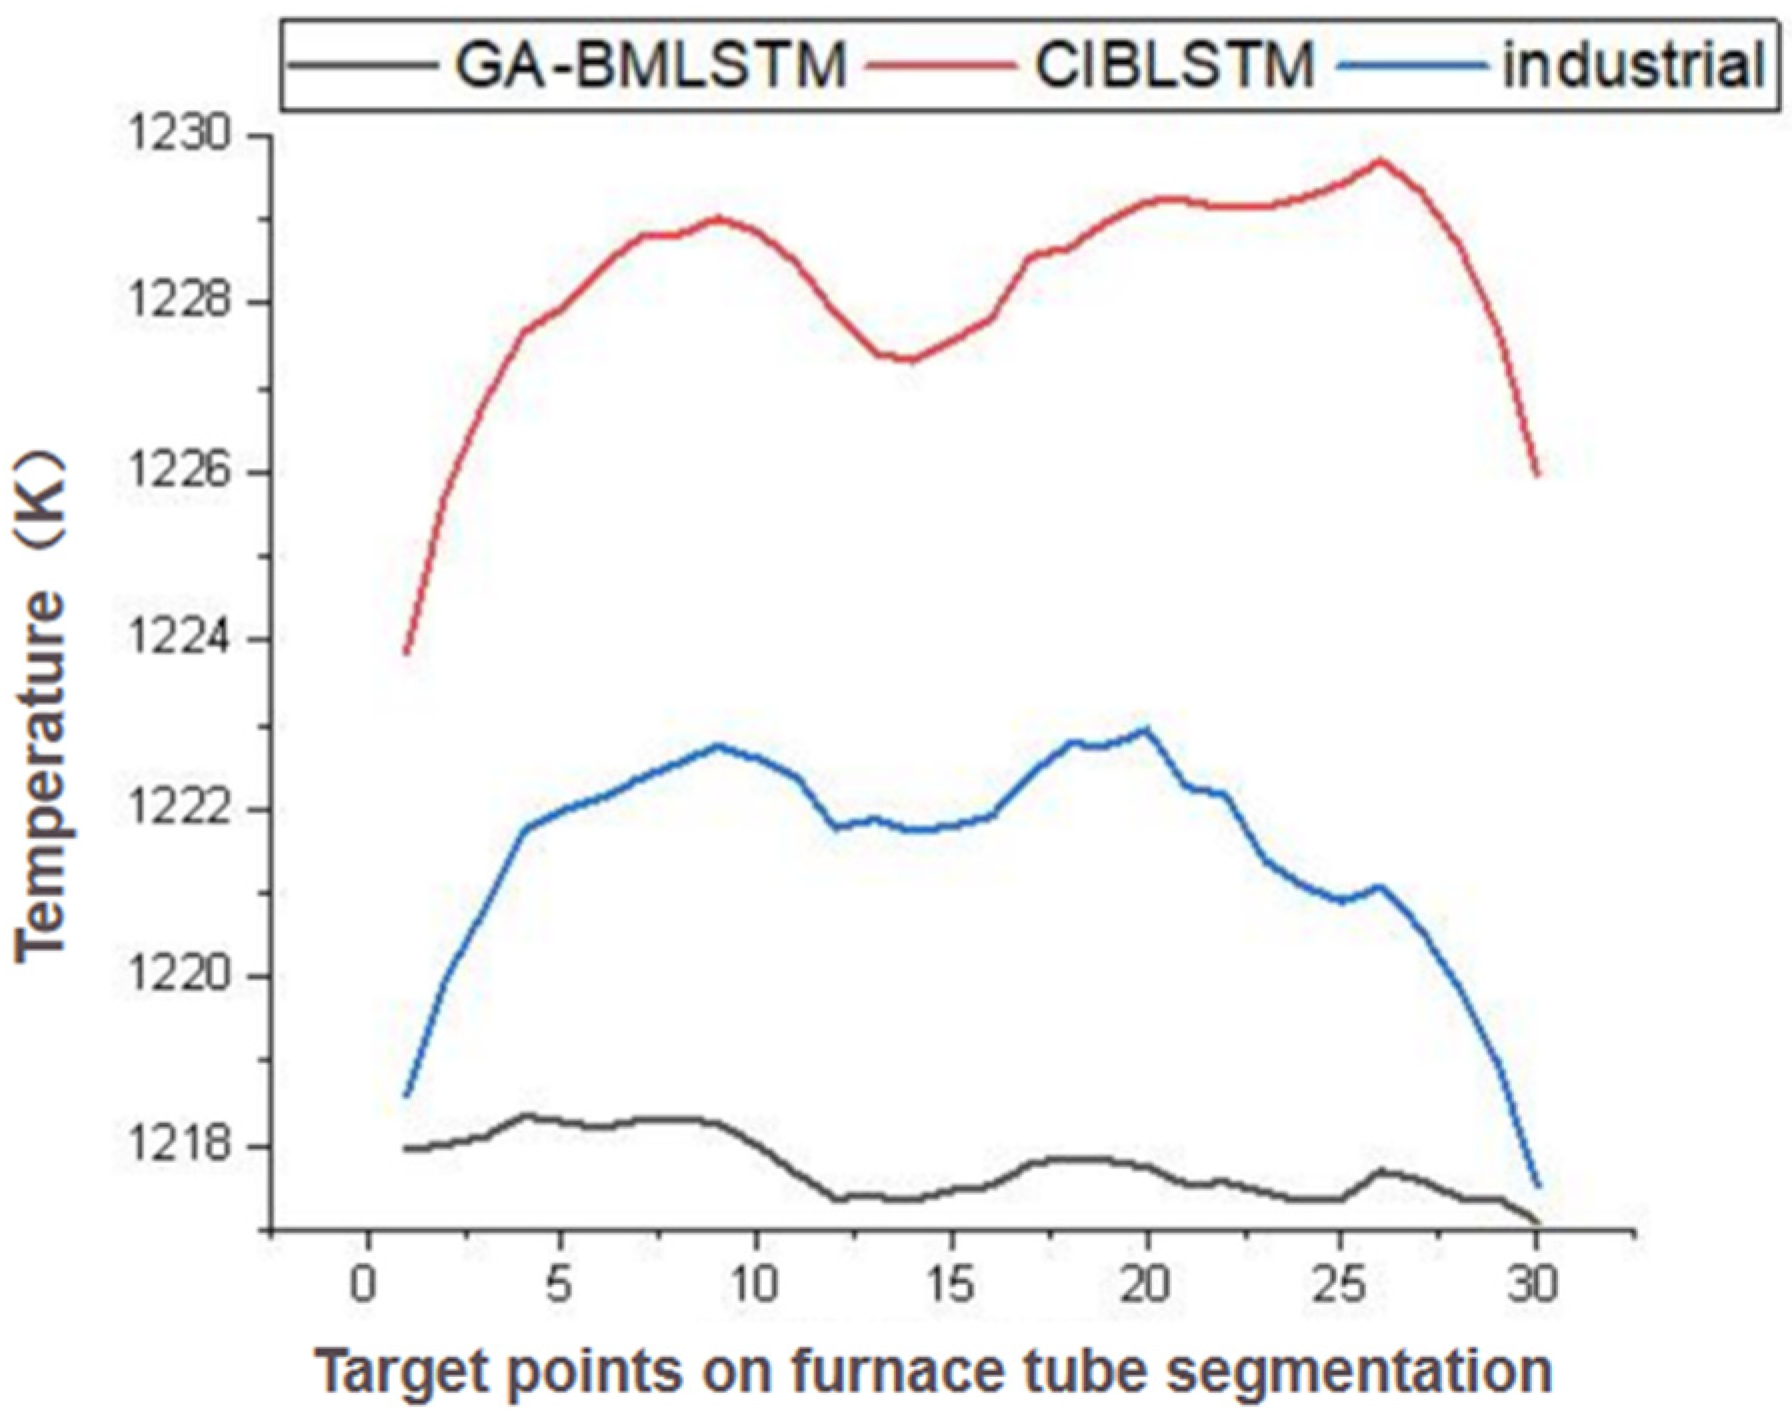
9] developed a furnace tube temperature field reconstruction method by fusing computational fluid dynamics (CFD) simulations with a Long Short-Term Memory (LSTM) network. Their model, termed GA-BMLSTM, employs an improved genetic algorithm for structure optimization and a bidirectional multi-step prediction strategy. As shown in
Figure 4, GA-BMLSTM demonstrated superior accuracy in predicting the sectional average temperature of furnace tubes compared to conventional models [
9]. This work provides a more reliable data foundation for online coking diagnosis and underscores the potential of hybrid modeling frameworks.
To further enhance model precision and generalization capability, researchers have focused on integrating multiple advanced techniques. For example, Cui Delong and Zhang Zimo et al. [
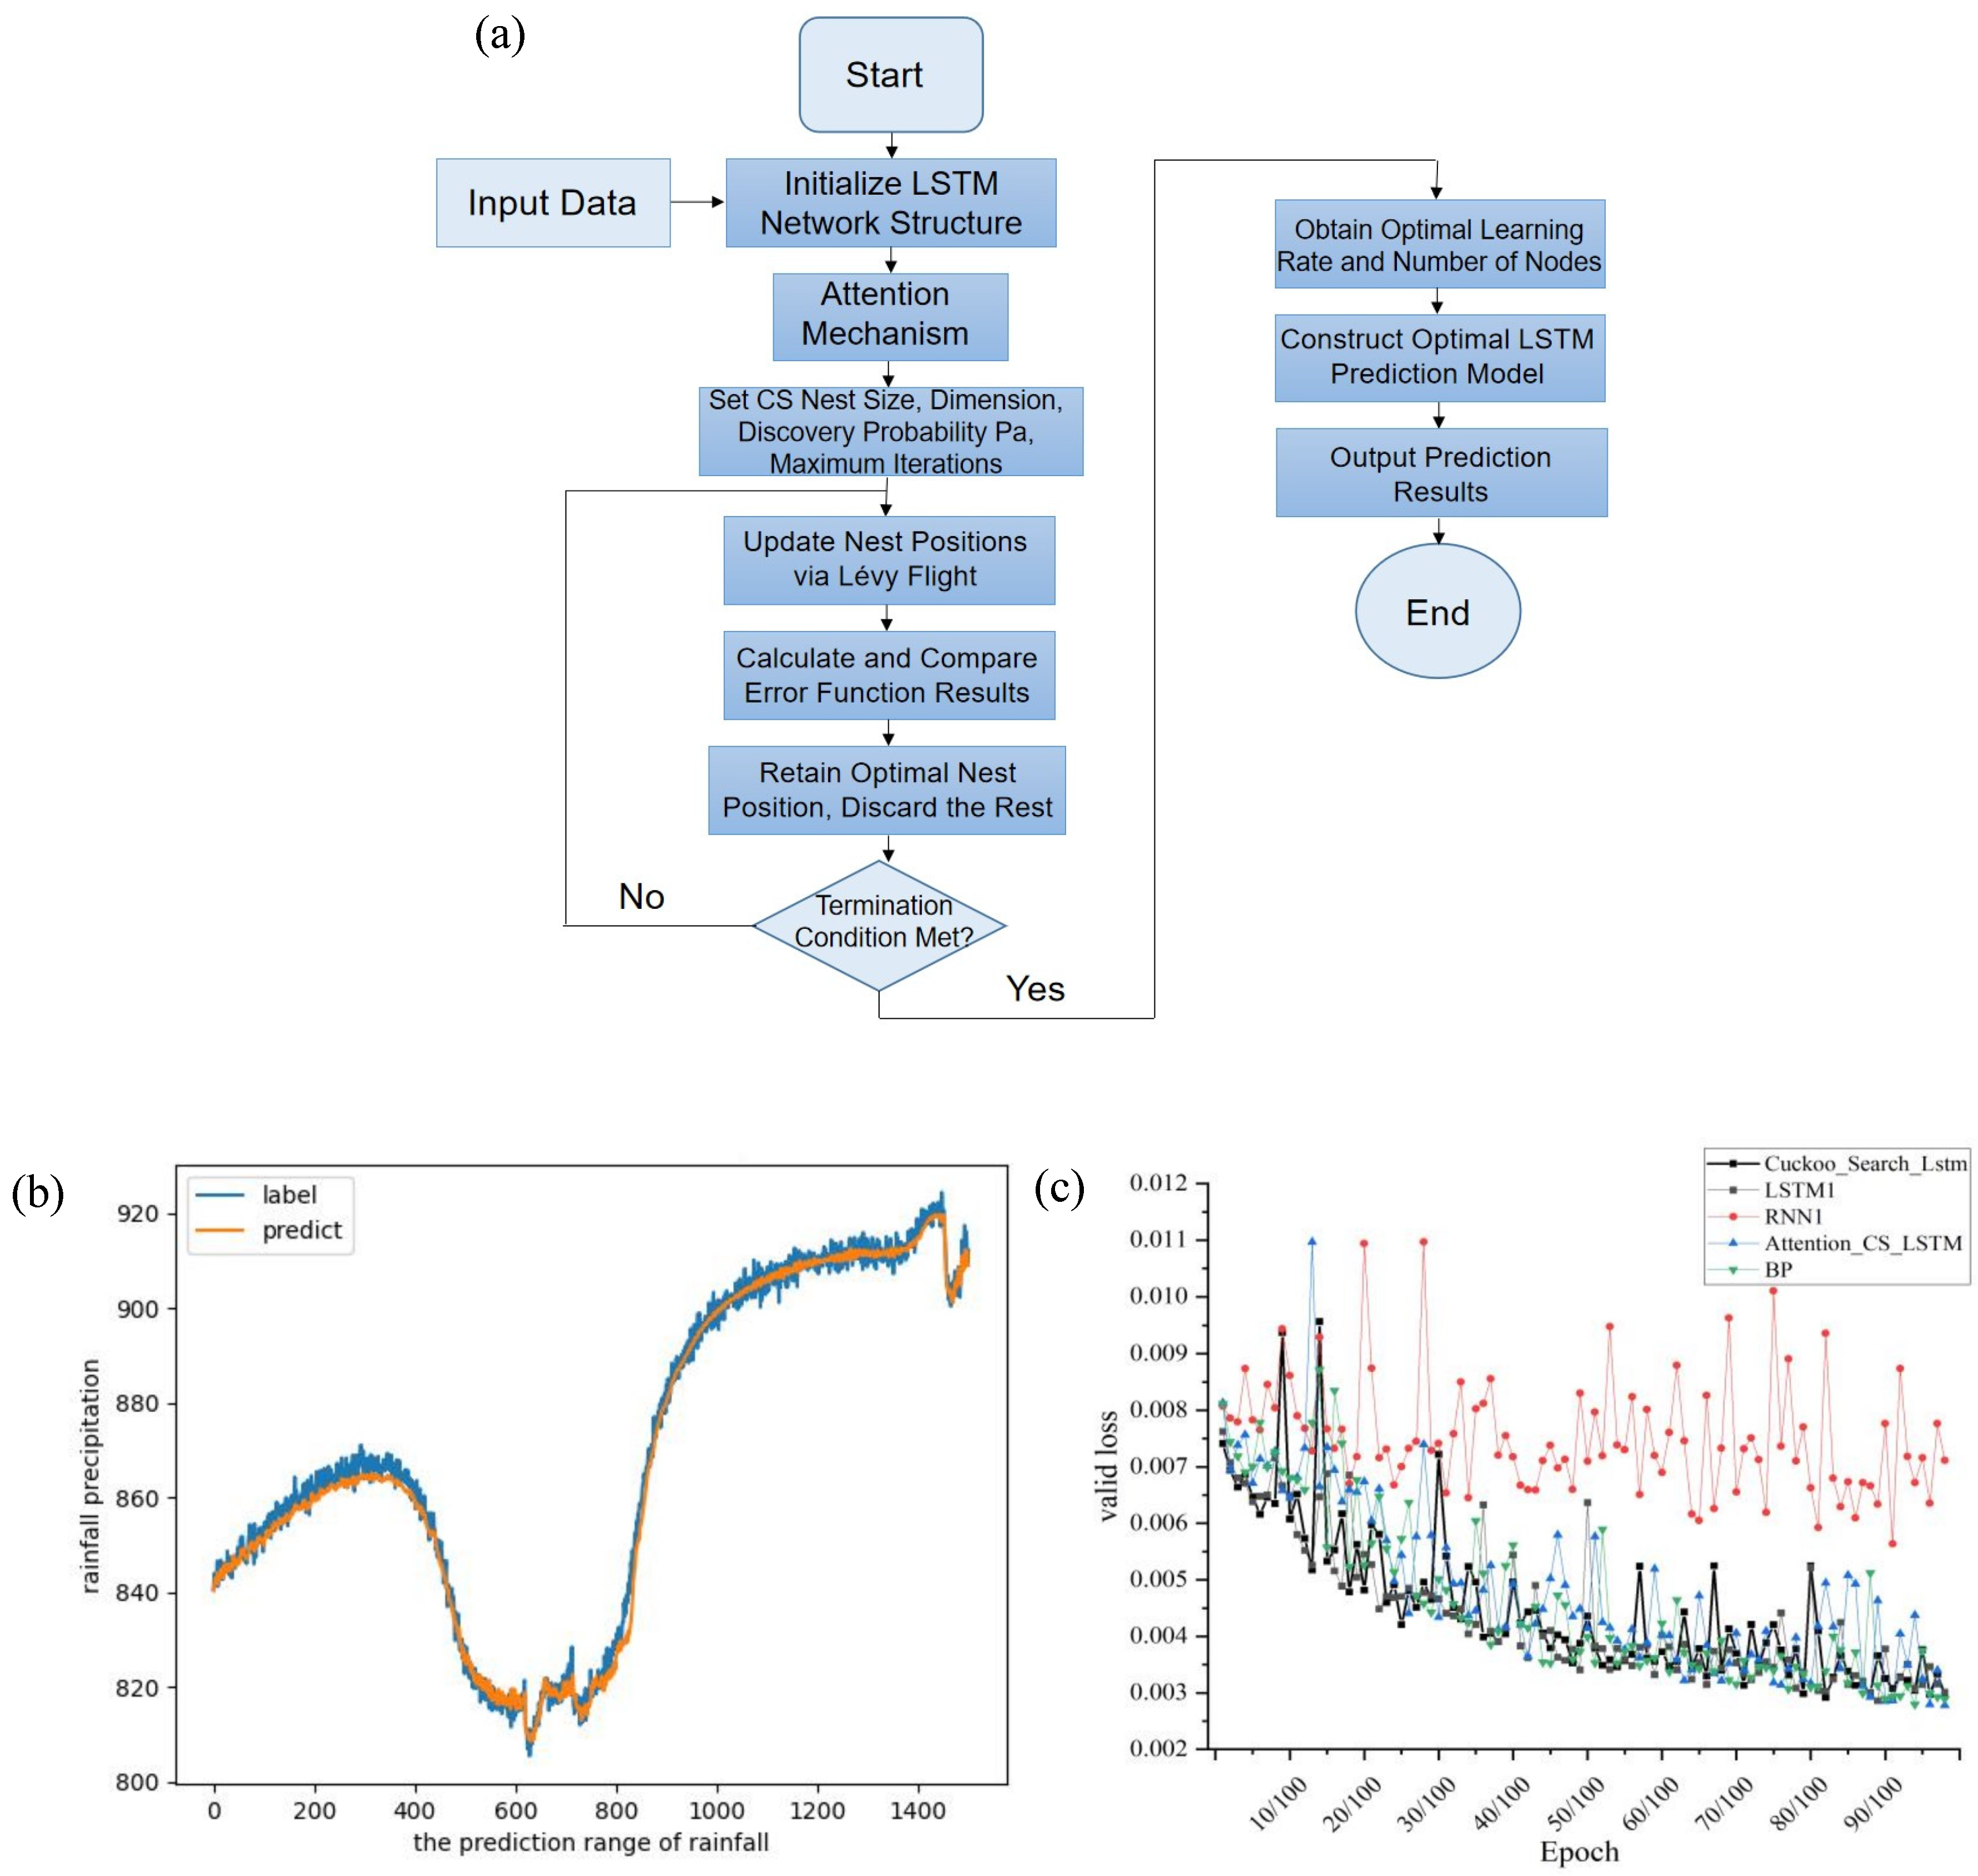
38] proposed an Attention-CS-LSTM model for intelligent temperature perception. As illustrated in
Figure 5, this hybrid architecture incorporates the Cuckoo Search (CS) algorithm for hyperparameter optimization and an attention mechanism to enable the LSTM network to dynamically focus on critical input features. The prediction performance of the Attention-CS-LSTM model is validated in
Figure 5a, where its predicted temperature curve shows a close fit to the actual measured values, with error maintained at a minimal level (
Figure 5b). Concurrently, as shown in
Figure 5c, comparative experiments with models like BP, RNN, and standard LSTM further highlight the performance advantages of these advanced hybrid architectures. These studies underscore the substantial potential of hybrid modeling frameworks, which effectively combine mechanistic understanding, intelligent optimization, and adaptive feature learning, thereby advancing the field towards more reliable and interpretable intelligent diagnostics.
5. Integrated Monitoring and Diagnostic Systems and Practical Applications
5.1. System Architectures and Industrial Application Cases
Advanced sensing technologies and intelligent algorithms ultimately need to be implemented through integrated system platforms to translate into tangible productivity. Currently, leading domestic petrochemical enterprises, such as Maoming Petrochemical and Lanzhou Petrochemical, have achieved significant progress in the construction of intelligent health monitoring systems for cracking furnace tubes.
The convergence of advanced sensing and intelligent diagnostics necessitates a systemic architectural paradigm that can reconcile real-time responsiveness with computational depth. As illustrated in the representative hierarchical framework shown in
Figure 6, prevailing intelligent monitoring systems for cracking furnace tubes increasingly embody a cloud–edge collaborative architecture [
37]. This paradigm is fundamentally driven by the need to process multi-source, heterogeneous data—spanning spatial temperature fields, transient acoustic signals, and temporal process parameters—which originate from disparate physical principles and spatiotemporal scales.
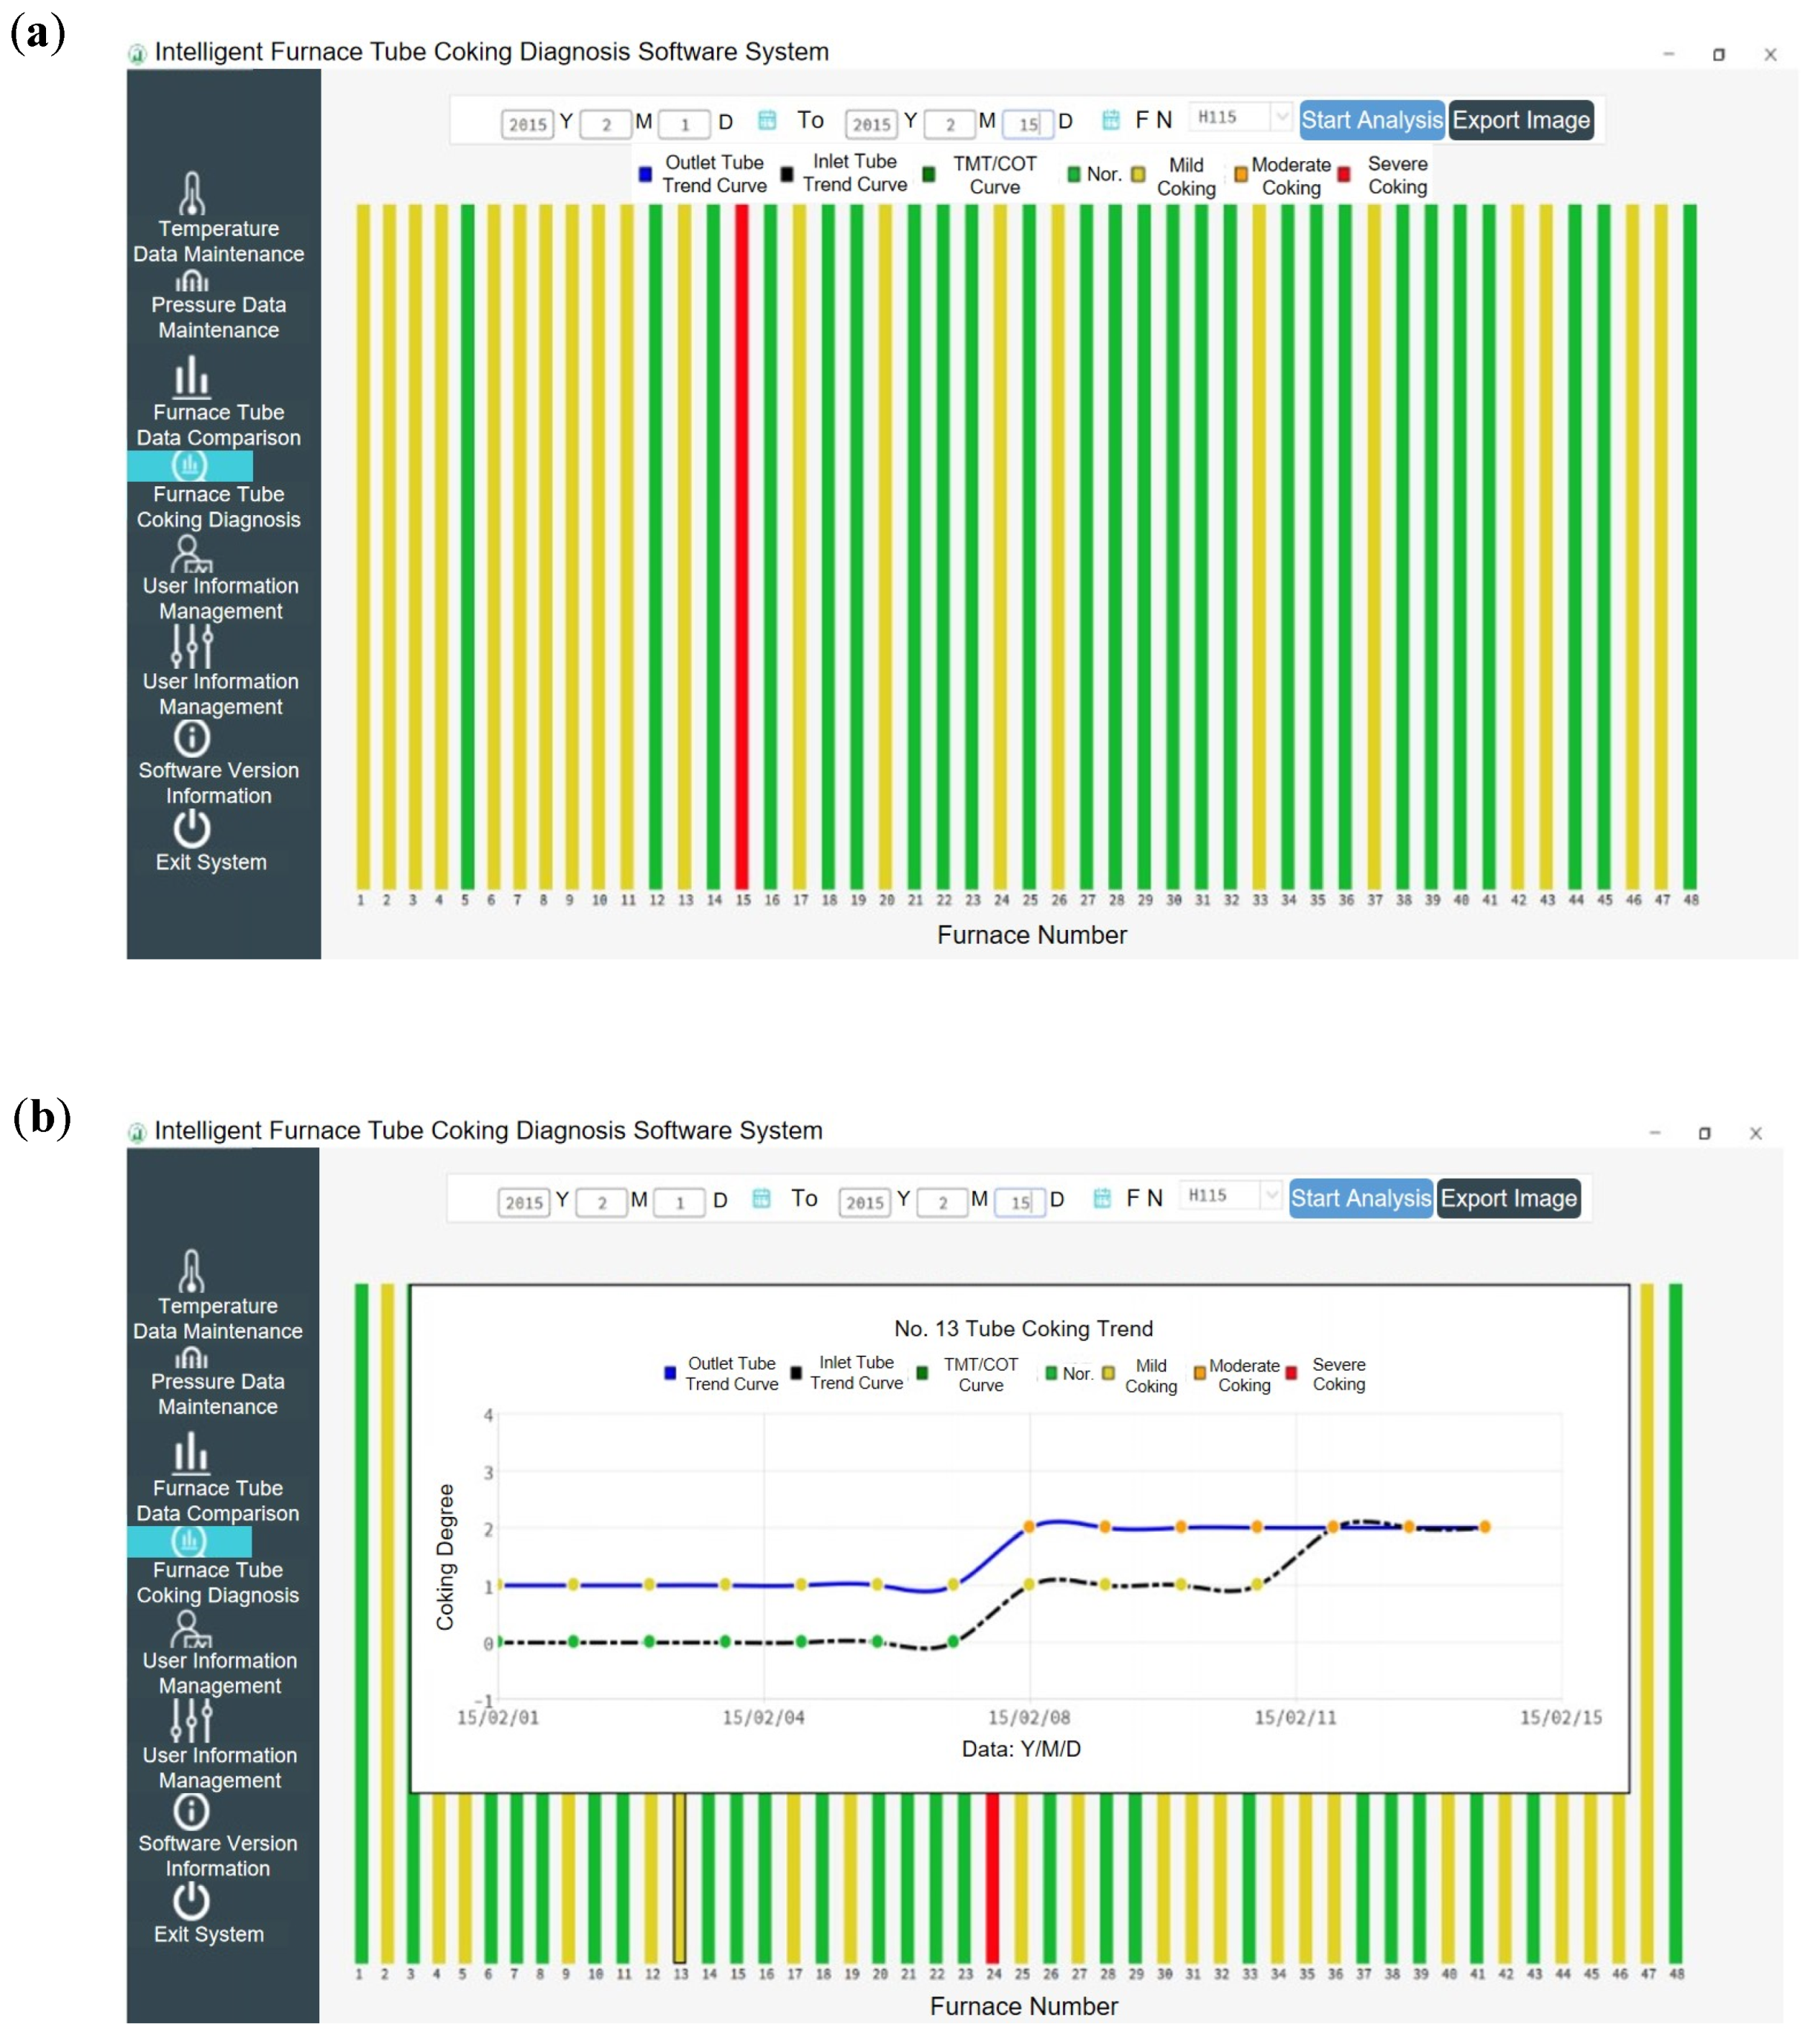
Within this architecture, the Perception Layer addresses the primary challenge of data harmonization and fusion from instruments like infrared imagers and plant DCS (Distributed Control System, used to acquire process parameters like pressure, flow rate, and COT). The Transmission and Edge Layer then prioritizes low-latency data conduit and preliminary feature extraction, enabling immediate anomaly alerts. The core Platform Layer shifts focus to computationally intensive tasks, including model retraining, lifecycle prediction, and digital twin simulation, typically hosted on cloud or private servers. Finally, the Application Layer translates these analytical outputs into actionable operational insights through interactive diagnostic interfaces, as exemplified in
Figure 7. Specifically,
Figure 7a (the real-time coking diagnosis interface) visually presents the key input parameters (e.g., tube skin temperature, pressures) and outputs the diagnosed coking level, addressing the “coking degree level alarm” function.
Figure 7b (the coking trend prediction interface) displays the historical trend of key parameters and projects the future coking trajectory, directly embodying the “remaining operation cycle prediction” and, by extension, providing the foundational data for “decoking decision support.” Together, these interfaces transform raw data into visualized health maps and prescriptive maintenance advice, thereby closing the loop from perception to decision.
This evolution from isolated data acquisition toward an integrated cyber–physical system underscores a key trend in industrial intelligence: moving beyond standalone algorithms to orchestrated system-level solutions where data flow and functional layering are explicitly designed to mitigate the inherent limitations of any single monitoring technology.
Reported industrial implementations, such as the case at Lanzhou Petrochemical [
10], serve to validate the pragmatic efficacy and highlight persistent hurdles of such intelligent systems. In this case, real-time tracking of the COT deviation (ΔT) enabled the early detection of tube-specific coking anomalies. This success underscores a critical methodological insight: even relatively simple deviation-based metrics, when applied to high-fidelity, plant-wide data, can serve as powerful proxies for complex degradation states, offering a pragmatic path toward initial digitalization. However, the reliance on a fixed threshold for ΔT also exemplifies the generalization limitation discussed earlier—such static rules may require recalibration under varying feedstocks or operating modes. Therefore, these application cases do not merely demonstrate economic benefits; they concretely illuminate the transition gradient from rule-based heuristics to adaptive, model-driven diagnostics in real-world industrial settings.
5.2. Implications for Practical Implementation
The critical analysis of technology maturity and system integration presented in this review leads to specific, actionable recommendations for stakeholders aiming to implement intelligent monitoring solutions.
For plant operators and asset managers, the quantitative TRL assessment (
Table 2) offers a clear technology selection and prioritization guideline. High-TRL infrared thermography should form the backbone of any online monitoring system due to its proven reliability for full-field temperature surveillance. Offline ultrasonic inspection remains indispensable for periodic integrity verification and model calibration. Investment in emerging technologies (e.g., high-temperature fiber optics) should be strategically directed towards pilot deployments at critical but less extreme locations to validate their long-term value, a process that requires careful consideration of the performance–economic trade-offs inherent to these sensors [
39].
A value-driven, lifecycle cost analysis is essential [
40]. Decision-making should transcend initial procurement costs. For high-TRL technologies like infrared thermography, the focus should be on quantifying their return on investment (ROI) through reduced unplanned downtime, optimized decoking schedules, and extended tube life. For emerging technologies, pilot projects should define clear key performance indicators (KPIs) that measure their unique diagnostic value (e.g., creep damage detection to prevent catastrophic failure) against their total cost of ownership. The economic justification for system integration lies in the synergistic value where the cost of multi-sensor fusion is outweighed by the significantly higher reliability and accuracy of the collective diagnosis.
For system integrators and developers, the phased integration roadmap advocates for a modular and scalable system architecture. Implementation should begin with robust data fusion between the dominant infrared data and existing process data (DCS), establishing a reliable baseline. The system design must explicitly accommodate the future incorporation of additional sensing modalities (e.g., acoustic, fiber optic) through standardized data interfaces and a cloud–edge computing framework [
41]. This approach mitigates risk and allows for incremental technological upgrades.
For the research community, this review highlights that fundamental progress is contingent upon overcoming specific material and data bottlenecks. Priority should be given to developing sensing materials and packaging that withstand prolonged service at temperatures exceeding 1000 °C, and to creating open, annotated datasets that enable benchmarking of multi-modal fusion algorithms under realistic industrial conditions.
6. Analysis of Existing Challenges and Limitations
Despite significant technological advancements, current monitoring and diagnostic technologies still face numerous severe challenges when applied to the complex and variable scenarios of industrial sites.
Firstly, although current systems can collect various types of information such as infrared images and process data, most still operate at the level of independent analysis and display, failing to achieve true information fusion. This is primarily because a natural gap exists in spatiotemporal scales and physical semantics between data from different sources. Simple data aggregation cannot uncover their deep-seated coupling relationships. While academia has explicitly stated that future intelligent optimization and diagnosis must rely on the deep fusion of mechanisms, knowledge, and data [
42], and in the design of advanced systems (such as those based on digital twins), the deep fusion of multi-source data has been placed at the core, in engineering practice, how to construct a unified framework to achieve a more comprehensive and precise joint perception of furnace tube status remains a critical, unresolved problem.
Secondly, the generalization and adaptive capabilities of diagnostic models are limited. Most current intelligent diagnostic models are essentially static, trained on historical data from specific furnace types, specific feedstocks, and stable operating conditions. This leads them to face the typical “data distribution shift” challenge in industrial practice: when feedstock properties change, operating modes are adjusted, or equipment undergoes modifications, the data foundation on which the model was built changes, potentially causing a significant decline or even complete failure in its predictive performance. The industry is acutely aware that models based on fixed datasets cannot adapt to the dynamics of refining and chemical production [
43]. Therefore, developing adaptive model frameworks with capabilities such as online learning and transfer learning, enabling systems to continuously adapt to changing production conditions without relying on large amounts of new labeled data, has become a key technological path to enhance the practical usability and robustness of intelligent diagnostic systems.
Thirdly, there is the challenge of balancing system real-time performance with computational accuracy. An inherent contradiction exists between the computational overhead of high-precision models (such as deep neural networks and complex CFD models) and the limited resources of industrial edge devices [
44]. Research since 2020 has shifted its focus from algorithm accuracy to model deployability. The mainstream solution is to achieve real-time inference at the edge through model lightweighting techniques (e.g., mixed-precision quantization, channel pruning, and the adoption of efficient network architectures). Concurrently, the cloud–edge collaborative architecture has become a standard paradigm, where the cloud handles complex model training and updates, and the edge executes lightweight models to meet real-time diagnostic needs. How to tailor more efficient lightweight models and deployment frameworks specifically for cracking furnace tube diagnosis remains a current research frontier.
Fourthly, there is the comprehensive consideration of cost-effectiveness in technology implementation. The procurement and maintenance costs of advanced monitoring equipment, such as high-precision infrared thermal imagers and distributed fiber optic sensing systems, are substantial. Furthermore, the development and ongoing operation and maintenance of complex intelligent diagnostic systems require continuous investment in specialized personnel [
27]. For many small- and medium-sized petrochemical enterprises, finding the balance point between cost and benefit is an unavoidable practical issue in the process of technology promotion.
7. Future Development Trends and Outlook
Looking ahead, ethylene cracking furnace tube monitoring and diagnostic technologies will evolve towards greater intelligence, integration, and precision. The following directions deserve special attention:
Firstly, the deep application of digital twin technology. Constructing high-fidelity digital twins of cracking furnaces and their tubes will be a core development direction. By creating a digital model in a virtual space that is synchronized in real time and bidirectionally mapped with the physical entity, it will not only enable real-time state monitoring and diagnosis but also allow for simulating tube responses under different operating conditions. This facilitates advanced applications such as decoking cycle optimization, operational parameter optimization, and predictive maintenance, truly achieving a closed-loop from “perception” to “decision” [
45].
Secondly, breakthroughs in cross-modal fusion diagnosis. Utilizing advanced algorithms like multimodal deep learning to deeply integrate infrared thermal images, acoustic signals, process data, and even maintenance history data, constructing a multi-scale, comprehensive furnace tube health assessment system [
46]. For example, combining infrared temperature field anomalies with acoustic emission event localization can more accurately determine the correlation between local overheating and internal damage in tubes, significantly improving the reliability and accuracy of diagnosis [
47].
Thirdly, the proliferation of edge intelligence and cloud–edge collaborative architectures. With the increasing computational power of edge computing chips, more data preprocessing, feature extraction, and lightweight diagnostic models will be deployed at the edge (such as within the smart thermometer itself), enabling localized rapid response and decision-making [
48]. Concurrently, complex model training, big data analysis, and digital twin simulations will be handled in the cloud, forming an efficient cloud–edge collaborative processing architecture. This ensures real-time performance while leveraging the powerful computing capabilities of the cloud [
45].
Fourthly, the development of self-evolving and explainable artificial intelligence (XAI). Future diagnostic systems will not be static tools but “expert systems” with continuous learning capabilities. They will be able to continuously self-optimize and evolve from new operational data, maintenance records, and even operator feedback [
49]. Simultaneously, through eXplainable AI (XAI) technologies, the diagnostic basis and reasoning process of the model will be made transparent to users, enhancing engineers’ trust in system decisions and promoting human–machine collaborative decision-making [
50].
8. Conclusions
The health status of ethylene cracking furnace tubes is the lifeline for ensuring the safe, stable, long-cycle, and efficient operation of the entire ethylene plant. This paper systematically reviewed the development and application of various monitoring technologies, from infrared temperature measurement and acoustic emission to fiber optic sensing. It provided an in-depth analysis of the evolutionary journey from mechanism-based models to data-driven intelligent diagnostic models. Specifically, the analysis conducted in this review is threefold: a systematic mapping of the technology stack, a critical synthesis with quantitative Technology Readiness Level (TRL) assessment under extreme temperature constraints, and the derivation of an evolutionary roadmap. Furthermore, by quantitatively assessing technology maturity and critically synthesizing their capabilities, this review provides a technical framework to shift the field’s focus from single-technology competition to integrated system-level solutions. It is evident that integrating multi-source sensing data with advanced artificial intelligence algorithms to build integrated intelligent monitoring and early warning diagnostic systems has become a clear trend and a technological high ground for the industry. Existing technological practices have fully demonstrated their immense potential in extending operational cycles, avoiding unplanned shutdowns, and enhancing production efficiency.
The principal conclusions drawn from this analysis are: (1) a significant feasibility gap exists among monitoring technologies under high-temperature conditions, with infrared thermography remaining the only mature online option; (2) the integration of multi-source data and hybrid models is an irreversible trend but is bottlenecked by the challenges of cross-modal fusion and model generalization; and (3) future advancement necessitates a paradigm shift from pursuing standalone technological excellence to architecting orchestrated, system-level solutions. However, it must be soberly recognized that numerous challenges remain in areas such as data fusion, model generalization, real-time performance, and cost control. In the future, with continuous breakthroughs and deep integration of cutting-edge technologies like digital twins, cross-modal fusion, edge intelligence, and self-evolving systems, the monitoring and diagnosis of cracking furnace tubes are destined to advance to a new, higher-level intelligent stage, providing solid technical support for achieving smart manufacturing and high-quality development in the petrochemical industry.
Author Contributions
Conceptualization, J.-K.R.; methodology, X.-Q.X.; formal analysis, P.W.; investigation, Z.-H.L.; data curation, L.-J.Z.; writing—original draft preparation, J.-K.R.; writing—review and editing, G.-L.Z., visualization, Z.-H.L.; supervision, Z.-Q.B. and F.-W.L.; project administration, X.-Q.X. and F.-W.L. All authors have read and agreed to the published version of the manuscript.
Funding
This work was supported by the PetroChina Company Limited Science and Technology Project (No. 2024DJ92), CNPC Project of Science Research and Technology Development (No. 2024DJ92) and (No. 2024LH-02).
Data Availability Statement
The raw data supporting the conclusions of this article will be made available by the authors on request.
Conflicts of Interest
Authors Jia-Kuan Ren, Xiu-Qing Xu, Peng Wang, Guang-Li Zhang, Li-Juan Zhu and Zhen-Quan Bai were employed by the company Tubular Goods Research Institute of CNPC. Author Zhi-Hong Li was employed by the company Northwest Institute for Non-Ferrous Metal Research. Author Fang-Wei Luo was employed by the company PetroChina Company Limited Safety & Environmental Protection Research Institute. The authors declare that this study received funding from PetroChina Company Limited Science and Technology. The funder was not involved in the study design, collection, analysis, interpretation of data, the writing of this article or the decision to submit it for publication.
Abbreviation
| Abbreviations and Symbol | Full Name |
| A/D | Analog to Digital Converter |
| ABC | Artificial Bee Colony |
| AE | Acoustic Emission |
| AI | Artificial Intelligence |
| ANFIS | Adaptive Neuro-Fuzzy Inference System |
| BP | Back Propagation |
| CCD | Charge-Coupled Device |
| CFD | Computational Fluid Dynamics |
| CNN | Convolutional Neural Network |
| COT | Outlet temperature of cracking furnace tube |
| CTF | Coking Time Factor |
| CIBLSTM | Cross-Iteration Bidirectional Long Short-Term Memory |
| CS | Cuckoo Search |
| D/A | Digital to Analog Converter |
| DCS | Distributed Control System |
| ΔT | Temperature Deviation between the COT of single furnace tube and the average COT of this group of furnace tubes |
| FBG | Fiber Bragg Grating |
| GA-BMLSTM | Genetic Algorithm-optimized Bidirectional Multi-step Long Short-Term Memory |
| IR | Infrared |
| IoT | Internet of Things |
| KPI | Key Performance Indicator |
| LSTM | Long Short-Term Memory |
| NETD | Noise Equivalent Temperature Difference |
| ROI | Return on Investment |
| RNN | Recurrent Neural Network |
| TMT | Tube Metal Temperature |
| TRL | Technology Readiness Level |
| UFPA | Uncooled Focal Plane Array |
References
- Jin, P.; Shen, L. Research Progress on Failure Modes and Cause Analysis of Ethylene Cracking Furnace Tubes. Chem. Mach. 2016, 43, 263–267, 301. [Google Scholar]
- Otegui, J.L.; de Bona, J.; Fazzini, P.G. Effect of Coking in Massive Failure of Tubes in an Ethylene Cracking Furnace. Eng. Fail. Anal. 2015, 48, 201–209. [Google Scholar] [CrossRef] [Scilit]
- Chen, J. Research on Measures to Suppress Coking of Cracking Furnace Tubes in Ethylene Plants. Chem. Manag. 2016, 6, 8. [Google Scholar]
- Panjapornpon, C.; Rochpuang, C.; Bardeeniz, S.; Hussain, M.A. Machine Learning Approach with a Posteriori-Based Feature to Predict Service Life of a Thermal Cracking Furnace with Coking Deposition. Results Eng. 2024, 22, 102349. [Google Scholar] [CrossRef] [Scilit]
- Liu, J.; Zhang, F. Analysis of Causes and Countermeasures for Coking of Cracking Furnace Tubes in Ethylene Plants. Sino-Glob. Energy 2025, 30, 89–94. [Google Scholar]
- Wang, D. Coking Principle and Inhibition Methods of Ethylene Cracking Furnaces. Jiangxi Chem. Ind. 2018, 1, 23–25. [Google Scholar]
- Zhang, L. Measures to Suppress Coking of Cracking Furnace Tubes in Ethylene Plants. Petrochem. Technol. 2017, 24, 131. [Google Scholar]
- Sun, X.; Shen, L. Research Progress on Coking Mechanism and Protective Measures of Ethylene Cracking Furnace Tubes. Corros. Sci. Prot. Technol. 2017, 29, 575–580. [Google Scholar]
- Lin, Q. Research on Multi-modal Data Analysis and Mining Methods for Ethylene Cracking Furnaces. Master’s Thesis, Guangdong University of Technology, Guangzhou, China, 2023. [Google Scholar]
- Zuo, X.; Pan, F.; Ji, H. Application of Online Monitoring Technology for Cracking Furnace Operation Cycle in Ethylene Plants. In Proceedings of the 2023 International Petroleum and Petrochemical Technology Conference; Petroleum Industry Press: Beijing, China, 2023; pp. 422–424. [Google Scholar]
- Herce, C.; González-Espinosa, A.; Gil, A.; Cortés, C.; González-Rebordinos, J.; Guégués, T.; Gil, M.; Ferré, L.; Brunet, F. Alfred Arias Combustion Monitoring in an Industrial Cracking Furnace Based on Combined CFD and Optical Techniques. Fuel 2020, 280, 118502. [Google Scholar] [CrossRef] [Scilit]
- Huang, Y.; Li, X.; Zhang, Q.; Wang, L.; Chen, H.; Liu, J.; Zhang, S.; Zhao, W.; Wu, F.; Zheng, Y. Environmental Cracking Behavior of Long-Term Serviced Ethylene Cracking Furnace Tubes. Corros. Sci. Prot. Technol. 2025, 37, 1–10. [Google Scholar]
- Yang, C.; Wang, W.; Li, N.; Zhang, H.; Liu, J.; Chen, Y.; Zhao, L.; Xu, M.; Sun, K.; Zhou, T. A Review on the Application of Intelligent Detection Technology for Cracking Furnace Tubes. Chem. Eng. Mach. 2025, 52, 123–130. [Google Scholar]
- Peng, Z.; Liu, Y.; Zhang, G.; Wang, X.; Li, J.; Chen, S.; Huang, W.; Yang, F.; Wu, B.; Xu, H. Key Technologies and Application of Intelligent Health Monitoring Platform for Ethylene Cracking Furnace Tubes in Cloud Environment. Comput. Appl. Chem. 2024, 41, 225–233. [Google Scholar]
- Cui, D.; Li, Y.; Zhang, H.; Wang, J.; Chen, L.; Liu, W.; Zhao, Y.; Sun, M.; Zhou, X.; Wu, J. Next-Generation 5G Fusion-Based Intelligent Health-Monitoring Platform for Ethylene Cracking Furnace Tube. Math. Biosci. Eng. 2022, 19, 3985–4001. [Google Scholar] [CrossRef] [Scilit]
- Wu, H.; Kong, L. Temperature Safety Monitoring of Ethylene Cracking Furnace Tubes Based on Infrared Imaging Technology. J. Atmos. Environ. Opt. 2015, 10, 46–50. [Google Scholar]
- Yun, H.; Deng, B.; Sun, H. Application of Acoustic Emission and Optical Fiber Sensing Technology in Detection of Hydrogen Pipes and Valves in High-Pressure Hydrogenation Stations. China Sci. Technol. Inf. 2025, 21, 139–141. [Google Scholar]
- Wang, D.; Shen, Z. Application of Acoustic Emission Technology in Pressure Vessel Inspection. Petrochem. Ind. Technol. 2025, 32, 149–151. [Google Scholar]
- Shi, D.; Jiang, Y.; Lu, Z.; Zhang, Z.; Wang, H.; Liu, B.; Chen, X.; Yang, J.; Wu, T.; Li, W. Leakage Detection Method for LNG Cryogenic Storage Tanks Based on Acoustic Emission Technology. China Offshore Platf. 2025, 40, 97–102. [Google Scholar]
- He, Y.; Yang, L.; Zhang, Y.; Zheng, B.; Yan, H.; Wang, J.; Liu, S.; Chen, M.; Zhao, Y.; Zhou, L. Monitoring of Uneven Settlement in Ultra-large LNG Storage Tank Foundations Based on Fiber Bragg Grating Sensing Technology. Constr. Mach. 2025, 10, 151–156. [Google Scholar]
- Liang, W.; Huang, Y.; Xu, Y.; Liu, X.; Zhang, W.; Chen, J.; Wang, Z.; Li, H.; Yang, T.; Sun, Q. Distributed Optical Fiber Sensing in Petrochemical Industry: A Review. IEEE Sens. J. 2015, 15, 6237–6253. [Google Scholar]
- Shi, Y.; Wang, H. High-Temperature Fiber Optic Sensors and Their Applications in Harsh Environments. Opt. Laser Technol. 2018, 106, 34–48. [Google Scholar]
- Chen, X.; Zhang, Q.; Liu, B.; Wang, H.; Li, J.; Yang, Y.; Zhao, L.; Sun, W.; Xu, F.; Zhou, M. On-Line Monitoring of Tube Wall Temperature in an Ethylene Cracking Furnace Using Metal-Packaged FBG Sensors. Sens. Actuators A Phys. 2020, 303, 111828. [Google Scholar]
- Charlesworth, J.P.; Temple, J.A.G. Engineering Applications of Ultrasonic Time-of-Flight Diffraction, 2nd ed.; Research Studies Press: Baldock, UK, 2001. [Google Scholar]
- Prager, M.; Roder, H.; Riedel, H.; Schmidt, W.; Müller, K.; Becker, T.; Hoffmann, J.; Wagner, S.; Koch, A.; Bauer, F. Remaining Life Assessment of Furnace Tubes in Ethylene Cracking Service. J. Press. Vessel Technol. 2017, 139, 031402. [Google Scholar]
- Santos, A.; Silva, F.J.G.; Campilho, R.D.S.G.; Pinto, G.F.L.; Sousa, V.F.C.; Correia, D.S.; Costa, M.L.P.; Nascimento, R.M.; Ferreira, N.M.; Alves, F.L. A Comparative Study of Sensing Technologies for Pipeline Integrity Monitoring: Cost vs. Performance. J. Nat. Gas Sci. Eng. 2021, 95, 104223. [Google Scholar]
- Meng, Q.; Wang, F.; Liu, C.; Zhang, Y.; Li, H.; Chen, J.; Zhao, W.; Xu, L.; Yang, T.; Sun, K. High-Temperature Performance and Application Limits of Acoustic Emission Sensors for Structural Health Monitoring. Sens. Actuators A Phys. 2021, 331, 112876. [Google Scholar]
- Kaplan, H. Practical Applications of Infrared Thermal Sensing and Imaging Equipment, 3rd ed.; SPIE Press: Bellingham, WA, USA, 2007. [Google Scholar]
- Mankins, J.C. Technology Readiness Assessments: A Retrospective. Acta Astronaut. 2009, 65, 1216–1223. [Google Scholar] [CrossRef] [Scilit]
- Sathupadi, K.; Achar, S.; Bhaskaran, S.V.; Faruqui, N.; Abdullah-Al-Wadud, M.; Uddin, J. Edge-Cloud Synergy for AI-Enhanced Sensor Network Data: A Real-Time Predictive Maintenance Framework. Sensors 2024, 24, 7918. [Google Scholar] [CrossRef] [Scilit] [PubMed]
- Albright, L.F.; Marek, J.C. Mechanistic Model for Formation of Coke in Pyrolysis Units Producing Ethylene. Ind. Eng. Chem. Res. 1988, 27, 755–759. [Google Scholar] [CrossRef] [Scilit]
- Pant, H.J.; Kunzru, D. Modeling of Thermal Cracking of Naphtha in a Tubular Reactor. Ind. Eng. Chem. Res. 1997, 36, 2059–2072. [Google Scholar] [CrossRef] [Scilit]
- Stefanidis, G.D.; Merci, B.; Heynderickx, G.J.; Marin, G.B. CFD Simulations of Steam Cracking Furnaces Using Detailed Combustion Mechanisms. Comput. Chem. Eng. 2006, 30, 635–649. [Google Scholar] [CrossRef] [Scilit]
- Van Geem, K.M.; Reyniers, M.F.; Marin, G.B. Challenges and Opportunities in the Modeling of Steam Cracking Reactors. Rev. Chem. Eng. 2007, 23, 1–38. [Google Scholar]
- Valus, H.J.; Fontoura, D.V.R.; Serfaty, R.; Nunhez, J.R. Computational Fluid Dynamic Model for the Estimation of Coke Formation and Gas Generation Inside Petrochemical Furnace Pipes with the Use of a Kinetic Net. Can. J. Chem. Eng. 2017, 95, 2286–2292. [Google Scholar] [CrossRef] [Scilit]
- Hussain, M. Sustainable Machine Vision for Industry 4.0: A Comprehensive Review of Convolutional Neural Networks and Hardware Accelerators in Computer Vision. Artif. Intell. 2024, 5, 1324–1356. [Google Scholar] [CrossRef] [Scilit]
- Zhao, J. Research on Intelligent Coking Diagnosis Method for Ethylene Cracking Furnace Tubes. Master’s Thesis, Guangdong University of Technology, Guangzhou, China, 2020. [Google Scholar]
- Zhang, Z. Intelligent Perception Model for Ethylene Cracking Furnace Based on Mechanism and Data Mixing. Master’s Thesis, Jilin Institute of Chemical Technology, Jilin, China, 2024. [Google Scholar]
- Chen, X.; Wang, L.; Kumar, S.; Singh, R.; Patel, A.; Gupta, P.; Sharma, V.; Li, J.; Zhang, W.; Liu, Y. Performance-Economic Trade-Offs in High-Temperature Sensing for Industrial Asset Health Monitoring: A Review and Case Study. Sens. Actuators A Phys. 2023, 349, 114063. [Google Scholar]
- Smith, J.; Johnson, R.; Brown, L.; Davis, M.; Wilson, T.; Anderson, P.; Thomas, K.; Martinez, C.; Taylor, S.; White, D. An Economic Analysis of Predictive Maintenance Strategies in Petrochemical Plants: From Cost Modeling to ROI Evaluation. J. Loss Prev. Process Ind. 2023, 81, 104999. [Google Scholar]
- Du, H.; Zheng, W.; Liu, C.; Wang, J.; Chen, S.; Li, H.; Yang, F.; Zhao, L.; Wu, T.; Zhang, Y. Maintenance Optimization Methodology of Edge Cloud Collaborative Systems Based on a Gateway Cost Index in IIoT. Reliab. Eng. Syst. Saf. 2022, 223, 108494. [Google Scholar] [CrossRef] [Scilit]
- Liu, Y.; Zhang, H.; Wang, Z.; Chen, X.; Li, W.; Sun, Q.; Zhou, J.; Wu, L.; Xu, M.; Zhao, Y. Research on Intelligent Safety Optimization and Coking Model of Ethylene Cracking Furnace Based on Multi-Information Fusion. J. Loss Prev. Process Ind. 2023, 84, 105012. [Google Scholar]
- Wu, Z.; Chen, Y.; Li, X.; Zhang, L.; Wang, H.; Liu, B.; Yang, J.; Xu, T.; Zhao, W.; Sun, K. A Transfer Learning Approach for Coke Prediction in Ethylene Crackers under Varying Feedstocks. Comput. Chem. Eng. 2023, 170, 108115. [Google Scholar]
- Chen, Y.; Zhang, H.; Wang, Z.; Liu, J.; Li, S.; Yang, T.; Zhao, L.; Wu, F.; Xu, Q.; Huang, W. Edge-Cloud Collaborative Real-Time Fault Diagnosis for Industrial Processes via Lightweight Deep Learning. IEEE Trans. Ind. Inform. 2024, 20, 2115–2126. [Google Scholar]
- Zhang, Y.; Wang, C.; Liu, H.; Chen, L.; Li, J.; Sun, W.; Zhou, T.; Wu, B.; Xu, H.; Zhao, M. A Digital Twin-Based Approach for Predictive Maintenance and Operation Optimization of Ethylene Cracking Furnaces. Chem. Eng. Sci. 2023, 276, 118785. [Google Scholar]
- Li, H.; Wu, Z.; Wang, Q.; Zhang, Y.; Chen, X.; Liu, W.; Yang, F.; Zhao, J.; Sun, L.; Xu, P. Digital Twin-Driven Fault Diagnosis with Multimodal Data Fusion for Chemical Process Industries. Comput. Chem. Eng. 2022, 165, 107948. [Google Scholar]
- Wang, J.; Zhang, L.; Chen, Y.; Liu, H.; Li, W.; Zhao, T.; Sun, Q.; Wu, Z.; Xu, F.; Yang, M. A Multimodal Deep Learning Framework for Comprehensive Health Assessment of Industrial Equipment by Fusing Infrared Images and Acoustic Emission Signals. Mech. Syst. Signal Process. 2023, 188, 110022. [Google Scholar]
- Zhu, J.; Li, D.; Zhao, Y.; Wang, H.; Chen, S.; Liu, B.; Zhang, W.; Yang, J.; Wu, T.; Xu, L. A Cloud-Edge Collaborative Digital Twin Framework for Predictive Maintenance of Rotating Machinery. Mech. Syst. Signal Process. 2023, 185, 109820. [Google Scholar]
- Meng, L.; Zhang, H.; Li, T. A Human-in-the-Loop and Explainable Continual Learning Framework for Industrial Fault Diagnosis. IEEE Trans. Ind. Inform. 2023, 19, 10068–10079. [Google Scholar]
- Yang, S.; Zhao, Q.; Huang, B. Toward Self-Evolving Industrial AI: A Concept and Framework for Combining Digital Twin, Continual Learning, and Explainable AI. Annu. Rev. Control. 2022, 54, 357–370. [Google Scholar]
| Disclaimer/Publisher’s Note: The statements, opinions and data contained in all publications are solely those of the individual author(s) and contributor(s) and not of MDPI and/or the editor(s). MDPI and/or the editor(s) disclaim responsibility for any injury to people or property resulting from any ideas, methods, instructions or products referred to in the content. |




 ,
,