Article

An Integrated Framework for Deflagration Risk Analysis in Electrochemical Energy Storage Stations: Combining Fault Tree Analysis and Fuzzy Bayesian Network

1
College of Energy Environment and Safety Engineering, China Jiliang University, Hangzhou 310018, China
2
Fire & Explosion Protection Laboratory, Northeastern University, Shenyang 110819, China
3
Support Service Division, Zhejiang Safety Science and Technology Research Co., Ltd., Hangzhou 311305, China
*
Author to whom correspondence should be addressed.
Processes 2026, 14(4), 674; https://doi.org/10.3390/pr14040674
Submission received: 4 January 2026 / Revised: 5 February 2026 / Accepted: 7 February 2026 / Published: 15 February 2026
(This article belongs to the Section Process Safety and Risk Management)

Abstract

Electrochemical energy storage is pivotal in constructing new-type power systems. However, the large-scale deployment of energy storage stations poses severe safety challenges, particularly the risk of deflagration. The coupling of combustible accumulation within battery systems and the confined structure of storage units can trigger cascading thermal runaway and deflagration accidents. Existing research still falls short in systematically analyzing the deflagration risks and process evolution mechanisms in energy storage stations. To address this gap, this study develops a probabilistic risk assessment model that enables analysis of risk propagation through the integration of fault tree analysis (FTA) with a static fuzzy Bayesian network (BN). The proposed approach delineates the complete risk evolution pathway from battery thermal runaway to deflagration in a confined space. Diagnostic reasoning identifies a dominant risk escalation path initiated by internal short circuits, leading to thermal runaway, flammable gas release, and pressure accumulation due to inadequate pressure relief. Sensitivity analysis highlights gases ejected during thermal runaway (C22) and lack of pressure relief devices or insufficient venting area (C31) as the most influential risk drivers. This study thus offers a practical, model-based framework for enhancing targeted risk prevention and safety resilience in electrochemical energy storage station infrastructure.

1. Introduction

The global transition to a low-carbon energy structure is positioning electrochemical energy storage as a strategically vital technology, due to its indispensable function in integrating intermittent renewable sources and facilitating the development of modern power systems [1,2]. According to a guiding document issued by China’s National Development and Reform Commission and National Energy Administration, new energy storage has been explicitly designated as a key initiative to underpin the development of the nation’s new power system [3]. The electrochemical energy storage industry in China has been undergoing a significant expansion, driven by strong policy support. As of June 2025, the country had put into operation a cumulative total of 1663 grid-scale electrochemical energy storage (EES) stations, with their aggregate installed capacity amounting to 75.79 GW/175.12 GWh [4]. The rapid growth of the industry is fraught with serious safety challenges, with combustion and explosion incidents becoming a global bottleneck to its sustainable development. The high energy density of EES lithium batteries is counterbalanced by their inherent chemical instability, which poses a risk of thermal runaway and consequently compromises the entire system’s safety boundary [5,6]. From 2017 to 2024, there were over 90 publicly reported fire accidents involving energy storage systems worldwide, highlighting severe safety challenges [7]. The complex risks—where battery thermal runaway converges with external system failures—are exemplified by the 2024 container-system deflagration in Thuringia, Germany (causing €700,000 in losses) and the 2021 Beijing Dahongmen incident in China.
Currently, risk assessment across various industries remains predominantly reliant on a suite of conventional methodologies. While fault tree analysis (FTA) and Event Tree Analysis (ETA) have been applied to trace the root causes of safety incidents [8,9], techniques such as the Analytic Hierarchy Process (AHP) are commonly employed to rank and assign weights to various safety-influencing factors [7,10,11]. These methods, however, demonstrate significant limitations in modeling highly nonlinear systems with multiple couplings. FTA and ETA are poorly equipped for interdependent relationships and feedback, with model scale exploding exponentially with complexity, challenging both qualitative and quantitative assessment [12]. Meanwhile, other methods like risk matrices and Delphi rely heavily on subjective input and static data, failing to depict complex causal-probabilistic interactions. They are thus inherently constrained in analyzing risk propagation and supporting probabilistic inference [7,12].
Overcoming the inherent drawbacks of traditional approaches, Bayesian Networks (BN)—a probabilistic graphical model—have shown considerable utility in process industry risk assessment. BNs excel by using multi-state nodes to represent risk factors, moving beyond simplistic binary assumptions, and by supporting bidirectional reasoning for both prediction and diagnosis [12,13]. The common practice of using expert knowledge to define network parameters alleviates the need for exact data but introduces evaluator bias. A more reliable approach involves refining this expert input with fuzzy set theory, which systematically accounts for and quantifies subjective uncertainty [14,15]. In contrast to traditional Bayesian networks that rely on crisp probabilistic inputs, the FBN method replaces these inputs with fuzzy sets. The primary innovation of the FBN framework lies in its ability to retain and propagate the epistemic uncertainty derived from expert judgments within the computational graph. This feature enhances the robustness and transparency of the risk quantification model, particularly beneficial for assessing complex systems when data is limited. Bayesian networks have been successfully applied in domains such as chemical safety [12,16], fire and explosion analysis [17,18,19], and hydrogen risk analysis [20], which confirms the method’s competence in analyzing complex systems with coupled risks.
There is a serious gap between the existing risk assessment research in the EES field and the actual situation. Most current studies focus predominantly on the thermal runaway processes of individual lithium battery cells and the associated fire and deflagration risks, yet they often fail to adequately capture the holistic risk characteristics of an entire EES station [17,21]. An EES station is not a mere aggregation of individual devices; rather, it is a complex energy system comprising thousands of cells arranged in series and parallel to form battery racks, integrated with multiple subsystems such as the Battery Management System (BMS), Power Conversion System (PCS), and thermal management system. This high level of system integration gives rise to risks that are inherently systemic, featuring chain-reaction escalation and multi-physics coupling, the complexity of which far exceeds the risk assessment of a single battery cell [22,23].
To address the need for quantitative deflagration risk assessment in EES and overcome the limitations of traditional methods in handling uncertain information and complex causal relationships, this study develops a comprehensive probabilistic risk analysis methodology that proceeds as follows. Firstly, a systematic FTA is conducted to identify risk factors and delineate the complete causal chain from initial failures to deflagration. The fault tree is then systematically mapped into a BN structure to enable probabilistic reasoning. Secondly, to compensate for the scarcity of empirical accident data in the energy storage sector, fuzzy set theory is introduced to process expert judgments for determining the prior probabilities of basic events. This approach effectively quantifies linguistic evaluations while reducing subjectivity through an expert weighting system based on professional experience and domain relevance. Finally, the established fuzzy Bayesian network is implemented in GeNIe software (University of Pittsburgh Decision Systems Laboratory) to perform causal reasoning for deflagration probability prediction, diagnostic reasoning for critical path identification, and sensitivity analysis for pinpointing core risk drivers.
The structure of the paper is organized as follows: Section 2 introduces the integrated risk assessment methodology, covering Fault Tree Analysis, fuzzy Bayesian Networks, and their mapping. Section 3 focuses on constructing and analyzing the deflagration risk model, including risk factor identification, fault tree development, Bayesian network mapping, and prior probability estimation using fuzzy expert elicitation. Section 4 presents the results, including causal reasoning, diagnostic analysis, sensitivity evaluation, and the study’s conclusions.

2. Risk Assessment Methods

2.1. Fault Tree Analysis

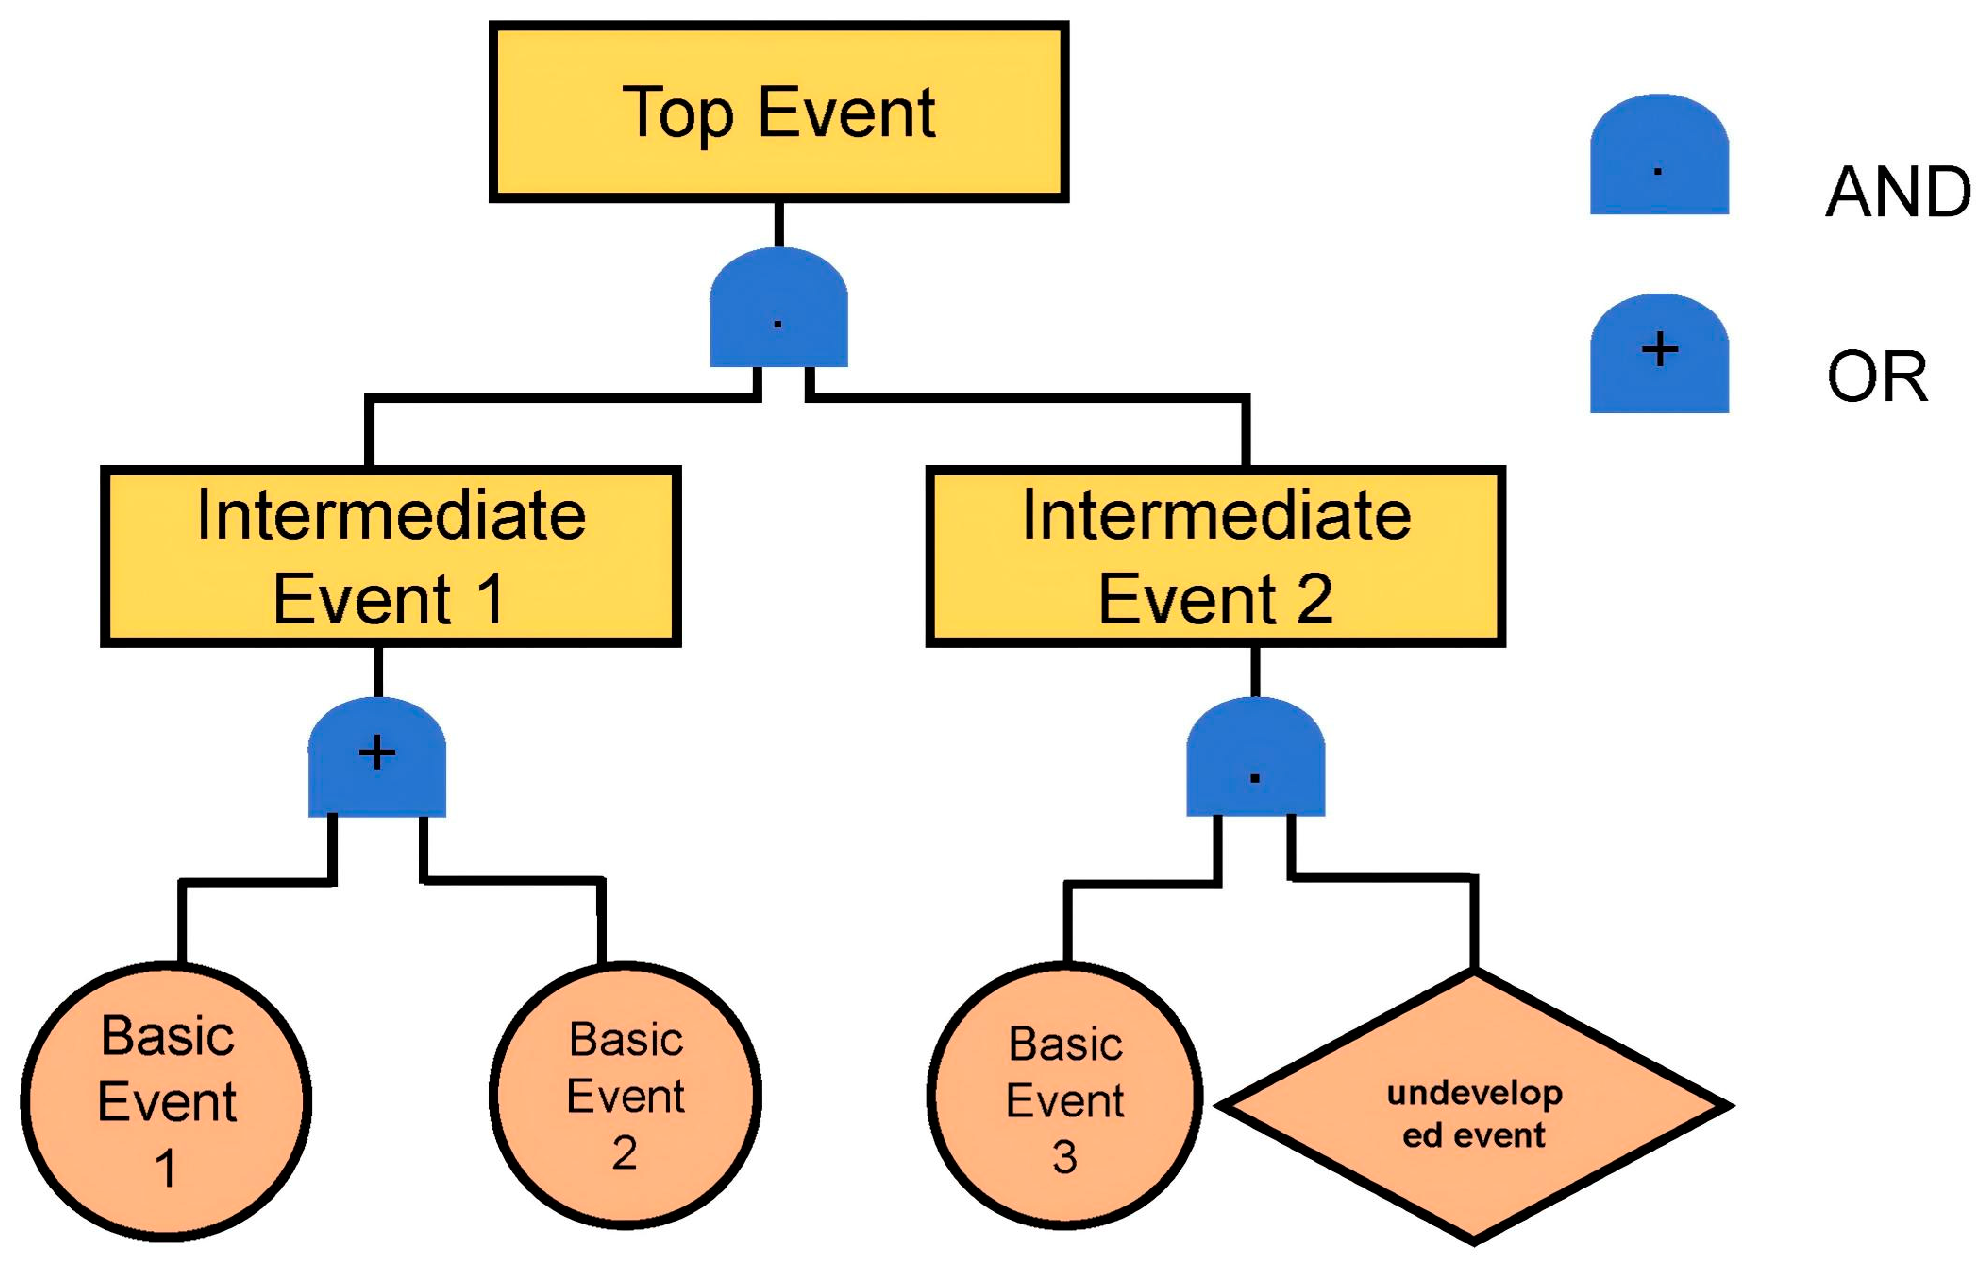
The Fault Tree Analysis (FTA) constitutes a top-down, deductive analytical procedure for assessing system safety and reliability (Figure 1). The process originates from a predefined top event and iteratively progresses through logical gates to delineate all potential causative basic events, resulting in a graphical representation of the deterministic causal pathways between component failures and the system-level fault [12]. The conventional FTA methodology, nevertheless, is inherently constrained by its foundations in static Boolean logic and the presumption of probabilistically independent basic events, thereby exhibiting pronounced limitations in handling common cause failures, causal event sequences, and epistemic uncertainties.

2.2. Fuzzy Bayesian Network Model

2.2.1. Bayesian Network Model

A static Bayesian Network (BN) constitutes a probabilistic graphical model utilized for representing and inferring dependency structures among variables, grounded in Bayes’ theorem and probability theory. It employs a directed acyclic graph (DAG) to model inter-variable causality, with nodes corresponding to random variables and edges representing direct probabilistic dependencies.
The foundational principle of BN is the factorization of the joint probability distribution. Consider a network comprising n variables, {X1, X2, …, Xn}. The joint probability distribution is factorized as shown in Equation (1) [24]:
P ( X 1 , X 2 , , X n ) = i = 1 n P ( X i parents ( X i ) )
where parents(Xi) denotes the set of parent nodes pointing to Xi in the graph. This factorization leverages conditional independence, thereby significantly reducing the number of required model parameters. The marginal probability of a node Xi is given by Equation (2):
P ( X i ) = X 1 , ... , X i 1 , X i + 1 , ... , X n P ( X 1 , ... , X n )
where P(Xi) is the marginal probability of the variable and (X1, …, Xn) is the joint probability distribution of all variables.
Bayes’ theorem is employed for probabilistic inference within Bayesian networks. For instance, given some observed evidence D, the posterior probability of a variable A can be updated using the following calculation:
P ( A D ) = P ( D A ) P ( A ) P ( D )
where P(A) represents the prior probability, P(DA) is the likelihood function, and P(D) is the evidence (or marginal likelihood). In the context of Bayesian network modeling, parameter learning typically involves estimating the Conditional Probability Tables (CPTs) or Conditional Probability Distributions (CPDs) from data, whereas probabilistic inference is employed to compute the posterior distribution of query variables.

2.2.2. Fuzzy Set Theory

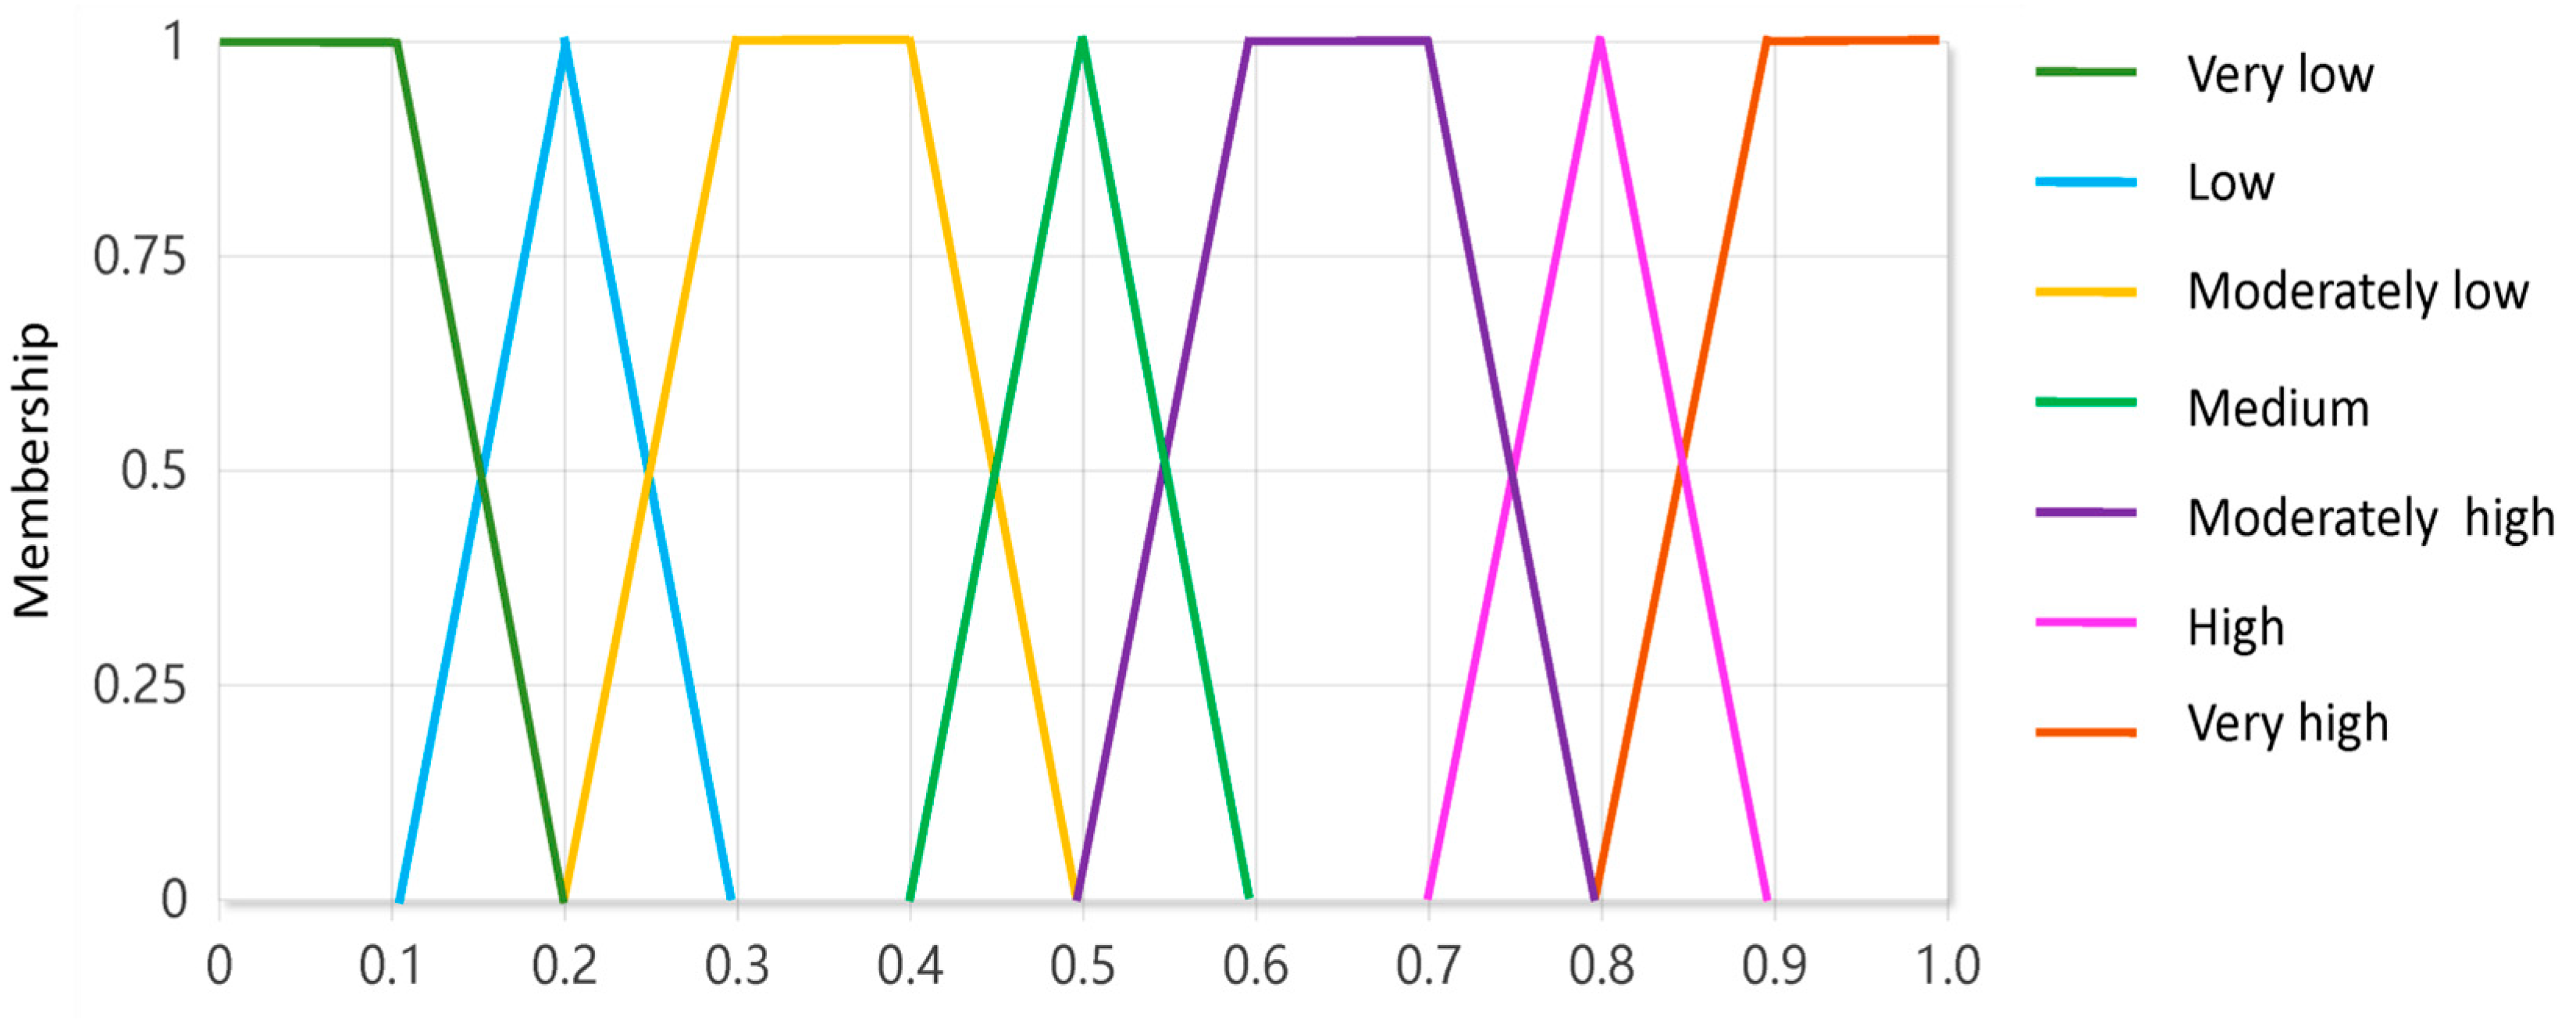
In conventional risk assessment, precise numerical values are typically employed to describe the probability of event occurrences or the severity of their consequences. However, in practical expert elicitation processes, human judgments often contain subjectivity and ambiguity. For instance, when evaluating the “likelihood of a specific failure,” experts tend to prefer linguistic terms such as “high,” “medium,” or “low” rather than providing specific probability values. To effectively handle this uncertainty, fuzzy set theory is introduced, which quantifies such vague and imprecise concepts through membership functions, offering a powerful mathematical tool for processing fuzzy information in expert knowledge. In risk assessment, linguistic evaluations provided by experts need to be converted into fuzzy numbers for computation. This study employs trapezoidal fuzzy numbers to quantify linguistic variables. A trapezoidal fuzzy number can be represented as A = (a, b, c, d), with its membership function defined in Equation (4) and Figure 2 [25]:
μ T ˜ ( x ) = { 0 , x < a x a b a , a x b 1 , b x c d x d c , c x d 0 , x > d
where a and d represent the lower and upper bounds of the fuzzy number, respectively, and the interval [b, c] denotes the core where the membership degree equals 1.
Apart from facilitating the interpretation of linguistic terms, a significant benefit of utilizing fuzzy set theory in expert elicitation lies in its intrinsic ability to quantify and retain epistemic uncertainty, encompassing the variability stemming from potential individual biases within expert judgments. This method offers a clear mathematical structure to handle subjectivity, aiming to manage it rather than eradicate it.

2.2.3. Mapping Between Fault Tree and Bayesian Network

Although Fault Tree Analysis (FTA) is widely used in system risk analysis, its static and deterministic framework exhibits limitations in handling issues such as common-cause failures and multi-state variables. To overcome these shortcomings, mapping a fault tree into a Bayesian network (BN) has emerged as a powerful extension method.
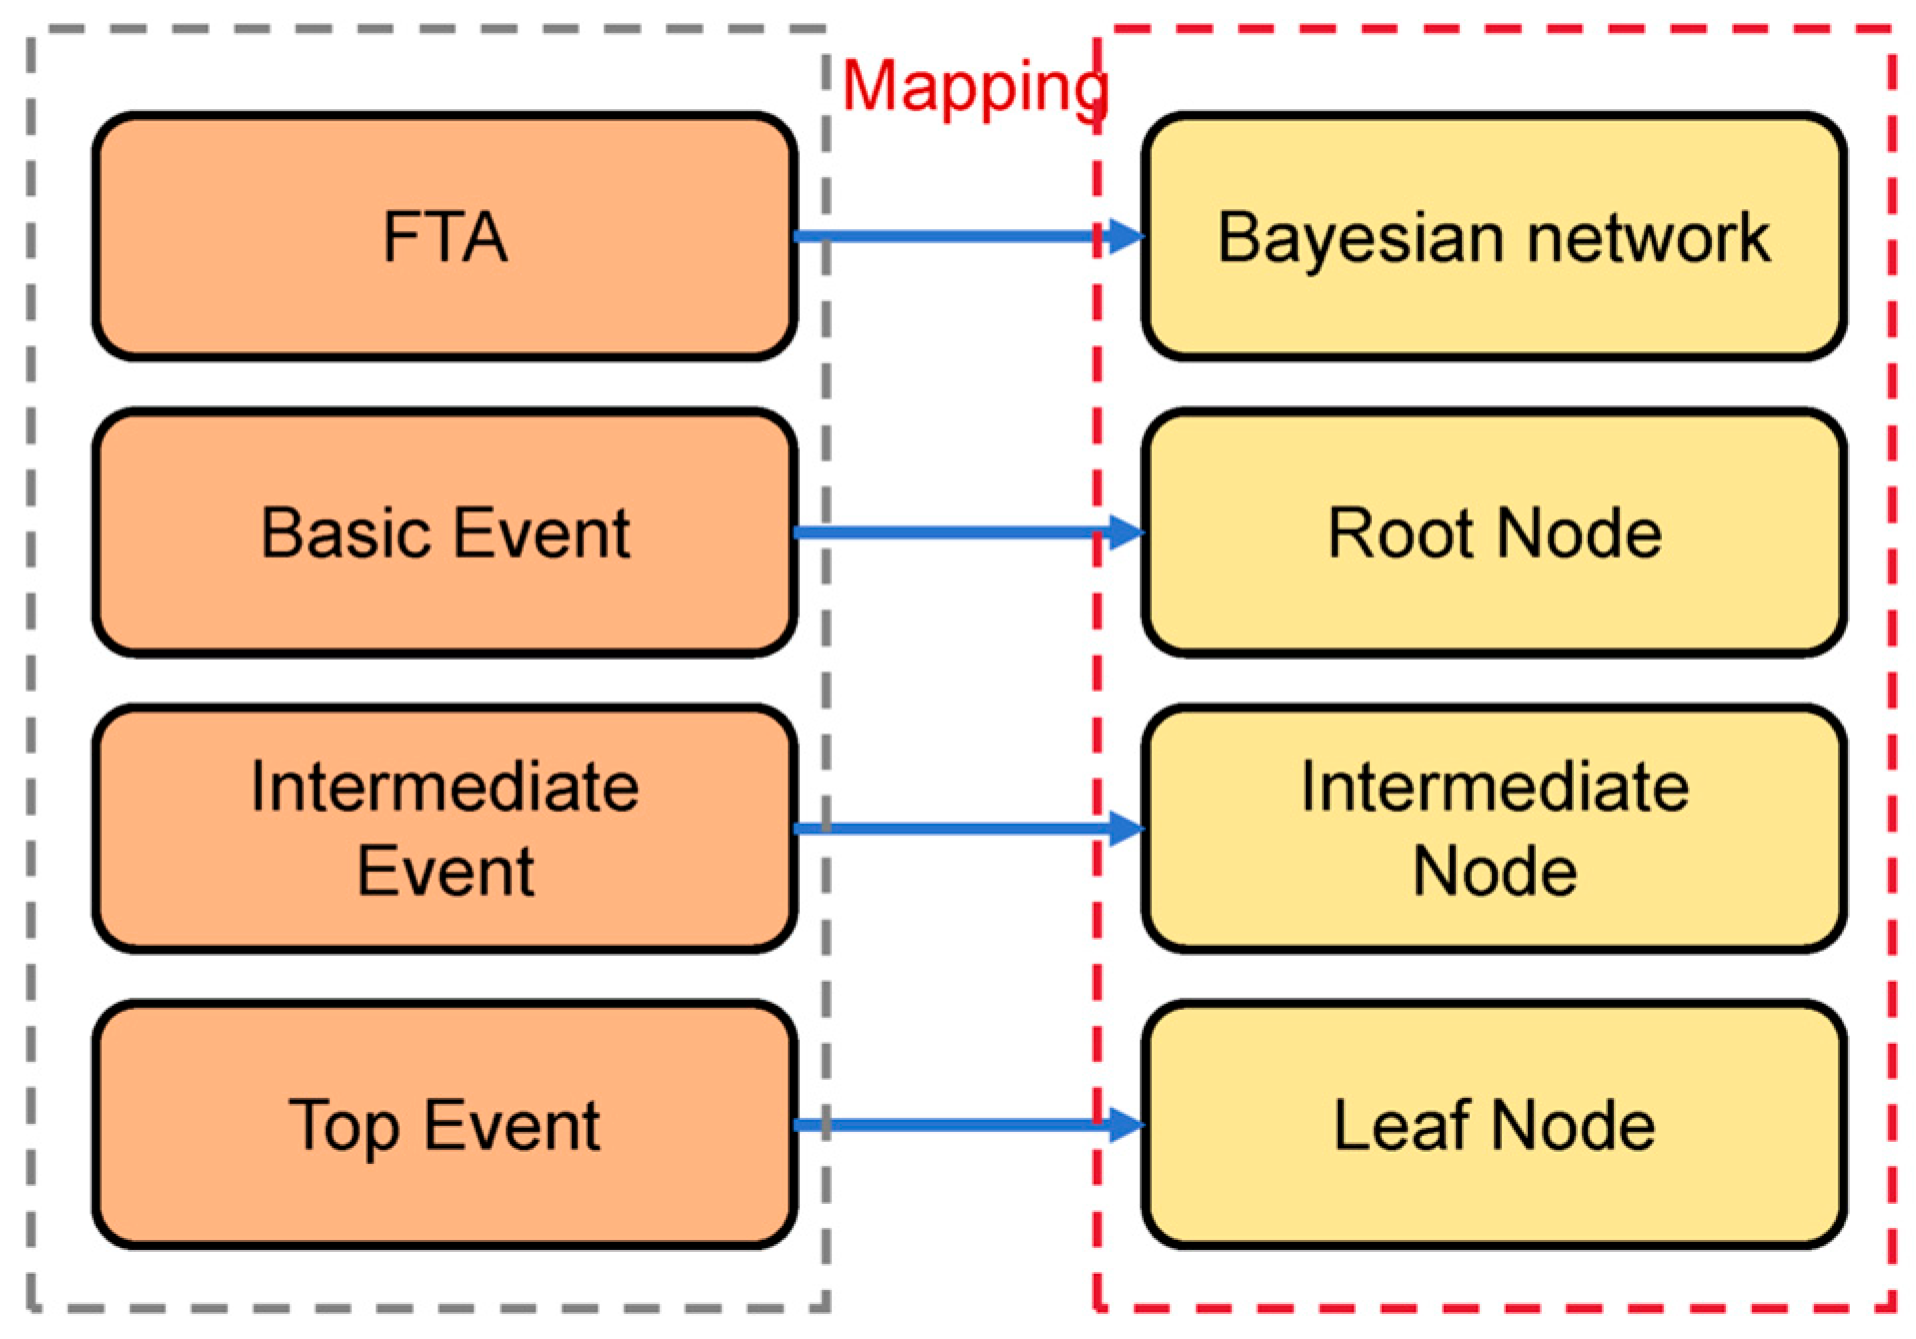
As illustrated in Figure 3, this mapping process follows systematic conversion rules:
  • The top event and basic events in the FTA are transformed into the leaf node and the root nodes in the BN, respectively.
  • The logic gates in the FTA (e.g., AND and OR gates) are converted into conditional probability tables (CPTs) within the BN. These CPTs define the dependency relationships between parent and child nodes.
  • For instance, an AND gate is equivalent to a deterministic probabilistic relationship: the child node has a probability of 1 of occurring only if all parent nodes are in the “occurred” state; otherwise, the probability is 0. Through this structured mapping, the explicit logical relationships from the fault tree are fully embedded within the graphical structure of the Bayesian network. The direct translation of logic gates (AND/OR) from deterministic Fault Tree Analysis (FTA) into binary Conditional Probability Tables (CPTs) significantly simplifies the modeling process, yet it inherently assumes that causal relationships are perfect and static. In reality, relationships between failure events often involve uncertainty, partial failures, or temporal sequences, aspects that Boolean logic struggles to fully capture. While the current strategy provides a clear and user-friendly foundation for our probabilistic model, future considerations may involve introducing dynamic Bayesian networks or fuzzy CPTs to more accurately portray these complex relationships.

2.2.4. A Prior Probability Calculation Method Based on Fuzzy Comprehensive Evaluation

Deriving prior probabilities for nodes in a Bayesian Network (BN) model of an energy storage station typically relies on extensive historical statistical data. However, the field of deflagration risk analysis for electrochemical energy storage stations faces a scarcity of such data, owing to the industry’s relatively short development history and insufficient accumulation of accident records, making it difficult to obtain ample and reliable empirical evidence. To address this issue, this study employs an integrated approach combining fuzzy set theory and expert judgment to systematically estimate the occurrence probabilities of basic events. By converting expert knowledge into fuzzy linguistic variables, the method effectively reduces the uncertainty and randomness inherent in subjective evaluations, thereby enhancing the reliability of the probability assessment. The fuzzy comprehensive evaluation method comprises the following key steps:
  • Determination of Expert Weights: Expert weights are assigned using the Analytic Hierarchy Process (AHP), based on four criteria: professional title, educational background, work experience, and domain relevance;
  • Design of the Linguistic Term Set: A standardized set of linguistic expressions (e.g., “Very High”, “High”) is defined, with each term mapped to a corresponding trapezoidal fuzzy number;
  • Aggregation of Expert Evaluations: The fuzzy evaluations provided by multiple experts are aggregated into a comprehensive fuzzy number through a weighted averaging process;
  • The specific implementation details of this methodology will be elaborated in Section 3.3, integrated with the deflagration risk model for the energy storage station.

3. Deflagration Risk Assessment and Model Construction for Energy Storage Station

3.1. Risk Identification and Fault Tree Construction

3.1.1. Risk Identification Process

Risk identification forms the basis of risk assessment, with the objective of systematically identifying potential incidents and tracing their root causes and contributing factors [26]. This is achieved through a structured knowledge-processing workflow. In this study, the risk factors associated with deflagration incidents in energy storage power stations are analyzed by considering four essential preconditions: an ignition source, combustible material, an oxidizing agent, and a confined space. This framework finds its roots in the core principles of combustion and explosion—the renowned “fire triangle”—which has been broadened to encompass deflagration hazards in enclosed settings. While established industry benchmarks like NFPA 855 [27] and GB/T 42288 [28] may not expressly detail these four elements, their technical stipulations—encompassing facets like ventilation system planning, detection of flammable gases, deployment of explosion-resistant pressure relief mechanisms, and fire compartmentalization—are fundamentally geared towards governing these four factors to avert concurrent incidents. Recent inquiries into lithium-ion battery thermal runaway additionally affirm the pivotal significance of gas aggregation, confinement, and ignition sources in amplifying deflagration risks [29,30]. Based on this theoretical foundation, we developed an indicator system to operationalize the four prerequisites for assessing deflagration risk in electrochemical energy storage stations. This system, detailed in Table 1, comprises 4 first-level, 9 second-level, and 43 third-level indicators.
The 43 third-level indicators (Table 1) were identified through a comprehensive multi-source information synthesis process. These indicators were derived from: (1) a systematic analysis of publicly reported failure incidents in battery energy storage systems (Table 2), capturing typical real-world accident causes; (2) insights from practical engineering experience and expert judgment obtained via structured workshops and interviews; (3) a review of standard operational and maintenance checklists used in routine safety inspections of energy storage facilities. This approach ensured the final set of risk factors was both empirically grounded and systematically structured, effectively linking historical accident patterns with potential failure modes identified by domain experts.
It is important to highlight that specific foundational environmental conditions, such as the existence of atmospheric oxygen, are not individually itemized as third-level events. These factors are acknowledged as consistent background requirements for combustion and are thus not categorized as variable risk elements. The emphasis is directed towards engineering aspects that have the potential to falter or diverge from intended design, such as instances of ventilation system malfunctions leading to the introduction of excessive oxygen or failures in inerting systems.

3.1.2. Fault Tree Construction

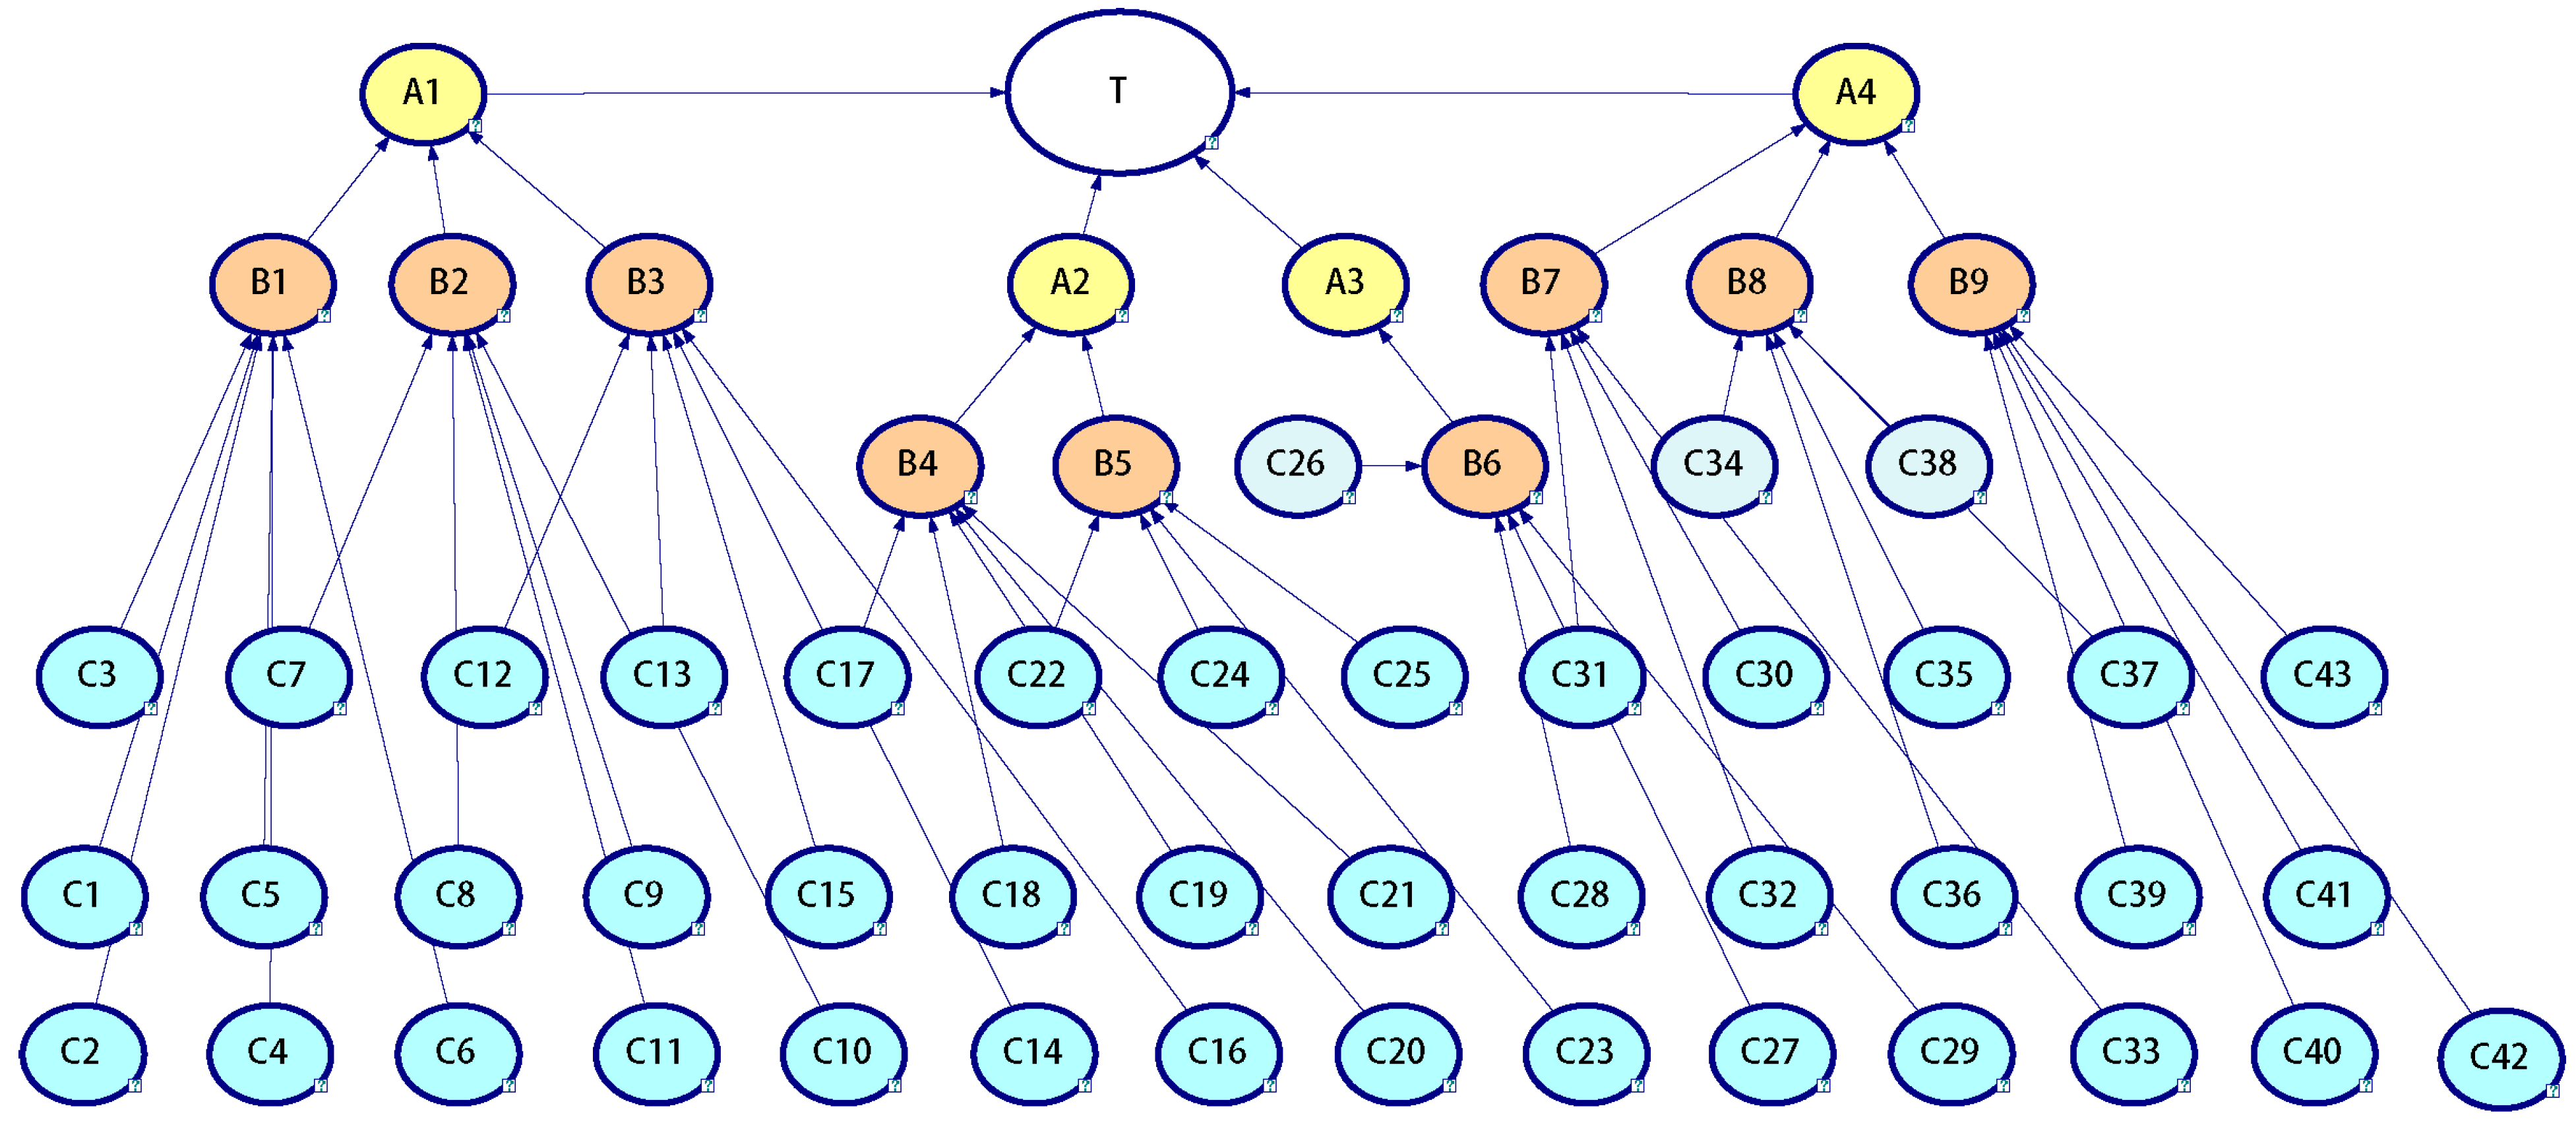
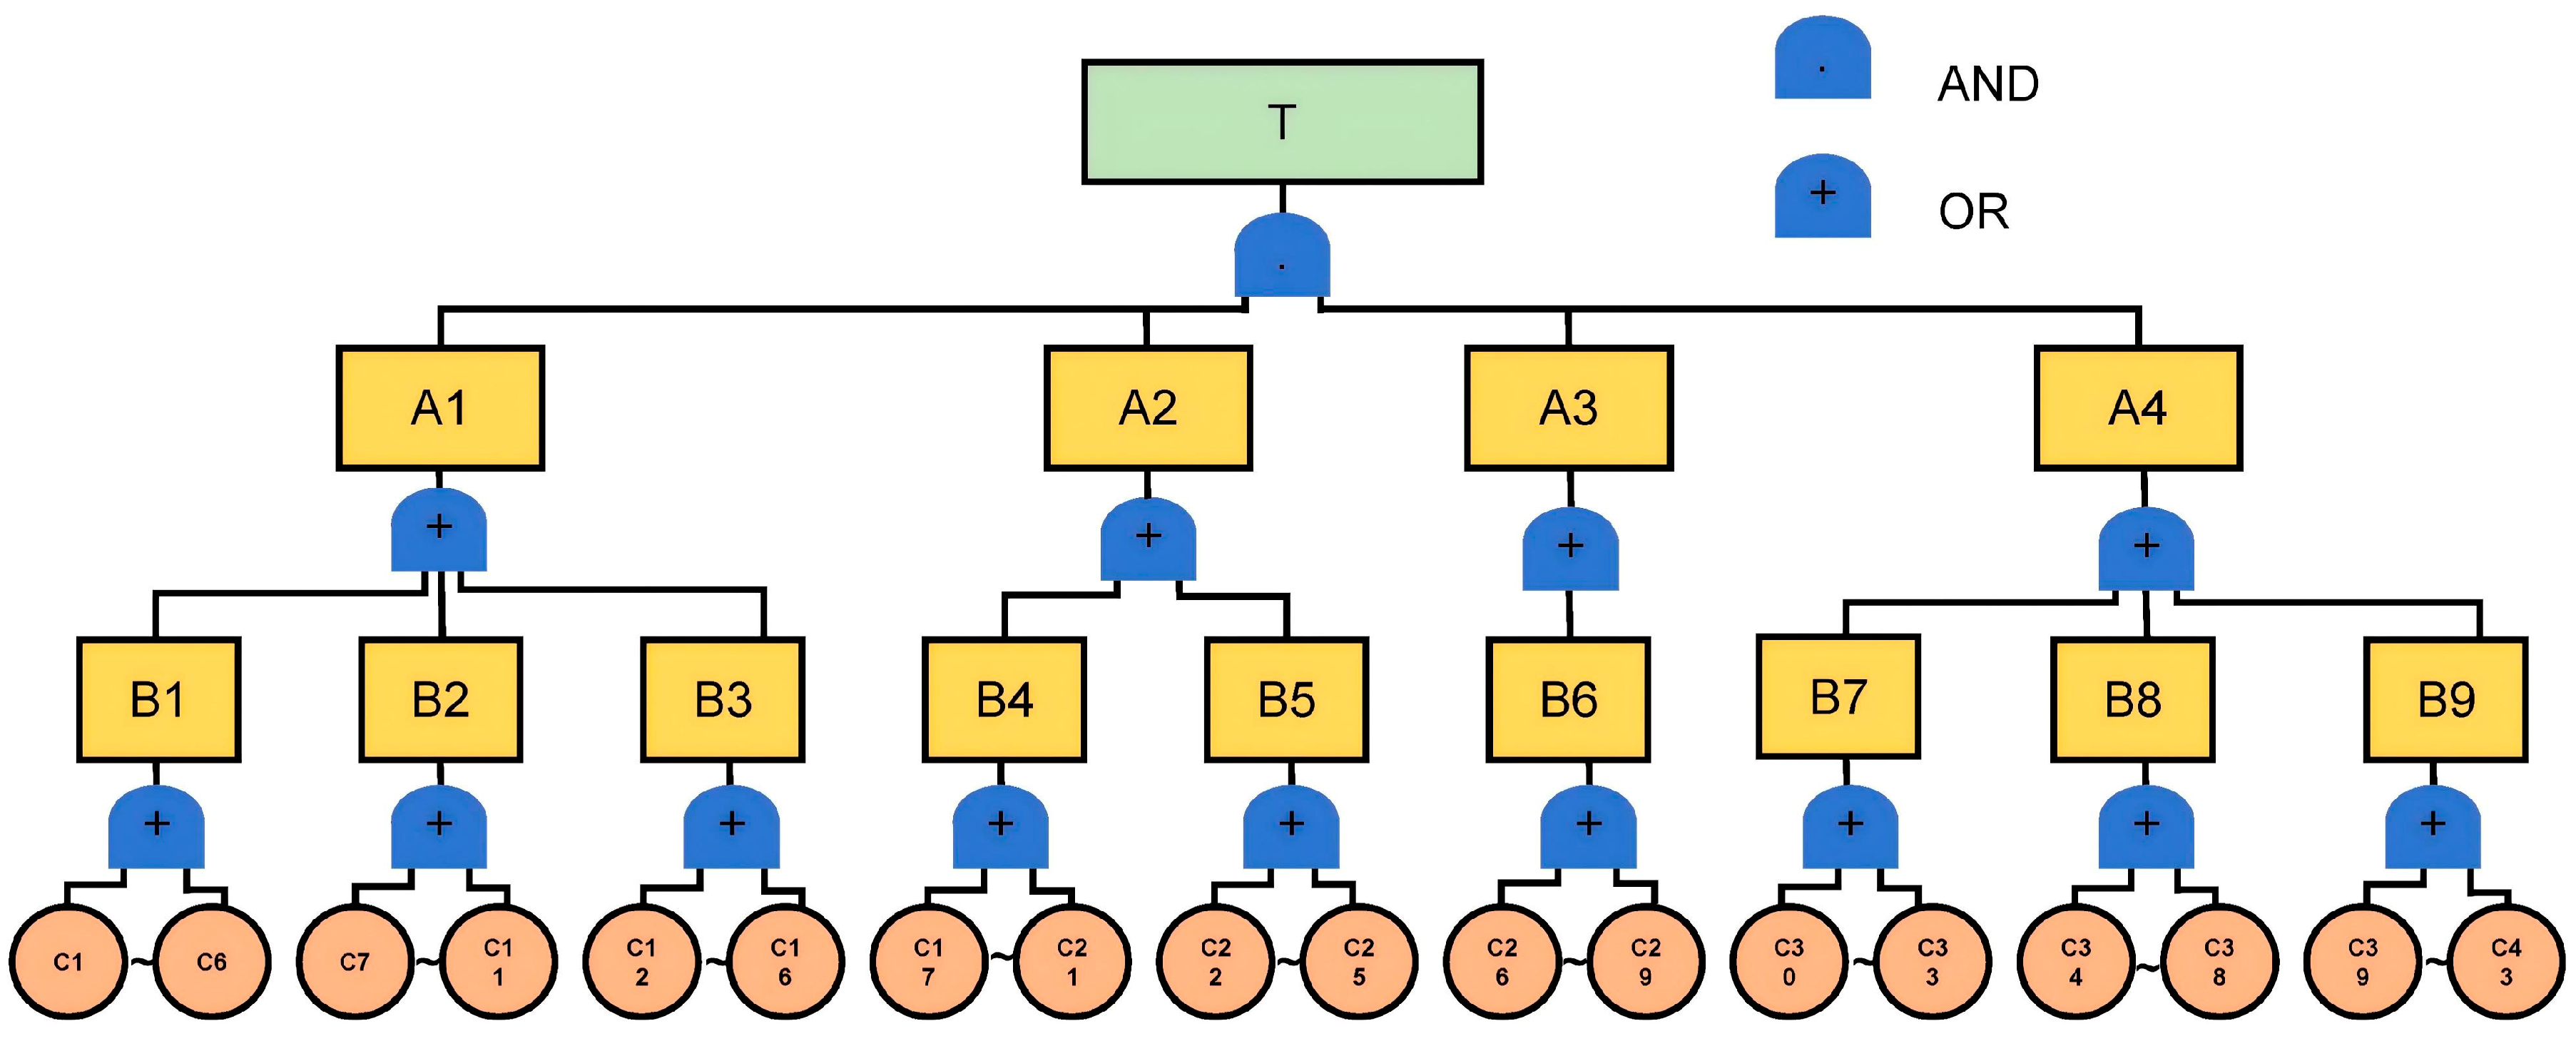
Based on the deflagration risk indicator system for electrochemical energy storage stations established in Section 3.1.1, the logical evolution of deflagration accidents was modeled graphically using Fault Tree Analysis (FTA). The fault tree is constructed with Deflagration in an electrochemical energy storage station as the top event. The analysis then systematically traces downward through the four necessary conditions for deflagration (ignition source, combustible material, oxidizing agent, and confined space). Through logic gates such as AND and OR, the intermediate events are linked to the underlying basic events (corresponding to the 43 third-level indicators). This structure clearly delineates the complete causal chains and failure paths from various initial faults to the eventual deflagration. The fault tree model not only intuitively illustrates the logical dependencies among risk factors but also provides a clear structural foundation for the subsequent probabilistic mapping to a Bayesian network (Figure 4).

3.2. Bayesian Network Model Mapping

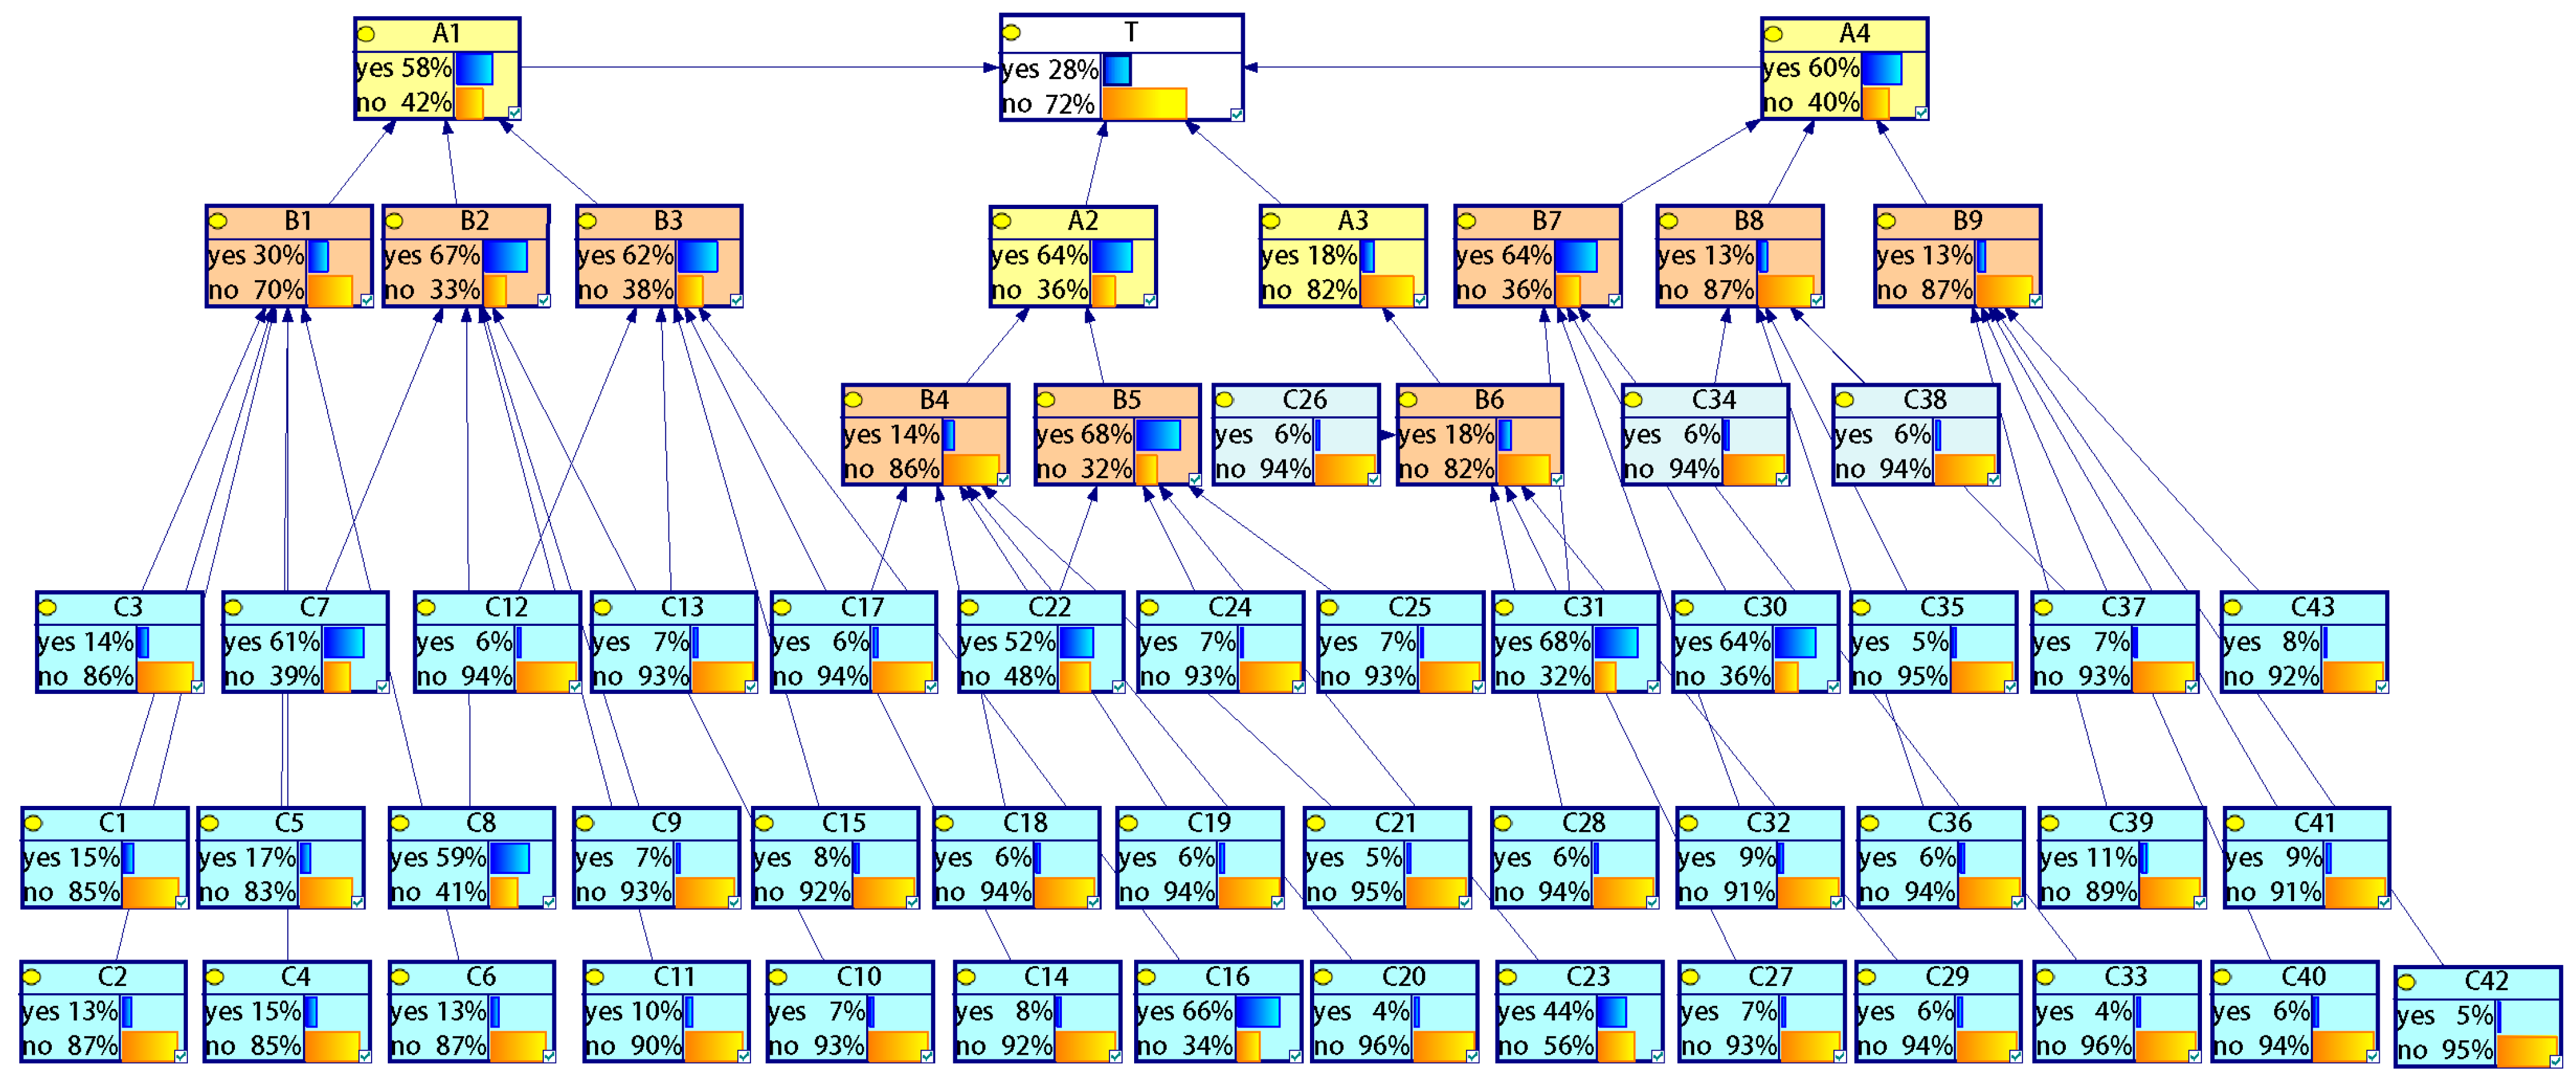
Deflagration risk in electrochemical energy storage stations is characterized by multi-factor coupling, rapid escalation, and high unpredictability. Fundamentally, a deflagration is the outcome of the instantaneous interaction of four necessary components: combustible material, an oxidizing agent, an effective ignition source, and a confined space. Leveraging the pre-constructed fault tree, this research translates it systematically into a Bayesian network to facilitate probabilistic inference under uncertainty. The model was built and parameterized using the GeNIe software (University of Pittsburgh Decision Systems Laboratory), which provides efficient inference algorithms for managing probabilistic dependencies in complex Bayesian networks. The finalized Bayesian network, depicted in Figure 5, forms the computational foundation for conducting both forward prediction and backward diagnostic analysis.

3.3. The Prior Probability Determination of Root Node Based on Fuzzy Theory

To address the scarcity of historical failure data, this study employs a fuzzy comprehensive evaluation method that integrates expert judgment with fuzzy set theory. This approach systematically quantifies linguistic assessments into precise prior probabilities for the root nodes (basic events) in the Bayesian network. The core of the expert evaluation is to determine the failure likelihood for each basic event (C1–C43). Experts were provided with a reference scenario: a typical large-scale energy storage power station compliant with current safety standards (e.g., GB/T 42288). Crucially, the evaluation does not assume perfect system operation. Instead, experts were asked to quantify the probability that specific safety functions or components in such a system might fail or degrade in practice due to manufacturing defects, aging, inadequate maintenance, or operational errors. Thus, the risks in this model originate from potential deviations from the system’s designed and compliant state during its lifecycle.

3.3.1. Determination of Expert Weights

The fuzzy comprehensive evaluation begins with the determination of individual expert weights to account for their differing levels of expertise. This is achieved by employing the Analytic Hierarchy Process (AHP) to compare the relative importance of the four predefined competency criteria.
Firstly, AHP is used to compare the relative importance of four predefined competency criteria. Based on the collective judgment of the expert panel, a pairwise comparison matrix A was constructed as shown in Table 3, where the element aij represents the relative importance of criterion i with respect to criterion j.
Table 3 can be further written in matrix form as follows:
A = [ 1 2 1 / 2 1 / 4 1 / 2 1 1 / 3 1 / 6 2 3 1 1 / 2 4 6 2 1 ]
The principal eigenvector of the pairwise comparison matrix was calculated and normalized to derive the eigenvector W of the criteria:
W = [ 0.140 0.081 0.260 0.520 ]
The principal eigenvalue of the corresponding matrix in Equation (5) is calculated as follows:
λ max = 1 n i = 1 n ( A W ) i W i
where n represents the order of the matrix, A is the pairwise comparison matrix, W denotes the weight vector, and λmax represents the principal eigenvalue.
To ensure the logical consistency of the judgment matrix, a consistency check was performed. The Consistency Ratio (CR) is calculated as follows:
C I = λ max n n 1 ,   C R = C I R I
where λmax is the principal eigenvalue, CI is the consistency index, RI is the random index, and n is the matrix order. The calculated CR was 0.0038, which is below the acceptable threshold of 0.10, confirming the rationality of the pairwise comparisons. The resultant weights for the four criteria are listed as “AHP Weight” (wk) in Table 4.
Second, predefined scoring scales were established within each criterion to translate an expert’s credentials into a quantitative score. These “Intra-dimension Scores” are standardized values (e.g., Senior Engineer = 1.0, Master’s degree = 0.8) as detailed in Table 4.
Finally, the comprehensive weight wi for an individual expert is calculated using a weighted arithmetic mean model, which linearly combines the standardized scores across all dimensions according to their relative importance. The model computes a raw competency score for each expert by summing the product of each dimension score and its corresponding AHP weight, and then normalizes these scores across all experts to obtain the final weights:
w i = k = 1 4 w k × S i , k j = 1 N ( k = 1 4 w k × S j , k )
where Si,k is expert i’s score in criterion k (from Table 4), wk is the AHP weight for criterion k, and N is the total number of experts. This approach ensures that an expert’s comprehensive weight reflects a linear combination of their performance across all criteria, with each criterion weighted according to its predetermined importance.
The intra-dimension scores were assigned based on a combination of industry practice and expert consultation, reflecting the relative competency differentials between adjacent levels within each criterion. These standardized scores enable the quantitative integration of qualitative expert profiles.
Based on the above evaluation framework, a panel of ten experts with diverse professional backgrounds was assembled to participate in the risk assessment. The choice of a ten-member expert panel follows established conventions in judgment-based risk assessment methodologies. This panel size is deemed adequate for capturing a range of professional perspectives while remaining operationally feasible for the fuzzy aggregation process, focusing on achieving informational saturation concerning risk factors rather than statistical representation through a large sample size. The basic information of these experts is summarized in Table 5, detailing their qualifications across the four criteria: professional title, educational background, work experience, and domain relevance. This diverse panel includes senior engineers and technicians, experts with doctorates to college diplomas, and individuals with a wide range of work experience (from less than 5 years to over 20 years). Crucially, all experts possess a certain degree of domain relevance to electrochemical energy storage station safety, with several rated as “Very Relevant”. The composition of this panel ensures a multi-perspective and balanced assessment, mitigating the potential bias from any single profile. Their individual comprehensive weights wi were subsequently calculated using Equation (9) and the scores from Table 4, which were then used to aggregate their linguistic judgments in the following sections.
The sensitivity of the model’s outputs to variations in expert weights is critical for ensuring robustness. While a detailed quantitative sensitivity analysis of the weight values could be a promising direction for future research, our current methodology incorporates a crucial feature to address this concern: the fuzzy aggregation process. This process does not reduce the weighted judgments to a single crisp probability; instead, it generates a composite fuzzy number where the width of the membership function explicitly represents the diversity of opinions within the expert panel. As a result, the uncertainty stemming from the weighting and judgment process—a significant potential bias factor—is retained and quantified as epistemic uncertainty in the fuzzy prior. This uncertainty is then propagated through the Bayesian network, ensuring that the outcomes reflect a range of credible expert inputs rather than a single, potentially fragile weighted average.
Prior to conducting the formal fuzzy language assessment, a specialized workshop was organized for the expert panel. The workshop had two primary objectives: firstly, to establish a standardized reference system scenario for the assessment; and secondly, to review and refine the descriptions of the 43 basic events outlined in Table 1. In alignment with the fault tree logic depicted in Figure 4, the experts collaborated to develop a coherent understanding of the technical definitions and scopes of each event being evaluated. This rigorous step played a crucial role in mitigating potential evaluation biases arising from differing interpretations.

3.3.2. Fuzzy Linguistic Assessment and Aggregation

Following the determination of their individual weights, the expert panel described in Table 5 was invited to assess the occurrence likelihood of each basic event using the linguistic scale provided in Table 6. In line with the finding that human discriminative ability is effective within 5 to 9 intervals [15], a set of seven linguistic terms was adopted: L = {Very High (VH), High (H), Moderately High (MH), Medium (M), Moderately Low (ML), Low (L), Very Low (VL)}. Each term corresponds to a trapezoidal fuzzy number (TrFN), defined by a quadruplet (a, b, c, d).
The seven-level linguistic scale and the corresponding trapezoidal fuzzy numbers shown in Table 6 follow the standard practice in fuzzy risk assessment literature [19,31]. This design, which ensures appropriate overlaps between adjacent terms across the probability space [0, 1], explicitly represents the inherent vagueness in expert linguistic judgments.
In this study, a panel of experts was invited to assess each basic event using the linguistic scale in Table 6. For a given event, each expert’s linguistic assessment was first converted into its corresponding TrFN. The evaluations from N experts were then aggregated into a composite TrFN A using the fuzzy weighted average, as shown in Equation (10).
A ˜ = i = 1 n w i R ˜ i = ( i = 1 n w i a i , i = 1 n w i b i , i = 1 n w i c i , i = 1 n w i d i )
where R ˜ i = (ai, bi, ci, di) is the TrFN from the i-th expert, wi is their comprehensive weight, and i = 1 n w i = 1.

3.3.3. Defuzzification to Obtain Crisp Probabilities

The aggregated composite fuzzy number A = (a, b, c, d) was then converted into a precise crisp value P* via the center of area (COA) defuzzification method. For a trapezoidal fuzzy number, the COA formula simplifies to:
P * = x μ A ˜ ( x ) d x μ A ˜ ( x ) d x = ( d + c ) 2 c d ( a + b ) 2 + a b 3 ( d + c a b )
where P* is the defuzzification value and μ A ˜ ( x ) is the membership function of fuzzy. The a, b, c, and d represent the lower bound, left core point, right core point, and upper bound of the membership function, respectively.
This crisp value P*, derived for each basic event, serves as its prior probability of being in the “Occurred” state. In the subsequent Bayesian network model, this value is assigned as the marginal probability P(Node = Yes) for the corresponding root node. The conditional probability tables for intermediate and top events, which are mapped directly from the fault tree’s AND/OR logic gates, then govern the probabilistic propagation through the network during inference.

3.4. Deflagration Risk Inference for Electrochemical Energy Storage Station

3.4.1. Causal Reasoning

Using the prior probabilities of the root nodes derived from the fuzzy assessment, the Bayesian network performs forward (causal) reasoning. This computes the probability of each node being in its fault state (“Yes”), including the top event, “Deflagration”. The simulation yields a top-event probability of 28%. This value is a model-derived risk index for a defined reference scenario, which describes a large-scale, grid-connected lithium-ion battery energy storage facility. This scenario adheres to contemporary safety standards such as GB/T 42288 and includes key physical parameters like battery arrays housed in standard 40-foot freight container modules, a ventilation system designed for flammable gas dispersion, and the presence of deflagration-proof pressure relief devices. During the expert evaluation process, the focus was on assessing the likelihood of functional failures within this system. Experts evaluated not the perfect design, but the probability of components (such as sensors, cooling systems, relief valves) or software functions (like BMS logic) degrading or failing due to manufacturing flaws, aging, maintenance lapses, or human error, leading to deviations from the intended safe state.
The 28% probability signifies the model-estimated likelihood of deflagration initiation under the assumption of these latent failures, serving as a benchmark for relative risk analysis. It does not directly reflect real-world accident rates but provides a consistent, quantifiable measure for ranking risk factors, identifying system vulnerabilities, and evaluating the effectiveness of potential safety interventions within the model. This benchmark risk value originates from the experts’ assessments of the likelihood of functional failures, establishing a stable reference point for risk assessment. This underscores the model’s adaptability: in specific applications, actual engineering parameters and conditions can be incorporated as evidence inputs to enhance and refine this foundational assessment.
A detailed analysis of the risk propagation pathways (Figure 6) reveals that the primary risk contributors are the first-level indicators A2 (combustible materials), A4 (confined space, 60%), and A1 (ignition sources, 58%). These high-risk states are driven by their respective sub-indicators. Specifically, B5 (thermal runaway products) contributes 68% to the probability for A2 (combustible materials). The probability of B5 is primarily governed by highly flammable components such as C22 (gases ejected during thermal runaway, 52%) and C23 (electrolyte pyrolysis vapor, 44%). The mixing and accumulation of these substances in a confined space constitute the material basis for deflagration accidents. Meanwhile, B2 (battery thermal runaway, 67%) and B3 (sparks and hot surfaces, 62%) are the key drivers elevating the probability of A1. The formation of B2 can be traced back to electrochemical failure modes such as C7 (battery overcharge/over-discharge) and C8 (internal short circuit), which trigger internal chain reactions including exothermic side reactions and separator rupture, ultimately leading to thermal runaway. Additionally, B7 (physical confinement), with a 64% probability, significantly influences A4 (confined space). This highlights that inherent enclosed structures (e.g., storage containers) can cause dangerous pressure accumulation if the pressure relief design is inadequate. Such pressure buildup not only accelerates flame propagation but also increases the peak overpressure, thereby transforming a fire into a destructive deflagration.

3.4.2. Risk Diagnosis

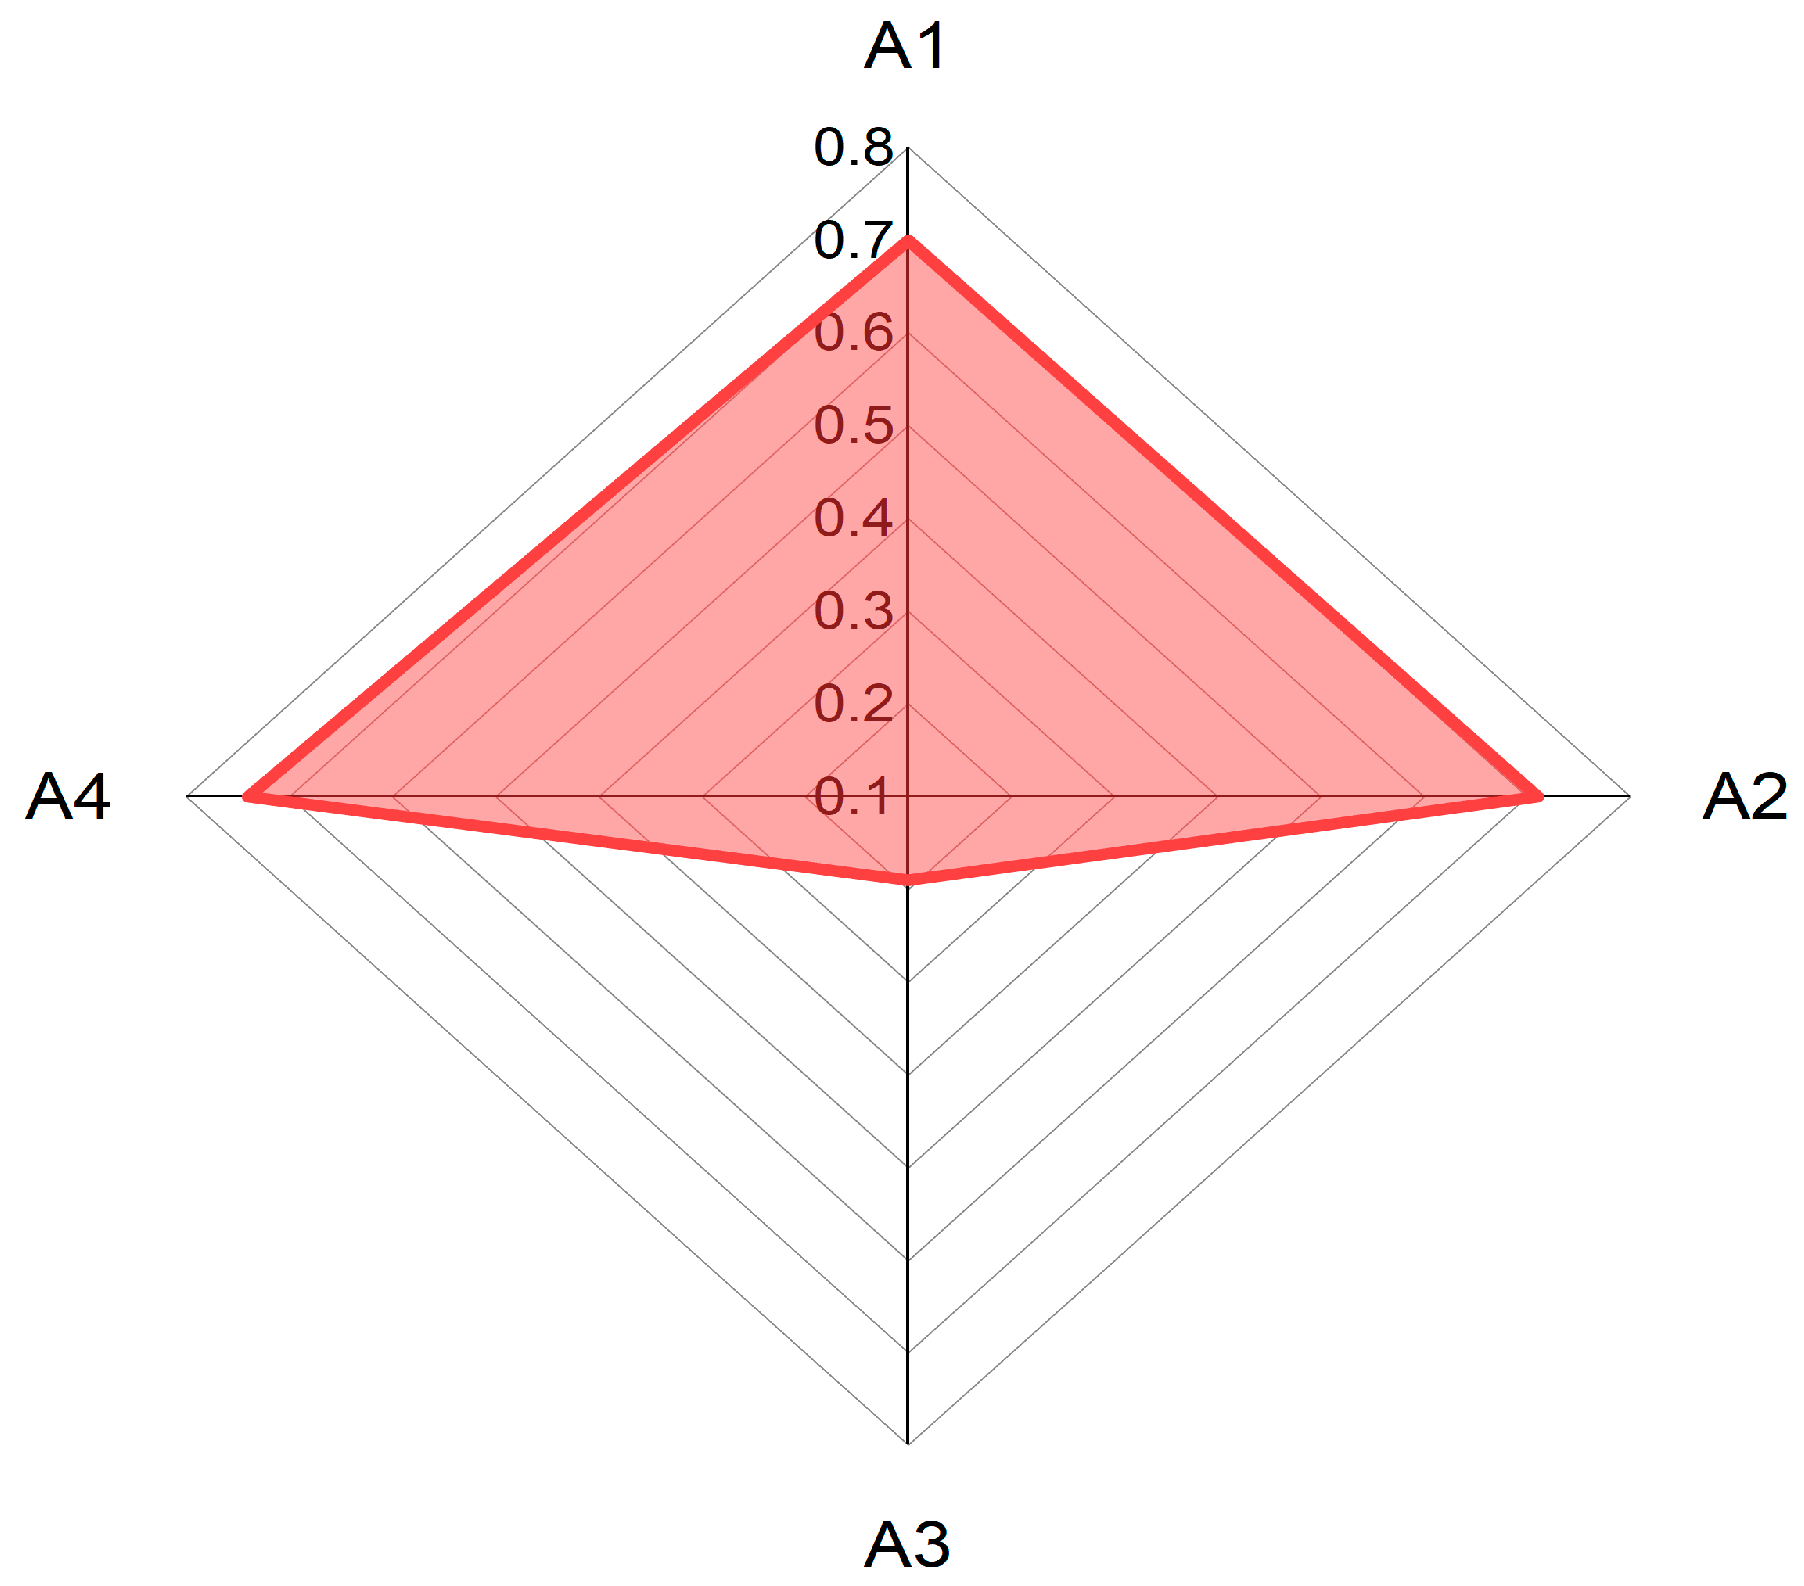
Under conditions of limited data, backward inference can be employed to evaluate the safety status of electrochemical energy storage stations with respect to deflagration accidents. Using the established Bayesian network (BN) model (Figure 6), diagnostic (backward) reasoning enables the calculation of the posterior probabilities of various risk factors given that a deflagration accident has occurred, thereby identifying the most critical contributors. As shown in Figure 7, when conditioning on the occurrence of an accident (i.e., setting the top event probability to 100%), the posterior probabilities of the first-level indicators identify the most influential risk factors as A2 (combustible materials, 74%), A4 (confined space, 71%), and A1 (ignition source, 69%). Further analysis of the posterior probabilities for the second- and third-level factors (Figure 8 and Figure 9) shows that the probabilities of several key factors exceed 50%, including B2 (battery thermal runaway), B3 (sparks and hot surfaces), B5 (thermal runaway products), B7 (physical confinement), C7 (battery overcharge/over-discharge), C8 (internal short circuit), C16 (local temperature overheating during equipment operation), C22 (gases ejected during thermal runaway), C30 (relatively enclosed energy storage container), and C31 (lack of pressure relief devices or insufficient venting area). This indicates that these factors constitute critical links in the accident chain and should be prioritized in routine inspection and maintenance.
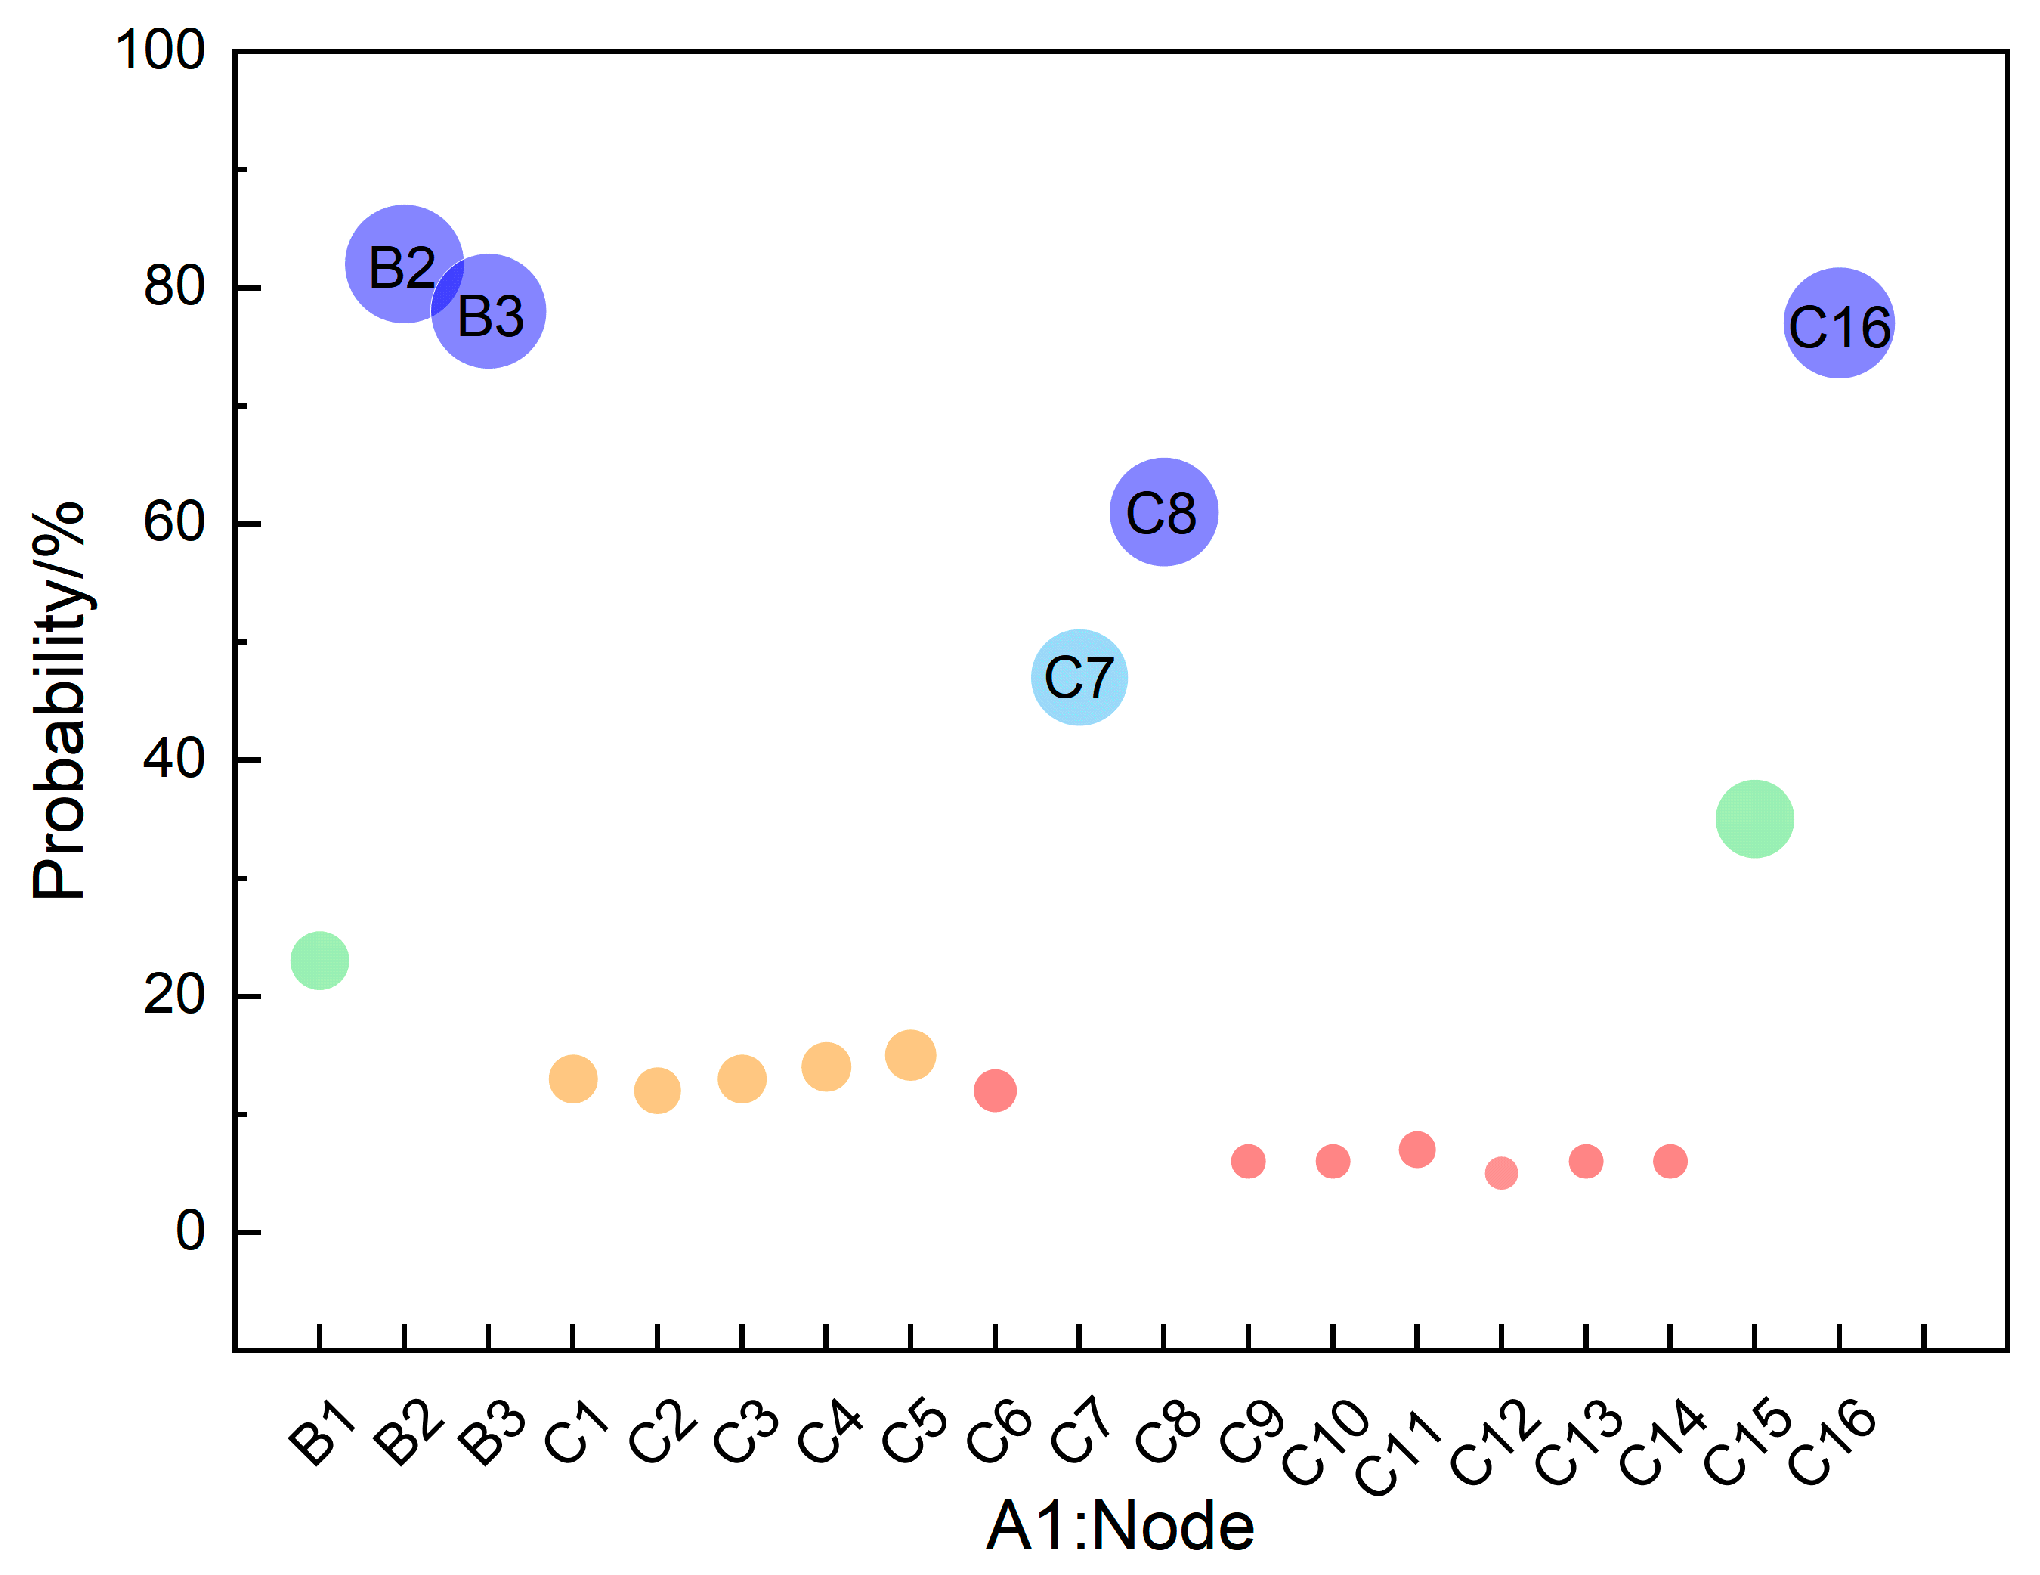
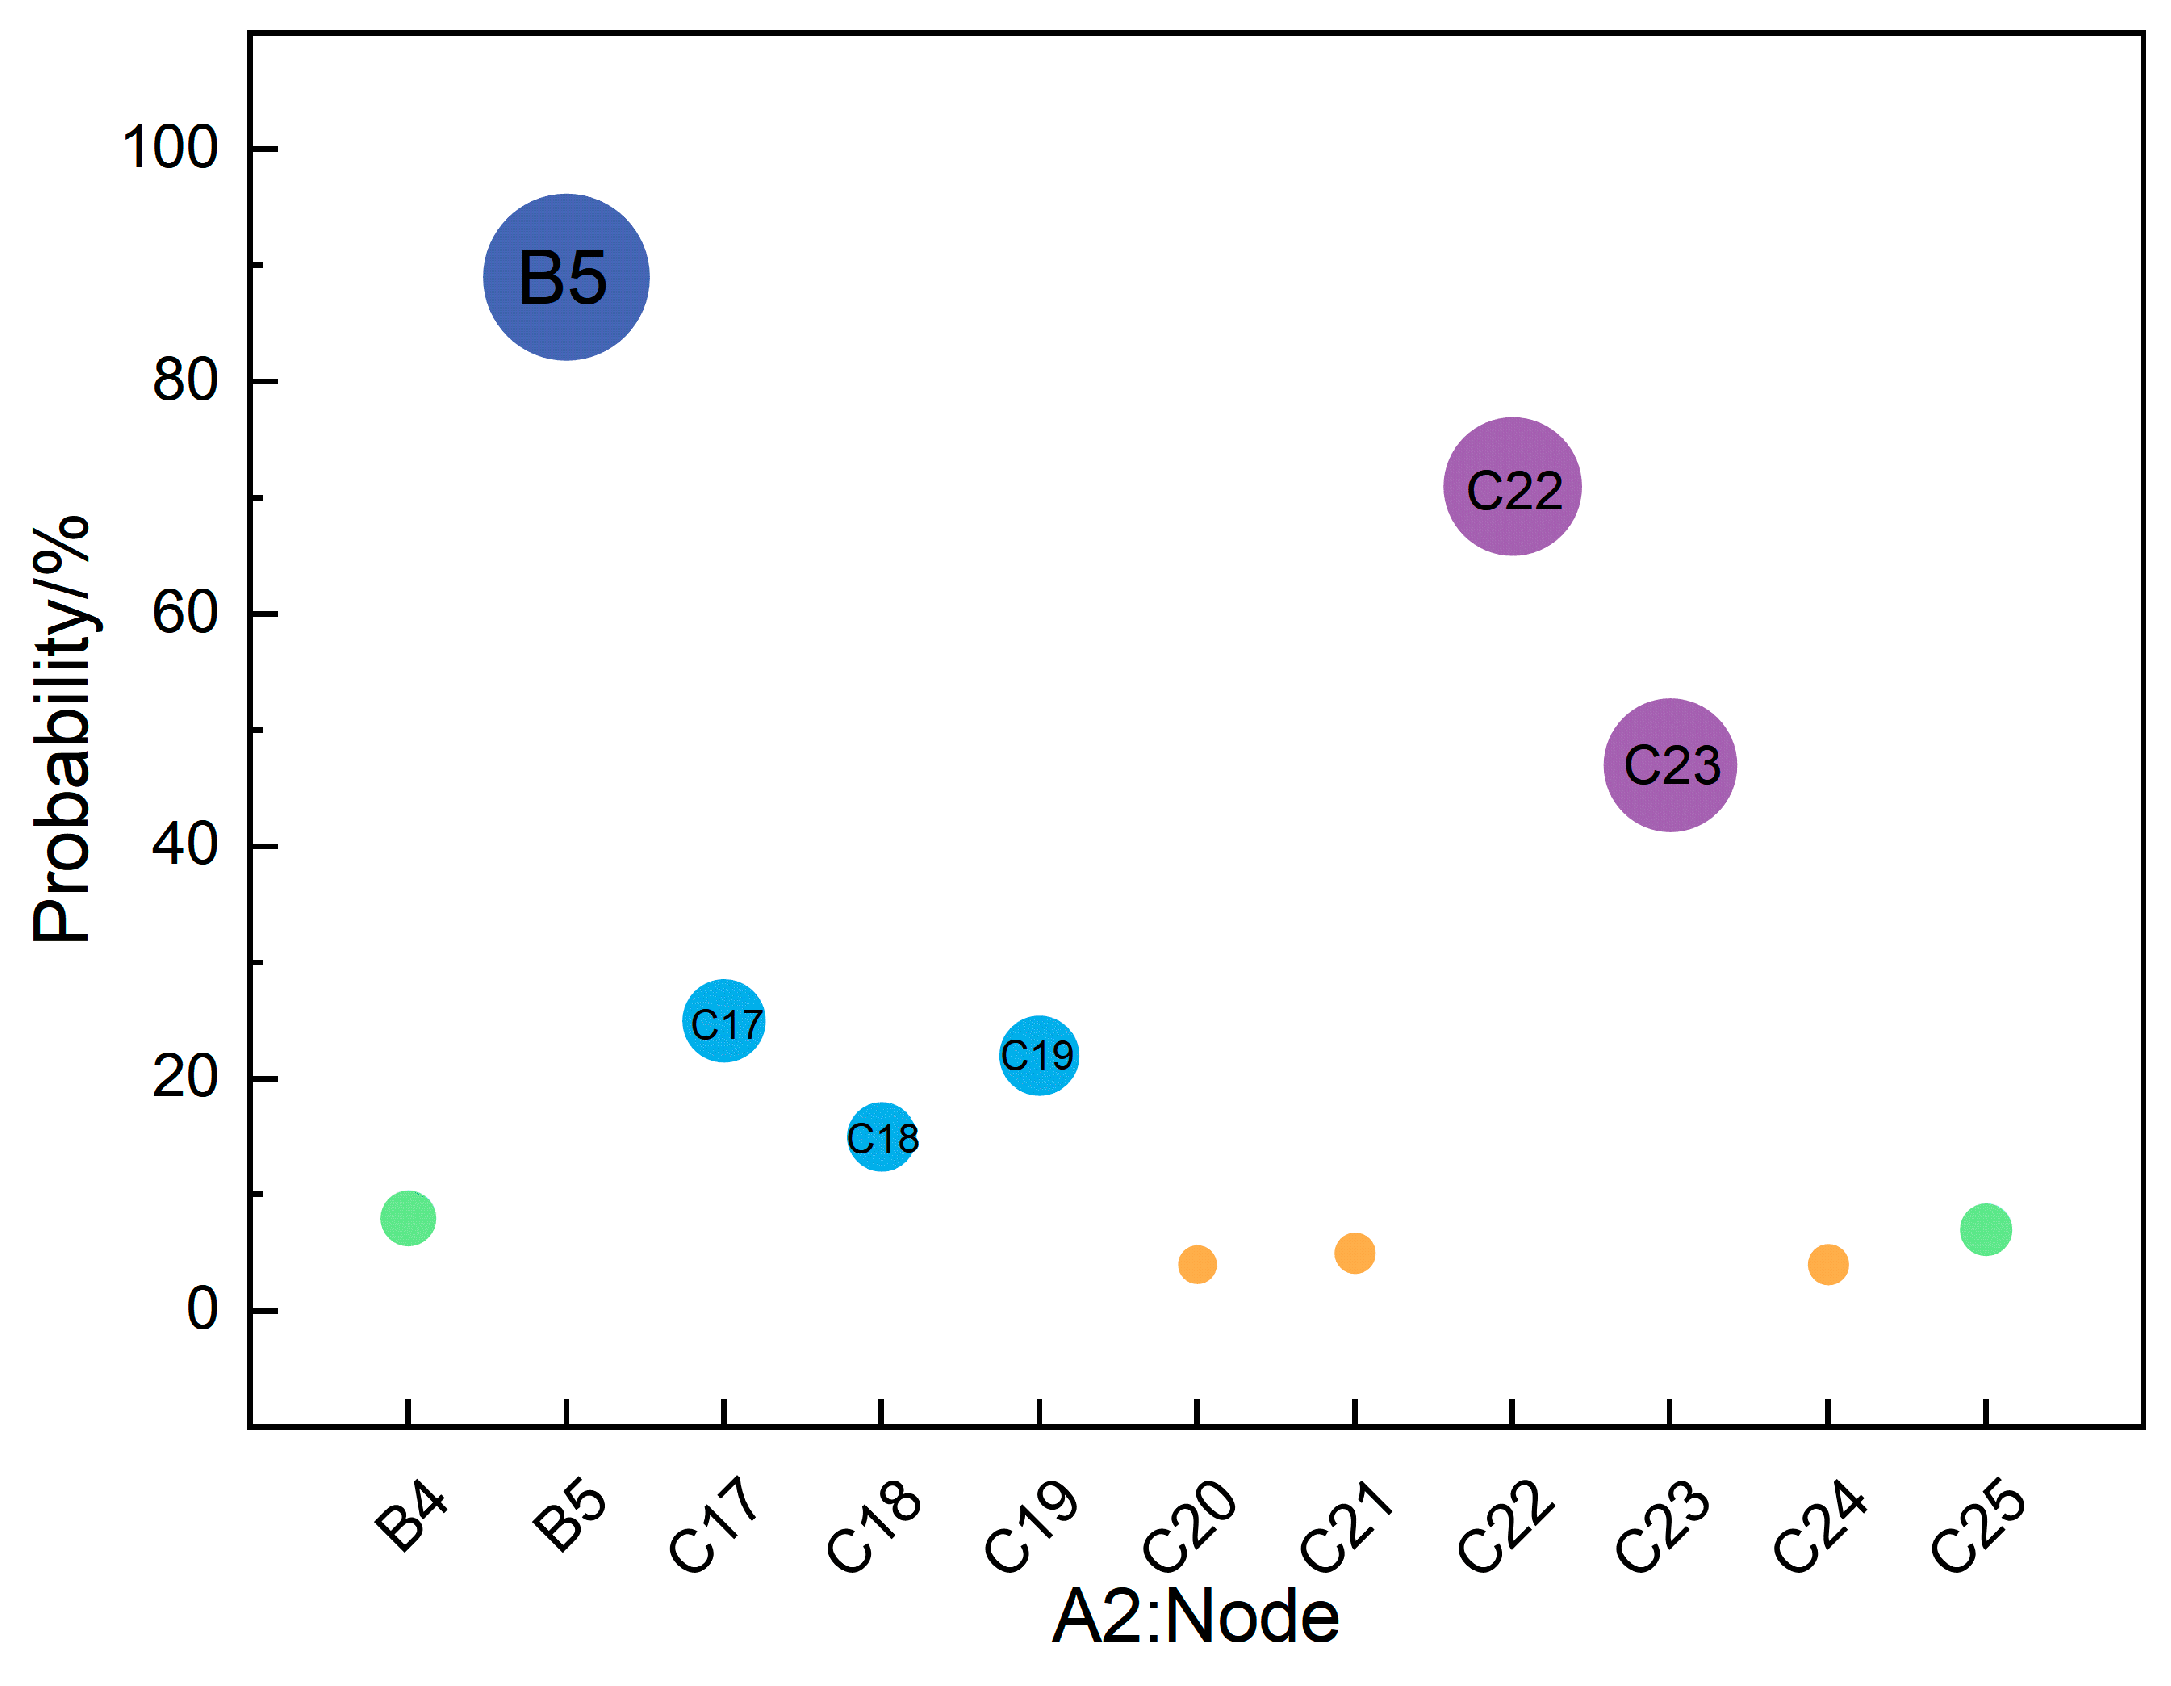
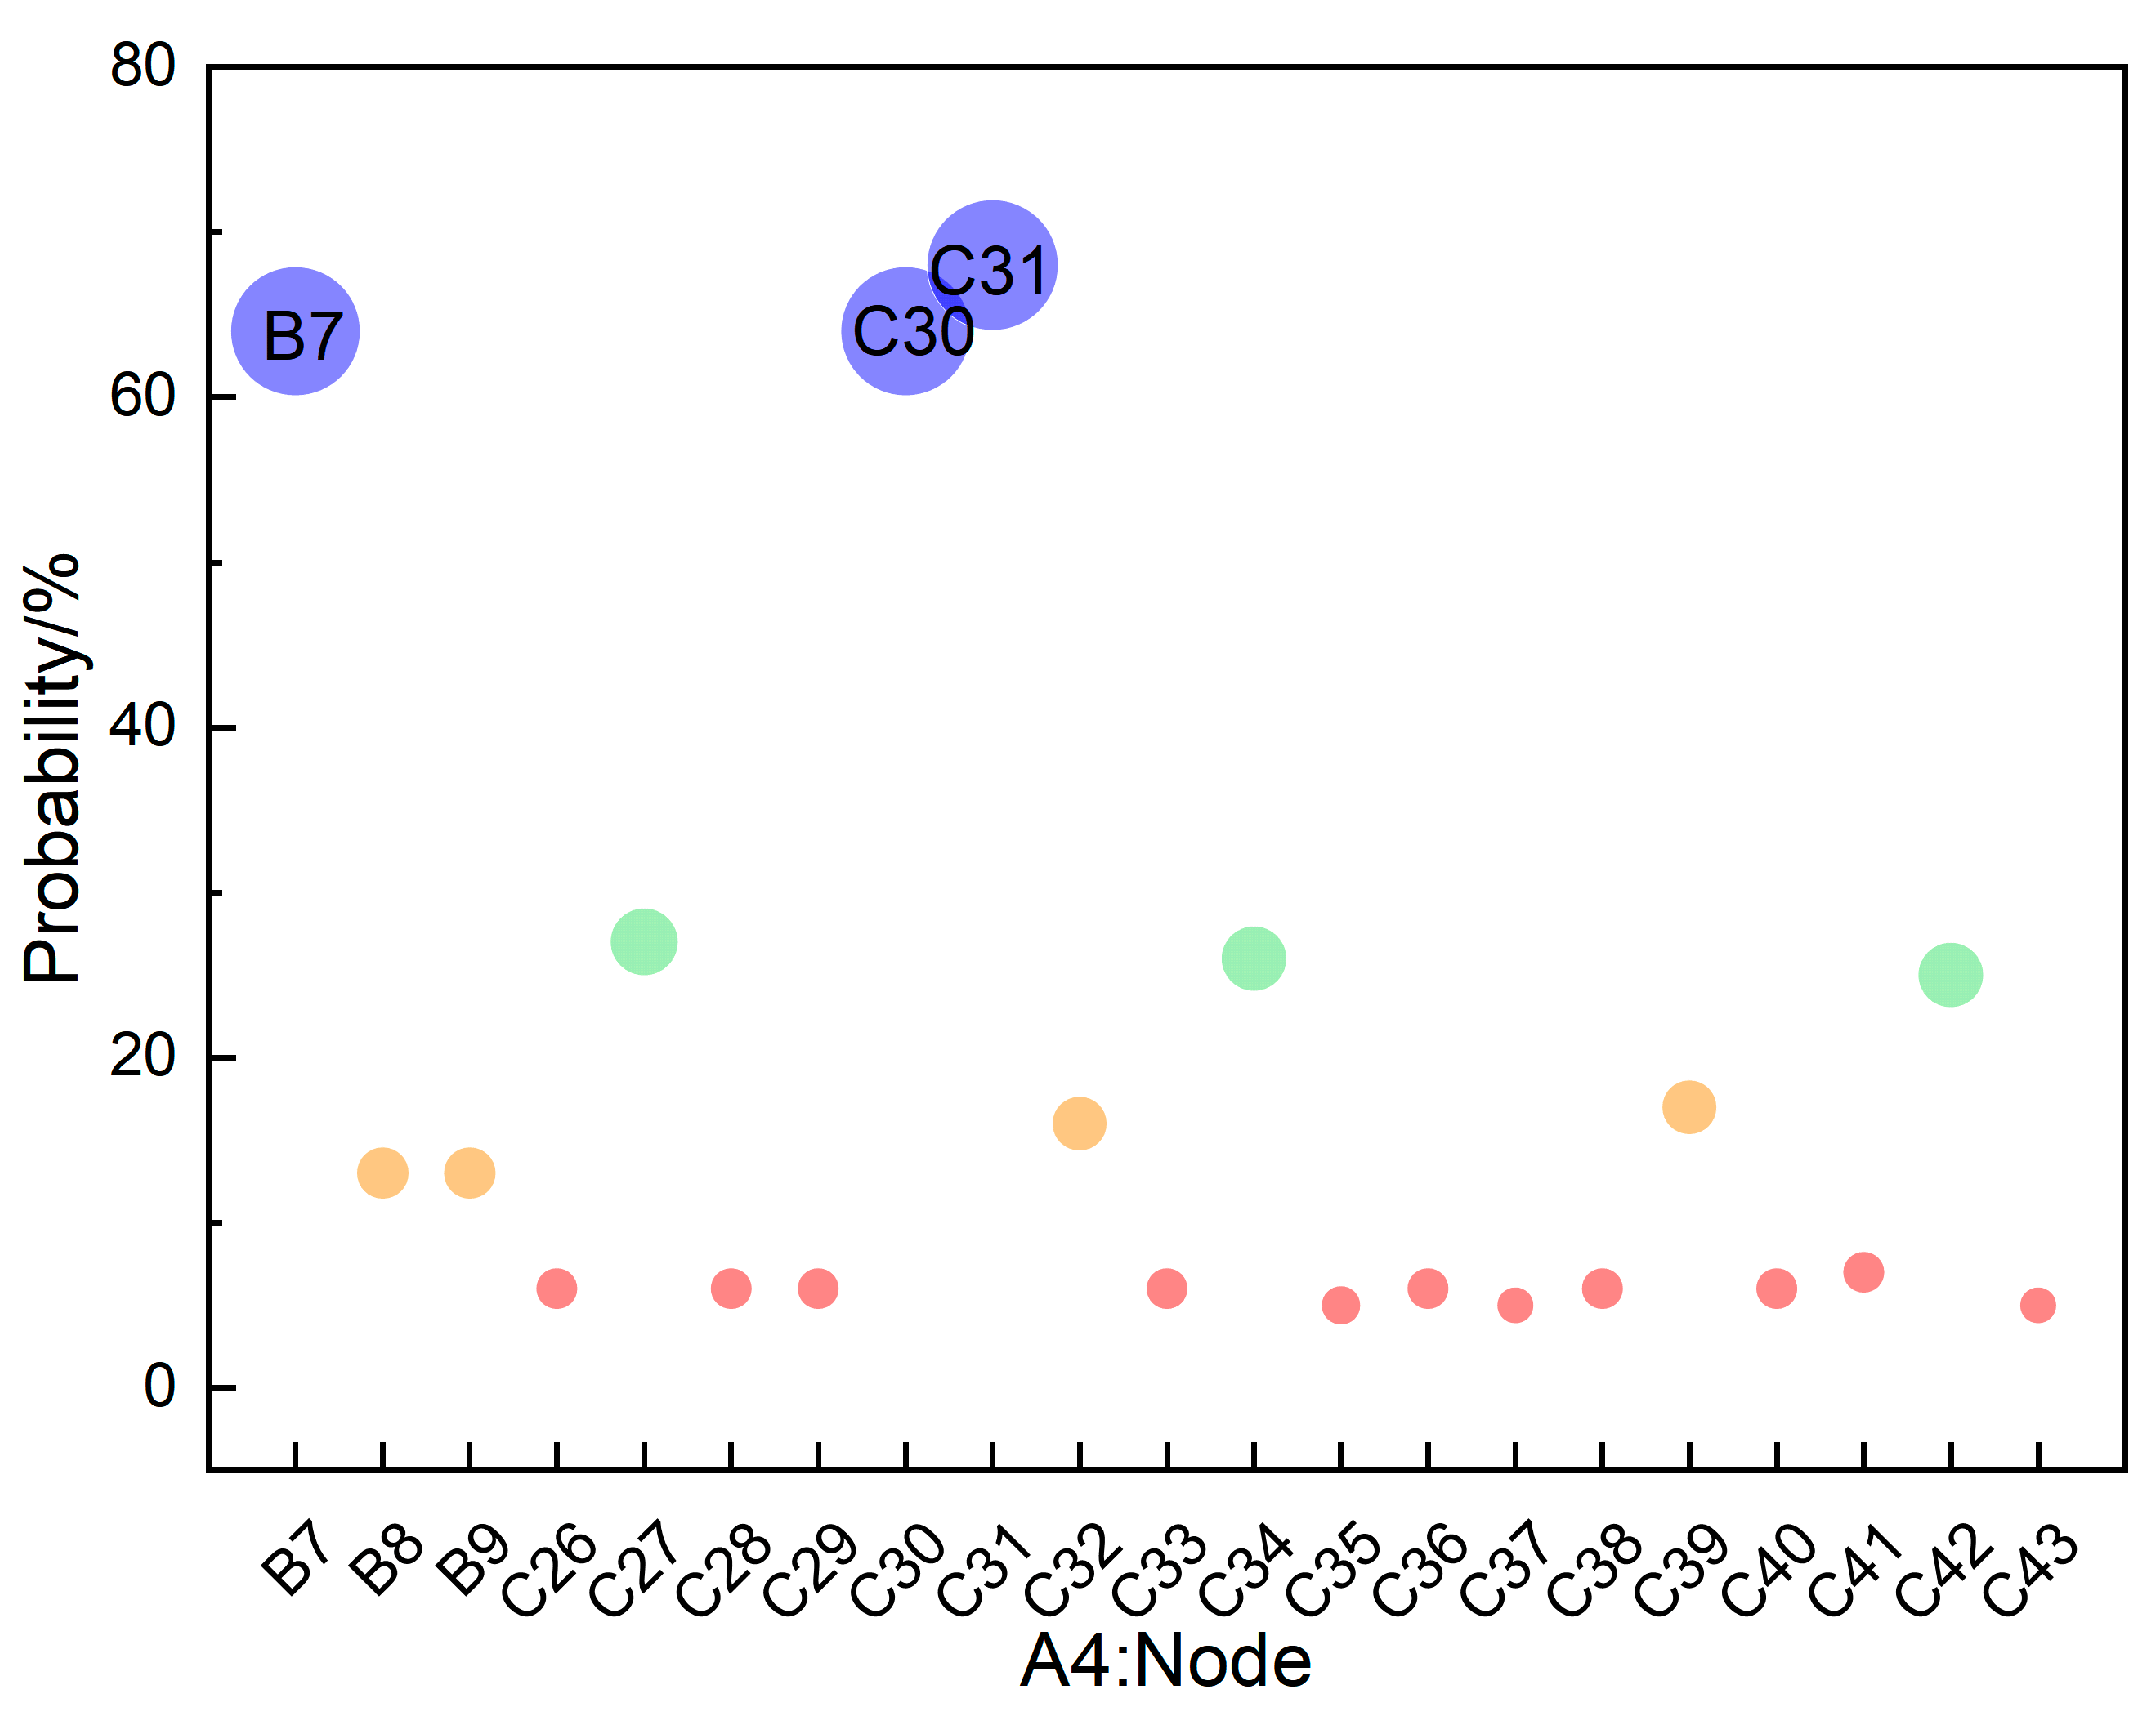
To further investigate the propagation mechanisms of key risk factors, evidence was set for first-level indicators A1, A2, and A4 (i.e., their occurrence probabilities were fixed at 100%), and the resulting posterior probability distributions of their direct child nodes (secondary factors) were analyzed. As shown in Figure 10, Figure 11 and Figure 12, bubble sizes in the bubble charts reflect the probability levels of each factor.
When A1 (ignition source) was set as evidence, the secondary factors B2 (battery thermal runaway) and B3 (sparks and hot surfaces) showed the highest posterior probabilities, at 82% and 78%, respectively. Among their corresponding third-level indicators, C7, C8, and C16 showed notable posterior probabilities of 47%, 61%, and 77%, respectively. With A2 (combustible materials) set as evidence, B5 (thermal runaway products) showed the highest probability (89%). Its associated third-level factors, C22 (gases ejected during thermal runaway) and C23 (electrolyte pyrolysis vapors), showed posterior probabilities of 71% and 47%, respectively. For A4 (confined space), set as evidence, the probability of B7 (physical confinement) reached 64%. Its corresponding third-level factors, C30 (relatively enclosed energy storage container) and C31 (lack of pressure relief devices or insufficient venting area), showed posterior probabilities of 64% and 68%, respectively.
Synthesizing these diagnostic results with the general backward inference, a dominant risk propagation pathway for deflagration accidents is identified as follows: C8 (internal short circuit) → B2 (battery thermal runaway) → C22 (gases ejected during thermal runaway) → Interaction within a space defined by C30 (relatively enclosed energy storage container) and C31 (lack of pressure relief devices or insufficient venting area) → deflagration.
The integrated analysis reveals that deflagration risk follows a distinct, cascading pathway. It originates from internal faults (C8/C16), which trigger B2 (battery thermal runaway). The resulting release of C22 serves as the primary combustible material. These flammable gases accumulate within a space characterized by C30, where C31 (lack of pressure relief devices or insufficient venting area) prevents their safe venting, leading to progressively increasing concentrations. Ultimately, ignition occurs through either a pre-existing A1 source or B2/B3 sources generated during the thermal runaway event itself.
This chain of events demonstrates that risk is not uniformly distributed. The analysis underscores that battery thermal runaway constitutes the core source of combustibles, and that inadequate pressure relief acts as a more critical risk amplifier than confinement alone. Consequently, safety management must prioritize early warning and suppression of thermal runaway at the battery source, while ensuring the reliability of pressure relief systems as a critical last line of defense. This approach enables a transition from fragmented safety measures to a systematic and targeted risk mitigation strategy.

3.4.3. Sensitivity Analysis

A sensitivity analysis was conducted on the Bayesian network model for deflagration accidents in energy storage power stations to quantify how probability variations in individual nodes affect the target node, thereby identifying their relative importance within the network. This analysis plays a critical role in risk assessment, helping to uncover system vulnerabilities and inform prevention strategies. Even minor probability fluctuations in key nodes can significantly alter the overall system risk. Thus, sensitivity analysis is essential for pinpointing critical risk drivers throughout the risk propagation process. The sensitivity analysis was conducted using the internal algorithm within GeNIe. This software computes a sensitivity coefficient for each node in the network concerning the target node (“Deflagration”). This coefficient represents the derivative of the posterior probability of the target node in relation to the prior probability of the node under examination, measuring the impact of a unit change in the latter on the former.
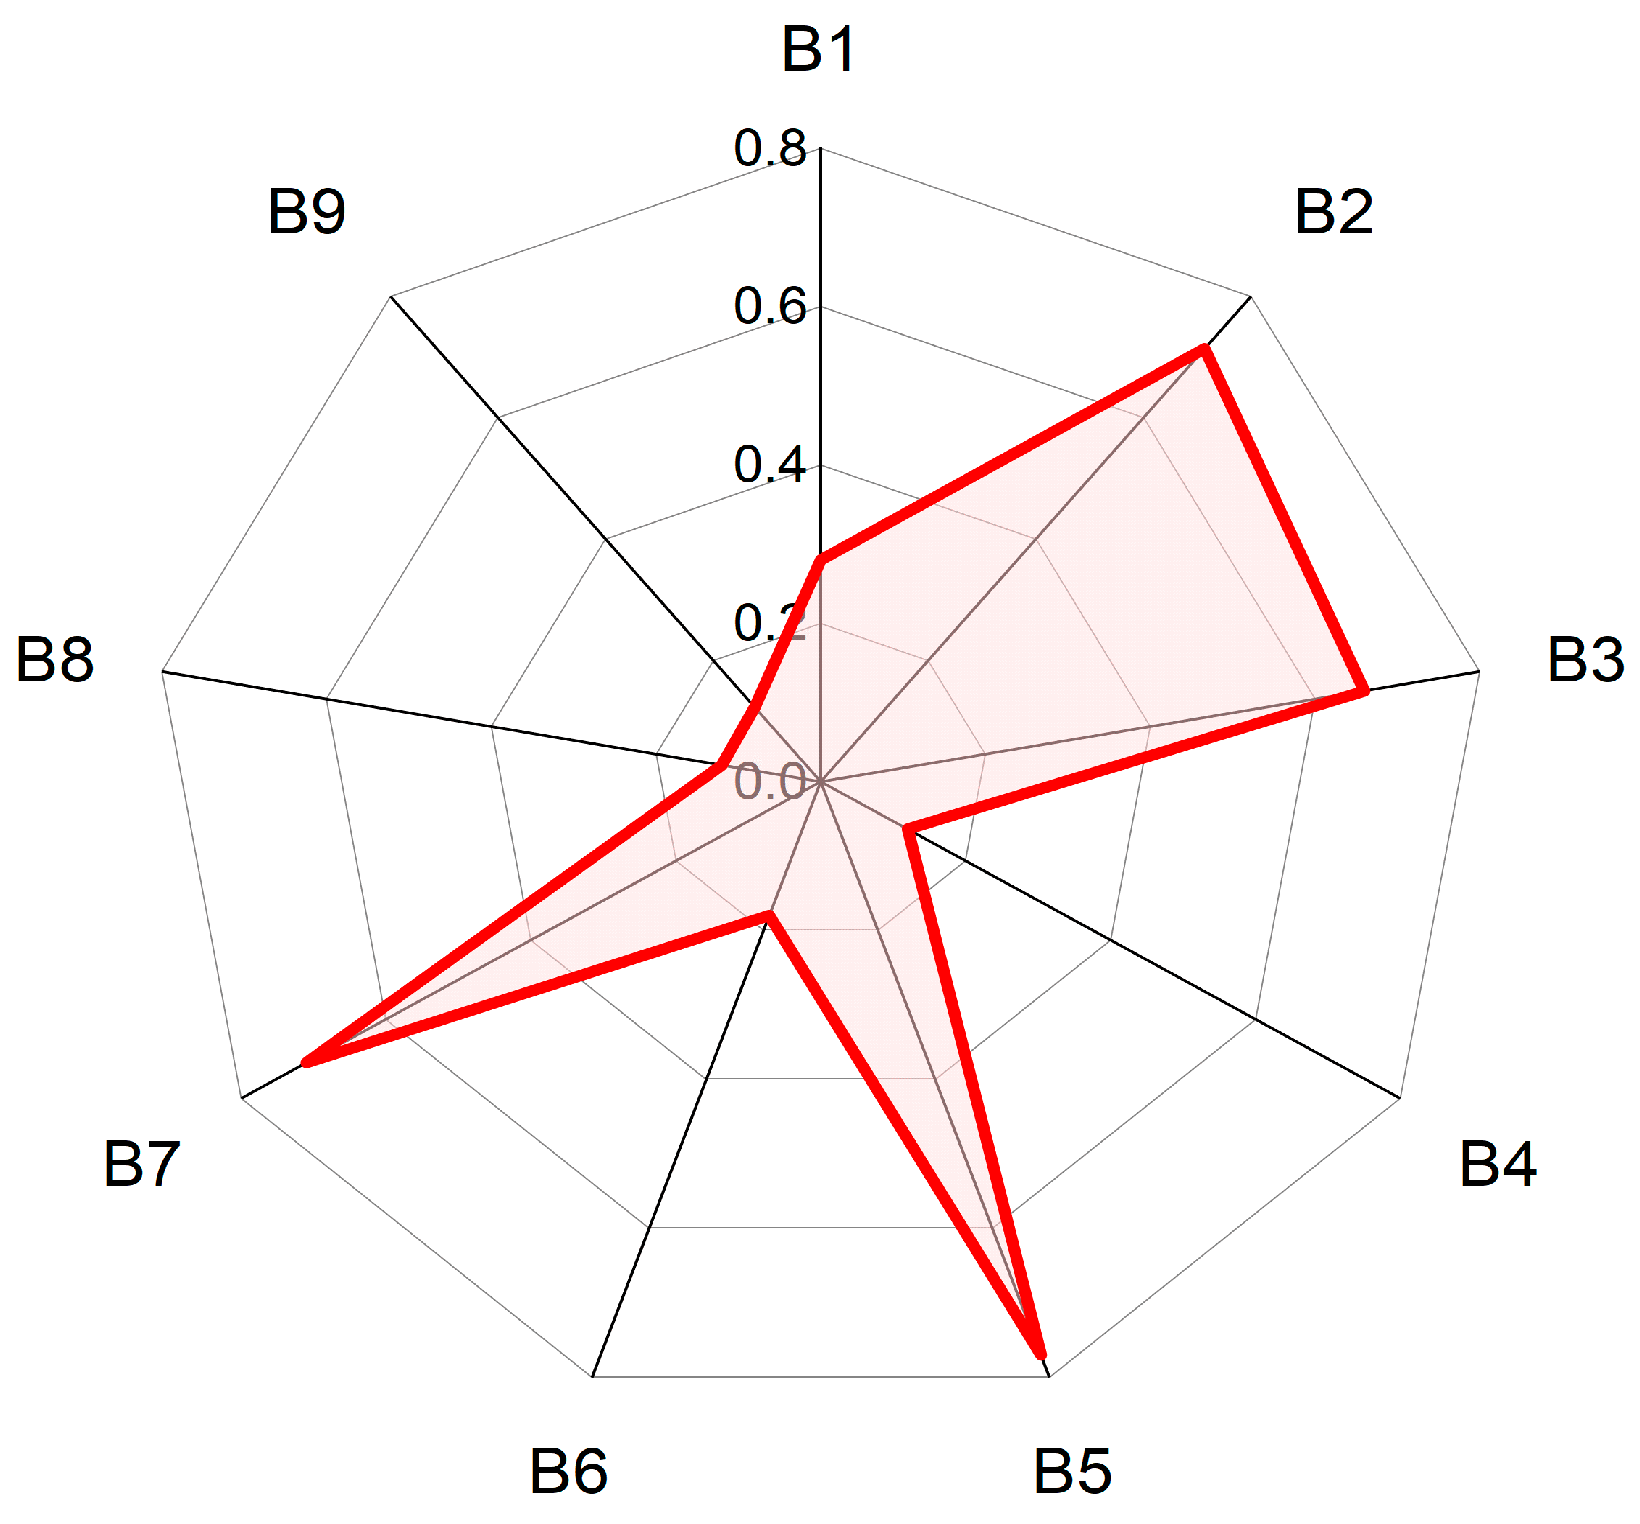
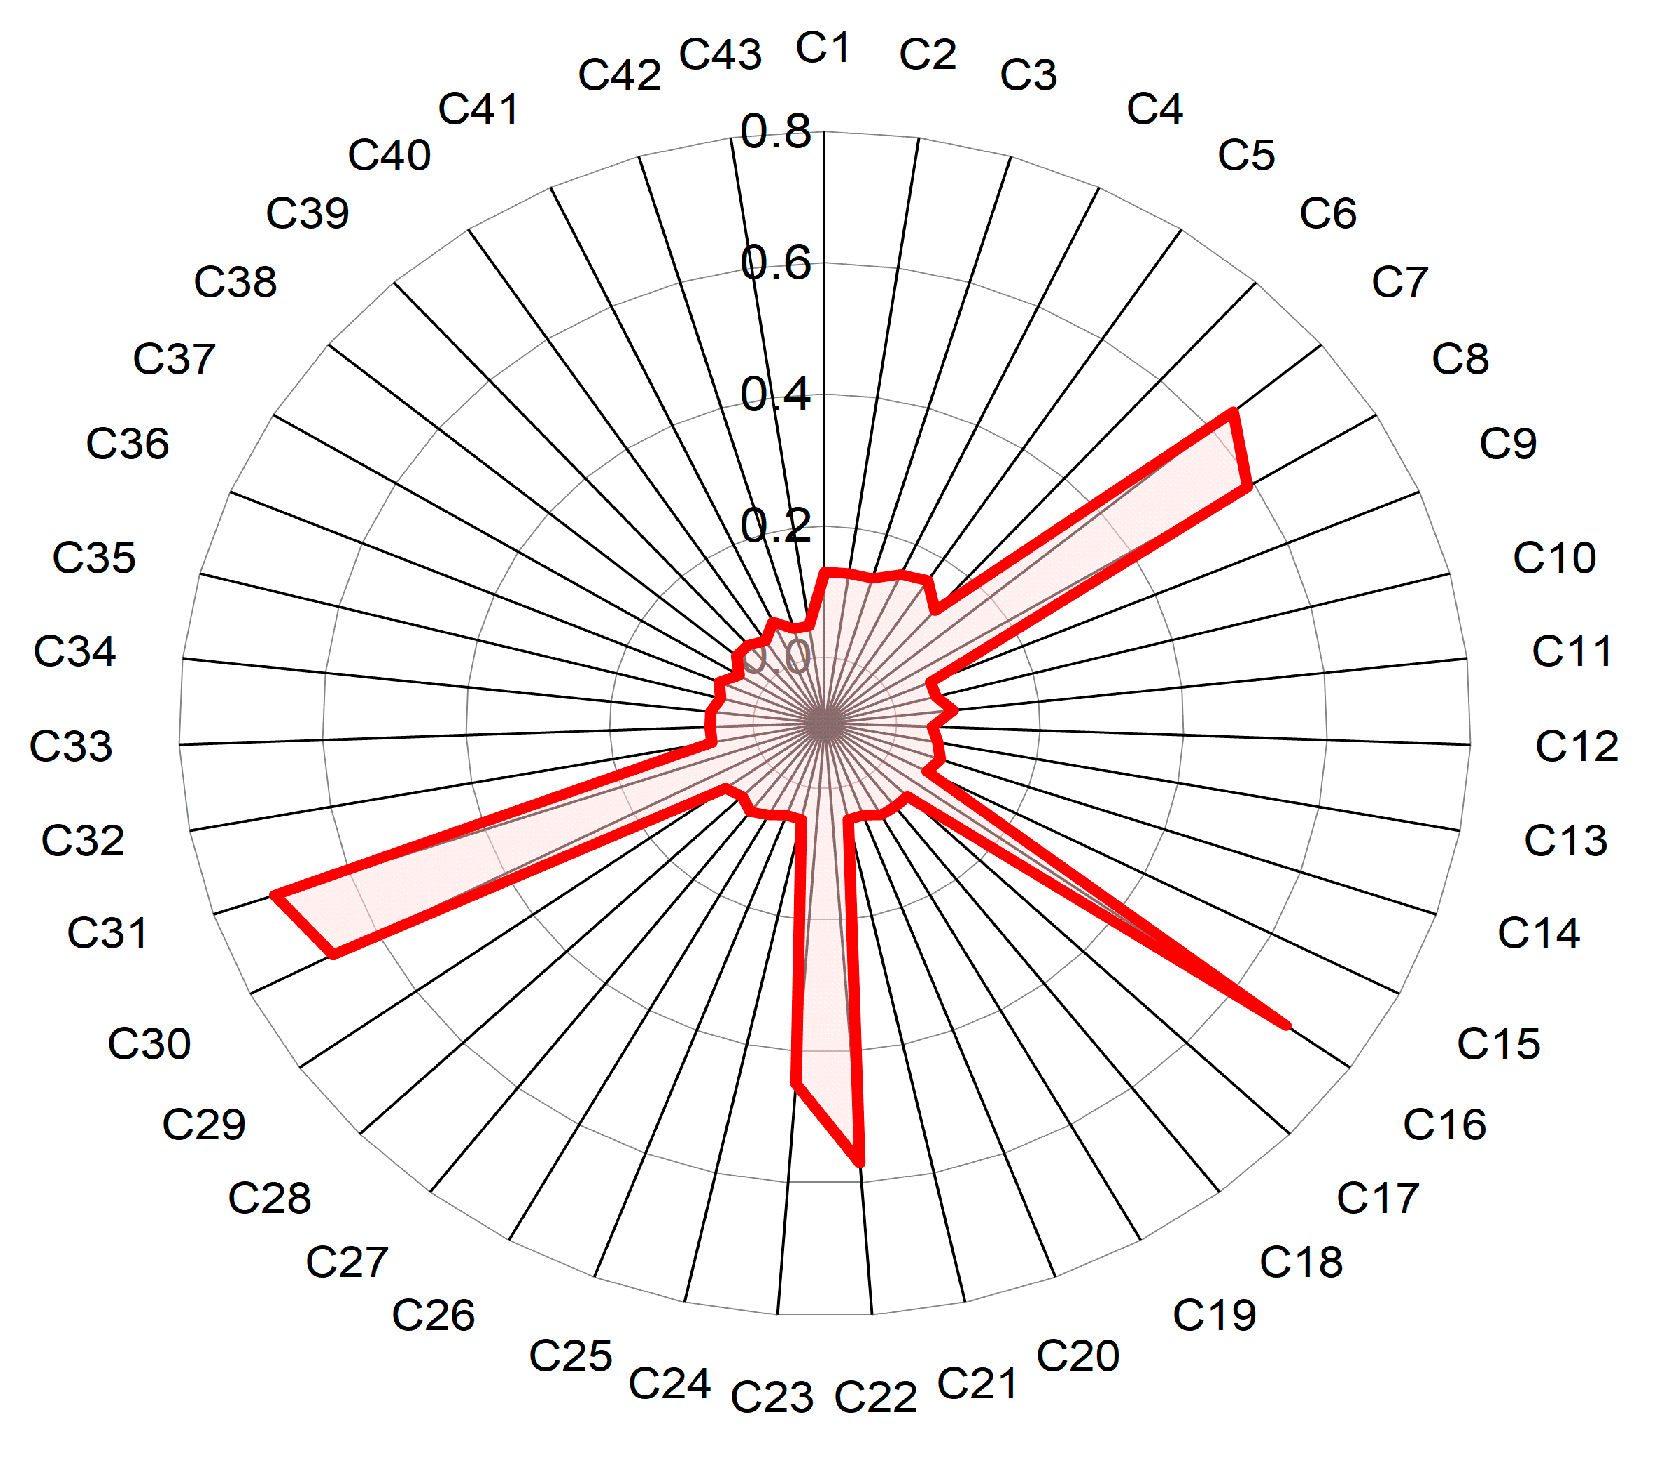
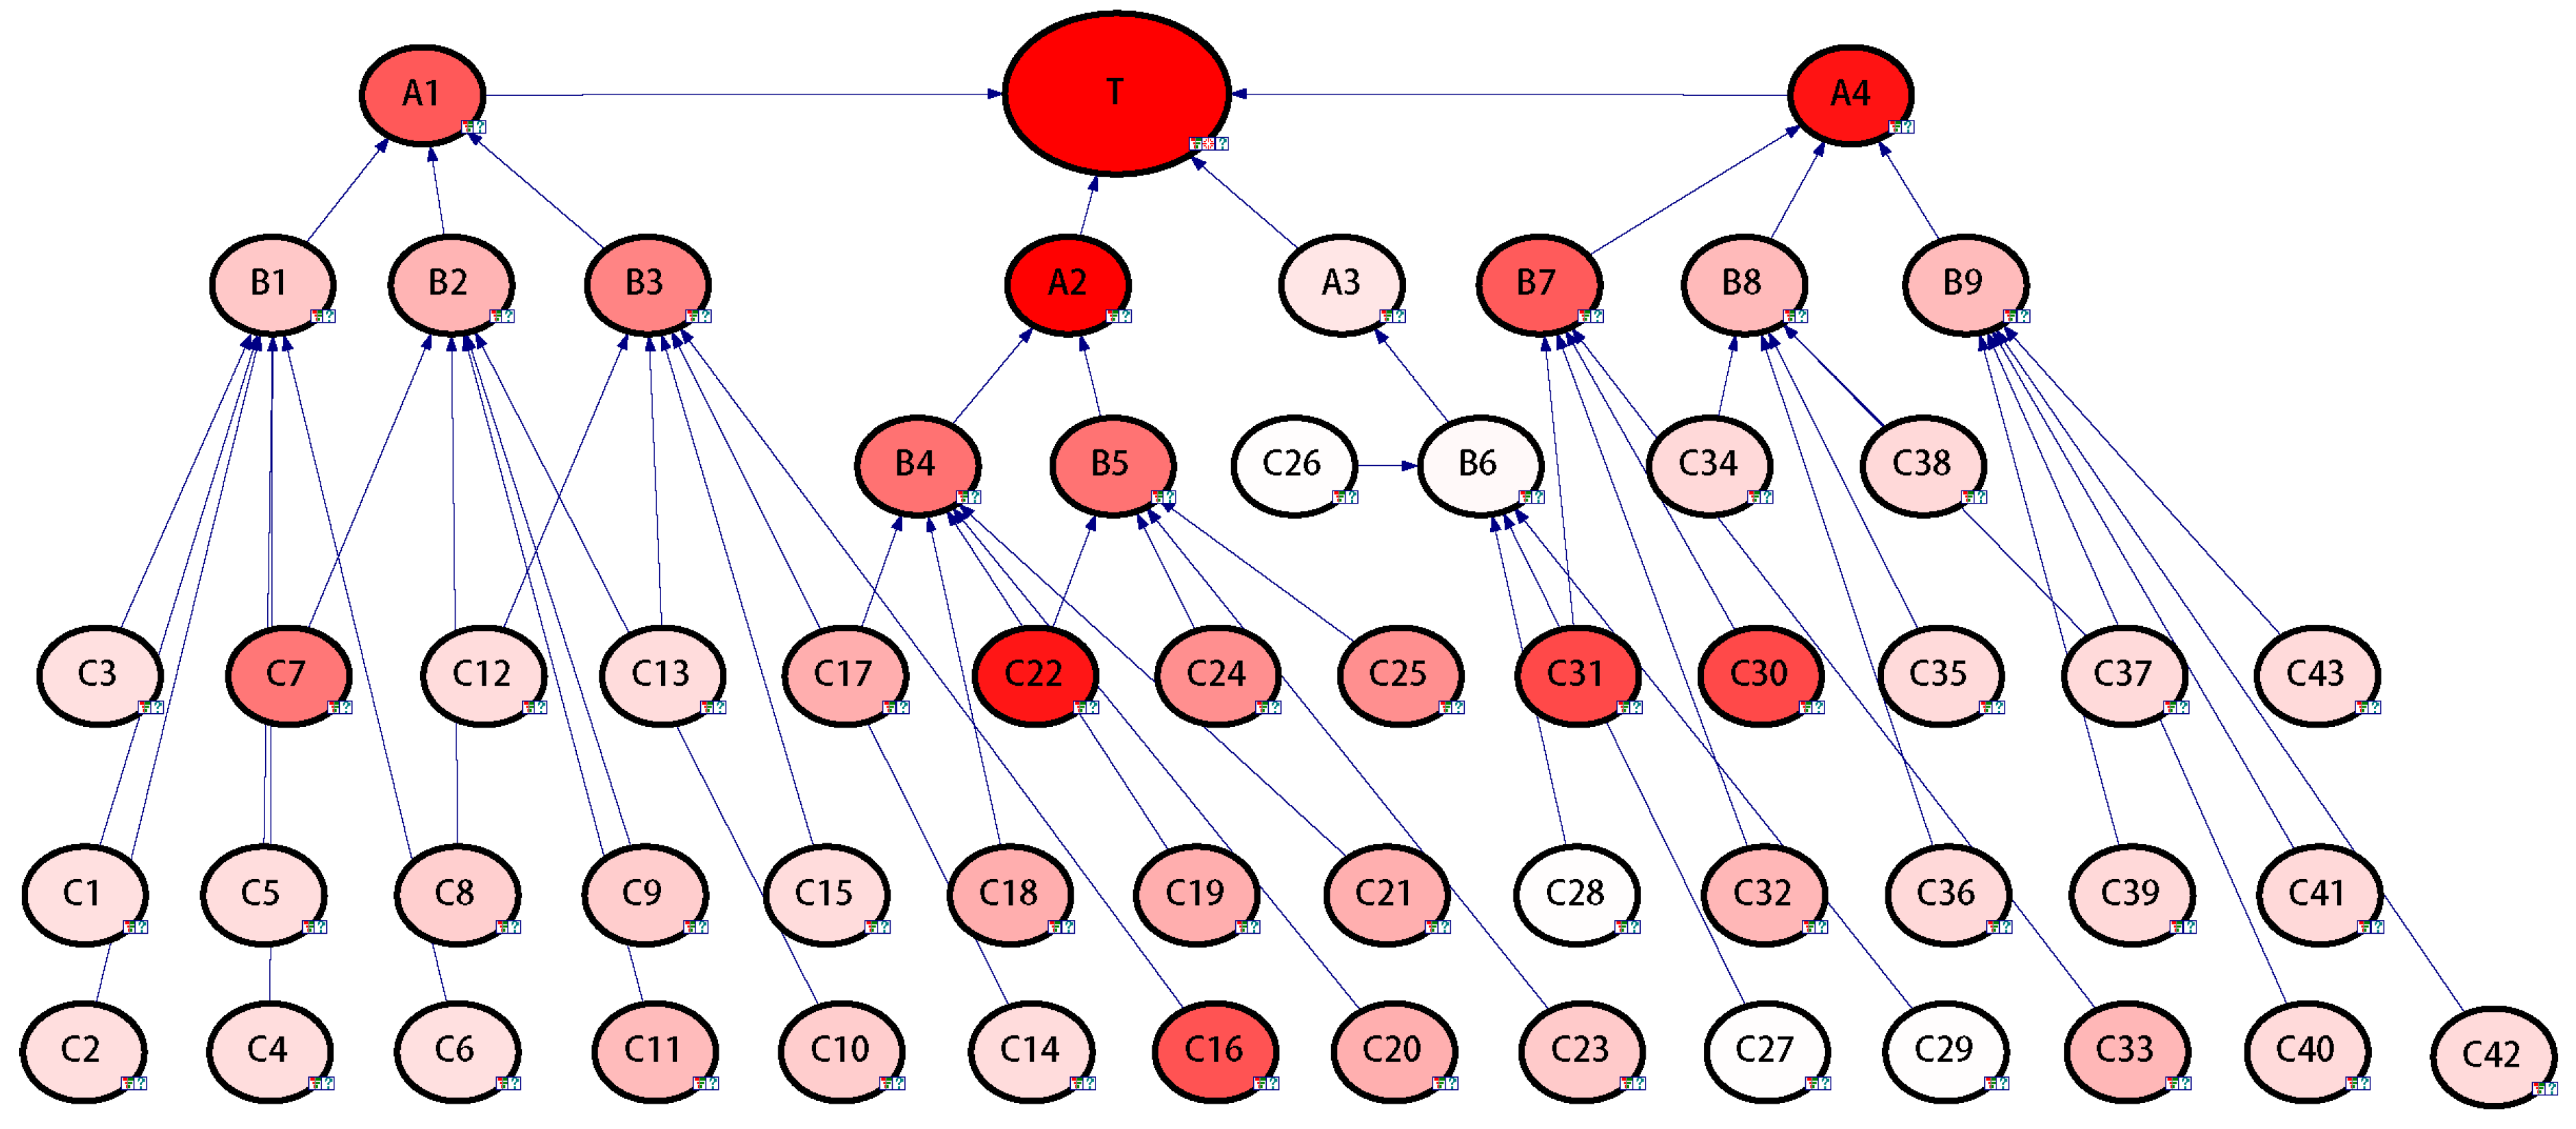
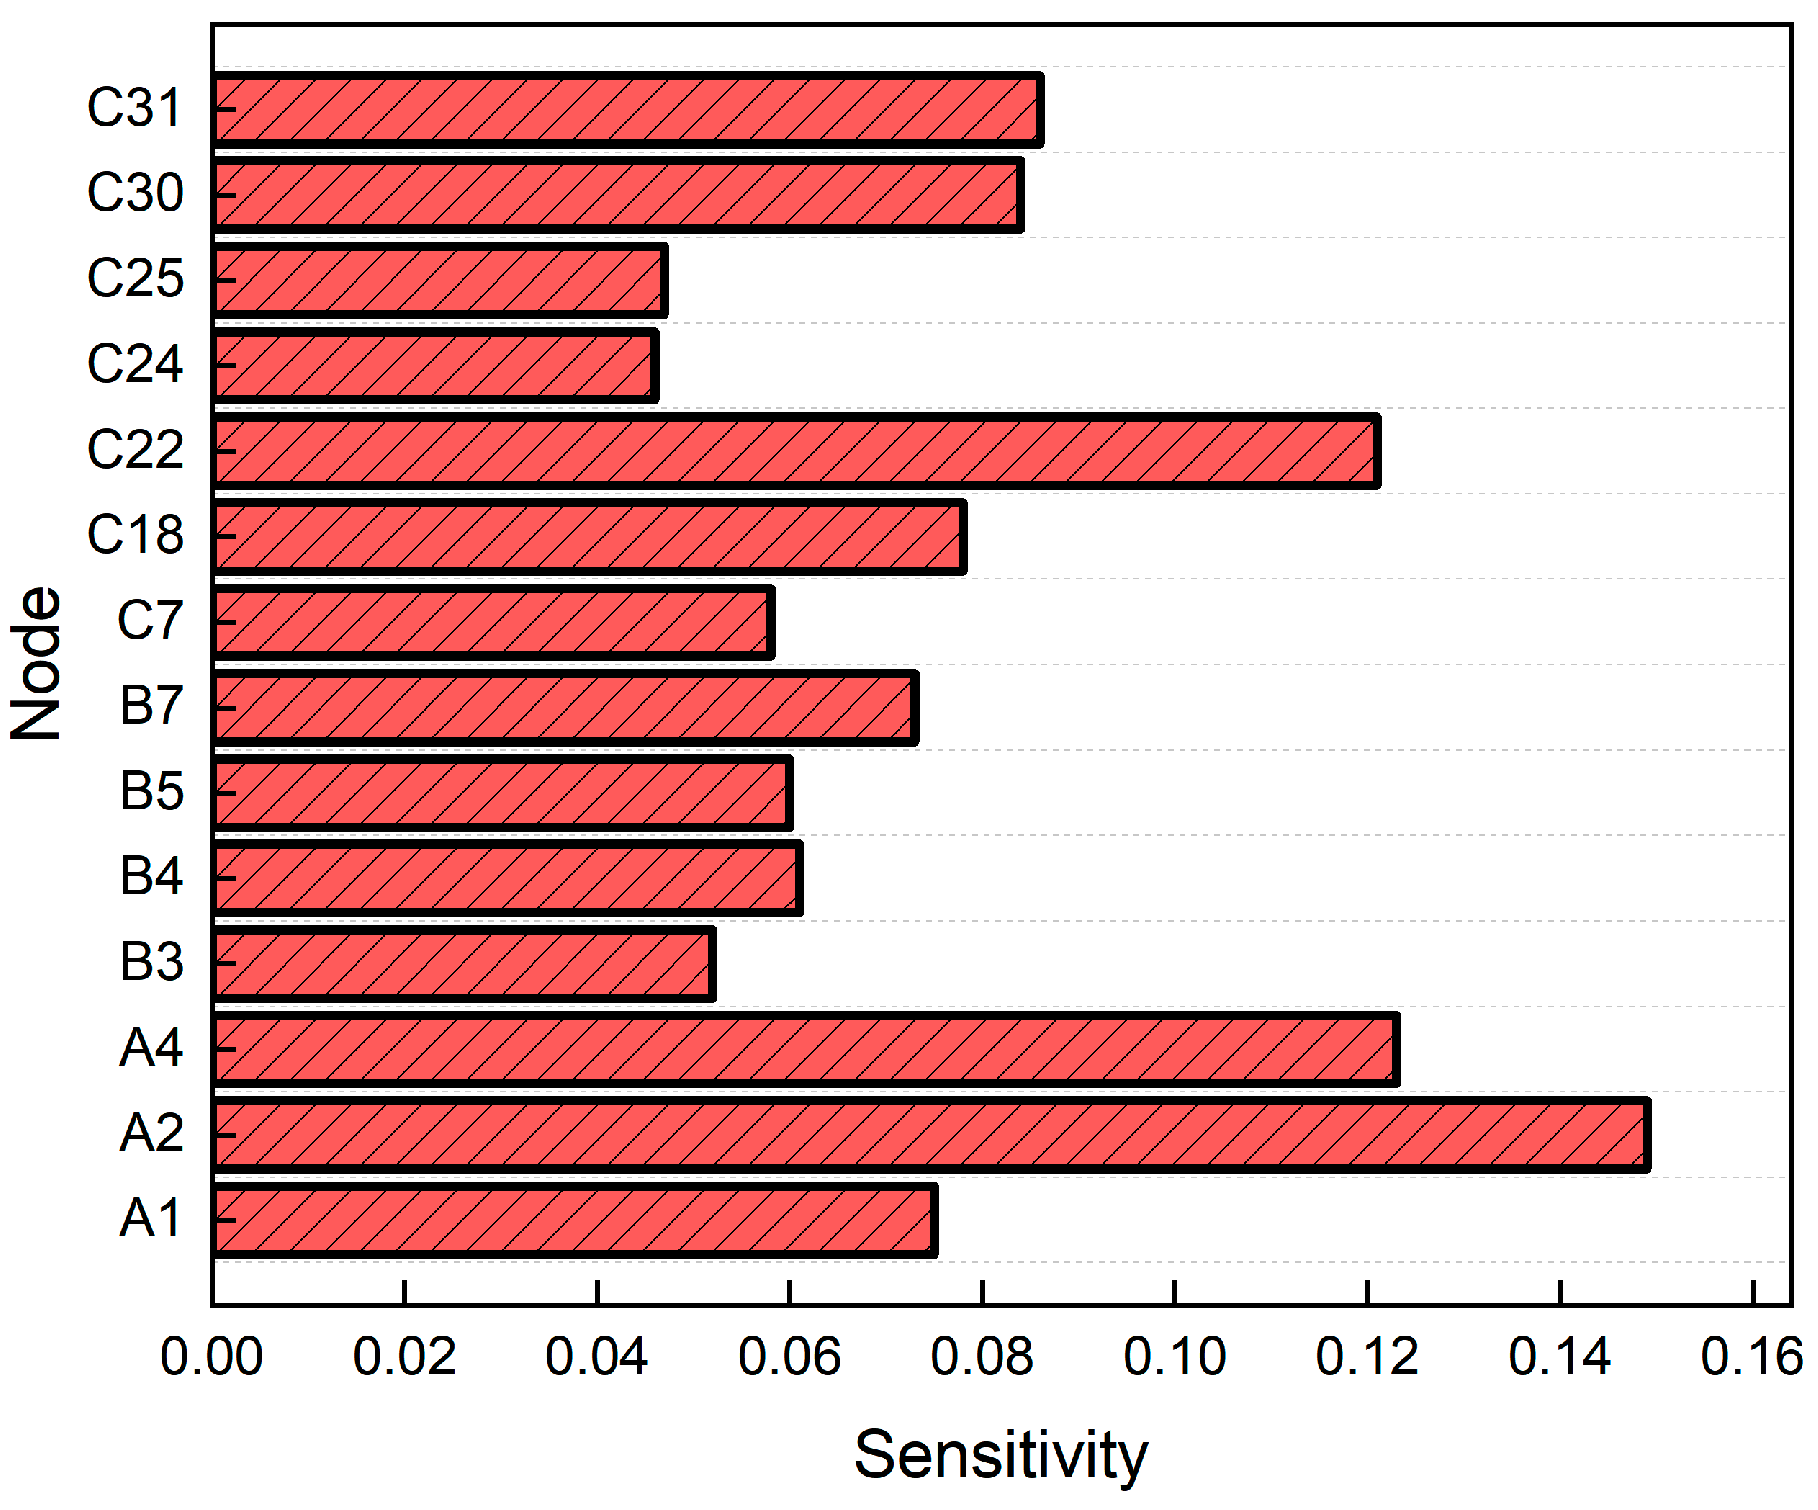
The analysis was performed with “Energy storage power station deflagration” set as the evidence node. The results are presented in Figure 13, where the color intensity of each node reflects its sensitivity level (darker shades indicate stronger influence). Figure 14 further highlights nodes with higher sensitivity coefficients.
The results identify several highly sensitive factors, indicated by dark red nodes: C22 (gases ejected during thermal runaway) in Group A2; B7 (physical confinement), C30 (Relatively enclosed energy storage container) and C31 (lack of pressure relief devices or insufficient venting area) in Group A4 (confined space); C16 (local temperature overheating during equipment operation). Additionally, nodes with moderate sensitivity (shades between deep red and pink) include B3 (sparks and hot surfaces), B2 (battery thermal runaway), B4 (battery materials), B5 (thermal runaway products), C7 (battery overcharge/over-discharge), C24 (molten battery casing materials), and C25 (electrode particles ejected during thermal runaway). Although of medium sensitivity, these factors still play non-negligible roles in accident progression.

3.4.4. Risk Mitigation and Preventive Maintenance Strategies

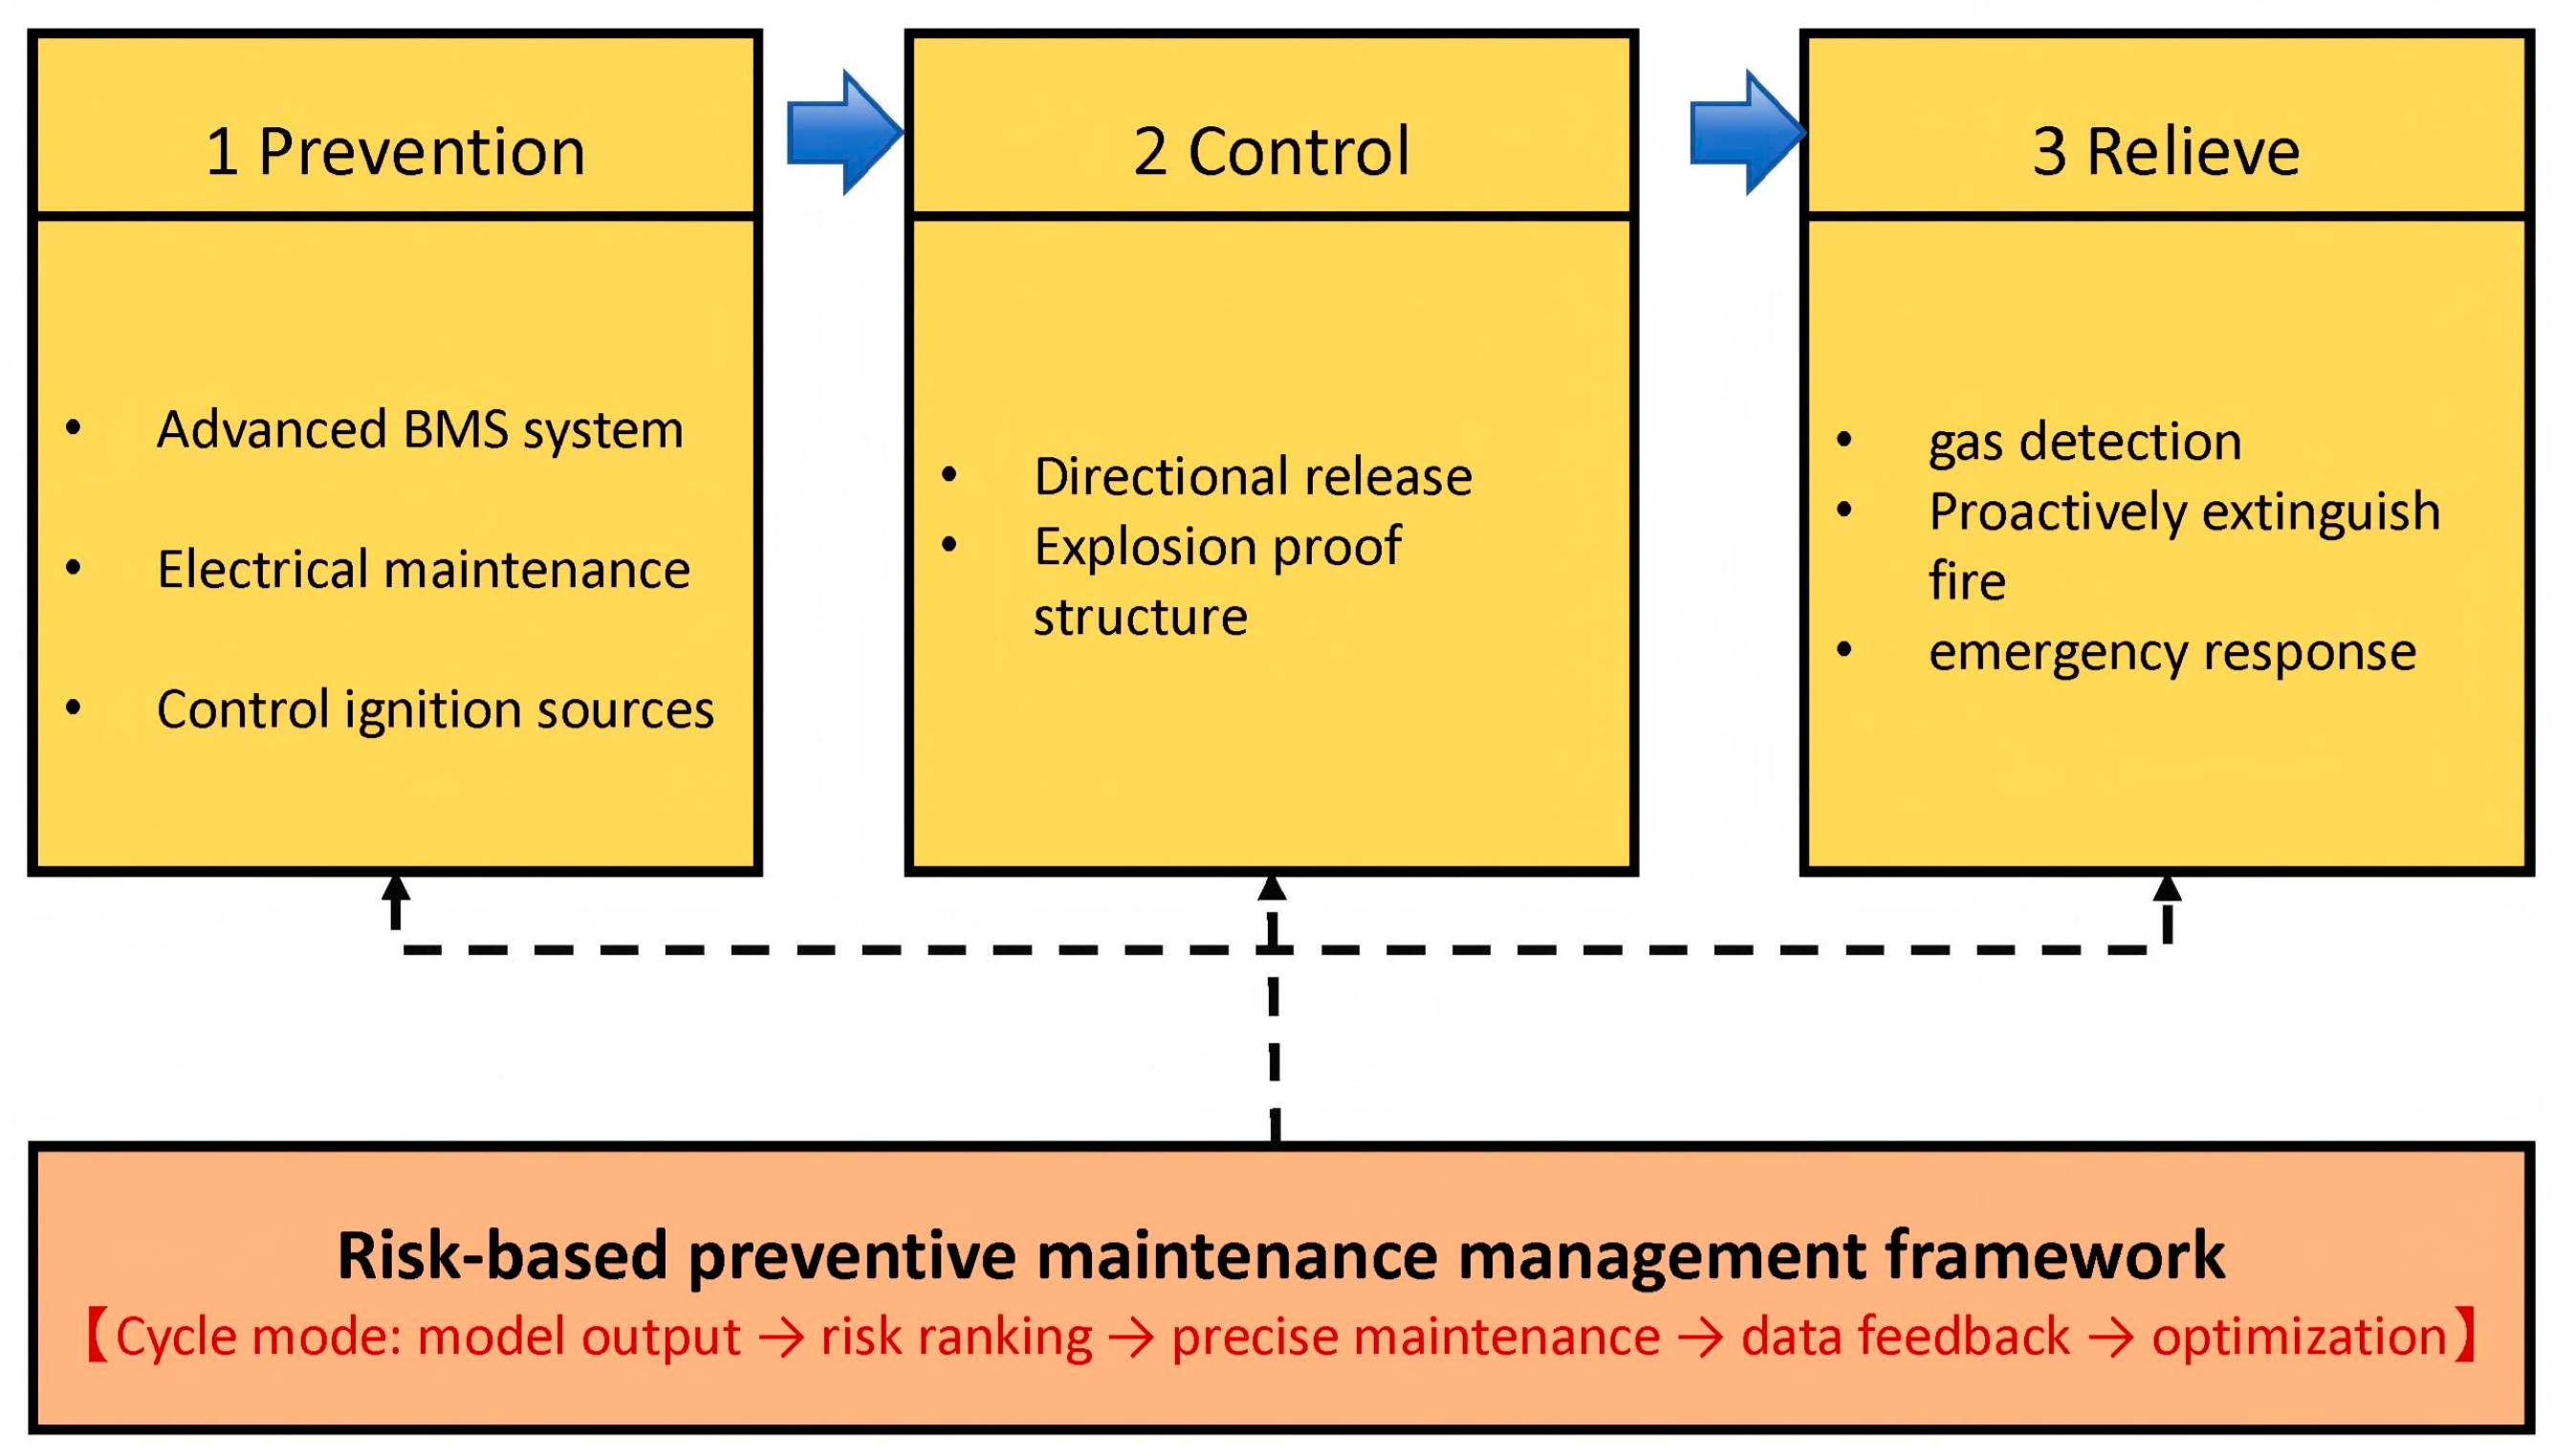
Building upon the critical risk pathway and the identification of highly sensitive nodes through causal inference and sensitivity analysis, this study outlines a comprehensive risk mitigation and operational management strategy (Figure 15). Central to this strategy is the establishment of a defense-in-depth system. Vertically, it comprises three progressively advancing technical lines of defense, targeting distinct incident stages. Horizontally, it is supported by a risk-based preventive maintenance management framework spanning the entire lifecycle of the system.
The first line of defense focuses on preempting potential incidents at their source by systematically eliminating or controlling initial conditions that could trigger accidents. This involves two key aspects: firstly, preventing battery thermal runaway through measures like advanced battery management systems, optimized temperature monitoring, and regular electrical connection maintenance to curb the generation of combustible materials at the origin. Secondly, rigorously managing potential ignition sources station-wide by adhering to deflagration-proof electrical standards, implementing electrostatic protection measures, and standardizing hot work management from system design to daily operation to eradicate ignition energy presence fundamentally.
The second line of defense aims to hinder the escalation from thermal runaway to deflagration, with a core focus on managing flammable gases. This necessitates addressing critical nodes like gas ejection during thermal runaway and pressure relief system failures by designing effective directional venting pathways and deflagration-proof pressure relief structures at module and system levels. This ensures swift redirection of flammable gases to safe zones, averting their accumulation in confined spaces and the formation of explosive atmospheres.
The third line of defense is dedicated to minimizing consequences in worst-case scenarios by mitigating damages when an deflagration occurs. It establishes a rapid linkage response mechanism integrating gas detection, early warning systems, and active fire suppression to promptly contain hazards, halt fire spread, and facilitate safe evacuation and emergency responses.
To ensure maintenance efforts are prioritized according to the risk levels identified by the model and optimal resource allocation, our work proposes a horizontal risk-based preventive maintenance management framework. This framework translates quantitative risk indicators from the Bayesian network model into specific operational decisions. It prioritizes node criticality based on diagnostic probability and sensitivity coefficients, guiding varied maintenance task priorities and frequencies. By continuously comparing actual operational data with model predictions, an “evaluation-optimization” loop is formed, enabling ongoing model calibration and maintenance strategy refinement. Through this integrated defense-in-depth system and horizontal management framework, the deflagration risk of energy storage systems is deconstructed into quantifiable, manageable engineering components.

3.5. Limitations and Future Work

The static fuzzy Bayesian network model developed in this study offers a structured analytical framework for assessing the deflagration risk of electrochemical energy storage stations. Its primary strength lies in the systematic integration of fault tree analysis’s rigorous logic with fuzzy expert judgment’s capacity to represent uncertainties. This integration enables the identification of intricate risk pathways and critical causal nodes even in the absence of accident data. It is essential to recognize that all models simplify reality, and the current framework has specific constraints. The deterministic logic gates (AND/OR) inherited from fault trees ensure clarity in initial causal relationships but may oversimplify real-world complexities by assuming independence among basic events. An essential simplification in the present FTA-to-BN conversion is the lack of explicit modeling of common cause failures (CCFs)—scenarios where multiple basic events stem from a shared root cause. This simplification may result in an underestimation of the system risk overall, as the failure probabilities of interconnected events are not entirely considered under the current assumption of event independence.
While expert priors are managed through fuzzy set processing to address cognitive uncertainties at the parameter level, incorporating physical or functional couplings at the network structure level is a crucial future direction for model enhancement. To address dependencies like CCFs in future iterations, methodological extensions could include introducing common cause parent nodes into the BN structure or employing more advanced probability gates (e.g., Noisy-OR, Noisy-AND) that can capture partial causal influences and shared failure mechanisms. Exploring the introduction of common cause failure nodes or utilizing probability logic gates like Noisy-OR to capture partial causal relationships can improve the model’s alignment with practical engineering scenarios. Furthermore, expanding the existing static framework to model accident temporal evolution through a dynamic BN and iteratively updating prior and conditional probability tables with operational and fault data accumulation has the potential to elevate this model from a fundamental risk assessment tool to an adaptive analysis platform supporting precise safety management.

4. Conclusions

This work introduces an integrated framework that merges Fault Tree Analysis with a static fuzzy Bayesian network for conducting probabilistic risk assessments related to deflagration incidents in electrochemical energy storage stations. The methodology first systematically identifies risk contributors via fault tree analysis and then maps the causal logic into a static BN. To address data scarcity, the model employs trapezoidal fuzzy numbers to quantify expert linguistic judgments for root node probabilities, with expert weights calibrated based on professional background and domain relevance. The assessment estimates a baseline deflagration probability of 28% for a typical system. Diagnostic inference reveals a primary risk escalation path: C8 (internal short circuit) → B2 (battery thermal runaway) → C22 (gases ejected during thermal runaway) → C31 (lack of pressure relief devices or insufficient venting area) combined with C30 (relatively enclosed energy storage container) → deflagration. Sensitivity analysis further highlights that ejected gases (C22) and, more critically, lack of pressure relief devices or insufficient venting area (C31) are the most sensitive risk drivers, serving as key amplifiers of deflagration risk. These results underscore that pressure relief failure is a more decisive risk amplifier than confinement alone. Therefore, safety management must prioritize early warning and suppression of thermal runaway at the battery source, while ensuring robust pressure relief systems as the ultimate line of defense. Theoretically, this research contributes a static fuzzy Bayesian network methodology that enables effective risk quantification under uncertainty. The model’s bidirectional reasoning (causal and diagnostic) extends risk assessment capabilities by enabling the inference of risk relationships and critical paths in complex, coupled systems. Practically, the model delivers actionable insights for safety management, offering specific guidance for optimizing critical systems such as gas detection, pressure relief design, and battery management. This approach facilitates the transition from generalized safety measures to precision prevention, thereby enhancing the operational resilience of electrochemical energy storage stations.

Author Contributions

Conceptualization, X.L. and D.H.; methodology, C.Y.; validation, Q.Y. and X.L.; formal analysis, Q.Y.; investigation, Q.Y. and Y.Q.; resources, Y.Q.; data curation, Q.Y.; writing—original draft preparation, Q.Y.; writing—review and editing, D.H.; visualization, Q.Y. and Y.Q.; supervision, X.L.; project administration, X.L.; funding acquisition, X.L. and C.Y. All authors have read and agreed to the published version of the manuscript.

Funding

This research was funded by the Key R&D Program of Zhejiang, China (Grant No. 2025C02001), the Key Science and Technology Program Project of the Ministry of Emergency Management (Grant No. 2025EMST100101), the National Natural Science Foundation of China (Grant No. 52374287), the State Key Laboratory of Disaster Prevention and Ecology Protection in Open-pit Coal Mines, Shandong University of Science and Technology (No. DPEPM202501), and the Opening Project of the State Key Laboratory of Explosion Science and Safety Protection, Beijing Institute of Technology (Grant No. KFJJ25-10M).

Data Availability Statement

The original contributions presented in the study are included in the article. Further inquiries can be directed to the corresponding author.

Acknowledgments

The authors appreciate all the survey participants.

Conflicts of Interest

Author Y.Q. was employed by the company Zhejiang Safety Science and Technology Research Co., Ltd. The remaining authors declare that the research was conducted in the absence of any commercial or financial relationships that could be construed as a potential conflict of interest.

Abbreviations

The following abbreviations are used in this manuscript:
BNBayesian Network
FBNFuzzy Bayesian Network
EESElectrochemical Energy Storage Station
ETAEvent Tree Analysis
AHPAnalytic Hierarchy Process
BMSBattery Management System
PCSPower Conversion System
TrFNTrapezoidal Fuzzy Number
COACenter of Area
DAGDirected Acyclic Graph
CPTsConditional Probability Tables
CPDConditional Probability Distribution
CCFCommon Cause Failure

References

  1. Nyamathulla, S.; Dhanamjayulu, C. A review of battery energy storage systems and advanced battery management system for different applications: Challenges and recommendations. J. Energy Storage 2024, 86, 111179. [Google Scholar] [CrossRef]
  2. Yu, B.; Chen, Y.; Wu, Y.; Zhou, Z.; Xu, S.; Luo, X.; Chen, J. Industrial chain risk assessment for the promotion of electrochemical energy storage technology. J. Energy Storage 2025, 128, 117279. [Google Scholar] [CrossRef]
  3. National Development and Reform Commission; National Energy Administration. Guiding Opinions on Accelerating the Development of New Energy Storage; National Development and Reform Commission; National Energy Administration: Beijing, China, 2021.
  4. China Electricity Council; National Platform for Safety Monitoring Information of Electrochemical Energy Storage Power Stations. Statistical Data on the Electrochemical Energy Storage Power Station Industry for the First Half of 2025; China Electricity Council: Beijing, China, 2025. [Google Scholar]
  5. Liu, Z.; Zhang, M.; Yang, K.; Jin, Y.; Wang, H.; Wei, B.; Liu, J. Thermal runaway behavior of large-format sodium-ion and lithium-iron phosphate batteries under different trigger sources: A comparative study. eTransportation 2025, 26, 100495. [Google Scholar] [CrossRef]
  6. Fernandes, Y.; Bry, A.; de Persis, S. Identification and quantification of gases emitted during abuse tests by overcharge of a commercial Li-ion battery. J. Power Sources 2018, 389, 106–119. [Google Scholar] [CrossRef]
  7. Yuan, S.; Cui, Y.; Cheng, D.; Tai, F.; Wu, J. Statistical analysis of fire and explosion accidents in electrochemical energy-storage stations from 2017 to 2024 throughout the world. Energy Storage Sci. Technol. 2025, 14, 2362–2376. [Google Scholar]
  8. Lai, C.C.; Liu, C.C.; Xiao, H.Z.; Shu, C.M. The second residual hydrodesulphurisation of the refinery at the sixth naphtha cracker industrial park accident using fault tree analysis: A case study from a chemical complex in Taiwan. J. Loss Prev. Process Ind. 2025, 99, 105812. [Google Scholar] [CrossRef]
  9. Huang, P.; Hu, G.; Yong, Z.; Mao, B.; Bai, Z. Fire risk assessment of battery transportation and storage by combining fault tree analysis and fuzzy logic. J. Loss Prev. Process Ind. 2022, 77, 104774. [Google Scholar] [CrossRef]
  10. Sadeghi-Yarandi, M.; Torabi-Gudarzi, S.; Asadi, N.; Golmohammadpour, H.; Ahmadi-Moshiran, V.; Taheri, M.; Ghasemi-Koozekonan, A.; Soltanzadeh, A.; Alimohammadi, B. Development of a novel Electrical Industry Safety Risk Index (EISRI) in the electricity power distribution industry based on fuzzy analytic hierarchy process (FAHP). Heliyon 2023, 9, E13155. [Google Scholar] [CrossRef]
  11. Sun, S.; Mao, T.; Lv, P.; Pang, L. Dust Explosion Risk Assessment for Dry Dust Collector Based on AHP-Fuzzy Comprehensive Evaluation. Processes 2022, 10, 2616. [Google Scholar] [CrossRef]
  12. Wang, X.; Xue, X.; Yeoh, W.; Sun, X.; Qin, H. Risk propagation analysis of domino effect in chemical accident: An integrated approach with data mining and Bayesian networks. J. Loss Prev. Process Ind. 2025, 98, 105745. [Google Scholar] [CrossRef]
  13. Bayazit, O.; Kaptan, M. Evaluation of the risk of pollution caused by ship operations through bow-tie-based fuzzy Bayesian network. J. Clean. Prod. 2023, 382, 135386. [Google Scholar] [CrossRef]
  14. Zarei, E.; Khakzad, N.; Cozzani, V.; Reniers, G. Safety analysis of process systems using Fuzzy Bayesian Network (FBN). J. Loss Prev. Process Ind. 2019, 57, 7–16. [Google Scholar] [CrossRef]
  15. Li, Z.; Wang, X.; Gong, S.; Sun, N.; Tong, R. Risk assessment of unsafe behavior in university laboratories using the HFACS-UL and a fuzzy Bayesian network. J. Saf. Res. 2022, 82, 13–27. [Google Scholar] [CrossRef] [PubMed]
  16. Yu, J.; Ding, H.; Wu, S.; Zeng, Q.; Ma, W. Risk assessment of domino effects under fire and explosion accidents in LNG storage tank farms based on Bayesian network. J. Loss Prev. Process Ind. 2025, 93, 105507. [Google Scholar] [CrossRef]
  17. Xie, J.; Li, J.; Wang, J.; Jiang, J.; Shu, C.-M. Fire risk assessment in lithium-ion battery warehouse based on the Bayesian network. Process Saf. Environ. Prot. 2023, 176, 101–114. [Google Scholar] [CrossRef]
  18. Aydin, M.; Akyuz, E.; Boustras, G. A holistic safety assessment for cargo holds and decks fire & explosion risks under fuzzy Bayesian network approach. Saf. Sci. 2024, 176, 106555. [Google Scholar] [CrossRef]
  19. Pang, L.; Zhang, M.; Li, X.; Yang, K.; Zhang, Y. Research on quantitative risk assessment method of dust explosion based on Bayesian network. J. Loss Prev. Process Ind. 2024, 87, 105237. [Google Scholar] [CrossRef]
  20. Lu, Z.; Cao, Y.; Zou, Y.; Li, X.; Yang, F.; Khakzad, N.; Chen, C. Dynamic risk analysis of fire and explosion domino accidents at hydrogen refueling stations using Dynamic Bayesian Network. Int. J. Hydrogen Energy 2024, 95, 546–557. [Google Scholar] [CrossRef]
  21. Savinykh, E.; Zhang, W. Fire Risk Assessment of Battery Ship Based on Bayesian Network. In Proceedings of the 2021 6th International Conference on Transportation Information and Safety (ICTIS), Wuhan, China, 22–24 October 2021; Institute of Electrical and Electronics Engineers: Piscataway, NJ, USA, 2021; pp. 386–391. [Google Scholar]
  22. Huang, Q.; Zeng, L.; Lashari, N.u.R.; Huang, Z.; Xie, X. A comprehensive review on the techno-economic analysis of electrochemical energy storage systems: Technologies, applications, benefits and trends. Future Batter. 2025, 5, 100031. [Google Scholar] [CrossRef]
  23. Bani Ahmad, A.; Ooi, C.A.; Ali, O.; Charin, C.; Mohamad Maharum, S.M.; Swadi, M.; Salem, M. Renewable integration and energy storage management and conversion in grid systems: A comprehensive review. Energy Rep. 2025, 13, 2583–2602. [Google Scholar] [CrossRef]
  24. Ching, J.; Leu, S.-S. Bayesian updating of reliability of civil infrastructure facilities based on condition-state data and fault-tree model. Reliab. Eng. Syst. Saf. 2009, 94, 1962–1974. [Google Scholar] [CrossRef]
  25. Iswarya, T.; Karpagavalli, S. The implementation of the trapezoidal fuzzy number toward the solution of the A fuzzy inventory model with shortages. J. Phys. Conf. Ser. 2021, 1818, 012230. [Google Scholar] [CrossRef]
  26. Khan, F.; Rathnayaka, S.; Ahmed, S. Methods and models in process safety and risk management: Past, present and future. Process Saf. Environ. Prot. 2015, 98, 116–147. [Google Scholar] [CrossRef]
  27. NFPA 855-2026; Standard for the Installation of Stationary Energy Storage Systems. National Fire Protection Association: Quincy, MA, USA, 2026.
  28. GB/T 42288-2022; Safety Code for Electrochemical Energy Storage Station. Standardization Administration of China: Beijing, China, 2022.
  29. Liu, C.; Zhang, G.; Li, X.; Yuan, D.; Zhu, G.; Liu, C. Study on explosion venting efficacy of thermal runaway gases from lithium-ion batteries in a confined space: Impact of venting area. Process Saf. Environ. Prot. 2026, 203, 107876. [Google Scholar] [CrossRef]
  30. Hu, Q.; Yang, H.; Wang, K.; Wang, X.; Yan, K.; Yuan, M.; Qian, X. Explosion-venting overpressure structures and hazards of lithium-ion batteries thermal runaway gas induced by multiple vents of energy storage system container. J. Energy Storage 2024, 93, 113173. [Google Scholar] [CrossRef]
  31. Yang, J.; Zhao, J.; Shao, L. Risk assessment of coal mine gas explosion based on fault tree analysis and fuzzy polymorphic bayesian network: A Case Study of Wangzhuang Coal Mine. Processes 2023, 11, 2619. [Google Scholar] [CrossRef]
Figure 1. Schematic diagram of a fault tree.
Processes 14 00674 g001
Figure 2. Membership function curve of linguistic variable.
Processes 14 00674 g002
Figure 3. Mapping process from fault Tree to Bayesian network.
Processes 14 00674 g003
Figure 4. Fault tree of deflagration risk in an electrochemical energy storage station.
Processes 14 00674 g004
Figure 5. Bayesian network structure of energy storage power station deflagration.
Processes 14 00674 g005
Figure 6. Bayesian network diagram.
Processes 14 00674 g006
Figure 7. First level node probability diagram.
Processes 14 00674 g007
Figure 8. Second-level node probability diagram.
Processes 14 00674 g008
Figure 9. Third-level node probability diagram.
Processes 14 00674 g009
Figure 10. Results of inverse reasoning for node A1.
Processes 14 00674 g010
Figure 11. Results of inverse reasoning for node A2.
Processes 14 00674 g011
Figure 12. Results of inverse reasoning for node A4.
Processes 14 00674 g012
Figure 13. Sensitivity analysis of deflagration risk.
Processes 14 00674 g013
Figure 14. Nodes with high sensitivity.
Processes 14 00674 g014
Figure 15. Schematic diagram of the defense-in-depth and preventive maintenance framework.
Processes 14 00674 g015
Table 1. Risk factors of deflagration for electrochemical energy station.
First Level IndicatorsSecond Level IndicatorsThird Level IndicatorsDescription
A1 Ignition SourceB1 Electrical System FailureC1Insufficient torque on battery connection bolts
C2Aged/damaged cable insulation (short-circuit discharge)
C3Design flaws in power distribution cabinets (arc discharge)
C4Electrical circuit overload (high-temperature)
C5Lack of deflagration-proof electrical equipment (electrical sparks)
C6Grounding system failure
B2 Battery Thermal RunawayC7Battery overcharge/over-discharge (exothermic side reactions)
C8Internal short circuit (separator damage leading to thermal runaway)
C9BMS voltage monitoring failure (failure of overcharge protection)
C10Poor thermal design of battery pack (heat accumulation)
C11Product defects, manufacturing contamination (local micro-short circuits)
B3 Sparks and Hot SurfacesC12Mechanical impact on batteries
C13A short circuit caused by coolant leakage contacting metal components
C14Equipment friction-induced heating
C15Thermal management system failure
C16Local temperature overheating during equipment operation
A2 Combustible MaterialsB4 Battery MaterialsC17Electrolyte leakage
C18Graphite anode dust
C19Conductive carbon black
C20Thermal decomposition of cathode materials
C21Separator thermal shrinkage (accelerating internal short circuits)
B5 Thermal Runaway ProductsC22Gases ejected during thermal runaway (containing flammable H2/CO)
C23Electrolyte pyrolysis vapors
C24Molten battery casing materials
C25Electrode particles ejected during thermal runaway
A3 Oxidizing ConditionsB6 Oxygen SupplyC26Improper design/control of ventilation system (continuous introduction of fresh air)
C27Malfunction or leakage of deflagration-proof pressure relief valves (continuous ingress of external air)
C28Heating, ventilation, air conditioning/ environmental control system failure (running continuously in fresh air mode)
C29Inerting system failure (interruption of nitrogen protection)
A4 Confined SpaceB7 Physical ConfinementC30Relatively enclosed energy storage container
C31Lack of pressure relief devices or insufficient venting area
C32Construction defects in deflagration-proof walls
C33Ventilation openings blocked or obstructed
B8 Layout and StructureC34Insufficient spacing between battery clusters
C35Multi-layer non-framed containers
C36Blocked fire lanes
C37Poor equipment layout
C38Aging of container components (degraded blast resistance)
B9 Confined Space Safety System FailureC39Gas concentration monitoring system failure
C40Automatic deflagration suppression system failure
C41Emergency ventilation system failure
C42Pressure relief device failure
C43Temperature monitoring system failure
Table 2. Overview of Causes in Typical Deflagration Accidents at Energy Storage Stations (2019–2025).
DateLocationProjectCause of Accident
24 September 2019Pyeongchang, KoreaSolar energy storage system in Pyeongchang-gun, Gangwon-doOvercharging of ternary lithium batteries caused increased voltage, leading to an internal short circuit.
19 April 2019Arizona, USAArizona Public Service energy storage facility in McMickenA defect in the battery module (initial failure of a battery cell) led to thermal runaway. Oxygen introduced by firefighters opening the compartment triggered an explosion.
6 April 2021Chungcheongnam-do, KoreaEnergy storage unit at a photovoltaic power station in Hongseong-gunTernary lithium battery failure.
16 April 2021Beijing, ChinaEnergy storage power station in Fengtai, BeijingGases released during battery thermal runaway ignited by an open flame or electrical spark, causing an explosion.
30 July 2021Victoria, AustraliaTesla Megapack at the Victorian Big Battery project during testingA coolant leakage in the cooling system caused a battery short circuit, leading to a fire that spread through the battery module.
12 January 2022Nam-gu, Ulsan, KoreaEnergy storage system provided by LG Energy SolutionA defect in the Battery Management System (BMS) led to overcharging, causing thermal runaway and subsequent explosion of released gases.
13 February 2022California, USAMoss Landing energy storage station in Monterey CountyOverheating of multiple battery packs triggered the automatic release system.
26 May 2024Hainan, ChinaEnergy storage station in Wenchang, operated by China Huadian GroupThe power distribution box at the bottom of the battery was damaged by external impact, causing a short circuit. This led to internal damage and arcing, igniting the batteries.
15 February 2025Taichung, TaiwanEnergy storage system in TaichungStorage cabinet tipped over, causing an internal short circuit and fire.
17 September 2025California, USAValley Center battery storage projectThermal runaway in an energy storage container released large amounts of gas, causing nearby containers to explode.
26 September 2025Daejeon, KoreaKEPCO (Korea Electric Power Corporation) testing facilitySpark-generating work (welding) ignited flammable gases released by the battery system, triggering an explosion.
Table 3. Judgment Matrix.
CriterionProfessional Title C1Educational Background C2Work Experience C3Domain Relevance C4
Professional Title C1a11 = 1a12 = 2a13 = 1/2a14 = 1/4
Educational Background C2a21 = 1/2a22 = 1a23 = 1/3a24 = 1/6
Work Experience C3a31 = 2a32 = 3a33 = 1a34 = 1/2
Domain Relevance C4a41 = 4a42 = 6a43 = 2a44 = 1
Table 4. Expert competency evaluation framework and scoring standards.
Evaluation Dimension (AHP Weight, ωk)Level DescriptionIntra-Dimension Score (k)
Professional Title (ω1 = 0.140)Senior Engineer1.0
Intermediate Engineer0.8
Junior Engineer0.6
Technician0.4
Educational Background (ω2 = 0.081)Doctorate1.0
Master’s Degree0.8
Bachelor’s Degree0.6
College Diploma0.4
Work Experience (ω3 = 0.260)≥20 years1.0
15~<20 years0.9
10~<15 years0.8
5~<10 years0.6
<5 years0.4
Domain Relevance (ω4 = 0.519)Very Relevant1.0
Relatively Relevant0.8
Generally Relevant0.6
Basically Relevant0.4
Table 5. Profile of the expert panel.
NumberProfessional TitleEducational BackgroundWork Experience [Years]Domain Relevance
E1Senior EngineerDoctorate≥20 Very Relevant
E2Senior EngineerMaster’s Degree15~<20Very Relevant
E3Intermediate EngineerMaster’s Degree10~<15Relatively Relevant
E4Senior EngineerBachelor’s Degree10~<15Very Relevant
E5Intermediate EngineerDoctorate5~<10Relatively Relevant
E6Junior EngineerMaster’s Degree5~<10Generally Relevant
E7TechnicianCollege Diploma≥20Relatively Relevant
E8Senior EngineerBachelor’s Degree<5Basically Relevant
E9Intermediate EngineerBachelor’s Degree15~<20Generally Relevant
E10Junior EngineerMaster’s Degree<5Very Relevant
Table 6. Linguistic variables and corresponding trapezoidal fuzzy numbers.
Linguistic TermFuzzy Numbers
Very low (VL)(0, 0, 0.1, 0.2)
Low (L)(0.1, 0.2, 0.2, 0.3)
Moderately Low (ML)(0.2, 0.3, 0.4, 0.5)
Medium (M)(0.4, 0.5, 0.5, 0.6)
Moderately High (MH)(0.5, 0.6, 0.7, 0.8)
High (H)(0.7, 0.8, 0.8, 0.9)
Very high (VH)(0.8, 0.9, 1.0, 1.0)
Disclaimer/Publisher’s Note: The statements, opinions and data contained in all publications are solely those of the individual author(s) and contributor(s) and not of MDPI and/or the editor(s). MDPI and/or the editor(s) disclaim responsibility for any injury to people or property resulting from any ideas, methods, instructions or products referred to in the content.