Article

Study on the Influence of Rock Pore Structure on Radon Diffusion Coefficient and Permeability Based on Quartet Structure Generation Set Method


1
School of Resources Environment and Safety Engineering, University of South China, Hengyang 421001, China
2
National & Local Joint Engineering Research Center for Airborne Pollutants Control and Radioactivity Protection in Buildings, University of South China, Hengyang 421001, China
3
School of Civil Engineering, University of South China, Hengyang 421001, China
*
Author to whom correspondence should be addressed.
Processes 2026, 14(4), 634; https://doi.org/10.3390/pr14040634
Submission received: 19 December 2025 / Revised: 3 February 2026 / Accepted: 4 February 2026 / Published: 12 February 2026

Abstract

As pore space serves as the primary migration pathway of radon in rock media, investigating the influences of pore structural characteristics on radon migration is essential. In this study, the rock pore structure was numerically reconstructed via the Quartet Structure Generation Set (QSGS) method, based on the characteristic parameters extracted from real rock pore models obtained from CT scanning. Quantitative comparison results indicate that the permeability and radon diffusion coefficient of the QSGS-reconstructed models are highly consistent with those of the CT-based model, which verifies the reliability and effectiveness of the QSGS method. A series of three-dimensional (3D) rock pore models with different porosities (η), distribution probabilities (Pd), and growth probabilities (G) were constructed using the QSGS method. The radon diffusion coefficient, tortuosity factor and permeability of these models under dry conditions were quantitatively determined. The relationship between the radon diffusion coefficient, water saturation and temperature was obtained using the tortuosity factor of the pore models and the unsaturated non-isothermal radon diffusion coefficient model. Furthermore, the relationship between the relative permeability of the air and water phases and water saturation was obtained by coupling the calculated permeability with the Brooks–Corey model. The results demonstrate that the η was positively correlated with both the radon diffusion coefficient and permeability, with a more pronounced positive correlation observed for permeability. Under low η conditions, Pd was positively correlated with both the radon diffusion coefficient and permeability; under medium-porosity conditions, Pd was positively correlated with the radon diffusion coefficient but negatively correlated with permeability; under high-porosity conditions, Pd exhibited no significant correlation with the radon diffusion coefficient, while it shows a negative correlation with permeability. G in the principal direction was positively correlated with the radon diffusion coefficient and permeability along the same direction, but negatively correlated with those along orthogonal directions. The radon diffusion coefficient was strongly negatively correlated with water saturation, and weakly positively correlated with temperature. With an increase in water saturation, the relative air permeability presented a nonlinear decrease characterized by a fast-then-slow trend, whereas the relative water permeability showed a nonlinear increase with a slow-then-fast pattern.

1. Introduction

The radon in the indoor environment of underground engineering mainly originates from the radium-containing surrounding rocks. Radon atoms, which are radon-222, with a half-life of 3.82 days, posing potential hazards to the environment and human health, are formed by the decay of radium within matrix grains in rocks, subsequently enter the pores of rocks via the recoil effect, migrate to the surface under the combined action of diffusion and convection, and are ultimately released into the external environment [1]. It is evident that the pore structures of rocks themselves, as well as environmental conditions such as temperature and water saturation, all affect radon diffusion and convection in rocks. Studying the influences of different pore structures and environmental conditions on radon migration in rock pores helps fundamentally reveal the migration mechanism of radon in rocks, provides theoretical support and correction methods for macro-scale radon migration laws (regarded as the comprehensive reflection of microscale processes), and thereby offers more robust theoretical guidance for radiation protection in underground engineering.
The first step in conducting research on radon migration in rock pores is to establish a pore model. The main methods include experimental reconstruction methods and numerical reconstruction methods. Experimental reconstruction methods mainly include computed tomography technology (CT), scanning electron microscopy (SEM), nuclear magnetic resonance spectroscopy (NMRS), etc.; numerical reconstruction methods mainly include pore network modeling (PNM) and the four-parameter random growth method. Among them, compared with other methods, the QSGS method has the advantages of fewer parameters, clear physical meaning, strong parameter controllability, high generation efficiency, low computational cost, and ease of coupling with numerical simulation methods. It is widely used in research fields such as the petroleum and natural gas industry, building science and engineering, geology, safety science and disaster prevention, and the power industry. Ref. [2] constructed a two-dimensional shale micro-pore model using the QSGS method and studied the flow mechanism of shale gas. Huo et al. [3] studied the influence of the Rayleigh number and porosity on the heat transfer process of battery thermal management (BTM) using the QSGS method and the LBM method. Yao et al. [4] studied the influence of different two-dimensional porous electrode structures and operating parameters on the desalination performance of desalination batteries using the QSGS method and the LBM method. For Liu et al. [5], the microstructure of the porous medium constructed using the QSGS method formed a representative volume element (REV) model, and they obtained the stress–strain curves of REV in the elastic–plastic stage under different conditions. Jin et al. [6] studied the effective thermal conductivity of thermal barrier coatings (TBC) prepared through different plasma spraying techniques using the QSGS method. Li et al. [7] constructed the mesoscale internal structures of anisotropic rock and soil materials using the QSGS method and evaluated their effective thermal properties using the finite element method and Monte Carlo method. Huang et al. [8] studied the influence of the pore volume and characteristic parameters of two-dimensional foam metal on the heat transfer process of the porous structure using the QSGS method and the LBM method. Guan et al. [9] constructed various microscopic porous metal material models using the QSGS method and studied their sound absorption performance. Wang et al. [10] studied the influence of the pore volume and specific surface area of two-dimensional porous media on the flow and apparent permeability of rarefied gas using the QSGS method and the MRT-LBM method. Wang et al. [11] constructed the coal pore structure using the QSGS method and simulated the gas dynamics distribution in the coal roadway using the LBM method. Wang et al. [12] constructed the microscopic structure of composite phase change materials (CPCMs) using the QSGS method and determined its effective thermal conductivity using the finite element method. Li et al. [13] constructed the microscopic structure of two-dimensional plant fiber materials using the QSGS method and calculated its effective thermal conductivity using the LBM method. Yang et al. [14] studied the fluid heat transfer and flow characteristics of the wall of diesel particulate filter using the QSGS method and the LBM method. Zhu et al. [15] constructed porous medium models with different porosities using the QSGS method and CT scanning method and studied the variation law of the hydraulic curvature of the model with porosity. Liao et al. [16] used the QSGS method to generate the porous structure for immobilized particles used in biohydrogen production, and studied the influence of porosity on the flow field, concentration field, and hydrogen production performance. Cai et al. [17] used the QSGS method and the Sierpinski carpet method to construct the geometric structure of a dehumidification finned plate solid dryer and studied its electroosmotic properties. Liu et al. [18] sintered copper joints with different porosities, reformed them into three-dimensional models using the QSGS method, and studied the influence of pore structure on thermal performance and electrical performance. Zhao et al. [19] generated the microstructure of porous concrete using the QSGS method and studied the relationship between permeability and seepage velocity and porosity. Xia et al. [20] combined the QSGS method and the LBM method to study the effects of porosity, particle size, and soil particle shape on the permeability of frozen soil. Wu et al. [21] combined the QSGS method and the LBM method to study the multi-scale flow characteristics of engine particulate filters at the pore scale and representative unit volume (REV) scale. Zeng et al. [22] constructed two-dimensional porous media with different porosities and distribution probabilities using the QSGS method and calculated their permeabilities and radon diffusion coefficients.
The current research status demonstrates that the QSGS method has been mainly applied to investigations on fluid flow and heat transfer in porous media across diverse research fields. Nevertheless, there are still few studies on radon migration, and the related investigations are limited to two-dimensional models, homogeneous porous media, and saturated seepage conditions. Previous research has failed to consider the spatial connectivity of pore structures, the anisotropy of radon migration parameters, and the evolutionary characteristics of radon migration under unsaturated seepage and diffusion conditions, which leads to the limited universality and applicability of the existing conclusions.
The main research contents of this paper are summarized as follows: (1) Based on the porosity characteristics and radon migration parameters derived from the CT pore model of a miniature rock specimen, a series of three-dimensional reconstructed pore models with similar properties were constructed using the QSGS method, which verifies the effectiveness and reliability of the method. (2) A variety of three-dimensional random pore models with different porosities and distribution probabilities were constructed, and the relationships between the radon diffusion coefficient and permeability of the pore models and the porosity and distribution probabilities were analyzed. (3) A variety of three-dimensional random pore models with higher growth probabilities in one and two principal directions were constructed, and the relationships between the radon diffusion coefficient and permeability of the pore models and the degree of medium heterogeneity were analyzed. (4) Combining the calculated radon migration parameters and the unsaturated non-isothermal radon diffusion coefficient model and Brooks–Corey model, the unsaturated non-isothermal radon diffusion coefficient and relative permeability of the pore models under various water saturation and temperature conditions were calculated.

2. Methodology

2.1. Modeling Method

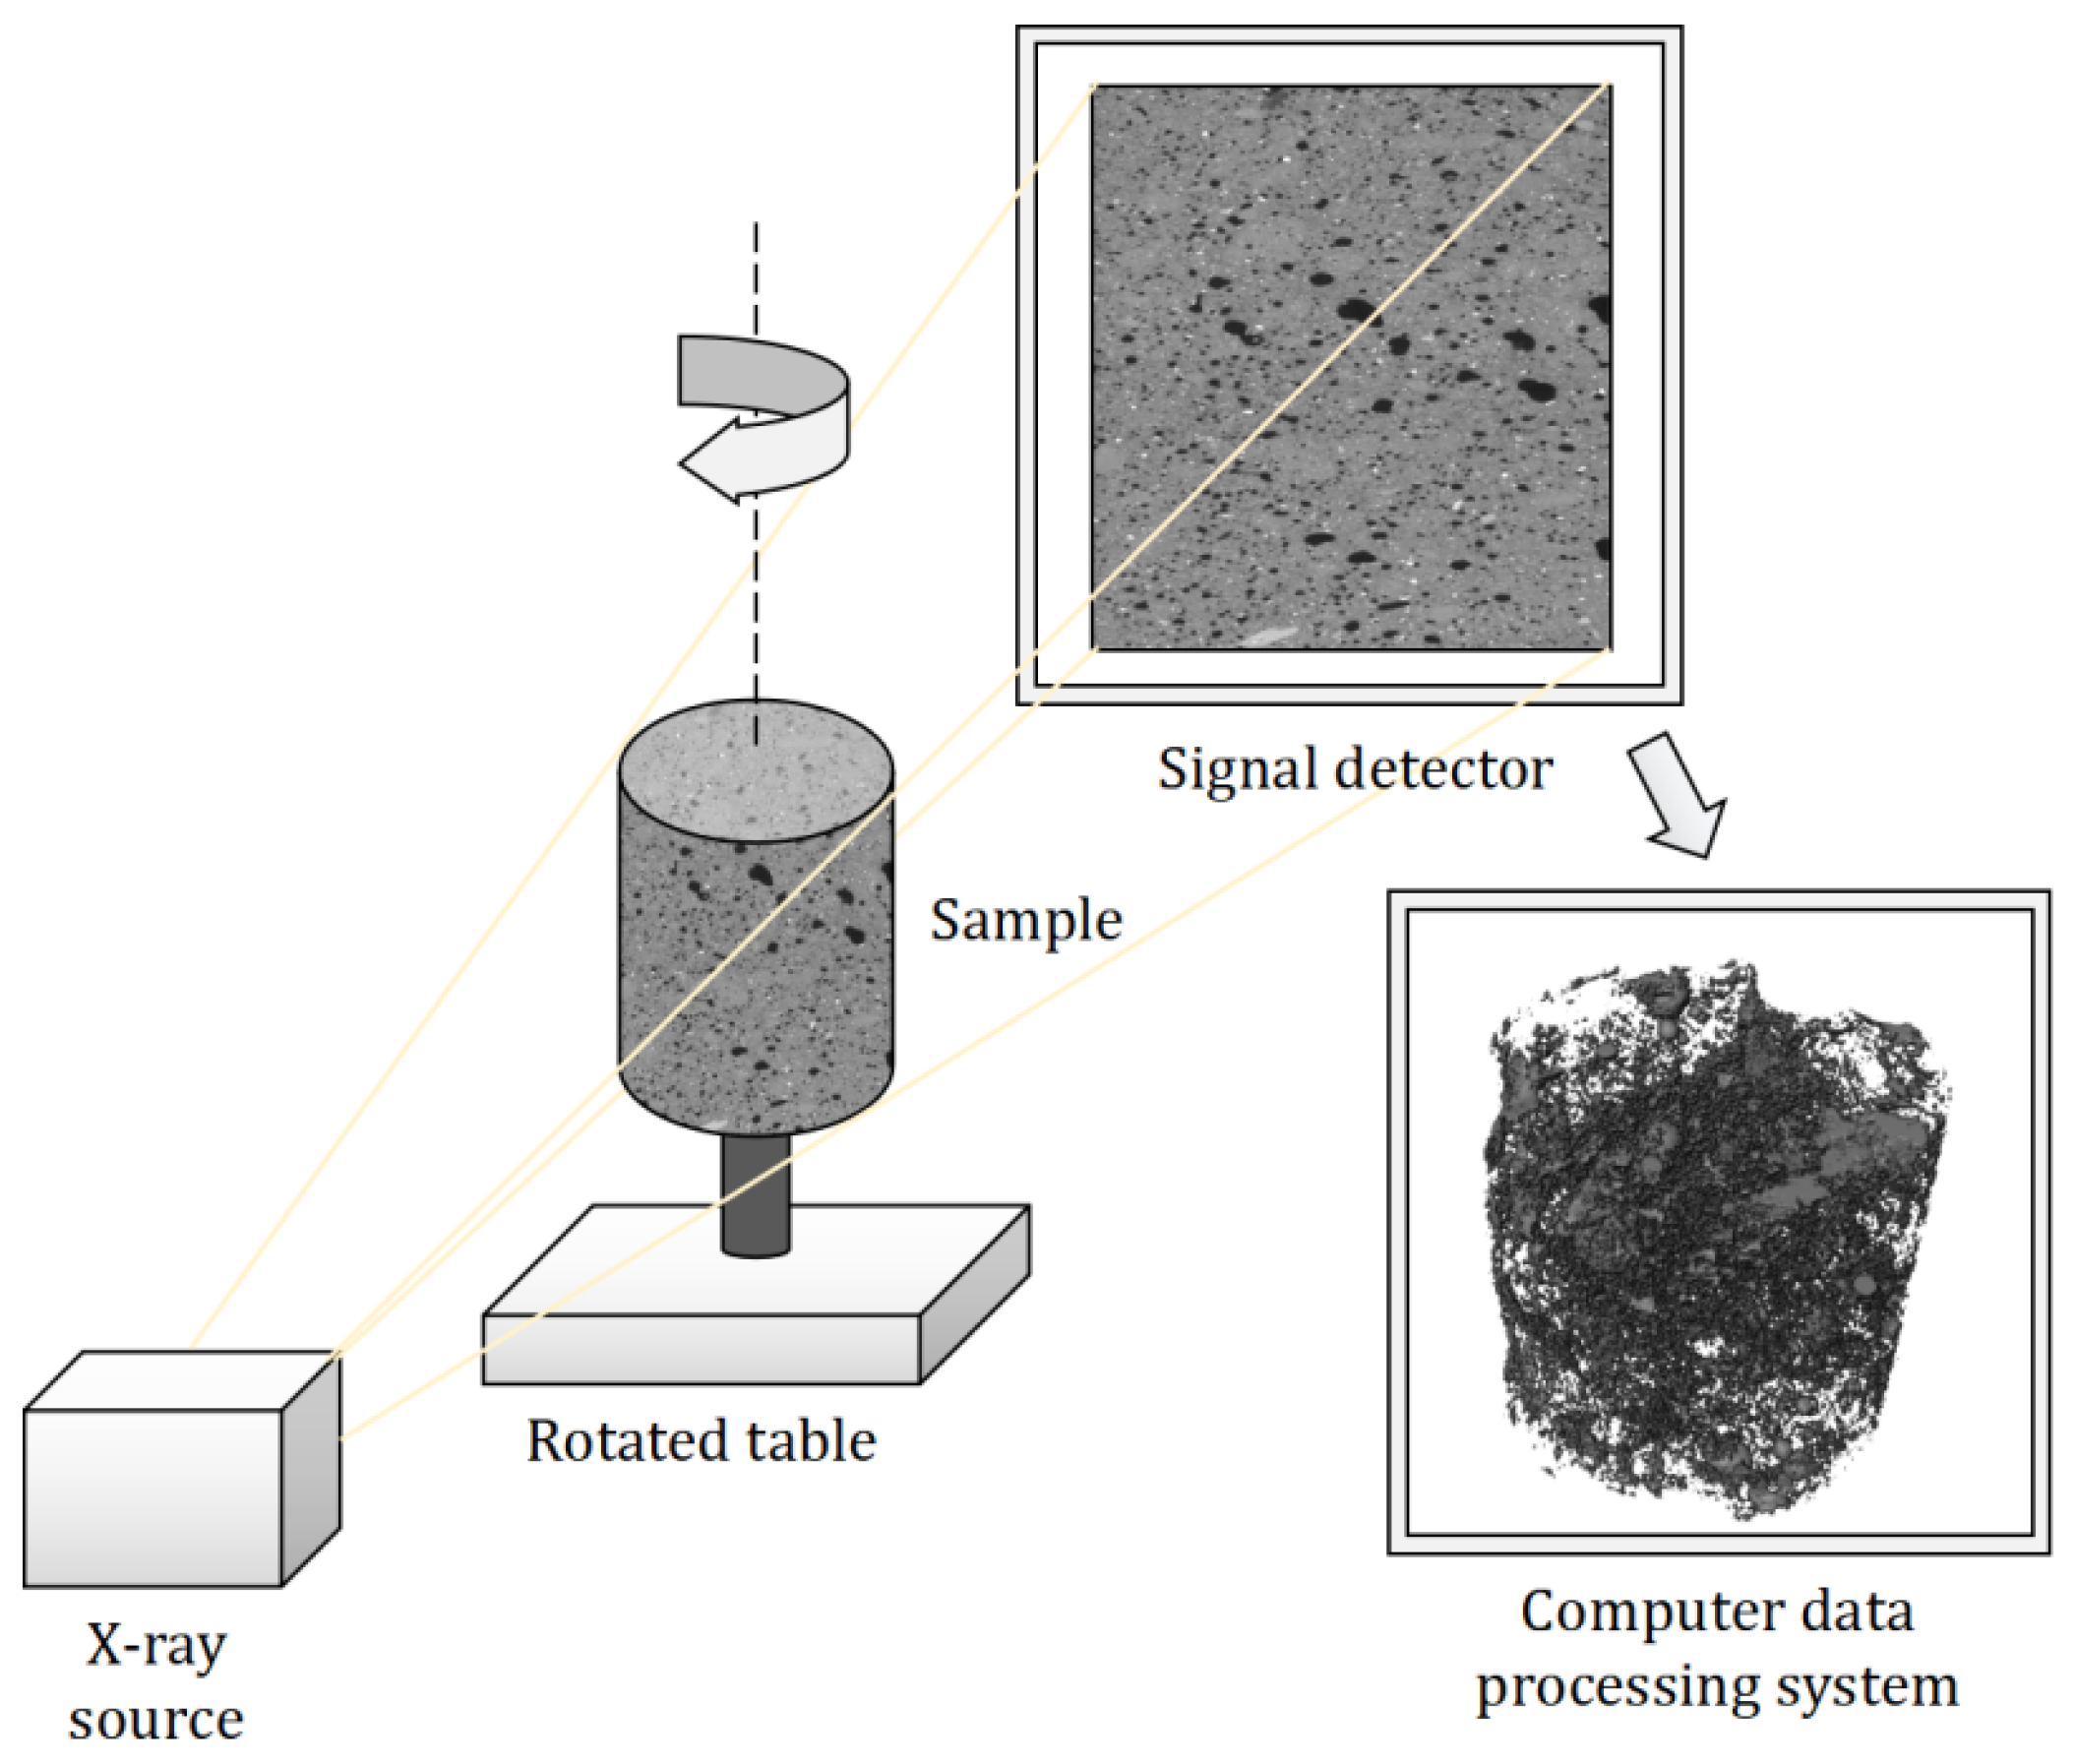
In this study, two modeling approaches, namely the computer tomography (CT) and the QSGS method, were adopted to construct the rock pore models. As a non-destructive testing technique, CT acquires three-dimensional cross-sectional images of an object by means of X-rays and computer reconstruction technology. Based on these cross-sectional images, it can further reconstruct a three-dimensional pore model with detailed microscopic pore features, thus enabling the extraction of microscopic structural characteristic information of the pore space. Specifically, a real pore model of the rock specimen was established via CT scanning (Yinghua NDT (Shanghai) Co., Ltd., Shanghai, China), which served as a benchmark to verify the effectiveness and applicability of the QSGS method. The schematic diagram is shown in Figure 1.
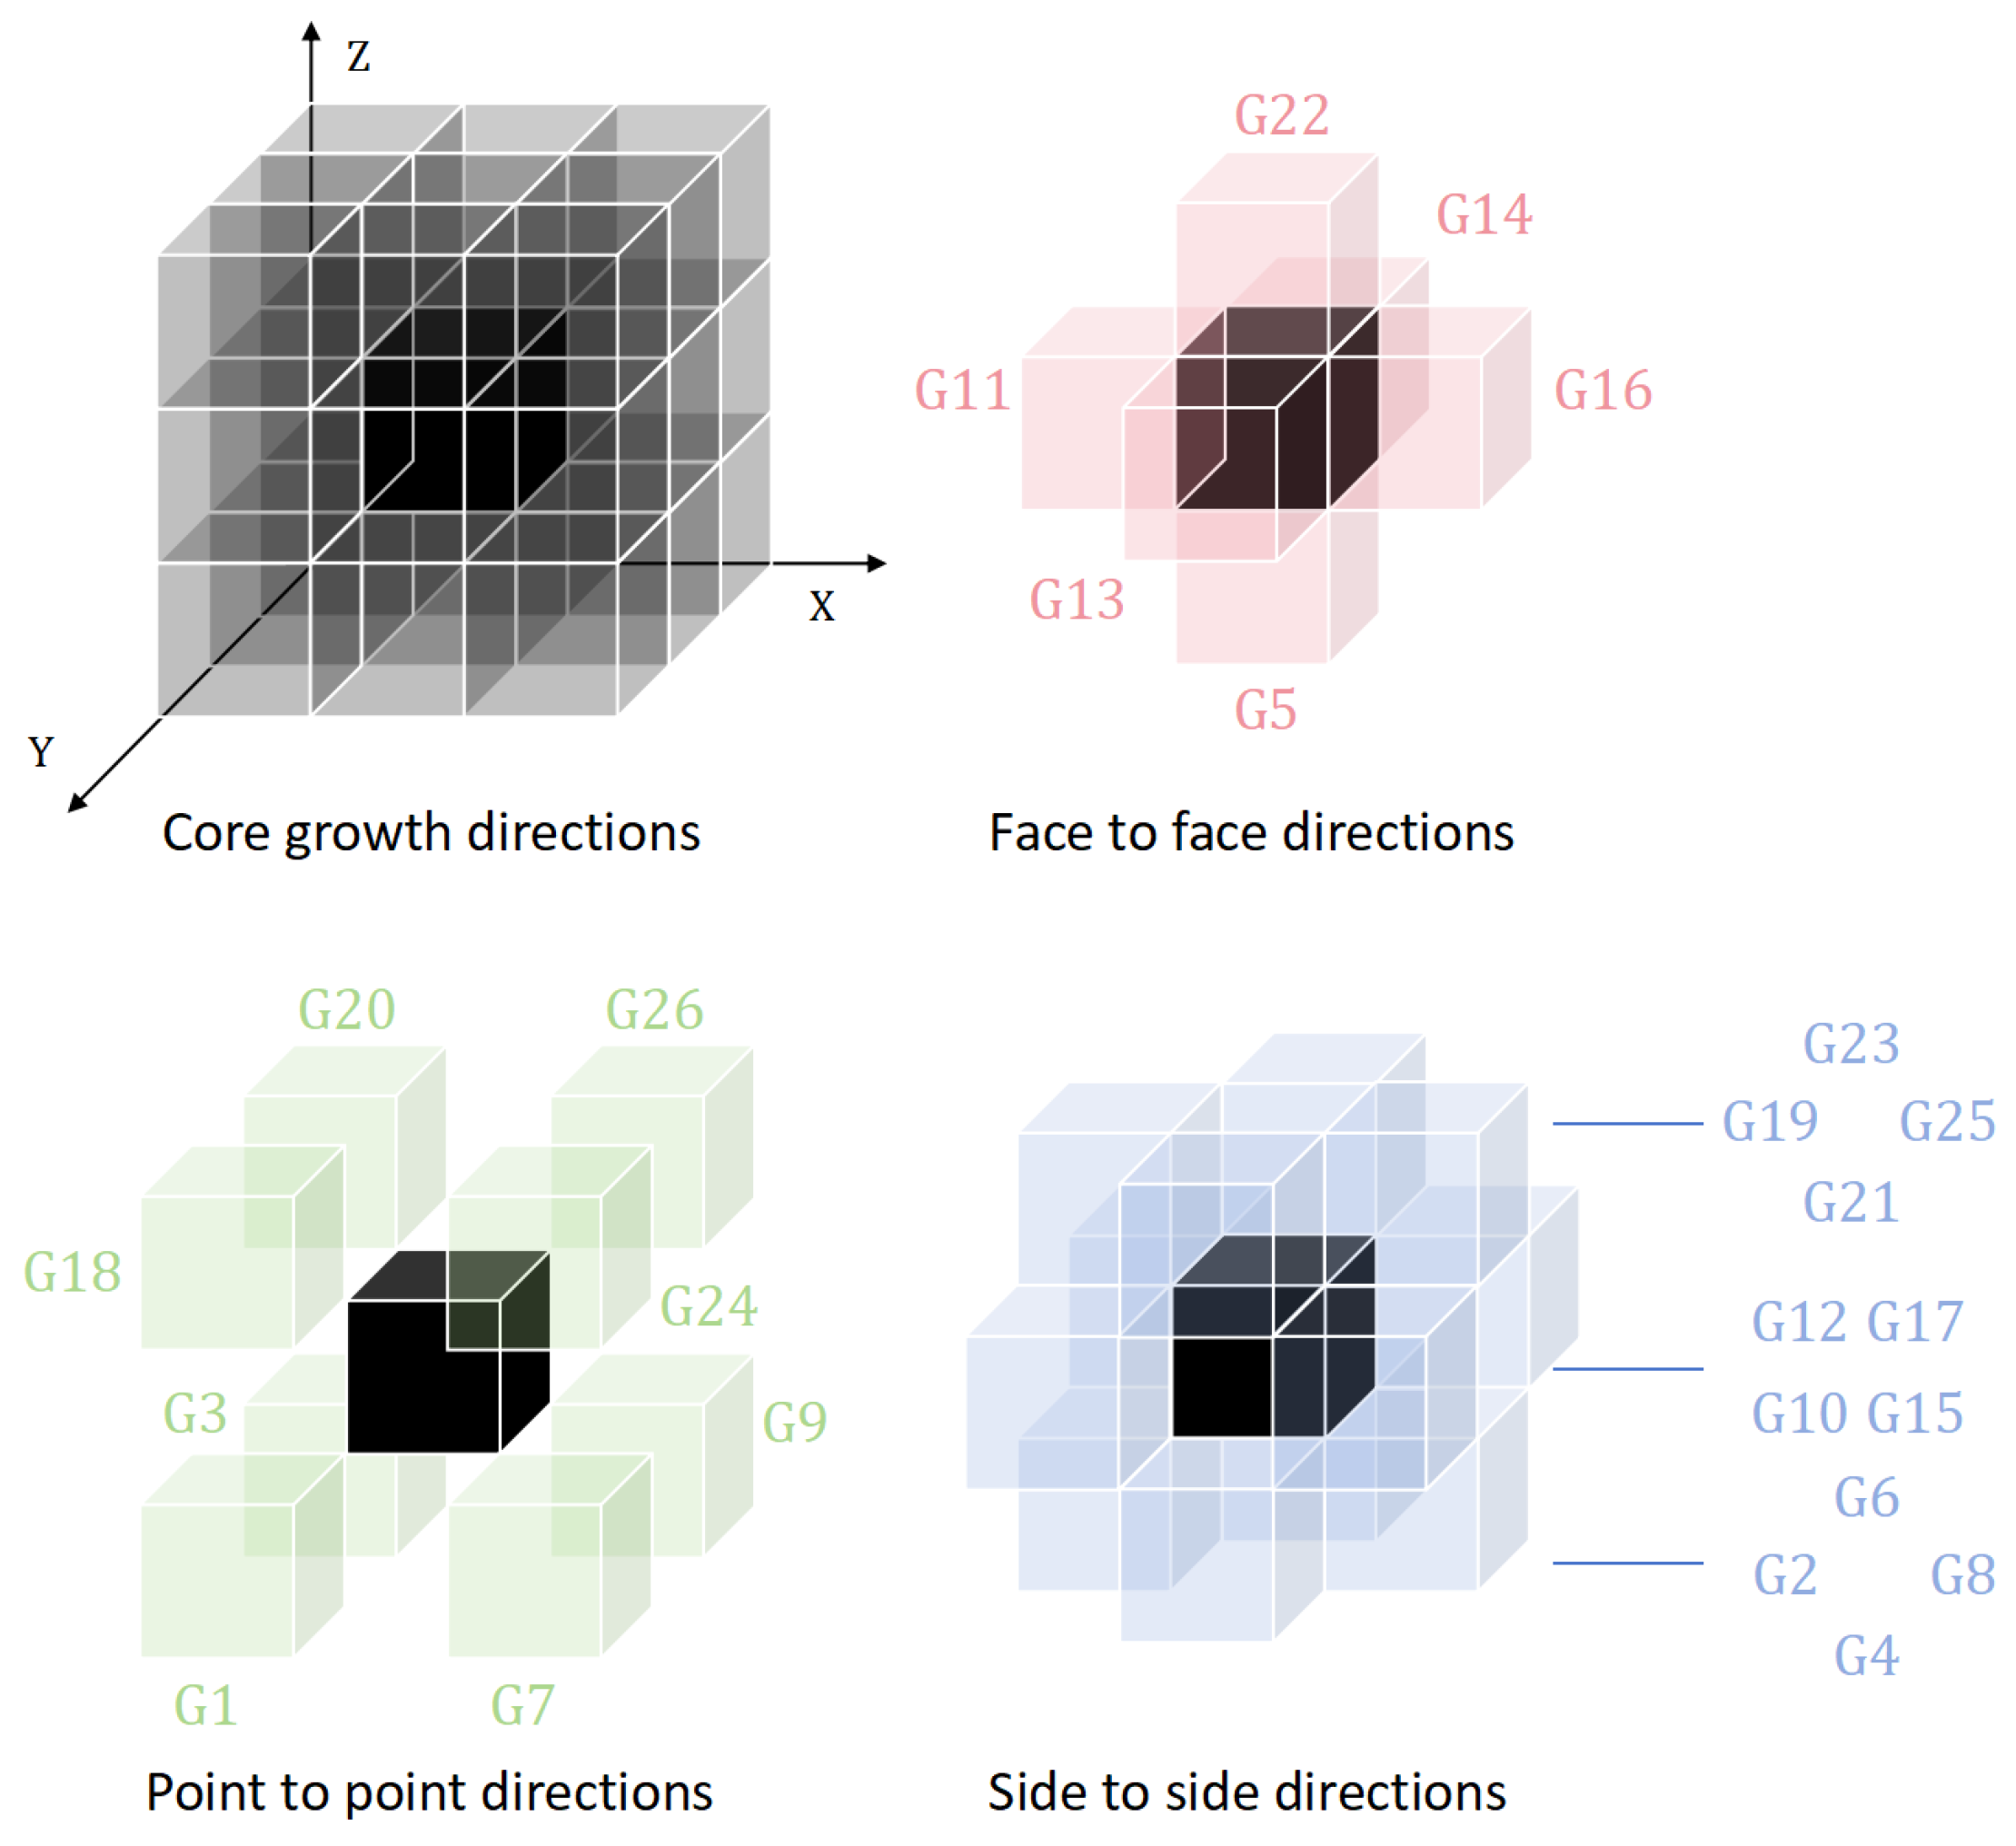
The QSGS method, as an algorithm based on probabilistic rules, simulates the formation process of the microstructure of multi-phase materials on a three-dimensional grid by controlling four key parameters: porosity (η), distribution probability (Pd), growth probability (G), and phase number (N) [23]. The phase number (N) in the single-phase case can be ignored. In this study, the QSGS method was adopted to construct rock pore models with various porosities, pore dispersion degrees, and heterogeneity levels in order to investigate the influence of microscopic pore structure characteristics on radon diffusion and seepage performances. The schematic diagram is shown in Figure 2, with the steps as follows: (1) Pore units (pure black cubes) in the three-dimensional model space are randomly generated based on Pd. (2) New pore units around the pore units in 26 directions (semi-transparent black cubes) are generated according to the growth probabilities (G1~G26). (3) This second step is repeated until the porosity of the porous medium reaches the preset value η.

2.2. Numerical Method

The migration of radon in the pores of porous emanating media is generally described by the convection diffusion equation with a decay term and source term, as shown in Equation (1).
C / t + C U D m C = α λ R n C
where C is the radon concentration, Bq/m3; t is time, s; U is the velocity of fluid in the pore, m/s; Dm is the molecular diffusion coefficient of radon in the fluid in the pore; α is the radon source term, Bq/(m3·s). λRn is the radon decay coefficient, which is about 2.1 × 10⁻⁶ s−1.
The Navier–Stokes equations are used to solve the fluid flow in the pores, as shown in Equation (2).
ρ U t + ρ U U = ρ I + μ ( U + U T ) + F + ρ g ρ t + ρ U = 0
where I is the unit vector; F is the volume force, N/m3; g is the acceleration of gravity, m/s2.
Permeability is defined as the ability of porous media to allow fluid to pass through under a certain pressure difference. It is a parameter that characterizes the ability of porous media to conduct fluid, which can be calculated using Darcy’s law, as shown in Equation (3).
κ = μ U o u t / P
where κ is permeability, m2, and Uout is the mean normal velocity of the outflow surface of the medium, m/s.
In the unsaturated condition, the relative permeability in porous media can be expressed using the Brooks–Corey model (Equation (4)) [24].
κ r w = S e * 2 + 3 λ / λ κ r g = 1 S e * 2 1 S e * 2 + λ / λ S e * = S e S g / 1 S e c S g c
where κrw is the relative permeability of the water phase; κrg is the relative permeability of the gas phase; Se is the water saturation; Sg is the gas saturation; S e * is the effective water saturation; S g * is the effective gas saturation; Sec is the residual water saturation; Sgc is the residual gas saturation. λ is the pore distribution index, which describes the uniformity of the size distribution of soil pores; it is usually obtained by fitting experimental data (soil moisture characteristic curve), or can be estimated through the fractal dimension of the medium, as shown in Equation (5) [25].
λ = 3 D f
where Df represents the fractal dimension of the porous medium.
With the relative permeability of the water phase and gas phase under different water saturation conditions, the effective permeability is calculated based on the absolute permeability using Equation (6).
κ w = κ κ r w κ g = κ κ r g
The diffusion coefficient is defined as the mass of matter per unit area in unit time under a certain concentration gradient, which can be calculated using Fick’s first law, as shown in Equation (7).
D = J d / C
where D is the volume diffusion coefficient of radon in the porous medium, m2/s; Jd is the mean normal diffusion flux on the low-concentration side of the medium, Bq/(m2·s).
The unsaturated non-isothermal radon diffusion coefficient model in pores is expressed by Equation (8) [26].
D e f f = τ D a T S g + D w T S e T ω T / S a + S e ω T
where τ is the tortuosity factor of the porous medium and is expressed by Equation (9). T is the temperature, K; Da(T) and Dw(T) are the diffusion coefficients of radon in air and water, respectively, and they are positively correlated with temperature; ω(T) is the dissolution coefficient of radon in water, and it is also positively correlated with temperature.
τ = D e f f / D a
Based on the kinetic theory of molecules, the relationship between the diffusion coefficients of radon in air and temperature is expressed by Equation (10):
D a T = D a 273.15 T 273.15 1.5
where Da(273.15) is the molecular diffusion coefficient of radon in the air at 273.15 K, which is approximately 1 × 10⁻⁵ m2/s.
The relationship between the diffusion coefficient of radon in water and temperature can be expressed using the Arrhenius formula (Equation (11)):
D w T = D w 273.15 e x p 2165 1 T 1 273.15
where Dw(273.15) is the diffusion coefficient of radon in water at 273.15 K, which is approximately 1 × 10⁻⁹ m2/s.
The dissolution coefficient ω is a function of temperature, and it can be expressed as Equation (12):
ω = 0.157 + 0.405 e x p 0.0502 T 273.15

3. Modeling Method Validation

To verify the capability of the QSGS method in reconstructing rock pore models that match the real medium in terms of radon migration characteristics, CT scanning was conducted on a rock specimen to acquire its microscopic real pore structure and porosity. Radon diffusion and seepage simulations were carried out to determine the permeability and radon diffusion coefficient of the specimen in three directions. Based on the above parameters, the parameters of the QSGS method such as porosity (η), distribution probability (Pd), and growth probability (G) were set to construct a series of random pore models; the radon diffusion coefficient and permeability were obtained through radon diffusion and seepage simulations, and a quantitative comparison with the CT pore model was conducted. If the two sets of parameters of the reconstructed models are highly consistent with those of the CT model, it demonstrates that the QSGS-reconstructed models possess equivalent radon migration properties to the original real rock medium, thereby verifying the effectiveness and reliability of the QSGS method for such pore structure reconstruction.
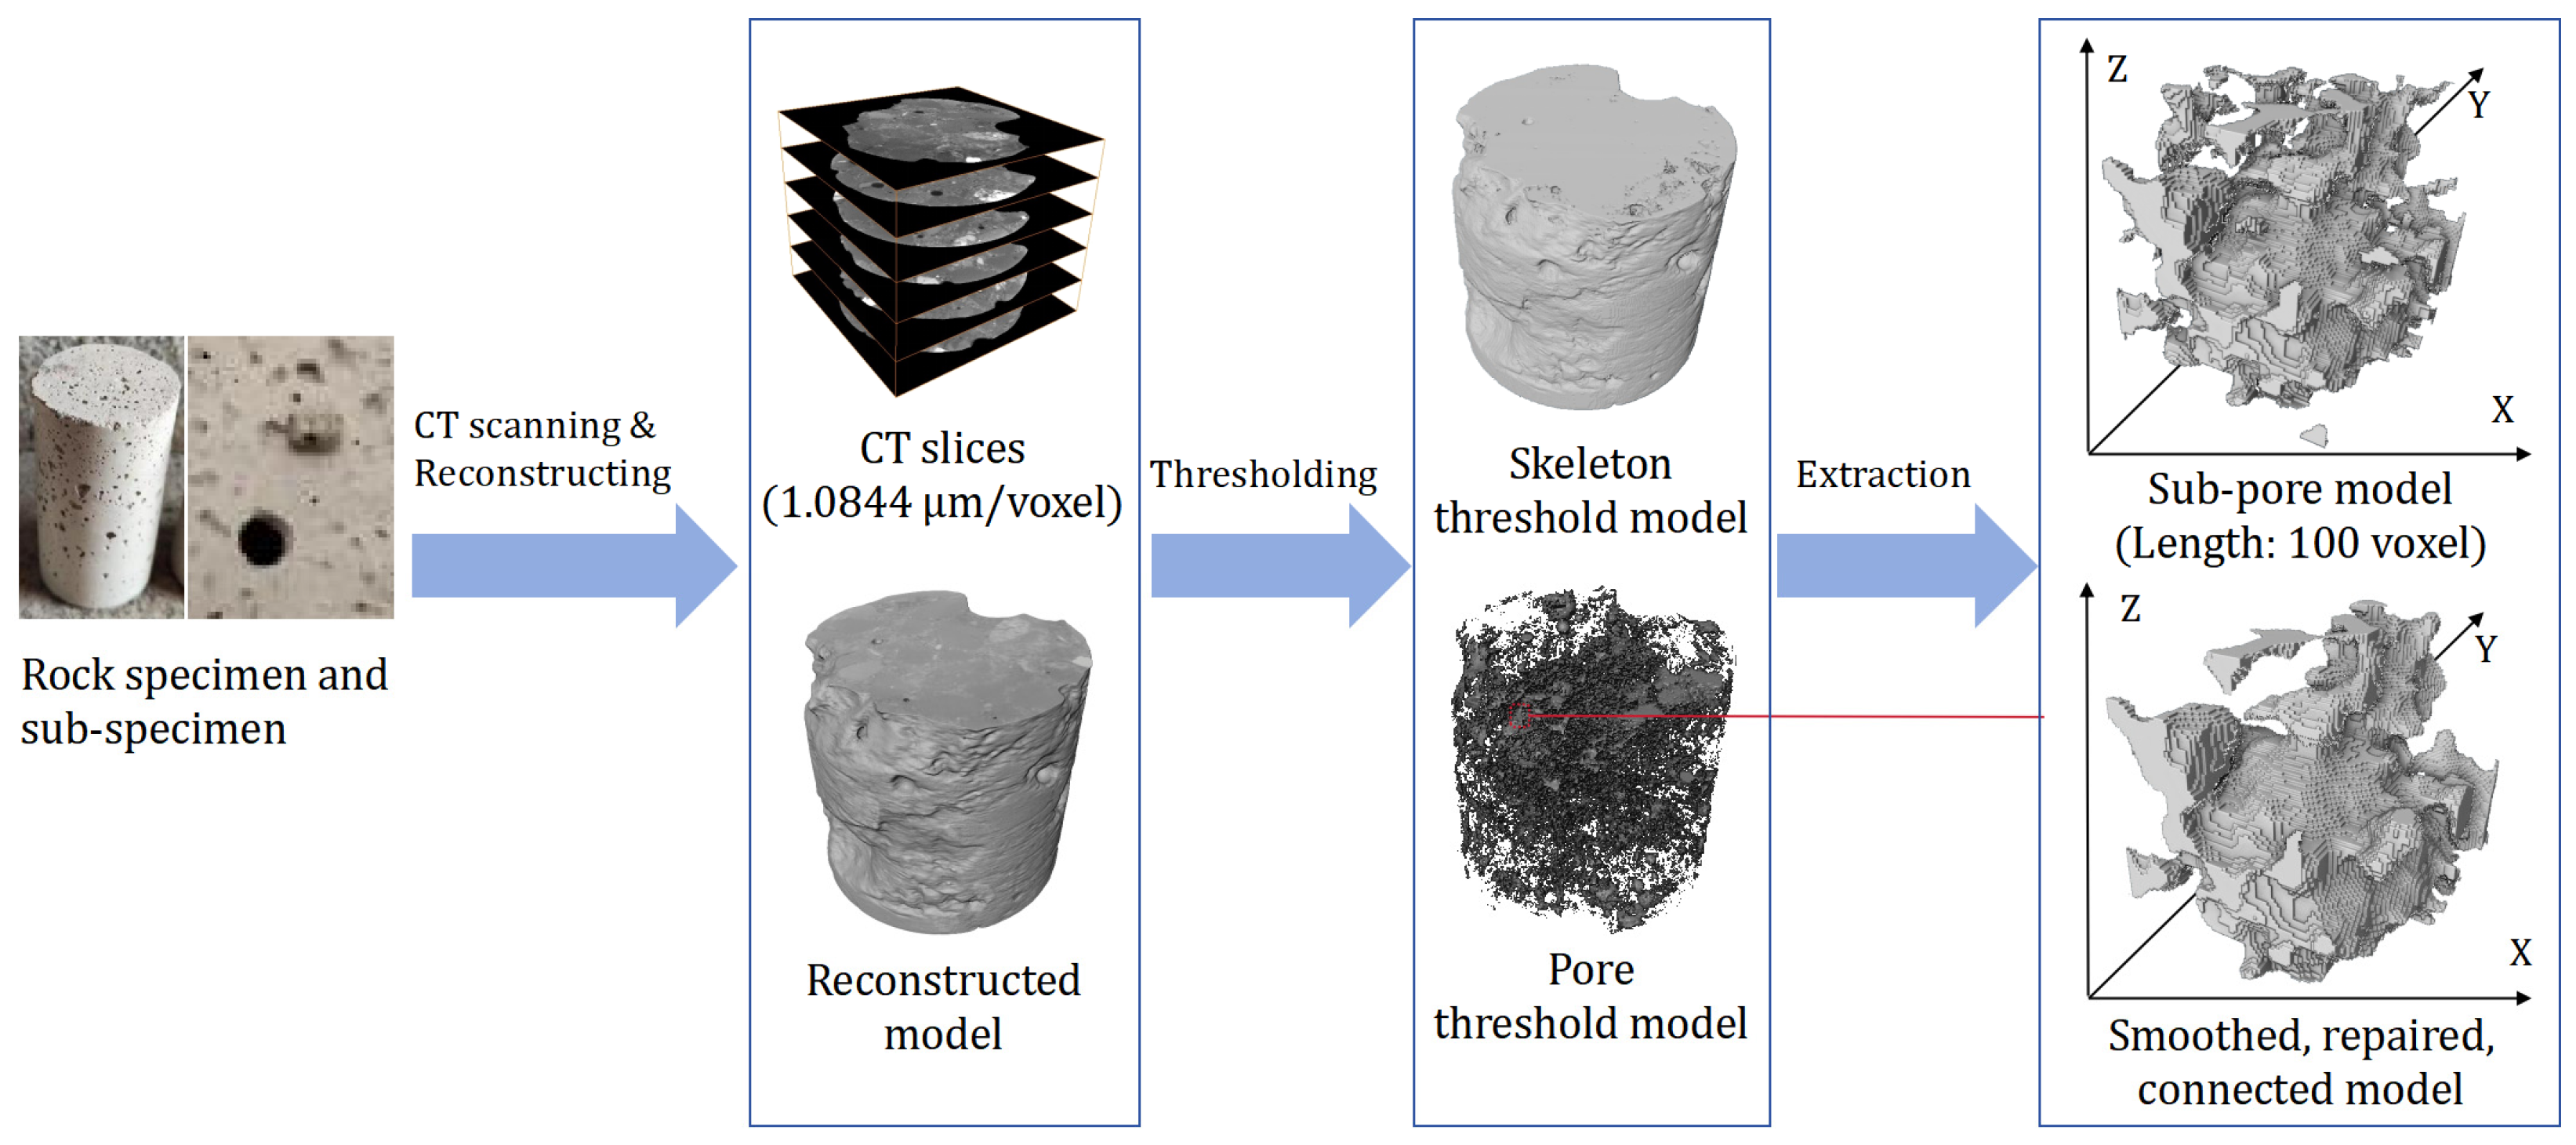
Owing to the difficulty in acquiring uranium-bearing surrounding rock from underground engineering and the excessive radioactivity of natural rock samples that renders them inapplicable for laboratory tests, a rock-like specimen was prepared with a typical uranium-bearing sandstone as the prototype, using quartz sand, uranium tailing sand, cement and water at a given mass ratio of cement:quartz sand:uranium tailing sand:water = 5:10:5:3 based on the model similarity principle. This specimen preparation approach has been widely applied in relevant research on radon migration in rocks [27,28,29]. A cylindrical sub-specimen with a diameter of 2.2 mm and a height of 1.8 mm was drilled from the specimen mentioned above, and CT scanning with a resolution of 1.0844 μm/voxel was performed, obtaining 1700 slices. The gray-scale adjustment and filtering processing were carried out in the Thermo Scientific Avizo 2020 software, and a three-dimensional model was constructed using direct volume rendering technology. The watershed algorithm was used to perform threshold segmentation on the pore and skeleton parts of the model, obtaining the pore threshold model and the skeleton threshold model. Then, a sub-pore model with a side length of 100 voxels was divided in the pore threshold model as the comparison model for the QSGS reconstruction. Since the micrometer-scale pore structure obtained through high-resolution CT scanning is extremely complex, it needs to be preprocessed before numerical simulations, including removing islands, smoothing processing, connectivity analysis, etc., to eliminate topological errors and details that have little influence on the main parameters and remove isolated pores that have no effect on material migration, in order to achieve the purpose of correcting and simplifying the model. The specific steps are shown in Figure 3.

3.1. Mesh-Independence Validation

To ensure that the numerical calculation accuracy meets the requirements while keeping the calculation cost within an acceptable range, by adjusting the three parameters, Facet Size, Facet Distance, and Cell Size, in Avizo, different density meshes were generated for the CT pore model to conduct the mesh independence verification. The meshes were non-uniform and adaptive: finer elements were deployed in the geometrically complex local regions of pores and throats to capture detailed structural features, while coarser elements were applied in the relatively regular regions of pores and throats to balance computational efficiency. Facet Size controls the size of the surface patches (surface triangles) on the mesh; Facet Distance controls the approximation error between the boundary and the subdivided surface; Cell Size controls the size of the tetrahedral mesh.
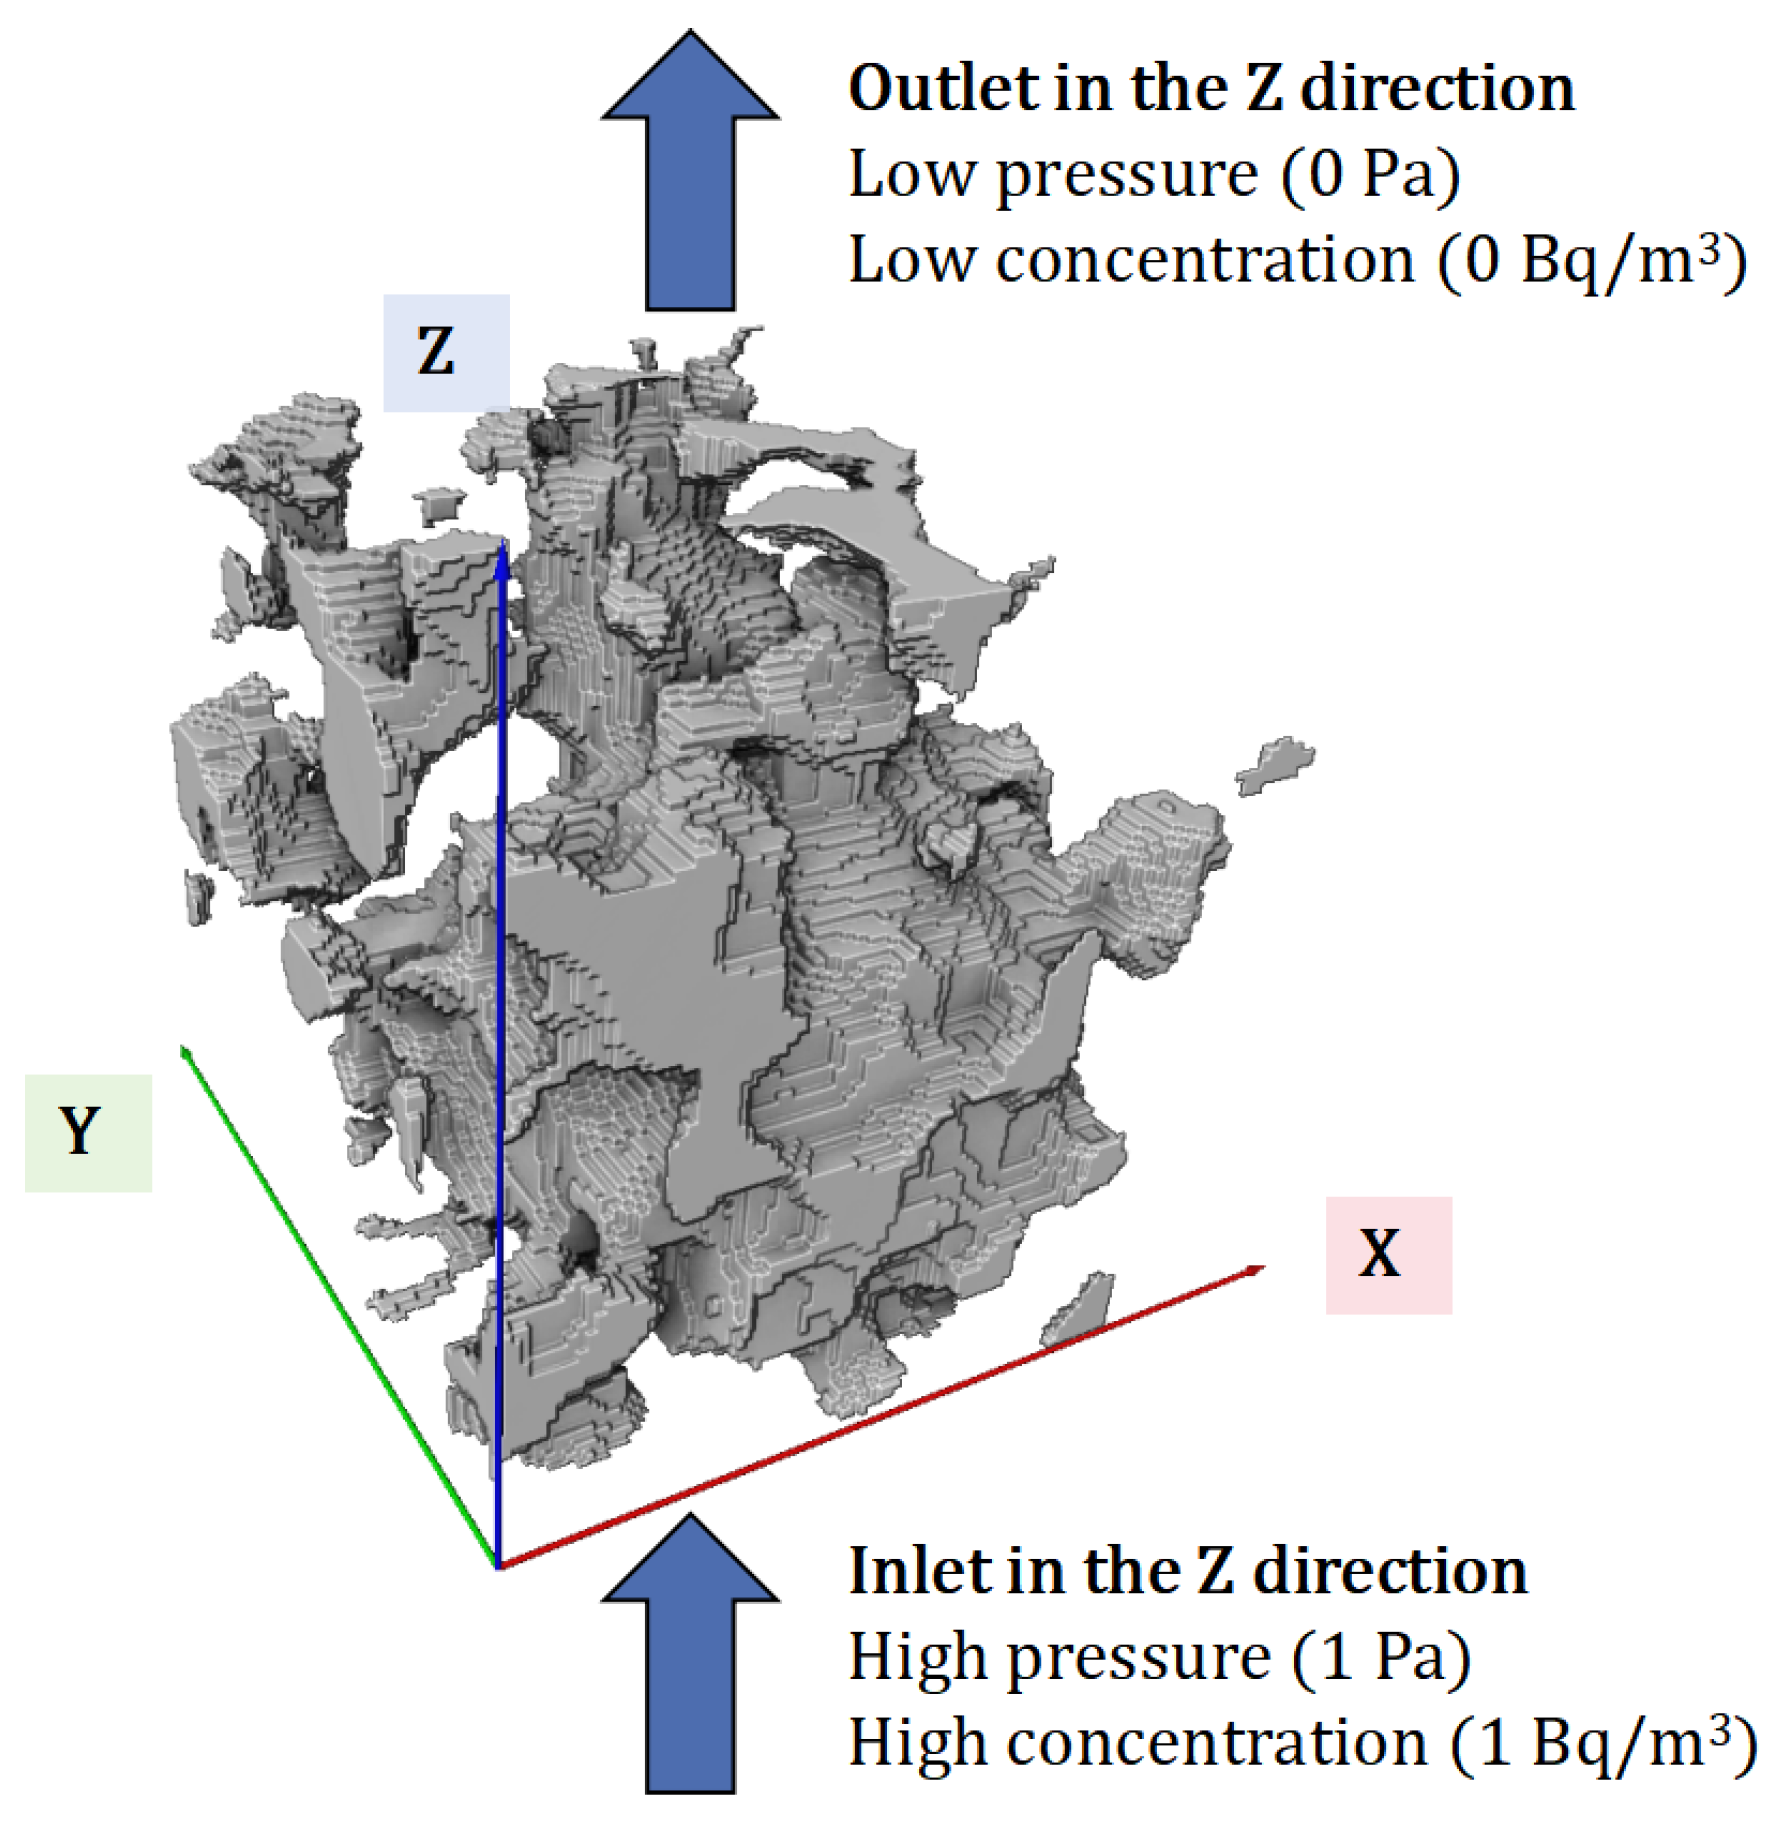
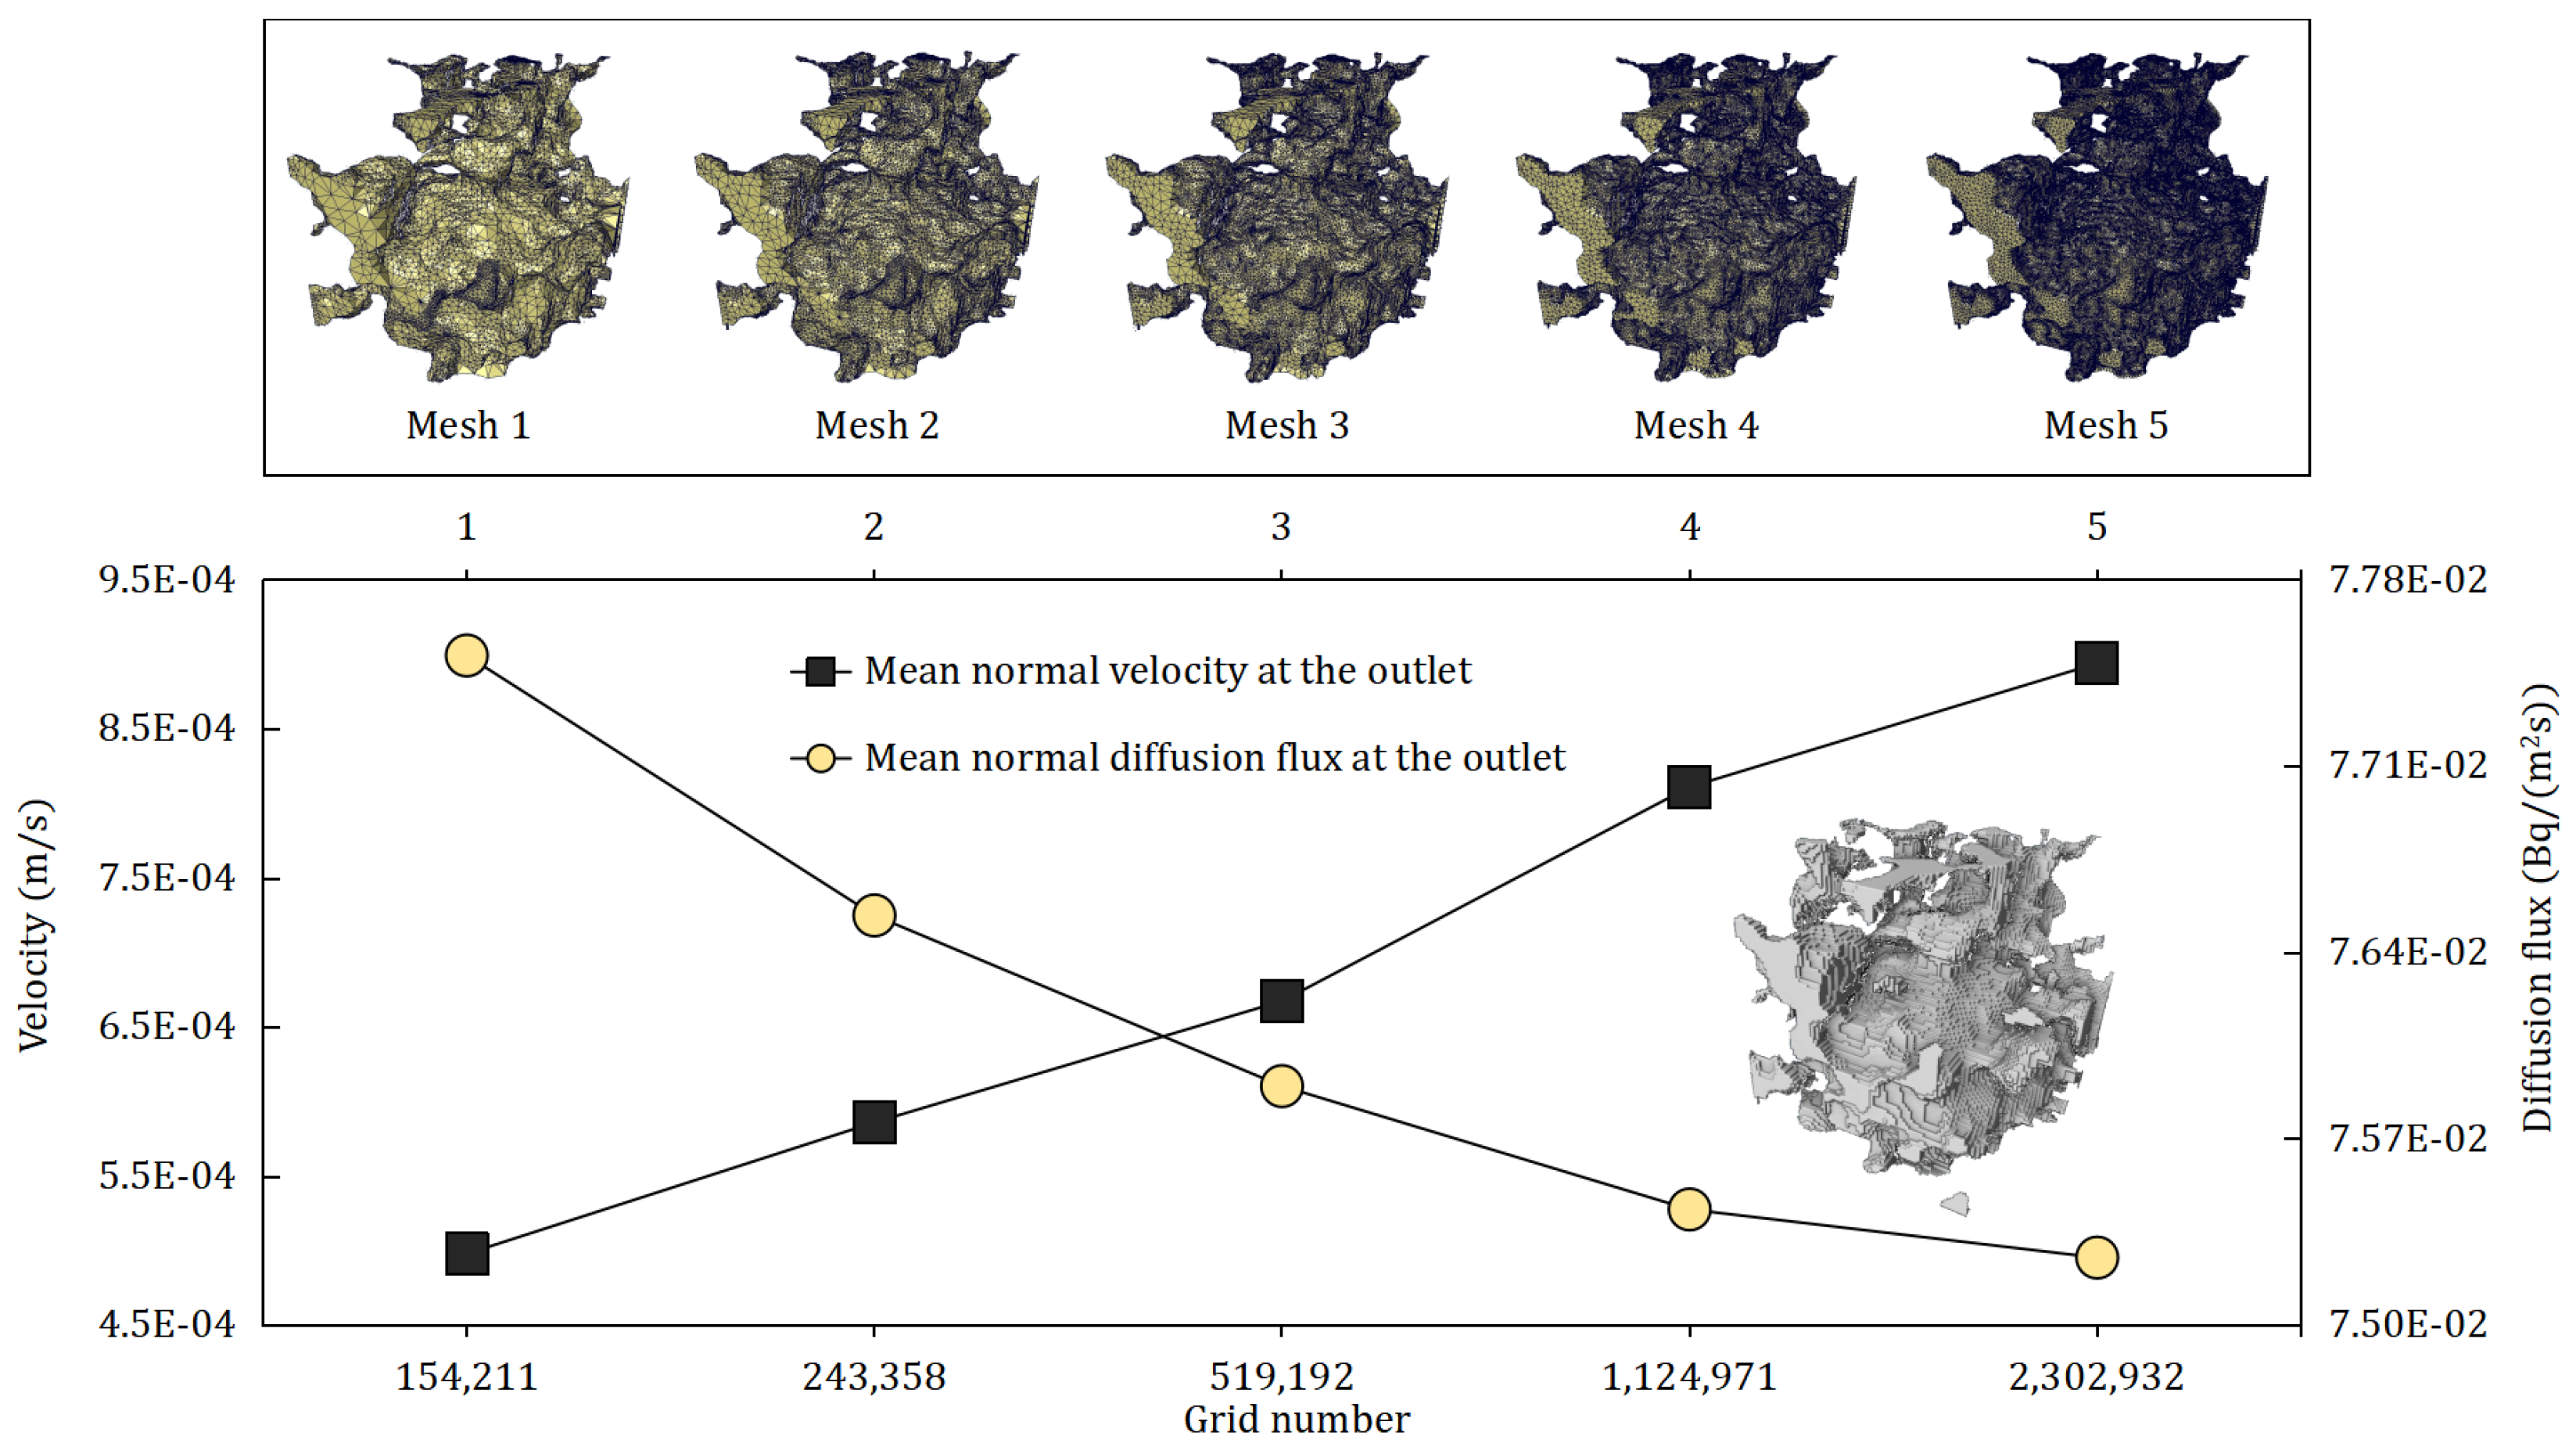
Assuming that the pore model is filled with air, the temperature was set at 273.15 K; a concentration difference of 1 Bq/m3 was set on both sides of the Z direction to conduct radon diffusion simulations and calculate the mean normal diffusion flux at the outlet. Then, a pressure difference of 1 Pa was set on both sides of the Z direction to conduct air seepage simulations and calculate the mean normal velocity of the outlet in COMSOL Multiphysics 6.3 software. The schematic diagram and boundary conditions of the CT pore model are shown in Figure 4. The meshes and the mesh independence verification are shown in Figure 5. From mesh 4 to 5, the number of grids has increased by more than double, and the mean outlet normal velocity and mean outlet normal diffusion flux only varied by 10.22% and 0.24%, respectively. Therefore, mesh 4 was used to simulate the diffusion and seepage of radon. The Avizo parameters for mesh 4 are as follows: Facet Size, Cell Size: 1.431 μm; Facet Distance: 0.072 μm.

3.2. Comparison of Radon Diffusion Coefficient and Permeability Between CT Pore Model and QSGS Pore Model

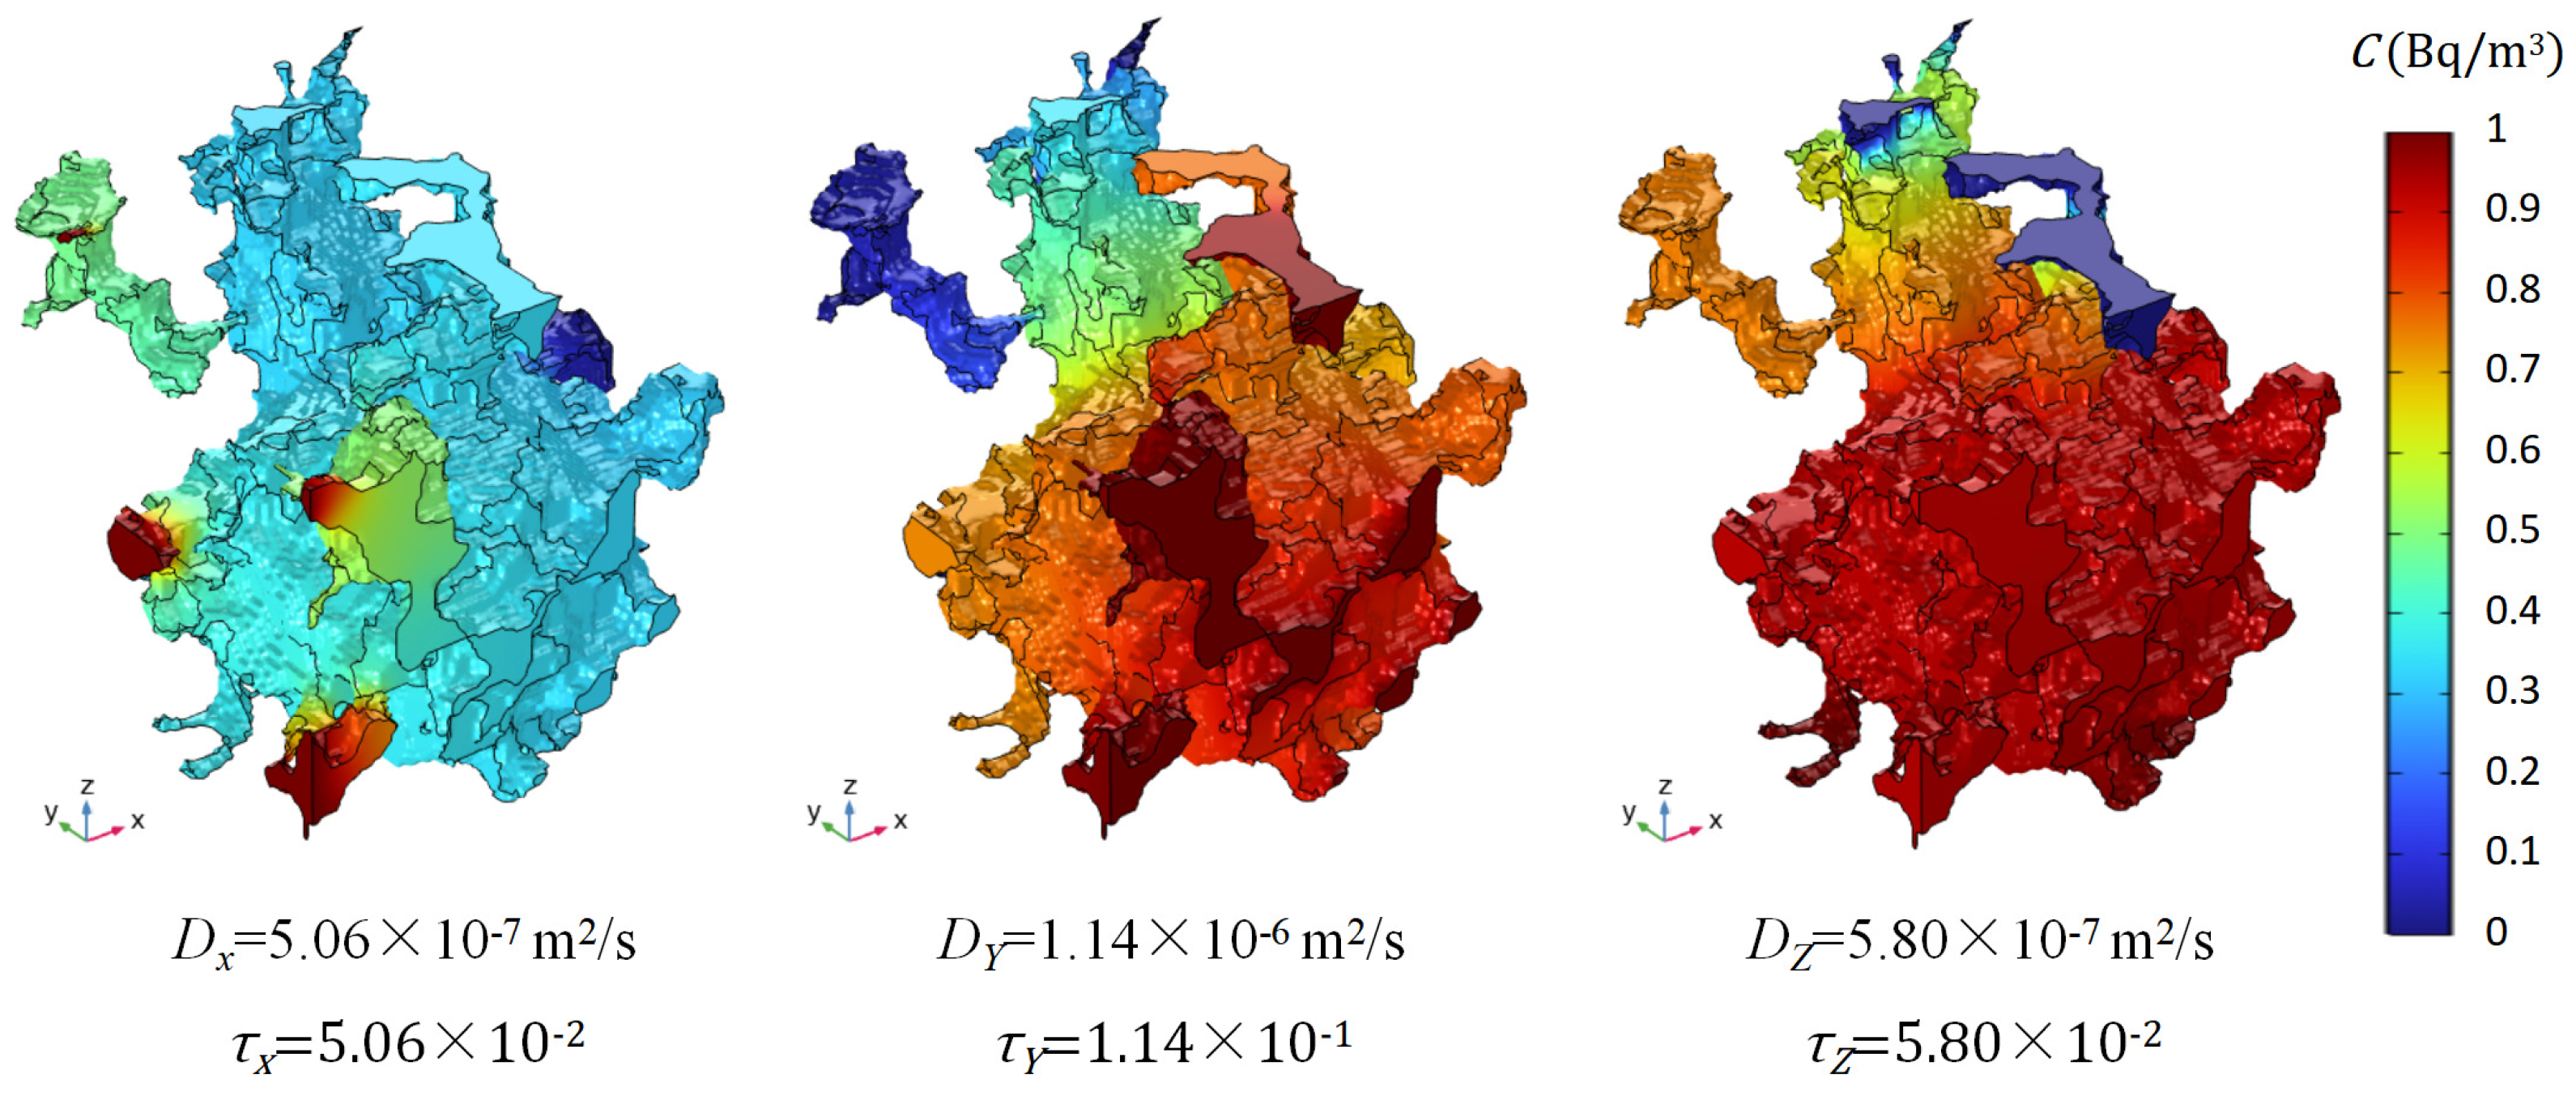
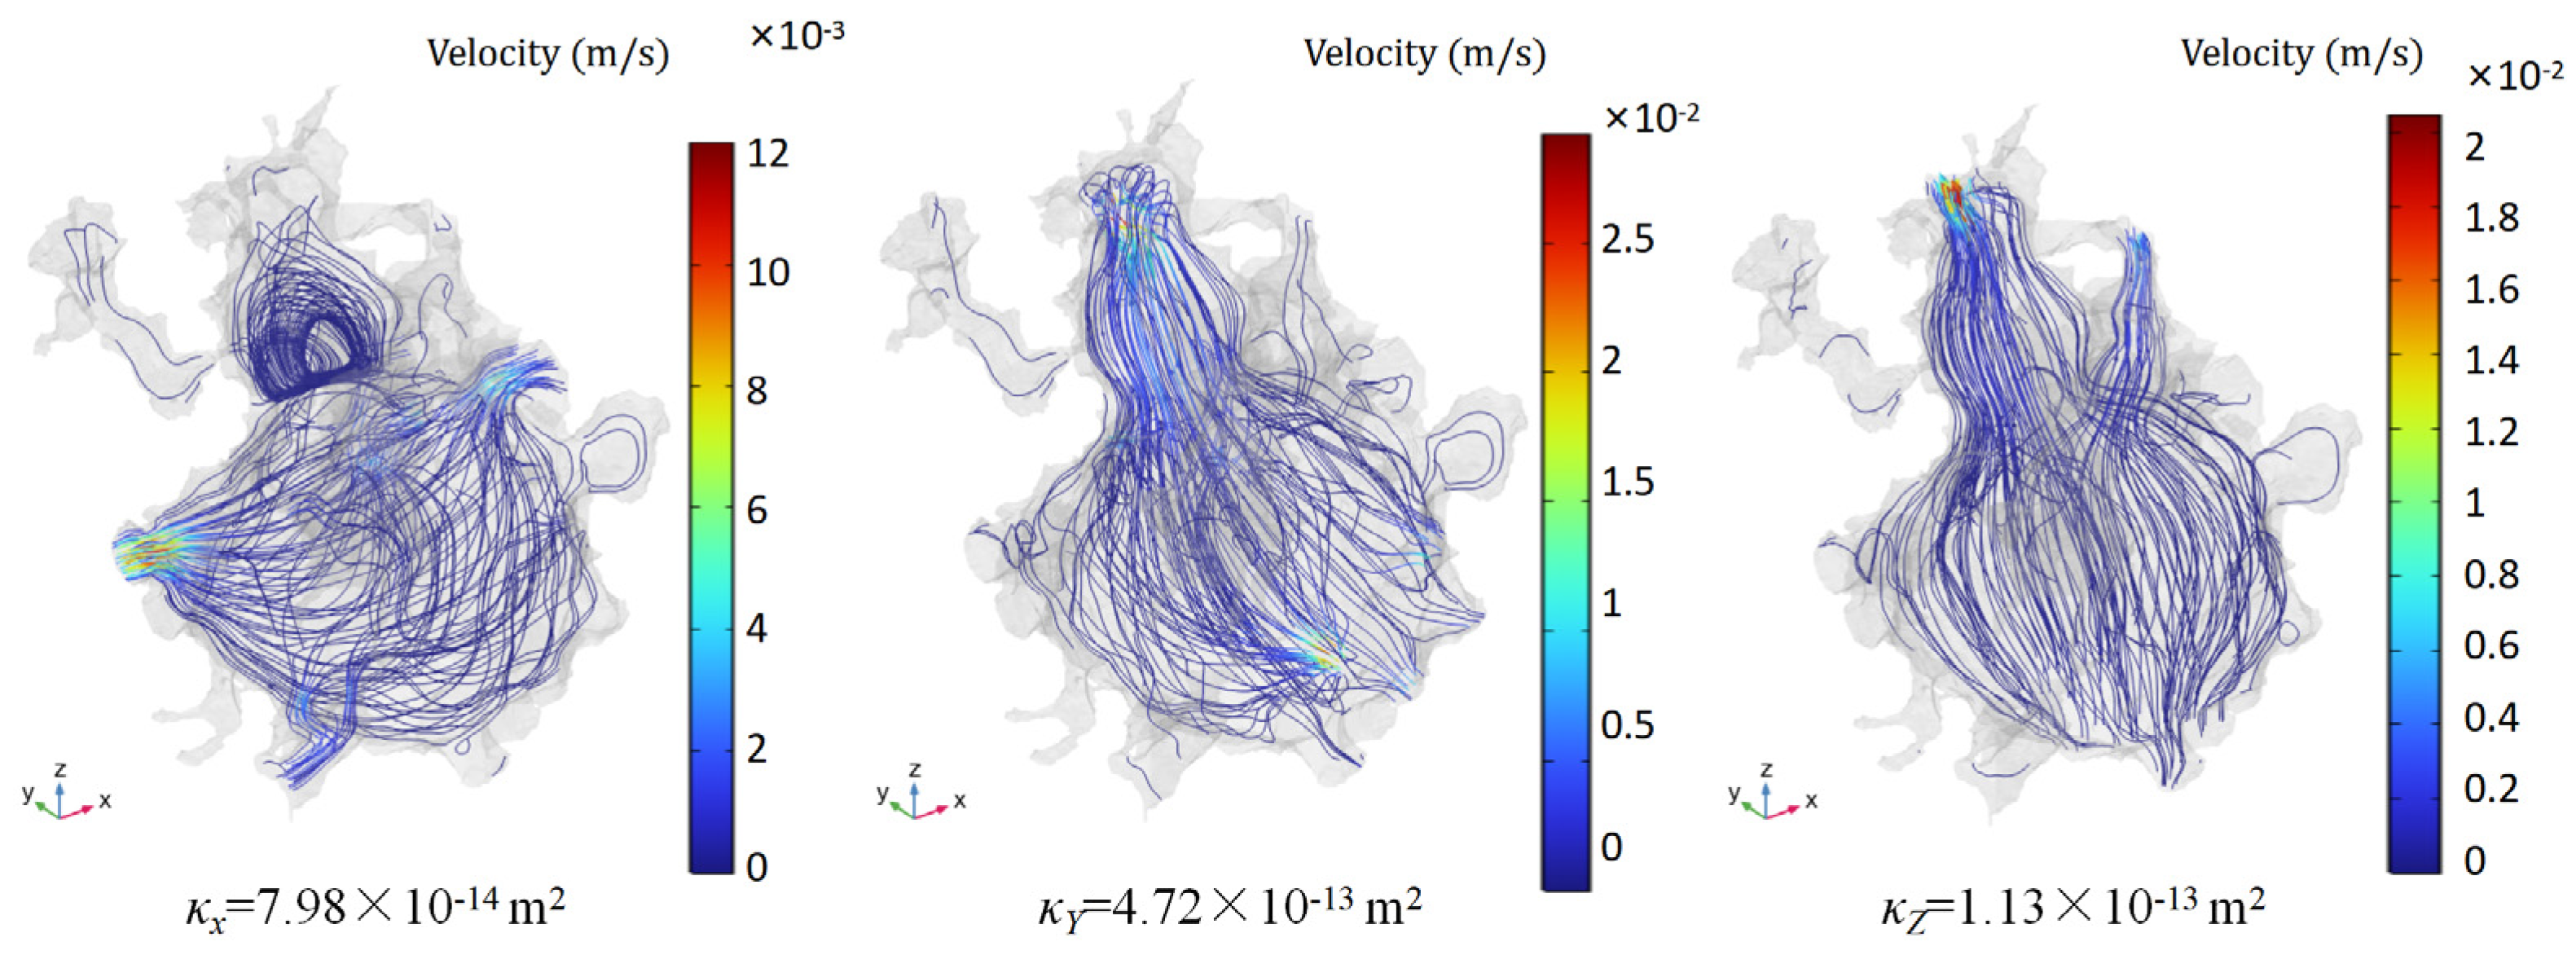
Based on mesh 4 and the above boundary conditions, radon diffusion and seepage simulations were conducted for the three main directions of the CT pore model, and the permeability, radon diffusion coefficient and tortuosity factor were calculated using Equations (3), (7) and (9). The radon concentration field and radon diffusion coefficient are shown in Figure 6, while the velocity streamline field and permeability are shown in Figure 7.
The radon diffusion coefficient, tortuosity factor, and permeability in the three directions were ranked from largest to smallest as Y, Z, and X. The radon diffusion coefficient and the tortuosity factor in the Y and Z directions were 2.3 and 1.1 times those of the X direction, respectively. The permeabilities in the Y and Z directions were 7.3 and 1.5 times that of the X direction, respectively. This indicated the heterogeneity of the pore model and the larger span of permeability in different directions compared to the radon diffusion coefficient. The distribution of the concentration field was more uniform than that of the velocity field. In narrower areas, the change in radon concentration was more rapid and the concentration gradient was larger, while in wider areas the change in radon concentration was more gradual and the concentration gradient was smaller. The distribution of the velocity streamline field was extremely uneven. In wider areas, the main flow channels were dominant, with a larger velocity, while the velocities in the side branches were very small.
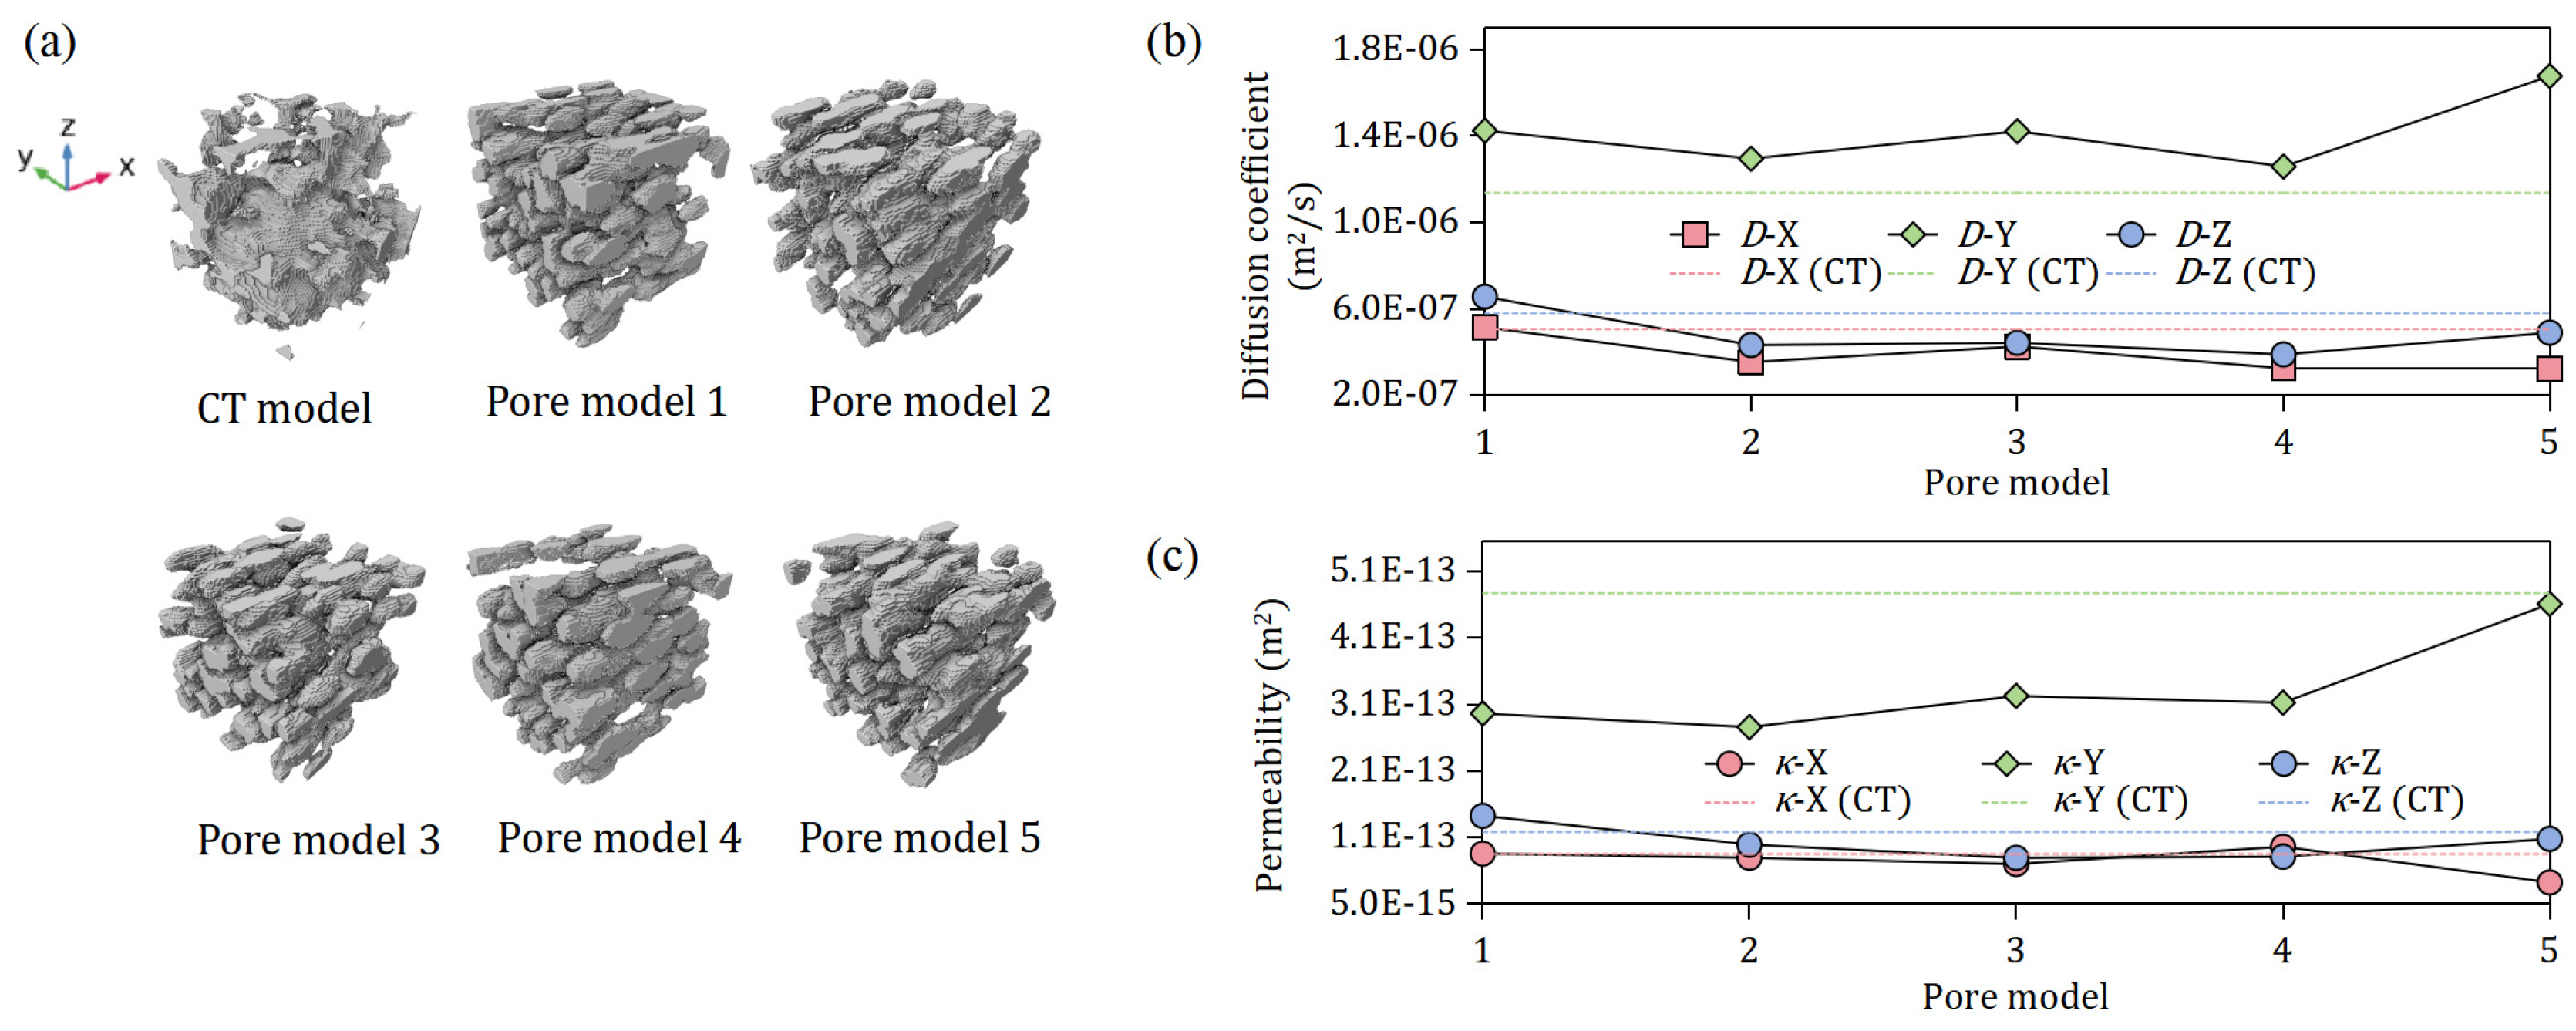
Based on the porosity of 31% of the CT pore model, a resolution of 1.0844 μm/voxel was used, and the parameter sizes of the three main directions, the Pd, and the G were adjusted multiple times. Finally, the radon diffusion coefficient and permeability parameters close to those of the CT pore model were determined as QSGS parameters: Pd was 0.0003, G13 and G14 were 0.6, G5 and G22 were 0.05, and the G in other directions was 0.01. Based on these parameters, five pore models were generated. The meshes were generated according to the Avizo grid parameters of mesh 4, and radon diffusion and seepage simulations were conducted to calculate the radon diffusion coefficient and permeability. The CT pore model, QSGS pore model, and their radon diffusion coefficients and permeabilities are shown in Figure 8. The comparison of radon diffusion coefficients and permeabilities between the CT model and the QSGS pore models are shown in Table 1 and Table 2, respectively.
The average relative deviations of the radon diffusion coefficient in all directions were between 16.80% and 24.50%, which was within the acceptable range (≤25%), and there was no systematic trend of higher or lower values. The average relative deviations of the permeability in all directions were between 12.91% and 30.41%, slightly higher than the deviation of the diffusion coefficient, but still within a reasonable range (≤31%). The deviation in the Y direction was slightly larger, but there was no directional offset. The reasons for the deviations were as follows: The pore distribution of the CT model included the local heterogeneity of the real structure, while the QSGS model was generated based on statistical laws; although it can reproduce the overall connectivity and anisotropy, it cannot completely restore the microscopic details. Therefore, there will be a certain deviation from the original parameters. Although there is a parameter deviation of ≤31% due to the difference in the degree of restoring microscopic details, it can accurately reproduce the anisotropic trend of the real pores, the parameter magnitude, and the core migration characteristics, verifying the validity of the modeling. Therefore, the analysis of the influence of the structural parameters based on the QSGS model on the radon migration parameters had a reliable model foundation.
Notably, the rock-like specimen adopted in this study was prototyped from rock masses free of prominent macroscopic fractures. Therefore, it was appropriate to employ the QSGS method to reconstruct its pore structure model, as the method is well suited for characterizing the microstructure of porous media. For rock masses with distinct macroscopic fractures, the QSGS method alone is inadequate to effectively reconstruct the fracture system, and should be coupled with the Discrete Fracture Network (DFN) method or other relevant numerical techniques.

4. Results and Discussion

4.1. Construction of Pore Models with Different Pore Structures

Two sets of ideal three-dimensional porous medium models with isotropic and anisotropic properties were constructed using the QSGS method, which was implemented using the Matlab 2019 software. The models were then smoothed and visualized using the Avizo 2020 software.
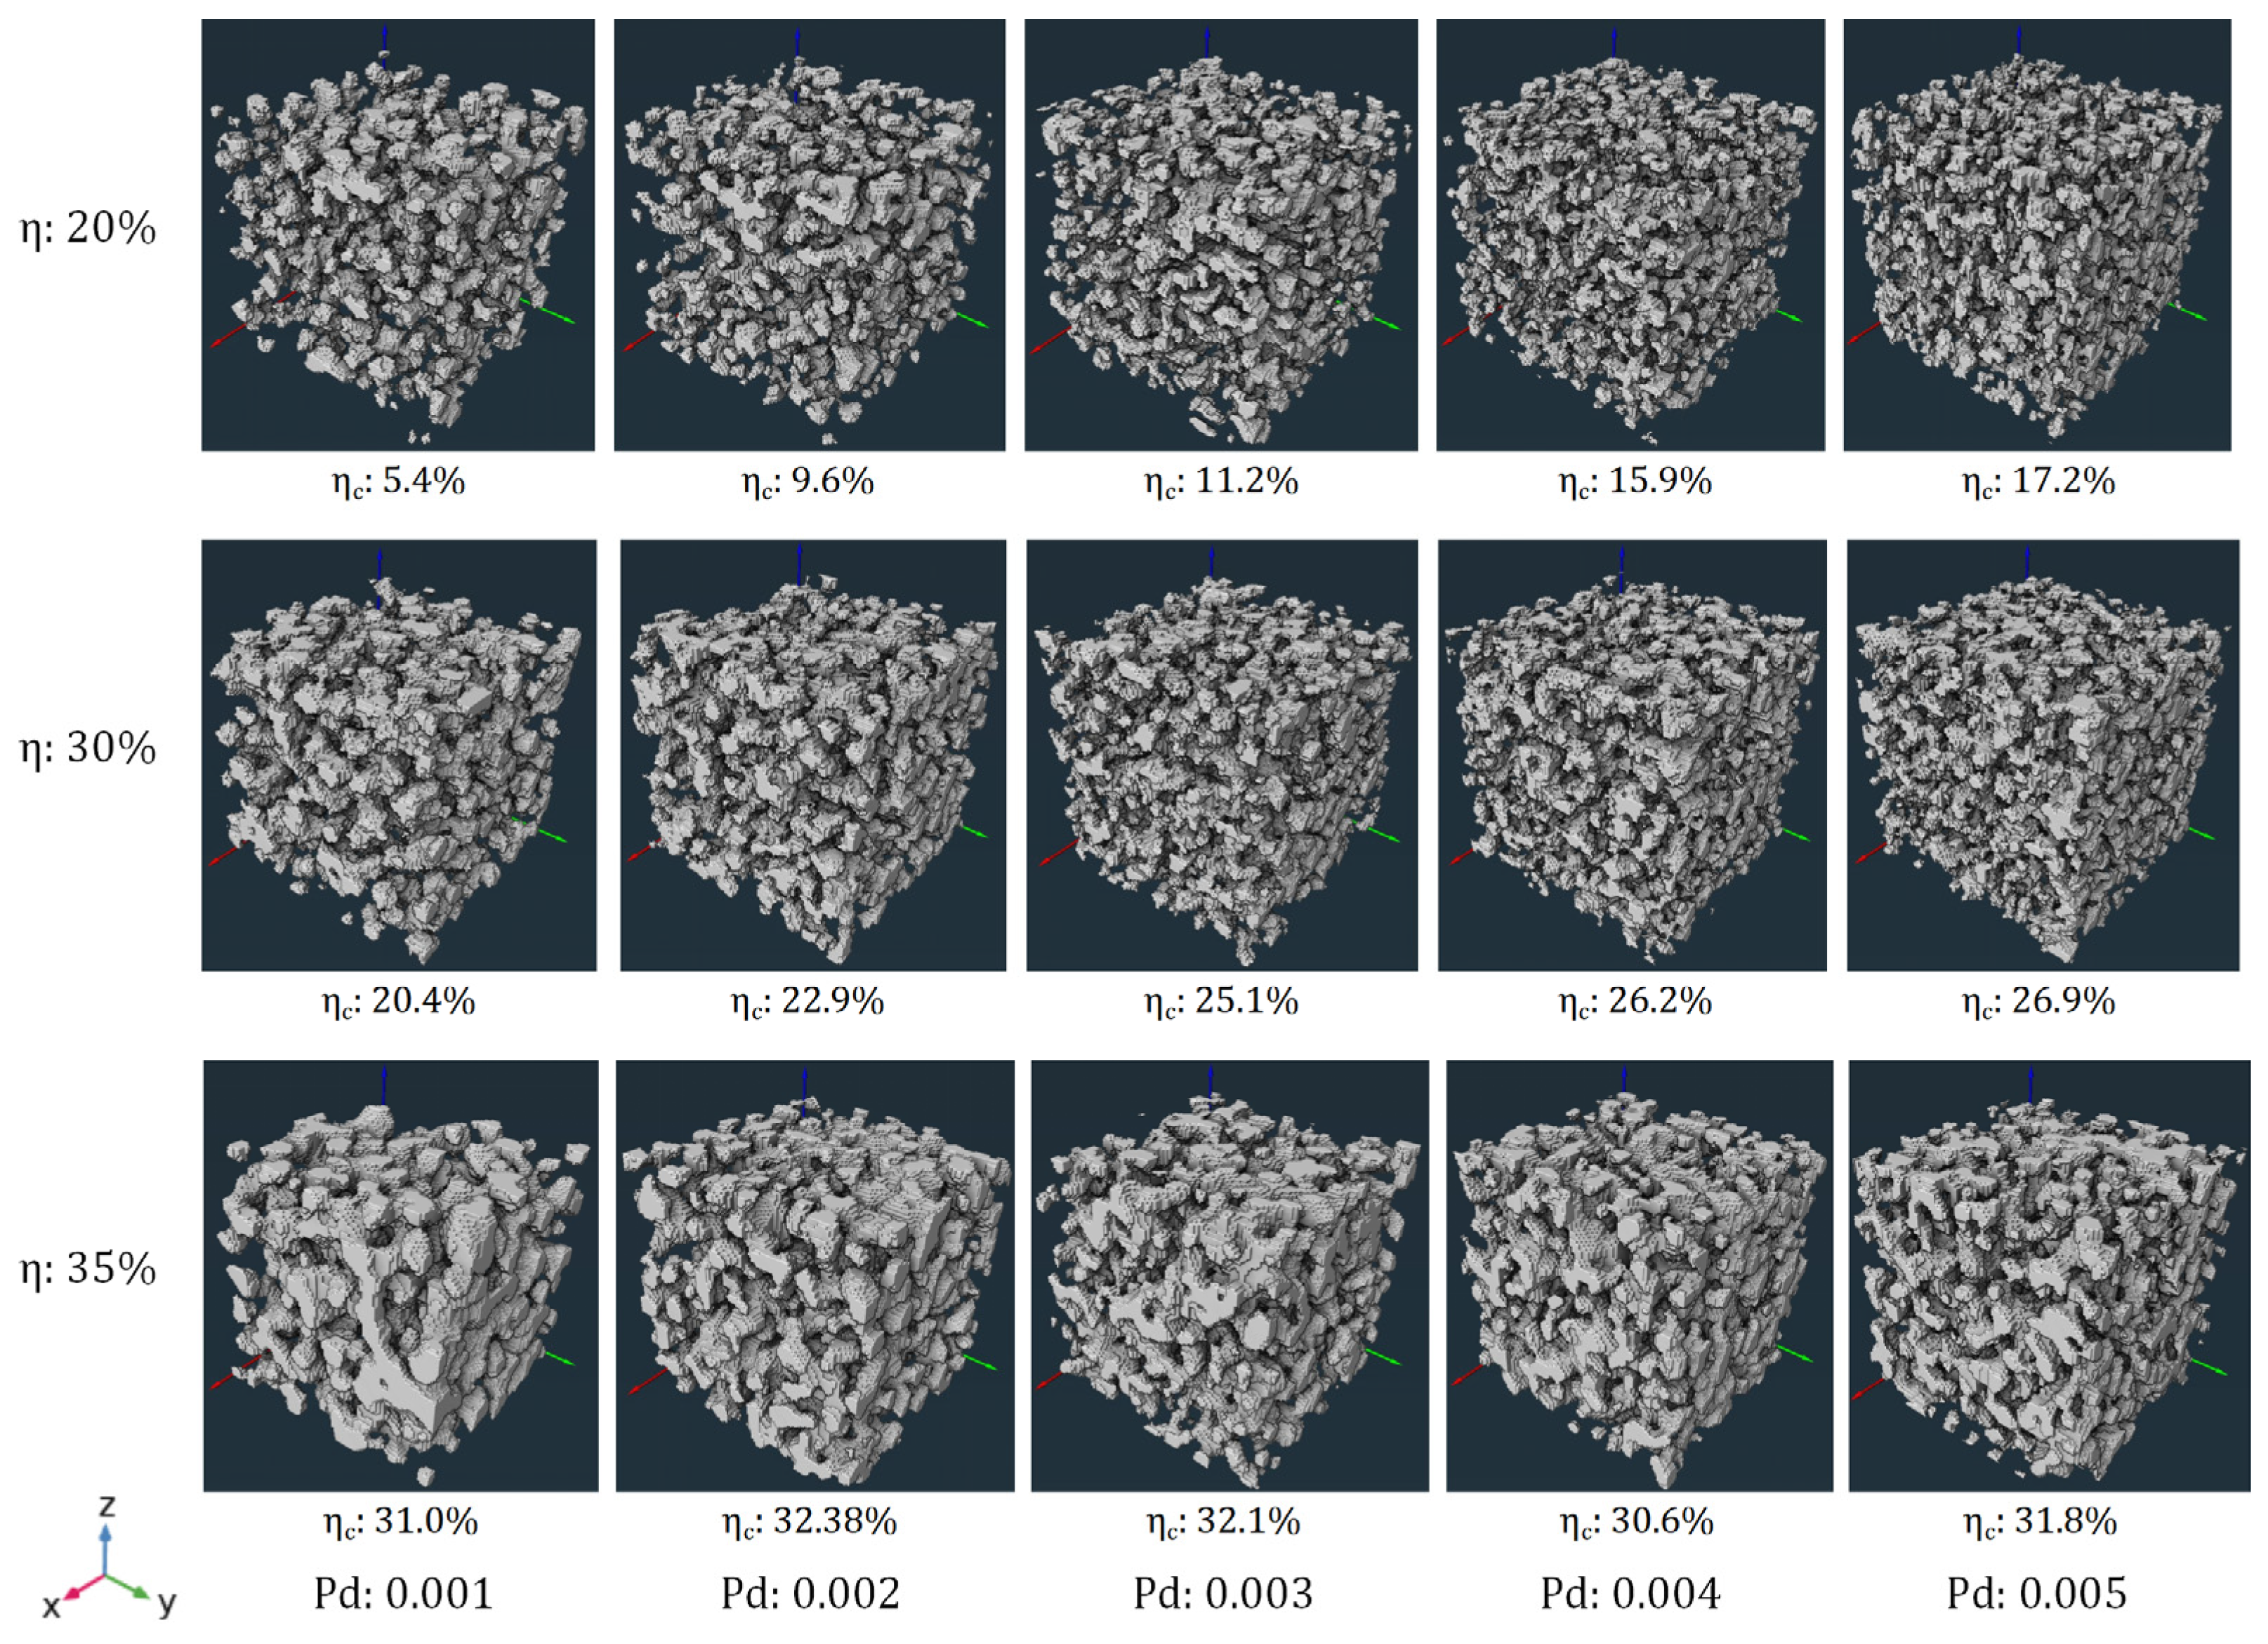
The first set of models was designed to investigate the influence of the porosity η and the degree of porosity dispersion (governed by the distribution probability Pd) on the radon transport law in the isotropic pore model. By using the control variable approach, η and Pd were controlled while keeping the anisotropic parameter G consistent. The parameters were set as follows: porosity η: 20%, 30%, and 35%; distribution probability Pd: 0.001, 0.002, 0.003, 0.004, and 0.005; growth probability G: 0.01. There were a total of 15 pore models in the first set, and the three-dimensional reconstruction diagram is shown in Figure 9, which presents the overall influence of porosity η and distribution probability Pd on the pore structure from a three-dimensional perspective. Each model was labeled with its connected porosity (ηc), obtained using the Axis Connectivity module in Avizo 2020 software.
Figure 9 illustrates that increasing η led to a more abundant and interconnected pore network: for η = 20%, ηc ranged from 5.4% to 17.2%; for η = 30%, ηc ranged from 20.4% to 26.9%; for η = 35%, ηc stabilized around 31.0~32.4%. This implies that, as η increases, the migration capacity of radon will also increase. Under the same porosity, models with a smaller Pd exhibited locally clustered pore agglomerations, while a larger Pd promoted a more uniform pore dispersion. This structural variation directly correlated with changes in ηc: as Pd increased, ηc rose monotonically for η = 20% and η = 30%, but showed only minor fluctuations for η = 35%, indicating that pore connectivity approached saturation at high porosity. This implies that the mechanism by which Pd affects the radon migration capacity of the model is more complex than that of η, and further analysis is required.
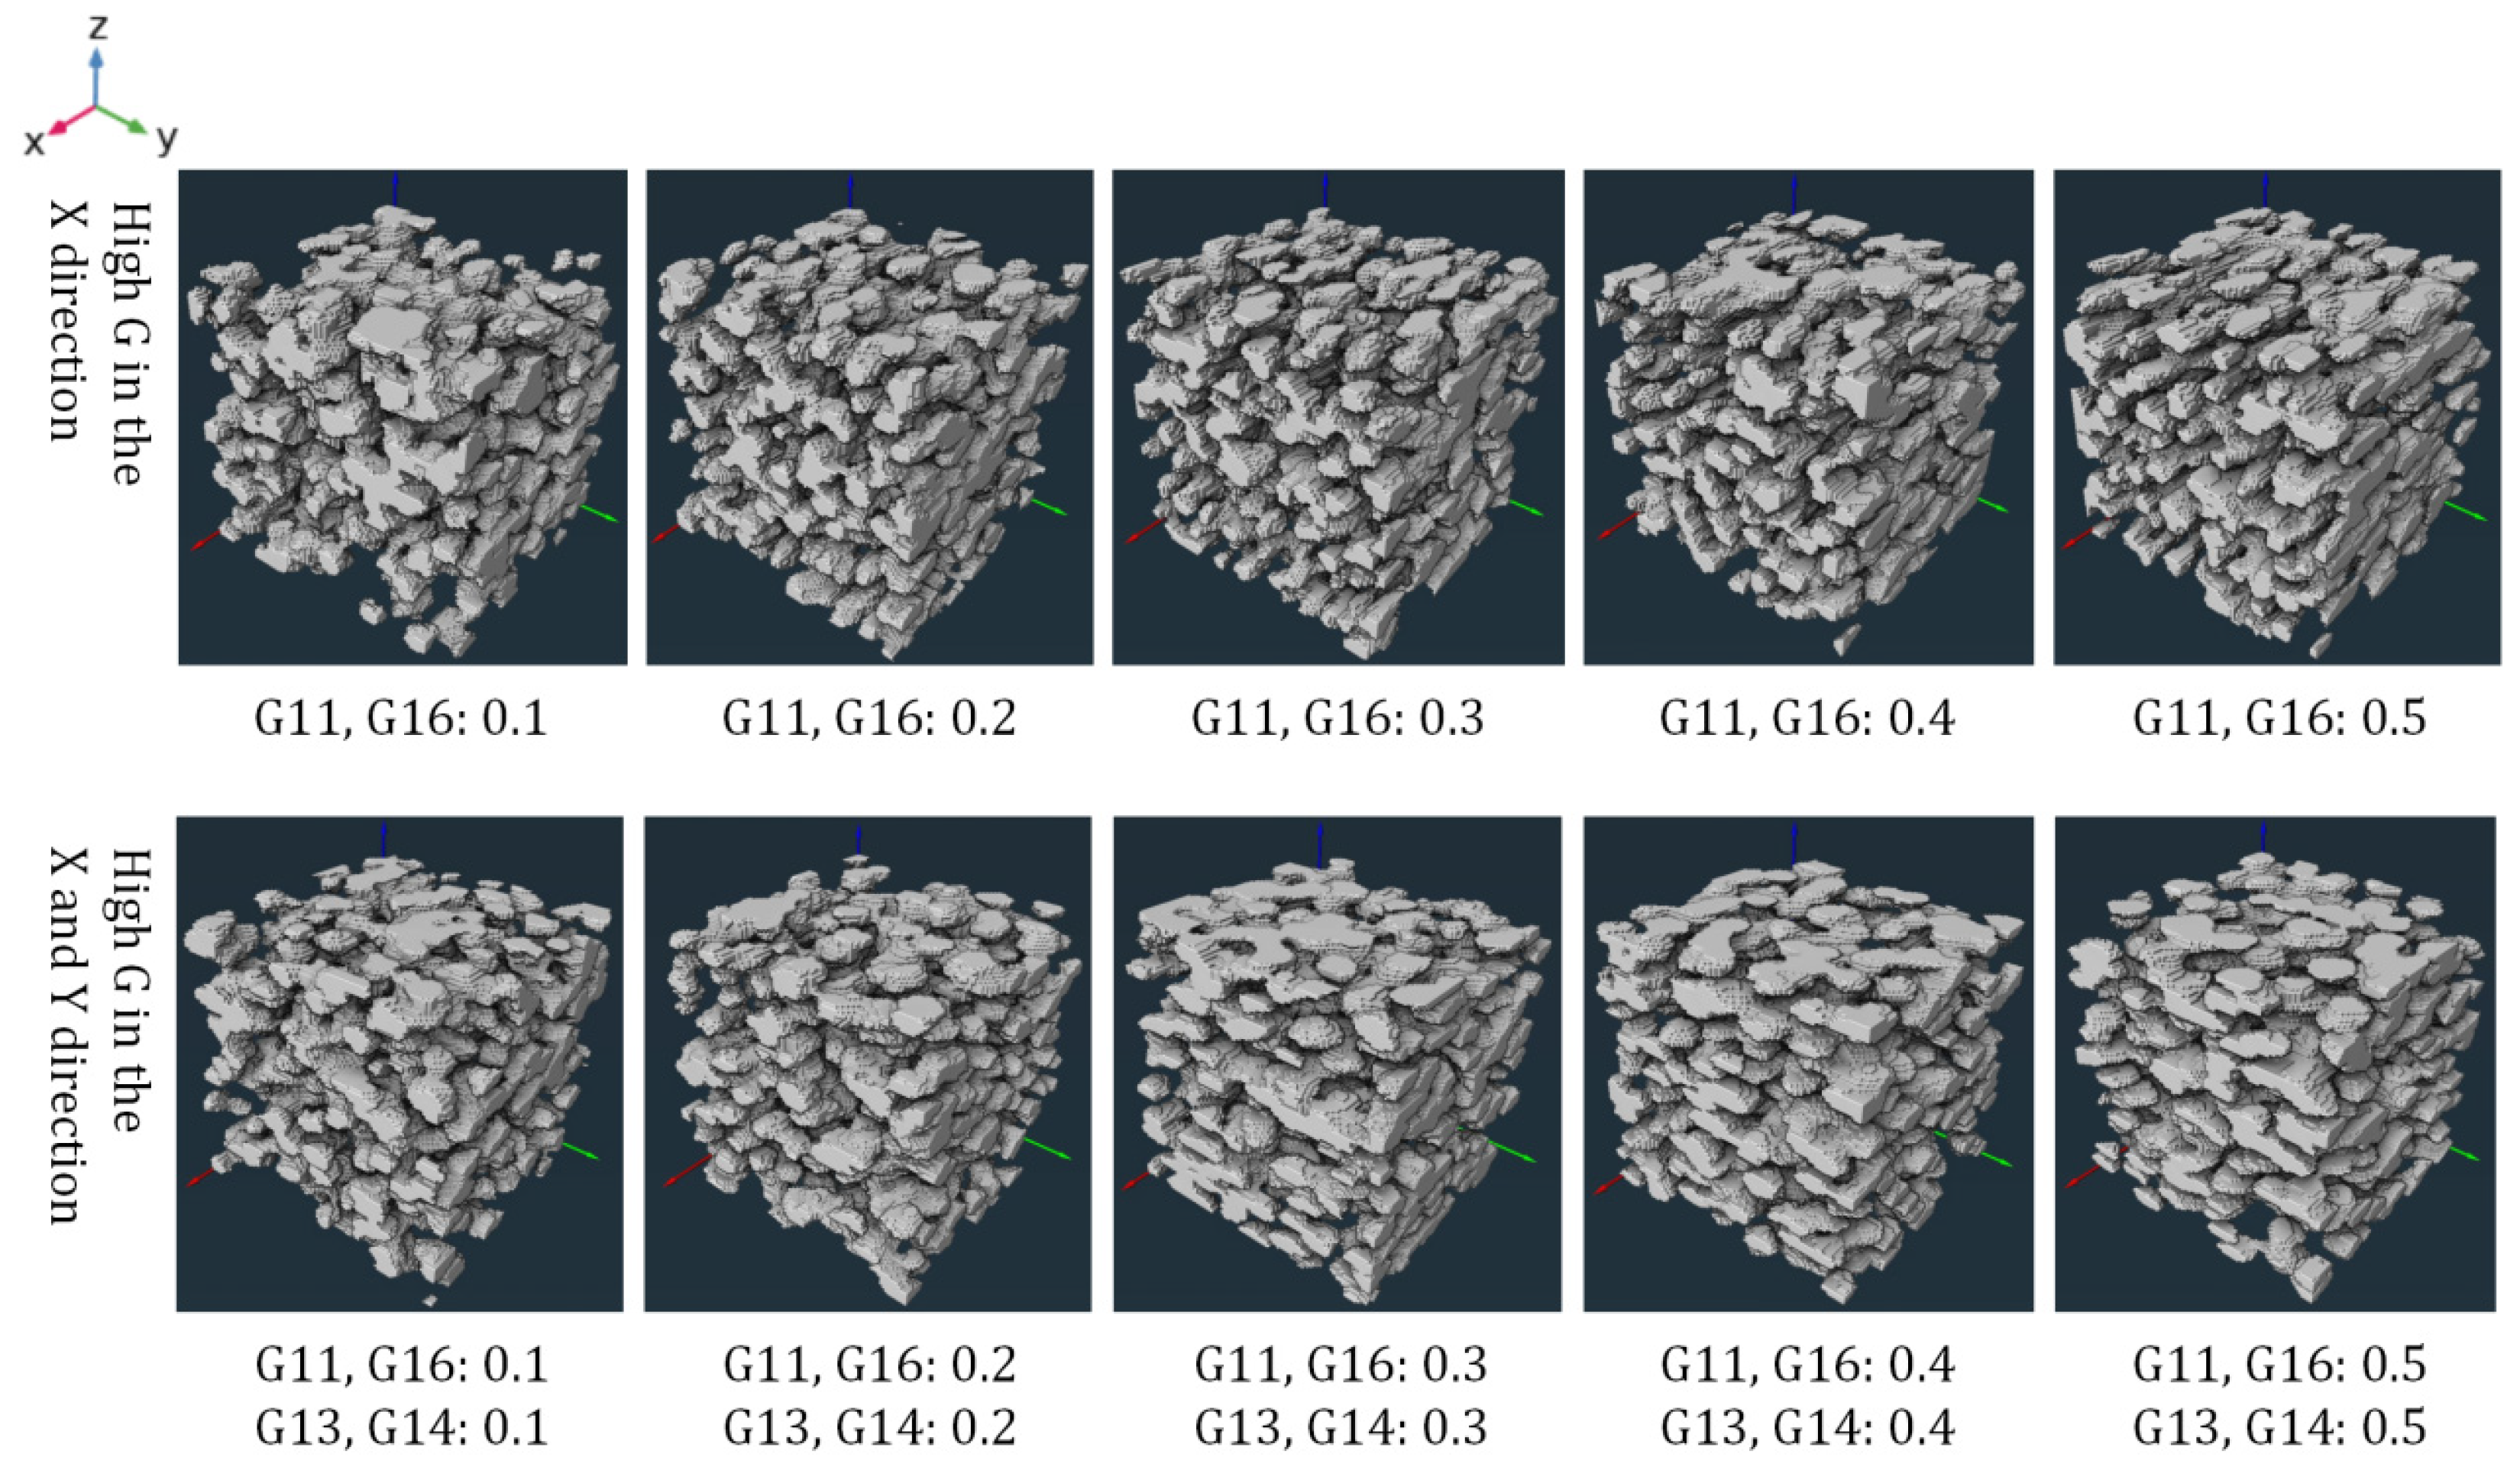
The second set of models was designed to investigate the influence of the anisotropic degree of the pore space (governed by the growth probability G) on the radon transport law in the anisotropic pore model. Under the condition of a fixed porosity of 35% and a distribution probability of Pd of 0.001, different growth probabilities (G) in different directions were adjusted to generate models with different anisotropic characteristics. There were a total of 10 pore models in the second set, and the three-dimensional reconstruction diagram is shown in Figure 10, which presents the overall influence of one or two directions with a high growth probability on the pore structure from a three-dimensional perspective.
Models 1~5 varied in their growth probabilities G11 and G16 (from 0.1 to 0.5), which control pore elongation along the X axis. As G11 and G16 increased, pores exhibited an increasingly pronounced strip-like or layered elongation along the X direction, forming continuous, directional migration channels. These channels reduced the tortuosity of radon diffusion paths and fluid flow paths in the X direction, while creating more frequent flow barriers in the Y and Z directions. This structural anisotropy is expected to facilitate radon migration along the X direction, while impeding transport in the Y and Z directions; Models 6~10 varied in the growth probabilities G11, G16, G13, and G14 (from 0.1 to 0.5), which control pore elongation along both the X and Y axes. As these G values increase, pores form interconnected planar or plate-like structures within the X-Y plane, and this planar connectivity reduces tortuosity and removes barriers within the X-Y plane, while reinforcing barriers in the Z direction. This structural anisotropy is expected to facilitate radon migration along both the X and Y direction, while impeding transport in the Z direction.

4.2. The Influence of Porosity and Distribution Probability on Radon Diffusion Coefficient and Permeability

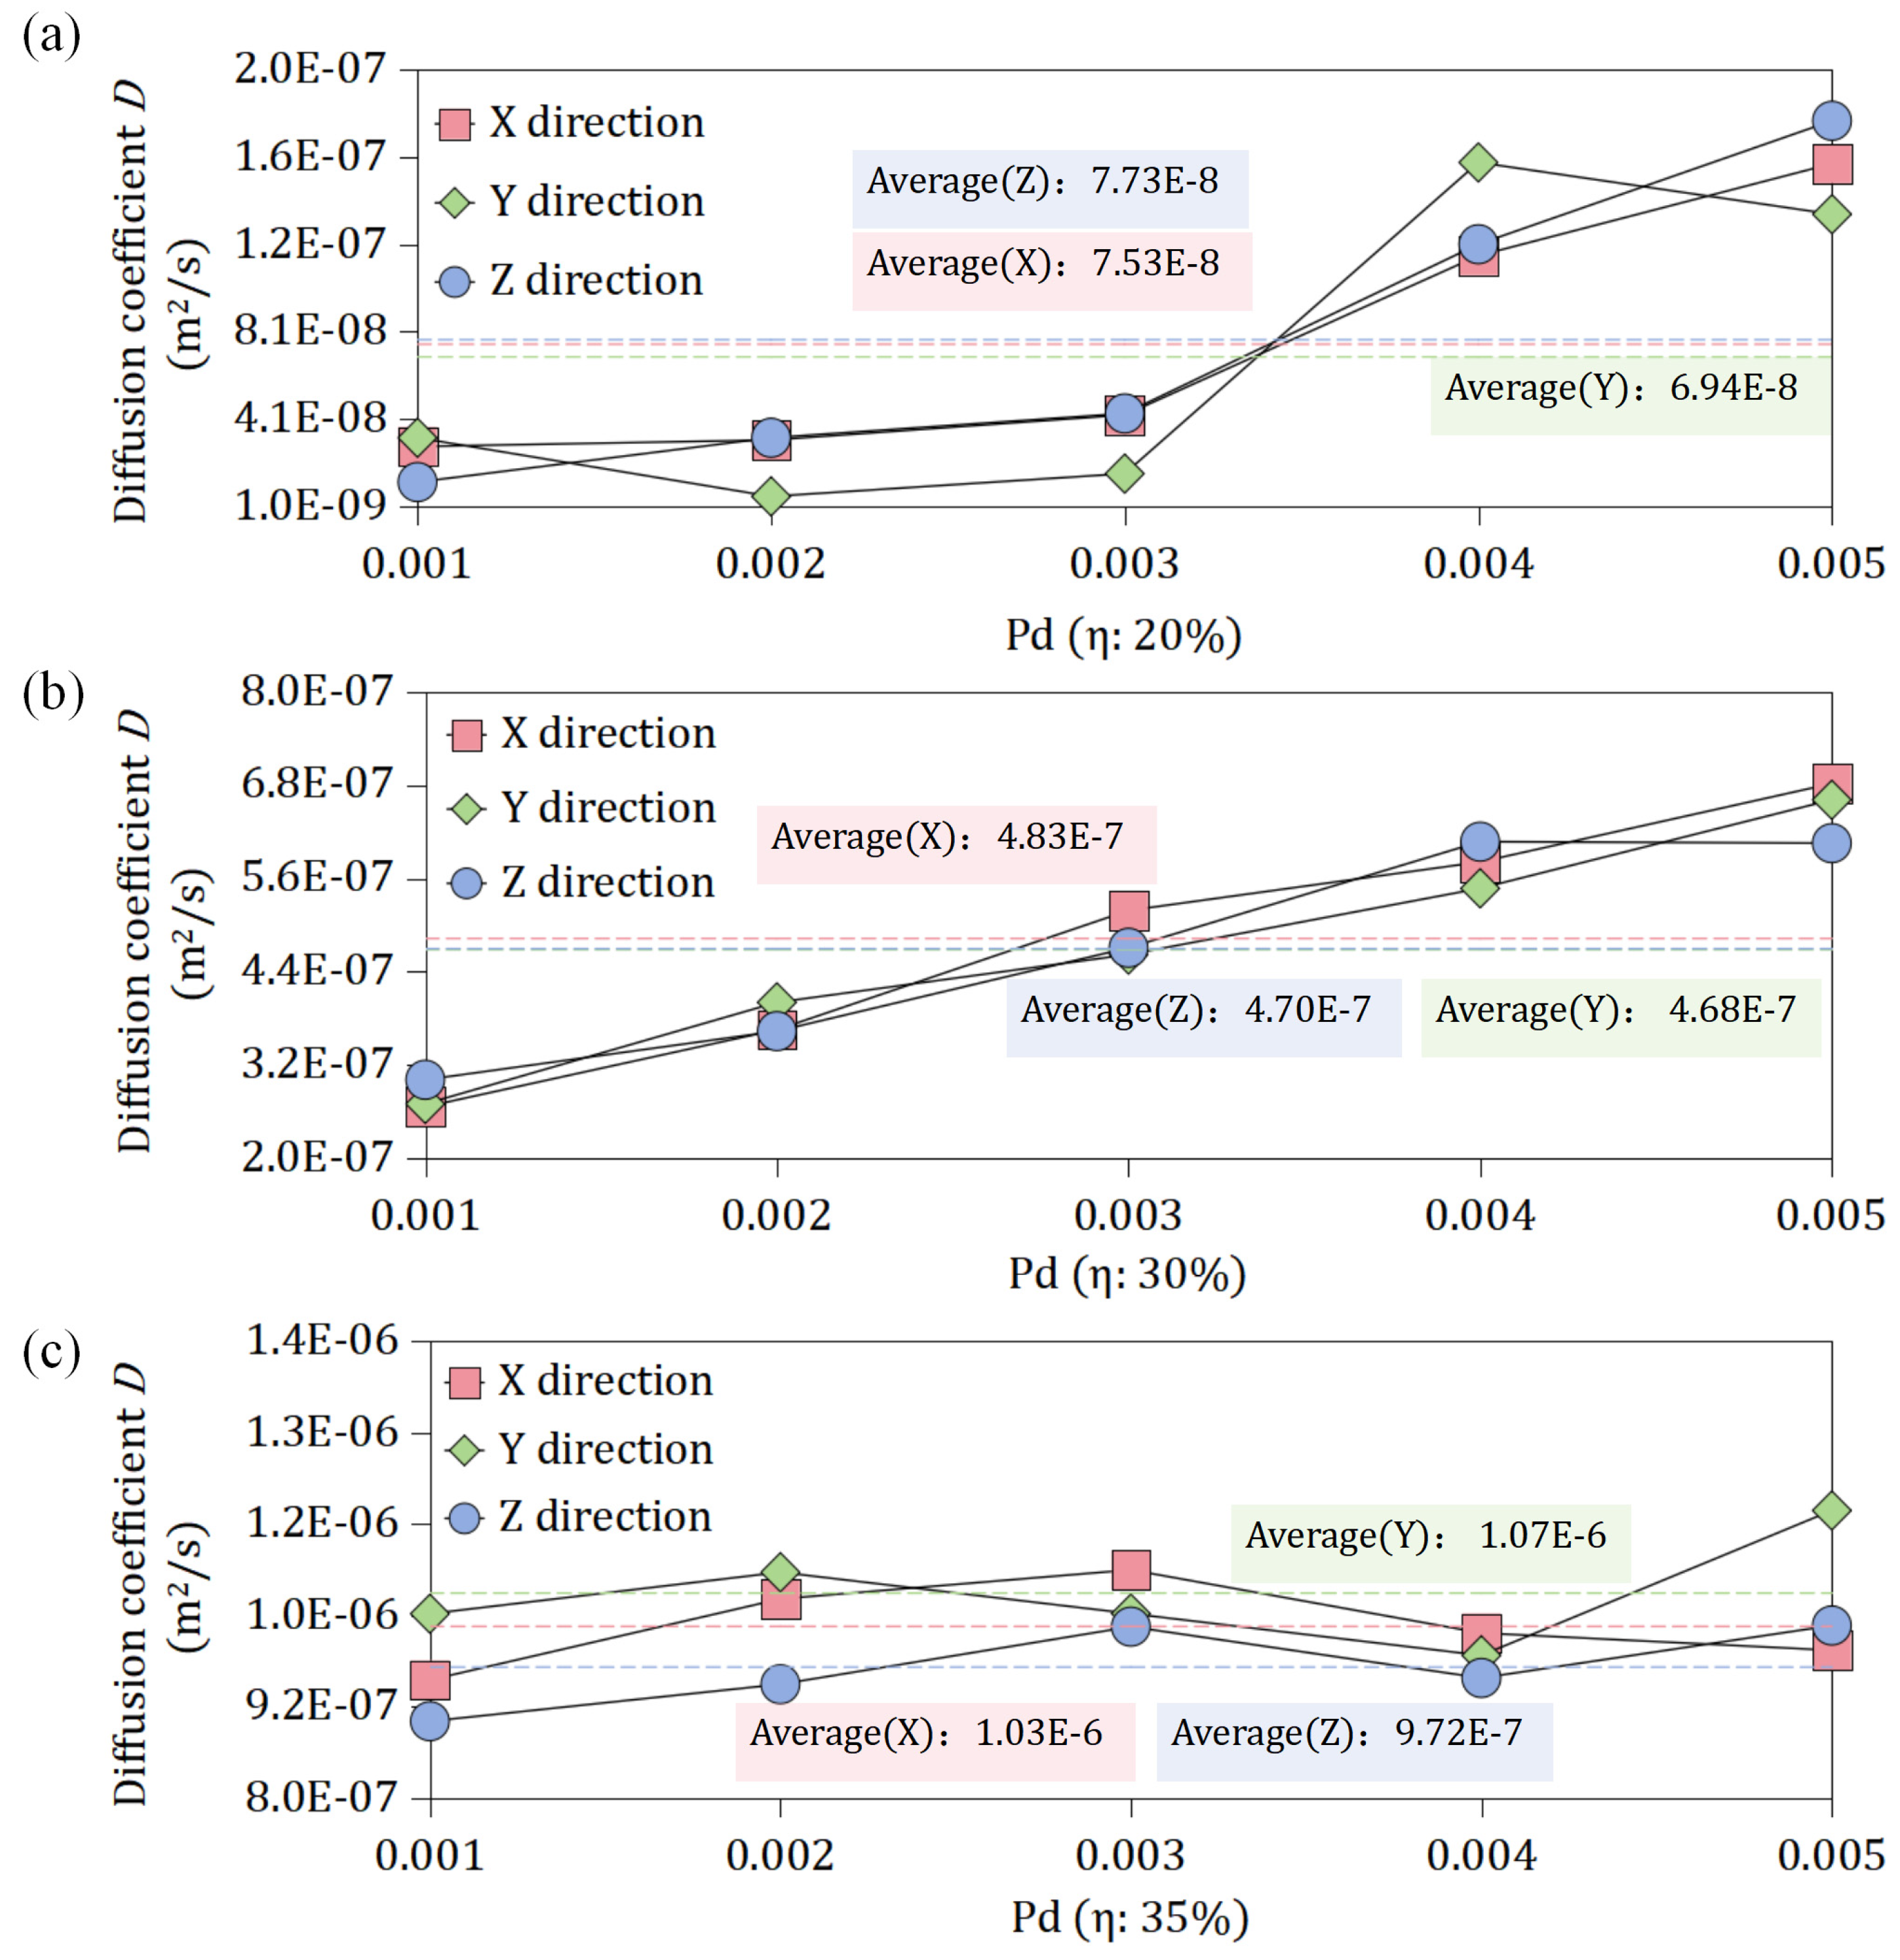
To study the influence laws of porosity and distribution probability on the radon diffusion coefficient and permeability of the pore model, radon diffusion and seepage simulations were conducted for the three main directions of the first set of models with the boundary conditions of Section 3 to calculate the radon diffusion coefficients and permeabilities. Figure 11 shows the radon diffusion coefficients and permeabilities of the 15 pore models.
With respect to the radon diffusion coefficient, Figure 11a–c demonstrate a clear positive correlation between the diffusion coefficient and porosity, as a higher porosity expands the connected pore volume and reduces the tortuosity of radon migration paths. Specifically, the average radon diffusion coefficients in the X, Y, and Z directions for the η = 30% model were 6.41, 6.74, and 6.07 times higher than those of the η = 20% model, respectively; for the η = 35% model, these values were 2.12, 2.28, and 2.07 times higher than those of the η = 30% model.
As shown in Figure 11a,b, at η = 20% and 30%, the radon diffusion coefficients exhibited a positive correlation with Pd. For η = 20%, the diffusion coefficients in the X, Y, and Z directions for Pd = 0.005 were 5.57, 4.17, and 14.78 times higher than those for Pd = 0.001, respectively; for η = 30%, these values were 2.56, 2.45, and 2.01 times higher, respectively. This trend arose because the low-porosity media had a poor initial connectivity, and increasing Pd effectively enhanced the pore network connectivity. However, this positive correlation was not strictly monotonic: when Pd increased from 0.001 to 0.002 and from 0.004 to 0.005, the Y-direction diffusion coefficient decreased slightly, reflecting the stochastic nature of pore model generation via the QSGS method.
In contrast, Figure 11c reveals that, at η = 35%, the relationship between the diffusion coefficients and Pd becomes indistinct, with diffusion coefficients increasing or decreasing with a similar probability as Pd rose. This is because the high-porosity media already possessed well-connected pore networks, so the connectivity-enhancing effect of Pd was significantly diminished, leading to negligible improvements in radon diffusion coefficients.
Existing studies have demonstrated that the radon diffusion coefficient of rocks is typically determined using the closed vessel system with a radon monitor, and the radon diffusion coefficient of porous media is positively correlated with their porosity [1]. As shown in Figure 9, the connected porosity (i.e., the effective porosity that contributes to radon migration) of the models with η = 20% and 30% is positively correlated with Pd, whereas that of the model with η = 35% shows no significant correlation with Pd. This relationship is consistent with the correlation between Pd and the radon diffusion coefficient observed in the present section, thus confirming the rationality of the results obtained herein.
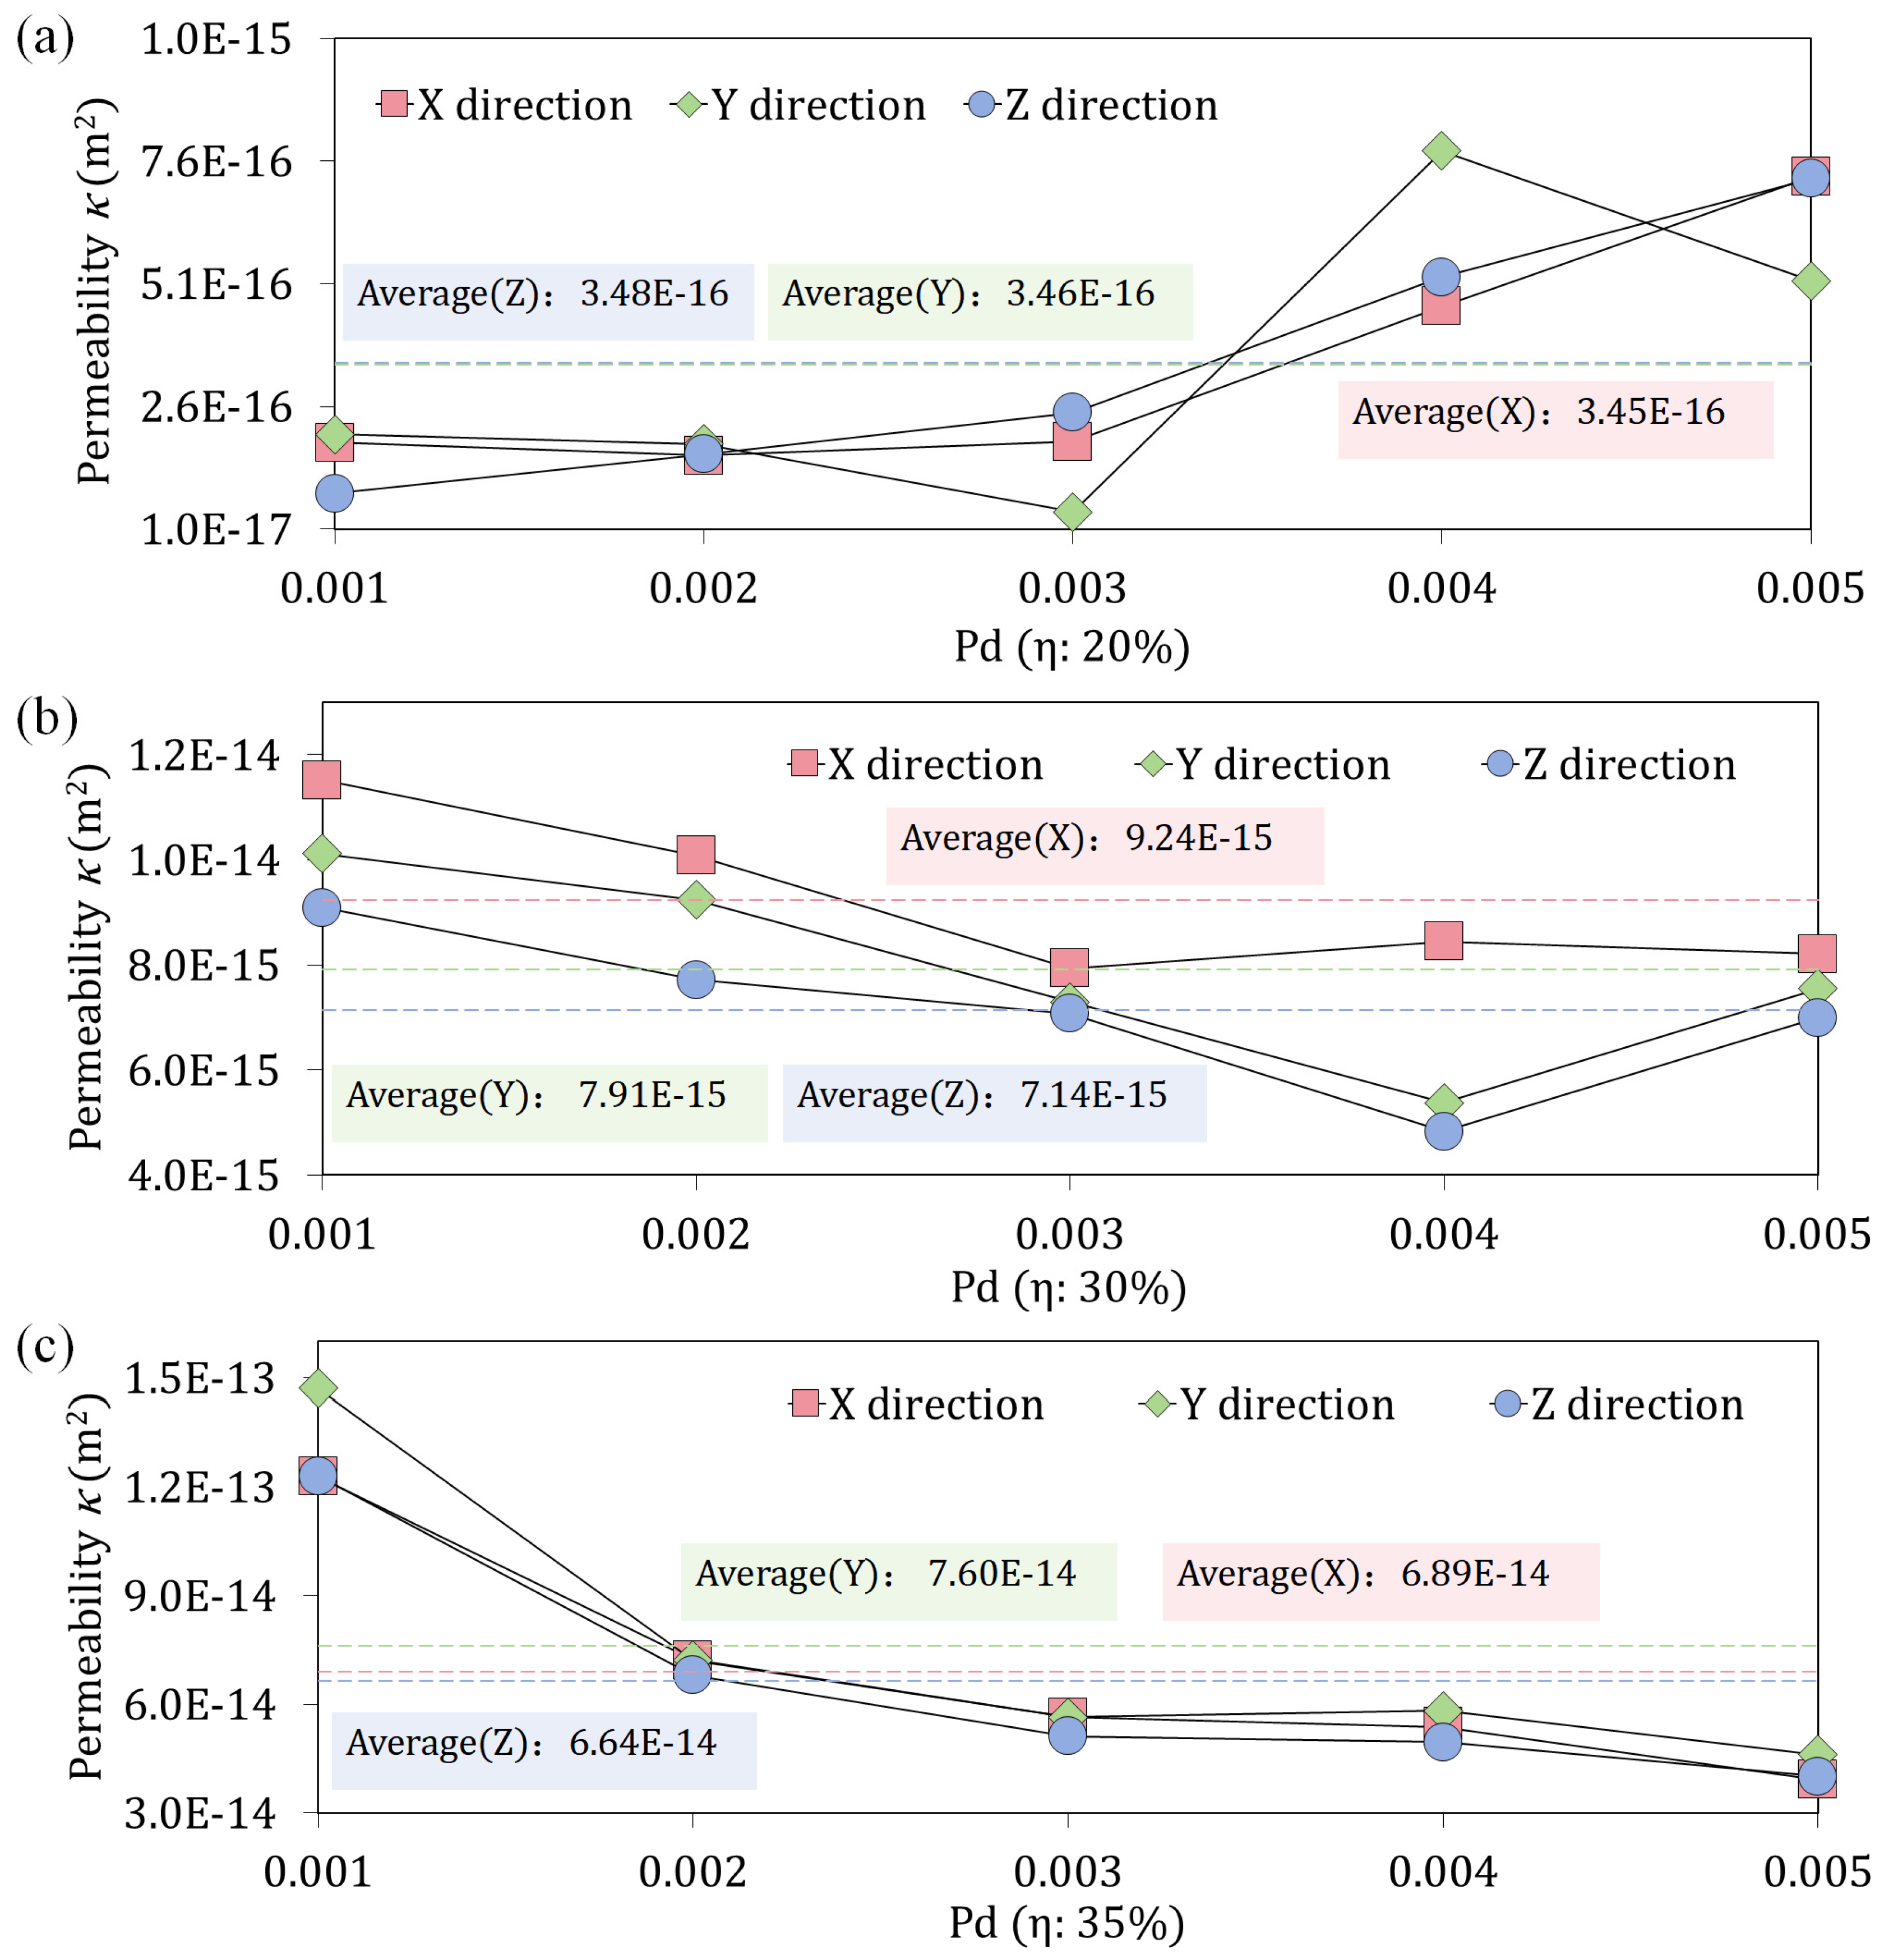
With respect to permeability, Figure 12a–c demonstrate that the permeability of pore models exhibited a clear positive correlation with porosity, a trend consistent with that observed for the radon diffusion coefficient. This relationship arose because the higher porosity expanded the interconnected pore network and reduced the fluid flow resistance. Specifically, the average permeabilities in the X, Y, and Z directions for the η = 30% model were 26.78, 22.90, and 20.51 times higher than those of the η = 20% model, respectively; for the η = 35% model, these values were 7.46, 9.60, and 9.30 times higher than those of the η = 30% model. Notably, the positive correlation between permeability and porosity was more pronounced than that observed for the radon diffusion coefficient, reflecting the greater sensitivity of fluid flow to pore volume and connectivity.
As shown in Figure 12a, at η = 20%, permeability exhibited a discernible positive correlation with Pd, a trend consistent with that of the radon diffusion coefficient. Here, increasing the Pd enhanced pore connectivity in the initially low-porosity medium, leading to a higher permeability. Specifically, the permeabilities in the X, Y, and Z directions for Pd = 0.005 were 3.91, 2.54, and 8.75 times higher than those for Pd = 0.001, respectively.
In contrast, Figure 12b,c reveal a negative correlation between permeability and Pd at η = 30% and 35%. This negative trend arose because increasing Pd not only enhanced pore connectivity but also increased the pore tortuosity, reduced the average pore diameter, and elevated the fluid flow resistance. Thus, in media with inherently good connectivity, increasing the Pd predominantly increases flow resistance, leading to a significant reduction in permeability. For η = 30%, increasing the Pd from 0.001 to 0.005 reduced the permeabilities in the X, Y, and Z directions by 29%, 25%, and 23%, respectively; for η = 35%, these reductions were more pronounced, reaching 68%, 69%, and 67%.
There are various methods currently used to measure the permeability of rocks, including steady-state flow measurement, transient pressure pulse decay, and nuclear magnetic resonance (NMR) spectroscopy, etc. Additionally, several studies have employed the QSGS method to investigate the effect of η and Pd on permeability, consistently reporting a negative correlation between permeability and Pd [30,31], which aligned with the observations from the η = 30% and η = 35% models in Figure 12b,c. In contrast, the positive correlation between permeability and Pd observed at η = 20% (Figure 12a) arose because the connectivity-enhancing effect of Pd on pore networks outweighed the permeability reduction caused by the increased pore tortuosity.

4.3. The Influence of Anisotropy Degree on Radon Diffusion Coefficient and Permeability

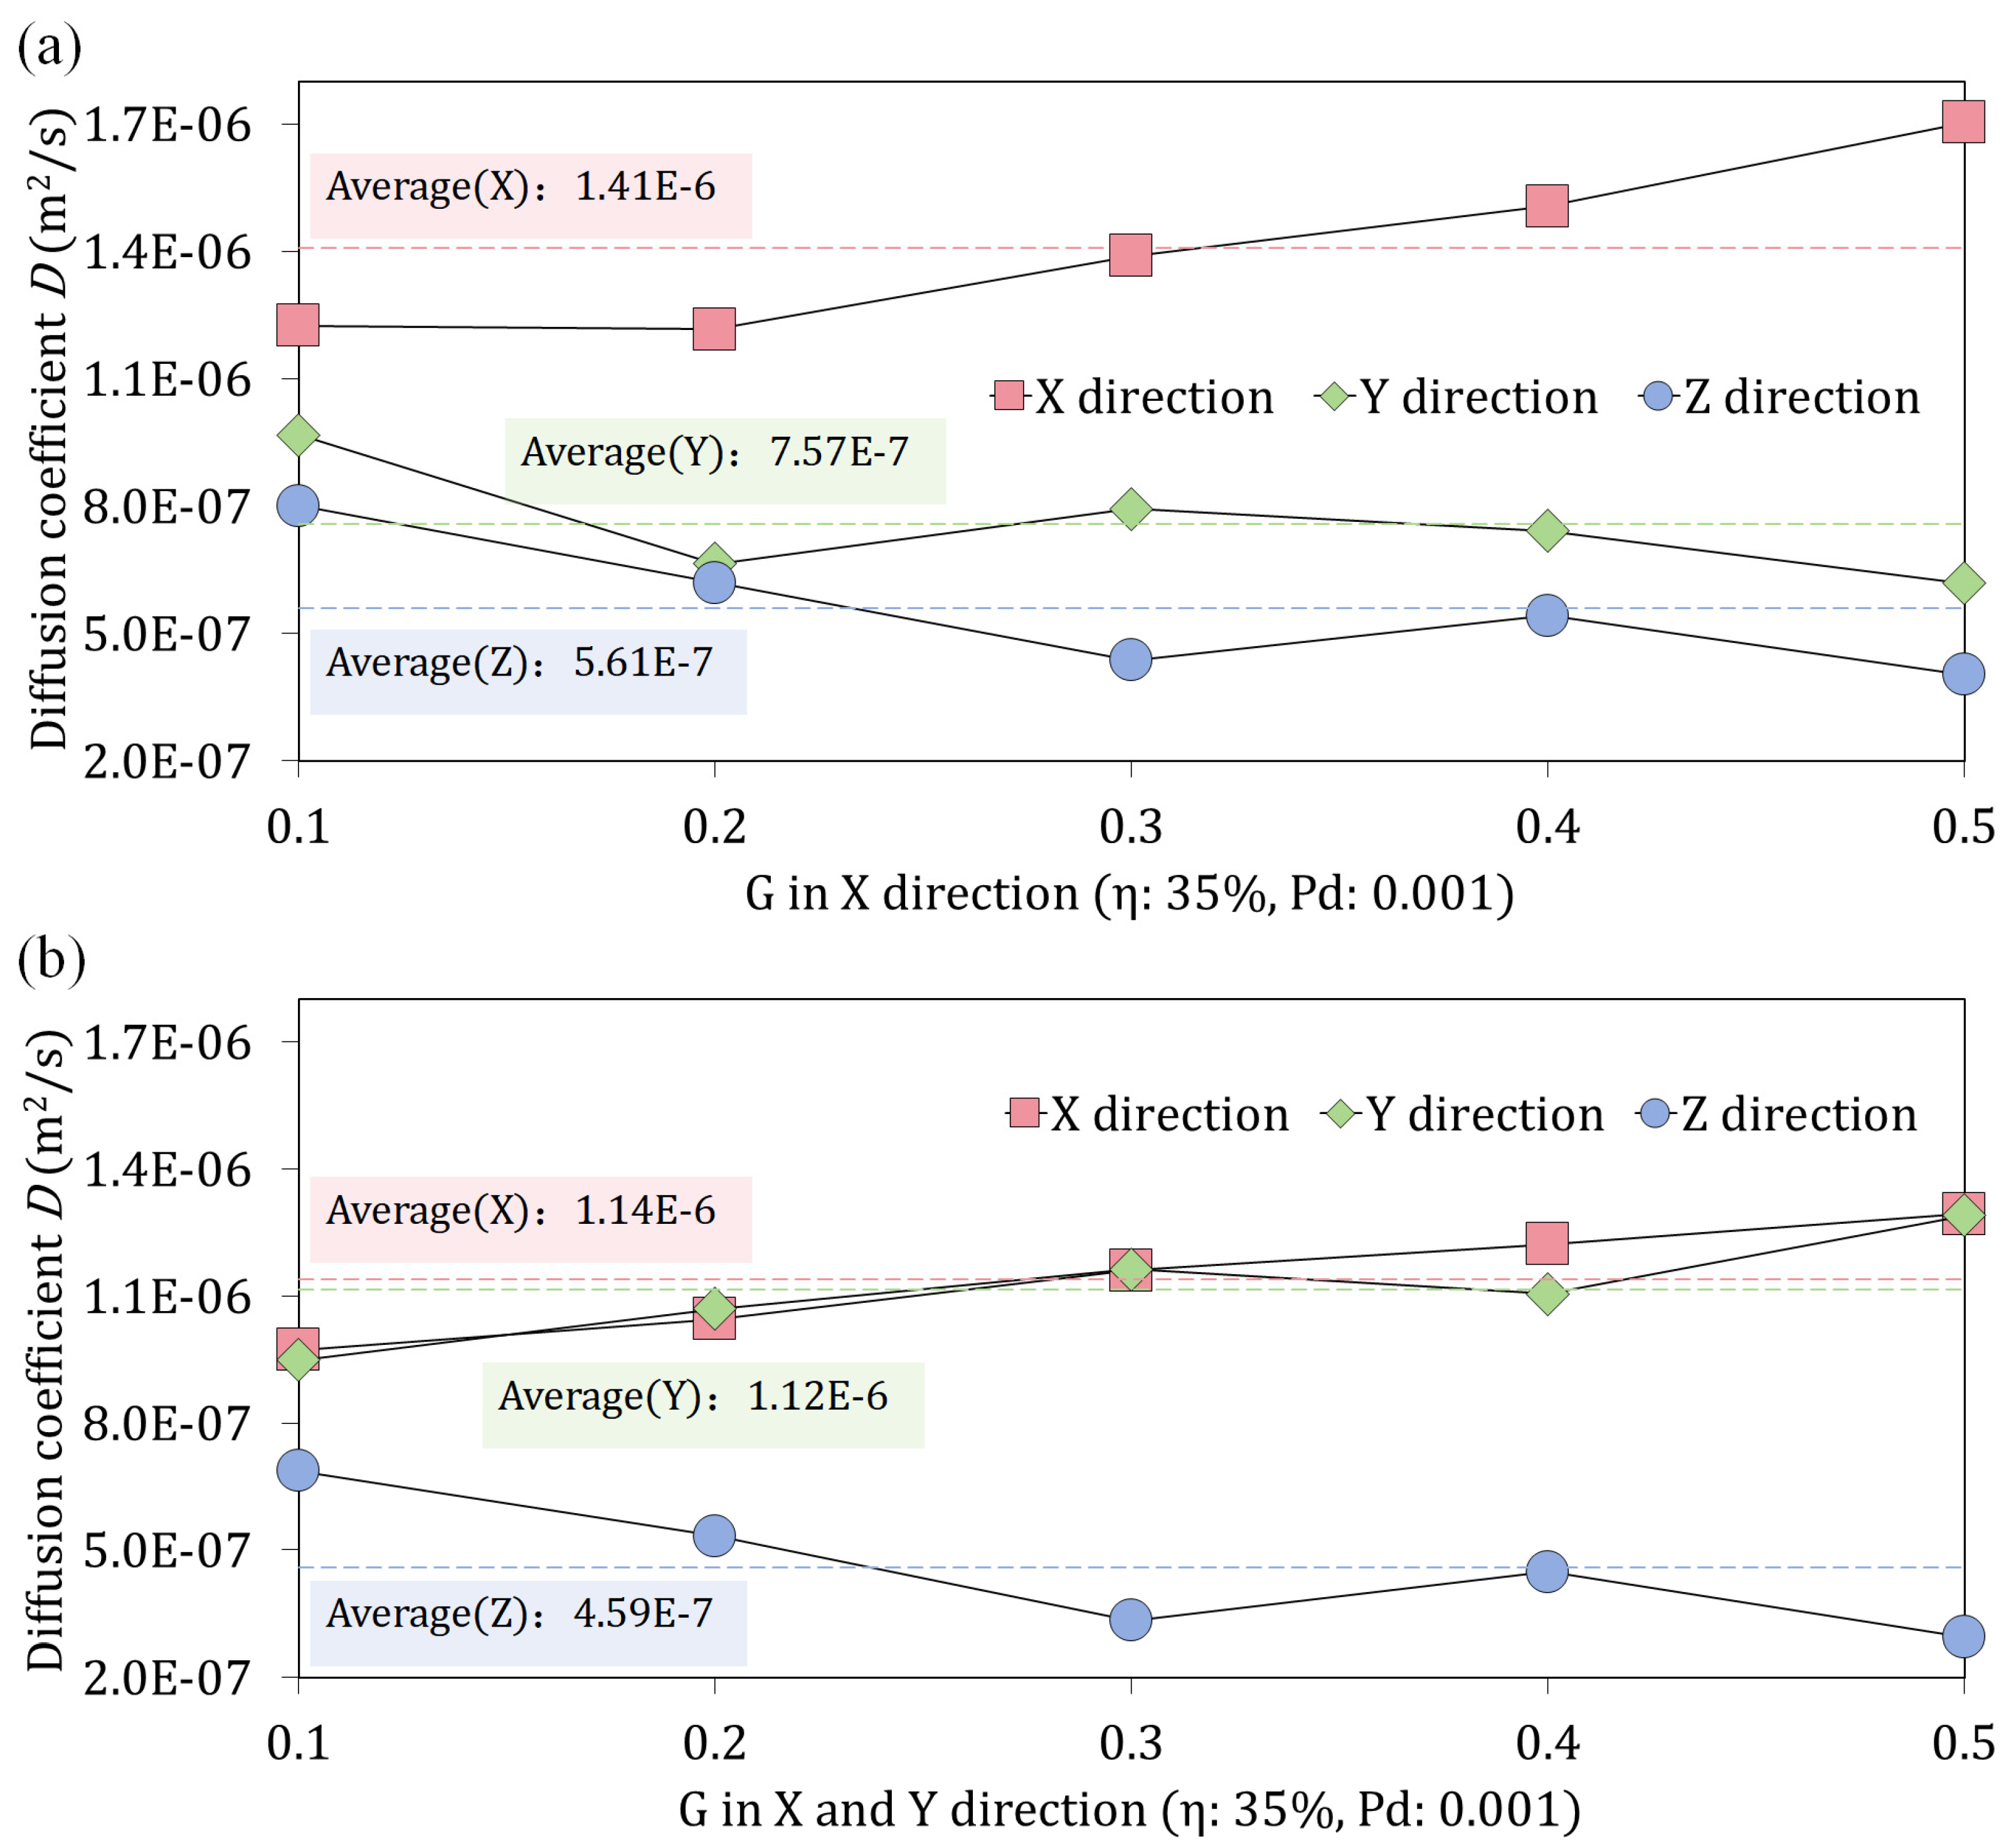
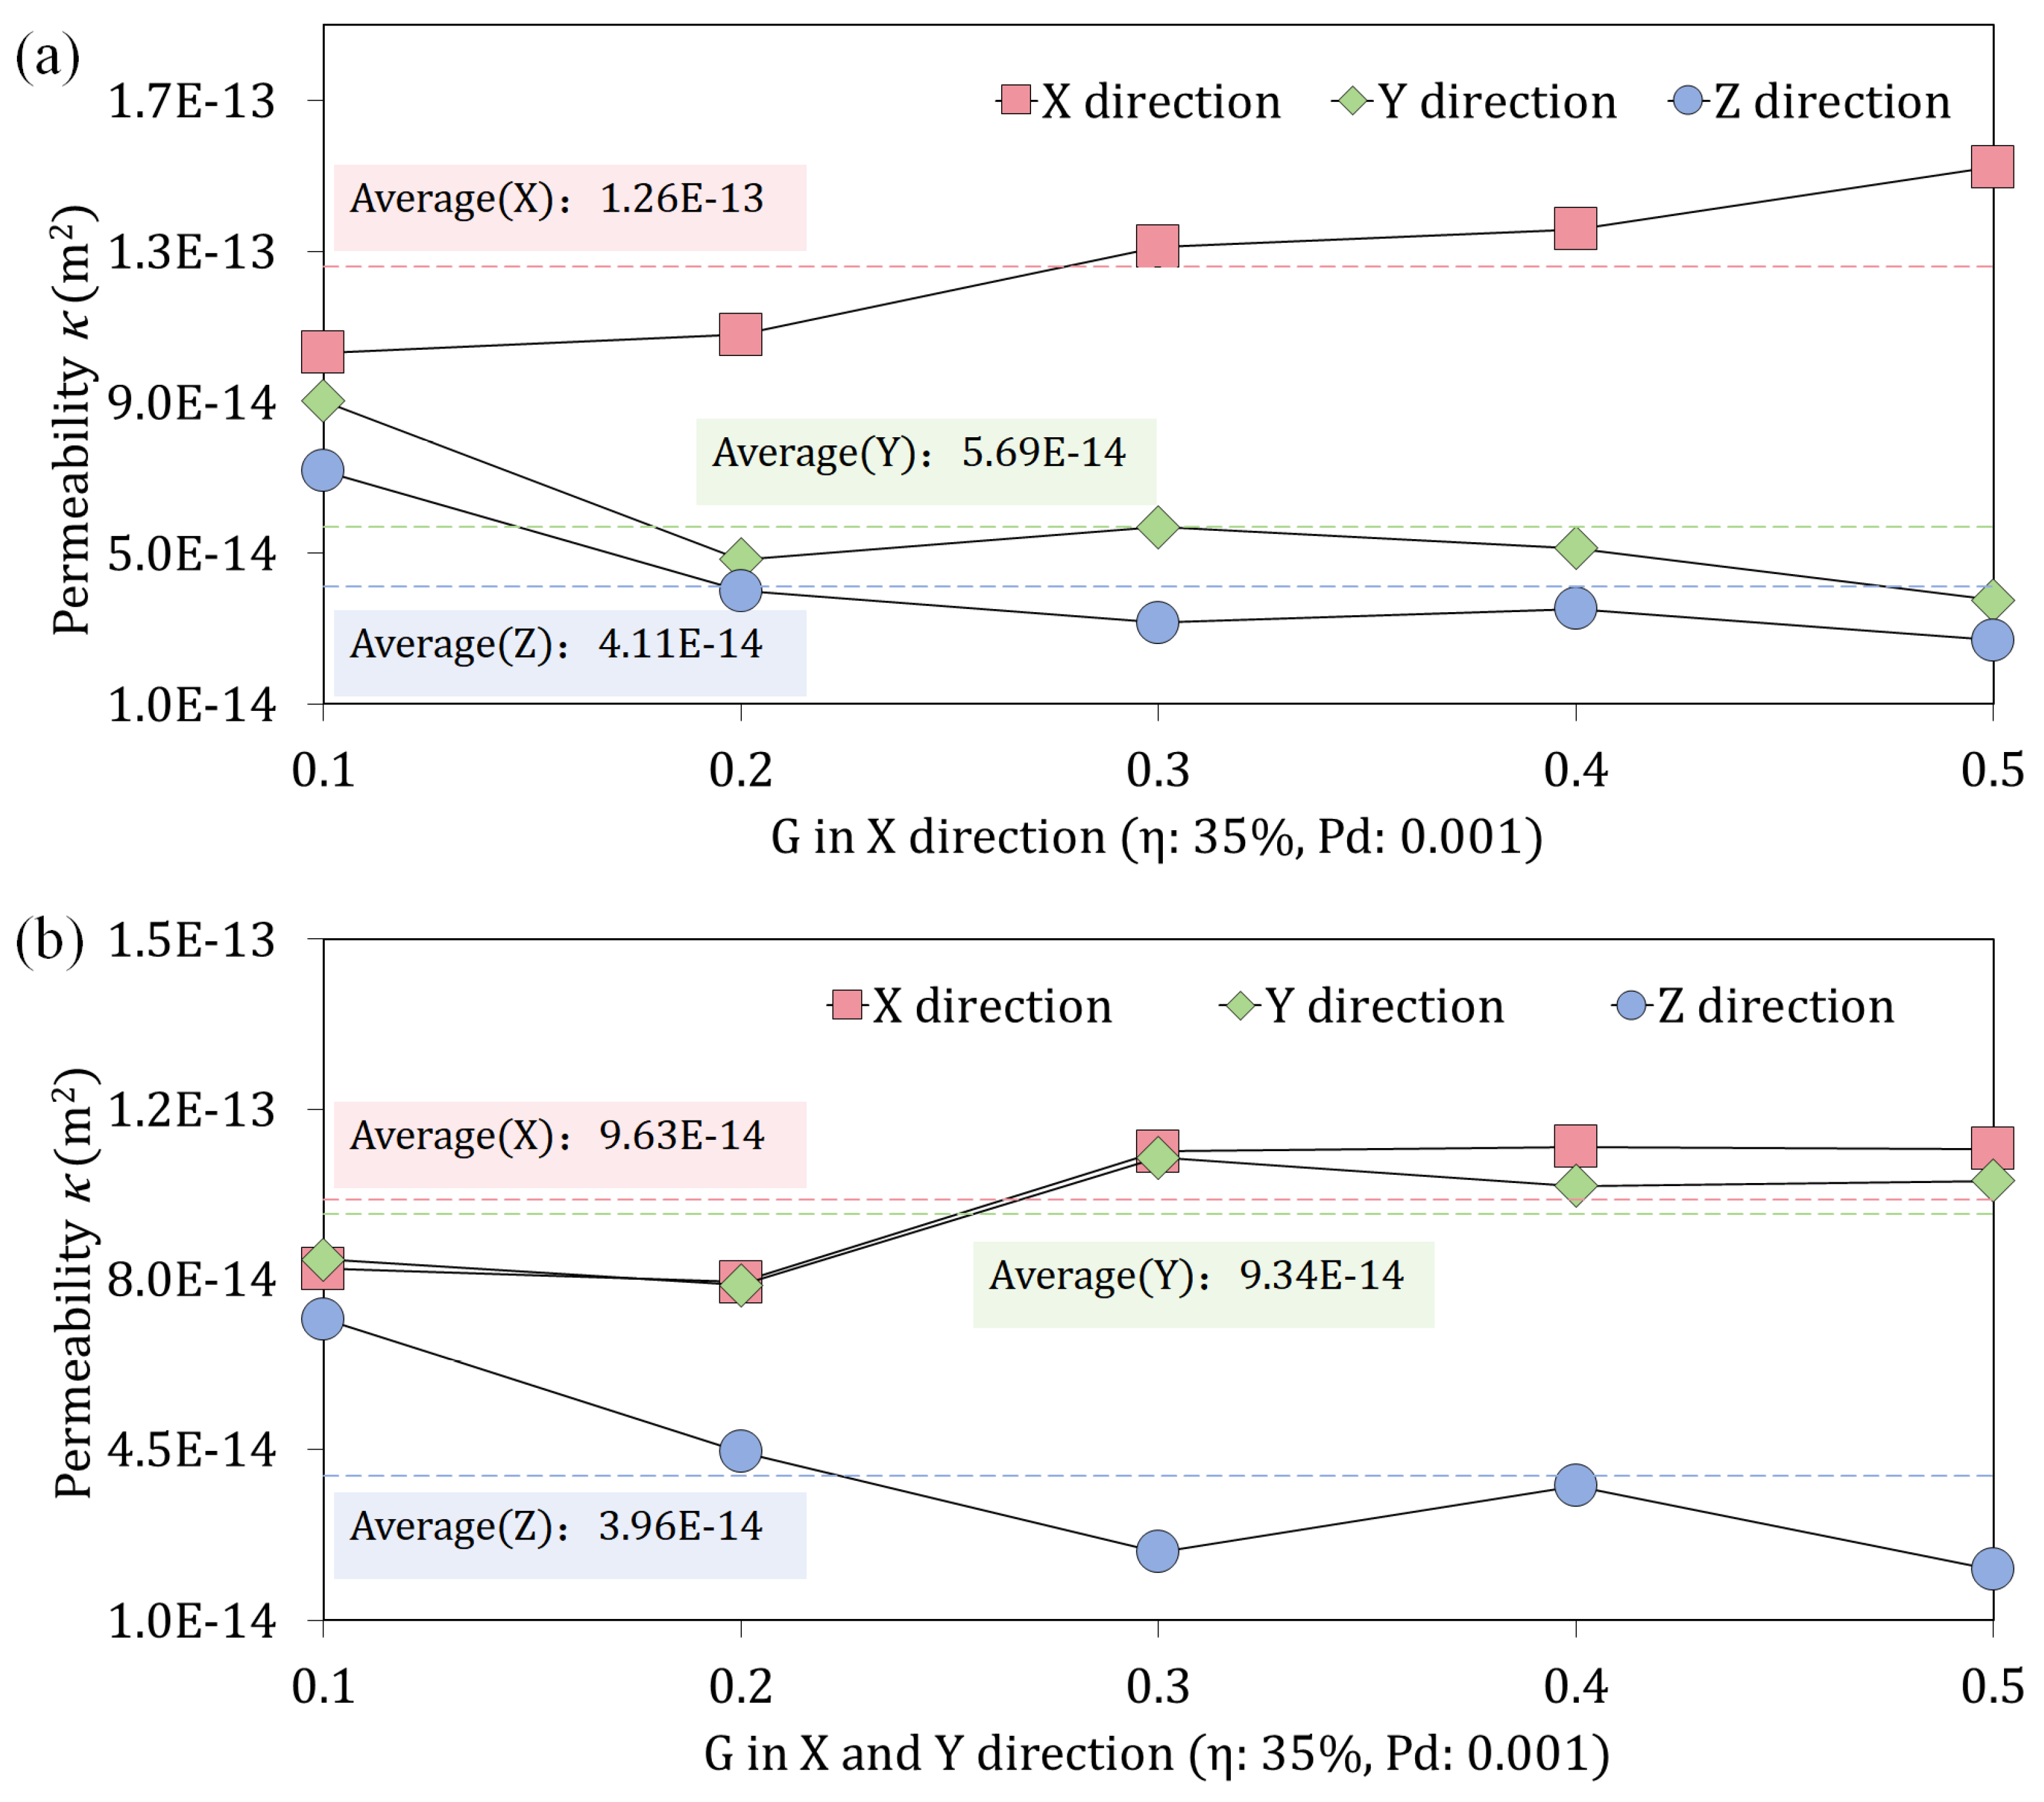
To study the influence laws of the anisotropy degree on the radon diffusion coefficient and permeability of the pore model, radon diffusion and seepage simulations were conducted for the three main directions of the second set of models with the boundary conditions of Section 3 to calculate the radon diffusion coefficient and permeability. Figure 13 shows the radon diffusion coefficients and permeabilities of the 10 pore models.
Regarding the radon diffusion coefficient, Figure 13a,b show that the radon diffusion coefficient of the pore model had a significant positive correlation with the growth probability in the same main direction and a significant negative correlation with growth probabilities in different main directions. The reason was that an increase in G in a certain direction meant that it was easier to form continuous and unobstructed layer-like preferential channels in that direction, which was more conducive to the diffusion of substances, while these layer-like preferential channels will make the connectivity in the transverse direction worse, which is not conducive to the diffusion of substances. Figure 13a shows that, when G in the X direction was between 0.1 and 0.5, the average radon diffusion coefficient in the X direction was 1.97 times and 2.66 times those of the Y and Z directions, respectively; Figure 13b shows that, when G in the X and Y directions was between 0.1 and 0.5, the average radon diffusion coefficients in the X and Y directions were 2.47 times and 2.40 times that in the Z direction, respectively.
Regarding the permeability, Figure 14a,b show that the relationship between the permeability of the pore model and the growth probability was basically consistent with that of the radon diffusion coefficient. Figure 14a shows that, when G in the X direction was between 0.1 and 0.5, the average permeability in the X direction was 2.22 times and 3.07 times those in the Y and Z directions, respectively; Figure 14b shows that, when G in the X and Y directions was between 0.1 and 0.5, the average permeabilities in the X and Y directions were 2.44 times and 2.36 times that in the Z direction, respectively.

4.4. Effects of Water Saturation and Temperature on Radon Diffusion Coefficient and Permeability

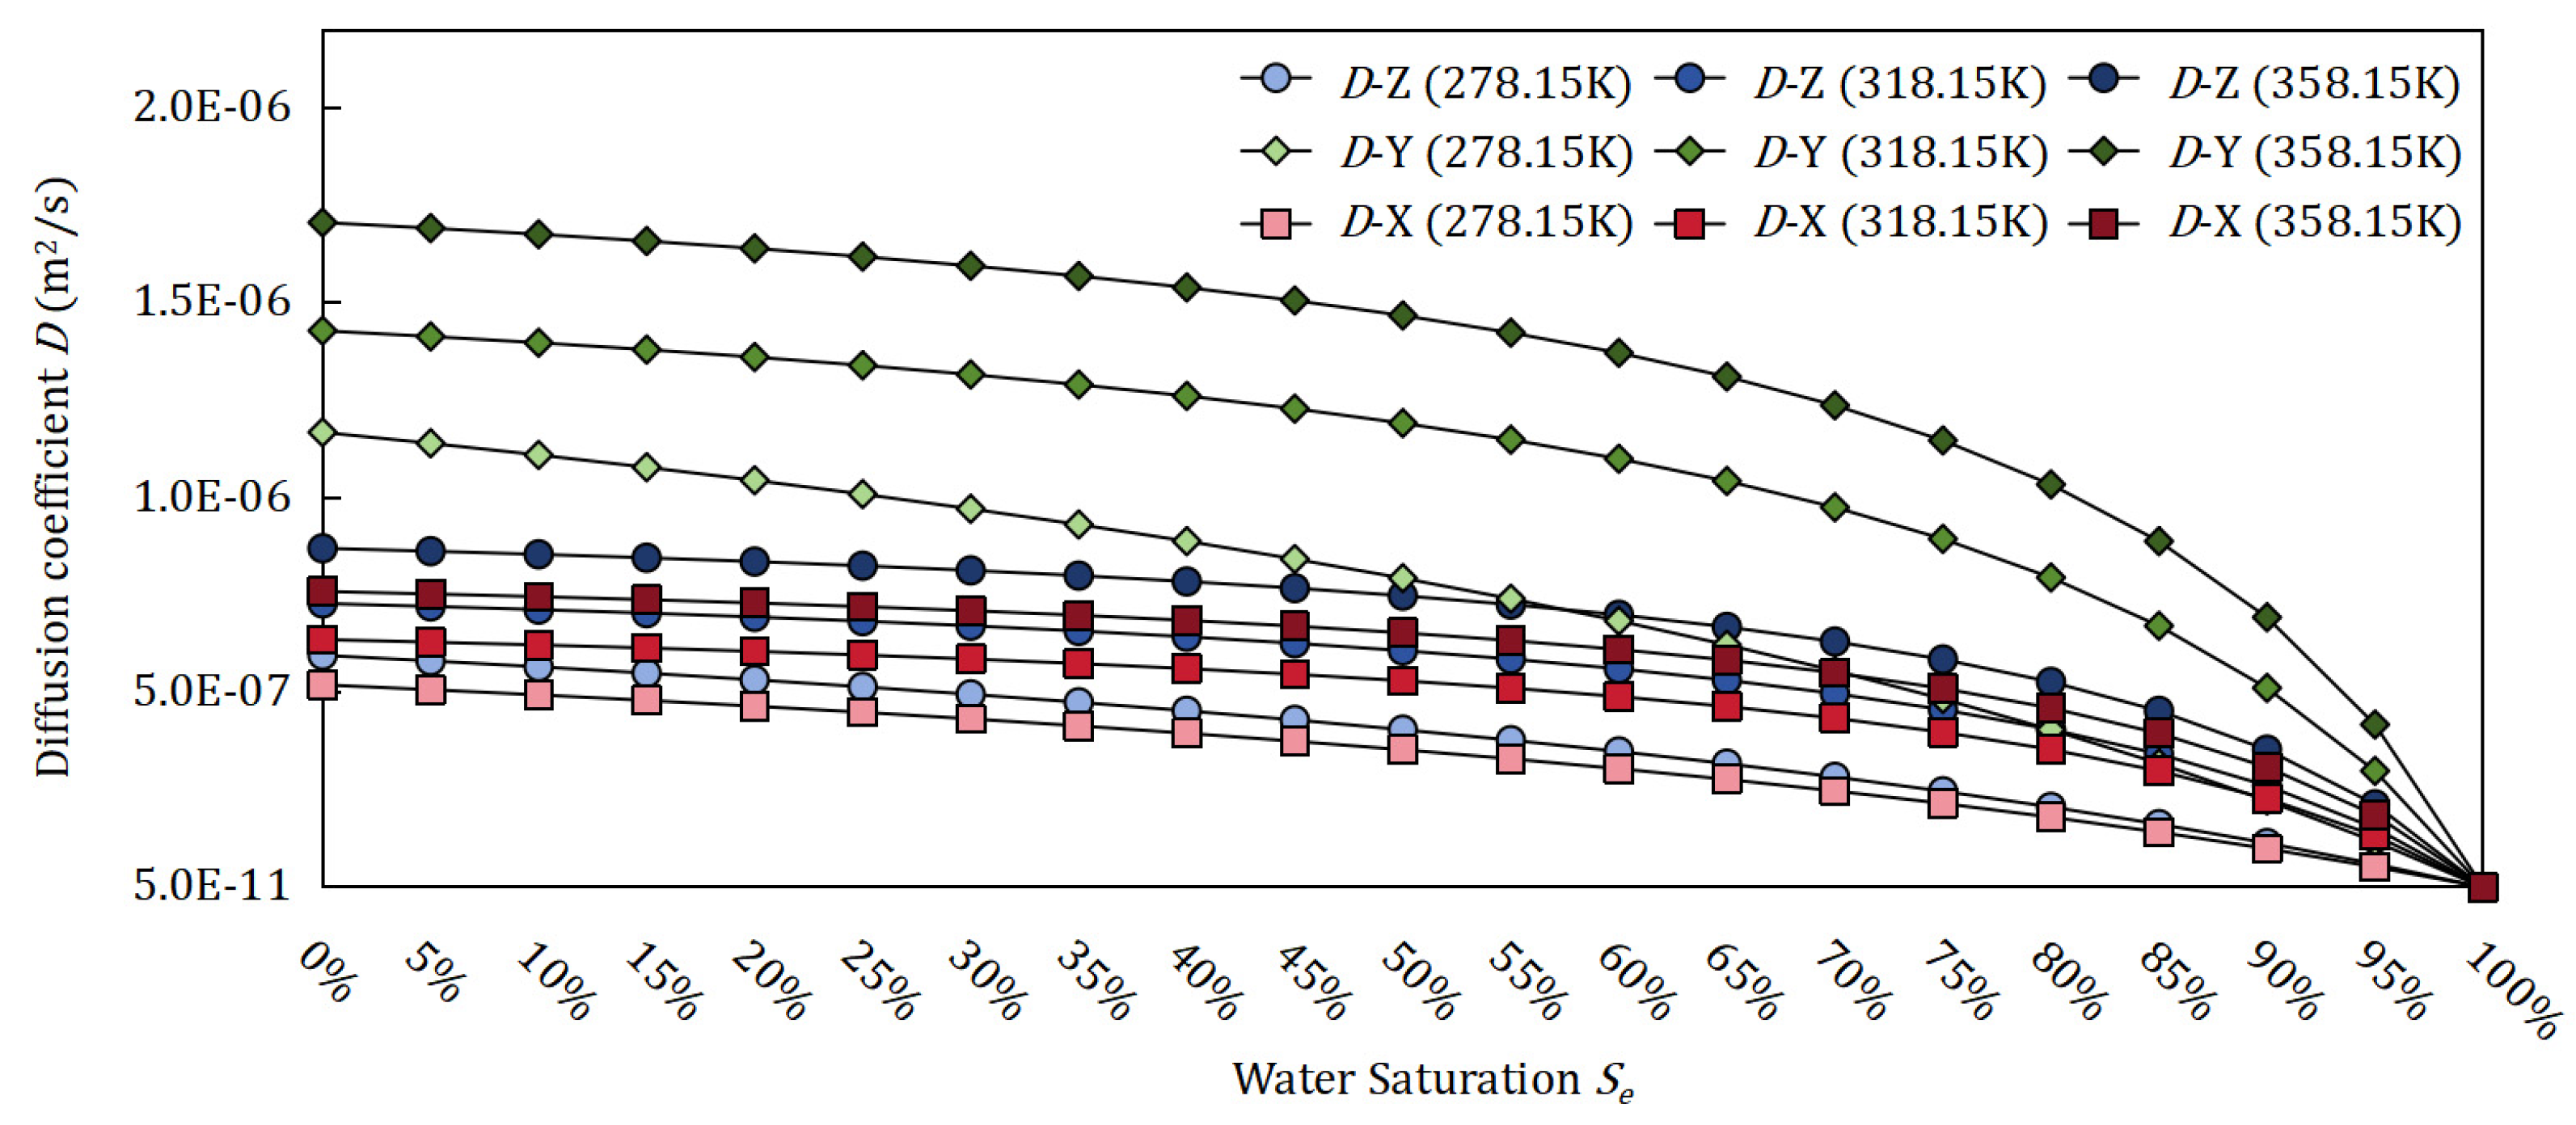
To investigate the effects of water saturation and temperature on the radon diffusion coefficient and permeability, water saturation Se was varied from 0% to 100% at 5% intervals, and temperature T was controlled from 273.15 K to 353.15 K at 40 K intervals. The radon diffusion coefficient of the CT-derived pore model under unsaturated and non-isothermal conditions was calculated using the directional tortuosity factors and Equation (8), with the results presented in Figure 15.
Figure 15 demonstrates that the radon diffusion coefficient D across all directions and temperatures T decreased monotonically with an increasing water saturation Se. For Se in the range of 0% to 70%, D declined relatively gradually; by contrast, for Se from 80% to 100%, D plummeted sharply and approached zero. For instance, D-Z at 278.15 K was 5.96 × 10⁻⁷ m2/s at Se = 0%, decreasing to 2.83 × 10⁻⁷ m2/s at Se = 70% (approximately 52% reduction). At Se = 100%, D-Z fell to 6.68 × 10⁻¹¹ m2/s (over 99% reduction). This behavior arose because water occupied pore space and blocked radon diffusion pathways; a higher Se thus increased the diffusion resistance. For a given direction and Se, the radon diffusion coefficient increased with rising T. For example, at Se = 0%, D-Z increased from 5.96 × 10⁻⁷ m2/s at 278.15 K to 7.28 × 10⁻⁷ m2/s at 318.15 K (approximately 22% increase) and further to 8.70 × 10⁻⁷ m2/s at 358.15 K (approximately 19% increase). This trend reflected the T dependence of the diffusion coefficient, as a higher T enhances the thermal motion of radon molecules, accelerating their diffusion rate. The above-described influence patterns of Se and T on the radon diffusion coefficient D are basically consistent with the experimental results and empirical formulas obtained by Ishimori Y et al. based on various types of soil [1].
Notably, the higher the Se, the more significant the temperature-driven enhancement of D, whereas, at higher T, the magnitude of this enhancement became less pronounced. For example, at Se = 100%, D-Z increased from 6.68 × 10⁻¹¹ m2/s at 278.15 K to 1.78 × 10⁻¹⁰ m2/s at 318.15 K (approximately 166% increase) and further to 3.80 × 10⁻¹⁰ m2/s at 358.15 K (approximately 114% increase). At this Se level, the temperature-induced increase in the diffusion coefficient was 5~8 times greater than that observed at Se = 0%. This behavior can be explained by the fact that, at a high Se, water occupies most pores, narrowing the effective diffusion pathways and significantly increasing resistance. The enhanced molecular kinetic energy from rising temperatures thus more effectively overcame this resistance, amplifying the increase in the diffusion coefficient. Conversely, at higher temperatures, molecular thermal motion was already vigorous, so the incremental kinetic energy from further temperature increases had a diminishing promotional effect on the diffusion coefficient.
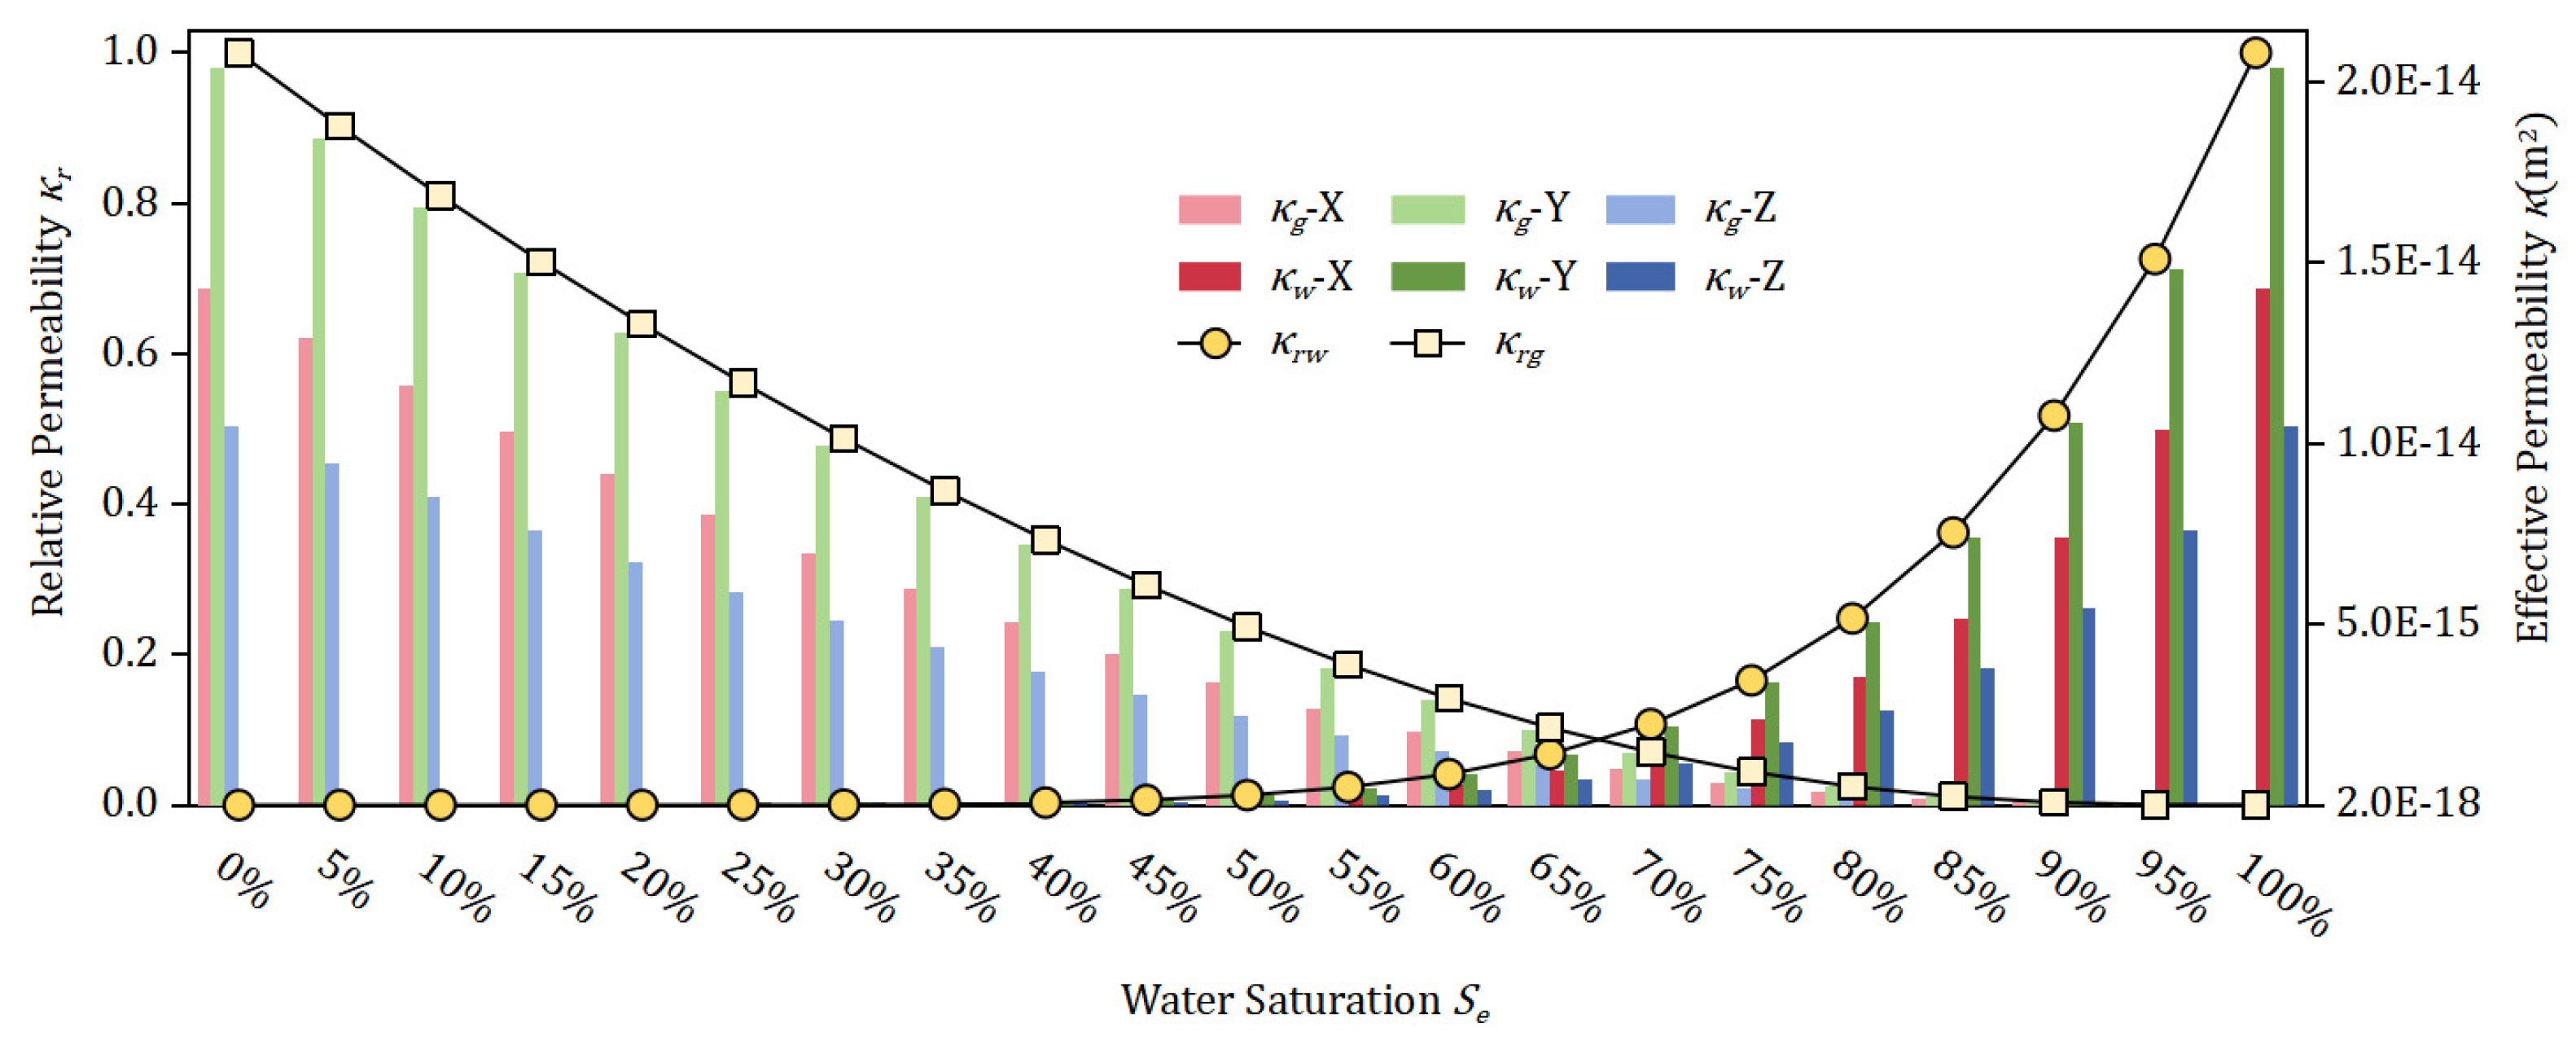
The box-counting dimension of the CT pore model was calculated as 2.14 using the box-counting dimension function in Avizo 2020; the residual water saturation Sec and residual gas saturation Sgc were set to 0, and the water saturation Se was varied from 0% to 100% at 5% intervals. By integrating these parameters with Equations (4)–(6), the relative permeability and effective permeability of the CT pore model under unsaturated conditions were computed; the results are presented in Figure 16. The left (primary) vertical axis of Figure 16 represents the dimensionless relative permeability of the water and gas phases, while the right (secondary) vertical axis shows the effective permeability (m2) of the water and gas phases along the X, Y, and Z directions. The curves represent the relative permeability of the water phase (krw, line with yellow circles) and the relative permeability of the gas phase (krg, line with pale yellow squares). The histograms denote the effective permeability of the gas phase along the X (pink), Y (light green), and Z (blue) directions (denoted as κg-X, κg-Y, and κg-Z, respectively) and the effective permeability of the water phase along the X (red), Y (green), and Z (dark blue) directions (denoted as κw-X, κw-Y, and κw-Z, respectively).
As Se increased, the relative permeability of the gas phase exhibited a nonlinear decline (with a rapid initial decrease followed by a slower rate), while the relative permeability of the water phase showed a nonlinear increase (with a slow initial rise followed by accelerated growth). When Se < 40%, the water phase relative permeability (krw) remained below 1 × 10⁻², corresponding to the threshold for fluid flow initiation in porous media. When Se > 70%, krw increased sharply from 0.15 to 1.0, indicating that a dominant flow pathway for the water phase was rapidly formed in the medium once this saturation threshold was exceeded. The above-described influence of Se on krw and krg is generally consistent with the theoretical curves and experimental data reported by Brooks R H et al. [24].
The following variations in the effective permeability are shown in the histograms: Low saturation stage (Se < 40%): The effective permeability of the gas phase dominated, with the gas phase effective permeability along the Y direction (light green bars) being significantly higher than those along the X and Z directions. The effective permeabilities of the water phase in all directions were close to 0, reflecting that the gas-phase flow dominated the pores at this stage, and the Y direction served as the preferential flow channel for the gas phase. Moderate saturation stage (40% < Se < 70%): The effective permeability of the gas phase continued to decline, while the effective permeability of the water phase began to increase slowly, but the values in all directions remained at low levels, indicating a competitive transition stage between gas and water flow pathways. High saturation stage (Se > 70%): The effective permeability of the water phase increased rapidly, especially along the Y direction (green bars), which reached a peak at Se = 100%, and the Z direction (dark blue bars) also increased significantly. In contrast, the effective permeability of the gas phase in all directions decreased to near 0, indicating that the water phase had occupied the dominant flow pathway, and the anisotropic characteristics were more pronounced in the water phase effective permeability.

5. Conclusions

Based on the QSGS method, a series of three-dimensional reconstructed pore models with radon diffusion coefficients and permeabilities close to those of the CT pore model were constructed, which verified the reliability and effectiveness of the QSGS method in reconstructing the rock pore model. Subsequently, pore models with different porosities (η), distribution probabilities (Pd), and growth probabilities (G) were constructed, and radon diffusion and seepage simulations were conducted; the relationships between various pore structural characteristics and the radon diffusion coefficient and permeability were studied. Finally, by coupling the unsaturated non-isothermal radon diffusion coefficient model and the Brooks–Corey model, the relationships between the radon diffusion coefficient and water saturation and temperature, as well as the relationships between the effective permeability and water saturation were investigated. The main conclusions are summarized as follows:
Porosity (η) exhibited a significant positive correlation with both the radon diffusion coefficient and permeability, with a more pronounced positive correlation observed for permeability. Under low-porosity conditions (η = 20%), both the radon diffusion coefficient and permeability showed a significant positive correlation with Pd. Under medium-porosity conditions (η = 30%), the radon diffusion coefficient maintained a significant positive correlation with Pd, while the permeability exhibited a significant negative correlation with Pd. Under high-porosity conditions (η = 35%), the radon diffusion coefficient showed no significant correlation with Pd, whereas the permeability still had a significant negative correlation with Pd. Additionally, the radon diffusion coefficient and permeability were significantly positively correlated with the pore growth probability (G) in the same principal directions, but significantly negatively correlated with G in orthogonal principal directions.
The radon diffusion coefficient was significantly negatively correlated with water saturation (Se) and weakly positively correlated with temperature (T). Specifically, the higher the Se, the more significant the increment of the radon diffusion coefficient induced by T; conversely, the higher the T, the less pronounced the increment of the radon diffusion coefficient. With the increase in Se, the relative air permeability decreased nonlinearly, while the relative water permeability increased nonlinearly. When the water saturation exceeded 40%, the pore model reached the seepage breakthrough threshold. When the water saturation was higher than 70%, the relative water permeability increased sharply.

Author Contributions

Y.-C.C.: Conceptualization, methodology, investigation, software, formal analysis, data curation, visualization, validation, writing—original draft; Z.-L.L.: Methodology, formal analysis, data curation, validation, writing—review and editing; D.X.: Conceptualization, writing—review and editing, supervision, funding acquisition. All authors have read and agreed to the published version of the manuscript.

Funding

This work was supported by the National Natural Science Foundation of China (No: 12275122).

Data Availability Statement

The original contributions presented in this study are included in the article. Further inquiries can be directed to the corresponding author.

Conflicts of Interest

The authors declare no conflicts of interest.

References

  1. Ishimori, Y.; Lange, K.; Martin, P.; Mayya, Y.S.; Phaneuf, M. Measurement and Calculation of Radon Releases from NORM Residues; IAEA Technical Reports Series No. 474; International Atomic Energy Agency: Vienna, Austria, 2013; ISBN 9789201426109. [Google Scholar]
  2. Zhao, J.; Fu, D.; Li, Y.; Jiang, Y.; Xu, W.; Chen, X. REV-scale simulation of gas transport in shale matrix with lattice Boltzmann method. J. Nat. Gas Sci. Eng. 2018, 57, 224–237. [Google Scholar] [CrossRef]
  3. Huo, Y.; Guo, Y.; Rao, Z. Investigation on the thermal performance of phase change material/porous medium-based battery thermal management in pore scale. Int. J. Energy Res. 2018, 43, 767–778. [Google Scholar] [CrossRef]
  4. Yao, S.; Luo, J.; Liu, R.; Shen, X.; Huang, X. Microscopic study of ion transport in the porous electrode of a desalination battery based on the lattice Boltzmann method. New J. Chem. 2022, 46, 1516–1532. [Google Scholar] [CrossRef]
  5. Liu, J.; Wu, M.; Zhu, Z.; Shao, Z. A study on the mechanical properties of the representative volume element in fractal porous media. Geofluids 2017, 2017, 7905218. [Google Scholar] [CrossRef]
  6. Jin, X.Q.; Zhao, C.Y. Numerical investigation on the effective thermal conductivity of plasma sprayed zirconia coatings. Ceram. Int. 2015, 41, 14915–14923. [Google Scholar] [CrossRef]
  7. Li, K.Q.; Miao, Z.; Li, D.Q.; Liu, Y. Effect of mesoscale internal structure on effective thermal conductivity of anisotropic geomaterials. Acta Geotech. 2022, 17, 3553–3566. [Google Scholar] [CrossRef]
  8. Huang, X.; Sun, C.; Chen, Z.; Han, Y. Experimental and numerical studies on melting process of phase change materials (PCMs) embedded in open-cells metal foams. Int. J. Therm. Sci. 2021, 170, 107151. [Google Scholar] [CrossRef]
  9. Guan, D.; Wu, J.H.; Jing, L. A statistical method for predicting sound absorbing property of porous metal materials by using quartet structure generation set. J. Alloys Compd. 2015, 626, 29–34. [Google Scholar] [CrossRef]
  10. Wang, J.; Kang, Q.; Wang, Y.; Pawar, R.; Rahman, S.S. Simulation of gas flow in micro-porous media with the regularized lattice Boltzmann method. Fuel 2017, 205, 232–246. [Google Scholar] [CrossRef]
  11. Wang, Q.; Li, C.; Zhao, Y.; Ai, D. Study of gas emission law at the heading face in a coal-mine tunnel based on the Lattice Boltzmann method. Energy Sci. Eng. 2020, 8, 1705–1715. [Google Scholar] [CrossRef]
  12. Wang, H.; Zeng, C.; Qin, X. Prediction on effective thermal conductivity of composite phase change materials from mesoscale structure. Mater. Today Commun. 2025, 46, 112555. [Google Scholar] [CrossRef]
  13. Li, R.; Wang, Z.; Dong, H.; Yang, M.; Sun, X.; Zong, Q.; Xu, Z. Lattice Boltzmann modeling of the effective thermal conductivity in plant fiber porous media generated by Quartet Structure Generation Set. Mater. Des. 2023, 234, 13. [Google Scholar] [CrossRef]
  14. Yang, Q.; Zhang, T.; Liu, X.; Qin, B.; Song, M.; Shen, B. The flow and heat transfer characteristics of DPF porous media with different structures based on LBM. Open Phys. 2022, 20, 349–369. [Google Scholar] [CrossRef]
  15. Zhu, Y.; Yue, W. Hydraulic tortuosity of porous media: Comparison of different modeling methods. J. Geophys. Eng. 2024, 3, 833–843. [Google Scholar] [CrossRef]
  16. Liao, Q.; Yang, Y.X.; Zhu, X.; Chen, R.; Fu, Q. Pore-scale lattice Boltzmann simulation of flow and mass transfer in bioreactor with an immobilized granule for biohydrogen production. Sci. Bull. 2017, 62, 22–30. [Google Scholar] [CrossRef]
  17. Cai, S.; Sun, X.; Li, X.; Li, S.; Xue, X. Simulation study on the electro-osmotic characteristic of a dehumidification fin. Sci. Technol. Built Environ. 2022, 28, 985–998. [Google Scholar] [CrossRef]
  18. Liu, W.; Wang, X.; Zhang, J.; Zhang, G.; Chen, C.; Liu, P. Quartet structure generation set algorithm based 3D reconstruction on porous structures of sintered copper joints for power electronics packaging. Scr. Mater. 2025, 265, 116750. [Google Scholar] [CrossRef]
  19. Zhao, D.; Xu, J.; Wang, X.; Guo, Q.; Li, Y.; Han, Z.; Liu, Y.; Zhang, Z.; Zhang, J.; Sun, R. Numerical Study on Permeability of Reconstructed Porous Concrete Based on Lattice Boltzmann Method. Buildings 2024, 14, 1182. [Google Scholar] [CrossRef]
  20. Xia, H.; Lai, Y.; Mousavi-Nezhad, M. Meso-scale investigation on the permeability of frozen soils with the lattice Boltzmann method. Phys. Fluids 2024, 36, 19. [Google Scholar] [CrossRef]
  21. Wu, C.; Zhang, T.; Fu, J.; Liu, X.; Shen, B. Random pore structure and REV scale flow analysis of engine particulate filter based on LBM. Open Phys. 2020, 18, 881–896. [Google Scholar] [CrossRef]
  22. Zeng, J.; Chen, Y.C.; Jia, Q.R.; Yang, Y.; Xie, D. Numerical simulation of pore structure on radon permeability and diffusion of porous media. J. Radioanal. Nucl. Chem. 2025, 334, 2919–2928. [Google Scholar] [CrossRef]
  23. Wang, M.; Wang, J.; Pan, N.; Chen, S. Mesoscopic predictions of the effective thermal conductivity for microscale random porous media. Phys. Rev. E Stat. Nonlinear Soft Matter Phys. 2007, 75, 036702. [Google Scholar] [CrossRef] [PubMed]
  24. Brooks, R.H.; Corey, A.T. Properties of porous media affecting fluid flow. J. Irrig. Drain. Div. 1966, 92, 61–88. [Google Scholar] [CrossRef]
  25. Kewen, L. Theoretical Development of the Brooks-Corey Capillary Pressure Model from Fractal Modeling of Porous Media. In Proceedings of the SPE Improved Oil Recovery Conference, Tulsa, OK, USA, 17–21 April 2004. Paper No. SPE-89429-MS. [Google Scholar] [CrossRef]
  26. Xu, W.P.; Ding, D.X.; Rao, L.; Li, G.Y.; Chen, X. A Coupled Mathematic Model for Radon Migration through Gas liquid Two-phase Fluid in Loose Fragmented Radioactive Medium. J. Univ. South China (Sci. Technol.) 2009, 23, 1–4. [Google Scholar] [CrossRef]
  27. Hao, Y.; Jiang, F.; Tan, B.; Zhang, C.; Zhang, M.; Li, H.; Yang, X.; Mo, Y.; Hu, T.; Li, S.; et al. Study on damage evolution and radon exhalation of uranium-bearing granite under high temperature. Environ. Sci. Pollut. Res. 2023, 30, 35223–35237. [Google Scholar] [CrossRef]
  28. Cai, Z.Q.; Li, X.Y.; Lei, B.; Hong, C.S.; Liu, K.X.; Li, M. Experimental Study on Influences of Low-frequency Vibration on Radon Exhalation from Hyperthermal Uranium-like Rock. Ind. Saf. Environ. Prot. 2018, 44, 22–26. Available online: https://oversea.cnki.net/kcms2/article/abstract?v=1UVqcA8TcpD0JR2kLMftZuCXqm_CCL0U19Vn-dbH5LDoFsXYBOWr_ufajsUIOHHoX-OA6mD6X1AMgxtTdisNftA4j0zTRUVRraMS6W_VgSA7eWmC3N2XBX1kG7X2j56GnsM2hHOfHgj4juGBzaPJJUZLSLi796u5AR4mCD4yWzOX5UFn58_aCQ==&uniplatform=OVERSEA&language=EN (accessed on 3 February 2026).
  29. Jiang, F.L.; Yang, W.C.; Zhang, S.; Liu, Y.; Li, X.Y.; Li, M.; Guo, J.T. Experimental Study on Damage and Radon Precipitation Law for Quasi-uranium Ore under Cyclic Blasting Load. Min. Metall. Eng. 2019, 39, 15–20. [Google Scholar]
  30. Jun, F.; Yue, Y.; JiaBin, Y. Water permeation simulation of autoclaved aerated concrete blocks using the Lattice Boltzmann method. Mag. Civ. Eng. 2019, 5, 106–114. [Google Scholar] [CrossRef]
  31. Que, Y.; Qiu, T.; Cai, P.C.; Ma, H.Y.; Xie, X.D.; Xue, B. LBM Numerical Simulation of Seepage Field of 3D Reconstructed SoilBased on QSGS Method. J. Hunan Univ. (Nat. Sci.) 2023, 50, 119–130. [Google Scholar] [CrossRef]
Figure 1. Schematic diagram of computed tomography (CT) technology.
Processes 14 00634 g001
Figure 2. Schematic diagram of the Quartet Structure Generation Set method (QSGS method). Different colors (pink/light green/light blue) correspond to face to face/point to point/side to side growth direction categories; G1–G26 mark growth sites under these categories.
Processes 14 00634 g002
Figure 3. Schematic diagram of CT pore model establishment.
Processes 14 00634 g003
Figure 4. Schematic diagram and boundary conditions of the CT pore model.
Processes 14 00634 g004
Figure 5. Verification of the grid independence of the CT pore model.
Processes 14 00634 g005
Figure 6. Radon concentration field and radon diffusion coefficient of the CT pore model.
Processes 14 00634 g006
Figure 7. Velocity streamline field and permeability of the CT pore model.
Processes 14 00634 g007
Figure 8. CT pore model and QSGS pore model (a); comparison of radon diffusion coefficient (b); comparison of permeability (c).
Processes 14 00634 g008
Figure 9. Pore models with different porosities η and distribution probabilities Pd.
Processes 14 00634 g009
Figure 10. Pore models with different principal direction growth probabilities G.
Processes 14 00634 g010
Figure 11. The influence of different porosities η and distribution probabilities Pd on the radon diffusion coefficient. (a) η = 20%; (b) η = 30%; (c) η = 35%. The colored dashed lines represent the average values of the radon diffusion coefficient: pink for the X direction, green for the Y direction, and blue for the Z direction.
Processes 14 00634 g011
Figure 12. The influence of different porosities η and distribution probabilities Pd on permeability. (a) η = 20%; (b) η = 30%; (c) η = 35%. The colored dashed lines represent the average values of the permeability: pink for the X direction, green for the Y direction, and blue for the Z direction.
Processes 14 00634 g012
Figure 13. The influence of growth probability G in different main directions on the radon diffusion coefficient. (a) G in the X direction; (b) G in the X and Y directions. The colored dashed lines represent the average values of the radon diffusion coefficient: pink for the X direction, green for the Y direction, and blue for the Z direction.
Processes 14 00634 g013
Figure 14. The influence of growth probability G in different main directions on the permeability. (a) G in the X direction; (b) G in the X and Y directions. The colored dashed lines represent the average values of the permeability: pink for the X direction, green for the Y direction, and blue for the Z direction.
Processes 14 00634 g014
Figure 15. Influence of water saturation and temperature on the radon diffusion coefficient.
Processes 14 00634 g015
Figure 16. Influence of water saturation on relative permeability and effective permeability.
Processes 14 00634 g016
Table 1. Comparison of radon diffusion coefficient between the CT model and the pore models.
DirectionCT Model
Diffusion Coefficient (m2/s)
Range of Pore Model
Diffusion Coefficient (m2/s)
Mean Relative Deviation
X5.06 × 10−73.22 × 10⁻⁷~5.15 × 10−723.30%
Y1.14 × 10−61.29 × 10⁻⁷~1.68 × 10−724.50%
Z5.80 × 10−73.89 × 10⁻⁷~6.56 × 10−716.80%
Table 2. Comparison of permeability between the CT model and the pore models.
DirectionCT Model
Permeability (m2/s)
Range of Pore Model
Permeability (m2/s)
Mean Relative Deviation
X7.98 × 10−143.71 × 10⁻¹⁴~9.09 × 10−1412.91%
Y4.72 × 10−132.71 × 10⁻¹³~4.56 × 10−1330.41%
Z1.13 × 10−137.41 × 10⁻¹⁴~1.37 × 10−1314.37%
Disclaimer/Publisher’s Note: The statements, opinions and data contained in all publications are solely those of the individual author(s) and contributor(s) and not of MDPI and/or the editor(s). MDPI and/or the editor(s) disclaim responsibility for any injury to people or property resulting from any ideas, methods, instructions or products referred to in the content.