Article

Hydraulic Fracture Propagation and Fracturing Design Optimization in Deep Coalbed Methane Reservoirs of the Changqing Oilfield

College of Energy, Chengdu University of Technology, Chengdu 610059, China
*
Authors to whom correspondence should be addressed.
Processes 2026, 14(3), 560; https://doi.org/10.3390/pr14030560
Submission received: 14 January 2026 / Revised: 30 January 2026 / Accepted: 2 February 2026 / Published: 5 February 2026
(This article belongs to the Section Petroleum and Low-Carbon Energy Process Engineering)

Abstract

This study presents a novel approach for optimizing hydraulic fracture propagation and fracturing design in deep coalbed methane (CBM) reservoirs, specifically focusing on the Changqing Oilfield in the eastern Ordos Basin. The increasing demand for clean energy underscores the strategic importance of CBM as an unconventional natural gas resource. However, significant variability in fracturing effectiveness has limited efficient production from deep CBM reservoirs. Unlike previous studies that primarily focus on shallow coal reservoirs, this work goes beyond existing efforts by developing detailed structural and geomechanical models incorporating well log data from 31 wells, allowing for a more accurate simulation of fracture propagation under varying fracturing conditions. Through numerical simulations, the study identifies key parameters—such as segment cluster ratio, fluid volume, and injection rate—that significantly influence fracture length and stimulated reservoir volume. The results indicate that optimizing fluid volume and segment cluster ratio can enhance fracture propagation and improve the total stimulated reservoir volume, particularly in reservoirs with stronger rock plasticity and higher permeability. These findings provide valuable insights into the optimization of hydraulic fracturing designs, contributing to improved gas production efficiency and better reservoir stimulation in deep CBM reservoirs.

1. Introduction

With the increasing global demand for clean energy, coalbed methane (CBM), as a major unconventional natural gas resource, plays an important strategic role in optimizing the energy structure and ensuring energy security [1]. Coalbed methane (CBM) is widely distributed across the globe, with significant reserves found in various regions, such as the United States, Australia, and Canada. These countries have made substantial advances in CBM exploration and production, leading to a greater understanding of its potential as a clean energy source. In the United States, the Appalachian Basin has long been a key area for CBM extraction, and similar successes have been observed in the Powder River and San Juan Basins. These regions have contributed to the global body of research on coal seam properties, including permeability, porosity, and fracture systems, all of which are critical factors influencing CBM production efficiency. Deep coalbed methane (DCBM) generally refers to CBM hosted in coal seams at burial depths greater than 1500 m and is characterized by large resource abundance and wide spatial distribution. In China, CBM resources at depths exceeding 1500 m are estimated to reach approximately 40.47 × 10¹² m3 [2]. As shallow CBM reservoirs have gradually entered the middle to late stages of development, DCBM has become a key replacement target for future reserve growth and production. In particular, basins such as the Ordos Basin and the Qinshui Basin contain a substantial proportion of deep CBM resources and exhibit significant development potential [3]. Compared with shallow coal seams, deep coal reservoirs are characterized by greater burial depth, higher in situ stress, and generally low porosity and permeability [4,5,6]. Under deep burial conditions, the pore–fracture structure, cleat development, and connectivity of the matrix–fracture system in coal undergo pronounced evolution [7,8], resulting in a transition of CBM occurrence from predominantly adsorbed gas to the coexistence of adsorbed and free gas [9]. The target coal seam in this study is the Carboniferous Benxi Formation No. 8 coal seam, located within the deep coal measure reservoirs of the Ordos Basin. It is a regionally stable and continuous seam. The coal thickness generally ranges from 8 to 10 m in specific blocks like Daji, with composite thicknesses of up to 8.7–13.5 m reported in other areas such as Fugu. The burial depth typically exceeds 1800 m, classifying it as a deep reservoir. The immediate roof is predominantly composed of limestone, providing a favorable sealing condition. The primary hydrocarbon generation period occurred during the Early Cretaceous. The tectonic setting is characterized by the “depositional unification and structural divergence” pattern, where basin-wide coal-forming processes were followed by differential tectonic uplift, creating heterogeneous zones of deep/shallow burial and preservation that critically control gas enrichment.
Coal seams, being complex and heterogeneous, play a crucial role in determining the productivity of CBM reservoirs. Properties such as cleat orientation, porosity, and permeability affect the ease with which methane can be extracted. Furthermore, coal’s natural fracture systems significantly influence gas flow pathways and fracture propagation during hydraulic fracturing. In regions with similar geological characteristics, the understanding of these properties has led to improved production strategies and more efficient extraction methods. Hydraulic fracturing is the primary technology for enhancing coal seam permeability and improving CBM productivity. Its effectiveness largely depends on the generation of a complex and conductive fracture network. Accordingly, detailed investigations into fracture initiation, propagation, and fracture network development in coal reservoirs form the foundation for hydraulic fracturing design and the evaluation of stimulation performance.
From an experimental perspective, true triaxial hydraulic fracturing experiments provide direct insight into fracture propagation mechanisms in coal. Experimental results show that fractures preferentially propagate along pre-existing weak planes under varying stress conditions, forming fracture networks composed of a main fracture and multiple branches. Fracture propagation behavior is strongly controlled by the orientation of the maximum principal stress, injection rate, and fracturing fluid viscosity [10,11]. In addition, coal fines and fine-grained materials within the coal matrix have been shown to impede fracture propagation paths and influence fracture network development [12,13]. Experimental observations further indicate that fracture propagation in coal reservoirs is highly dependent on the geometric characteristics and spatial distribution of cleats [14]. Although experimental studies have provided valuable insights, considerable uncertainty remains due to the inherent complexity of coal reservoirs.
Numerical simulation has become an indispensable tool for investigating fracture propagation during hydraulic fracturing. A variety of modeling approaches have been developed for this purpose. The finite element method (FEM) is widely used to calculate stress fields and fracture propagation paths, but it has limited capability in capturing complex fracture branching and interconnected networks [15]. The boundary element method (BEM) is advantageous for simulating fracture growth and fracture–rock interactions, particularly in evaluating boundary condition effects [16]. Cohesive zone model (CZM)– and extended finite element method (XFEM)–based approaches have been extensively applied to coal–rock composites and multilayered systems to simulate fracture initiation and propagation while incorporating elastoplastic damage and interfacial behavior [17,18]. Phase-field methods can effectively capture complex fracture trajectories and crack-tip evolution, showing strong performance in simulating interactions between hydraulic fractures and natural cleats [19]. The discrete element method (DEM) explicitly represents natural fracture networks and dominant fracture mechanisms [20], although it is computationally intensive when coupling fluid flow with large-scale fracture systems. Hybrid methods such as the finite–discrete element method (FDEM), along with independent fracture mesh techniques and dual-porosity flow models, have also been proposed to address coal heterogeneity and improve simulation accuracy [21,22]. Overall, both experimental and numerical studies indicate that fracture propagation in coal reservoirs is jointly controlled by geological factors, such as in situ stress and cleat distribution, and operational parameters, including fracturing fluid viscosity and injection rate [23].
Despite significant progress, most existing studies focus on shallow coal reservoirs at depths less than 1500 m, and their applicability to deep coal conditions remains uncertain [24]. Increasing burial depth substantially alters the in situ stress environment, mechanical response, and failure modes of coal, limiting the reliability of fracture propagation models developed for shallow reservoirs [25,26,27,28]. At present, fracture initiation mechanisms, propagation patterns, and dominant controlling factors in deep coal remain insufficiently understood, and the evolution of fracture networks under deep burial conditions is still poorly constrained.
In this study, geological, petrophysical, and geomechanical models were established based on the characteristics of deep CBM reservoirs in the Ordos Basin, Changqing Oilfield. Two representative reservoir types were classified according to the spatial distributions of petrophysical properties and geomechanical parameters. A numerical hydraulic fracture propagation model was then developed to investigate the dominant controlling factors of fracture growth in the two reservoir types and to optimize hydraulic fracturing treatment design. The results provide a reliable scientific basis for hydraulic fracturing stimulation of deep coalbed methane reservoirs in the Changqing Oilfield.

2. Numerical Model Development

The eastern part of the Ordos Basin contains abundant deep coalbed methane geological resources. Since exploration and development efforts were intensified in 2023, significant progress has been achieved in drilling and hydraulic fracturing. However, due to the limited understanding of fracture propagation behavior, a systematic and optimized hydraulic fracturing design has not yet been established, resulting in substantial variability in stimulation performance among different wells [29,30,31].
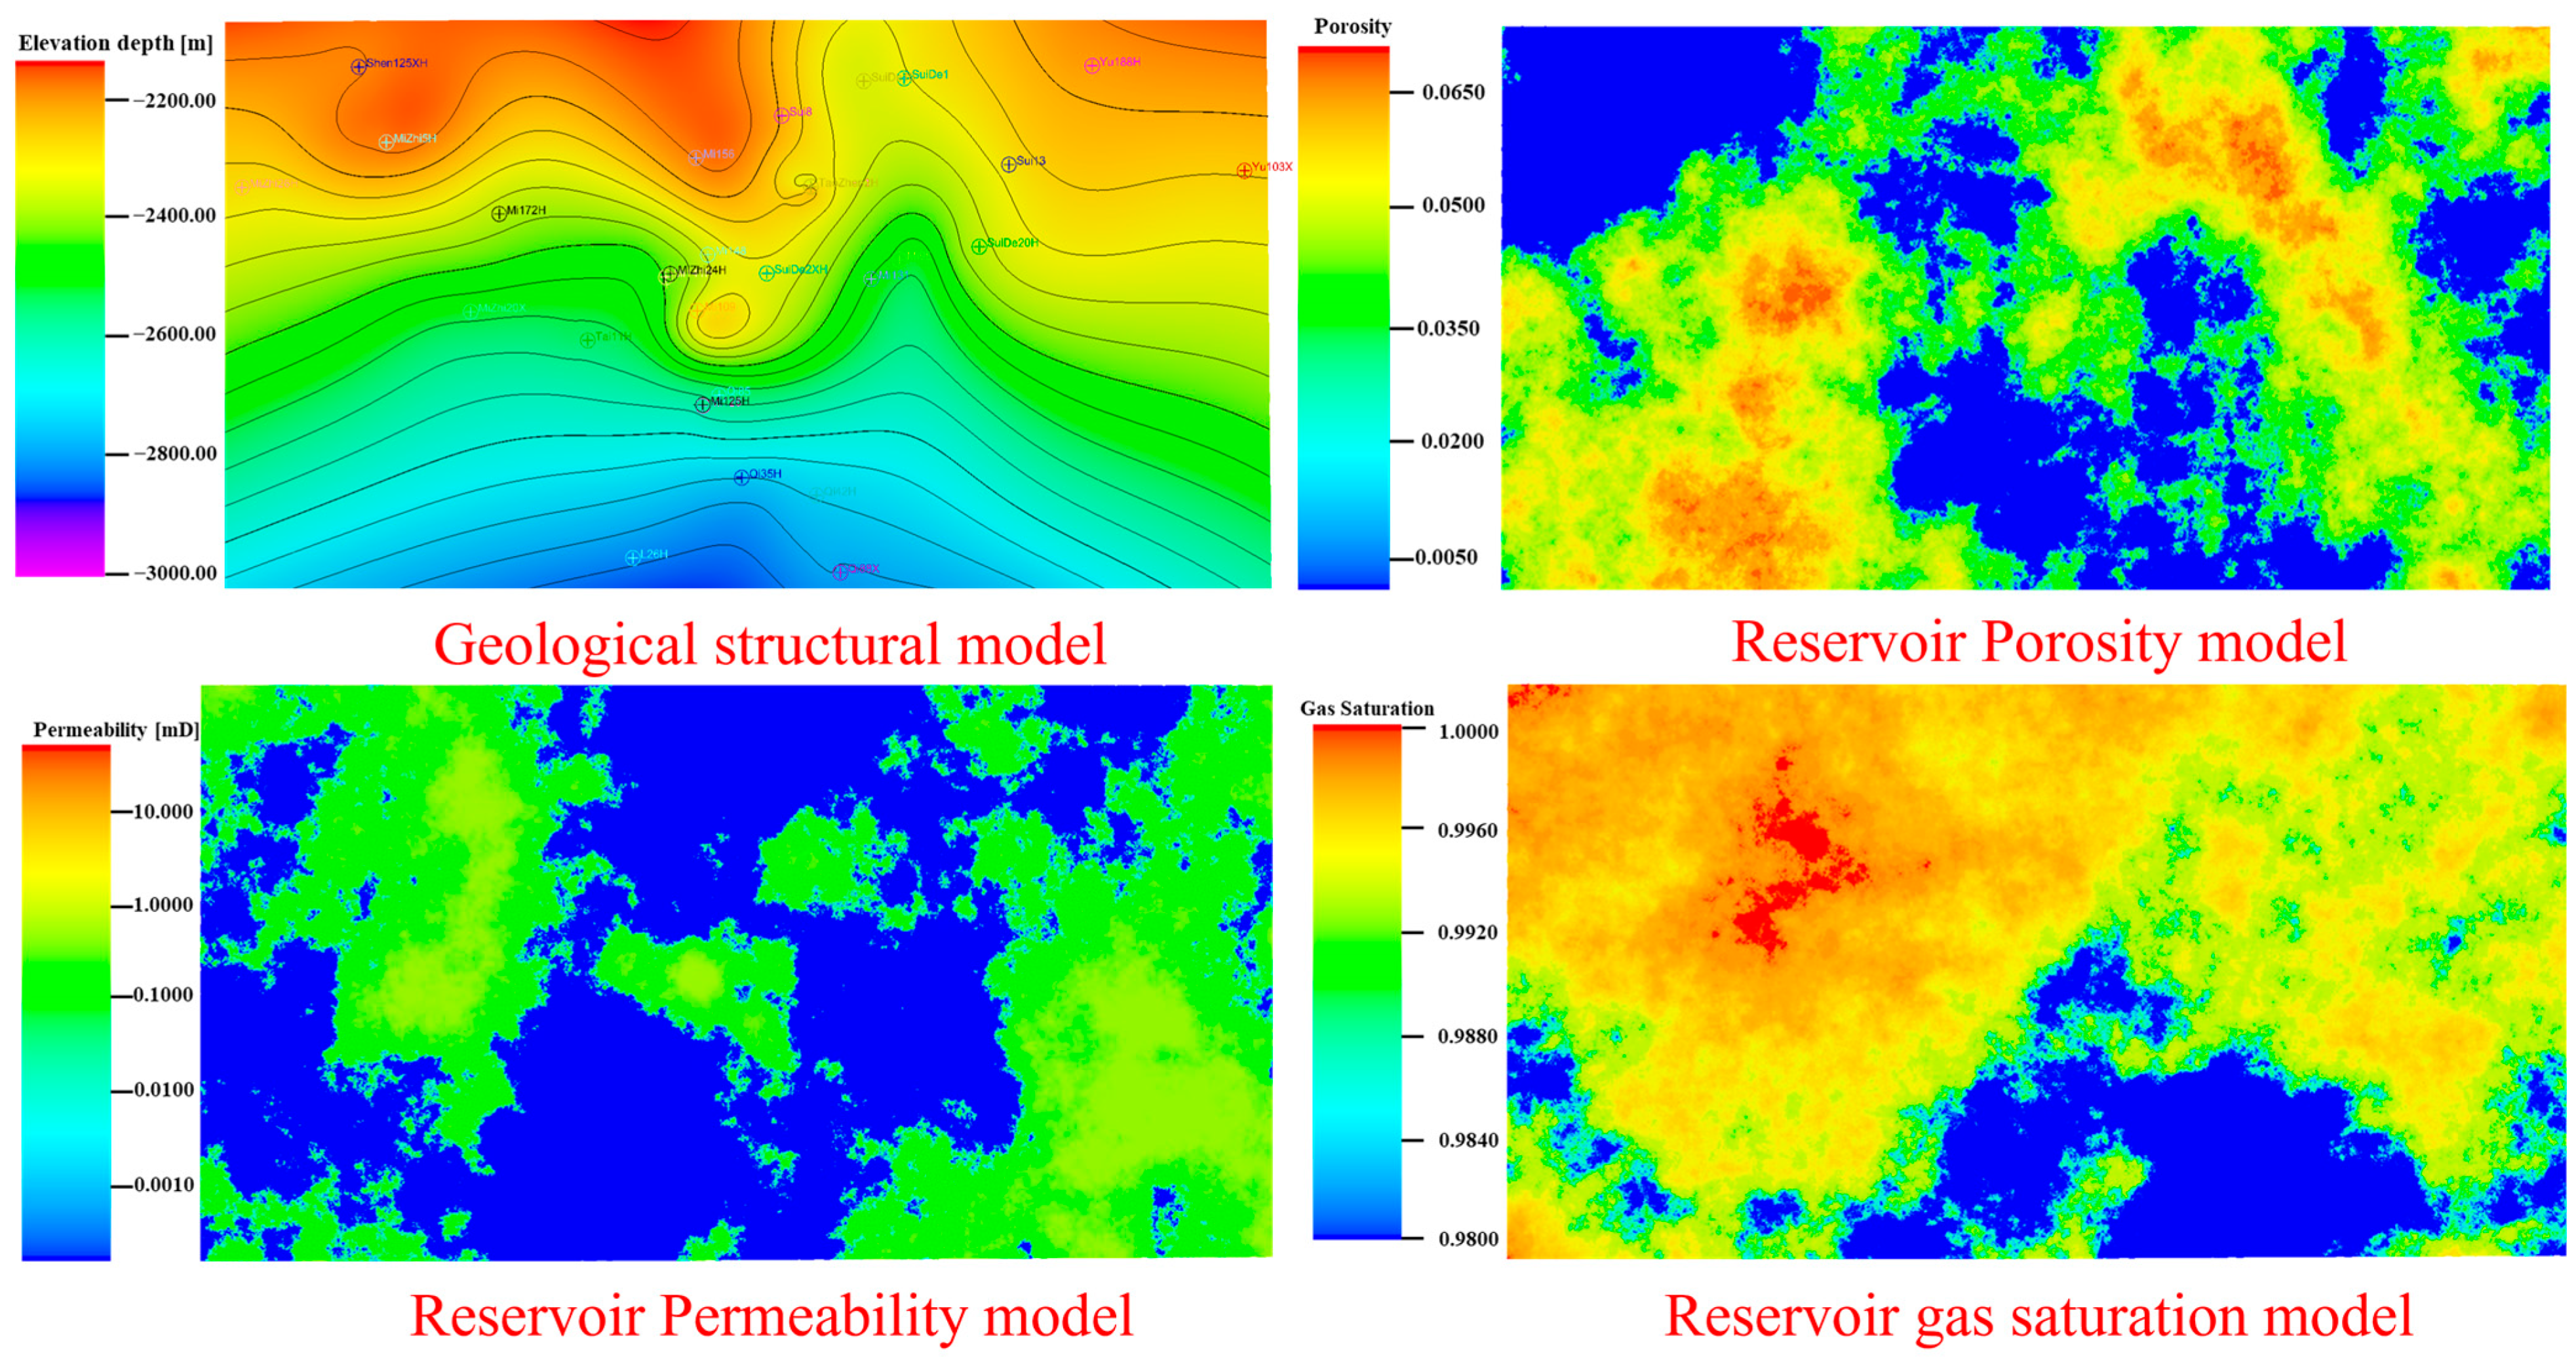
In this study, stratigraphic data and well logging data from 31 wells in the study area were collected. Using Petrel software(Version 2022), a structural model and a property model of the study area were first constructed, as shown in Figure 1. The modeling workflow consisted of the following steps: (1) establishing a well framework model in Petrel based on well location coordinates and stratigraphic data; (2) constructing the structural framework of the major stratigraphic horizons through stratigraphic correlation; (3) performing spatial interpolation of stratigraphic surfaces to complete the structural model; (4) generating a three-dimensional grid based on the structural model and conducting grid quality control; (5) establishing petrophysical property databases for each stratigraphic interval using well log interpretation results; and (6) applying geostatistical methods to perform spatial modeling of reservoir parameters. In this study, Ordinary Kriging, a geostatistical method, was used for spatial modeling of reservoir parameters. This method estimates the values of petrophysical parameters, such as porosity, permeability, and gas saturation, at unsampled locations by considering the spatial correlation between known data points. A variogram was first constructed to model the spatial variability of these parameters, and then Kriging interpolation was applied to generate continuous distribution maps across the study area. This approach ensures an accurate representation of the spatial heterogeneity of the reservoir.
As shown in Figure 1, the coal seams in the study area typically have low porosity and permeability. The porosity distribution model shows that the porosity of most coal seam sections is below 6%, with the deep blue areas having porosity even lower than 0.5%. The permeability distribution model indicates that the reservoir permeability is mostly below 0.001 mD, with the green areas having relatively higher permeability around 0.1 mD. However, there is little formation water content in the pore space, and the free gas content typically exceeds 95%, indicating a good development potential for the area. In the gas saturation model, the deep red area represents the core sweet spot, where the gas content is high, and both porosity and permeability are also relatively large.
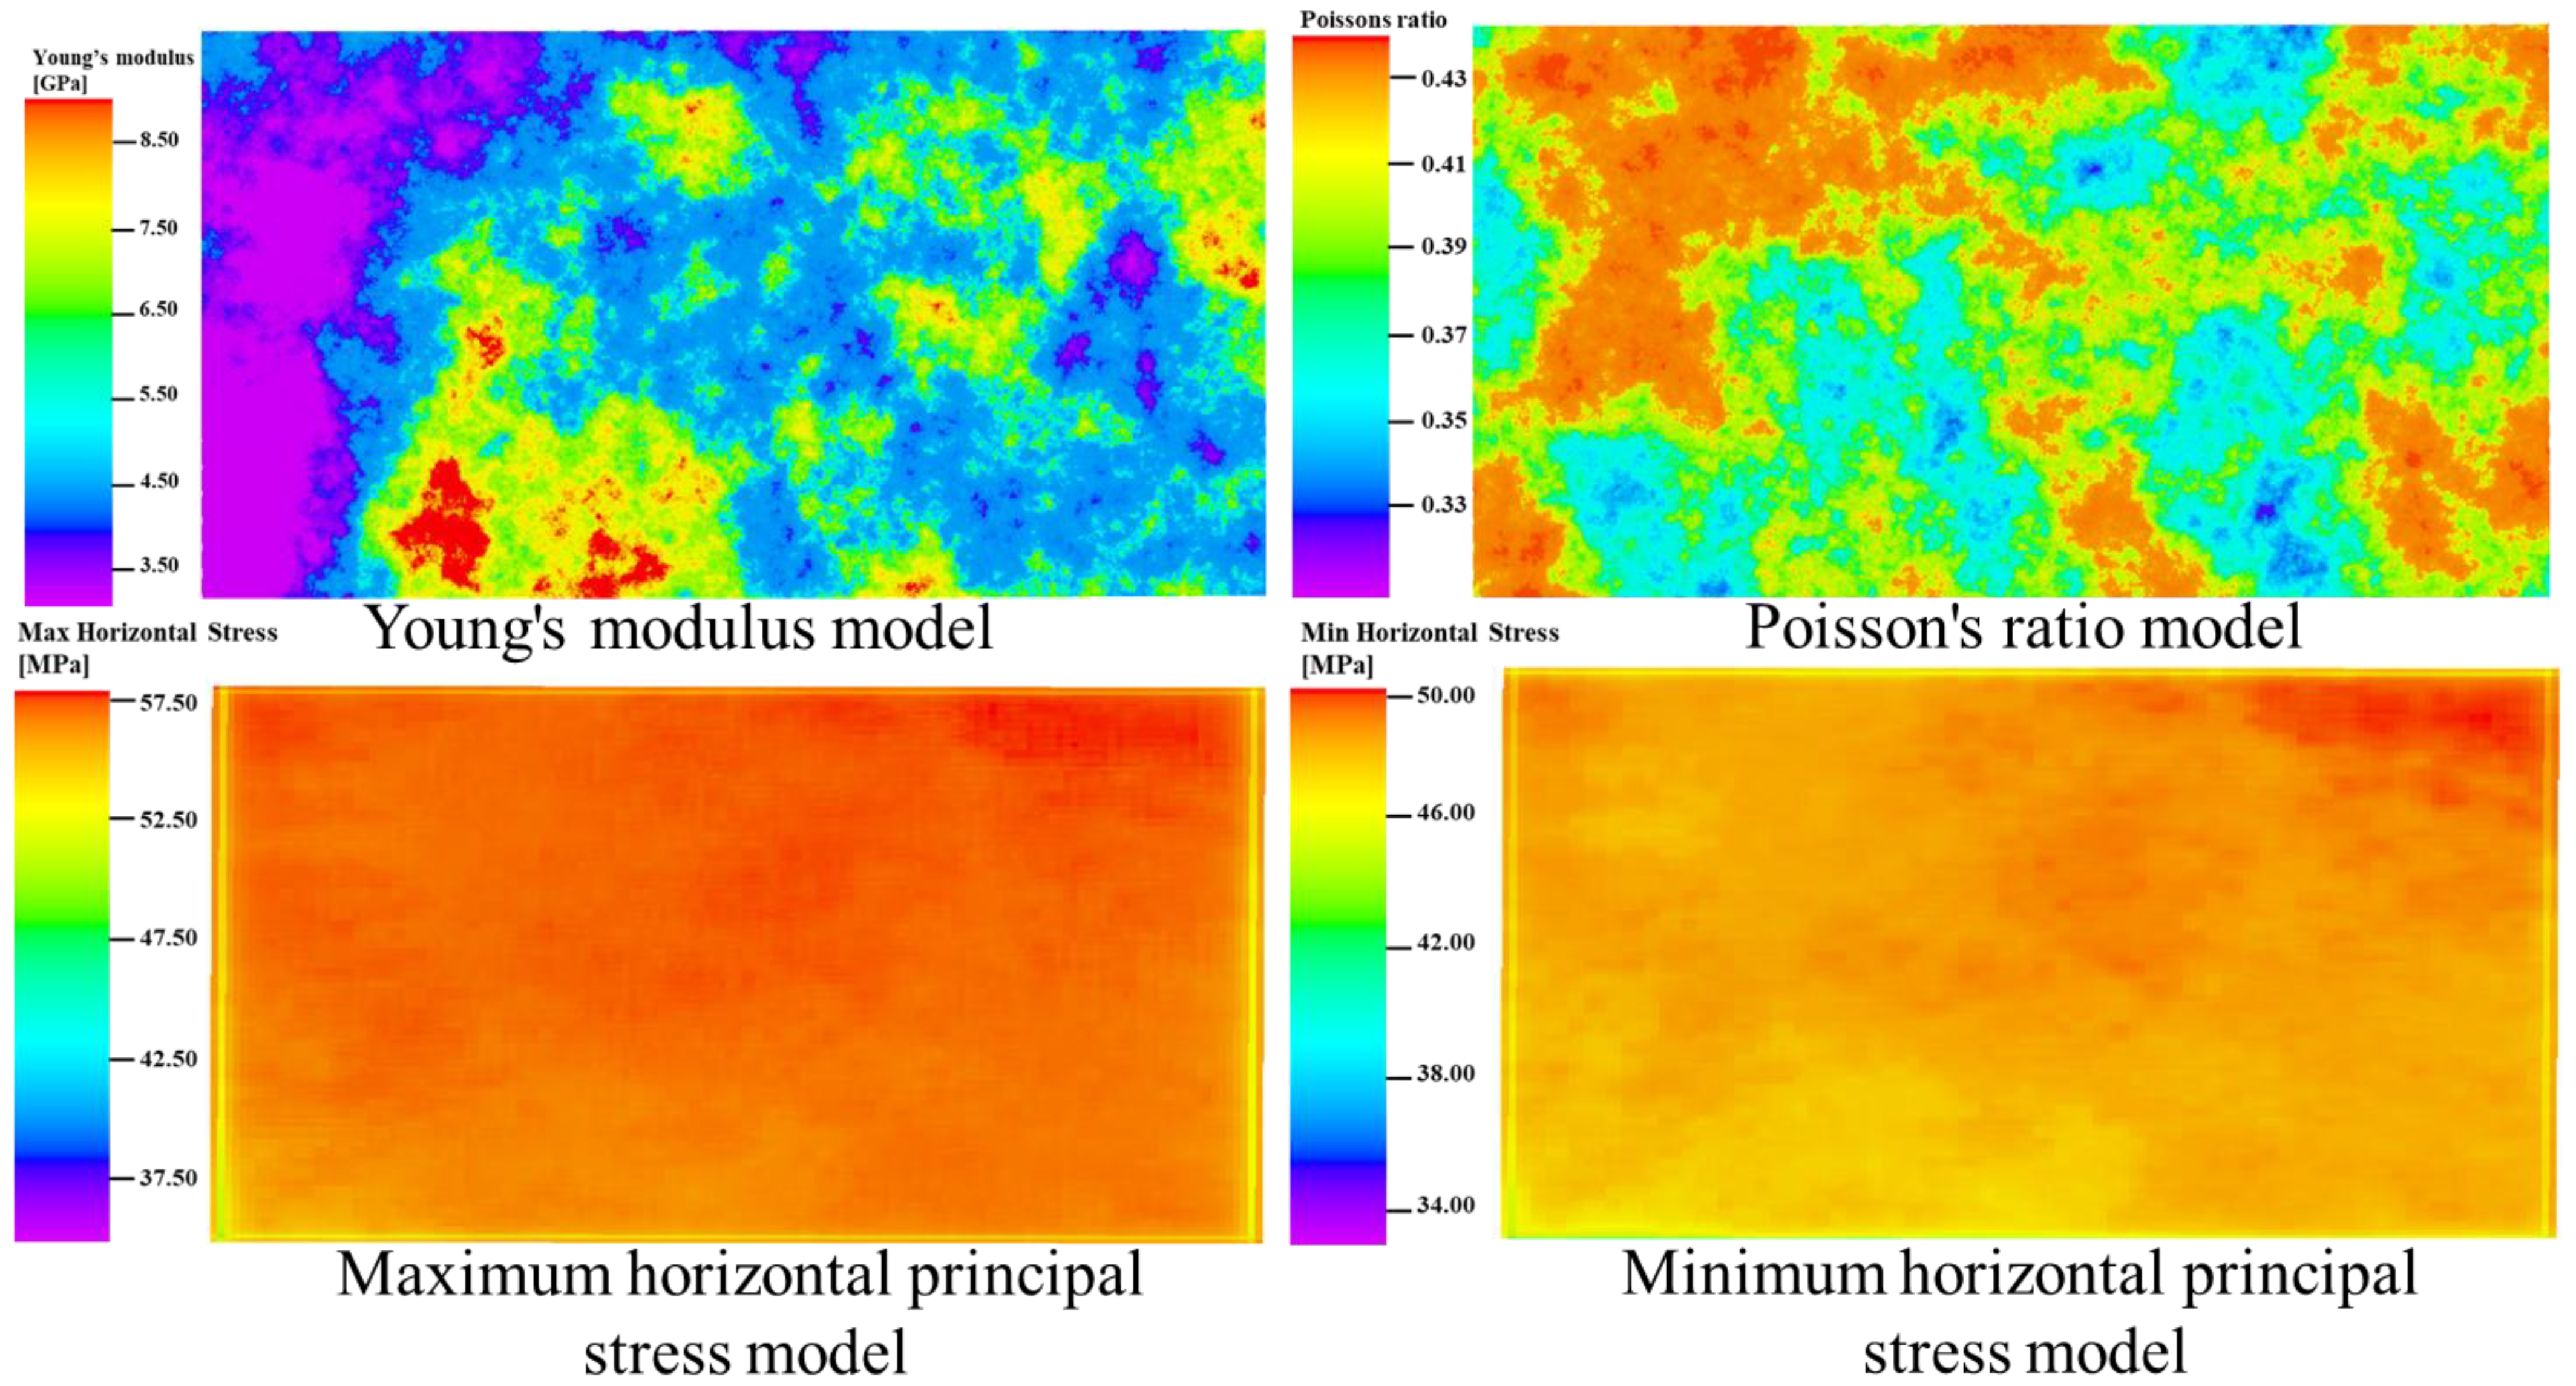
Based on the property model, geomechanical parameters were interpreted using well logging data, and a three-dimensional geomechanical model was established, as shown in Figure 2 (Distribution fields of different attribute parameters—Top view of the middle section of the coal seam). In this study, the Visage module of Petrel software was used to calculate the in situ stress field rather than developing a full 3D geomechanical model. The model assumes isotropic and homogeneous geological formations, with boundary conditions based on regional stress measurements and uniform horizontal stress distribution at the model boundaries. A linear elastic constitutive model was applied to simulate stress–strain relationships, with typical properties for coal seams and surrounding strata considered. The modeling workflow included the following steps: (1) inversion of dynamic elastic parameters of the formations based on log interpretation methods; (2) conversion of dynamic elastic parameters to static mechanical parameters; (3) calculation of Young’s modulus and Poisson’s ratio for each stratigraphic interval, followed by in situ stress estimation for individual wells; (4) construction of three-dimensional distribution models of Young’s modulus and Poisson’s ratio based on the geological model; (5) development of the in situ stress model of the study area using the Visage module; and (6) calibration of model parameters using available rock mechanics experimental data and in situ stress interpretation results from individual wells.
As shown in Figure 2, the coal seams in the study area are characterized by low Young’s modulus and generally high Poisson’s ratio, indicating strong plastic deformation characteristics. The Young’s modulus model shows that the Young’s modulus is mostly below 8 GPa, with most values concentrated around 5 GPa, indicating that the overall rock hardness is relatively low. The Poisson’s ratio model shows that the Poisson’s ratio is mostly above 0.3, suggesting that the rock has a strong overall deformation capacity. The maximum horizontal principal stress in the formation is mostly above 52.50 MPa, while the minimum horizontal principal stress is mostly below 50 MPa, indicating a relatively uniform stress distribution. The spatial variation in the in situ stress field is small, and the difference between the two horizontal principal stresses is relatively small, which is favorable for forming a complex fracture network during hydraulic fracturing.
Based on the structural and property models (Figure 1) and the geomechanical model (Figure 2), the distribution ranges of geological and geomechanical parameters in the eastern Ordos Basin were statistically analyzed. According to the statistical results of the model, the reservoirs were classified into two types, and two representative wells were selected based on the classification criteria. Type I reservoirs are characterized by a Young’s modulus of 5–9 GPa, a Poisson’s ratio of 0.40–0.48, porosity ranging from 3% to 7.5%, permeability of 0.1–10 mD, and gas saturation exceeding 98%. Well M24 was selected as the representative well for this reservoir type. Type II reservoirs exhibit a lower Young’s modulus of 3–5 GPa, a Poisson’s ratio of 0.30–0.40, extremely low porosity (0.01–3%), permeability of 0.001–0.1 mD, and gas saturation generally higher than 95%, with Well M125 chosen as the representative well. Compared with Type II reservoirs, Type I reservoirs show stronger rock plasticity and better reservoir permeability. The classification is based on the statistical analysis of well log data and rock mechanics experimental results from 31 wells in the study area. These parameters were clearly defined and consistently applied to ensure the reproducibility of the classification method.
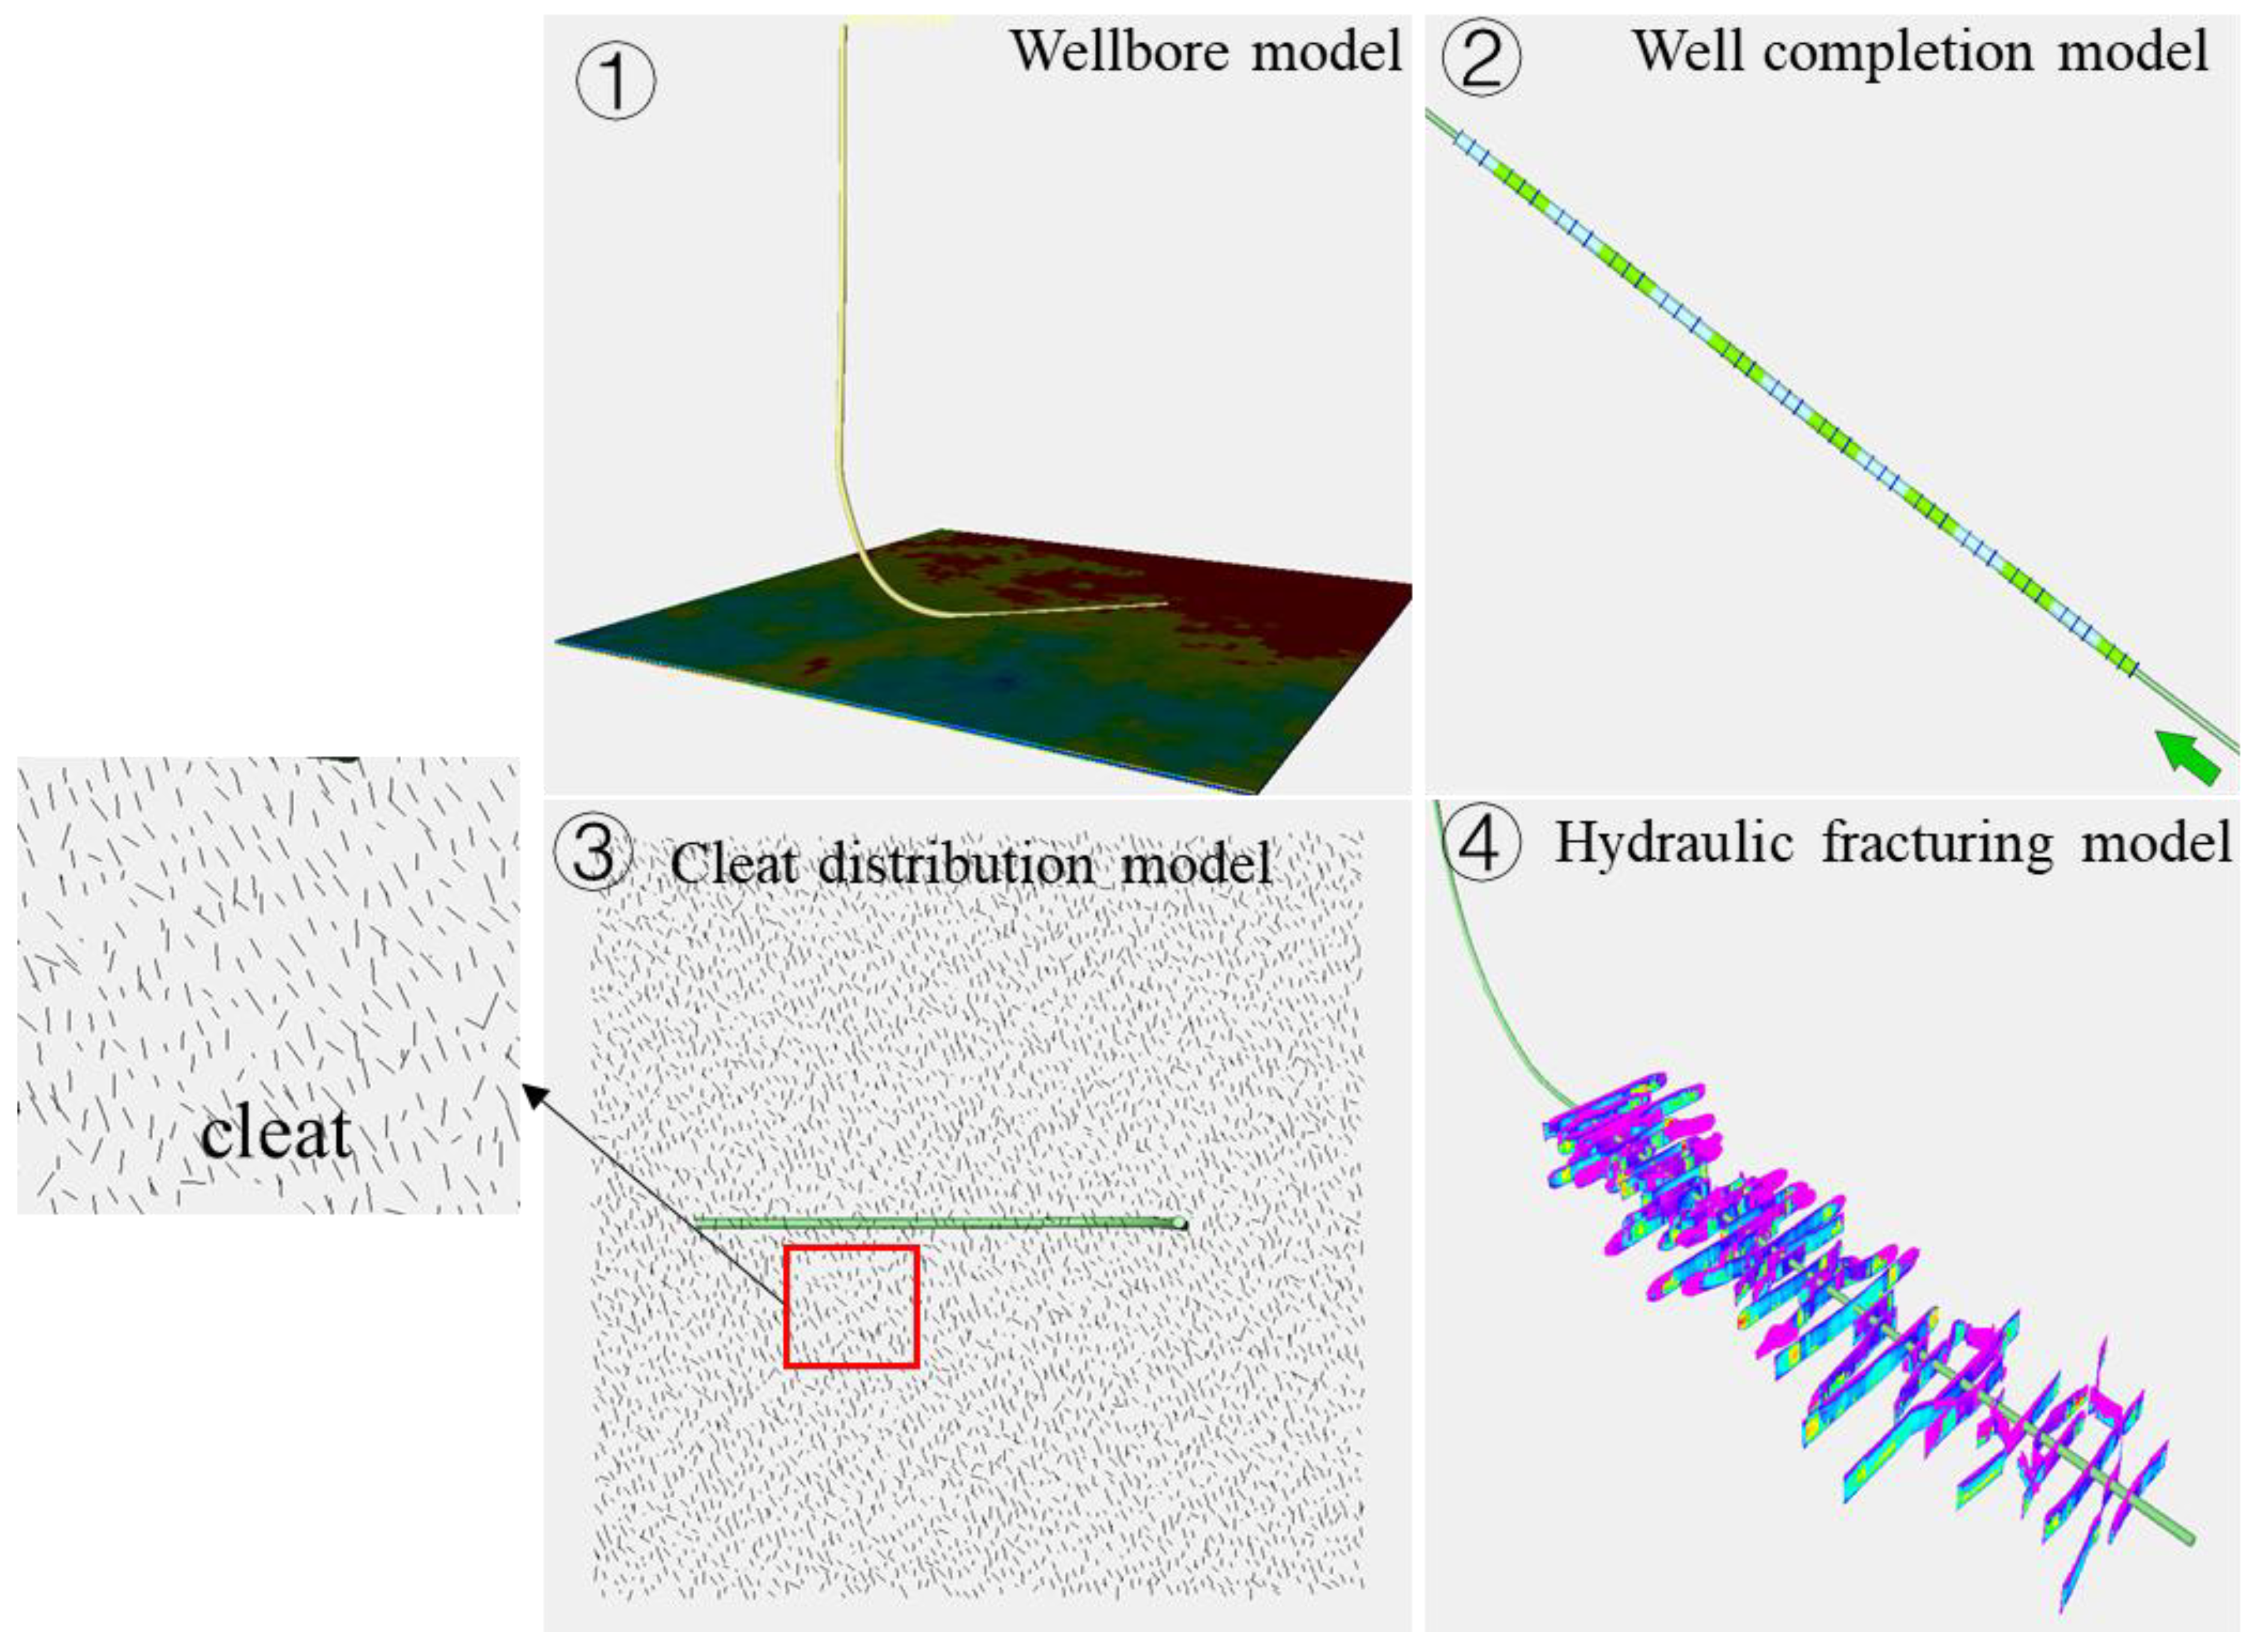
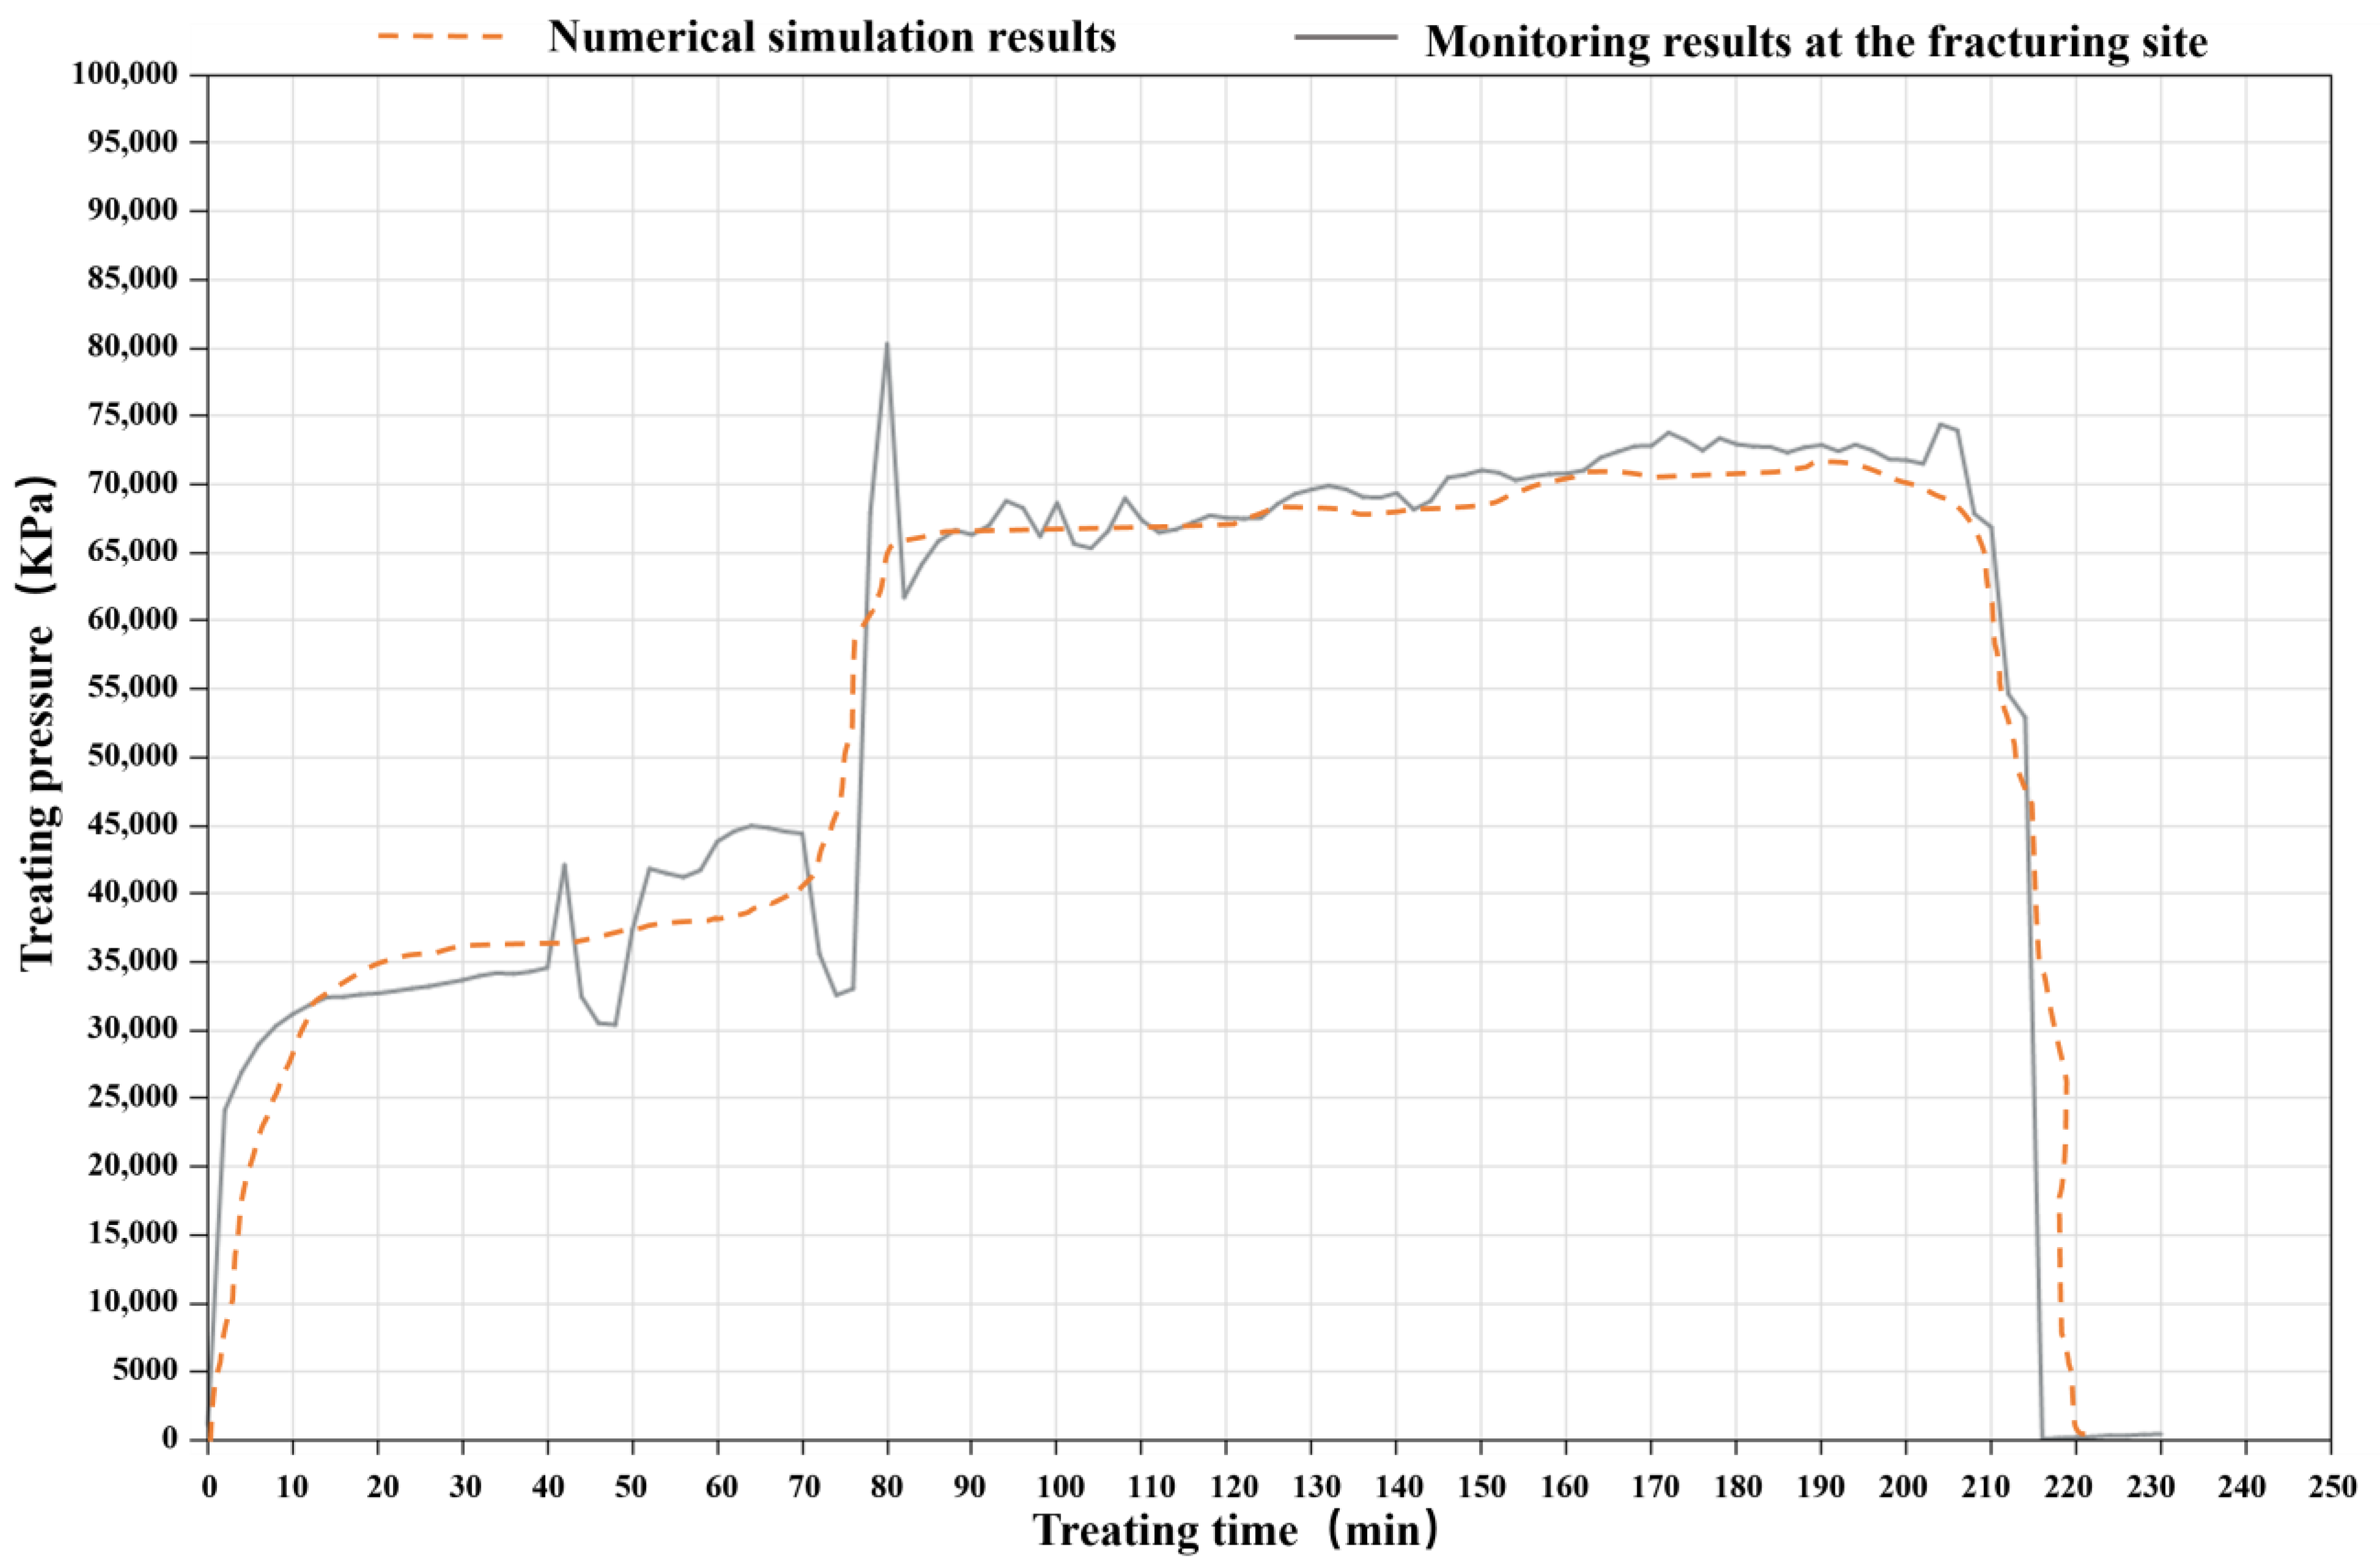
Using the two representative wells, a numerical hydraulic fracture propagation model was developed in the Kinetix module of Petrel. The fracture propagation simulations were conducted based on field pumping schedules, and the model was calibrated using monitored hydraulic fracturing treatment curves to ensure the reliability of subsequent analyses of fracture propagation behavior. Taking Well M24 as an example, the workflow of the hydraulic fracture propagation model is illustrated in Figure 3. The main procedures (Figure 3) include: (1) establishing a wellbore model based on target well data, defining tubing and casing parameters, and selecting a perforated completion scheme; (2) assigning cleat length, orientation, and spacing in the model according to drilling core observations; (3) implementing the field pumping schedule into the fracturing simulation; and (4) performing hydraulic fracture propagation simulations and calibrating the model using field-monitored fracturing curves. Figure 4 presents the fitting results of the hydraulic fracturing treatment curves for Well M24. The overall discrepancy between the simulated and field-measured wellhead pressure curves is within 5%, with a correlation coefficient (r) of 0.98, indicating that the proposed numerical model can reliably simulate hydraulic fracture propagation in the study area.

3. Numerical Simulation Results

3.1. Fracture Propagation Behavior in Type I Reservoirs

In Section 2, a fracture propagation model capable of accurately simulating hydraulic fracture geometry was established for Well M24, the representative well of the Type I reservoir. Based on this model, 16 simulation cases were designed, as listed in Table 1, to investigate the influence mechanisms of four key parameters—Section–cluster Ratio, injected fluid volume, proppant concentration, and injection rate—on hydraulic fracture propagation behavior in Type I reservoirs. Among these cases, Case 1 corresponds to the original field pumping parameters applied in Well M24. In this study, the Section–cluster Ratio is defined as the ratio of stage spacing to cluster spacing. The four values used in these figures—Section–cluster ratios, injected fluid volumes, proppant concentrations, and injection rates—are representative of the commonly used operational parameters in the Changqing Oilfield. These values were selected to reflect the typical practices in field fracturing operations and are not arbitrarily chosen. By comparing the impact of these parameters, the goal is to identify optimal fracturing treatments for both Type I and Type II reservoirs.
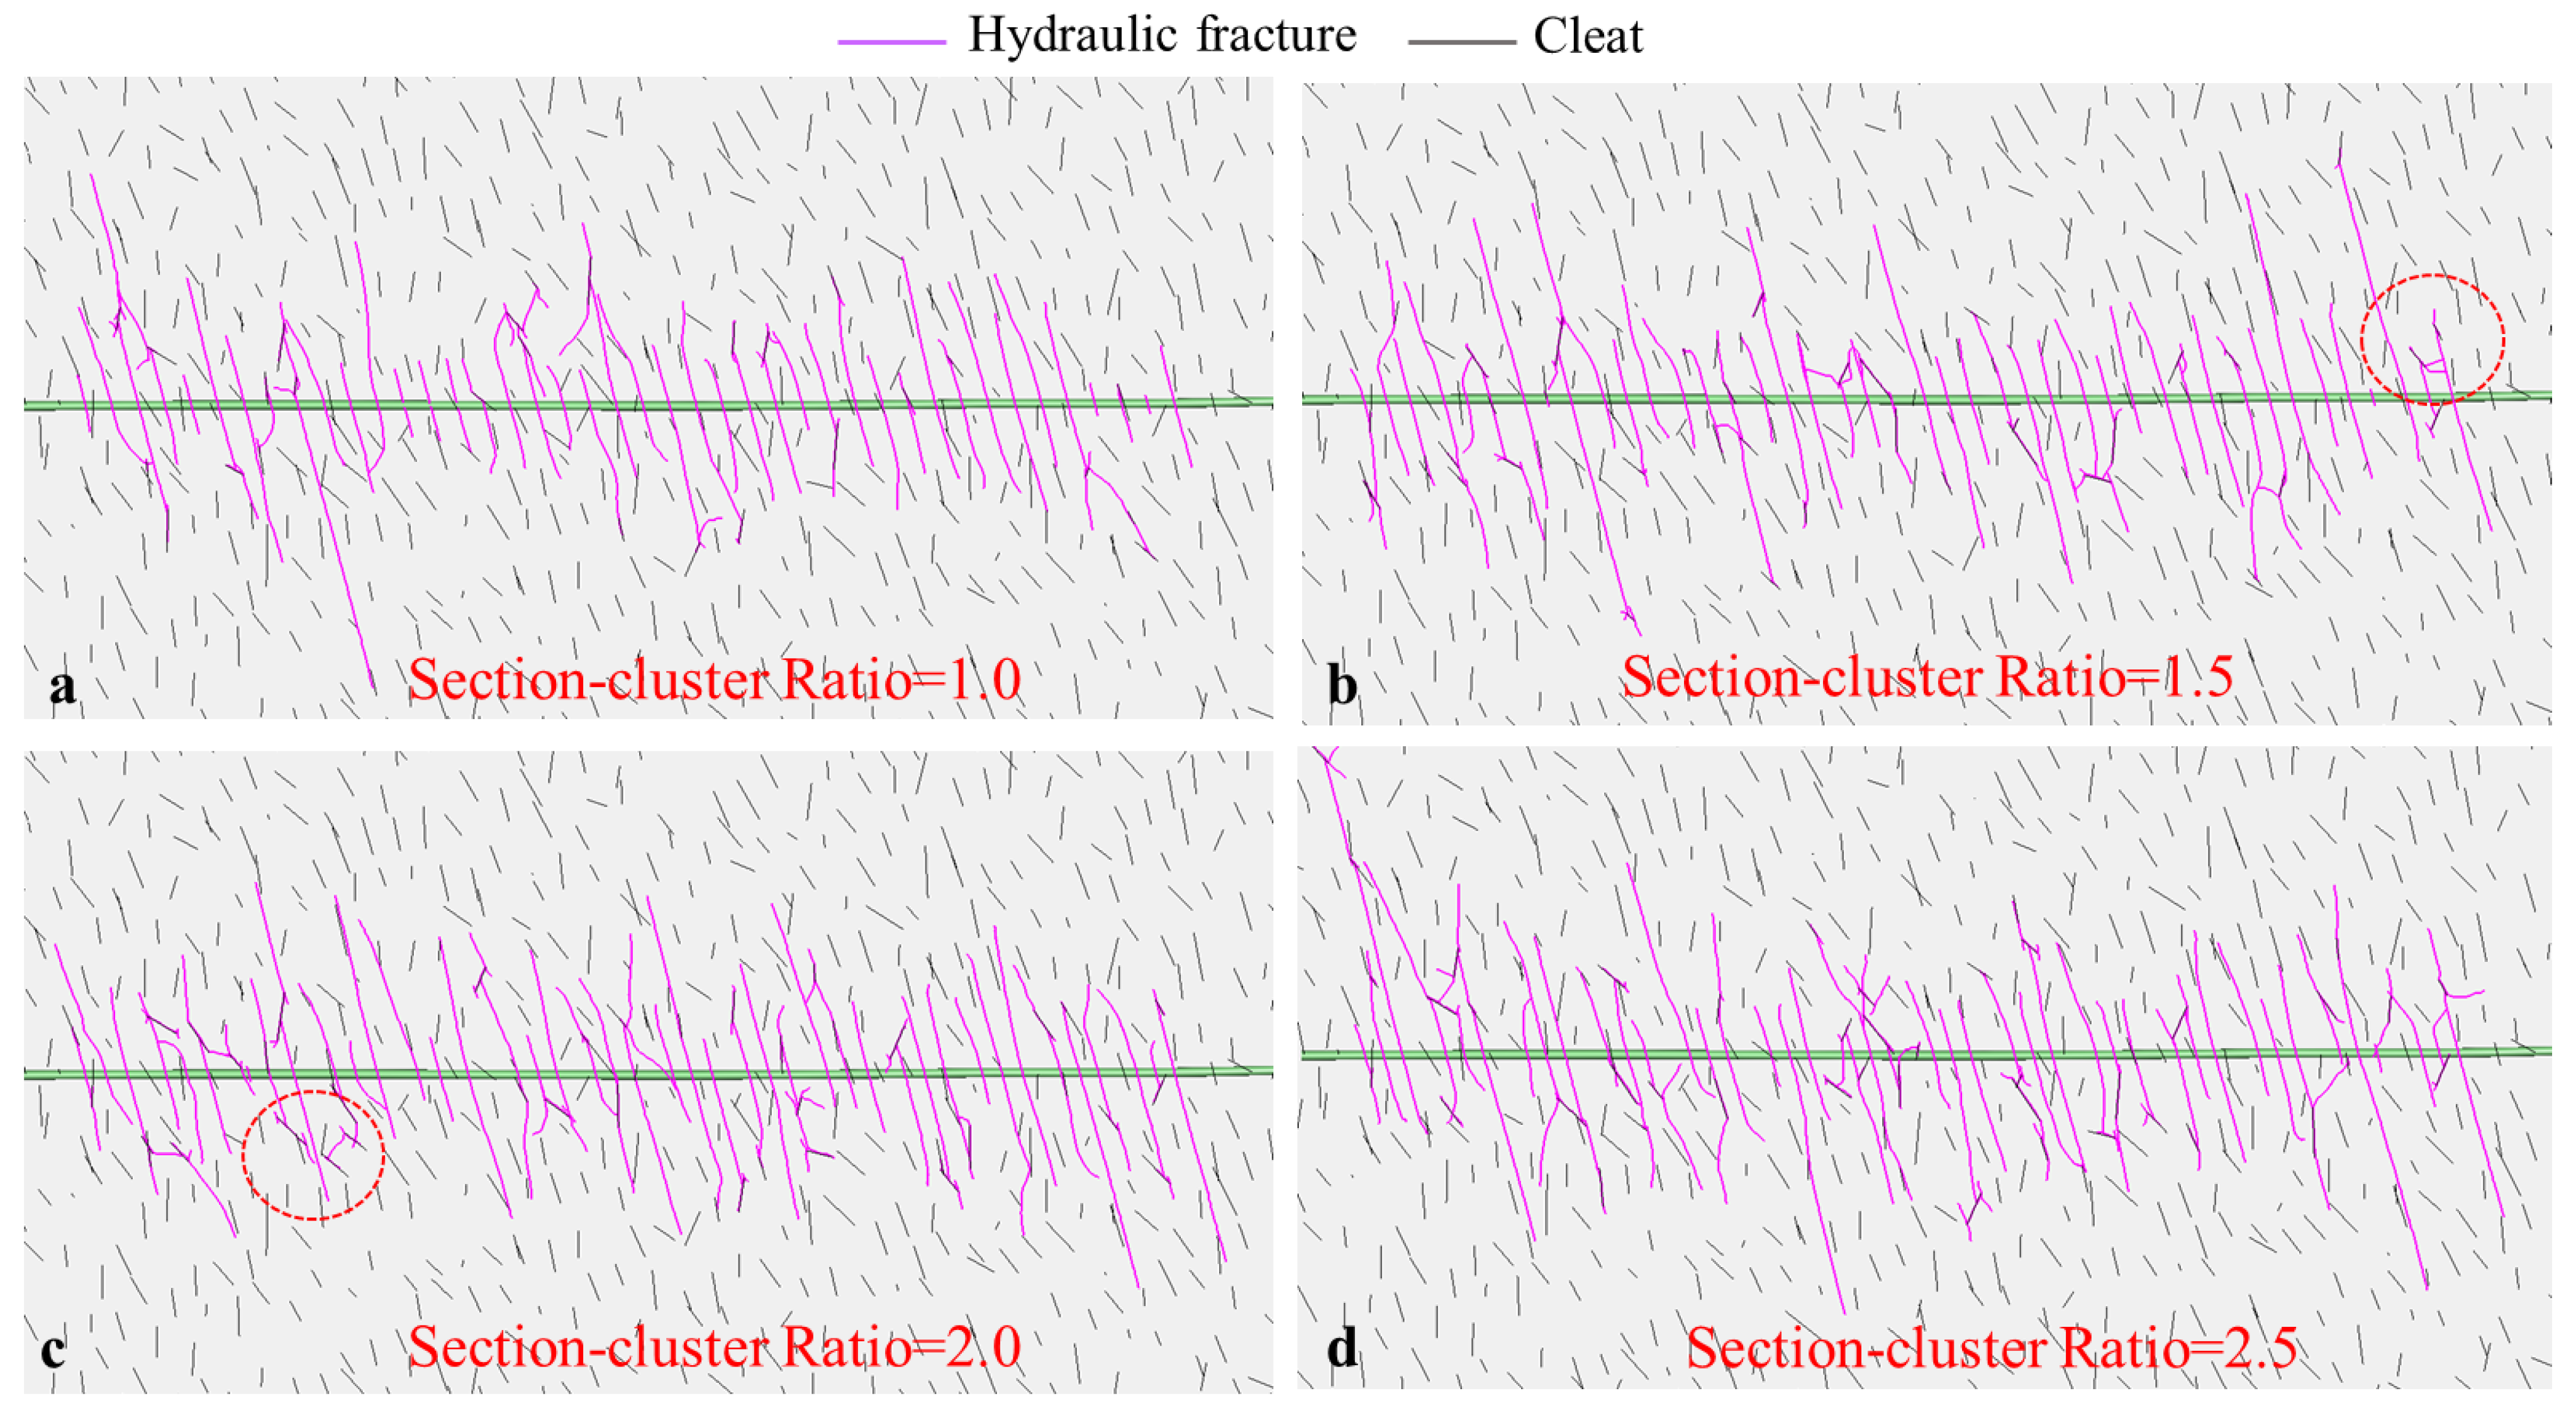
Figure 5 illustrates the effect of different Section–cluster Ratios on fracture propagation behavior. The ratios are chosen to highlight the influence of cluster spacing within each fracturing stage on fracture competition. As shown in Figure 5, after hydraulic fractures initiate from the perforations, they propagate predominantly in the direction perpendicular to the minimum horizontal principal stress. During fracture propagation, hydraulic fractures interact with natural cleats, leading to the activation of different types of cleat systems. When hydraulic fractures encounter cleats, three typical propagation modes can be observed (as indicated by the red circles in Figure 5): (1) the hydraulic fracture directly crosses the cleat; (2) the hydraulic fracture is arrested by the cleat and subsequently deflects toward the cleat tip before continuing its propagation; and (3) the hydraulic fracture is attracted to and captured by the cleat. With an increase in the Section–cluster Ratio, the cluster spacing within each fracturing stage decreases, resulting in intensified competitive fracture propagation. As indicated in Table 1, the overall average fracture length increases progressively with increasing Section–cluster Ratio. As fracture competition becomes stronger, the induced stress field enhances the interaction between hydraulic fractures and cleats, leading to a significant increase in fracture network complexity in the near-wellbore region.
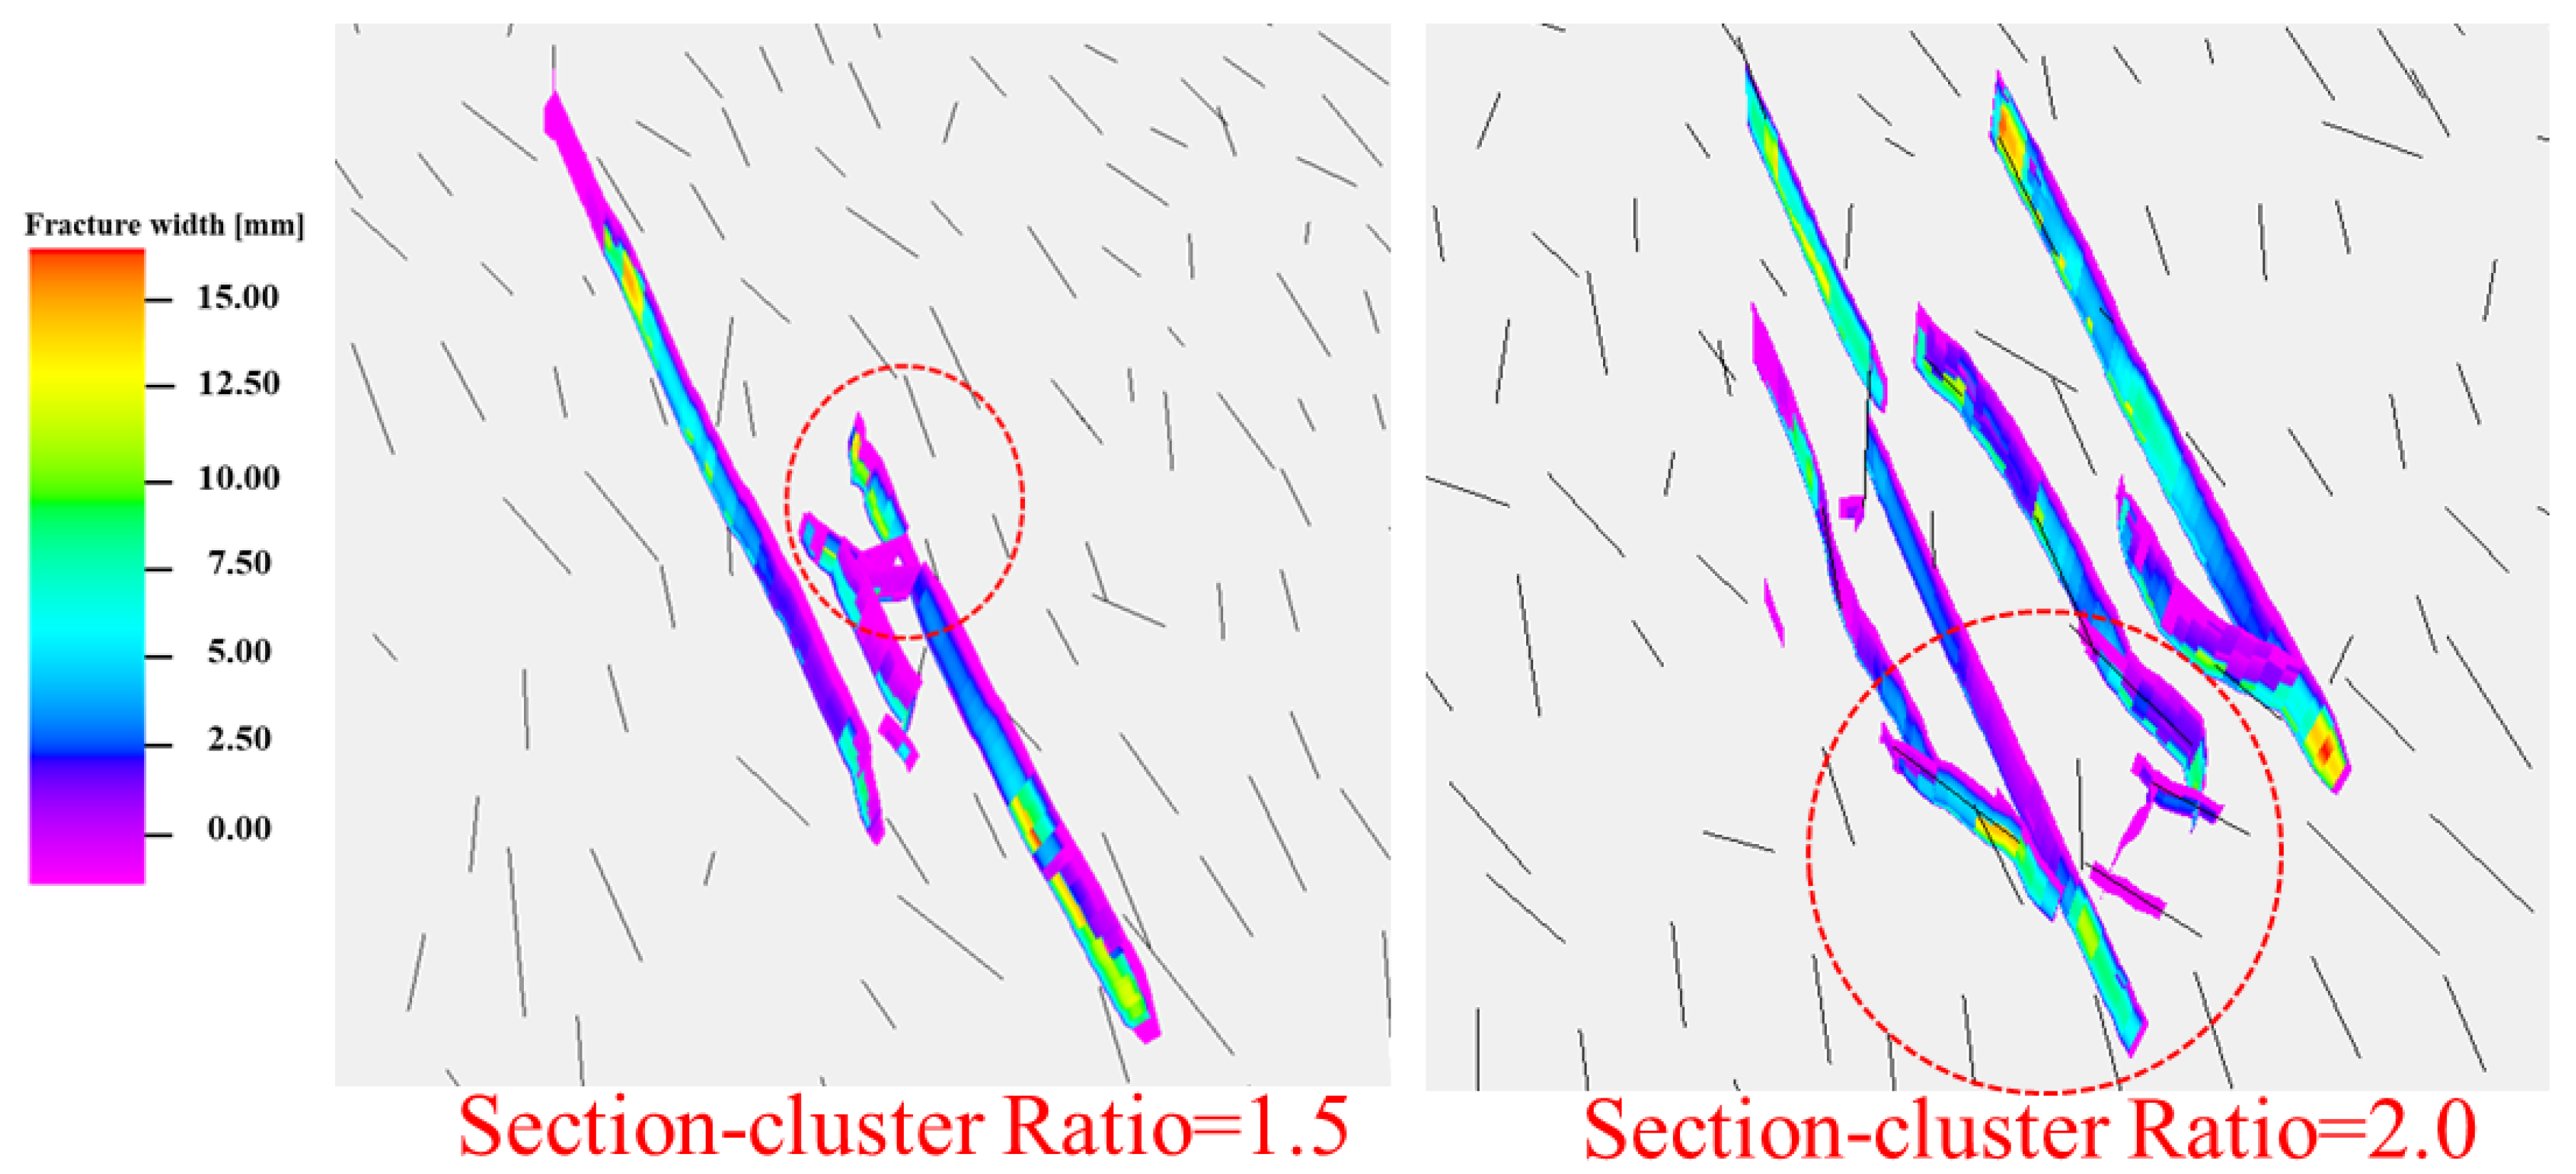
Figure 6 illustrates the fracture width distributions corresponding to the red-circled regions in Figure 5. The results indicate pronounced differences in fracture width between primary hydraulic fractures and secondary branch fractures. Although hydraulic fractures may locally connect with cleats, the connected segments generally exhibit relatively small fracture widths due to tortuous fracture geometries that hinder proppant transport. Some cleats are activated by the induced stress field and undergo shear slip; however, when they are not hydraulically connected to the main fracture, fracturing fluid fails to enter these cleats, resulting in extremely limited final fracture widths, as observed in the case with a Section–cluster Ratio of 2.0. Overall, for deep coalbed methane reservoirs, large injected fluid volume is required to effectively connect cleats and generate complex fracture networks. In addition, selecting proppants with finer mesh sizes (i.e., higher mesh number) may be beneficial for effectively propping highly tortuous branch fractures.
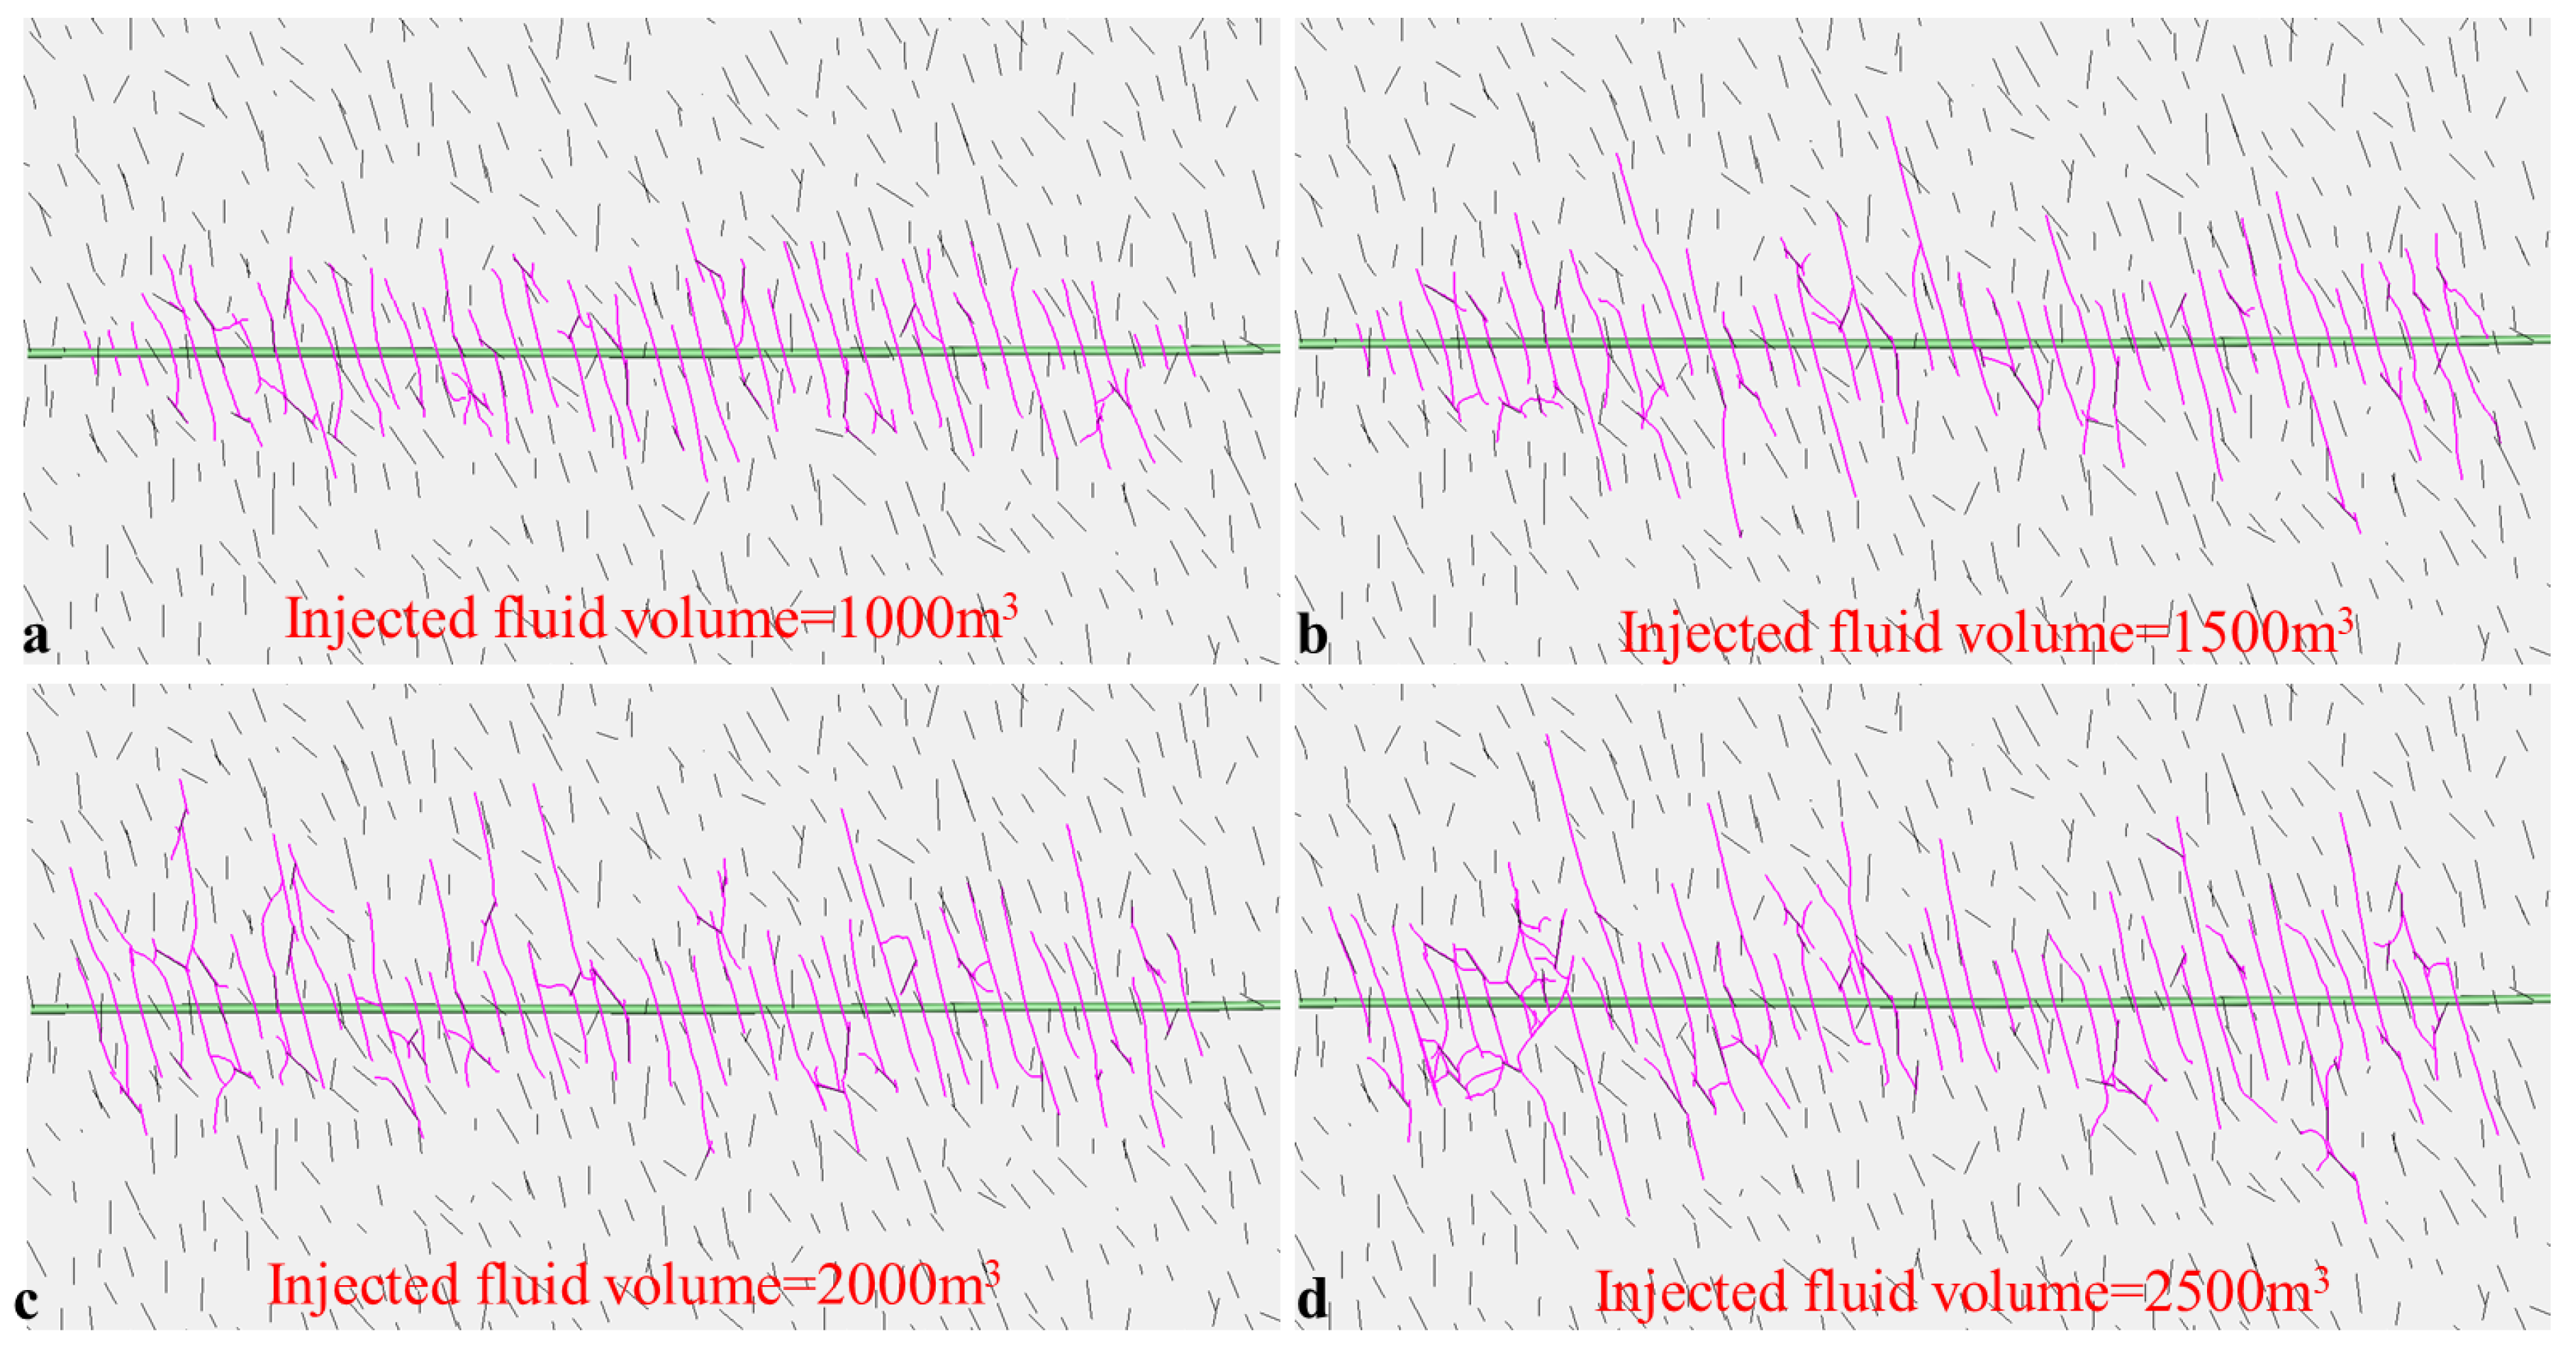
Figure 7 presents the hydraulic fracture propagation patterns under different injected fluid volumes in Type I reservoirs. Combined with Figure 7 and Table 1, it can be observed that increasing injected fluid volume leads to a significant increase in the average fracture length. Fracturing with a large injected fluid volume is conducive to the development of complex fracture networks around the wellbore. An increase in injected fluid volume substantially enhances the total stimulated reservoir volume (SRV), providing more flow pathways for free gas migration. Therefore, for the study area, ensuring sufficient injected fluid volume during hydraulic fracturing operations is essential for improving stimulation effectiveness.
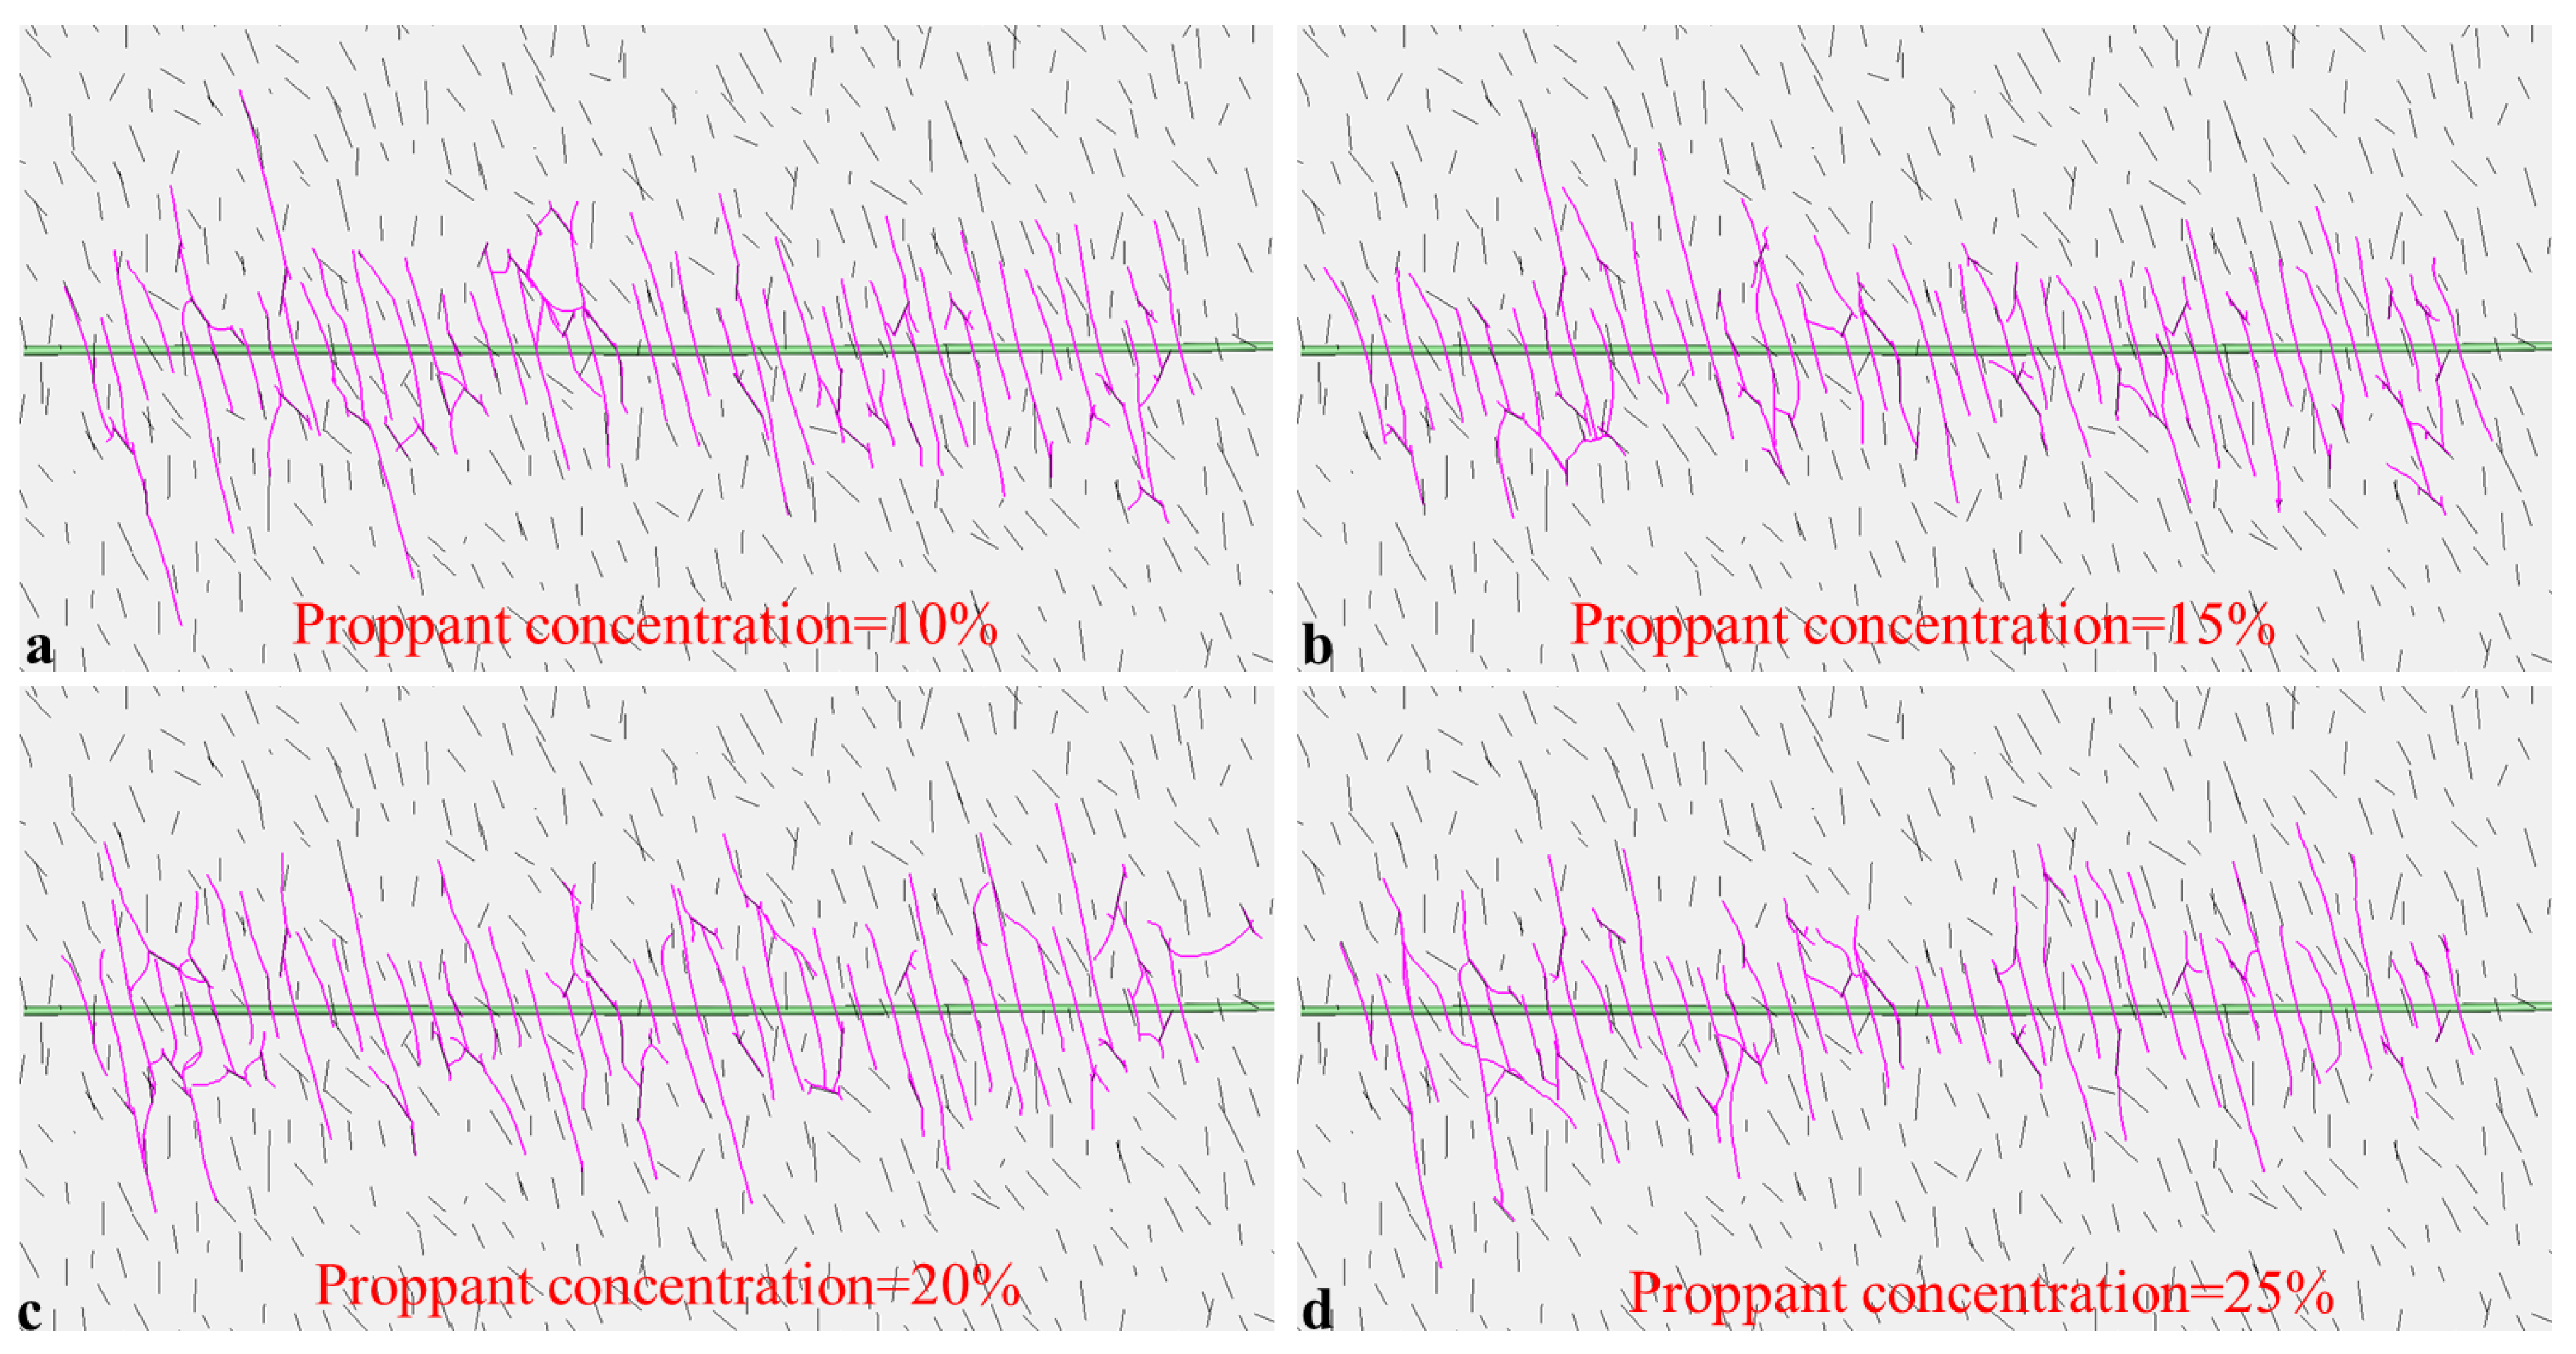
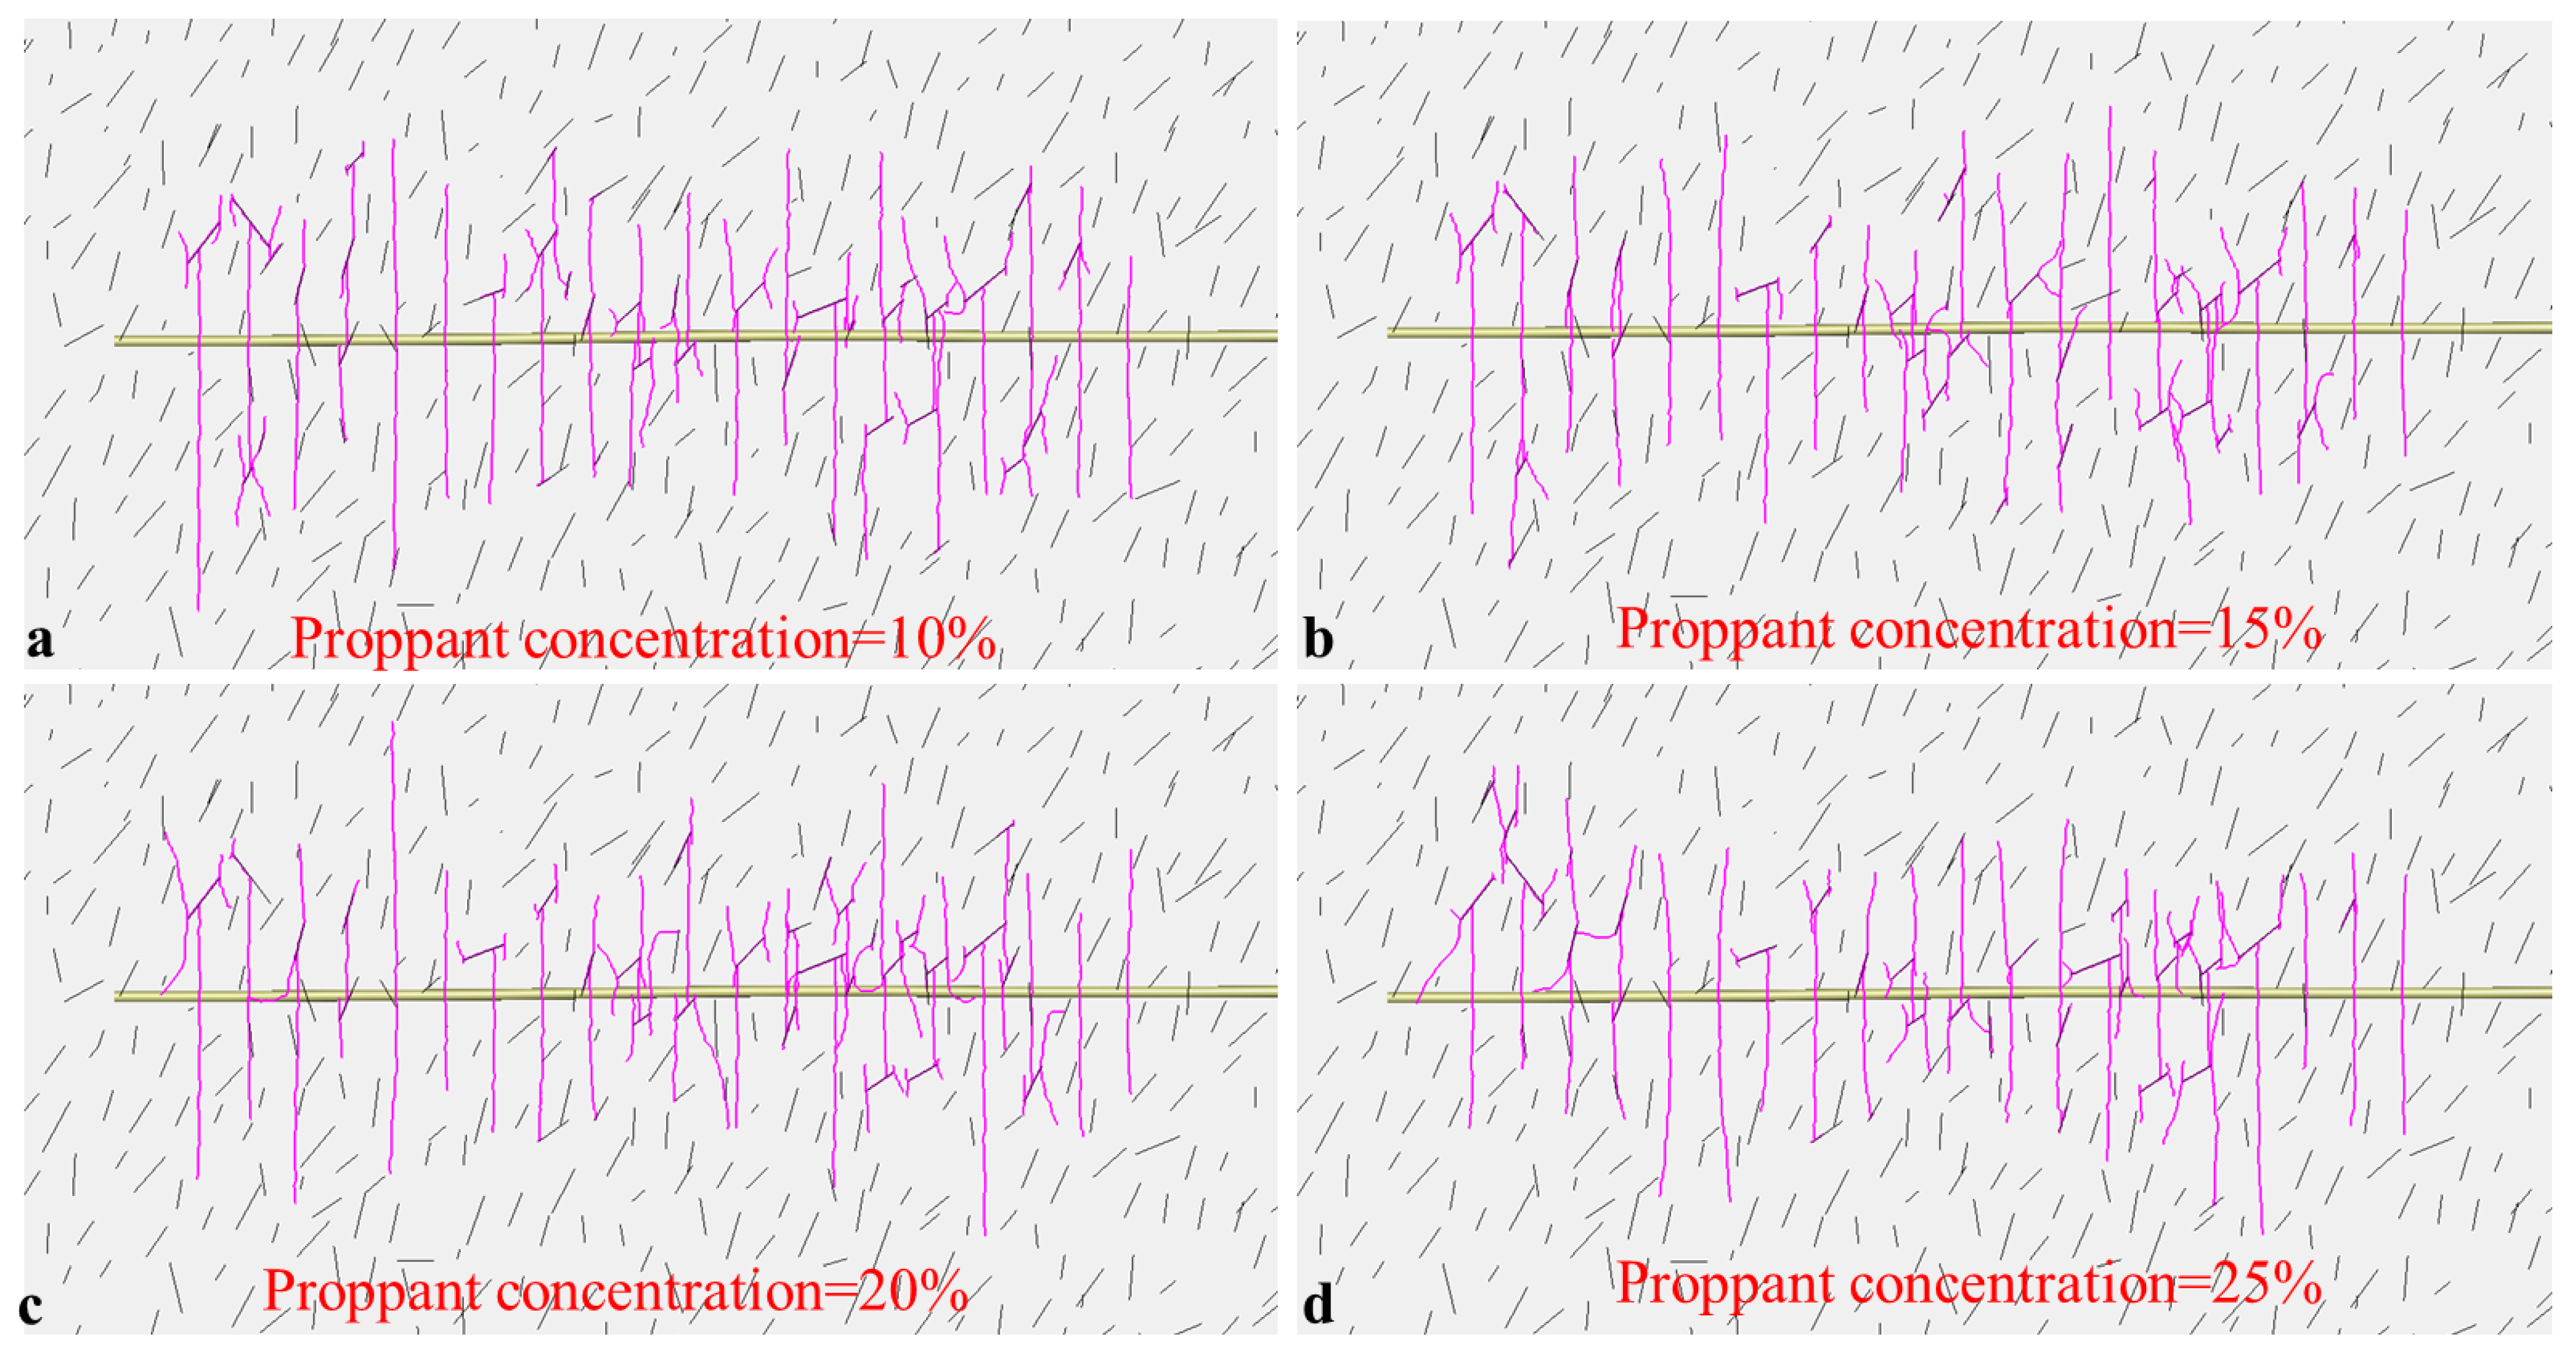
Figure 8 illustrates the hydraulic fracture propagation patterns in Type I reservoirs under different proppant concentrations. As shown by the combined analysis of Figure 8 and Table 1, proppant concentration has a limited influence on the average hydraulic fracture length. With increasing proppant concentration, the stimulated reservoir volume increases to some extent, whereas the overall fracture morphology exhibits relatively minor variations. As the proppant concentration increases, the amount of proppant filling within the fractures correspondingly increases, resulting in a significant enhancement of fracture conductivity. However, a high proppant concentration also leads to a substantial increase in operational costs. Therefore, an appropriate proppant concentration should be selected to ensure sufficient fracture conductivity while effectively controlling hydraulic fracturing costs.
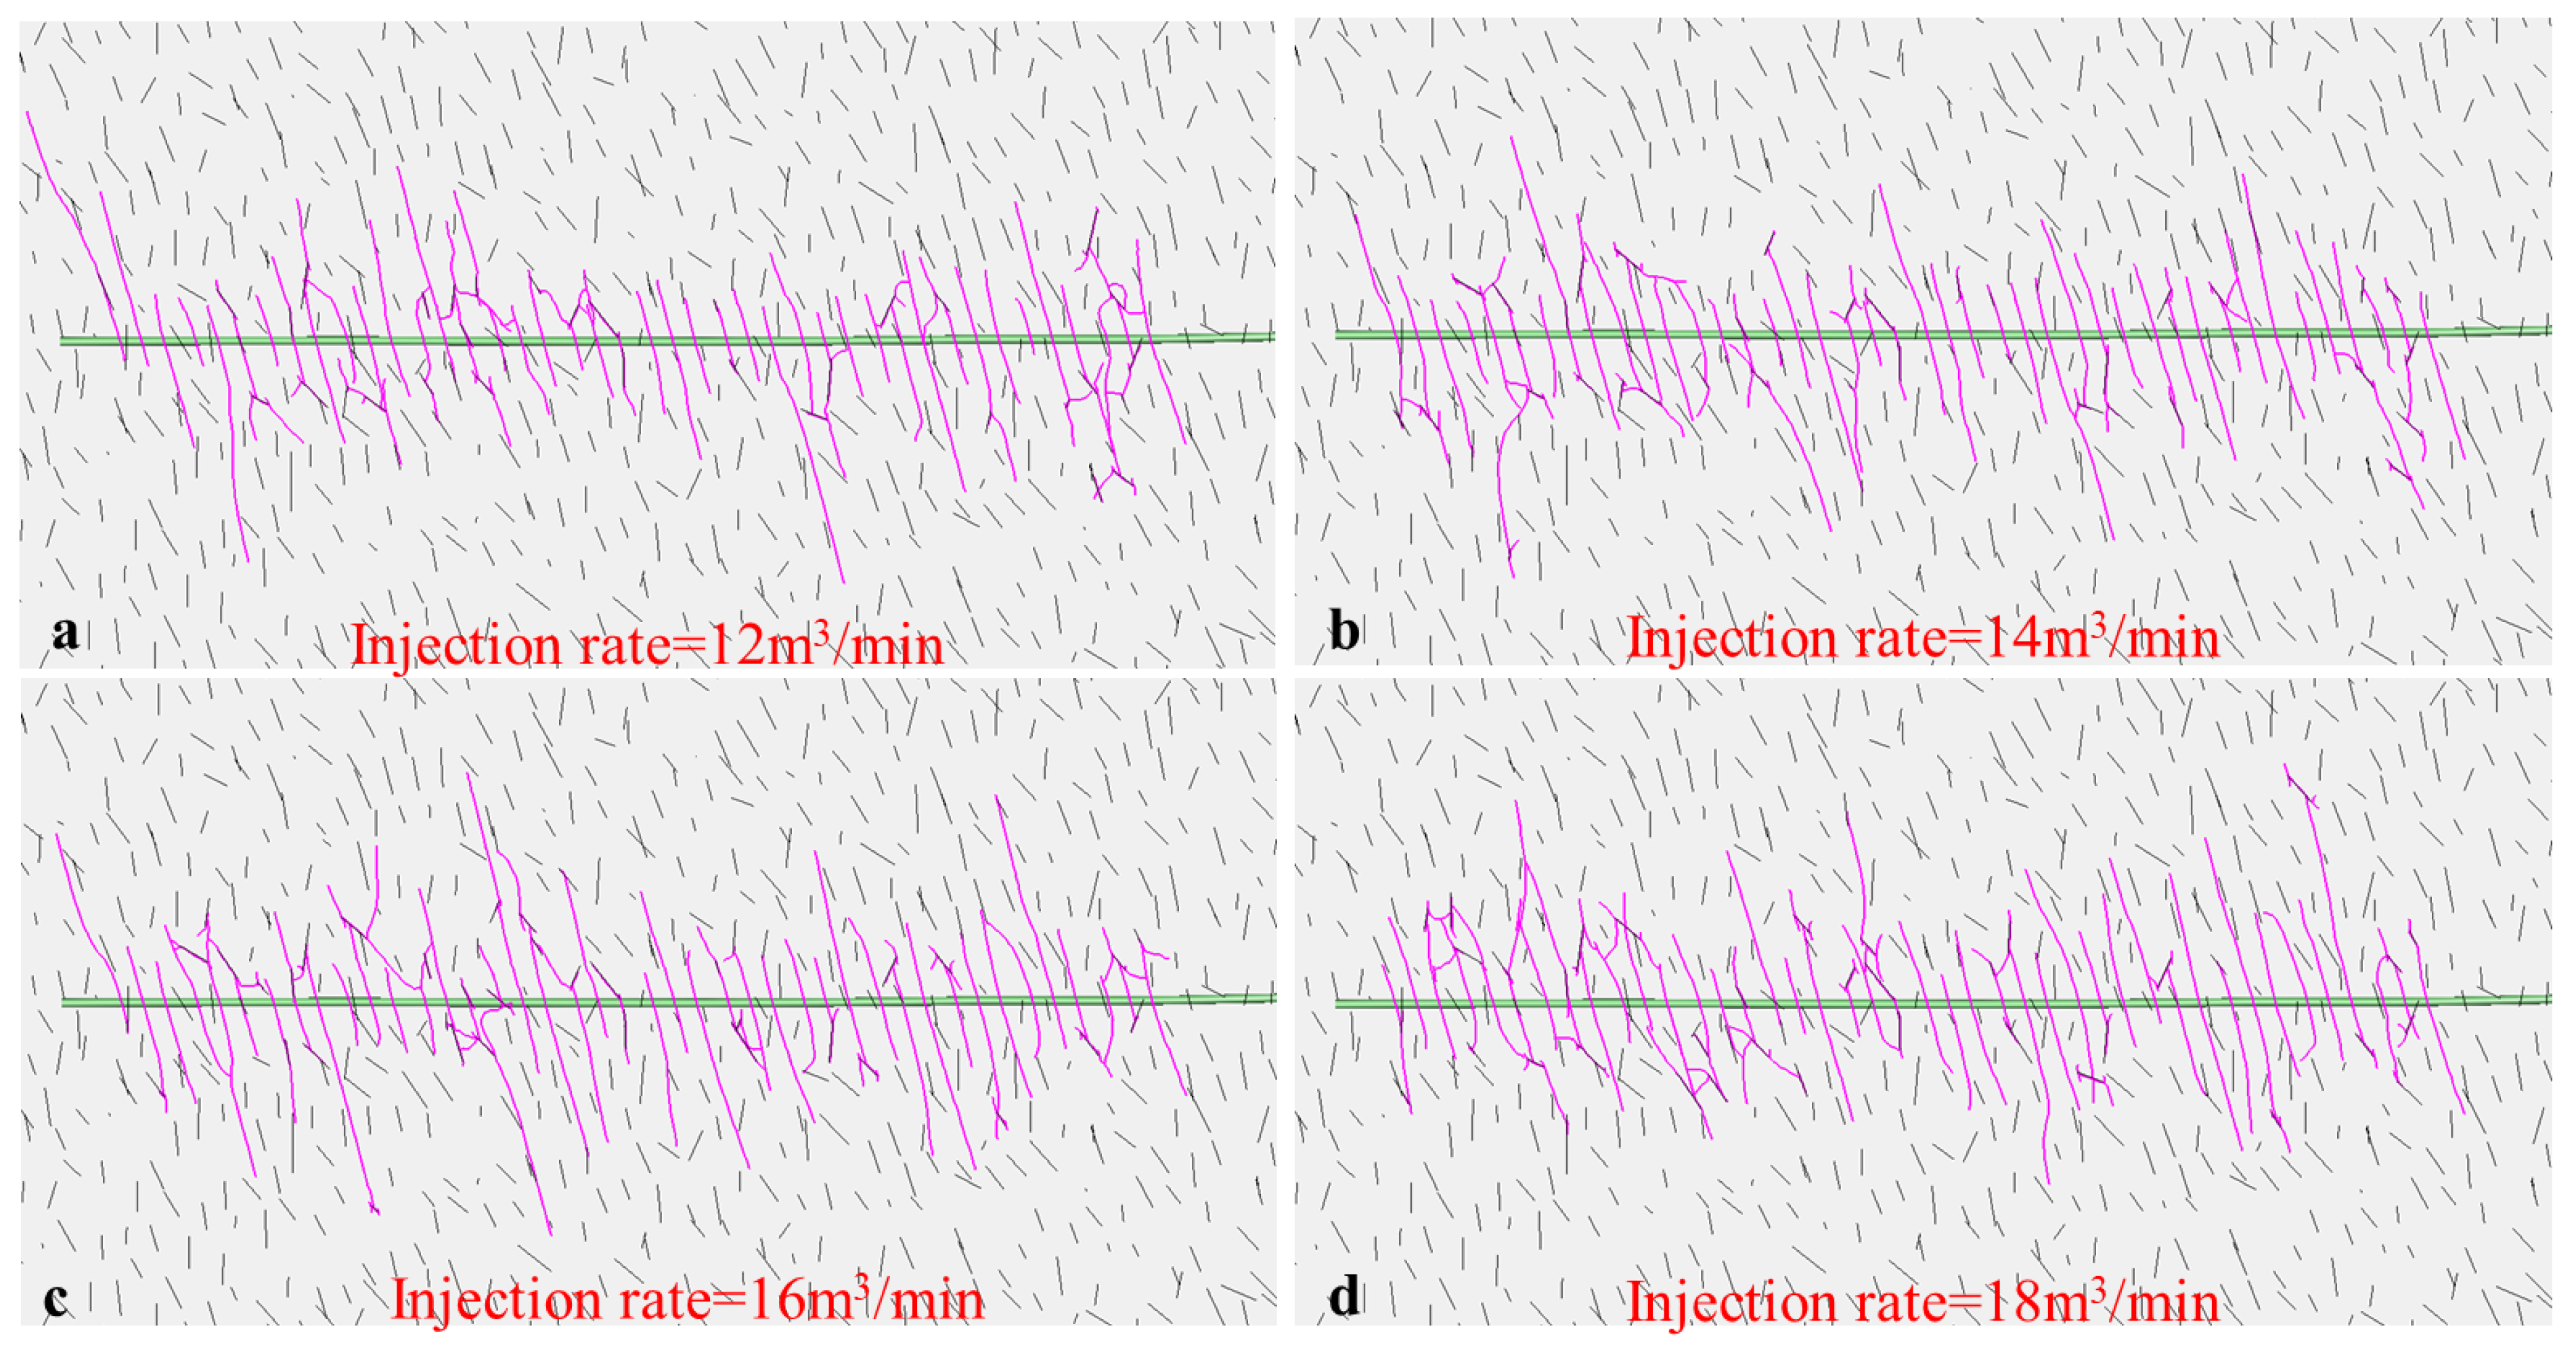
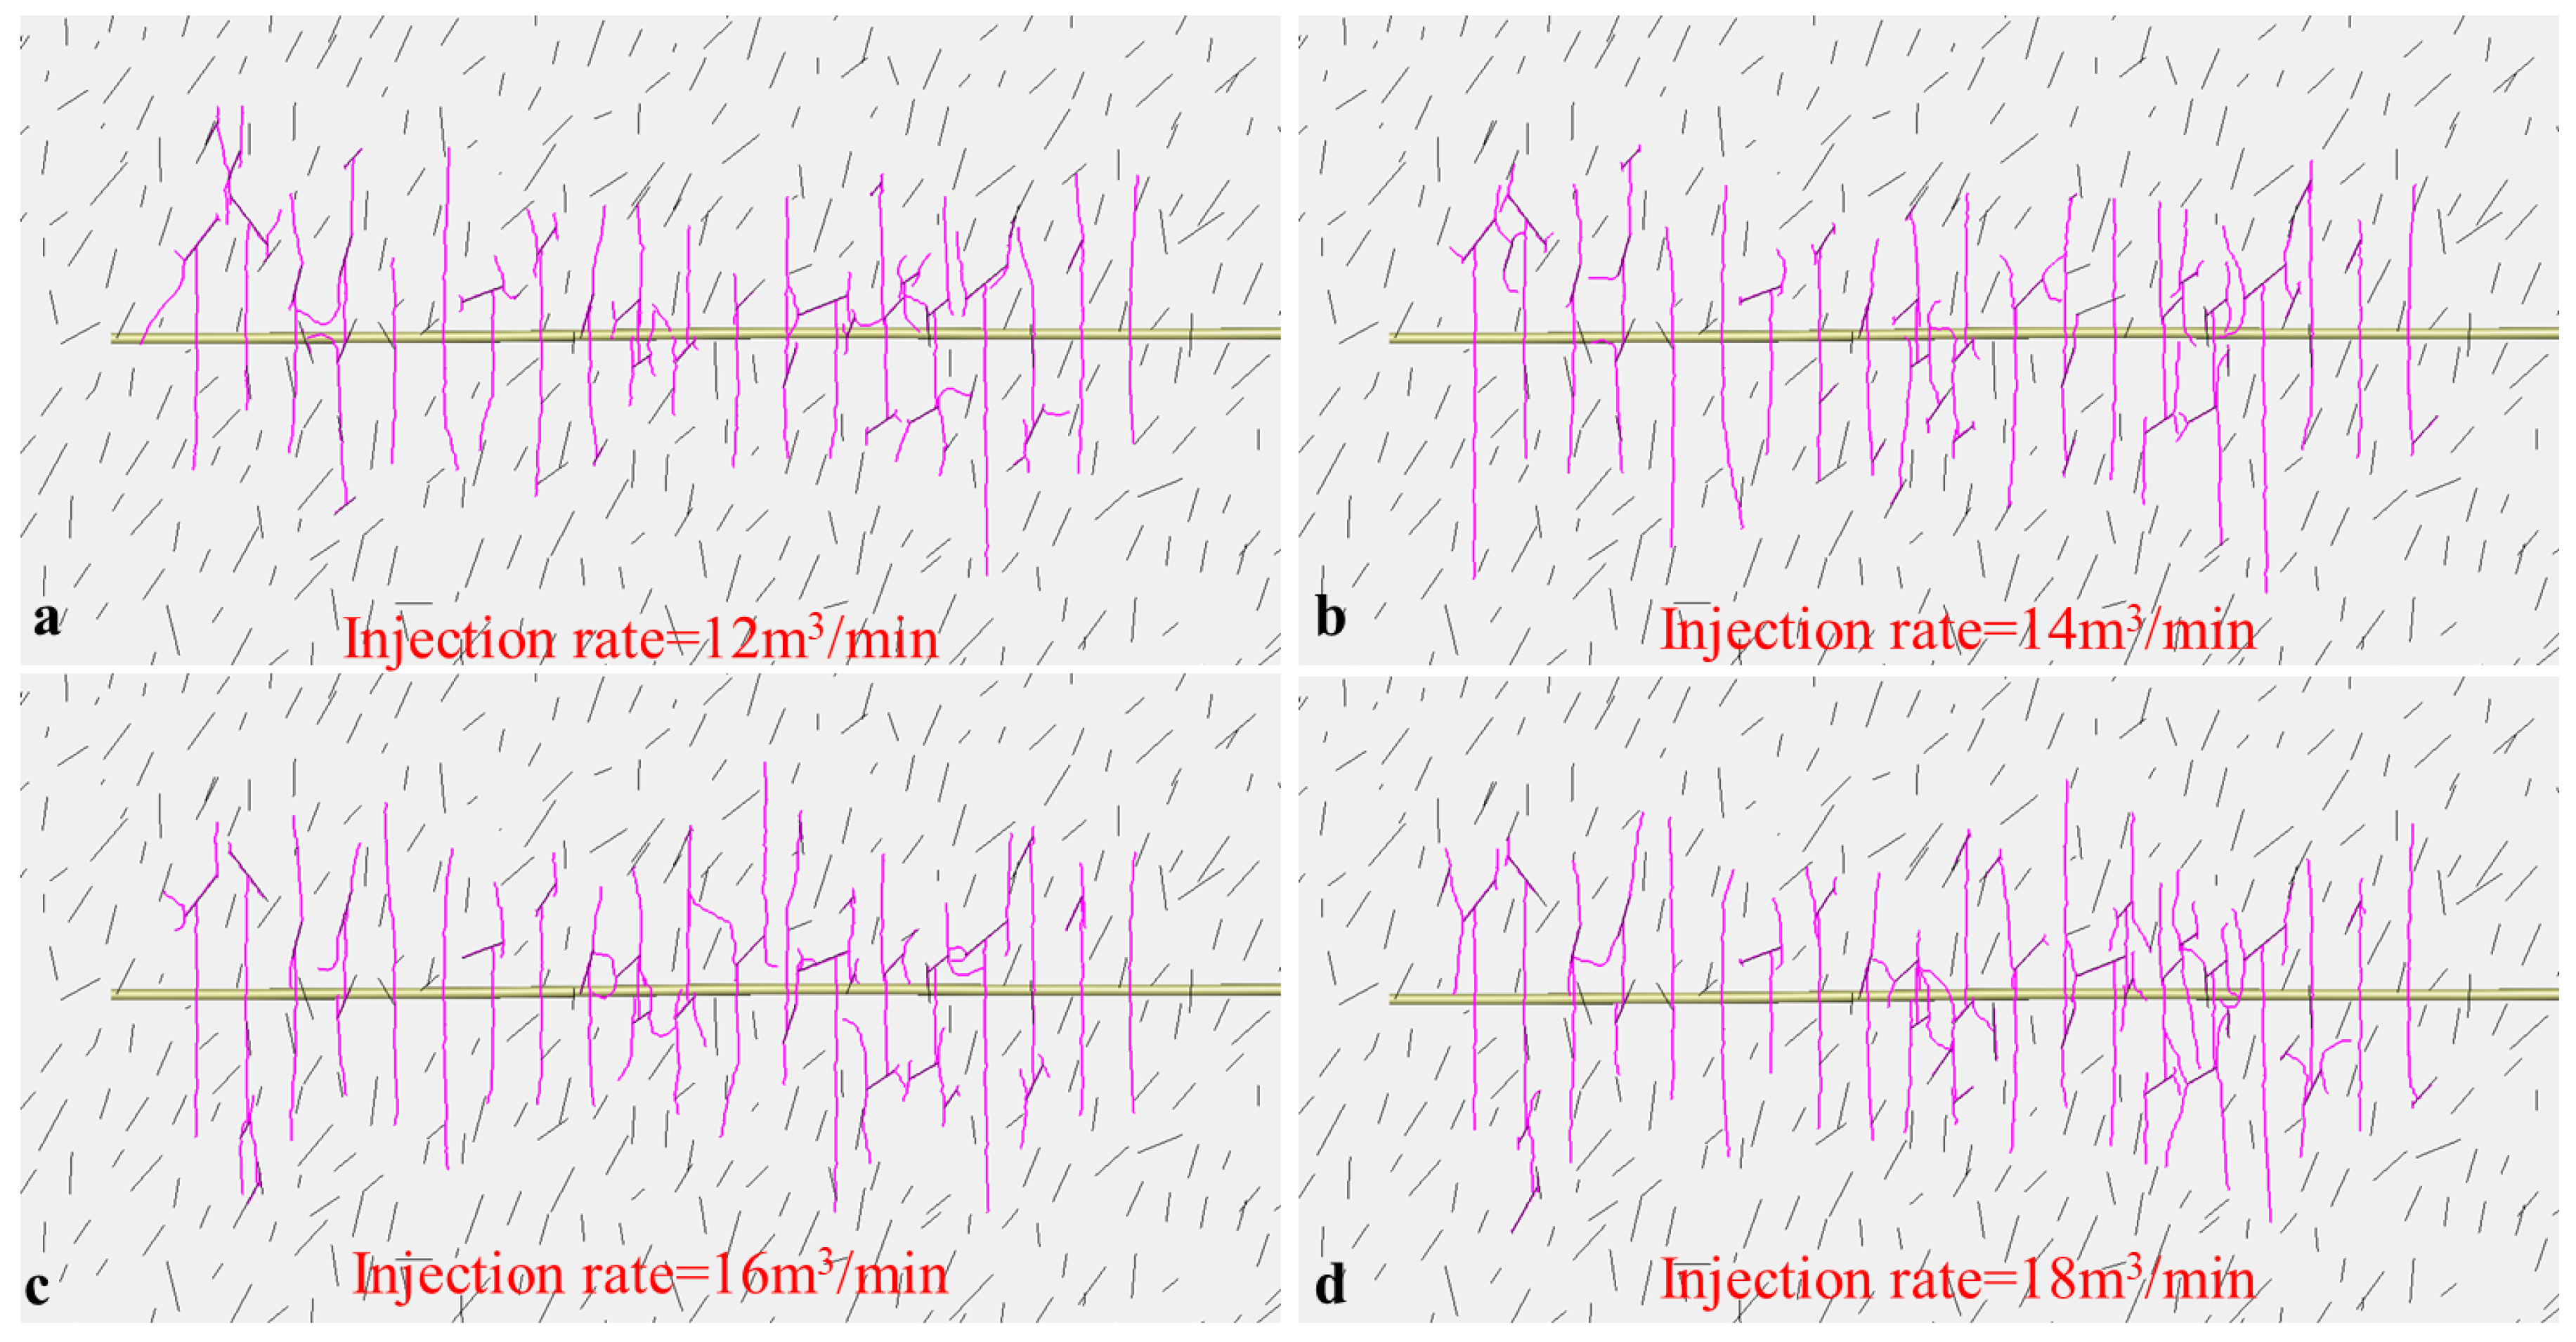
Figure 9 illustrates the hydraulic fracture propagation patterns in Type I reservoirs under different injection rates. Combined with Figure 9 and Table 1, it can be observed that increasing the injection rate does not result in a significant increase in fracture length, indicating that the effect of injection rate on fracture length is relatively limited. However, higher injection rates promote the activation of a greater number of cleats, leading to increased fracture complexity and an enlarged stimulated reservoir volume. For deep coalbed methane reservoirs in the study area, appropriately increasing the injection rate during hydraulic fracturing is therefore recommended to enhance fracture network complexity and improve stimulation effectiveness.
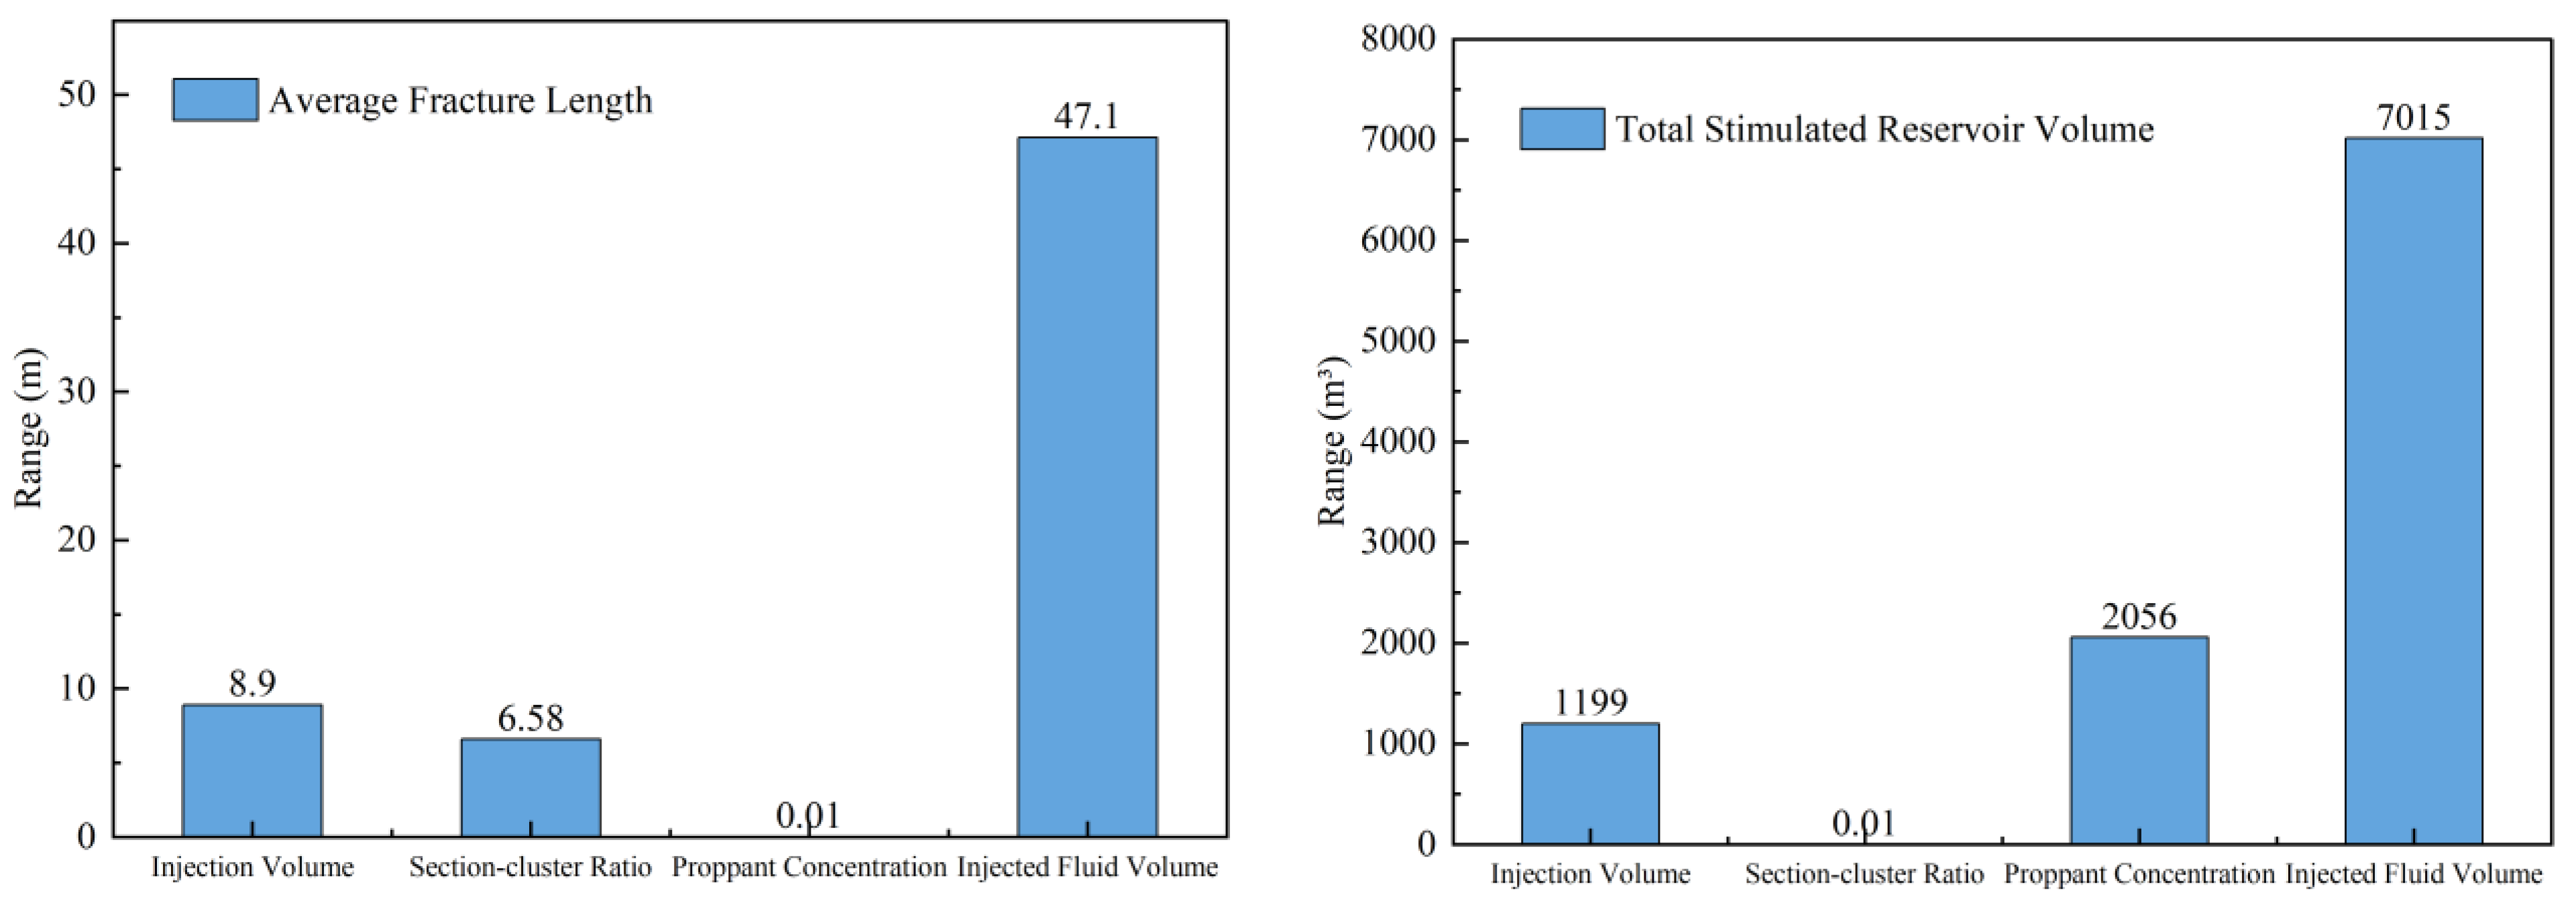
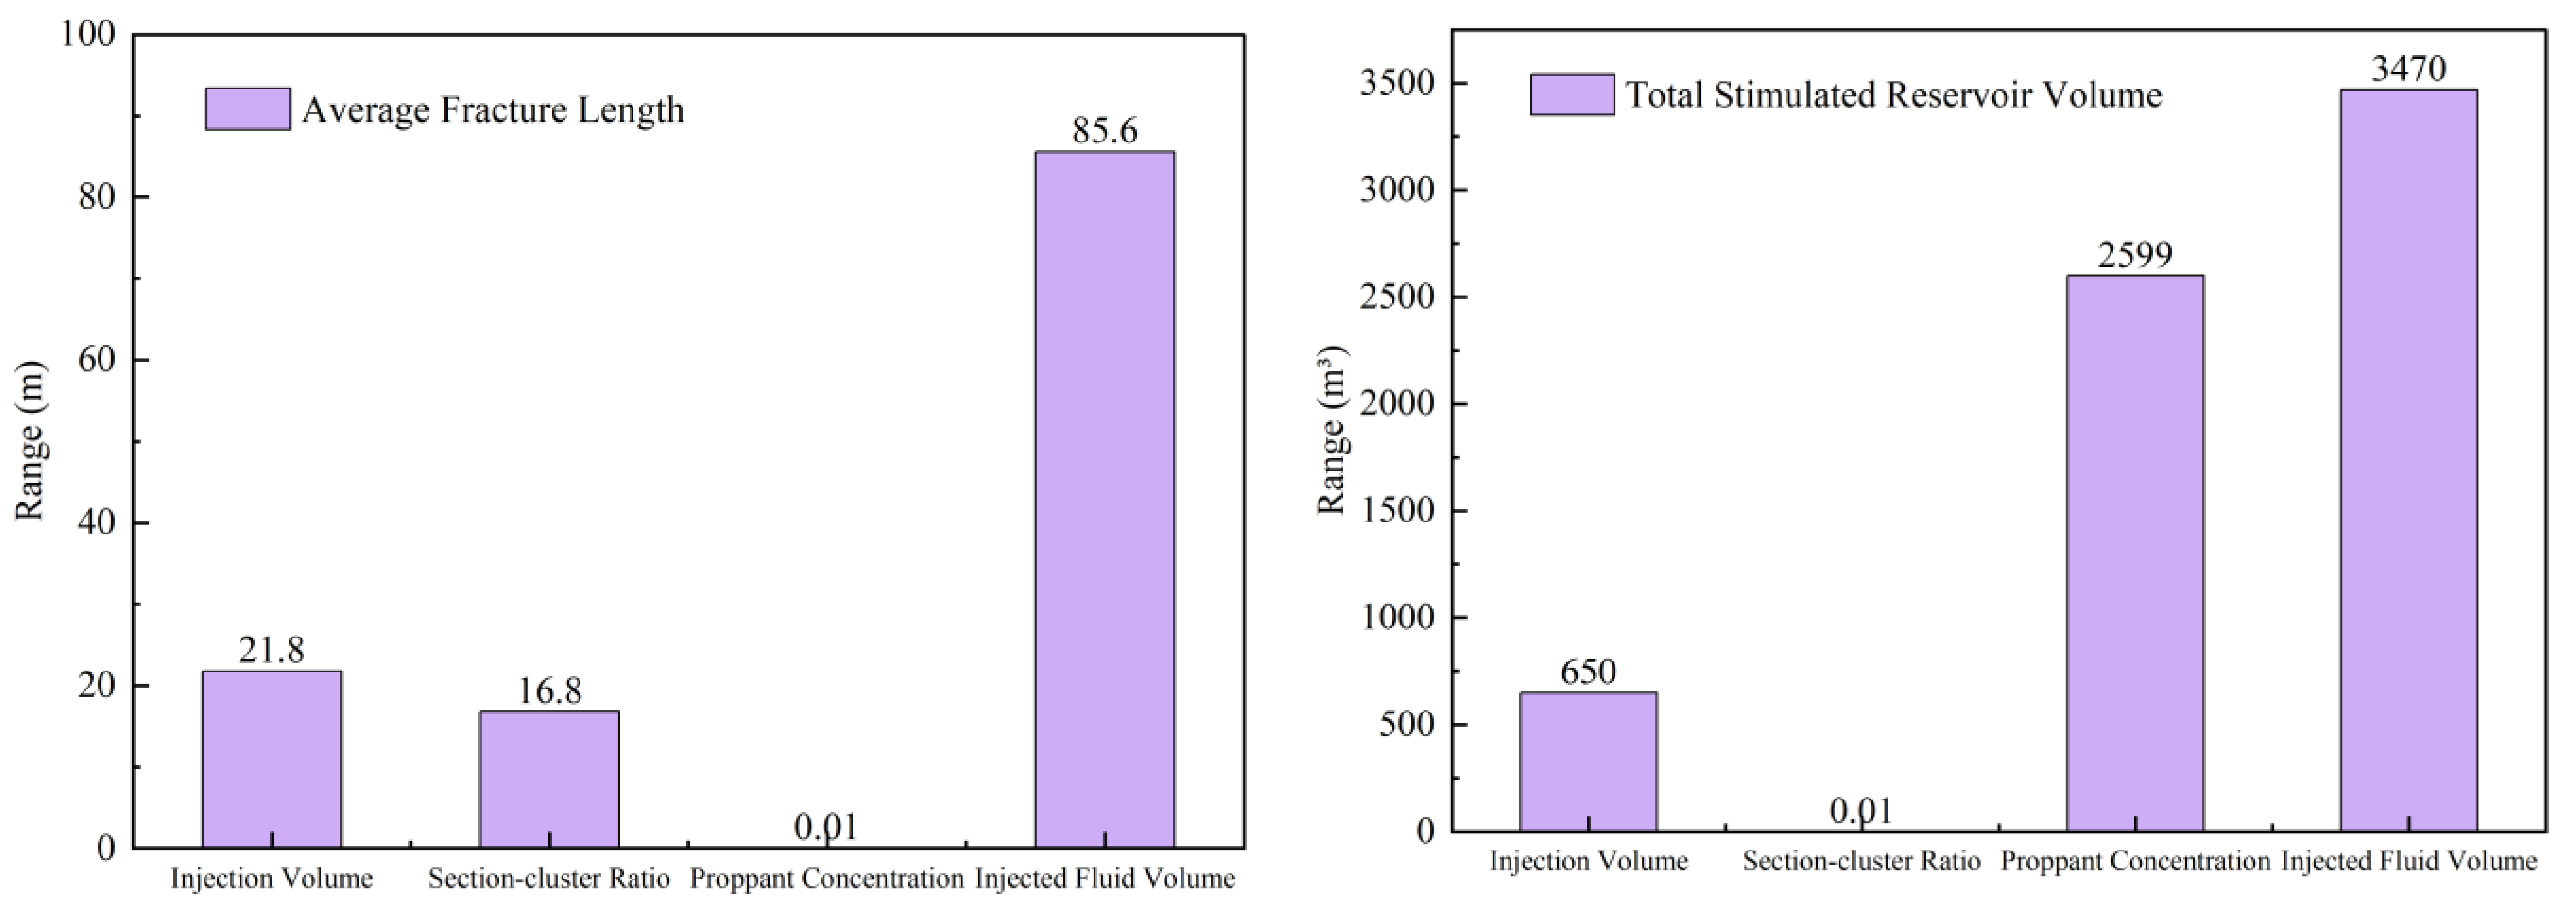
For the deep coalbed methane reservoirs in the study area, field hydraulic fracturing results indicate that average fracture length and total stimulated reservoir volume are the key factors controlling post-fracturing production. Therefore, a range analysis was applied to the simulation results listed in Table 1, as shown in Figure 10. The results demonstrate that injected fluid volume per stage plays a dominant controlling role in the average fracture length of Type I reservoirs, followed by injection rate and Section–cluster Ratio, whereas the influence of proppant concentration on average fracture length is negligible compared with the other factors. For the total stimulated reservoir volume of Type I reservoirs, the injected fluid volume per stage remains the primary controlling factor, followed by proppant concentration and injection rate, while the effect of the Section–cluster Ratio can be considered negligible. Therefore, for Type I reservoirs, it is essential to ensure sufficient injected fluid volume per stage and to moderately increase the injection rate in order to enhance both the average fracture length and the total stimulated reservoir volume.

3.2. Fracture Propagation Behavior in Type II Reservoirs

In Section 2, a fracture propagation model capable of accurately simulating hydraulic fracture geometry was established for Well M125, the representative well of the Type II reservoir. Based on this model, 16 simulation cases were designed, as listed in Table 2, to investigate the influence mechanisms of four parameters—Section–cluster Ratio, injected fluid volume, proppant concentration, and injection rate—on hydraulic fracture propagation behavior in Type II reservoirs. Among these cases, Case 13 corresponds to the original field pumping parameters applied in Well M125.
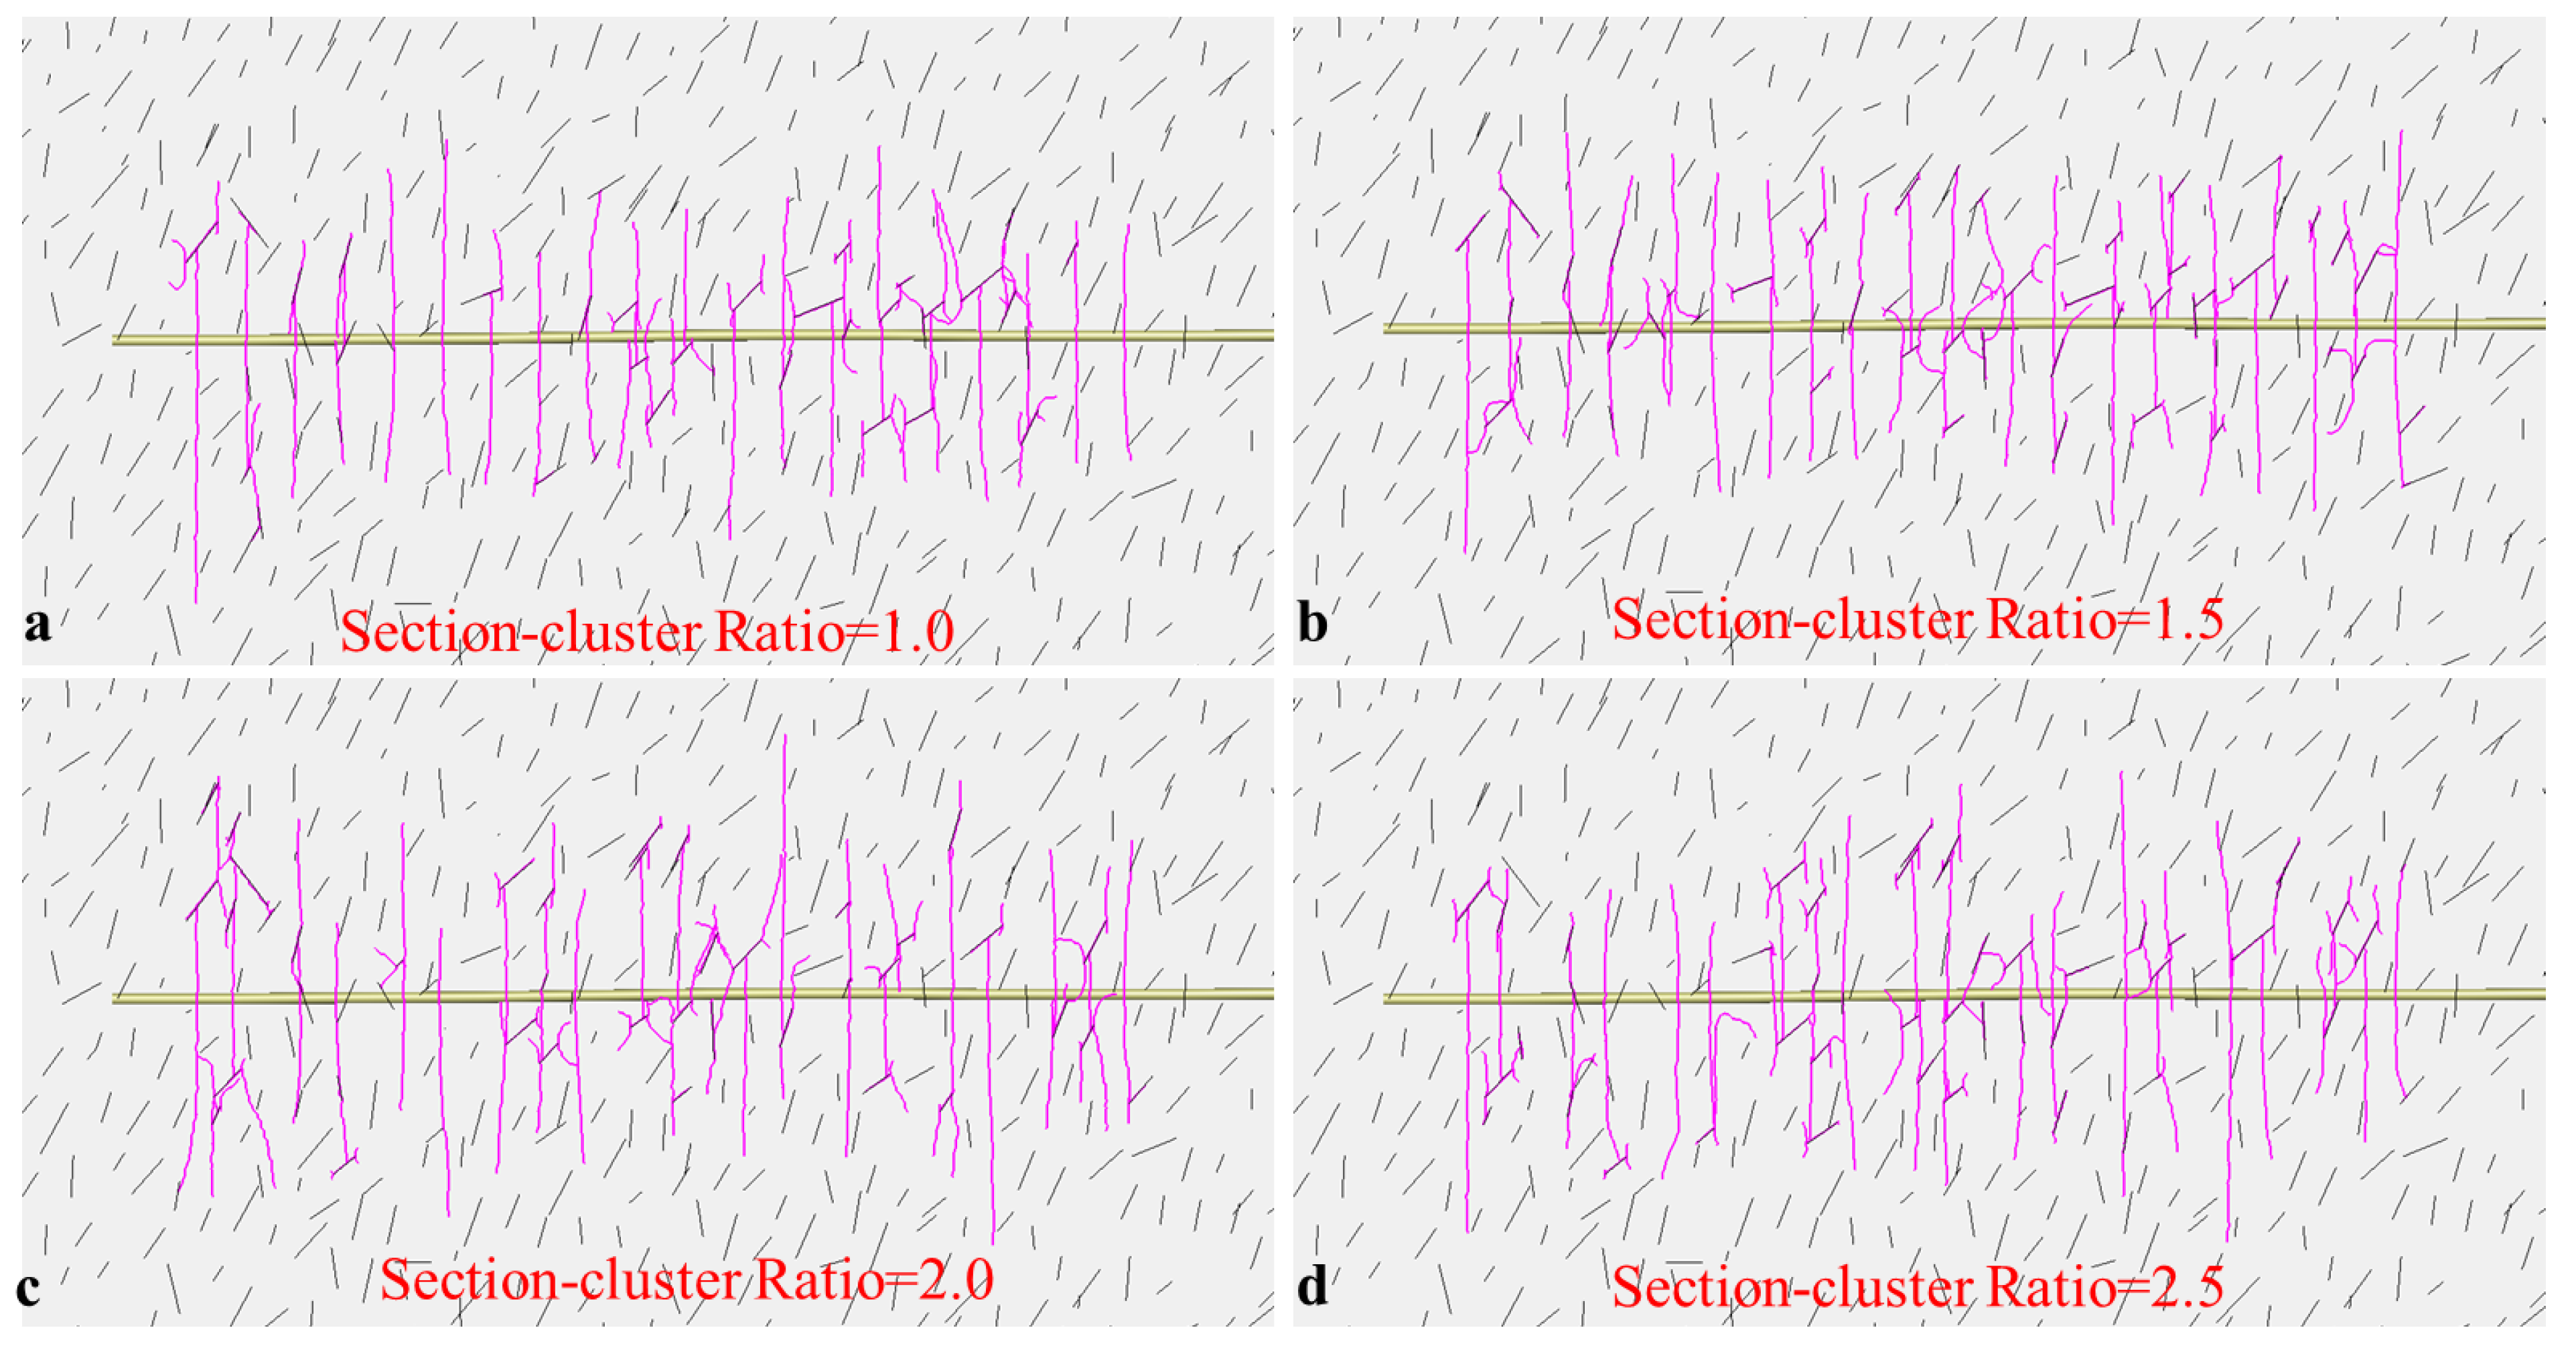
Figure 11 illustrates the comparison of hydraulic fracture propagation patterns in Type II reservoirs under different Section–cluster Ratios. Combined with the data in Table 2, the results indicate that increasing the Section–cluster Ratio does not lead to a significant increase in fracture length, suggesting that the Section–cluster Ratio has a limited influence on fracture length in Type II reservoirs. As the Section–cluster Ratio increases, competitive fracture propagation is intensified, resulting in enhanced interactions between the main hydraulic fractures and cleats in the near-wellbore region. Consequently, a greater number of cleats are activated by the main fractures, leading to the formation of more complex fracture network geometries. However, despite the increased fracture complexity, the total stimulated reservoir volume does not show a pronounced increase with increasing Section–cluster Ratio.
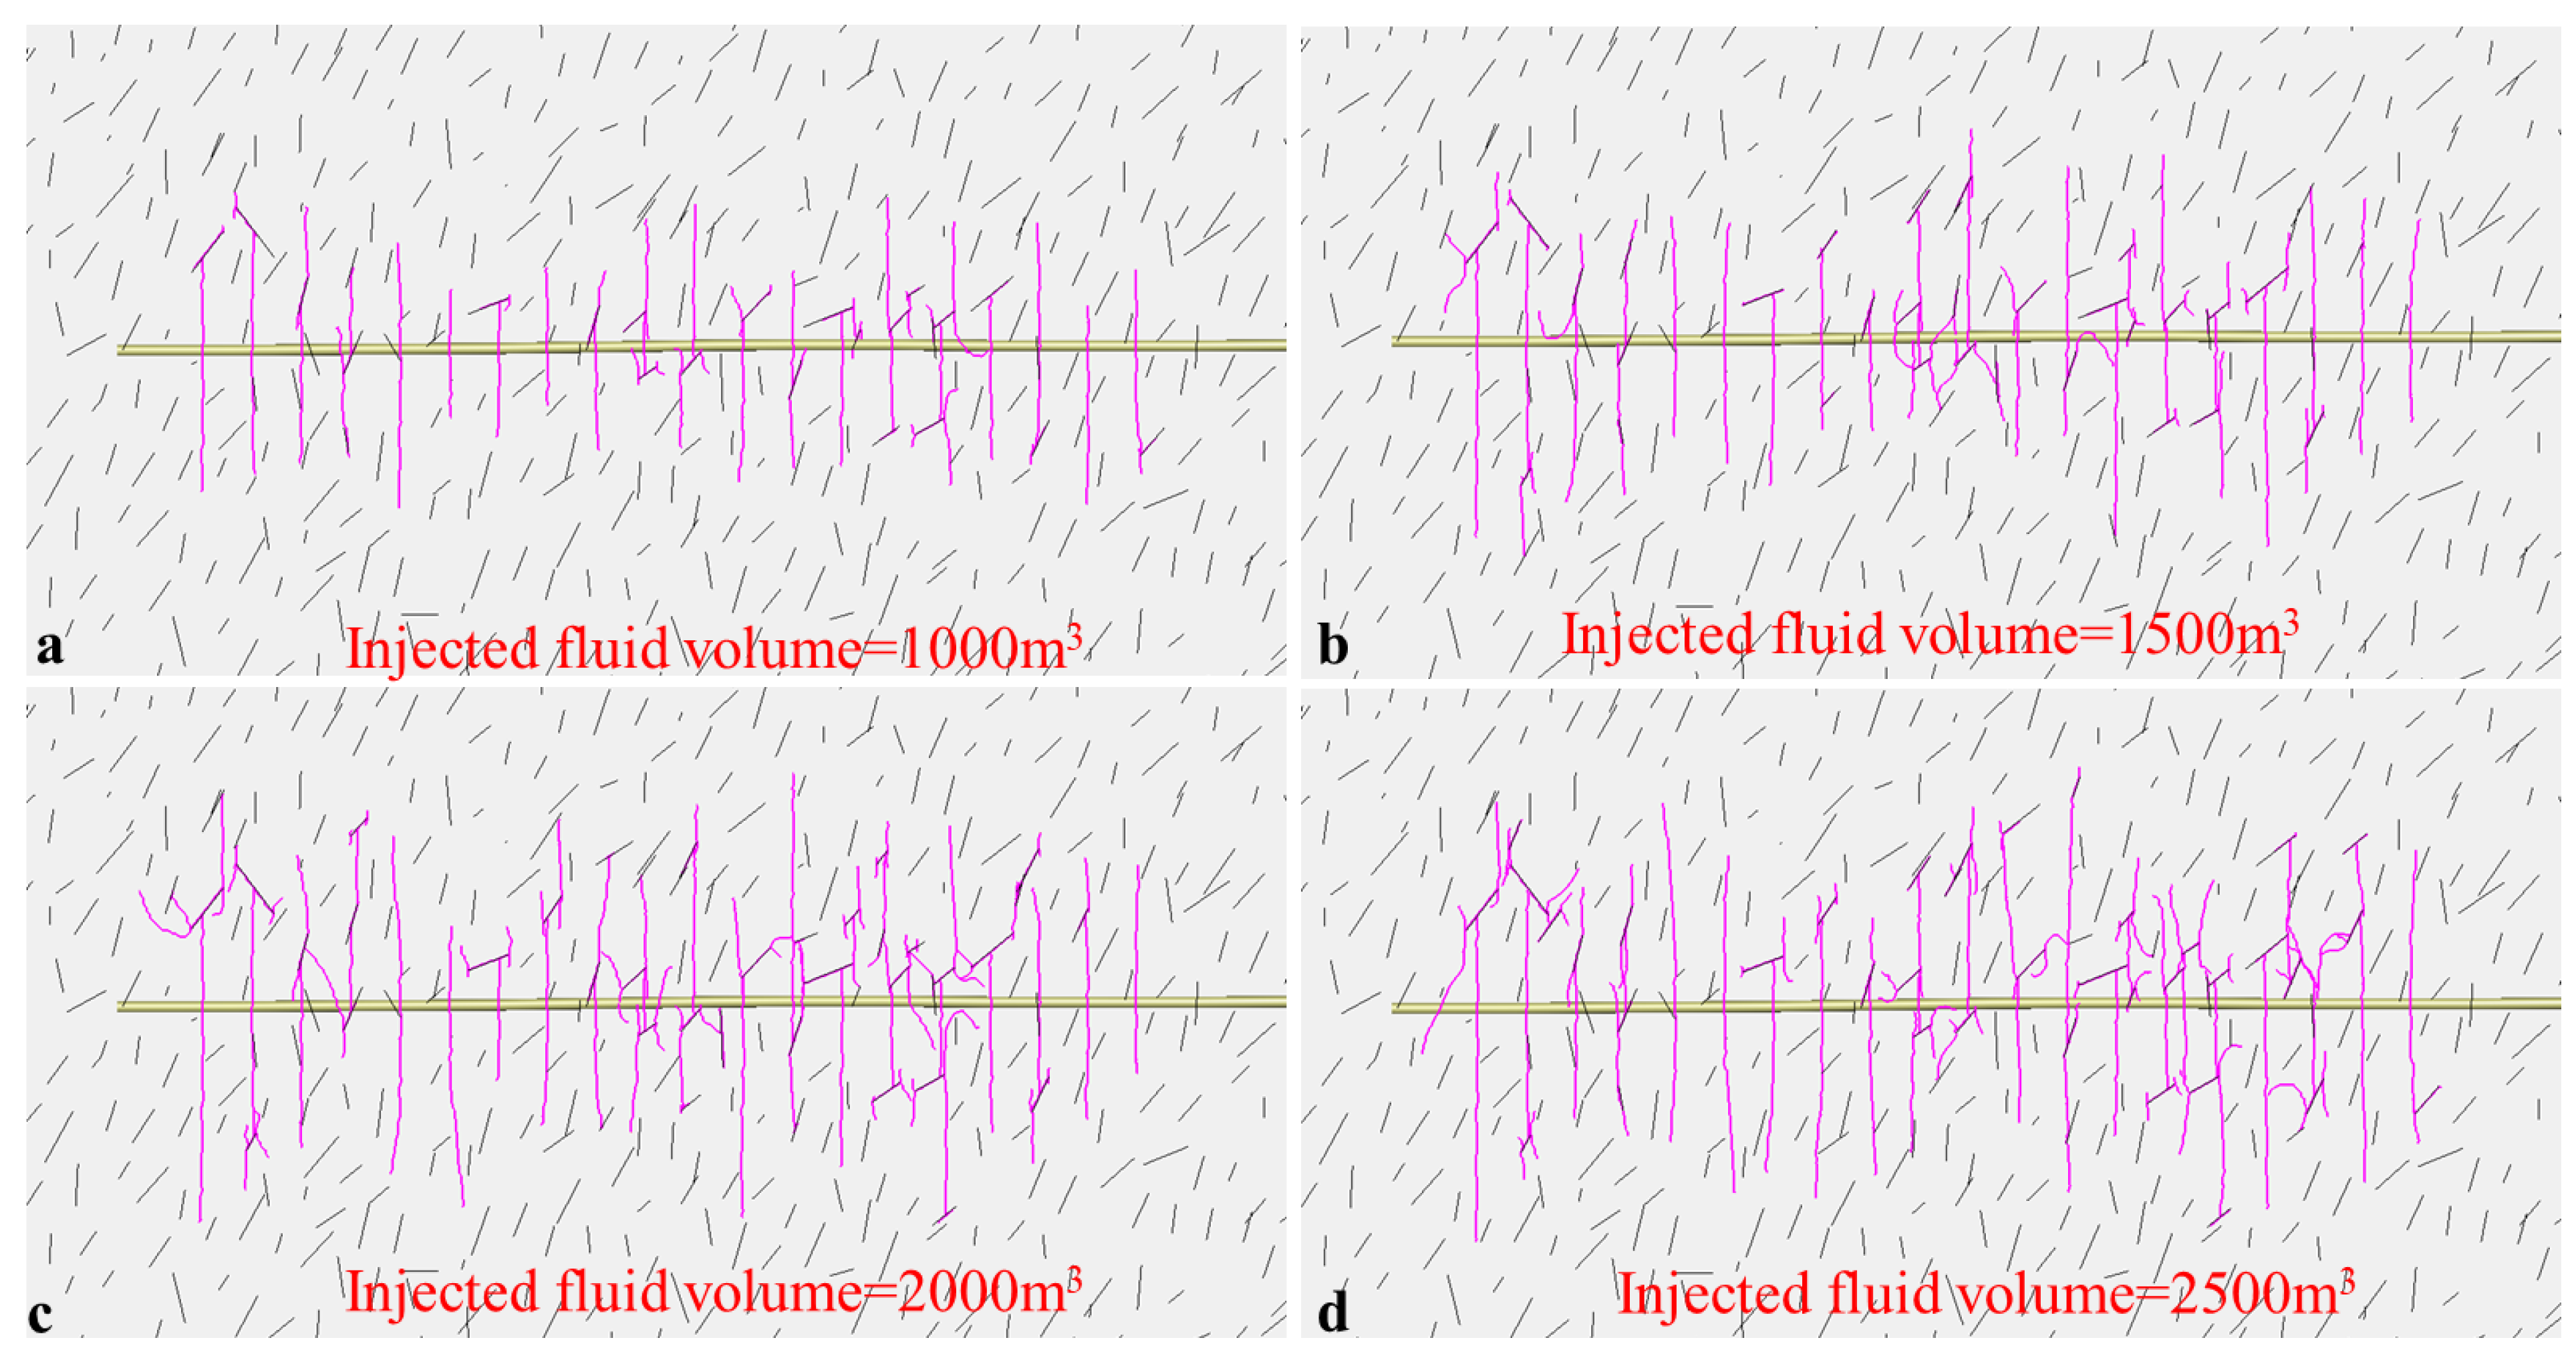
Figure 12 illustrates the hydraulic fracture propagation patterns in Type II reservoirs under different injected fluid volumes per stage. Combined with the data in Figure 12 and Table 2, it can be observed that increasing the injected fluid volume per stage leads to a significant increase in the average hydraulic fracture length in Type II reservoirs. With larger fluid volumes, higher energy within the fractures promotes the activation of a greater number of cleats, resulting in the formation of more complex fracture networks. Increasing the injected fluid volume not only enhances the average fracture length but also substantially enlarges the total stimulated reservoir volume, thereby improving the hydraulic fracturing effectiveness of Type II reservoirs.
Figure 13 illustrates the hydraulic fracture propagation patterns in Type II reservoirs under different proppant concentrations. Combined with the results in Figure 13 and Table 2, it can be observed that increasing proppant concentration does not lead to a significant change in the average hydraulic fracture length in Type II reservoirs. However, the stimulated reservoir volume gradually increases with higher proppant concentration, indicating an overall improvement in fracturing effectiveness. With increasing proppant concentration, the average fracture conductivity in Type II reservoirs is markedly enhanced, as a larger amount of proppant is effectively placed within both the main fractures and the secondary branch fractures.
Figure 14 shows the comparison of hydraulic fracture propagation patterns in Type II reservoirs under different injection rates. Combined with the results in Figure 14 and Table 2, it can be observed that the injection rate has no significant influence on the average hydraulic fracture length in Type II reservoirs, and increasing the injection rate does not lead to a pronounced increase in fracture length. However, at higher injection rates, the elevated fracture pressure and enhanced energy input promote the development of more complex fracture networks near the wellbore, resulting in an increase in the total stimulated reservoir volume.
Figure 15 shows the range analysis results of average fracture length and total stimulated reservoir volume under different influencing factors for Type II reservoirs. As indicated in Figure 15, consistent with the results for Type I reservoirs, the single-stage injected fluid volume plays a dominant controlling role in both the average fracture length and the total stimulated reservoir volume for Type II reservoirs, while injection rate and proppant concentration act as secondary controlling factors. Compared with Type I reservoirs, the single-stage injected fluid volume exerts a stronger influence on the average fracture length in Type II reservoirs, but its effect on the total stimulated reservoir volume is relatively weaker. Overall, for Type II reservoirs, ensuring sufficient single-stage injected fluid volume and moderately increasing the injection rate are essential for enhancing both the average fracture length and the total stimulated reservoir volume.

3.3. Optimization of Hydraulic Fracturing Treatment Design

Following a comprehensive analysis of post-fracturing production performance in deep coalbed methane reservoirs in the eastern Ordos Basin, Changqing Oilfield has identified hydraulic fracture average length and total stimulated reservoir volume as the key factors controlling long-term post-fracturing gas production. Accordingly, with these two factors as the primary evaluation objectives, a comprehensive fracturing performance evaluation index was established for deep CBM reservoirs in the eastern Ordos Basin of Changqing Oilfield. First, the average fracture length and total stimulated reservoir volume under different fracturing schemes were normalized as follows:
X i n = X i X i min X i max X i min
where Xin represents the normalized values of the average hydraulic fracture length and the total stimulated reservoir volume; Xi denotes the original values of the two parameters; and Ximax and Ximin are the maximum and minimum values of the two parameters among all simulated cases, respectively.
Subsequently, the comprehensive hydraulic fracturing evaluation index (S) is calculated according to the assigned weighting factors:
S = 0.5 X 1 n + 0.5 X 2 n
The reason this evaluation index is preferred over other existing metrics is that it incorporates both fracture geometry (length) and the total reservoir volume stimulated, which directly correlates to long-term gas production and reservoir performance. Unlike some traditional metrics that focus solely on fracture length or fluid injection volume, our index balances multiple key factors, thus providing a more holistic and accurate measure of fracturing success. This multi-parameter approach allows for better optimization of fracturing treatments and a more nuanced understanding of reservoir behavior.
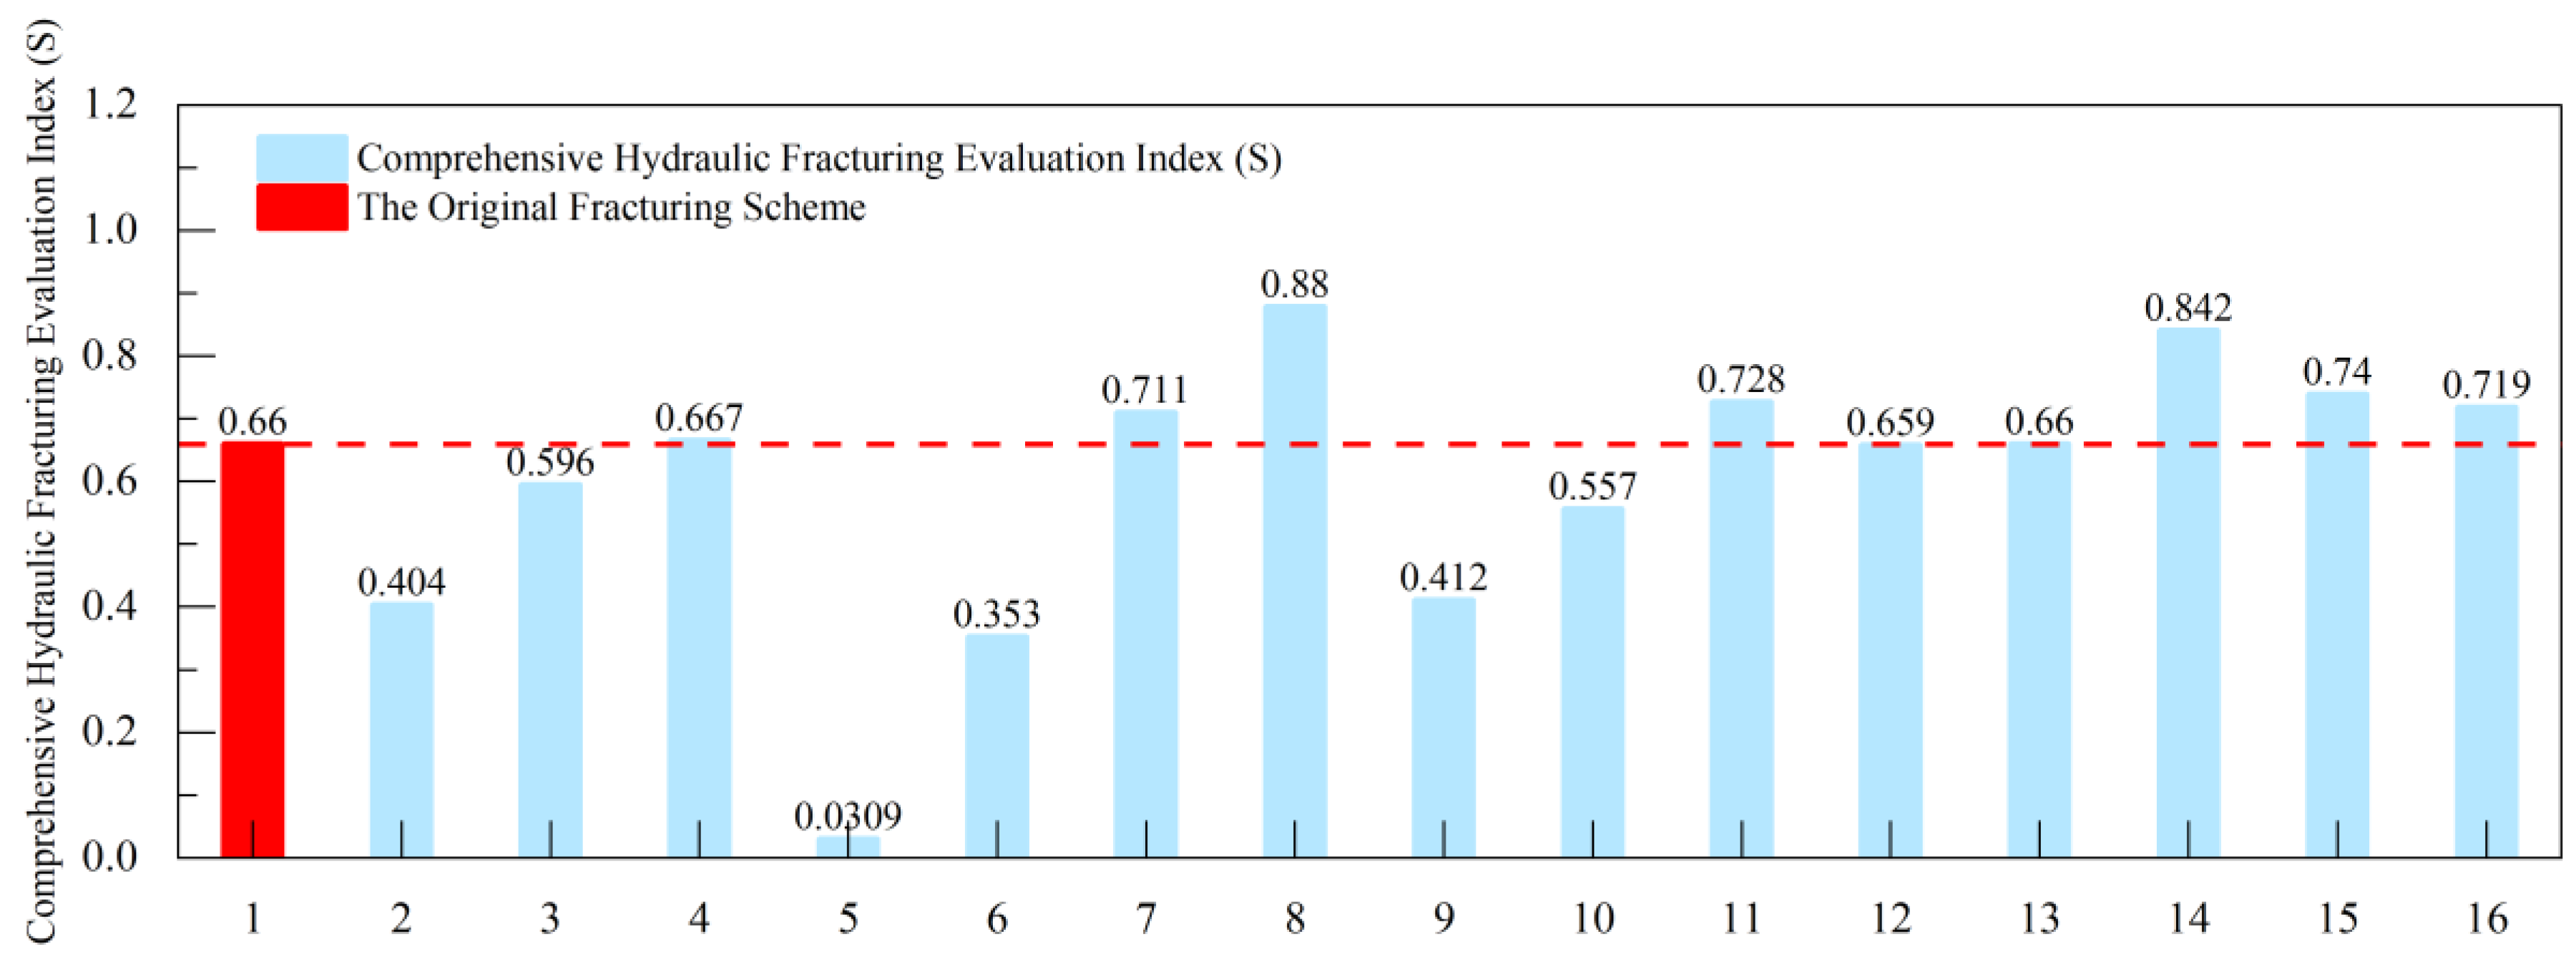
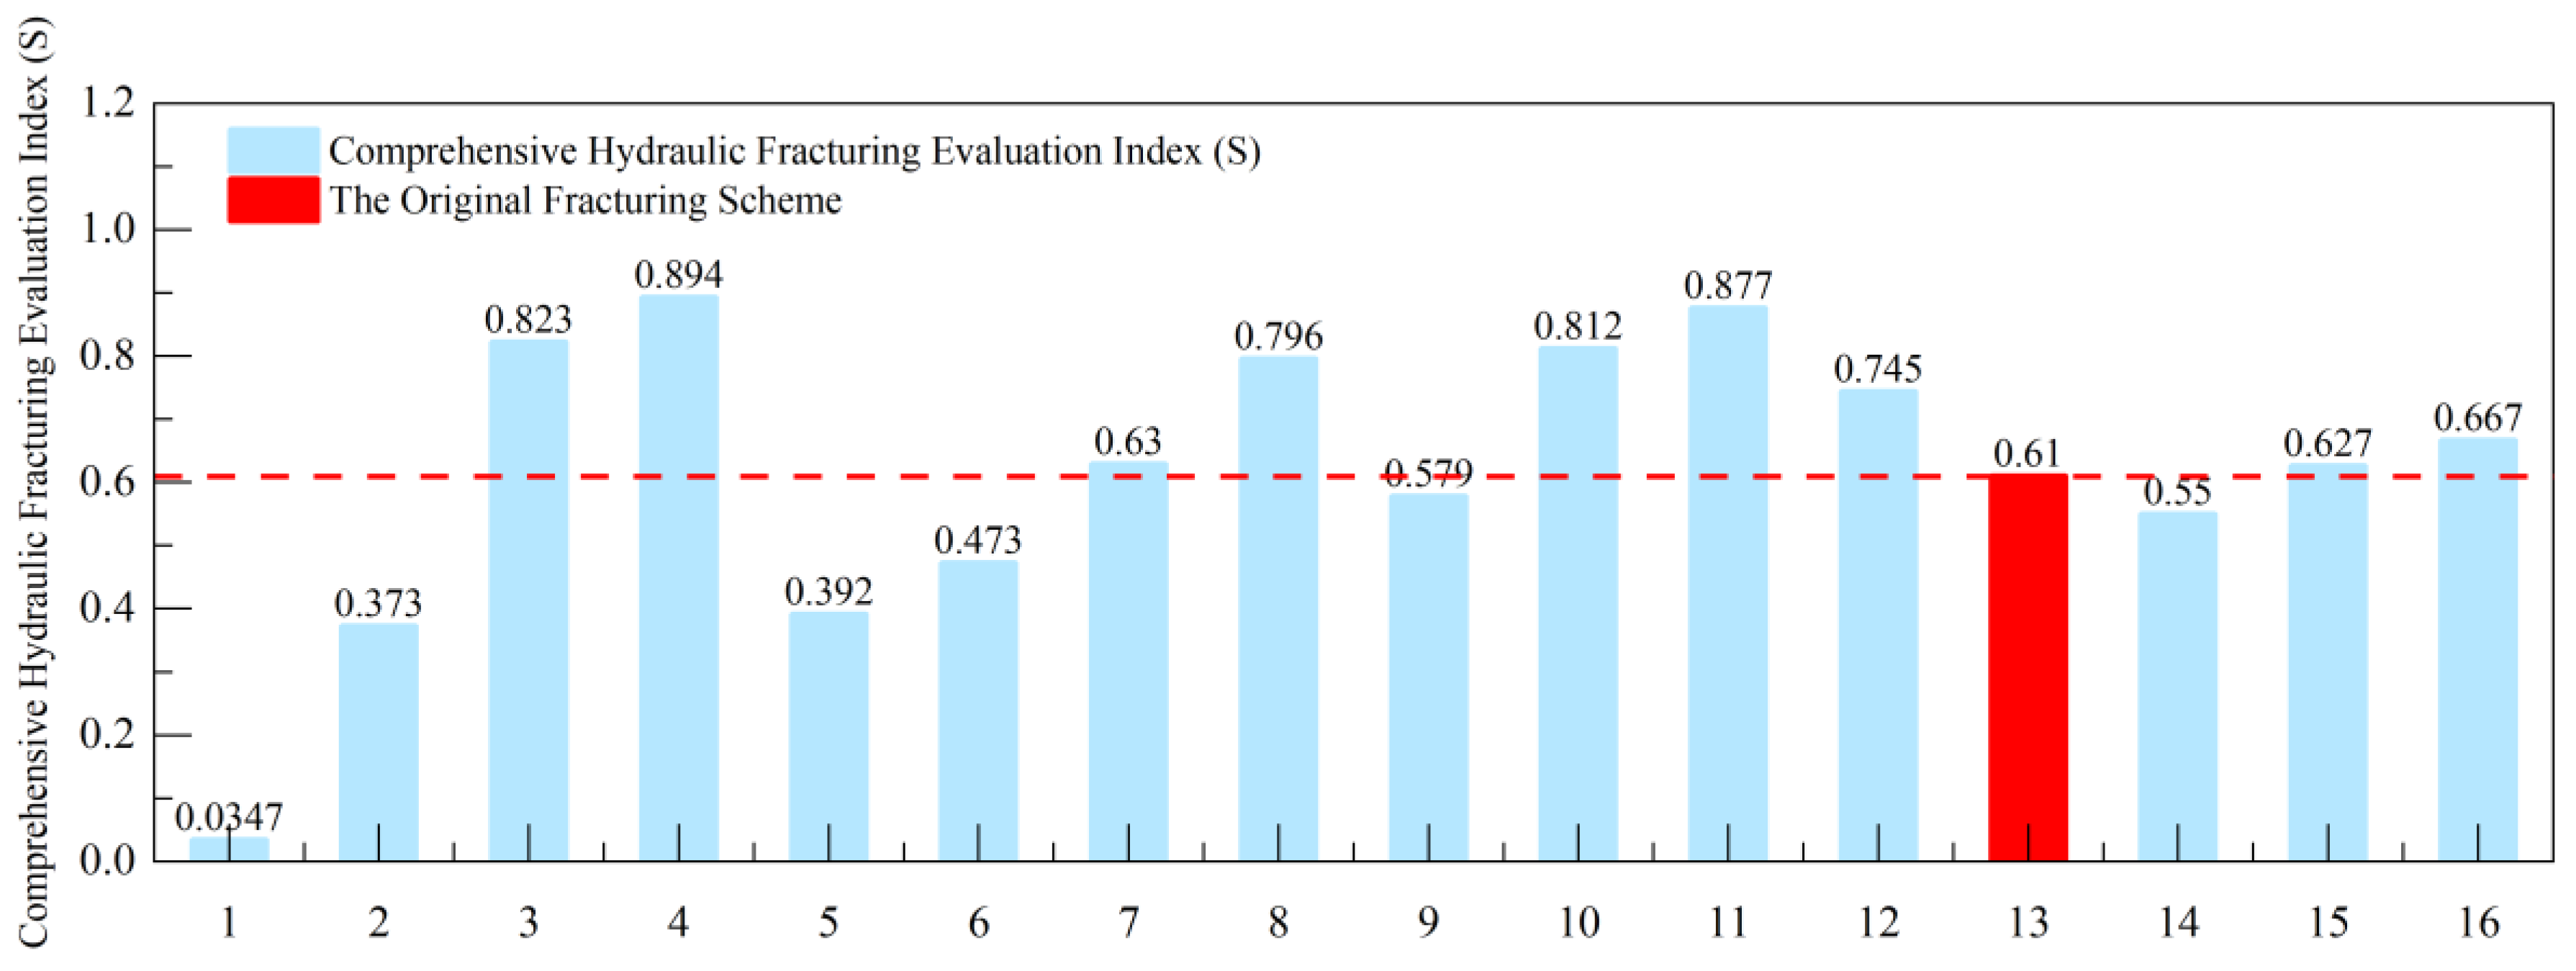
Here, X1n represents the normalized average hydraulic fracture length, and X2n represents the normalized total stimulated reservoir volume. Using the above equations, the comprehensive hydraulic fracturing evaluation index was calculated for different simulation cases of the two representative wells listed in Table 1 and Table 2, and the distributions of the evaluation index under different simulation scenarios were obtained, as shown in Figure 16 and Figure 17. The red rectangles indicate the original field fracturing schemes for the two representative wells. As shown in Figure 16 and Figure 17, the comprehensive evaluation indices vary significantly among different simulation cases. For the Type I reservoir (Well M24), the original fracturing scheme achieved a score of only 0.66; therefore, to improve the stimulation performance of this reservoir type, Case 8, which yielded the highest score, was selected as the optimized fracturing parameter set for subsequent Type I reservoir development. For the Type II reservoir (Well M125), the original fracturing scheme scored only 0.61; accordingly, Case 4, with the highest evaluation score, was selected as the optimized fracturing parameter set to enhance stimulation effectiveness. Ultimately, based on the comprehensive evaluation indices of different schemes, two optimized hydraulic fracturing design solutions suitable for different types of deep coalbed methane reservoirs in the study area were identified.

4. Conclusions

Based on the characteristics of deep coalbed methane reservoirs in the eastern Ordos Basin of the Changqing Oilfield, geological, petrophysical, and geomechanical models were established. According to the distribution characteristics of the property fields and geomechanical parameter fields, two representative reservoir types were classified. By developing a numerical model of hydraulic fracture propagation, the dominant controlling factors governing hydraulic fracture growth in the two reservoir types were analyzed, and hydraulic fracturing treatment schemes were optimized. The main conclusions are as follows:
(1) During hydraulic fracture propagation, cleats in deep coalbed methane reservoirs are activated, resulting in three typical interaction modes. Hydraulic fractures may directly cross cleats, activate and open cleats, or be arrested and captured by cleats.
(2) For both reservoir types, the injected fluid volume per stage plays a dominant role in controlling fracture length, followed by injection rate and Section–cluster Ratio. Increasing the injected fluid volume per stage and injection rate can significantly enhance the average hydraulic fracture length in coalbed methane reservoirs.
(3) For both reservoir types, the injected fluid volume per stage exerts a dominant control on the total stimulated reservoir volume, followed by proppant concentration and injection rate. Increasing the injected fluid volume per stage and proppant concentration can markedly improve the hydraulic fracturing stimulation effectiveness of coalbed methane reservoirs.
(4) The comprehensive fracturing evaluation index indicates that, for Type I reservoirs in the study area, the optimal parameters are an injected fluid volume per stage of 2500 m3, a Section–cluster Ratio of 1.5, a proppant concentration of 19.8%, and an injection rate of 15.4 m3/min. For Type II reservoirs, the optimal parameters are an injected fluid volume per stage of 2500 m3, a Section–cluster Ratio of 1.0, a proppant concentration of 20%, and an injection rate of 16 m3/min.

Author Contributions

Conceptualization, methodology, software, validation, writing—original draft preparation, writing—review and editing: X.W.; formal analysis, investigation, resources, data curation: C.Z.; supervision, project administration, funding acquisition, visualization: S.Z. All authors have read and agreed to the published version of the manuscript.

Funding

This research received no external funding.

Data Availability Statement

Data is contained within the article.

Conflicts of Interest

The authors declare no conflicts of interest.

References

  1. Moore, T.A. Coalbed methane: A review. Int. J. Coal Geol. 2012, 101, 36–81. [Google Scholar] [CrossRef]
  2. Yong, Q. Progress on geological research of deep coalbed methane in China. Acta Pet. Sin. 2023, 44, 1791–1811. [Google Scholar] [CrossRef]
  3. Xu, F.; Hou, W.; Xiong, X.; Xu, B.; Wu, P.; Wang, H.; Feng, K.; Yun, J.; Li, S.; Zhang, L.; et al. The status and development strategy of coalbed methane industry in China. Pet. Explor. Dev. 2023, 50, 765–783. [Google Scholar] [CrossRef]
  4. Yong, Q.; Jian, S. On the fundamental issues of deep coalbed methane geology. Acta Pet. Sin. 2016, 37, 125–136. Available online: https://www.syxb-cps.com.cn/EN/10.7623/syxb201601013 (accessed on 30 July 2015).
  5. Su, X.; Lin, X.; Liu, S.; Zhao, M.; Song, Y. Geology of coalbed methane reservoirs in the Southeast Qinshui Basin of China. Int. J. Coal Geol. 2005, 62, 197–210. [Google Scholar] [CrossRef]
  6. Wei, H.; Song, L.; Yongzhou, L.; Yifan, P.; Dazhen, T.; Shuling, T.; Shu, T.; Hao, X.; Bin, Z.; Shida, C. Geological particularity and reservoir engineering response of deep coalbed methane. Acta Pet. Sin. 2023, 44, 1993–2006. [Google Scholar] [CrossRef]
  7. Li, S.; Tang, D.; Pan, Z.; Xu, H.; Tao, S.; Liu, Y.; Ren, P. Geological conditions of deep coalbed methane in the eastern margin of the Ordos Basin, China: Implications for coalbed methane development. J. Nat. Gas Sci. Eng. 2018, 53, 394–402. [Google Scholar] [CrossRef]
  8. Li, Y.; Wang, Y.; Ding, J.; Yu, J.; Wu, P.; Song, Y. Pore-Scale Permeability Characteristics of Deep Coalbed Methane Reservoirs. Energy Fuels 2024, 38, 16149–16158. [Google Scholar] [CrossRef]
  9. Ze, D.; Yuhui, H.; Xia, Y.; Bing, Z.; Yongshang, K. Concept and main characteristics of deep oversaturated coalbed methane reservoir. Acta Pet. Sin. 2023, 44, 1781–1790. [Google Scholar] [CrossRef]
  10. Ai, C.; Li, X.-X.; Zhang, J.; Jia, D.; Tan, W.-J. Experimental investigation of propagation mechanisms and fracture morphology for coalbed methane reservoirs. Pet. Sci. 2018, 15, 815–829. [Google Scholar] [CrossRef]
  11. Ai, D.; Zhao, Y.; Wang, Q.; Li, C. Crack propagation and dynamic properties of coal under SHPB impact loading: Experimental investigation and numerical simulation. Theor. Appl. Fract. Mech. 2020, 105, 102393. [Google Scholar] [CrossRef]
  12. Tan, P.; Jin, Y.; Yuan, L.; Xiong, Z.-Y.; Hou, B.; Chen, M.; Wan, L.-M. Understanding hydraulic fracture propagation behavior in tight sandstone–coal interbedded formations: An experimental investigation. Pet. Sci. 2019, 16, 148–160. [Google Scholar] [CrossRef]
  13. Cong, R.; Yang, R.; Jing, M.; Li, G.; Huang, Z.; Zhang, B. Experimental Investigation on Hydraulic Fracture Propagation Behaviors of Coal-Measure Thin Interbedded Rocks. Rock Mech. Rock Eng. 2024, 57, 9557–9573. [Google Scholar] [CrossRef]
  14. Wang, T.; Hu, W.; Elsworth, D.; Zhou, W.; Zhou, W.; Zhao, X.; Zhao, L. The effect of natural fractures on hydraulic fracturing propagation in coal seams. J. Pet. Sci. Eng. 2017, 150, 180–190. [Google Scholar] [CrossRef]
  15. Qiao, L.; Liu, E.; Sun, D.; Dong, Q.; Qiao, L.; Bai, X.; Wang, Z.; Su, X.; Wang, H.; Zhou, D. Numerical Investigation of Vertical Hydraulic Fracture Propagation and Fracturing Parameter Optimization in Deep Coalbed Methane Reservoirs. Processes 2025, 13, 909. [Google Scholar] [CrossRef]
  16. Chen, L.; Wang, Z.; Peng, X.; Yang, J.; Wu, P.; Lian, H. Modeling pressurized fracture propagation with the isogeometric BEM. Geomech. Geophys. Geo-Energy Geo-Resour. 2021, 7, 51. [Google Scholar] [CrossRef]
  17. Ma, J.; Li, X.; Yao, Q.; Tan, K. Numerical simulation of hydraulic fracture extension patterns at the interface of coal-measure composite rock mass with Cohesive Zone Model. J. Clean. Prod. 2023, 426, 139001. [Google Scholar] [CrossRef]
  18. Xiao, C.; He, J.; Meng, L.; Zhang, R.; Xiong, D. Equivalent Modeling and Simulation of Fracture Propagation in Deep Coalbed Methane. Energies 2025, 18, 4432. [Google Scholar] [CrossRef]
  19. Zhou, S.; Zhuang, X.; Rabczuk, T. Phase field method for quasi-static hydro-fracture in porous media under stress boundary condition considering the effect of initial stress field. Theor. Appl. Fract. Mech. 2020, 107, 102523. [Google Scholar] [CrossRef]
  20. Wang, H.; Zhou, D.; Zou, Y.; Zheng, P. Effect mechanism of seepage force on the hydraulic fracture propagation. Int. J. Coal Sci. Technol. 2024, 11, 43. [Google Scholar] [CrossRef]
  21. Xia, B.; Zhang, X.; Ma, Z.; Xu, X. Numerical simulation of multiple hydraulic fracture propagation in heterogeneous coal reservoirs based on combined finite-discrete element method. Front. Earth Sci. 2024, 12, 1411129. [Google Scholar] [CrossRef]
  22. Zhang, J.; Bian, X. Numerical simulation of hydraulic fracturing coalbed methane reservoir with independent fracture grid. Fuel 2015, 143, 543–546. [Google Scholar] [CrossRef]
  23. Wang, H.; Jie, Y.; Zhou, D.; Ma, X. Underground hydrogen storage in depleted gas reservoirs with hydraulic fractures: Numerical modeling and simulation. J. Energy Storage 2024, 97, 112777. [Google Scholar] [CrossRef]
  24. Chen, B.; Li, S.; Tang, D. Numerical simulation study on hydraulic fracture propagation of multi-cluster fracturing of horizontal well in deep fractured coal seams. Eng. Fract. Mech. 2025, 318, 110983. [Google Scholar] [CrossRef]
  25. Zhao, H.; Li, P.; Li, X.; Yao, W. Fracture propagation and evolution law of indirect fracturing in the roof of broken soft coal seams. Int. J. Coal Sci. Technol. 2024, 11, 4. [Google Scholar] [CrossRef]
  26. Tian, Z.; Xiong, Z.; Wei, Y.; Ma, S.; Hu, X. Numerical simulation of fracture propagation in deep coal seam reservoirs. Energy Sci. Eng. 2023, 11, 3559–3574. [Google Scholar] [CrossRef]
  27. Panwar, D.S.; Saxena, V.K.; Chaurasia, R.C.; Singh, A.K. Prospective evaluation of coal bed methane in Raniganj coal field, India. Energy Sources Part A Recovery Util. Environ. Eff. 2017, 39, 946–954. [Google Scholar] [CrossRef]
  28. Panwar, D.S.; Suman, S.; Singh, A.K.; Saxena, V.K.; Chaurasia, R.C. Assessment of hydrocarbon generation potential of bituminous coal from Raniganj Basin, India. Energy Sources Part A Recovery Util. Environ. Eff. 2020, 42, 824–834. [Google Scholar] [CrossRef]
  29. Niu, L.; Jiang, T.; Wang, D.; Li, S. Experimental Study on Dynamic Changes of Physical Properties in Deep Coalbed Methane Reservoirs. Geol. J. 2026. ahead of print. [Google Scholar] [CrossRef]
  30. Li, C.; Yang, Z.; Yan, X.; Wang, G.; Huang, D.; Lu, B.; Zhang, B.; Feng, S.; Wang, J.; Liu, C.; et al. Dynamic distribution patterns and release behavior of adsorbed gas/free gas during deep coalbed methane production. Fuel 2026, 407, 137310. [Google Scholar] [CrossRef]
  31. Panwar, D.S.; Chaurasia, R.C.; Saxena, V.K.; Singh, A.K.; Akanksha. Geochemical investigation of hydrocarbon generation potential of coal from Raniganj Basin, India. J. Pet. Explor. Prod. Technol. 2021, 11, 3627–3636. [Google Scholar] [CrossRef]
Figure 1. Structural and property models of the study area (including porosity, permeability, and gas saturation).
Processes 14 00560 g001
Figure 2. Geomechanical parameter model of the study area.
Processes 14 00560 g002
Figure 3. Workflow of hydraulic fracture propagation model construction for Well M24.
Processes 14 00560 g003
Figure 4. Fitting results of monitored hydraulic fracturing treatment curves for Well M24.
Processes 14 00560 g004
Figure 5. Comparison of hydraulic fracture propagation patterns under different Section–cluster Ratios in Type I reservoirs.
Processes 14 00560 g005
Figure 6. Simulated fracture width distributions under different Section–cluster Ratios in Type I reservoirs.
Processes 14 00560 g006
Figure 7. Comparison of hydraulic fracture propagation patterns under different injected fluid volumes in Type I reservoirs.
Processes 14 00560 g007
Figure 8. Comparison of hydraulic fracture propagation patterns under different proppant concentrations in Type I reservoirs.
Processes 14 00560 g008
Figure 9. Comparison of hydraulic fracture propagation geometries in Type I reservoirs under different injection rates.
Processes 14 00560 g009
Figure 10. Range analysis results of average fracture length and stimulated reservoir volume under different influencing factors in Type I reservoirs.
Processes 14 00560 g010
Figure 11. Comparison of hydraulic fracture propagation patterns under different Section–cluster Ratios in Type II reservoirs.
Processes 14 00560 g011
Figure 12. Comparison of hydraulic fracture propagation patterns under different injected fluid volumes per stage in Type II reservoirs.
Processes 14 00560 g012
Figure 13. Comparison of hydraulic fracture propagation patterns under different proppant concentrations in Type II reservoirs.
Processes 14 00560 g013
Figure 14. Comparison of hydraulic fracture propagation patterns under different injection rates in Type II reservoirs.
Processes 14 00560 g014
Figure 15. Range analysis results of average fracture length and total stimulated reservoir volume under different factors for Type II reservoirs.
Processes 14 00560 g015
Figure 16. Comprehensive hydraulic fracturing evaluation index for different simulation cases of Well M24 in Type I reservoirs.
Processes 14 00560 g016
Figure 17. Comprehensive hydraulic fracturing evaluation index for different simulation schemes of Well M125 in Type II reservoirs.
Processes 14 00560 g017
Table 1. Hydraulic fracturing simulation schemes and results for Type I reservoirs.
Case No.Section–Cluster RatioInjected Fluid Volume/m3Proppant Concentration/%Injection Rate/m3/minAverage Fracture Length/mTotal Stimulated Reservoir Volume/m3Average Fracture Conductivity/mD·m
12186019.815.4204.277633753.47
21186019.815.4172.816722614.58
31.5186019.815.4194.077790677.38
42.5186019.815.4210.857344752.71
51.5100019.815.4152.633326507.39
61.5150019.815.4167.005994672.22
71.5200019.815.4184.758774867.49
81.5250019.815.4199.7510,341856.46
91.520001015.4200.816299436.96
101.520001515.4197.317635593.50
111.520002015.4198.508697788.81
121.520002515.4199.558355839.17
131.5200019.812186.197828892.60
141.5200019.814224.938334857.53
151.5200019.816197.408915790.92
161.5200019.818195.099027748.11
Table 2. Hydraulic fracturing simulation schemes and results for Type II reservoirs.
Case No.Section–Cluster RatioInjected Fluid Volume/m3Proppant Concentration/%Injection Rate/m3/minAverage Fracture Length/mTotal Stimulated Reservoir Volume/m3Average Fracture Conductivity/mD·m
1110002016177.843052874.21
2115002016224.5741341078.93
3120002016256.0355432257.21
4125002016263.4365221458.99
5120001016266.223698583.94
6120001516262.044557913.08
7120002016265.8254231354.02
8120002516236.7862971667.77
9120002012223.5051841566.21
10120002014249.1859591857.74
11120002016249.6264941740.51
12120002018245.2658341553.98
1311997.3319.616240.7055261371.73
141.51997.3319.616254.0545791191.24
1521997.3319.616266.6248261178.14
162.51997.3319.616257.4752051321.55
Disclaimer/Publisher’s Note: The statements, opinions and data contained in all publications are solely those of the individual author(s) and contributor(s) and not of MDPI and/or the editor(s). MDPI and/or the editor(s) disclaim responsibility for any injury to people or property resulting from any ideas, methods, instructions or products referred to in the content.