3.1. Combustion, Performance and Emission Analysis
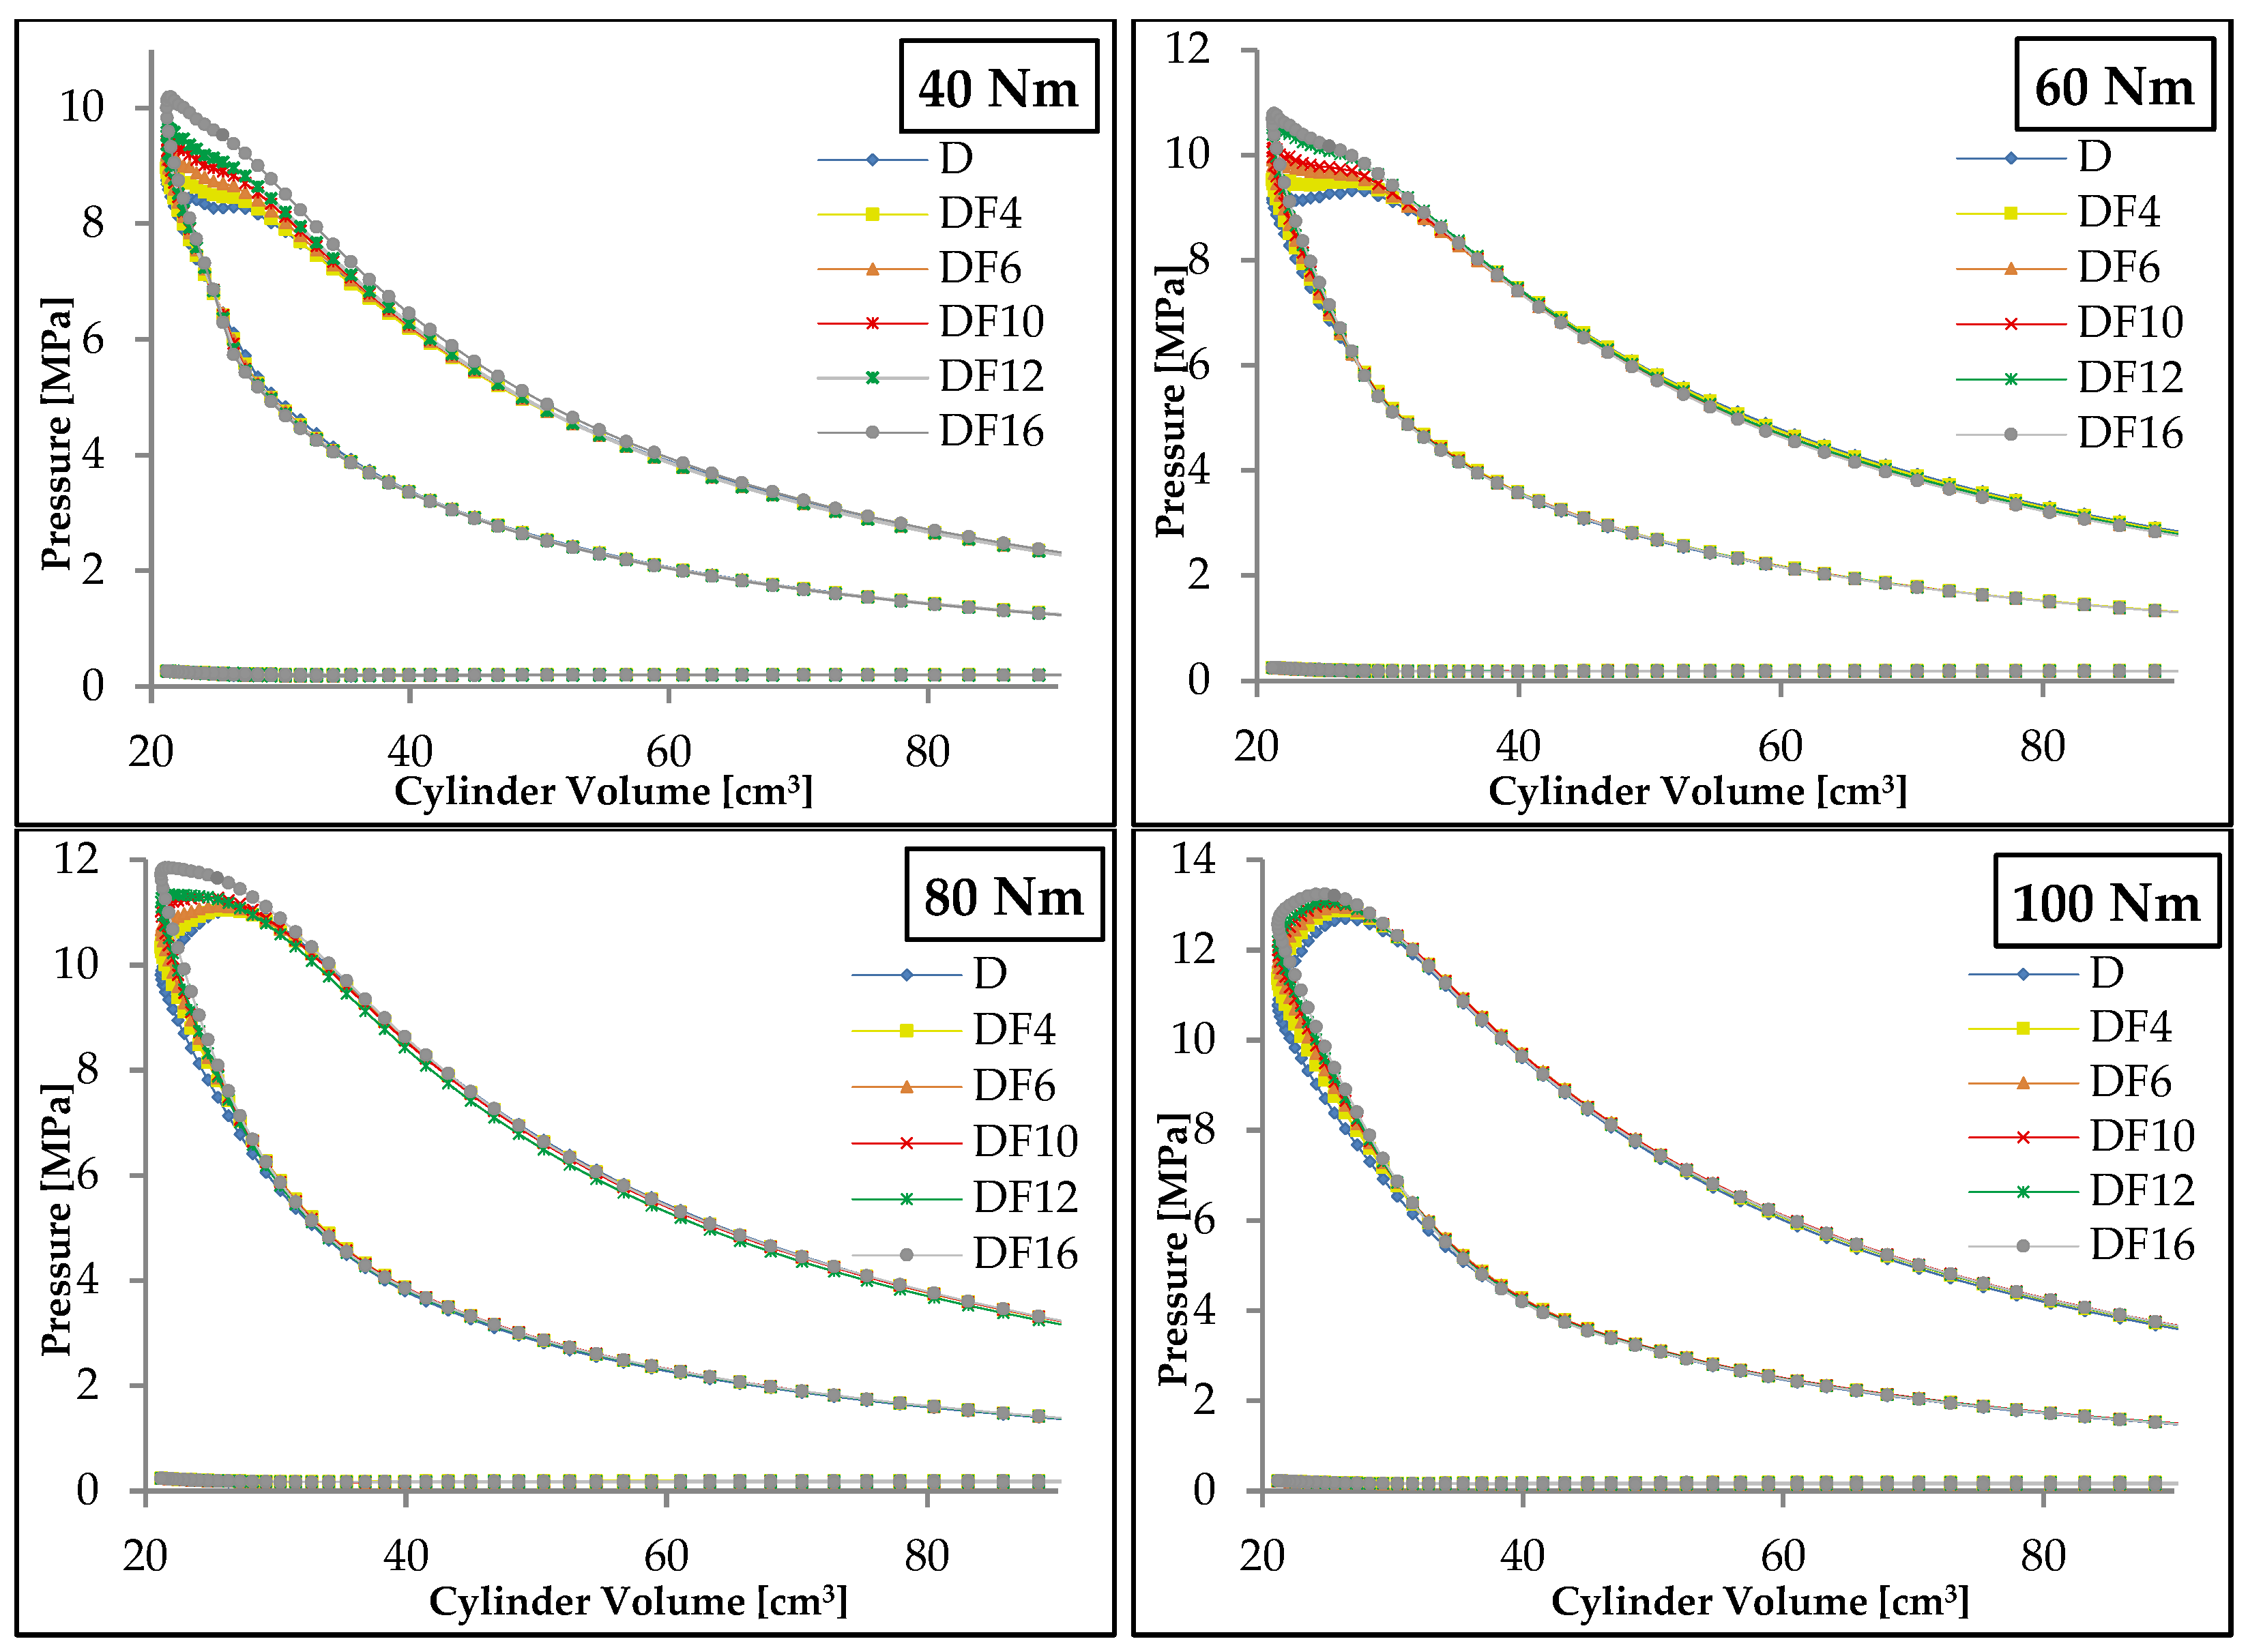
Figure 2 shows the cylinder pressure values with respect to cylinder volumes for tested engine loads. Additionally, maximum cylinder pressures (CP
max) and the CA values at which these pressures occur are provided in
Table 4. As can be seen, cylinder pressures increased with load. At a load of 40 Nm, maximum cylinder pressures occurred near TDC. This was due to the low amount of fuel delivered to the cylinder during the main injection phase. However, the increase in the amount of fuel delivered to the cylinder during the main injection phase due to the increased load caused the maximum cylinder pressures to move away from TDC. As the amount of fuel burned during the pilot combustion phase increased, the amount of diesel fuel burned during the main combustion phase decreased. Therefore, as the fusel oil amount increased, maximum pressures occurred near TDC. The combustion of the pre-mixed fusel oil–air mixture ignited by the pilot diesel fuel in a small chamber increased cylinder pressure. As the energy share of the fusel oil decreased, the amount of diesel fuel burned during the main combustion phase increased. Thus, maximum cylinder pressures moved away from TDC. The decrease in energy share reduced the effect of fusel oil on cylinder pressures. At 100 Nm engine load, this effect shifted the point at which maximum pressures occur by 1–2 CA while increasing maximum cylinder pressure by 1–4%.
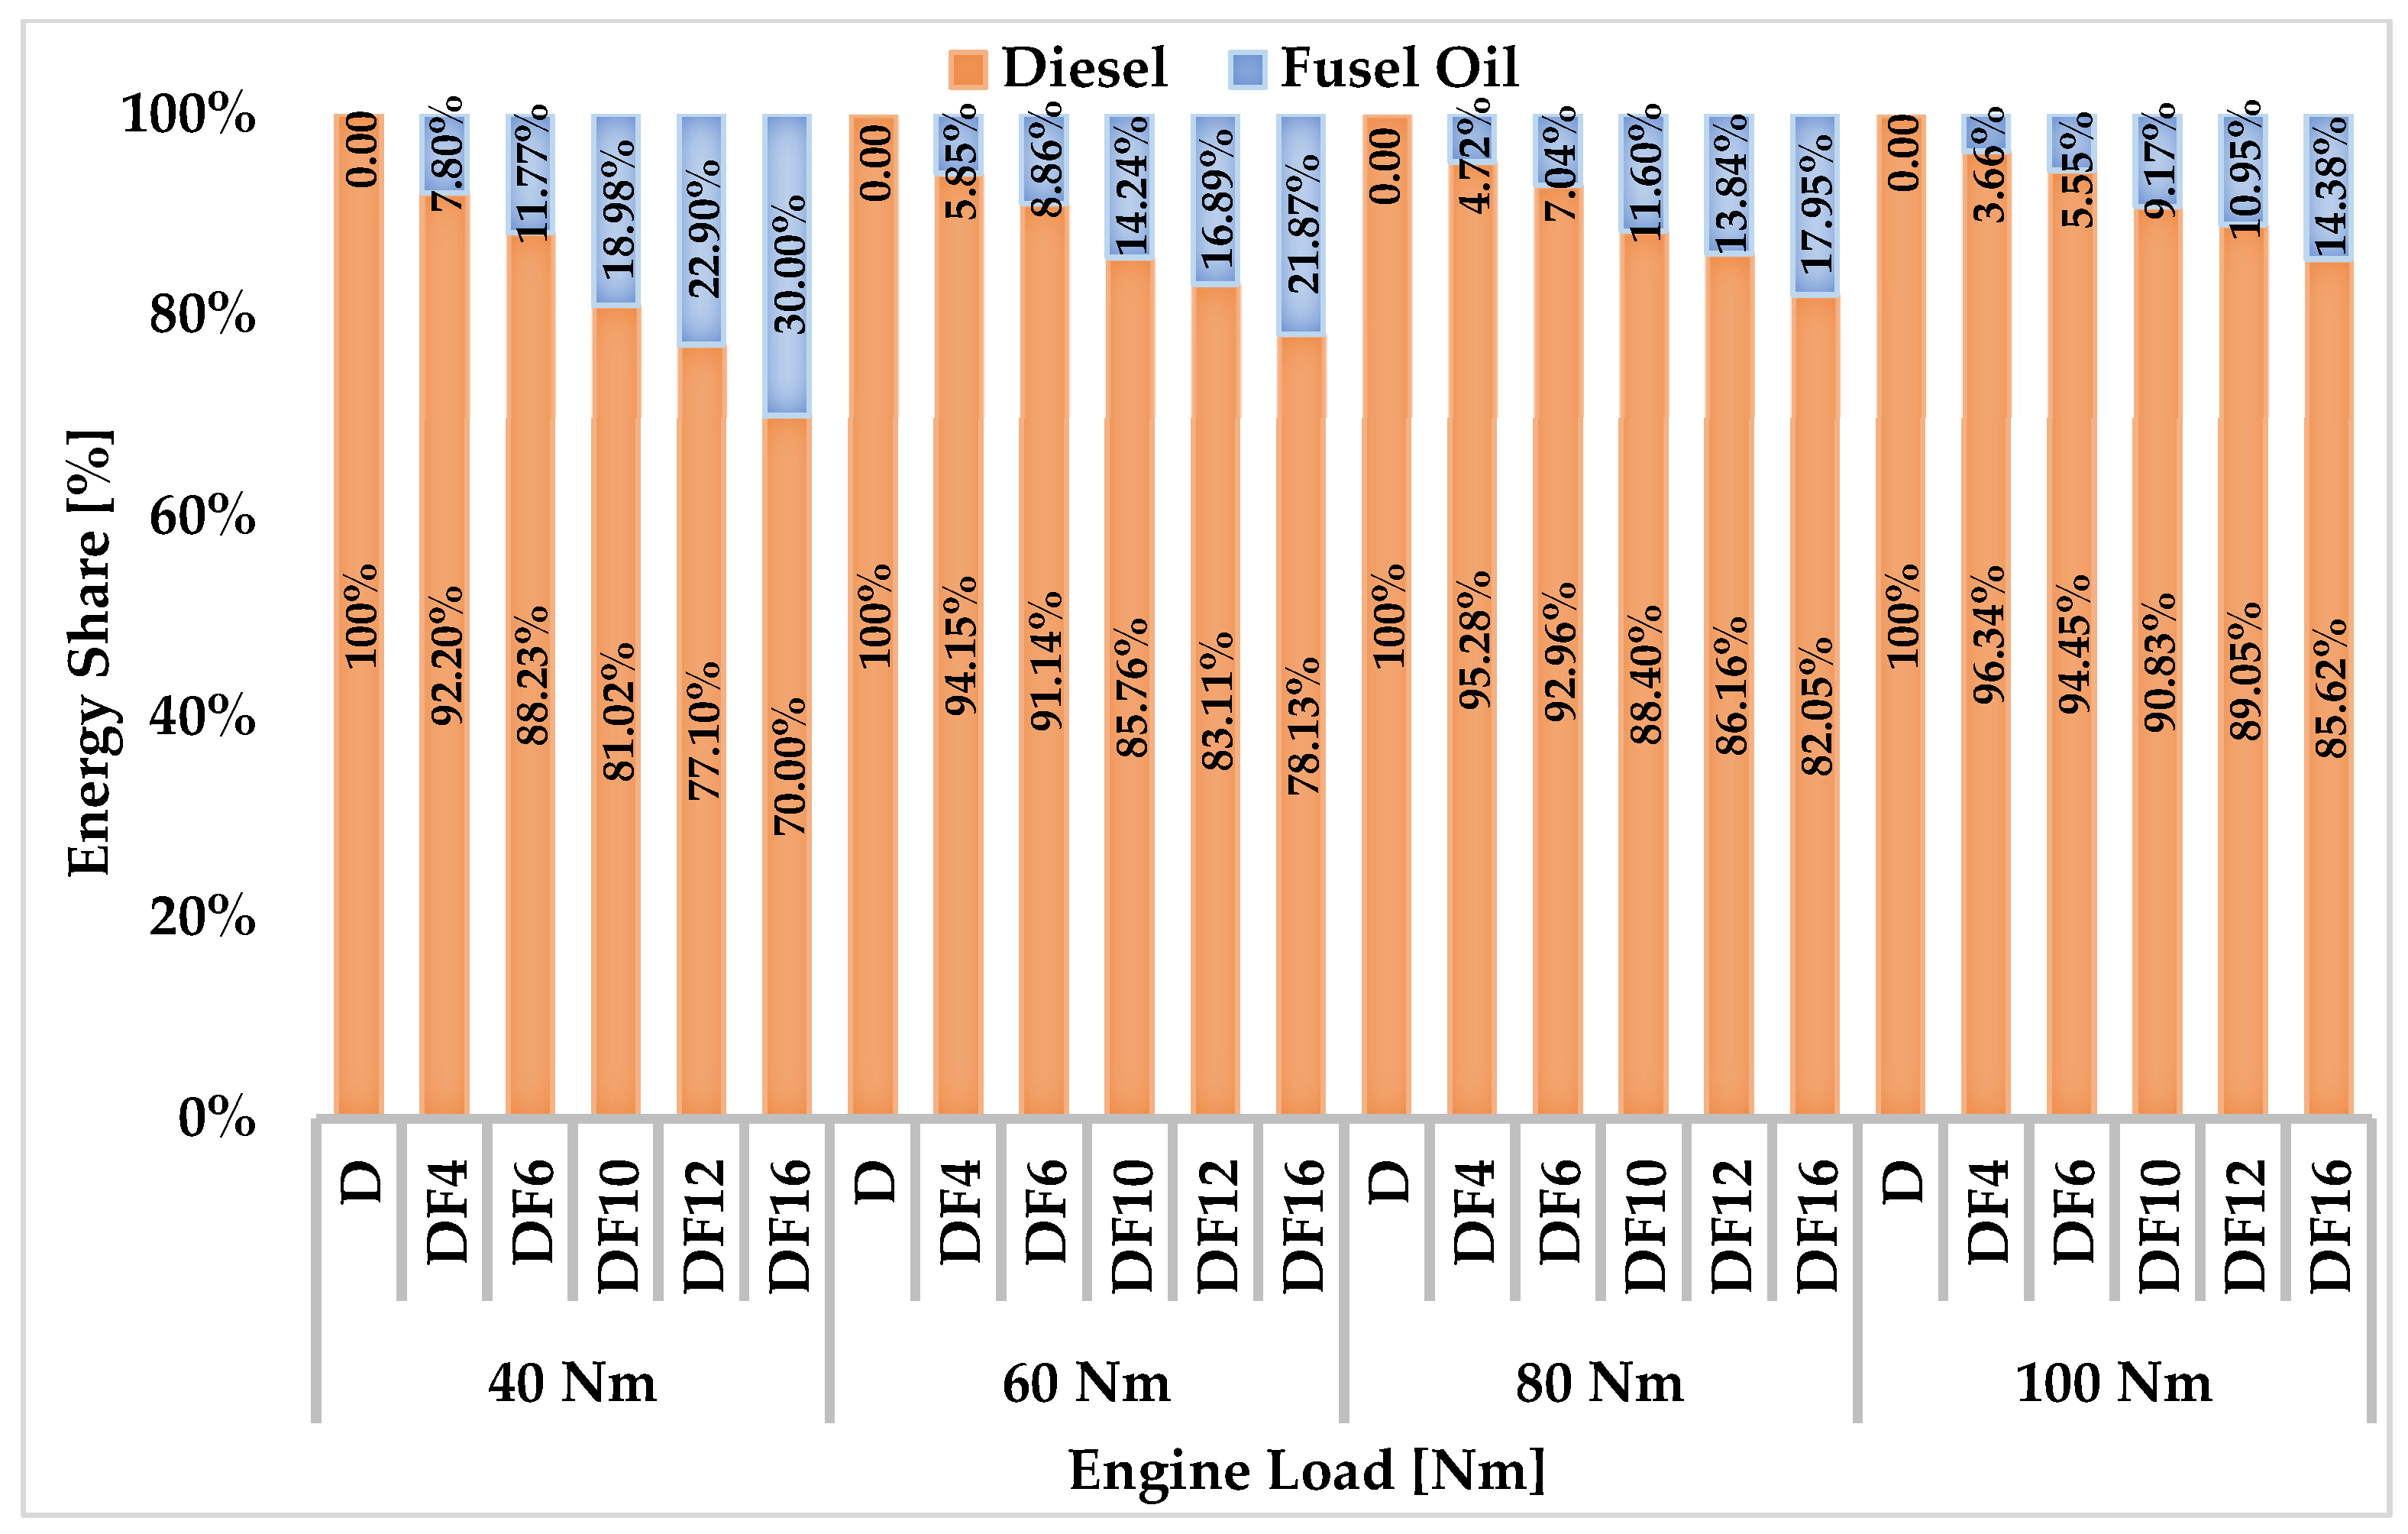
The energy shares of the test fuels can be seen in
Figure 3. The highest fusel oil energy share was observed in DF16 at a motor load of 40 Nm. Engine stability was unable to be maintained at a fusel oil mass flow rate exceeding 16 g/min. Fusel oil energy shares decreased in line with the increased engine load. This was due to the constant mass flow rates of fusel oil for each test condition. Increasing the fusel oil ratio to meet the engine’s energy requirements increased the maximum cylinder pressure rise rates. Thus, the test engine began to run noisily and unstably.
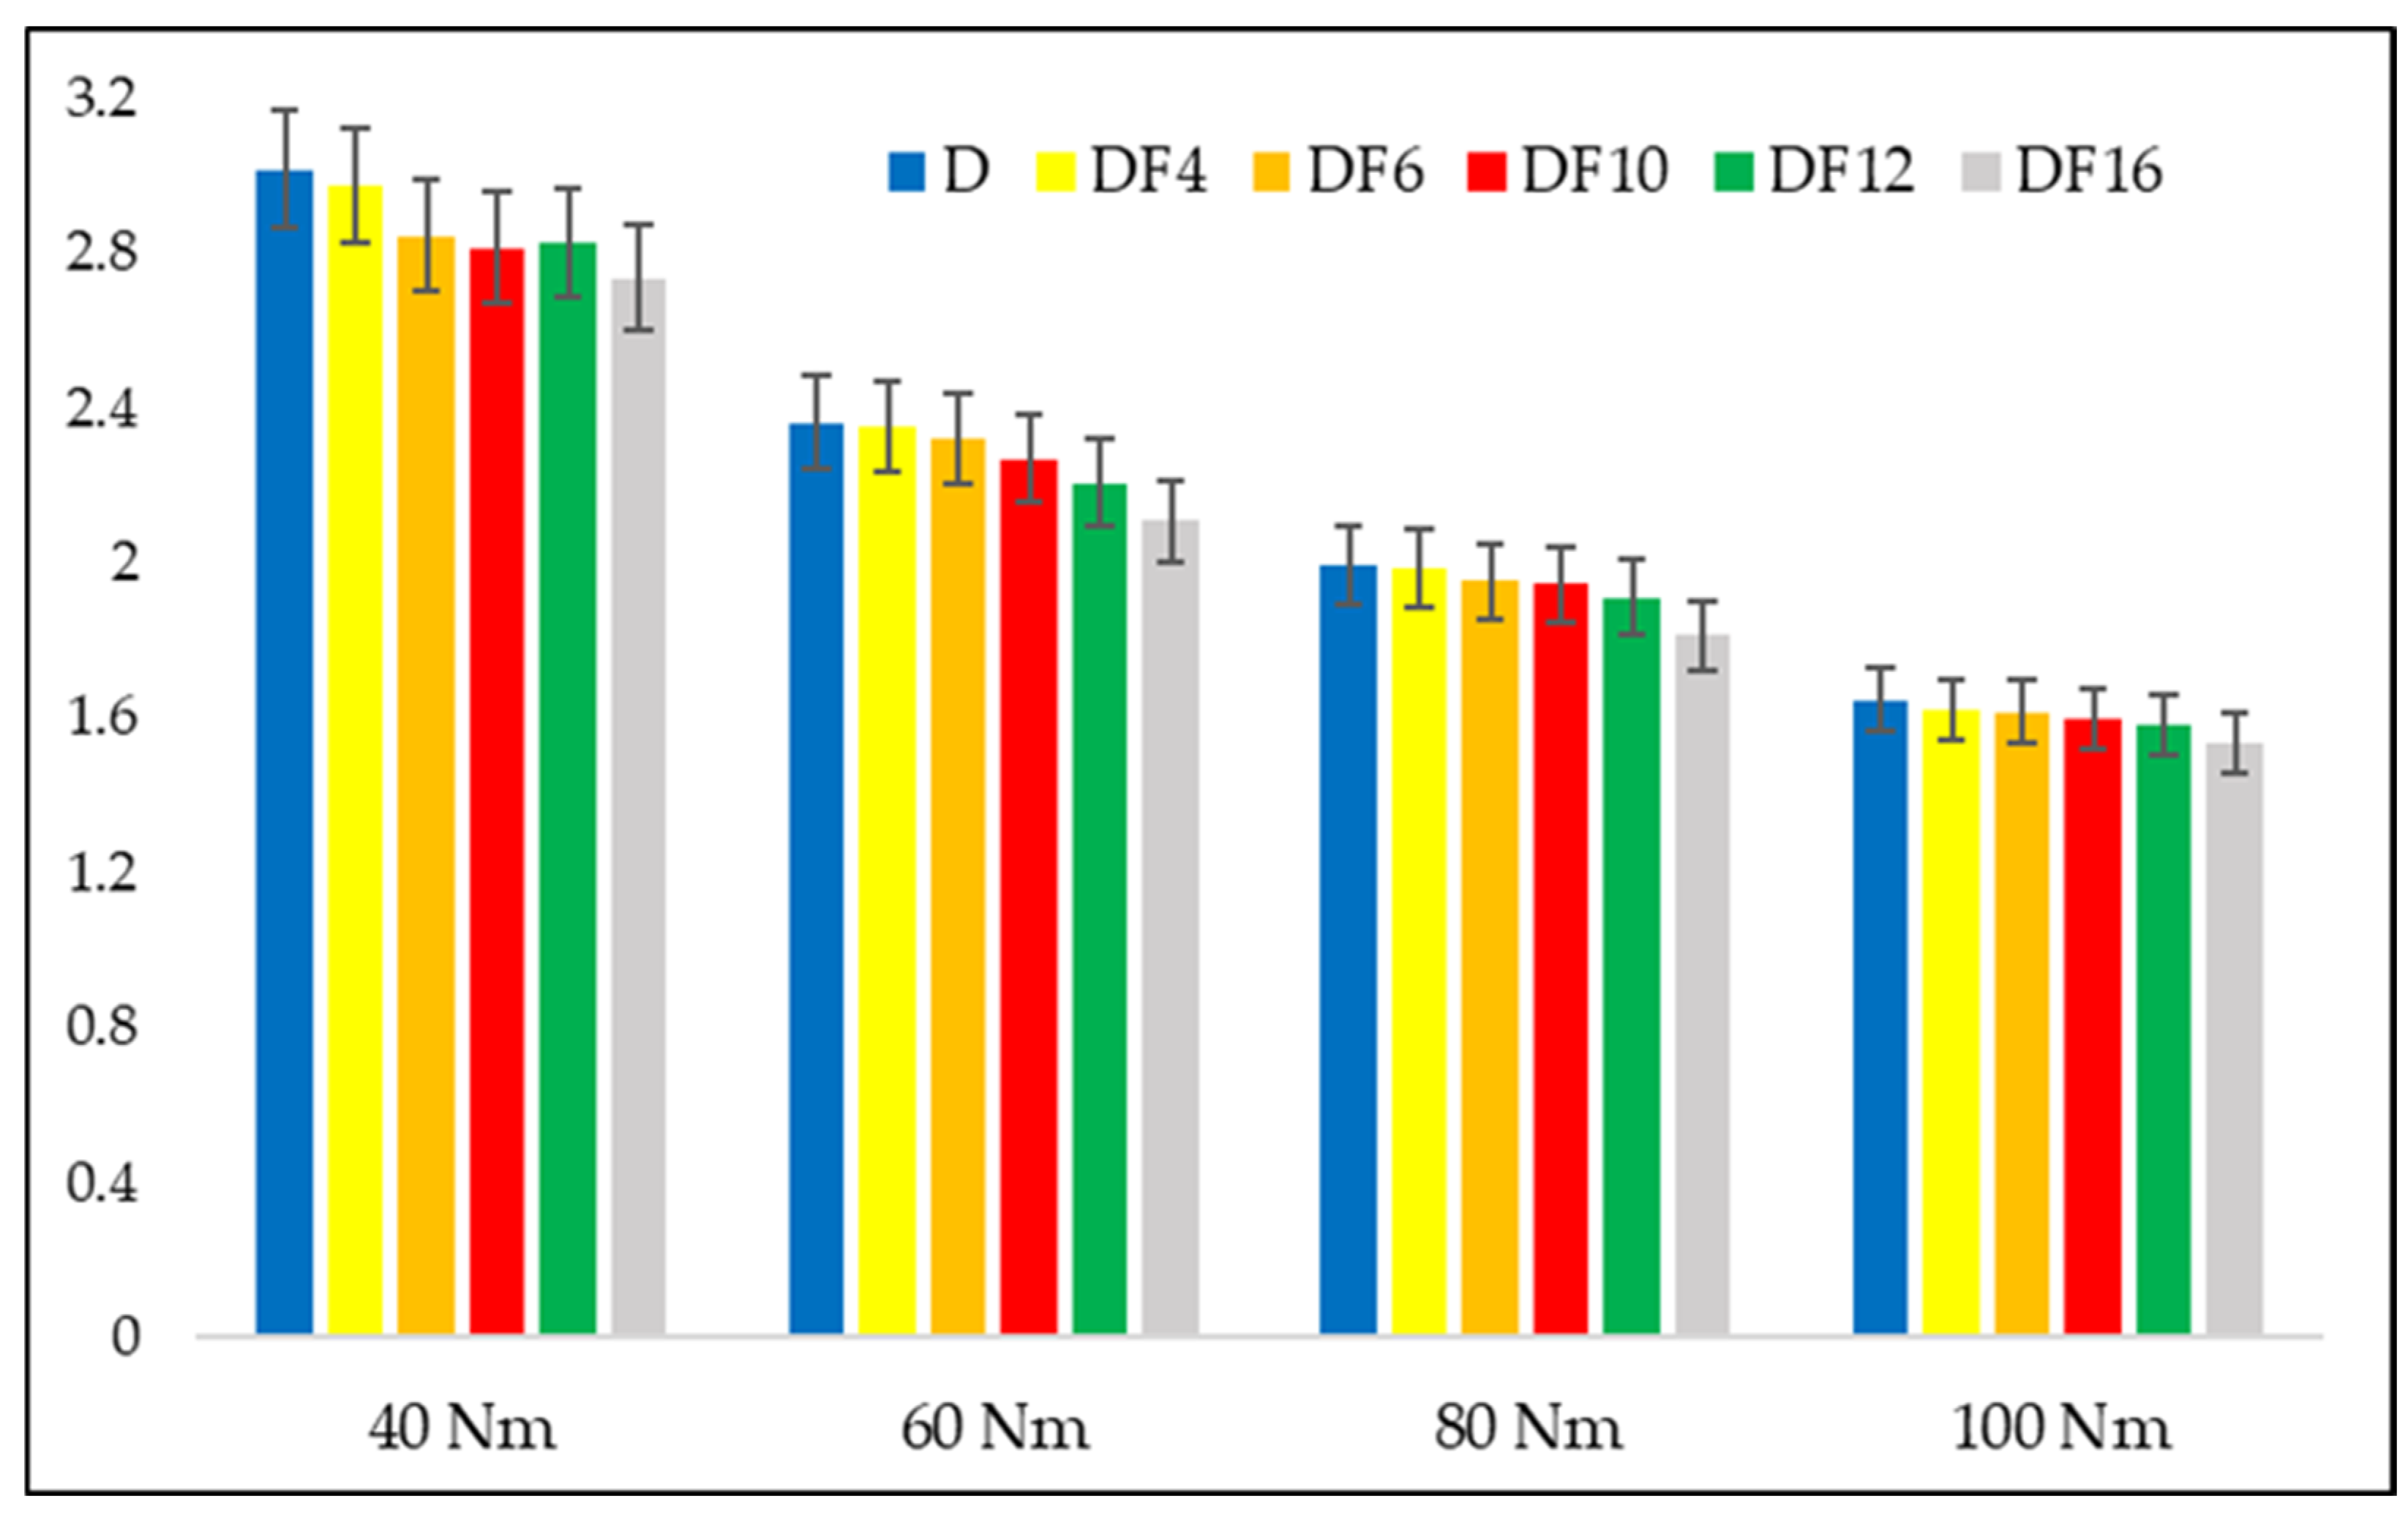
Figure 4 shows the lambda values for all tests. Lambda is the ratio of the actual air–fuel ratio to the theoretical air–fuel ratio. Lambda values decreased with increasing engine load. Although turbocharger efficiency was lower at high engine loads, the lambda value was high at low engine loads. Due to this, the engine could reach the target load of 40 Nm with less fuel mass. Accordingly, more fuel was sent to the cylinders to achieve higher loads. Thus, cylinder temperatures, exhaust gas enthalpy, and turbocharger efficiency increased. On the other hand, increased fuel mass decreased lambda values. The theoretical air–fuel ratio of fusel oil was lower than that of diesel fuel. However, due to the low heating value of fusel oil, more fusel oil was sent to meet the engine’s energy requirements. The lambda values obtained in the DF 16 tests decreased by approximately 10% compared to the tests conducted with diesel fuel under other test conditions, except for the 100 Nm engine load test. The decrease under the 100 Nm test condition was approximately 7%.
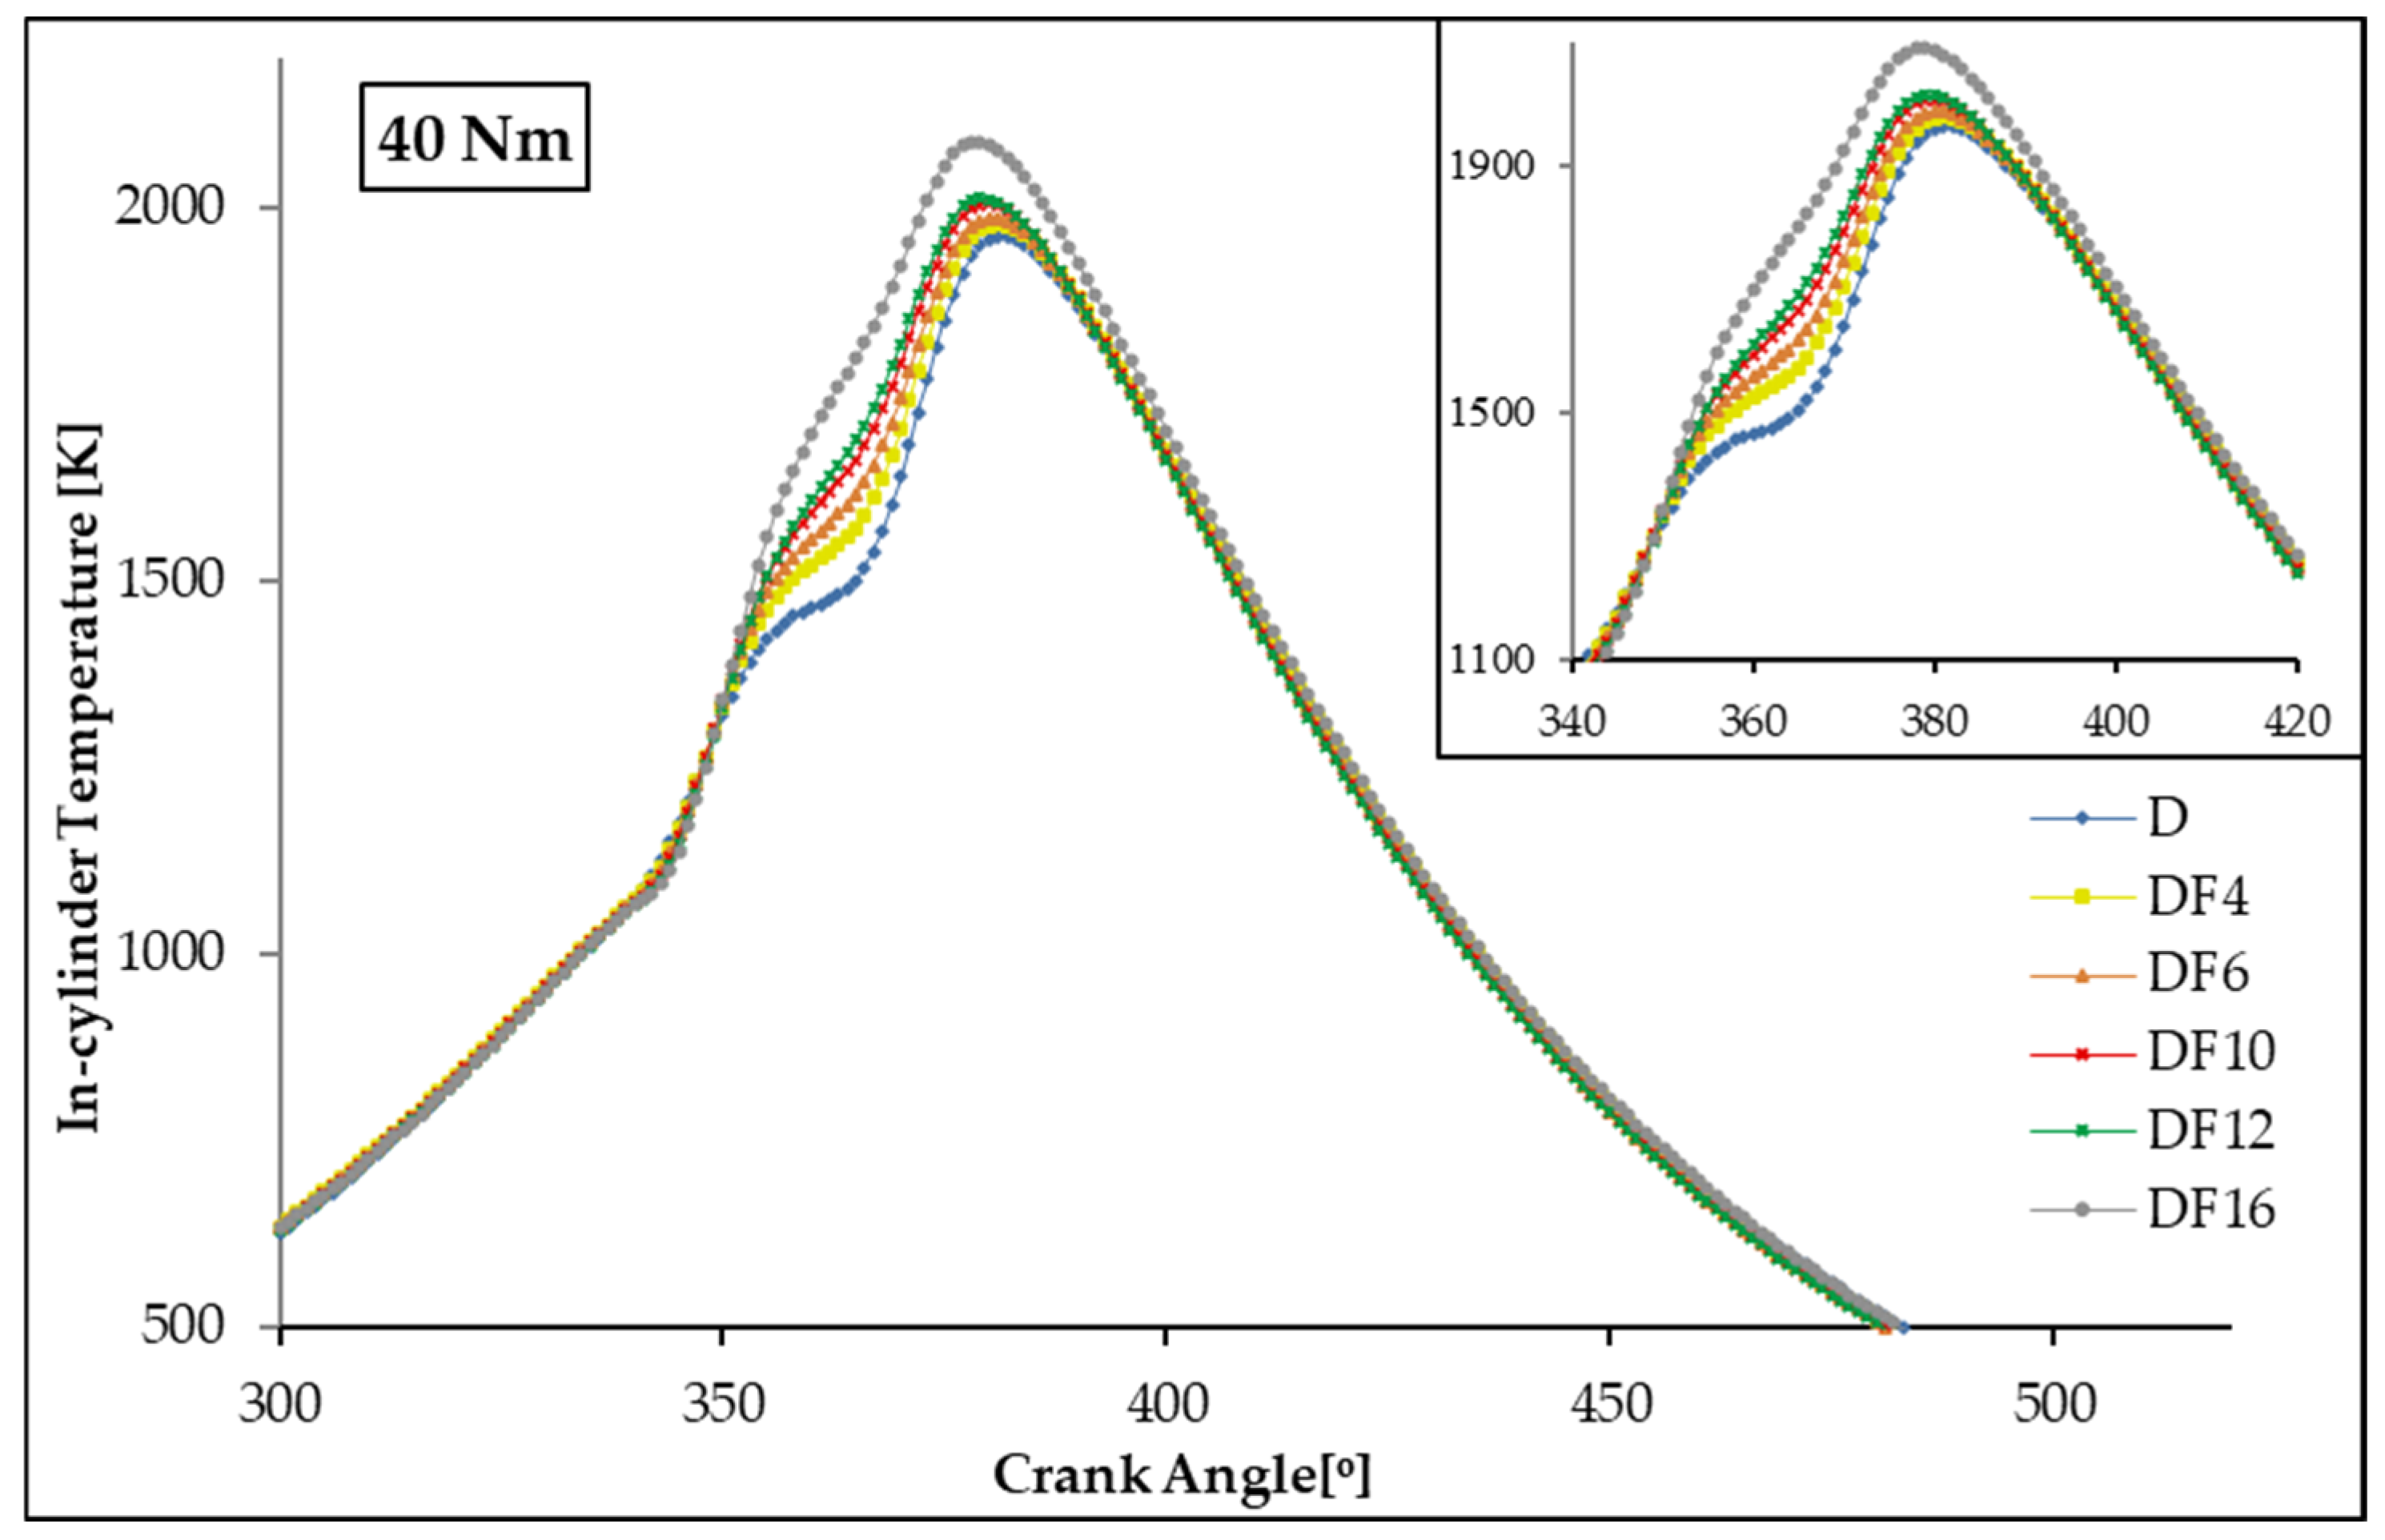
Figure 5 shows the cylinder temperature changes occurring at 40 Nm load under different fuels. The maximum cylinder temperatures were 1962 K at 381 °CA with D and 2088 K at 378 °CA with DF16. Analysis of the data revealed that the maximum cylinder temperatures increased by 6.43% with DF16 compared to when the engine was running on pure diesel fuel.
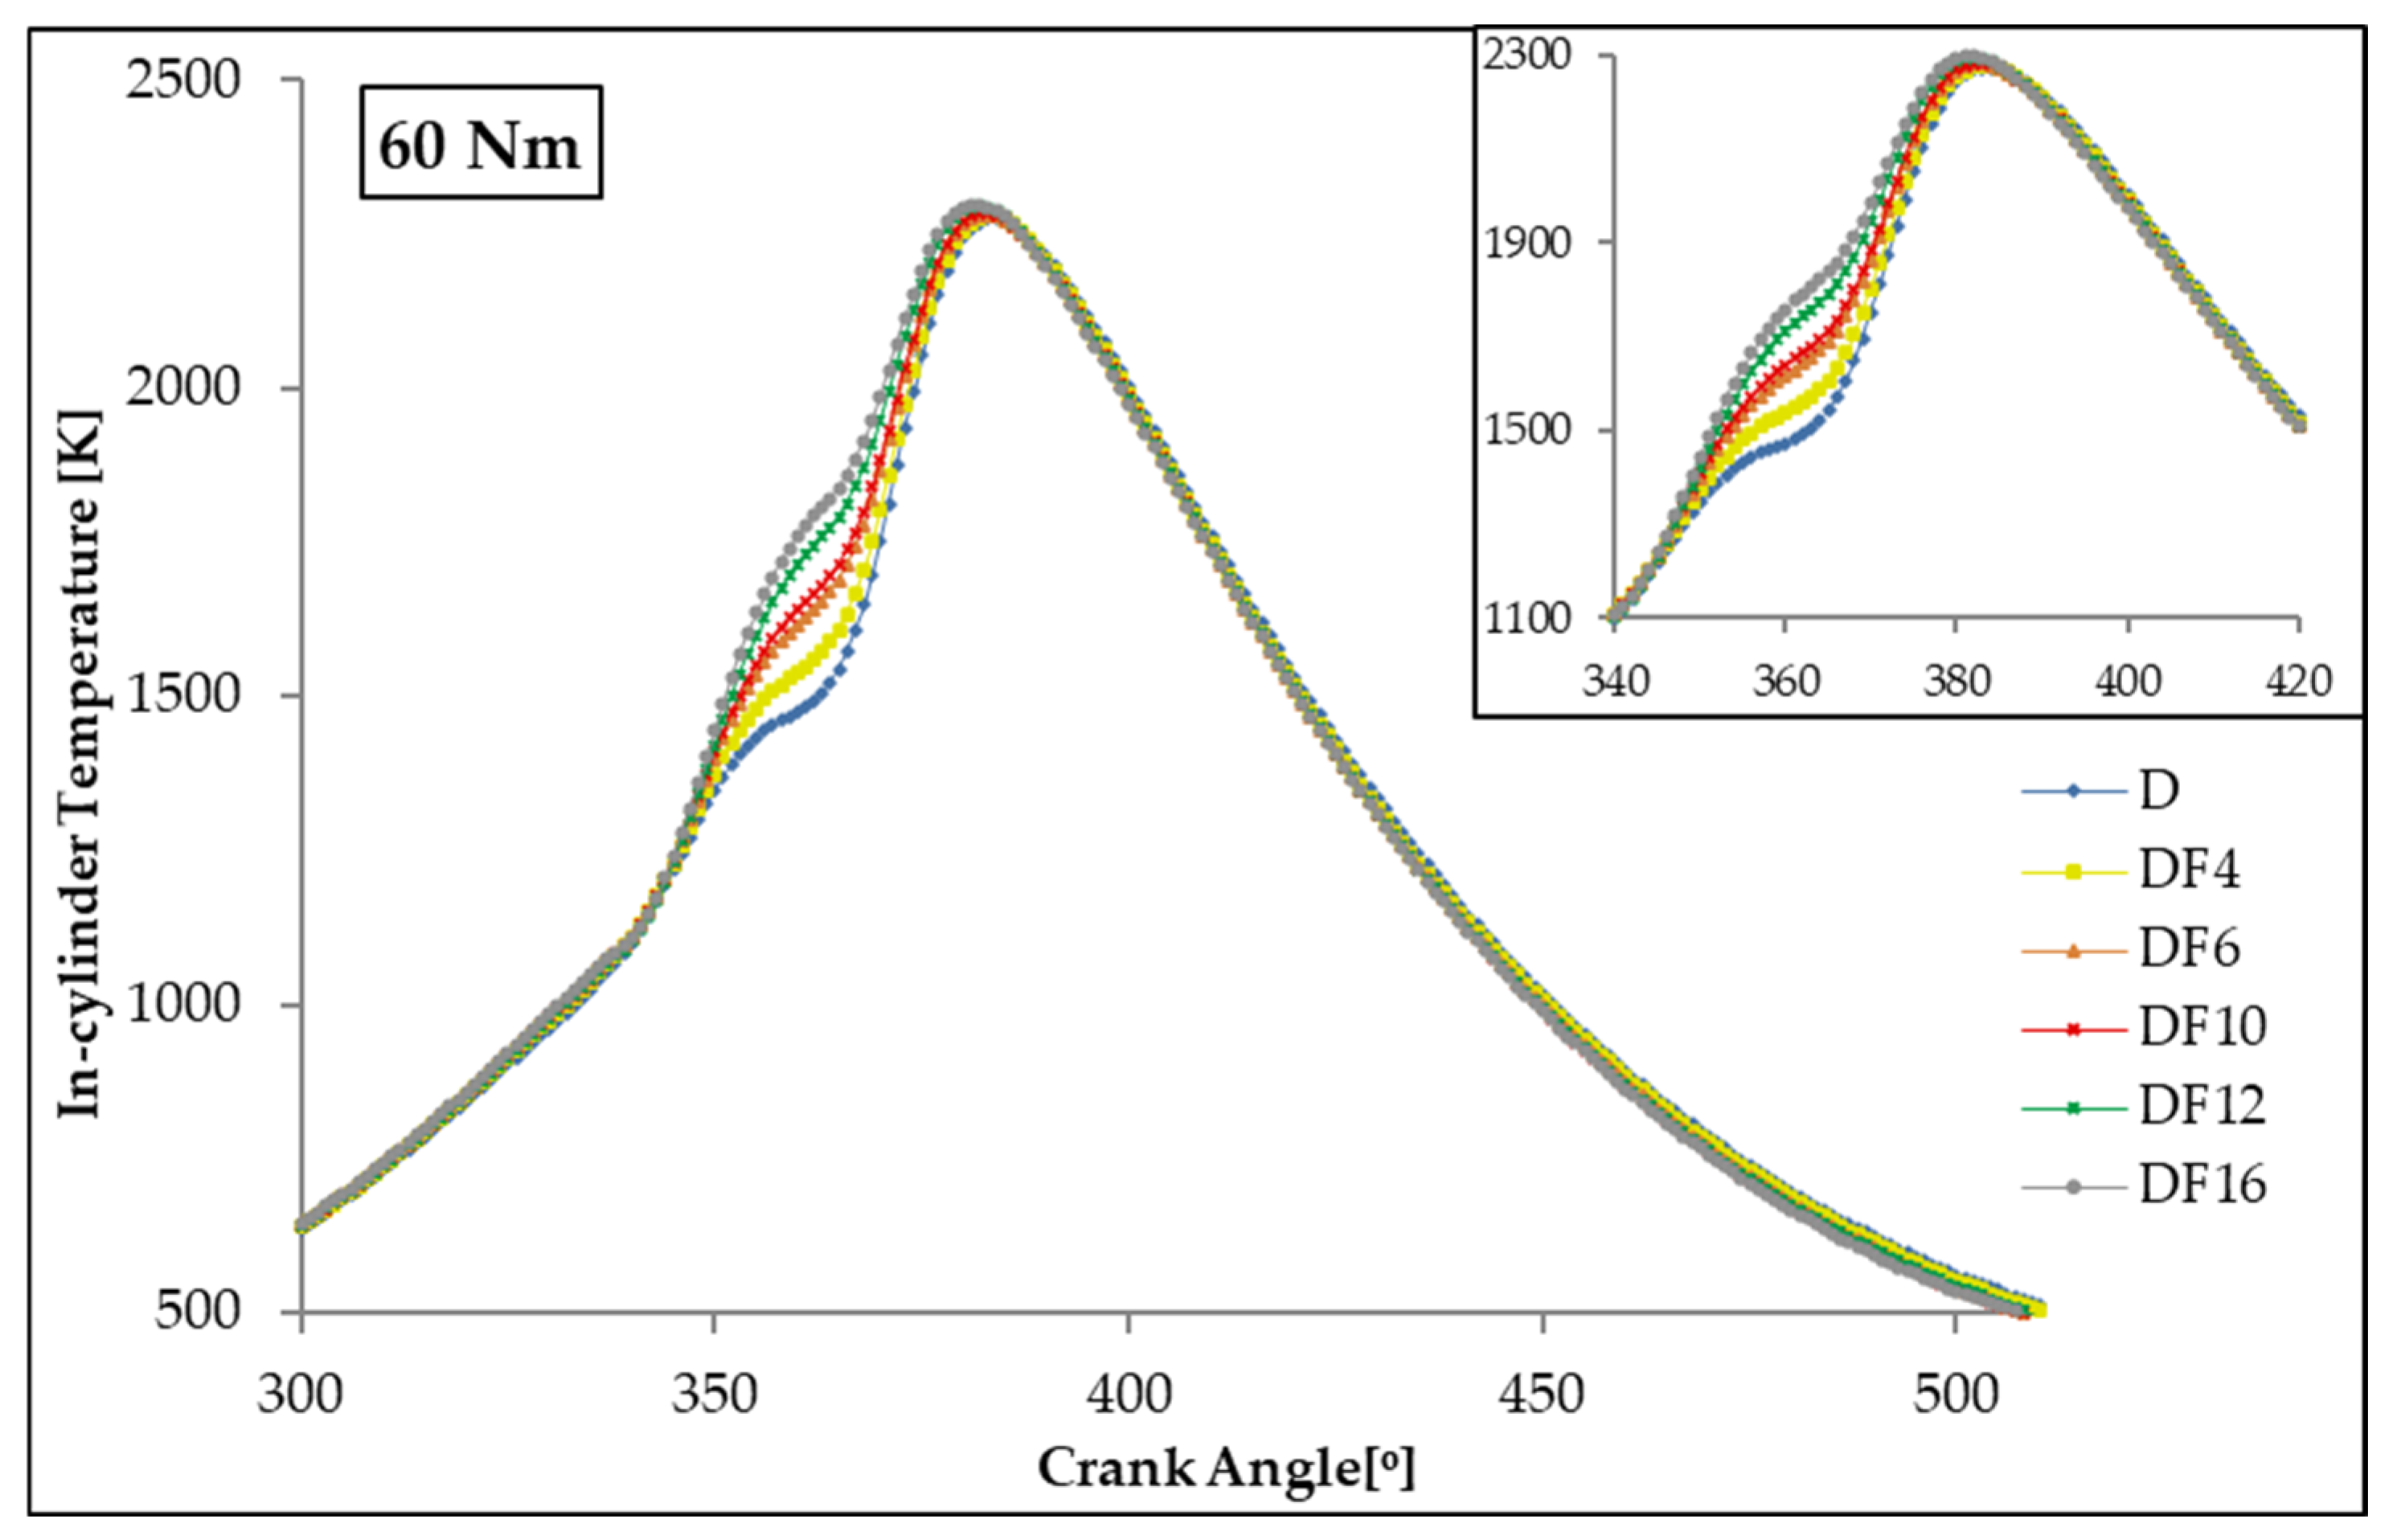
Maximum cylinder temperatures occurring under 60 Nm load with different fuels were measured as 2273 K at 384 °CA with D and 2296 K at 382 °CA with DF16. Analysis of the data revealed that maximum cylinder temperatures with DF16 increased by 1.02% compared to when the engine was running on diesel fuel only.
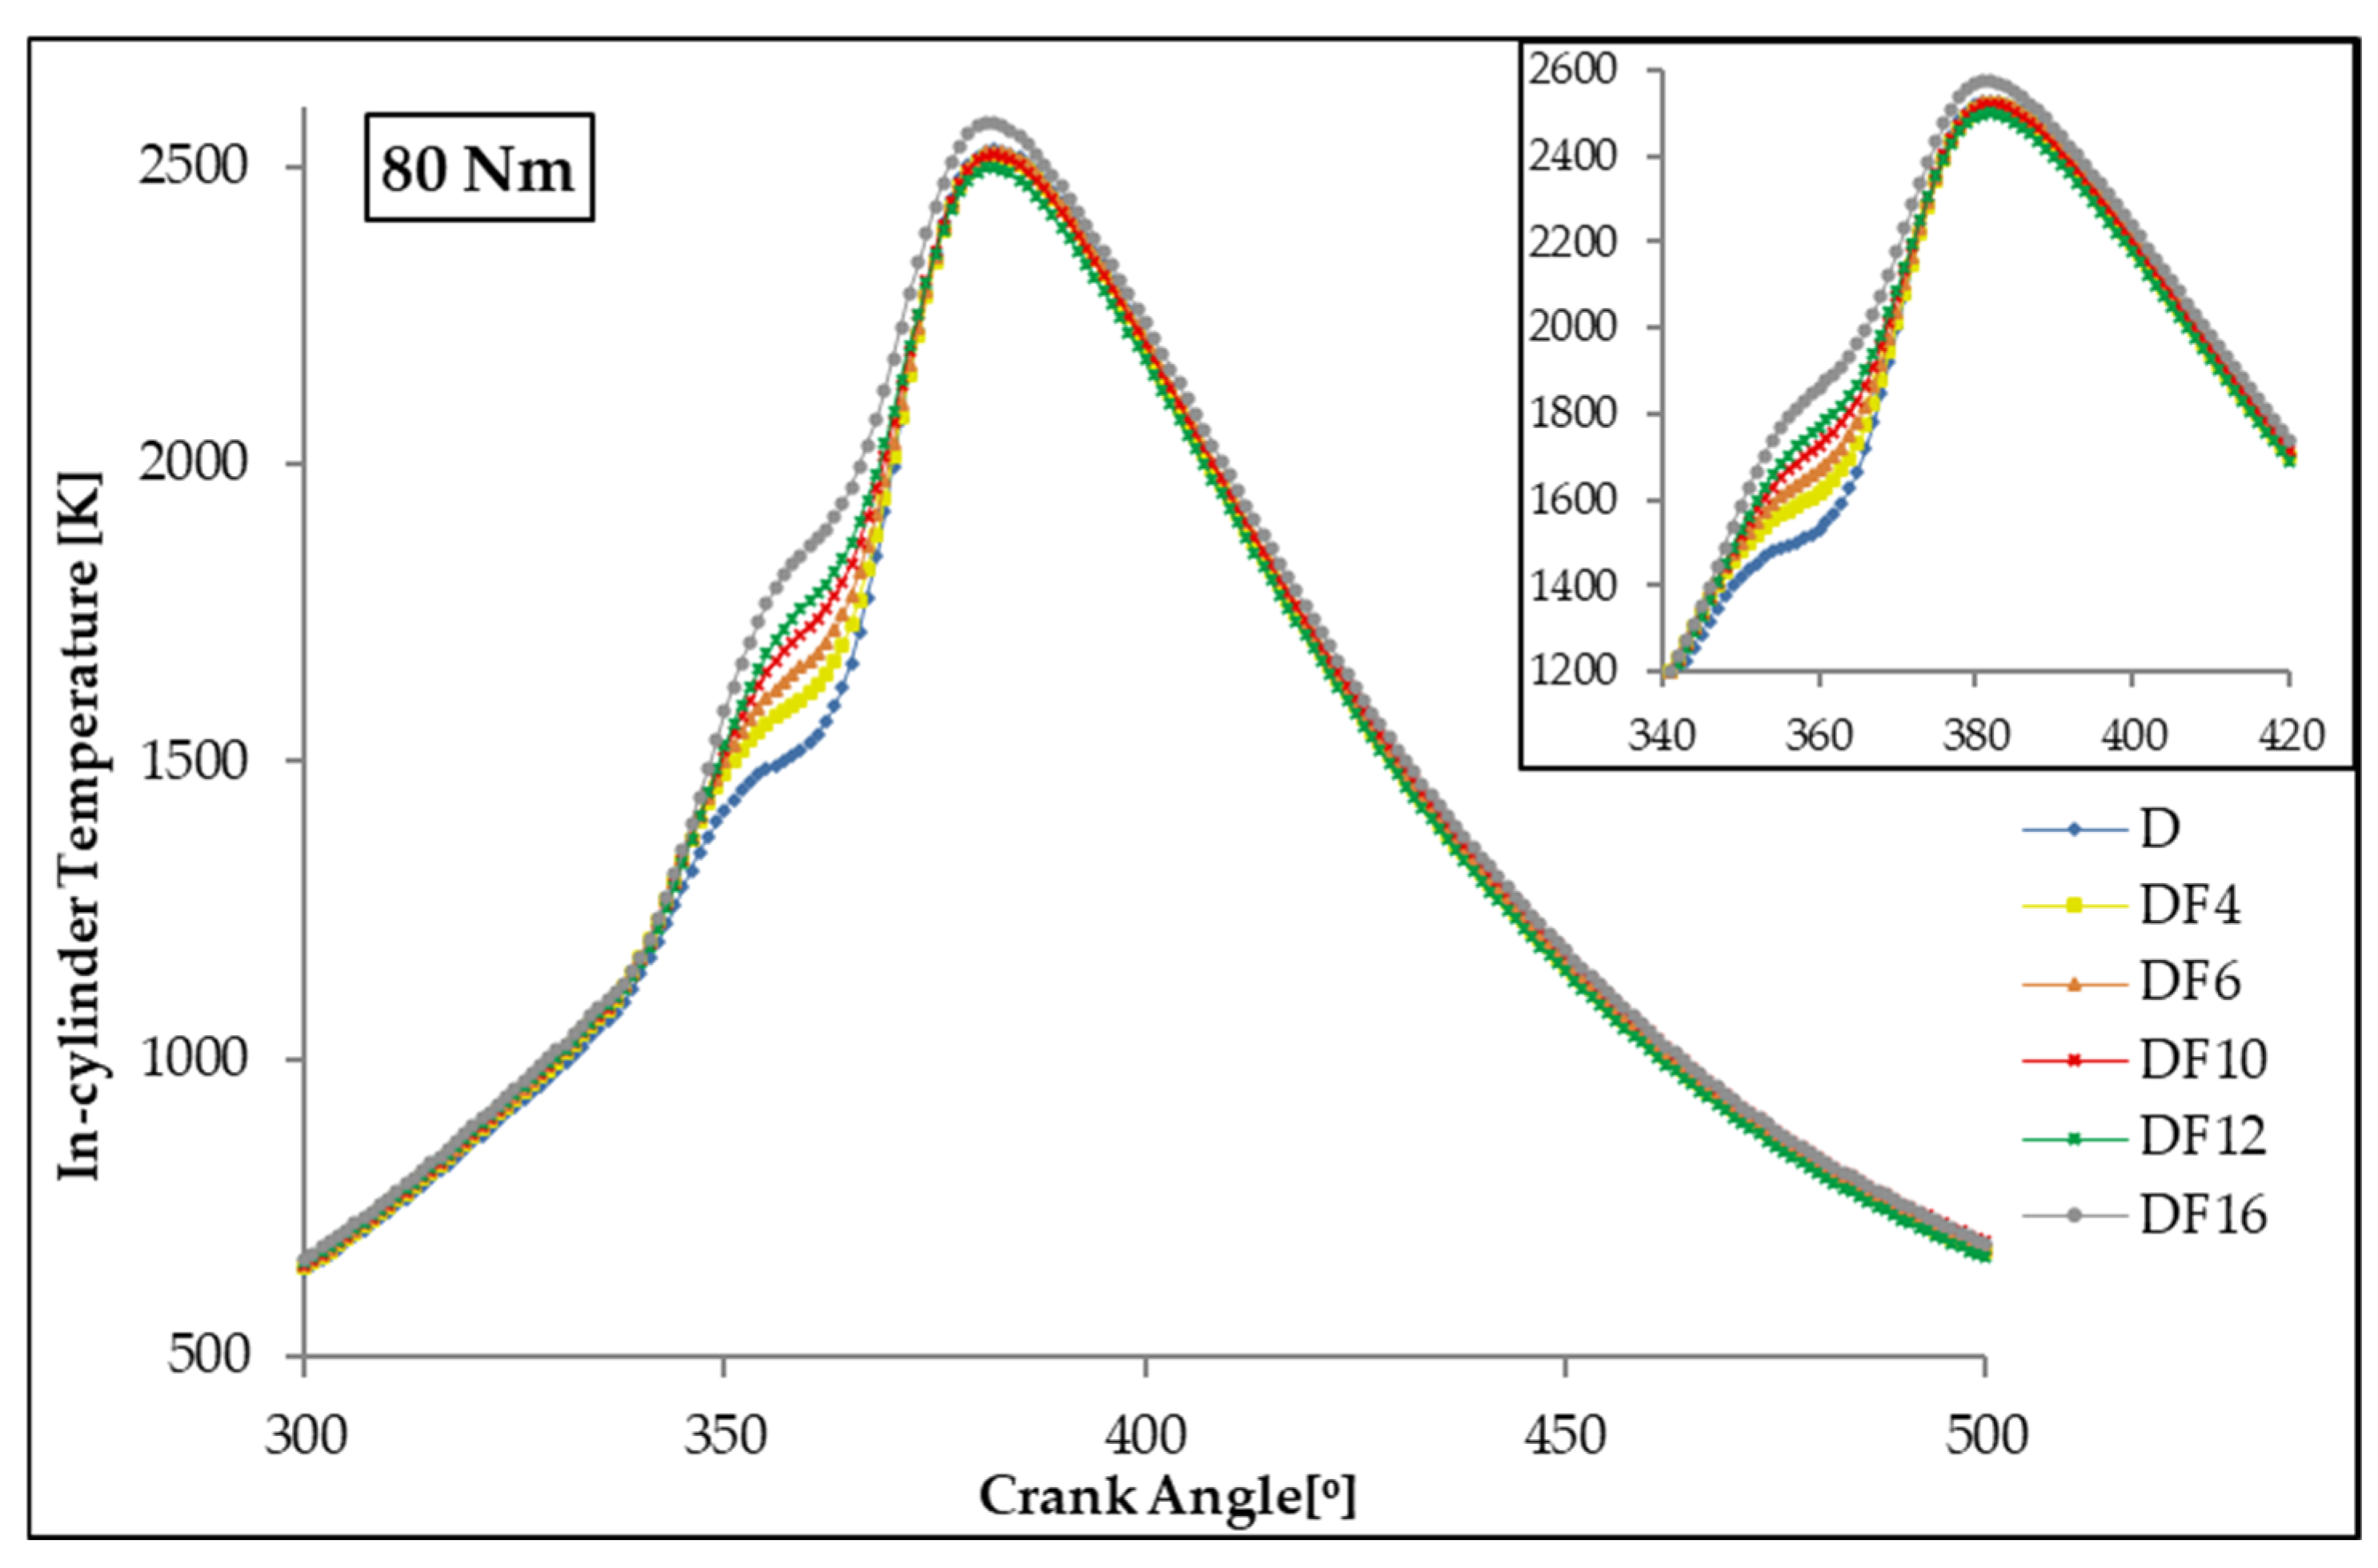
At a load of 80 Nm, the maximum cylinder temperatures occurring with different fuels were measured at 382 °CA, 2527 K in D, and 2573 K in DF16. Upon analysis of the data, it was determined that the maximum cylinder temperatures with DF16 increased by 1.02% compared to when the engine was running solely on diesel fuel.
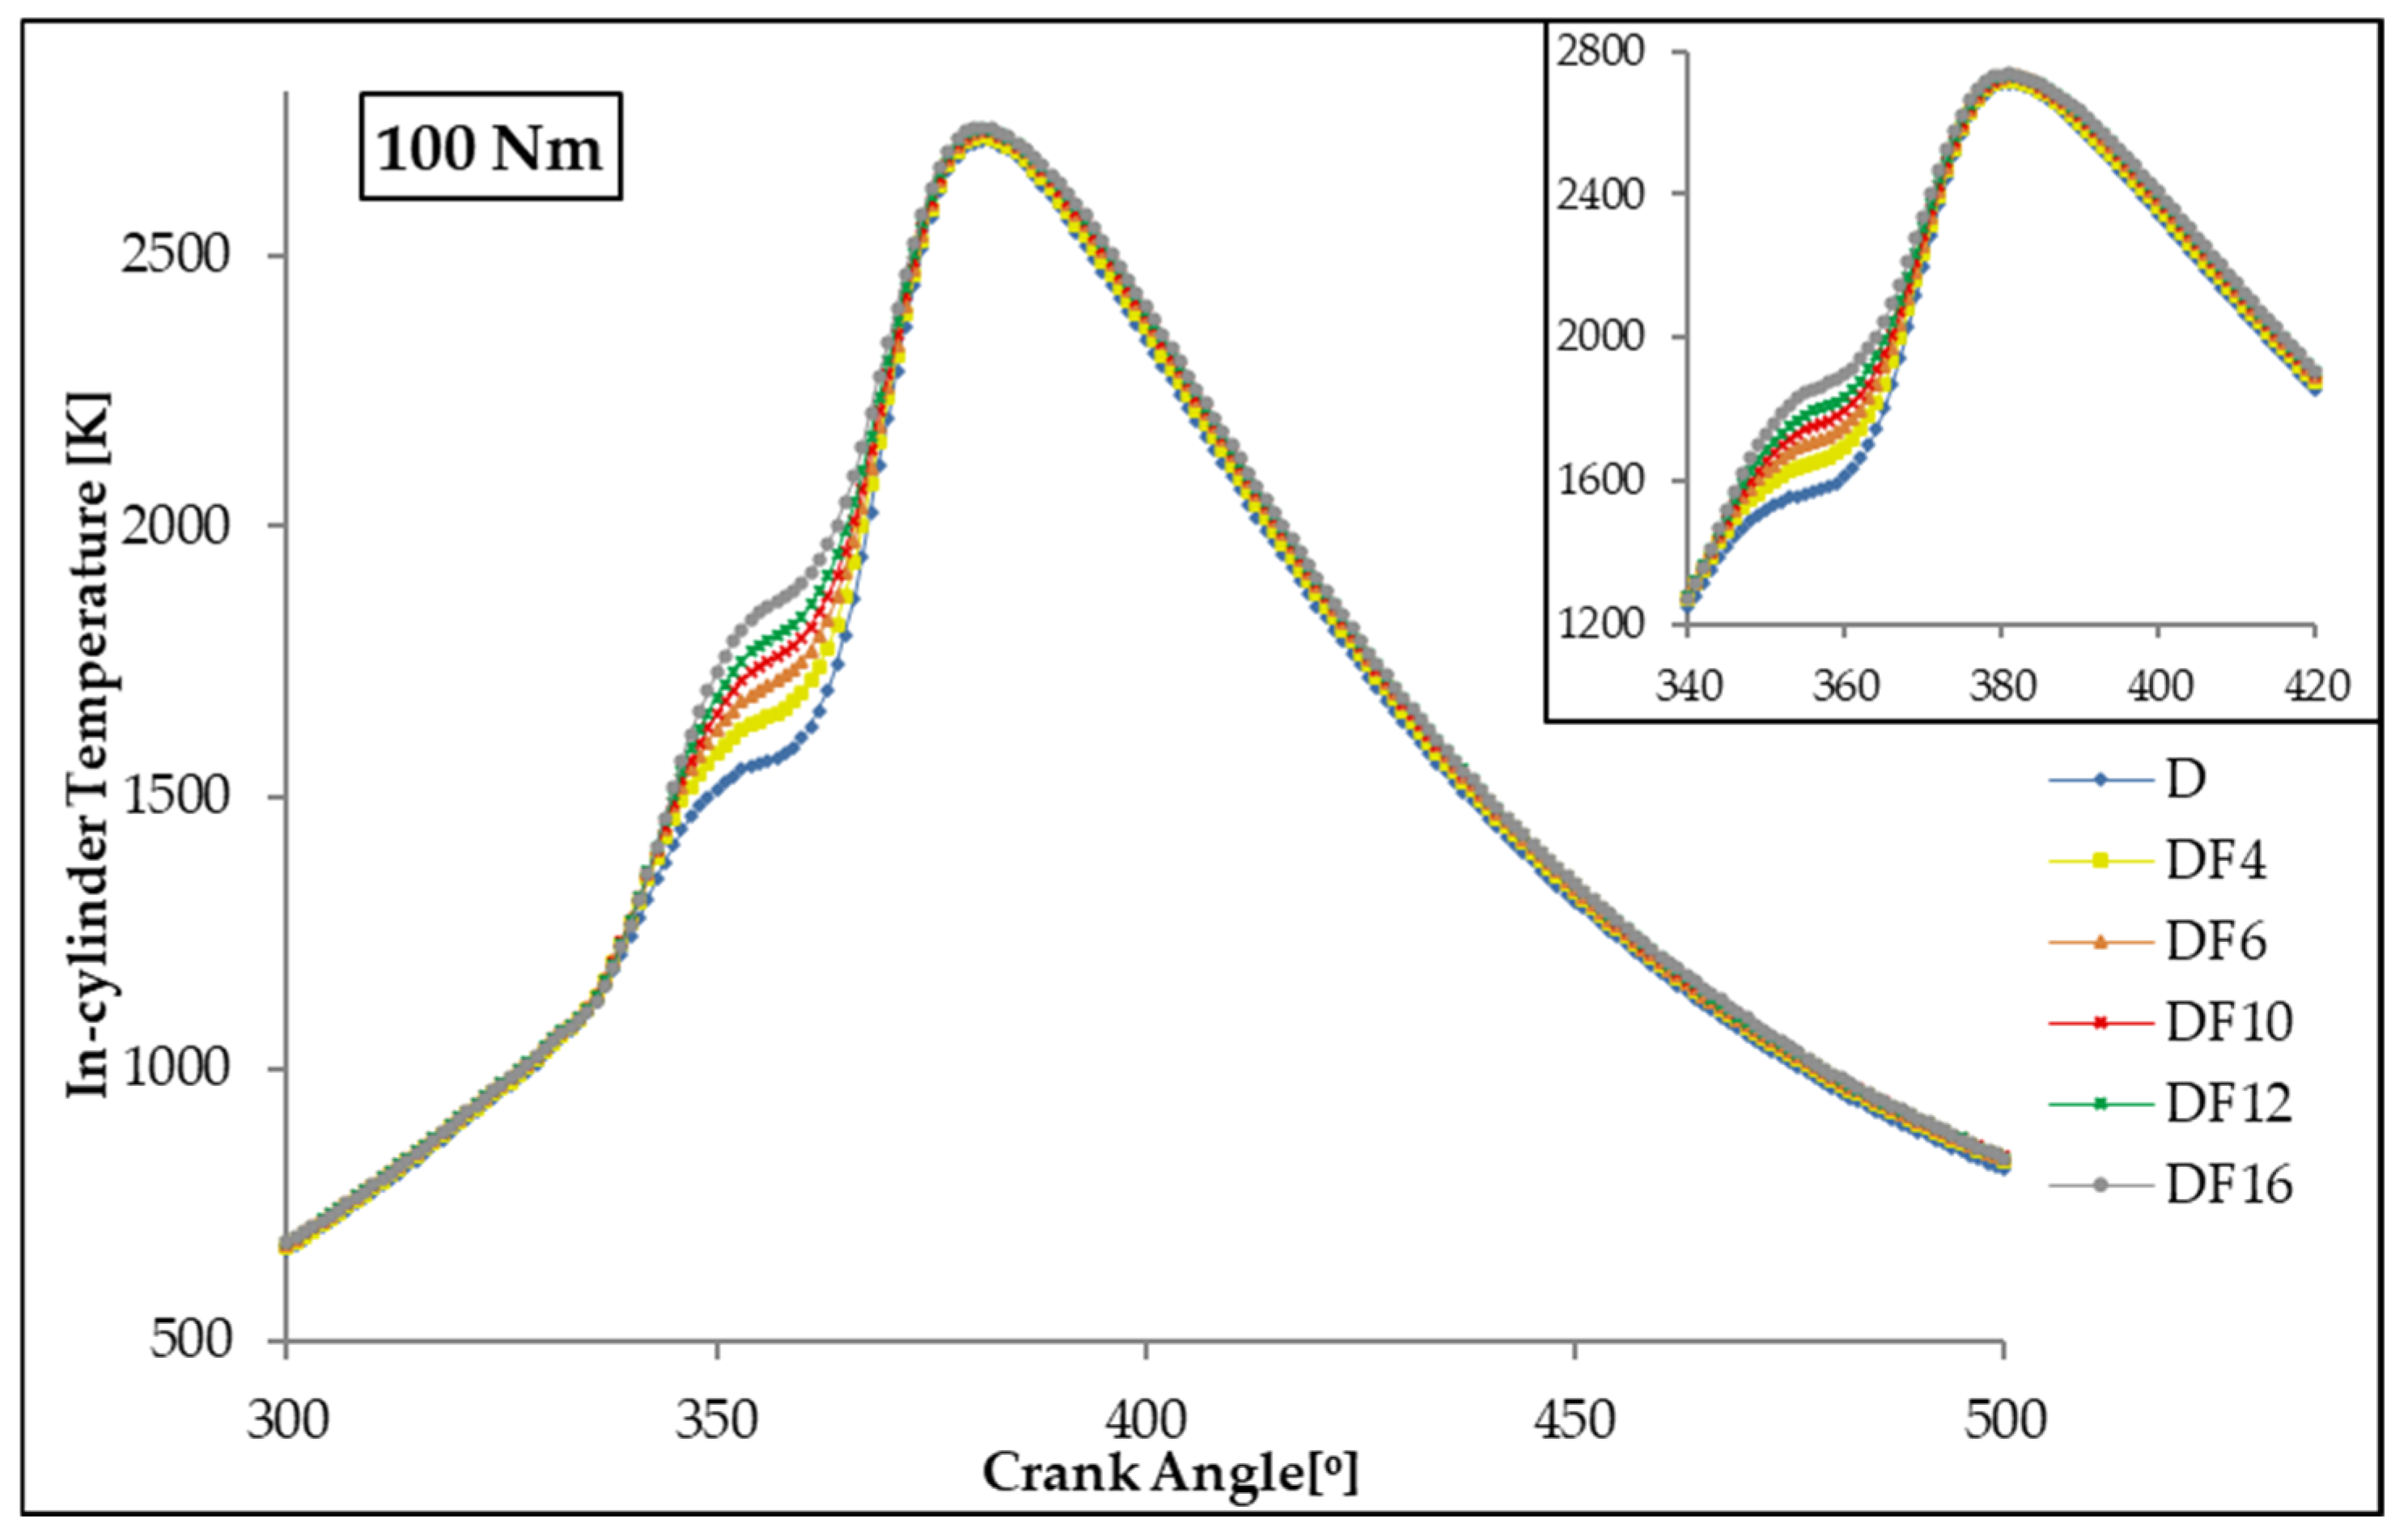
At a load of 100 Nm, the maximum cylinder temperatures occurring with different fuels were 381 °CA, D 2709 K, and DF16 2734 K. Upon examination of the data, it was determined that the maximum cylinder temperatures increased by 0.94% with DF16 compared to when the engine was running on diesel fuel only.
Based on examining the cylinder temperature graph, it was observed that the increase in fusel quantity had a slight effect on maximum cylinder temperatures and positions. The test engine’s common rail system had two injection stages. Fuel oil was injected into the mixing chamber to form a homogeneous mixture. This mixture was ignited with pilot diesel fuel. As the amount of fuel oil increased, more heat was released during the pilot combustion stage. This effect could be observed before TDC under all test conditions. On the other hand, it was observed that the amount of diesel in the main injection stage had a negligible effect on maximum cylinder temperatures. Although maximum cylinder temperatures during the pilot combustion stage increased with fusel oil usage, the maximum temperatures resulting from main combustion were similar under all test conditions. This situation could be attributed to the water content of fusel oil.
Overall, across the investigated torque range (40–100 Nm), increasing engine load increased the overall fueling demand and reduced the λ (
Figure 4), which led to higher in-cylinder temperatures in all cases (
Figure 5,
Figure 6,
Figure 7 and
Figure 8). The fusel oil energy share was highest at low load (40 Nm) and decreased as load increased (
Figure 3), primarily because the fusel oil mass flow rate was kept constant for each test point, while additional energy demand at higher loads was met by increasing the total fuel input. Consequently, the relative impact of fusel oil on peak in-cylinder temperature was strongest at 40 Nm and progressively diminished at higher loads.
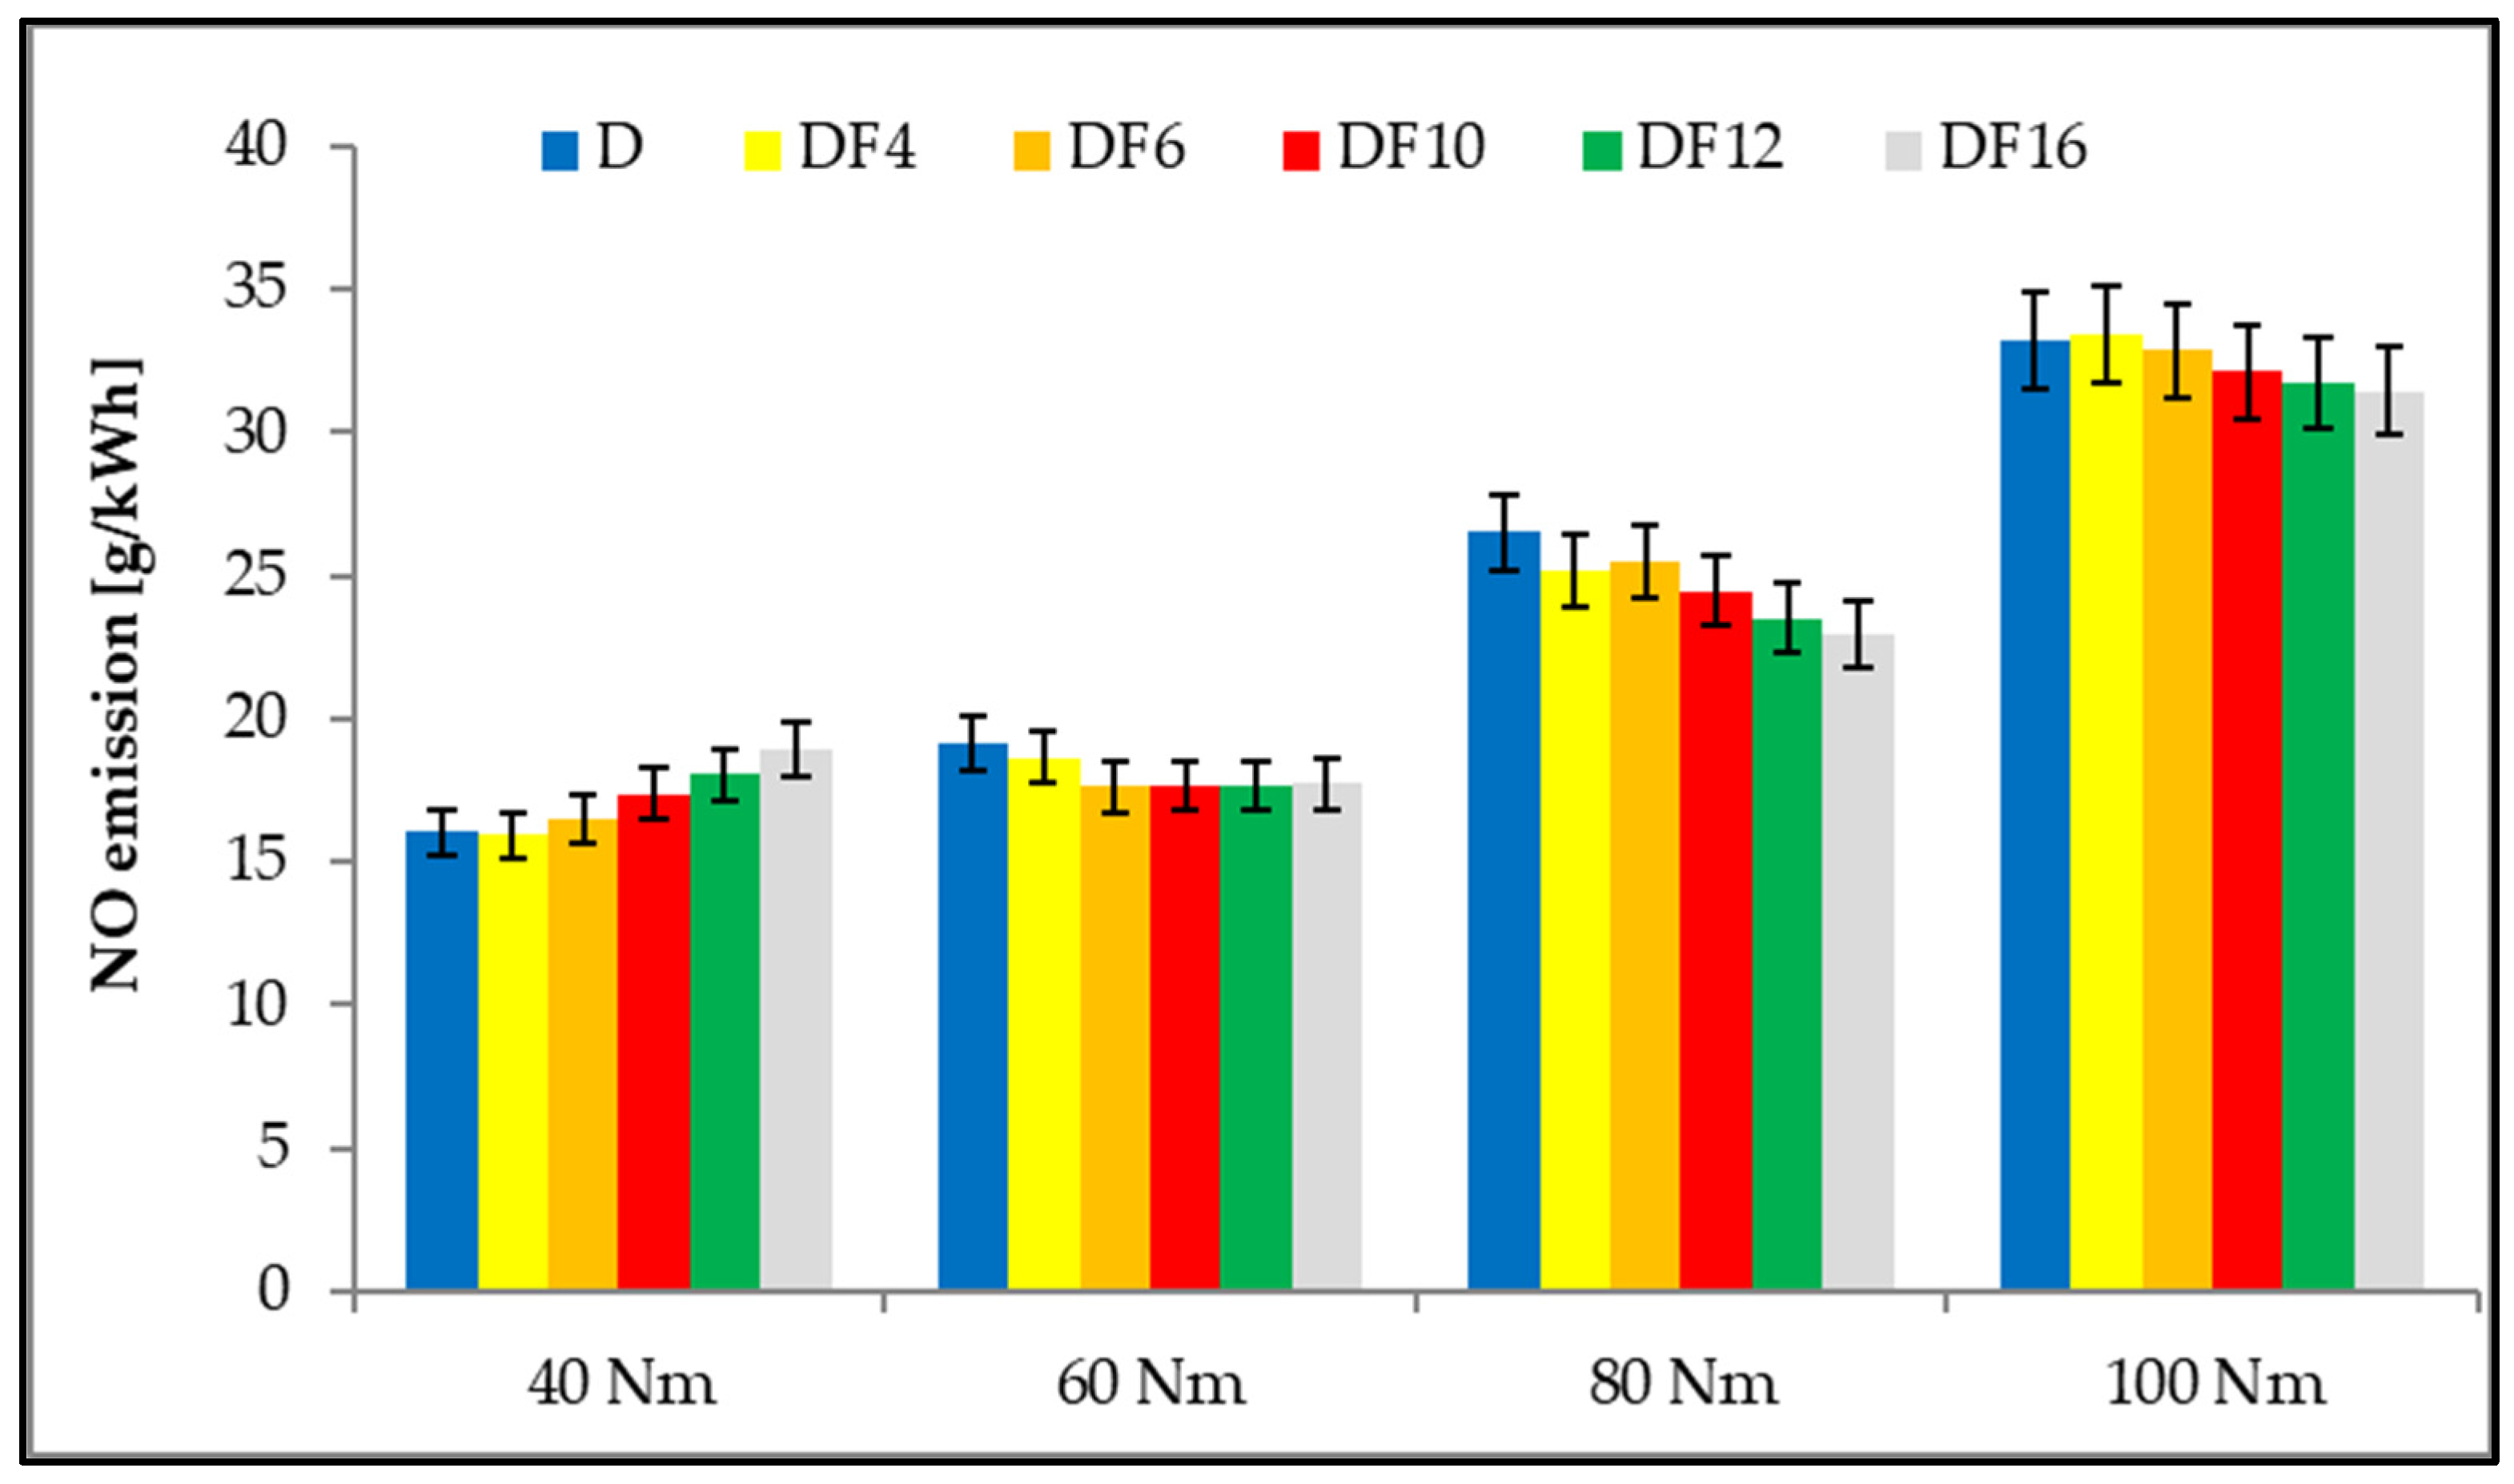
Figure 9 illustrates the variation of NO emissions with engine load for different fusel oil ratios. At the lowest load (40 Nm), NO emissions showed an increasing trend with increasing fusel oil addition, reaching a maximum increase of 17.9% at DF16 compared to diesel operation. In contrast, at medium and high loads (60–100 Nm), the addition of fusel oil led to a consistent reduction in NO emissions. The most pronounced decrease was observed at 80 Nm, where NO emissions were reduced by up to 13.54% at the highest fusel oil rate. At 60 Nm and 100 Nm loads, NO reductions of 7.13% and 5.25%, respectively, were achieved with DF16. Overall, these results indicate that fusel oil addition increases NO formation at low loads, while providing a clear NO reduction benefit under medium and high load conditions.
When cylinder temperatures and lambda graphs were examined, it was observed that temperatures increased as the fusel oil quantity increased, while lambda values decreased. However, even though lambda values decreased, they were relatively high, especially at 40 Nm engine load, compared to other engine loads. Both high temperatures and high lambda values increased NO emissions. At loads above 40 Nm, cylinder temperatures increased depending on the load. However, the effect of fusel oil on this increase diminished. In this case, the lambda values began to play a significant role in NO formation. After a load of 60 Nm, the temperature difference decreased by 20 K. In this scenario, the effect of air excess ratio on emissions was more pronounced than the effect of temperature. For DF16, λ decreased from 2.74 at a load of 40 Nm to 1.53 at 100 Nm. This demonstrated that air excess ratio played a significant role in NO formation. As the amount of fusel oil increased, the combustion time and air excess ratio decreased. Consequently, NO formation decreased.
In diesel engines, during the premixed uncontrolled combustion phase, hydrogen atoms react primarily with oxygen. The main reason for this is that hydrogen has a higher reactivity than carbon. In contrast, carbon atoms can carbonise without oxidising under the influence of high temperatures and can cause soot and smoke formation, particularly in areas where combustion is incomplete due to insufficient oxygen [
41,
42].
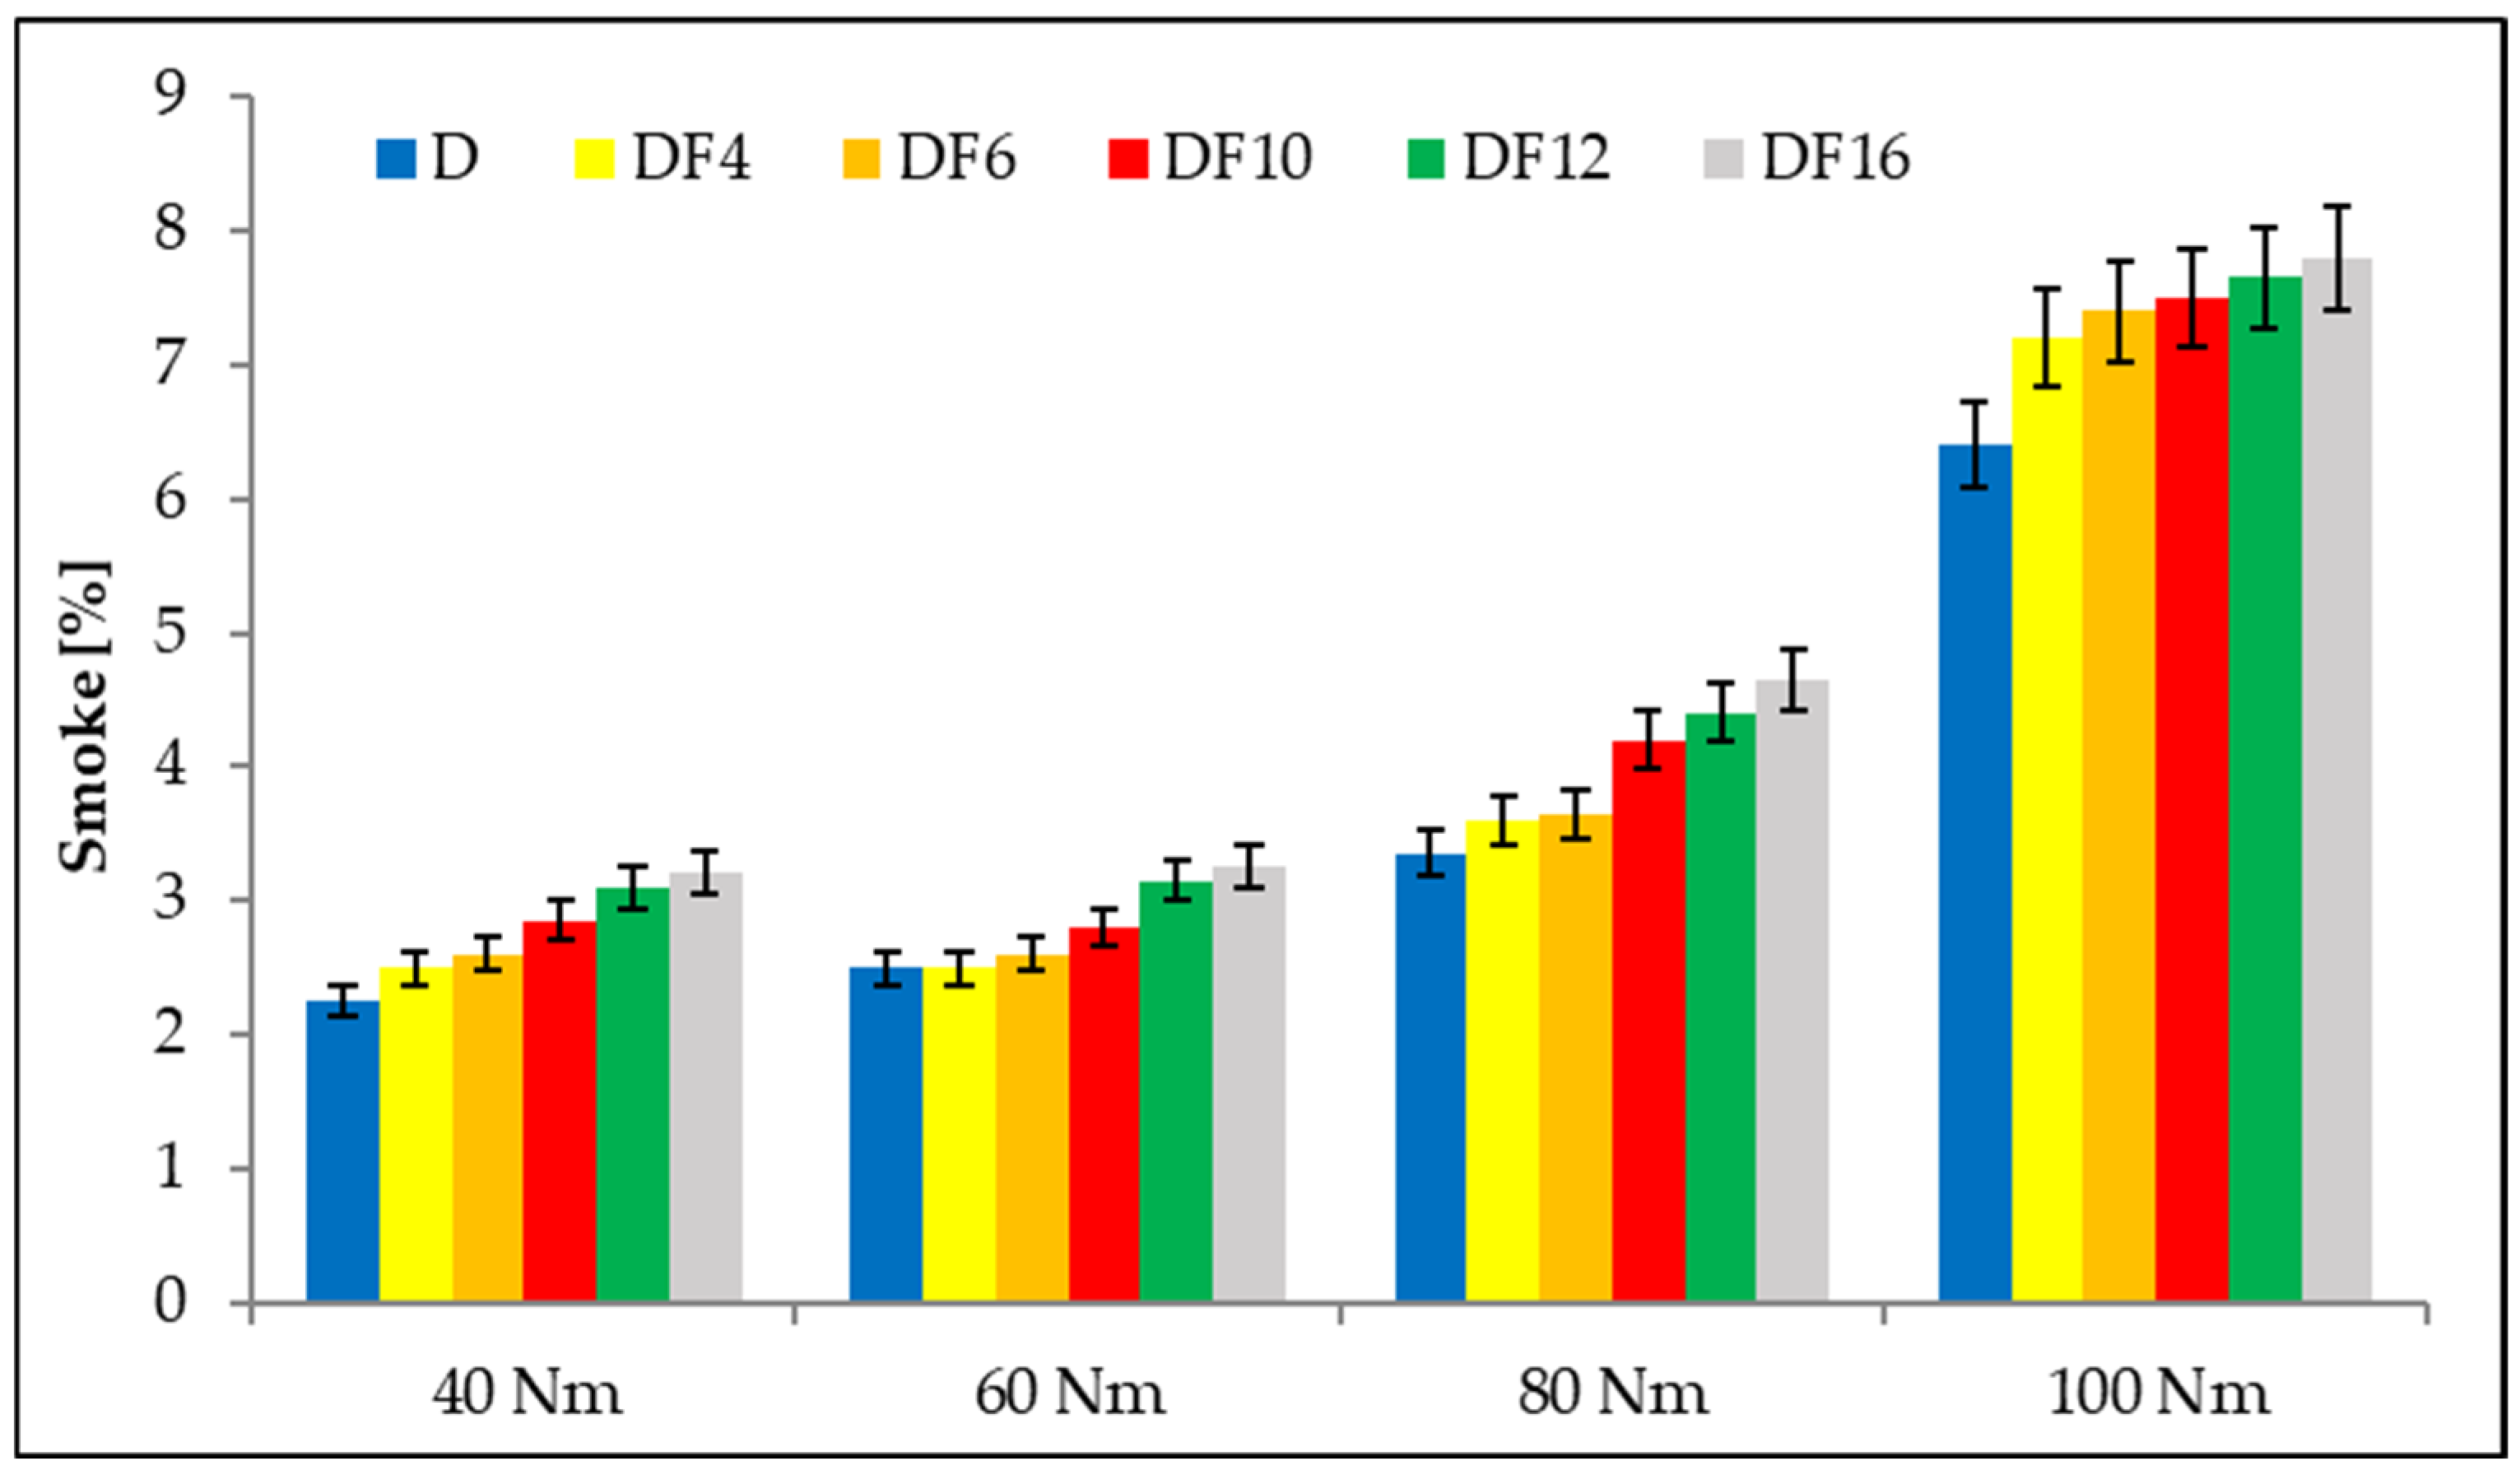
Figure 10 presents the variation of smoke emissions with engine load for different fusel oil ratios. For all operating conditions, smoke emissions increased with increasing fusel oil addition. At low load (40 Nm), the highest fusel oil ratio (DF16) resulted in a pronounced increase in smoke emissions, reaching approximately 42% compared to diesel operation. A similar increasing trend was observed at 60 Nm, where smoke emissions rose by about 30% at DF16. At medium load (80 Nm), smoke formation was further intensified, with an increase of nearly 39% at the highest fusel oil rate. At the highest load (100 Nm), although absolute smoke levels were higher, the relative increase due to fusel oil addition was more moderate, remaining below 22%. Overall, the results indicated that fusel oil addition consistently promoted smoke formation across the entire load range, with the strongest relative impact observed at low and medium loads.
In RCCI mode, the fusel oil–air mixture in the combustion chamber was ignited by pilot diesel fuel. The combustion products formed as a result of the pilot combustion phase diluted the cylinder charge and reduced the oxygen concentration. The main injection was performed after the pilot combustion phase. In this case, it became difficult for the diesel fuel sprayed into the cylinder during the main injection to reach the oxygen. Thus, as the fusel oil ratio increased to meet the engine’s energy requirements, an increase in smoke emissions was observed [
25,
26,
27,
29,
31,
43].
In summary, engine load markedly altered the emission response to fusel oil by changing the combined effects of temperature and oxygen availability. At low load (40 Nm), the coexistence of relatively high λ and the fusel oil-driven rise in peak in-cylinder temperature resulted in increased NO emissions (
Figure 9). In contrast, at medium and high loads (60–100 Nm), λ decreased and the peak temperatures during the main combustion phase remained comparable across fuels, leading to net NO reductions of 7.13%, 13.54%, and 5.25% at 60, 80, and 100 Nm, respectively (
Figure 9). Smoke emissions, however, increased with fusel oil addition at all loads (
Figure 10). This behaviour is attributed to oxygen depletion and charge dilution caused by pilot-combustion products, which hindered soot oxidation during the main injection period. The relative smoke penalty was most pronounced at low and medium loads and became more moderate at the highest load, where baseline smoke levels were already higher.