Article

Supercritical CO2 Pipeline Leakage Localization Detection Based on the Negative Pressure Wave Method and Cross-Correlation Analysis


1
School of Mechanical Engineering, Xi’an Shiyou University, Xi’an 710065, China
2
Shanxi Research Institute of Huairou Laboratory, Taiyuan 030032, China
3
Shaanxi Yanchang Petroleum (Group) Co., Ltd., Xi’an 710065, China
4
Department of Chemical and Petroleum Engineering, University of Calgary, Calgary, AB T3K 5E5, Canada
*
Author to whom correspondence should be addressed.
Processes 2026, 14(3), 536; https://doi.org/10.3390/pr14030536
Submission received: 13 January 2026 / Revised: 27 January 2026 / Accepted: 31 January 2026 / Published: 3 February 2026

Abstract

Supercritical CO2 pipeline transportation is a critical component of the carbon capture, utilization and storage (CCUS) industry chain, where long distance operation introduces inherent risks of accidental leakage. During the leakage process of supercritical CO2 pipelines, throttling pressure reduction and the Joule–Thomson effect generate distinct negative pressure wave characteristics. The magnitude of the leakage directly impacts localization effectiveness, particularly under small leakage conditions where negative pressure wave signals are less pronounced, so the leakage is difficult to effectively detect. To solve this problem, the mutual correlation function model for pipeline leakage was developed by using the mutual correlation analysis method, and it was verified by the dense-phase CO2 leakage data from Trondheim University of Technology. Based on the TGNET software, the actual pipeline model of the Yanchang oilfield is established, and the captured leakage signal is imported into MATLAB for differential pressure conversion, using the verified cross-correlation function model of the differential pressure signal to calculate the time difference between the arrival of the negative pressure wave at the two ends of the pipeline. Finally, the actual leakage location was determined. The simulation results indicate that the leakage detection method based on mutual correlation analysis of negative pressure wave signals exhibits varying localization performance under different leakage rates. By enhancing negative pressure wave characteristics and utilizing mutual correlation analysis, this method effectively addresses the challenges of indistinct negative pressure wave features and difficult localization during small leakage conditions. When leakage exceeds 5%, the relative error is controlled within ±5.40%, meeting the preliminary localization requirements for rapid identification and regional determination in engineering applications. Through the application of actual engineering cases, it is shown that this method has high accuracy in pipeline leakage detection. These findings provide theoretical and methodological support for supercritical CO2 pipeline leakage detection in the CCUS projects currently under construction.

1. Introduction

Carbon capture, utilization and storage (CCUS) is an effective technology to reduce CO2 in the atmosphere. Most of the captured CO2 will be pressurized to the supercritical state and transported through pipelines and stored in aquifers or underground depleted oil and gas fields, or used to improve oil or natural gas recovery [1,2]. However, during operation, CO2 pipelines may break, or equipment failure may cause CO2 leakage due to manufacturing defects, material aging, man-made negligence and natural disasters [3]. A report from the Joint Research Center of the European Commission shows that the use of high-pressure CO2 delivery pipelines has significant harm potential, and adults will be exposed to 10% concentration of CO2 in just 1 min, and this will cause coma. Therefore, in-depth research on pipeline leakage monitoring and leakage positioning technologies is of great significance to prevent leakage from continuing to develop, reduce fluid losses, and its impact on surrounding organisms and environments [4].
Current CO2 pipeline leakage detection methods are typically classified based on detection mechanisms and information sources into model-based methods, signal-based methods, and externally perceived methods. Methods based on operational parameters and modeling, such as those by Riaz M et al. [5], established mathematical models of dynamic hydraulic pipelines from the perspectives of volume balance and momentum balance. These approaches detail leakage detection using the volume balance method and leakage localization using the pressure gradient method. Zhang X et al. [6] proposed a method for detecting and locating leaks in gas drainage pipelines based on the pressure gradient technique. Results indicated that as the diameter of the pipeline leakage and the negative pressure within the pipeline increase, the leakage location becomes closer to the pipeline center, resulting in a smaller relative positioning error and higher positioning accuracy. Methods based on external sensing and environmental monitoring, such as those by K. Adefila et al. [7], utilized thermal imaging technology with temperature change detection to study gaseous CO2 leaks. The results demonstrate that infrared imaging systems can detect temperature variations under different leakage conditions. Li X et al. [8] proposed a time-of-arrival difference (TDOA) positioning method based on acoustic emission technology. Preliminary experiments were conducted for locating leaks in air pipelines and CO2 gas pipelines. The results demonstrated that acoustic emission technology can be employed for detecting leaks in gaseous CO2 pipelines. Signal analysis-based approaches, such as that proposed by Cui X et al. [9], involved installing acoustic emission sensors on CO2 pipelines to capture leakage signals, enabling detection and localization of pipeline CO2 leakage. Wang Z et al. [10] proposed a pipeline leakage detection method based on negative pressure waves from multiple pressure sensors by analyzing the sequence in which pressure sensors upstream and downstream of the pumping station detect negative pressure waves. The method distinguishes whether the waves originate from leaks or pumping station operational adjustments. This approach reduces false negative rates and enhances the system’s leakage localization capability. Wang Y et al. [11] proposed a time-reversal-based adaptive grid generation approach to enhance computational efficiency in pipeline leakage localization. The method introduced a resolution adjustment parameter to optimize captured signals, allowing for adaptive grid concentration in leakage areas based on energy distribution. The results demonstrated that the proposed approach maintains comparable localization accuracy while reducing the number of grids and localization time to only 0.6% and 2.4% of those required by conventional uniform grid methods. Most of these detection systems feature complex structures, cumbersome layouts, and costly setup and operation. Furthermore, covering long-distance pipelines requires a large number of sensors, significantly increasing design and operational costs.
Among numerous leakage detection and localization methods, the negative pressure wave (NPW) approach has been widely adopted for locating leakage in long-distance fluid pipelines during steady-state operation. When a leakage occurs, the localized instantaneous pressure drop generates a negative pressure wave that propagates along the pipeline at near-sonic speed. This wave arrives at upstream and downstream pressure sensors at different times, enabling localization by measuring the time difference between their arrivals [12]. However, there is currently a lack of reliable methods to effectively extract the time difference between the arrival of negative pressure waves at upstream and downstream pressure sensors. Typically, pressure waves propagate at high speeds (~the speed of sound), meaning the signal characteristics at upstream and downstream should exhibit high similarity, with only a time delay present. The cross-correlation algorithm can precisely calculate this time difference based on the degree of correlation between two sets of signals at different time lags. Xiao Hongliang et al. [13,14] performed cross-correlation analysis on dual-channel particle concentration signal fluctuations to extract particle motion time delays and calculate solid velocities. In convection-dominated systems or regions (e.g., the core zone of a rapid fluidized bed), particle motion exhibits strong directional consistency and signal similarity, yielding distinct cross-correlation peaks. This enables the algorithm to achieve high velocity measurement accuracy.
Therefore, this paper proposes a supercritical CO2 pipeline leakage detection and localization technique based on the negative pressure wave method and cross-correlation analysis. Firstly, due to its intermediate physical properties between gas and liquid in the supercritical state, CO2 exhibits significantly higher compressibility than conventional liquids. This high compressibility enables pressure disturbances to propagate more readily as waves within the pipeline rather than being rapidly dissipated, resulting in slower attenuation. Second, supercritical/dense-phase CO2 leakage is typically accompanied by pronounced Joule–Thomson effects, causing more significant drops in temperature and pressure. This “pressure-temperature coupling abrupt change” characteristic distinguishes negative pressure wave signals from normal operational fluctuations, facilitating identification and discrimination. Third, negative pressure wave technology offers low cost and high sensitivity, enabling leakage localization in pipelines up to 30 km in length [15,16,17].
However, negative pressure waves are highly sensitive to noise and interference; artificial peaks arising from pipeline boundary reflections or noise interfere with the true mutual correlation peaks, necessitating the use of signal processing and discrimination algorithms. Noise reduction techniques are applied to eliminate noise and convert pressure signals into differential pressure values [18]. Combined with cross-correlation algorithms, these techniques perform cross-correlation analysis on pressure signals collected from different measurement points. This enables automatic extraction of the time delay in negative pressure wave propagation, effectively distinguishing genuine mutual correlation peaks from reflected artifacts. Consequently, the accuracy and stability of leakage localization are enhanced. Therefore, when employing negative pressure waves and cross-correlation analysis for leakage detection, captured leakage signals first undergo wavelet denoising to eliminate non-leakage signals such as pump start/stop events and low-frequency operational fluctuations. Subsequently, differential pressure conversion is applied to remove steady-state pressure averages, retaining only transient components. This highlights the characteristic negative pressure waves induced by leakage, addressing the issue of inconspicuous cross-correlation function variations in high-pressure CO2 pipeline pressure signals. Finally, using actual pipelines from the Yanchang Oilfield CCUS project as samples, steady-state and transient operational models for impurity-containing CO2 pipelines were established at different locations and leakage rates using PiplineStudio4.2.1.0(TGNET) software. This enabled an analysis of the detection method’s leakage localization performance under various leakage conditions [19]. This research provides practical case studies for leakage detection in China’s supercritical CO2 pipelines, offering significant guidance.

2. Methodology

2.1. Negative Pressure Wave Leakage Detection Principle

When an accidental leakage occurs in a long-distance CO2 pipeline, the escaping medium reduces local fluid density, causing an instantaneous pressure drop and velocity difference at the leakage point, which further decreases fluid density and pressure in adjacent areas. The resulting pressure drop propagates upstream and downstream along the pipeline, generating a negative pressure wave [20,21,22,23]. Its propagation characteristics are as follows: After forming at the leakage point, it propagates at a speed close to the sound velocity in the medium. Affected by factors such as pipe wall elasticity, fluid viscosity, and friction losses, it gradually attenuates and distorts during propagation. Therefore, leakage point localization can be achieved by placing dynamic pressure sensors upstream and downstream of the pipeline to capture the pressure signal of the pipeline transmission, based on the time difference between the arrival of the negative pressure wave at the two sensors, as shown in Figure 1.
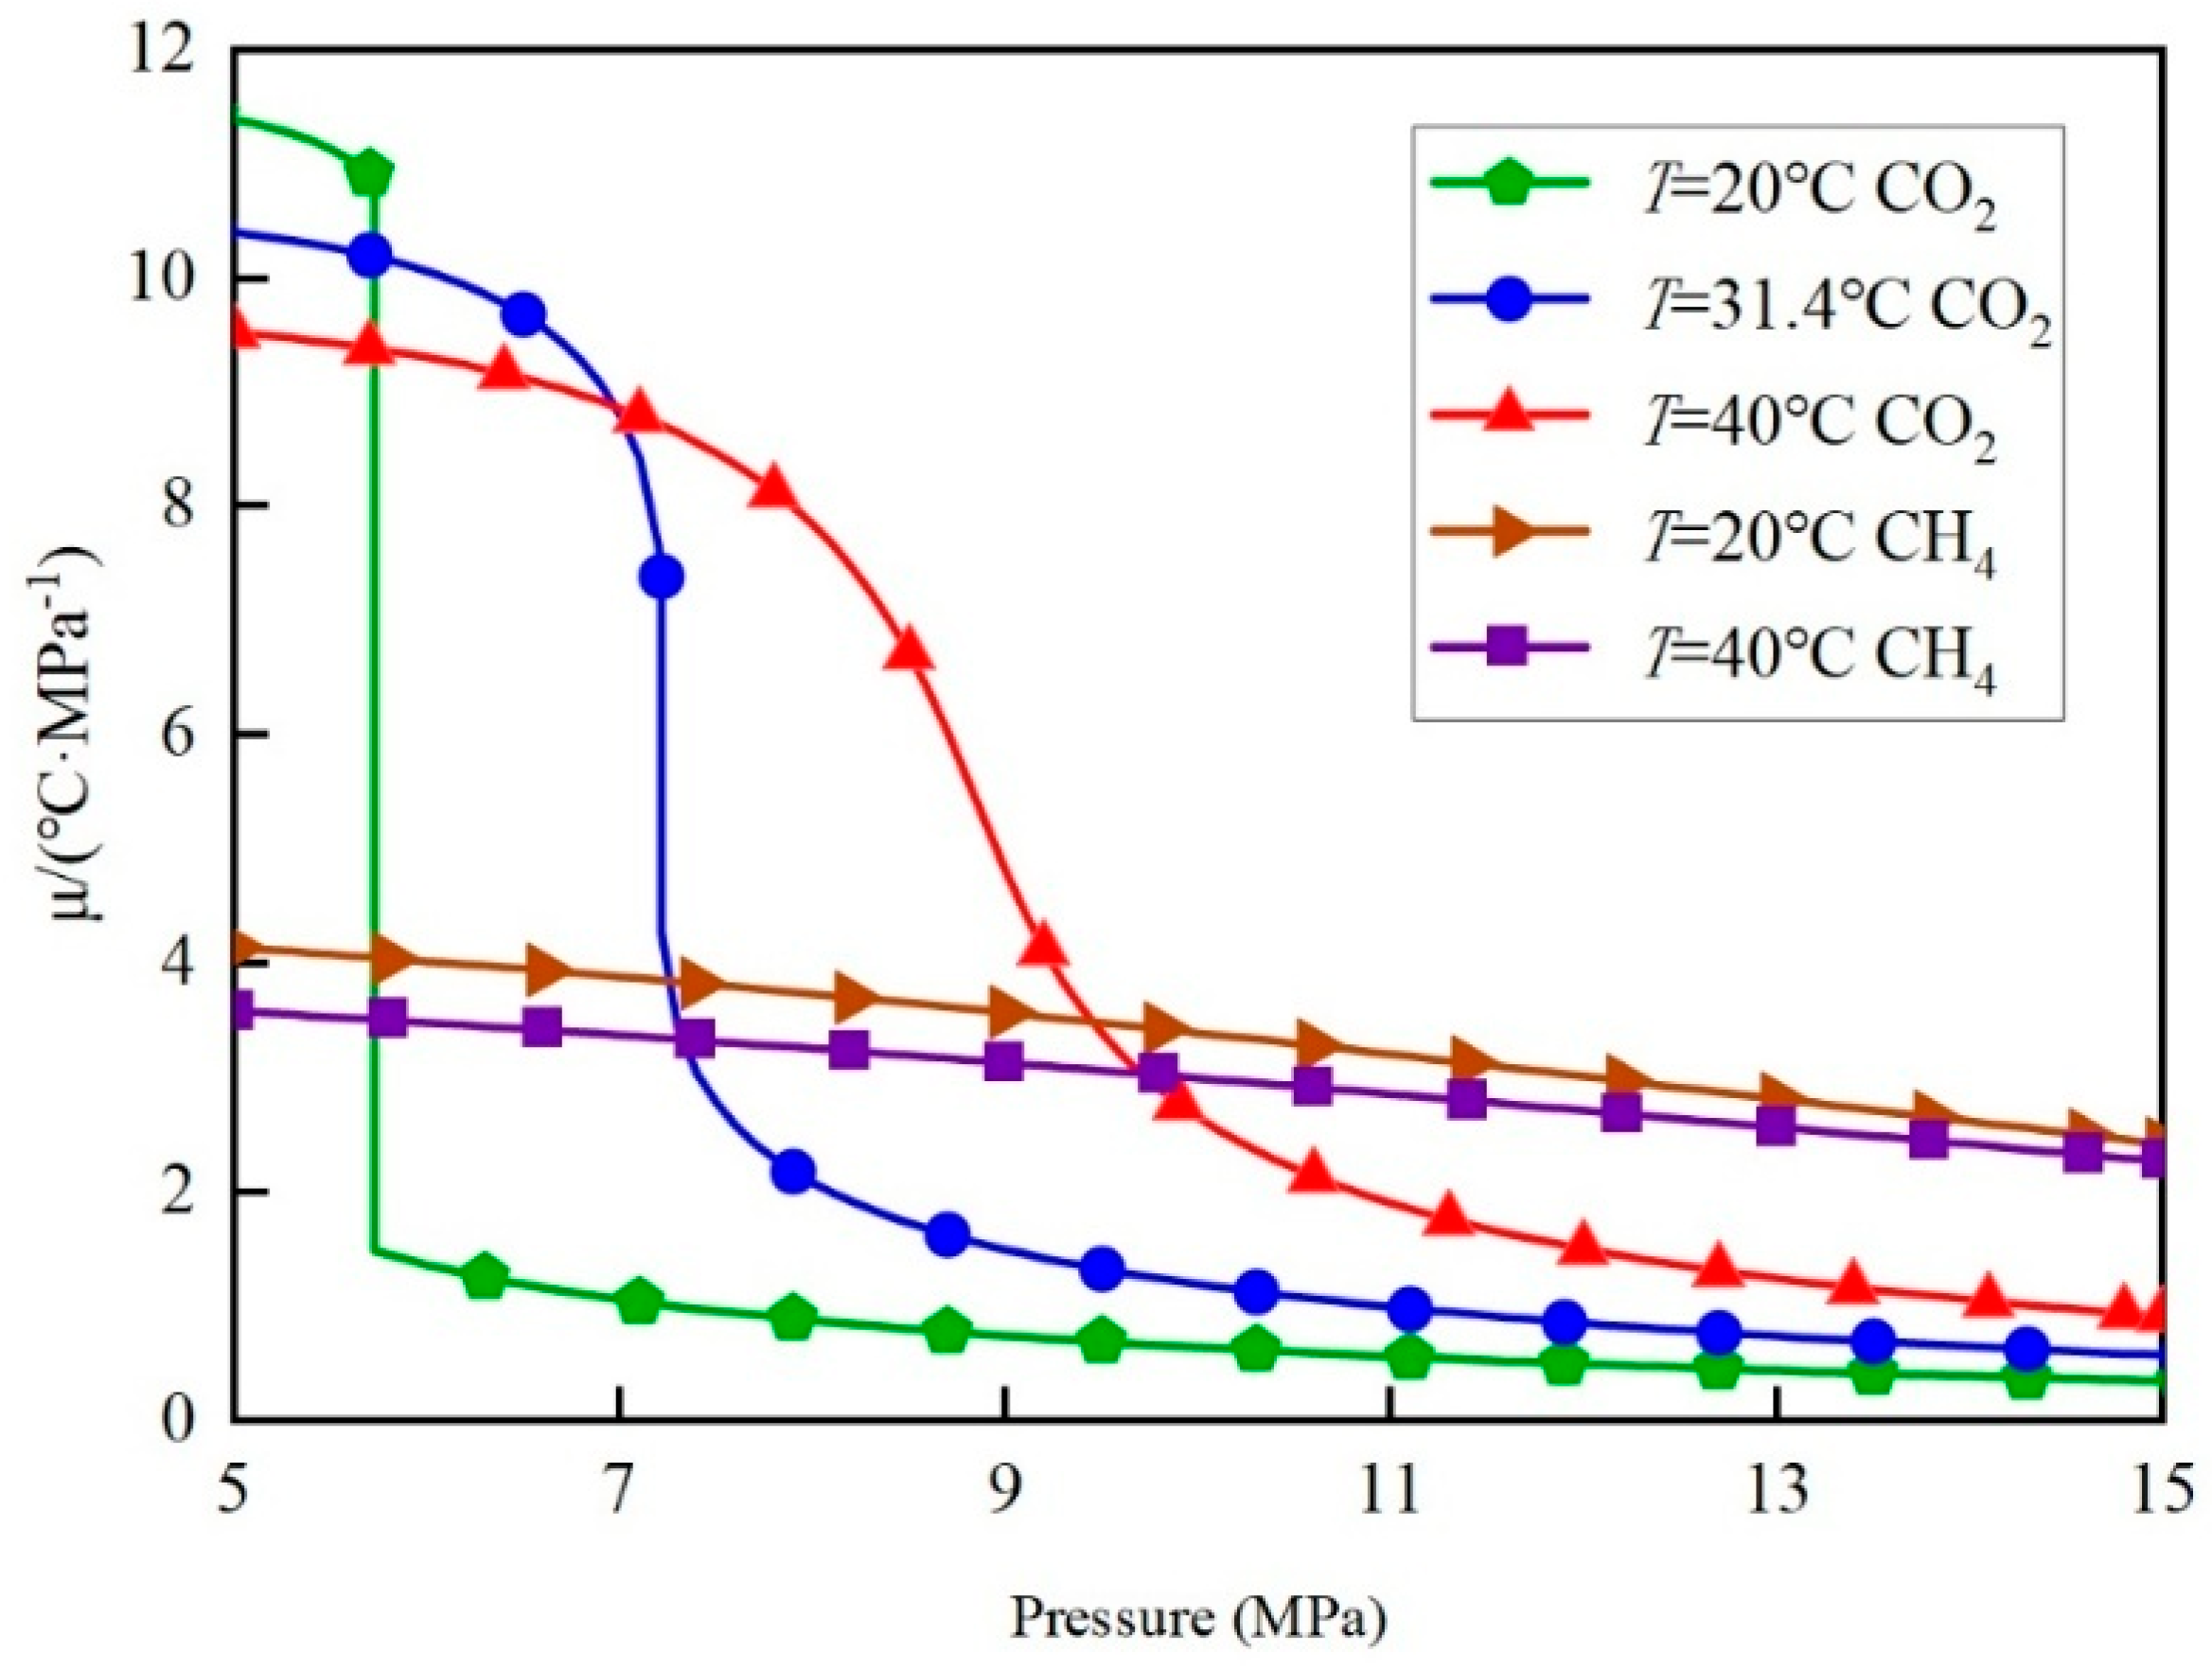
Supercritical CO2 undergoes explosive expansion when leaking compared to fluids such as natural gas, and the Joule–Thomson effect is more dramatic [24,25]. Figure 2 shows the Joule–Thomson coefficients of pure CO2 and pure methane under different conditions. It can be seen that CO2 at different temperatures is prone to a sudden change in the Joule–Thomson coefficient μ ( μ = d T d P H ) in the pressure range of 5~13 MPa. Therefore, after the leakage of a supercritical CO2 pipeline, when the pressure starts to decrease, the μ is highly probable to increase sharply, which makes the pressure and temperature decrease at the leakage point of the pipeline more pronounced, so it is more advantageous to use the negative pressure wave method to detect the leakage of the CO2 pipeline.

2.2. Cross-Correlation Analysis

The cross-correlation function can represent the statistical connection between different stochastic processes. On the basis of capturing the pressure signals using the sensors, in this study, the cross-correlation analysis will be utilized to further determine the time difference between the arrival of the negative pressure wave at the sensors at both ends. Assume P 1 ( k ) and P 2 ( k ) are discrete random pressure signal values collected during system operation [26,27,28,29]. Calculate the correlation function of P 1 ( k ) and P 2 ( k ) , i.e.,
Φ P 1 P 2 ( τ ) = lim N 1 N k = 1 N P 1 ( k ) P 2 ( k + τ )
In formula τ L / a , L / a , τ is the sampling interval time, s; L is the length of the tube, m; and a is the wave speed, m·s−1.
The peak of the cross-correlation function Φ P 1 P 2 ( τ ) is stably distributed within the interval [−1,1]. Its magnitude reflects the correlation strength between the pressure signals at two measurement points under a specific time delay. A higher value indicates more pronounced characteristics of the negative pressure wave caused by leakage and more reliable time delay extraction.
The following will replace Φ P 1 P 2 ( τ ) with Φ ( τ ) . Theoretically, when no leakage occurs, the correlation function will be maintained at some very small value, whereas if a leakage occurs and when τ = τ 0 , the Φ ( τ ) will have reached the maximum value [30,31], i.e.,
Φ τ 0 = max τ L a L a Φ ( τ )
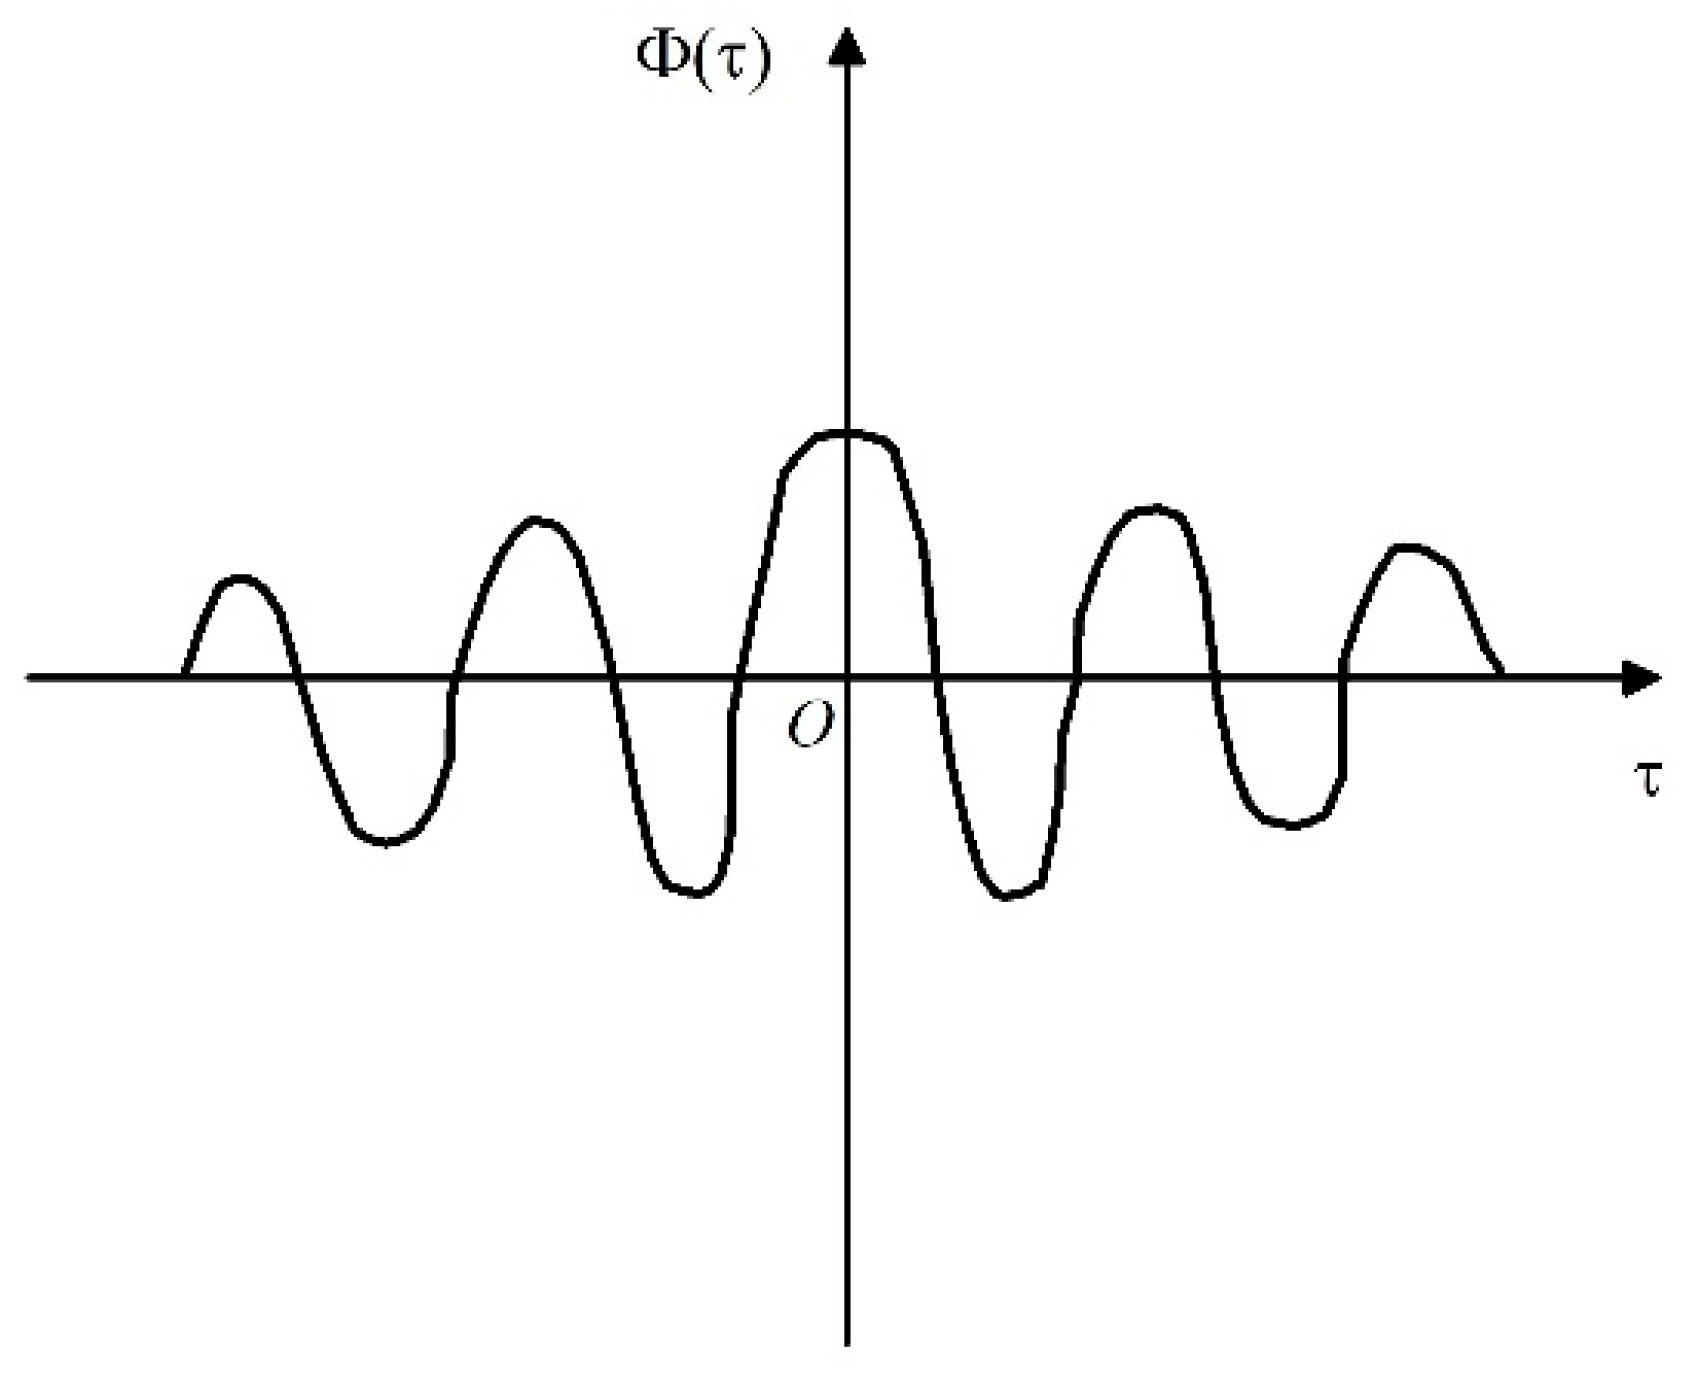
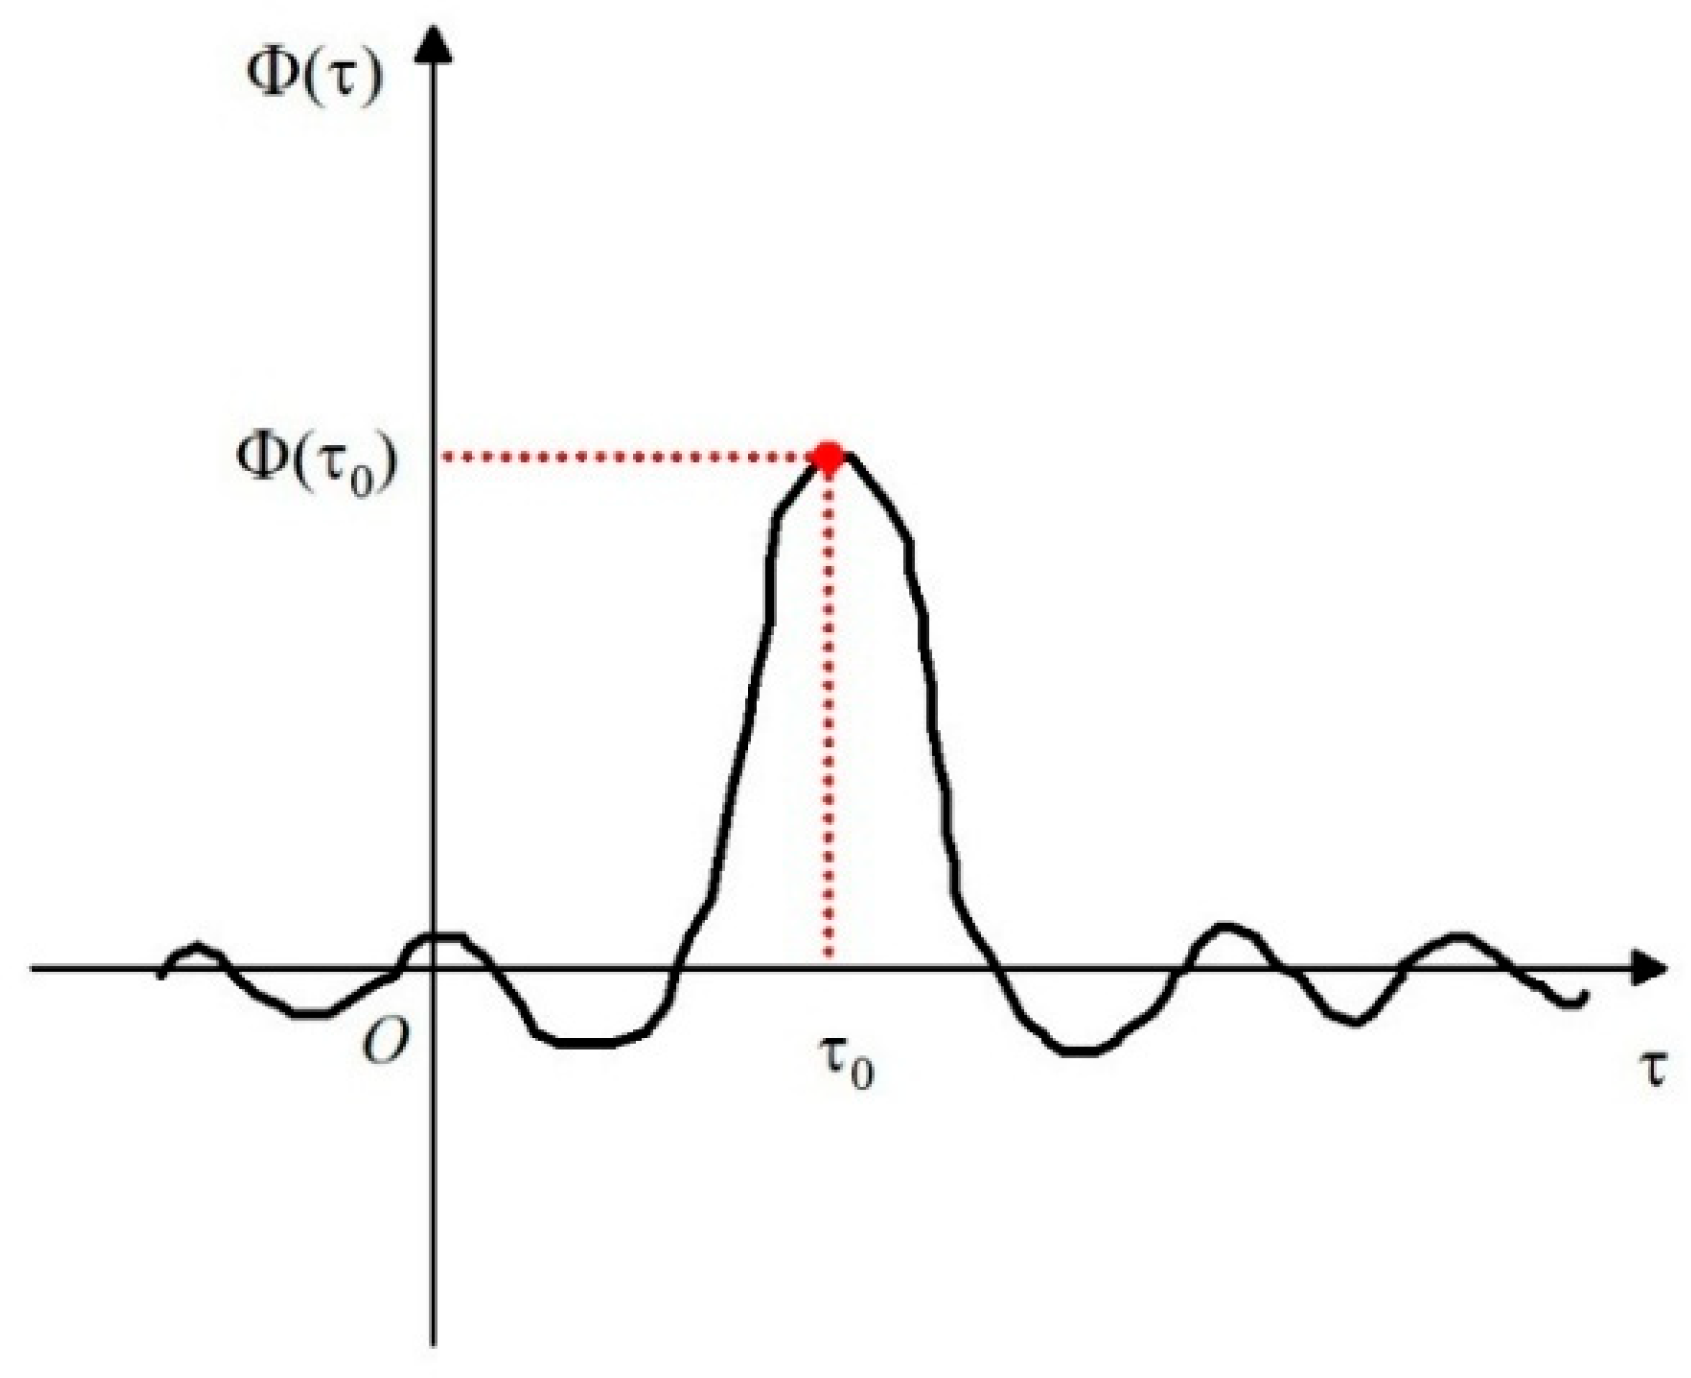
The cross-correlation function diagrams for non-leakage and leakage pipelines are shown in Figure 3 and Figure 4, respectively. When no leakage occurs, the cross-correlation function exhibits multi-peak oscillatory characteristics with no significant temporal features, making it impossible to extract effective propagation time differences. During leakage, however, the correlation function displays a distinct and unique dominant peak with stable and easily identifiable values, providing a reliable basis for subsequent leakage location calculations. The time corresponding to the maximum peak of the correlation function curve is considered to be the time difference between the arrival of the negative pressure wave at the pipeline inlet and outlet. When the maximum peak corresponds to τ 0 > 0 , the negative pressure wave arrives at the outlet earlier than at the inlet, indicating a leakage downstream. Conversely, if the negative pressure wave arrives at the inlet earlier than at the outlet, the leakage location is upstream.

2.3. Differential Pressure Conversion

The pressures of supercritical CO2 are all above 7.38 MPa, and the pressure signals themselves are large, making the change in the correlation function between the upstream and downstream pressure signals not significant. In order to improve the accuracy and effectiveness of leakage detection and localization, this study performs differential pressure transformation on the pressure signals collected by the sensor, eliminates the mean value and transforms the trend of the pressure change from a decreasing slope to a peak value, and at the same time filters out the rising part of the pressure due to noise and other reasons, and then performs a cross-correlation analysis of the differential pressure signals to amplify the leakage characteristics carried by the pressure signals, and ultimately obtains more accurate leakage localization information [32]. The specific formula to find the differential pressure signal is shown below:
Δ P 1 = P 1 ( t ) P 1 ( t + T s )
Δ P 2 = P 2 ( t ) P 2 ( t + T s )
where P 1 ( t ) is the inlet pressure at time t, MPa; P 2 ( t ) is the outlet pressure at time t, MPa; Δ P 1 is the difference between the inlet pressure at time t and the time t + T s , MPa; Δ P 2 is the difference between the outlet pressure at time t and the time t + T s , MPa; and T s is the interval sampling time, s.
After taking the differential pressure signal, the pressure drop will be reflected as an upward positive bump, and in order to simplify the calculation and exclude the interference of the pressure rise caused by the environment and other factors, the part of the differential pressure signal that is negative can be removed, i.e.,
Δ P 1 Δ P i Δ P i > 0 0 Δ P i 0 i = 1 , 2

2.4. Leakage Localization

The general expression for the propagation velocity of a negative pressure wave in a tube is [33]:
a = K ρ 1 + K E · D e C
where: E is the elastic modulus of the pipe, Pa; ν is the Poisson’s ratio of the pipe; ρ is the density of the fluid, kg·m−3; K is the elastic volume modulus of the fluid, Pa; D/e is the ratio of the inside diameter of the pipe to the wall thickness; and C is the pipe constraint coefficient for long-distance buried oil and gas transmission pipelines, C = 1 ν 2 .
Ignoring the effect of the fluid flow rate in the pipe on the propagation of the negative pressure wave, the equation for the localization of the leakage point of the pipe can be deduced as:
x = L + a × Δ t 2
where: x is the distance between the leakage location and the pipe inlet, m; Δ t is the time difference between the negative pressure wave signal arriving at the upstream and downstream sensors, s; V is the flow velocity, m·s−1; and a is the propagation speed of the negative pressure wave, m·s−1.

3. Simulation Methods

TGNET software is a gas pipeline steady state/transient simulation software developed by ESI Energy Group in the UK, which is widely used in the process analysis of natural gas pipelines. In this study, the basic steady state model of a supercritical CO2 pipeline containing impurities is first established in TGNET software, and the basic equations of pipeline network simulation are based on the built-in software. The continuity equation, the mass conservation equation, the momentum conservation equation, the energy conservation equation, and the resistance calculation equation are used for steady state operation calculations [34]. Then, the LEAK component and Scenario Editor are added to control the leakage port aperture and leakage coefficient of the long-distance CO2 pipeline through the LEAK component, and control the timing of pipeline components through the Scenario Editor to get the leakage signal characteristics of the whole pipeline and at different moments.
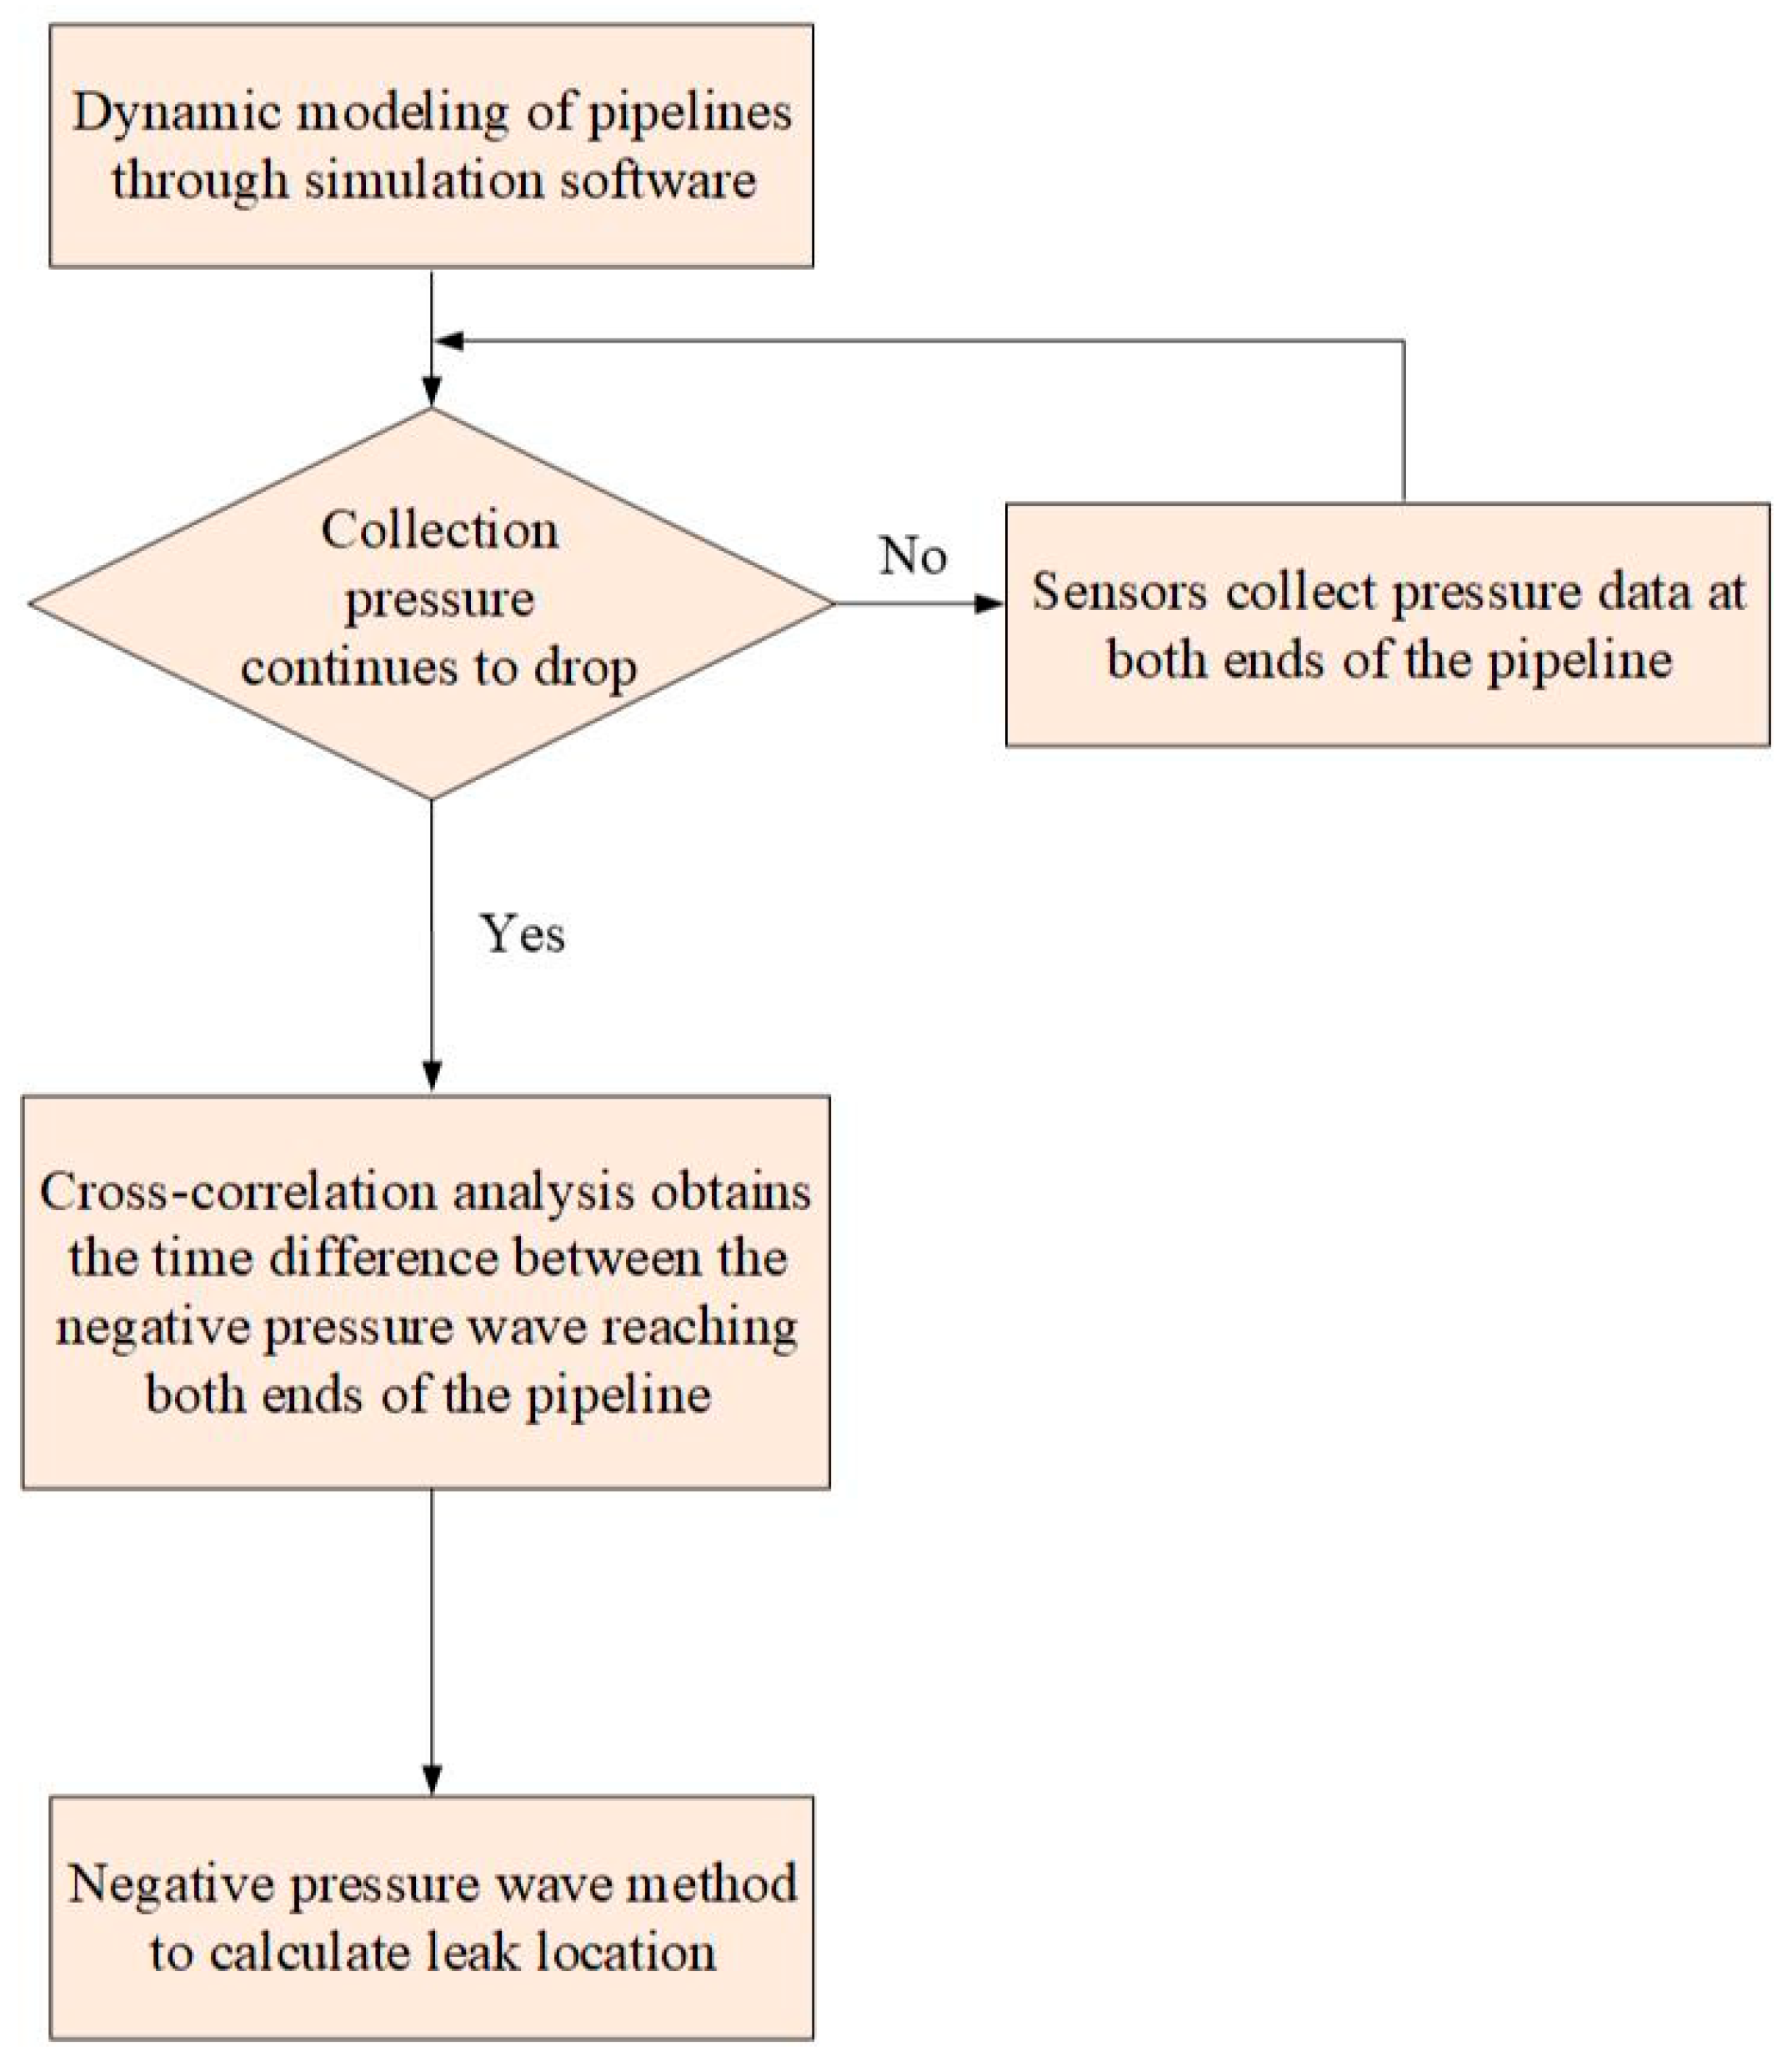
In order to obtain the specific leakage location, the required physical parameters are calculated in REFPROP software based on the GERG 2008 equation of state according to the fluid impurity fraction, and then the negative pressure wave velocity generated by the leakage of the pipeline is calculated by Equation (7). The acquired pressure signal curve is a differential pressure in MATLAB R2022a to filter the portion that is unlikely to carry pipeline leakage information and to amplify the leakage characteristics of the pressure curve. Then, through the correlation analysis to get the correlation function of the differential pressure curve, we find the time corresponding to the maximum peak of the correlation function, and get the time difference of the negative pressure wave arriving at the two ends of the pipeline. Finally, the negative pressure wave propagation speed and time difference are brought into the Formula (6) to calculate the specific location of the pipeline leakage; the specific process is shown in Figure 5.

4. Analysis of Simulation Results

4.1. Pipeline Simulation Method Validation

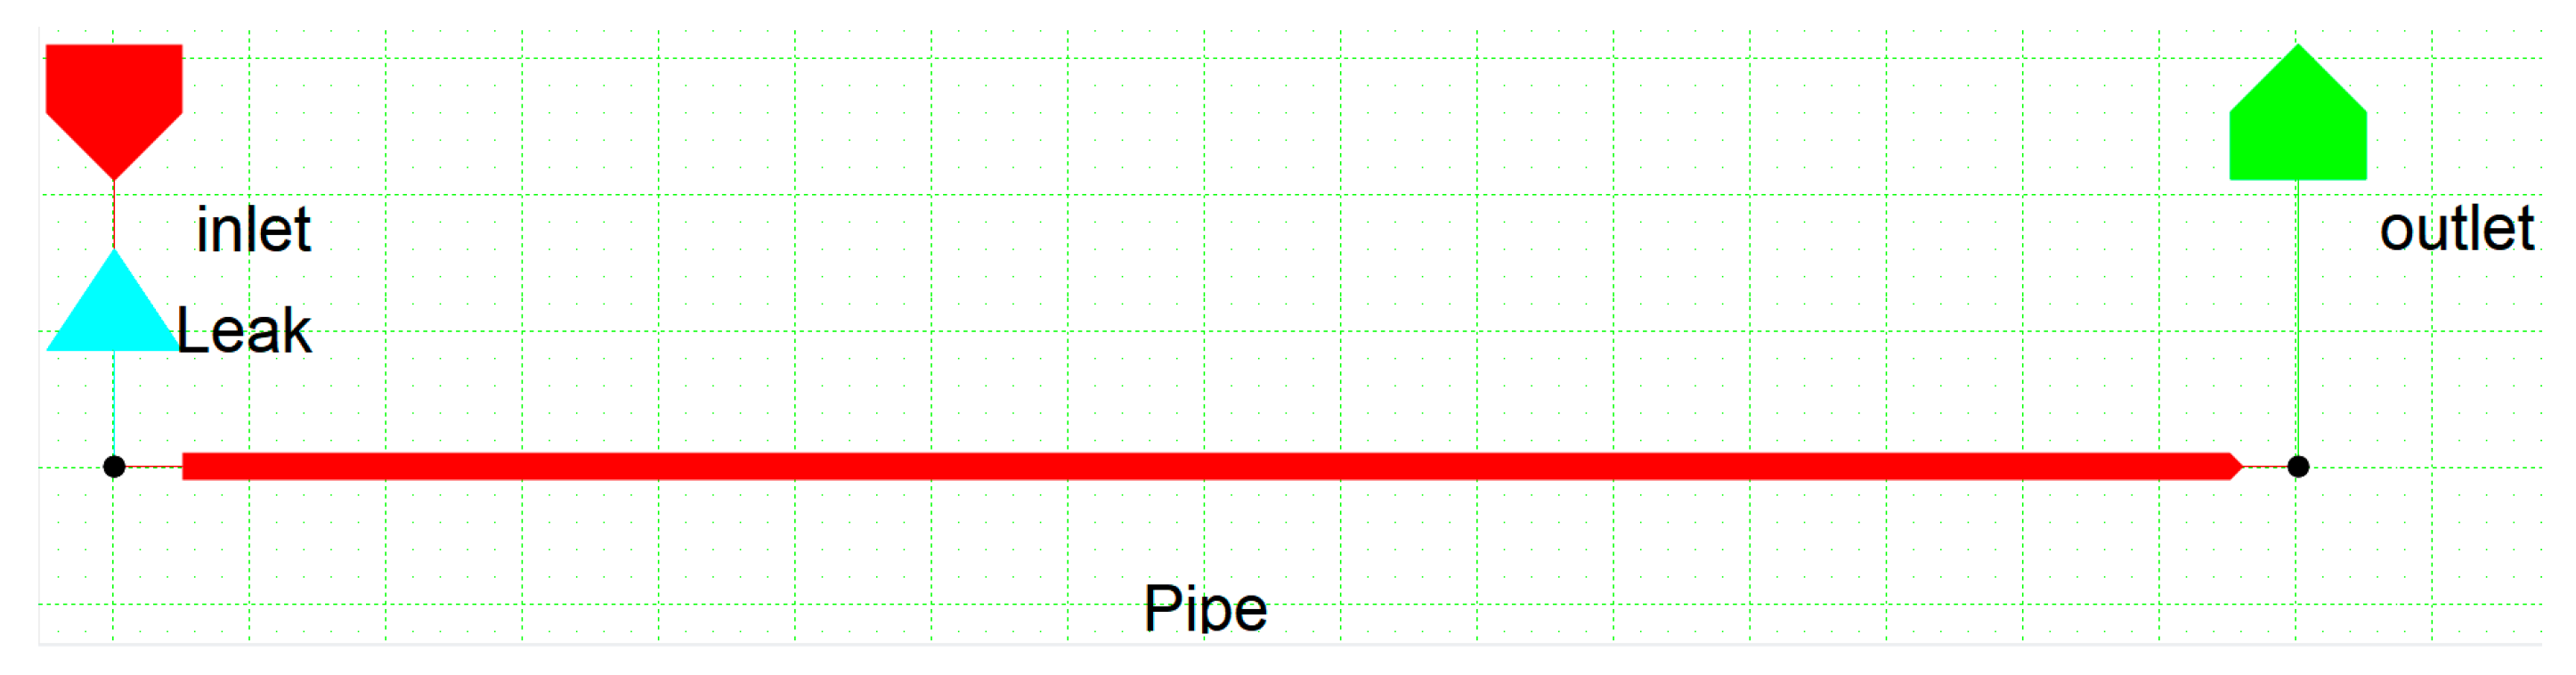
TGNET is mainly used for steady state/transient simulation of natural gas pipelines. In order to verify the feasibility of simulating supercritical CO2 pipelines using TGNET software, the impurity-containing dense-phase CO2 decompression characterization study conducted by K. K. Botros et al. [35] was utilized to conduct excitation tube tests and to validate the impurity-containing CO2 pipeline leakage model with the obtained test data. In this study, the pressure signal captured by the pressure sensor PT8 located at 31 m from the pipe inlet is selected as the control experimental data. The experimental conditions are shown in Table 1, and the simulation model is shown in Figure 6.
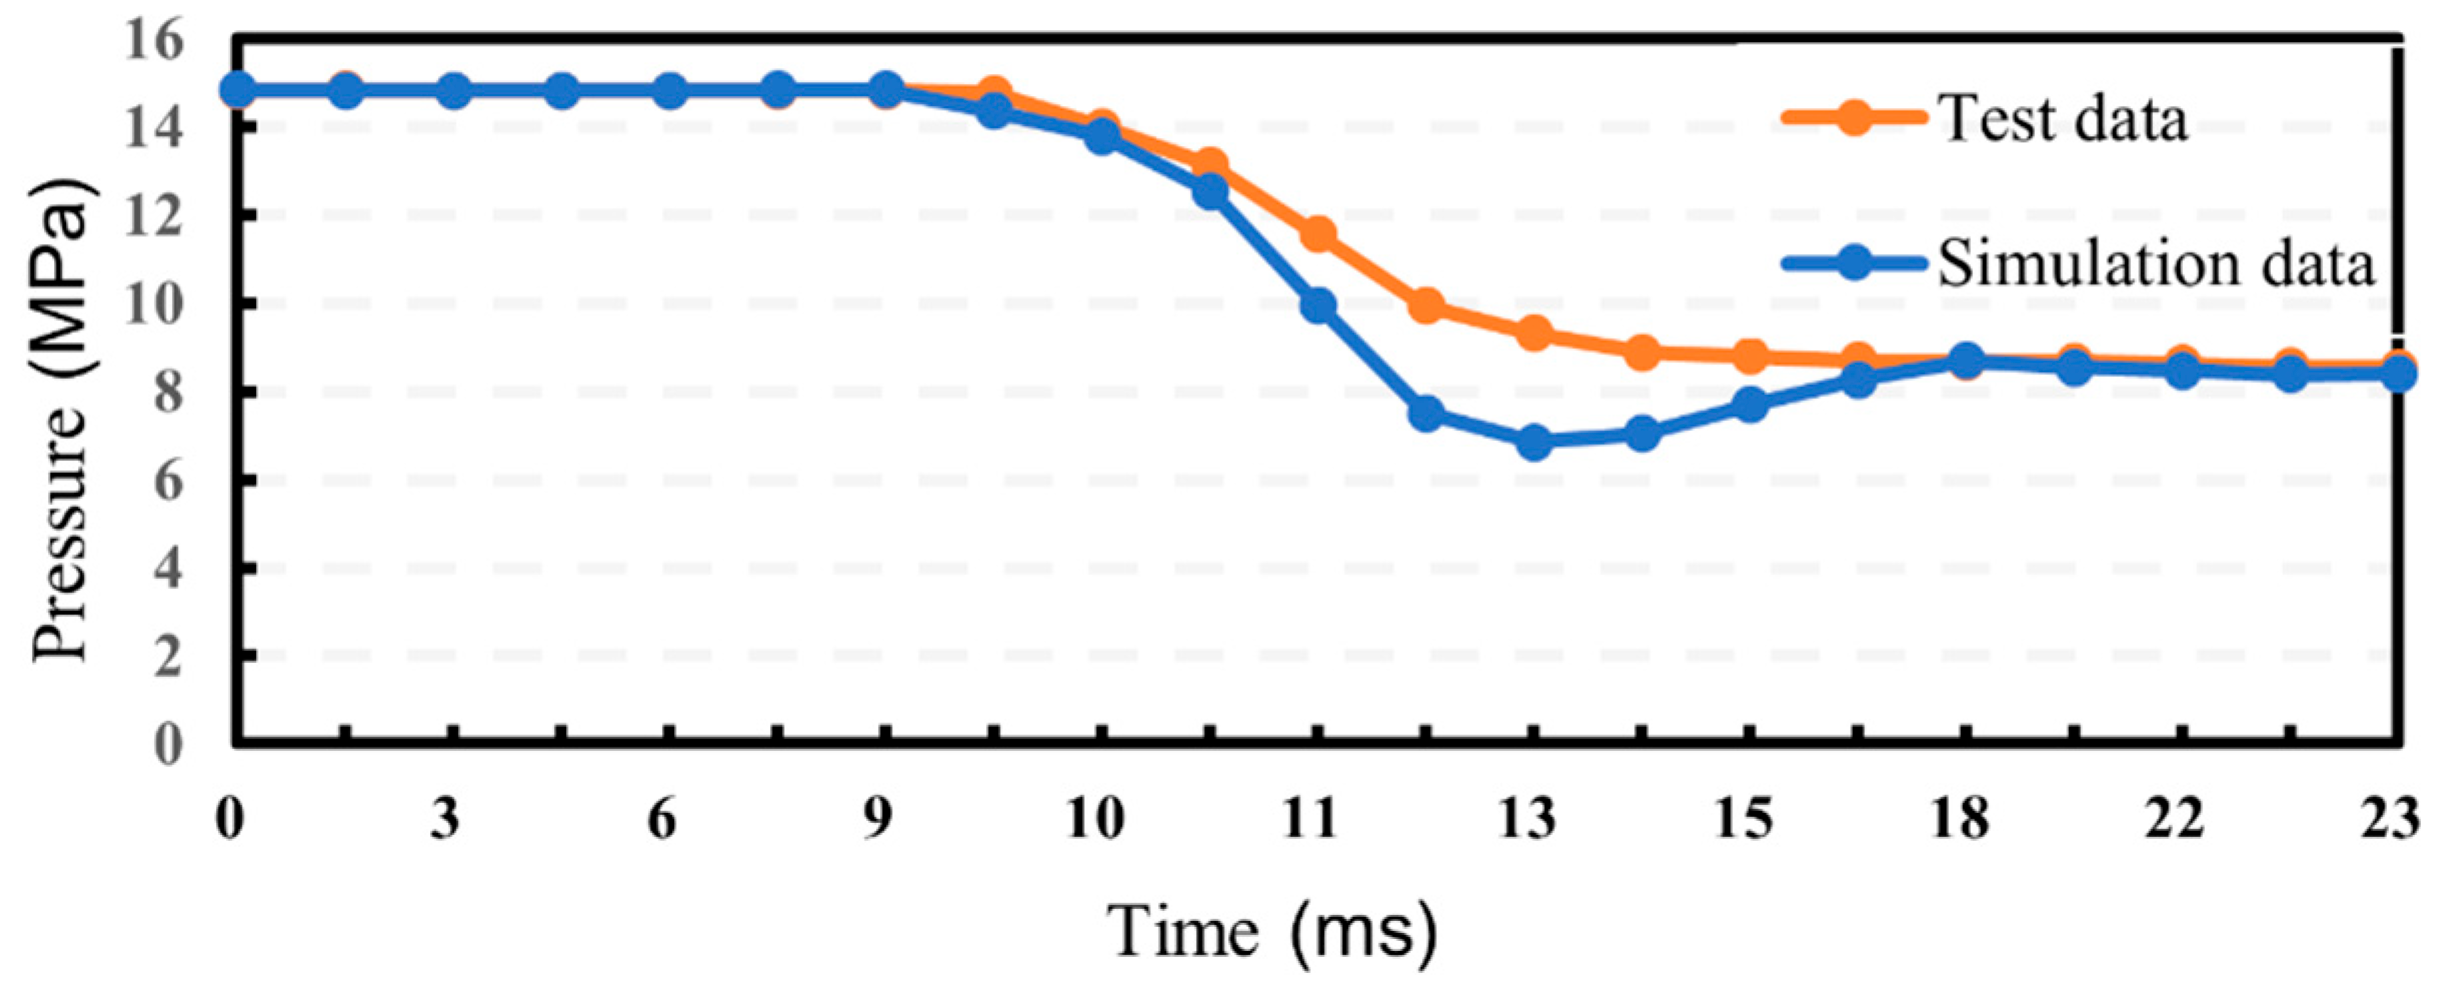
The measured data of the pressure sensor PT8 in Test#2 were simulated using the numerical simulation software TGNET, and a comparison of the measured and experimental data was obtained, as shown in Figure 7:
The simulation results show that the overall trend of the software simulation results is the same as that of the surge pipe test results. Before the downward trend of the pressure curve, the simulation results are in good agreement with the curve of the test results; the absolute error of the pressure curve in the second half of the downward edge is more than 1 MPa. After the experimental curves reached a new equilibrium, the absolute errors in pressure ranged from 0.00 MPa to 0.15 MPa, and the relative errors ranged from 0.00% to 2.10%. After analysis, we know that the simulation results in the falling section of the error is due to the test using rupture disc blasting, and the formation of man-made rules for the formation of the circular leakage of the time difference; however, the formation time of the leakage holes does not affect the time difference between the arrival of negative pressure waves at both ends of the pipeline, so the use of TGNET software to establish a model of the CO2 pipeline containing impurities for leakage simulation and localization of the analysis of the leakage simulation detection and localization is correct and feasible.

4.2. Signal Processing Method Validation

The experimental data from the dense-phase CO2 leakage experiments at the ECCSEL pressure reduction facility located at the Thermal Engineering Laboratory of the Norwegian University of Science and Technology in Trondheim were used, and the experimental data were analyzed and computed by MATLAB R2022a software to model the leakage localization as a function of the mutual correlation [36,37,38,39]. The pressure sensor locations are shown in Table 2.
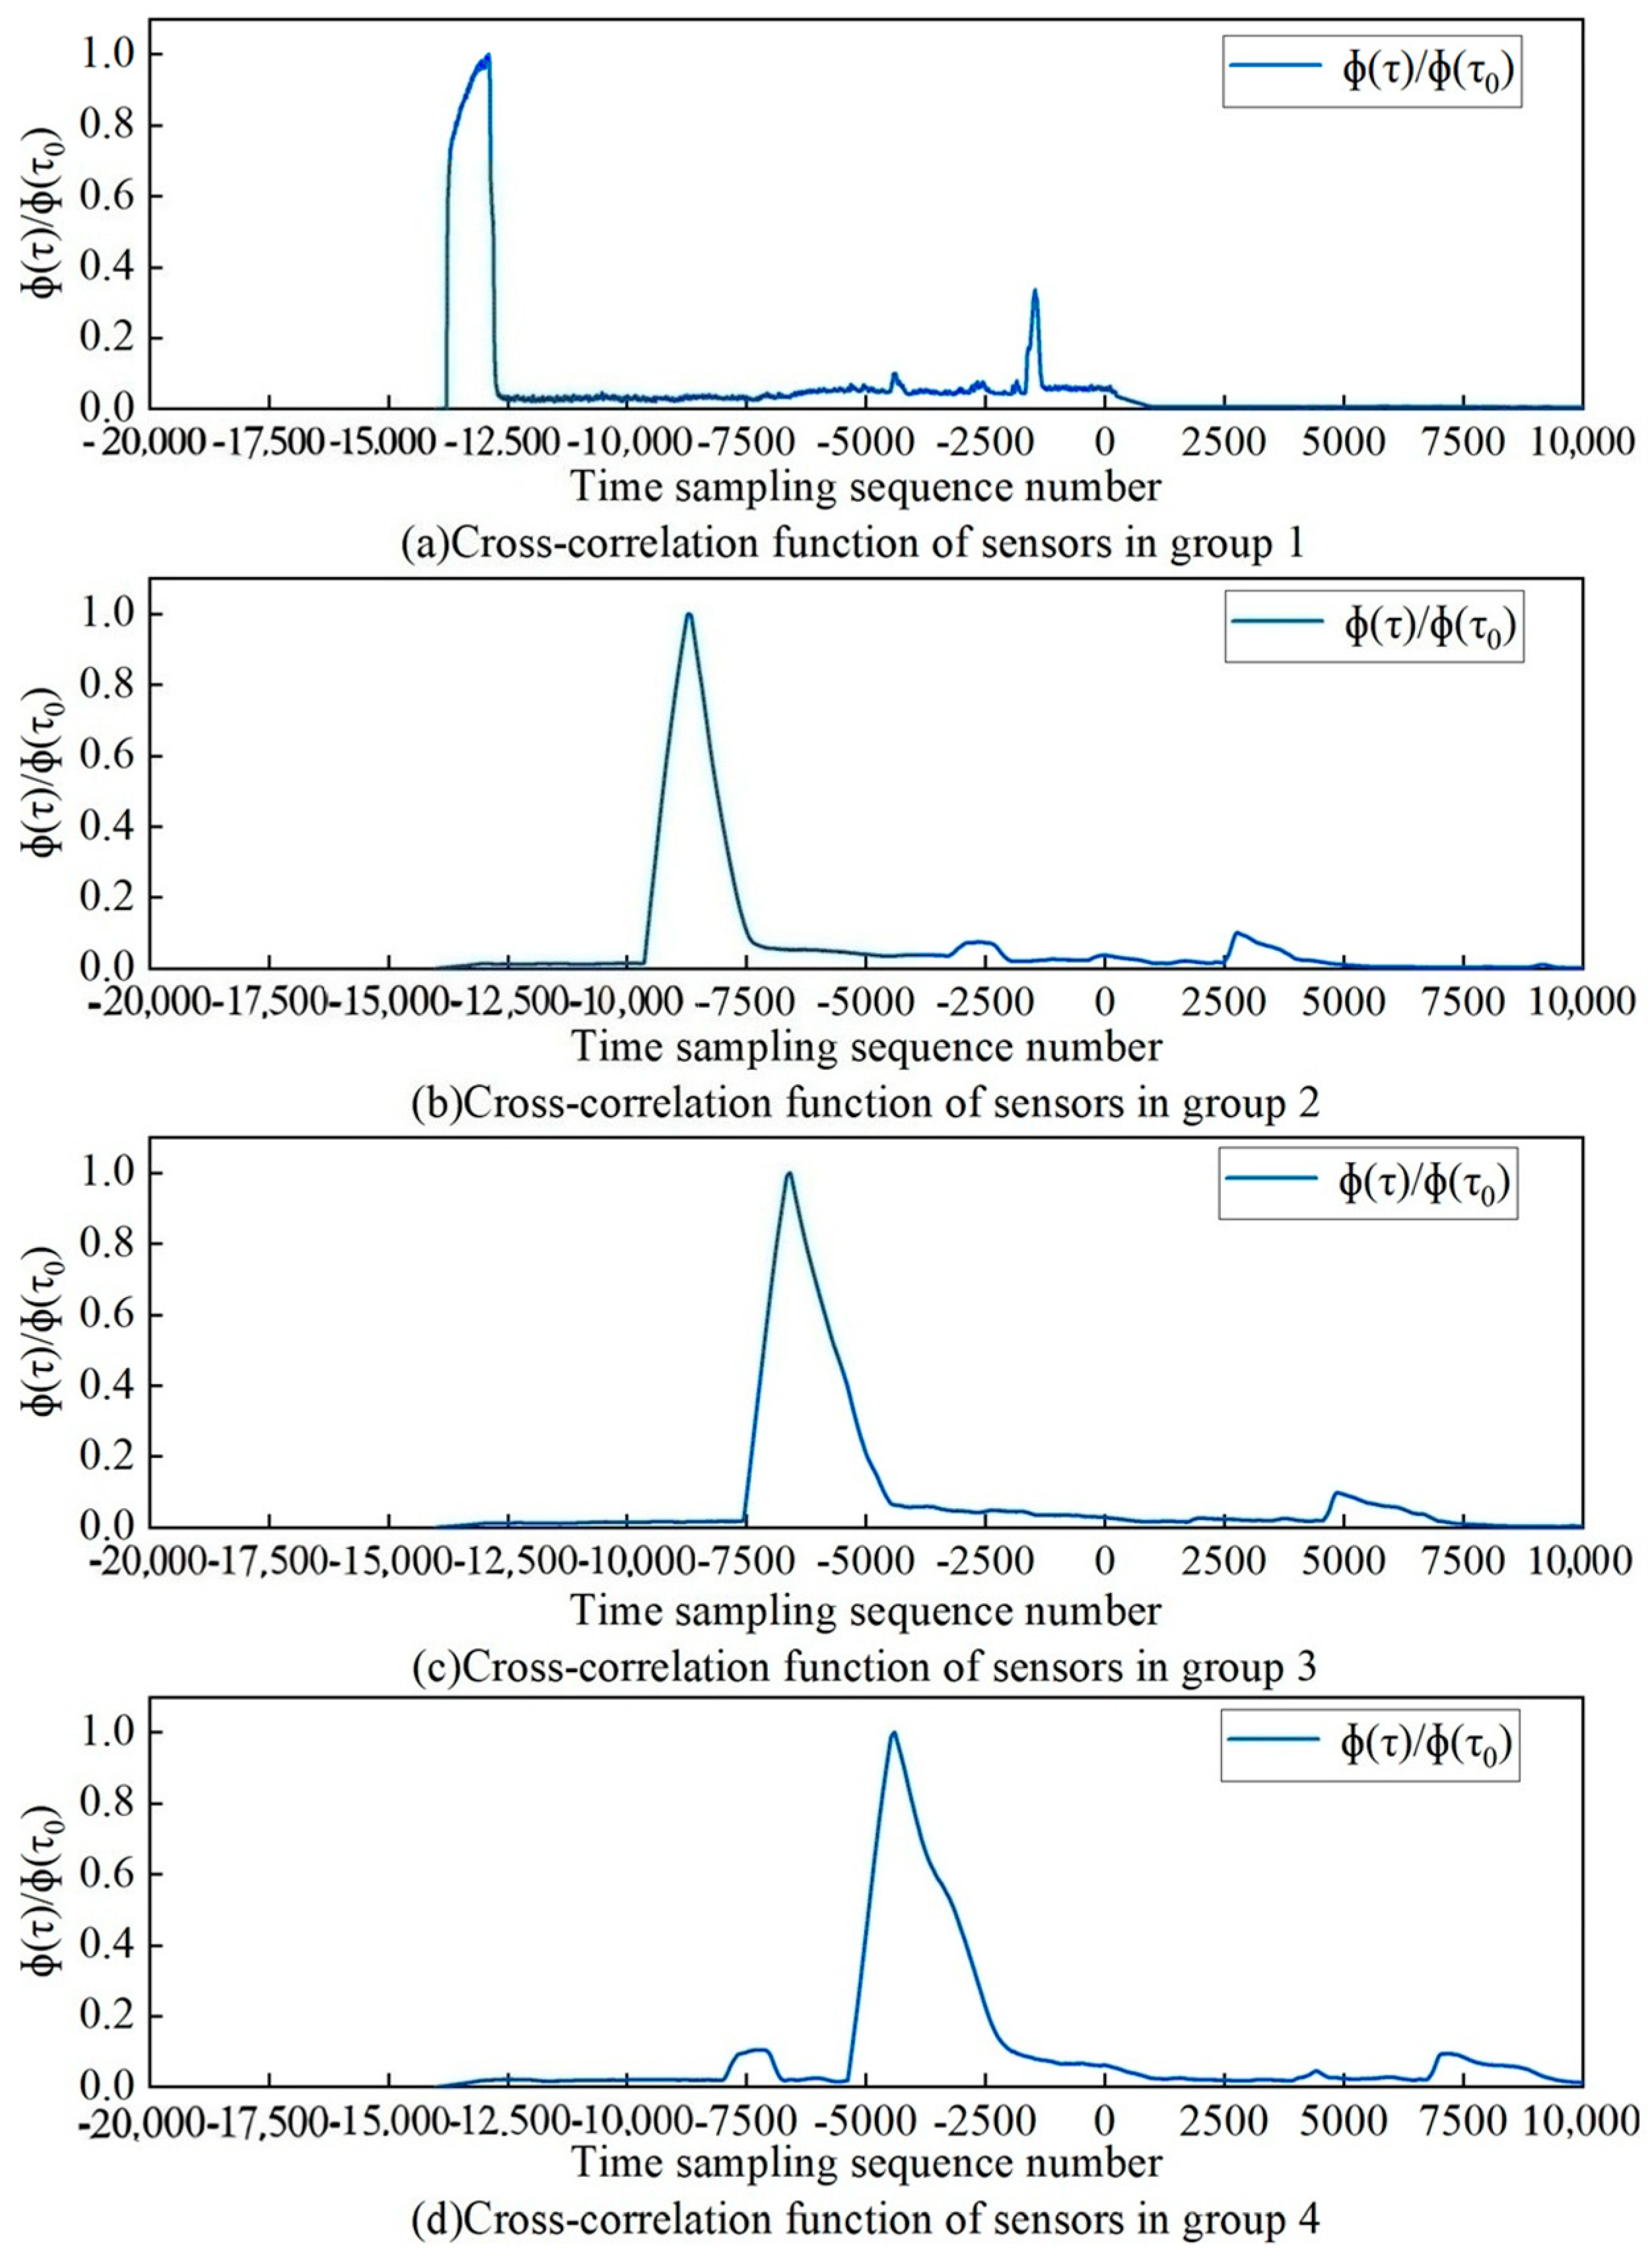
The four sets of differential pressure signals were analyzed for mutual correlation using MATLAB, and the simulation results are shown in Figure 8. The time difference between the arrival of the negative pressure wave at the two sensors is obtained by multiplying the maximum peak value of the cross-correlation function by the sampling time interval of 0.00001 s. A comparison of the experimentally obtained time difference with the simulation results of the cross-correlation analysis is shown in Table 3.
As can be seen from Figure 8, when the leakage occurs in the pipeline, the pressure signals detected at different locations of the pipeline have strong mutual correlation, and the time difference between the arrival of the negative pressure wave at different locations can be obtained through the mutual correlation analysis of differential pressure signals. Meanwhile, Table 3 shows that the accuracy of leakage time detection by mutual correlation analysis is high, and the overall relative error is controlled within ±1.5%, which meets the actual demand.

5. Yanchang Oilfield Engineering Practical Application

5.1. Practical Pipeline Modeling

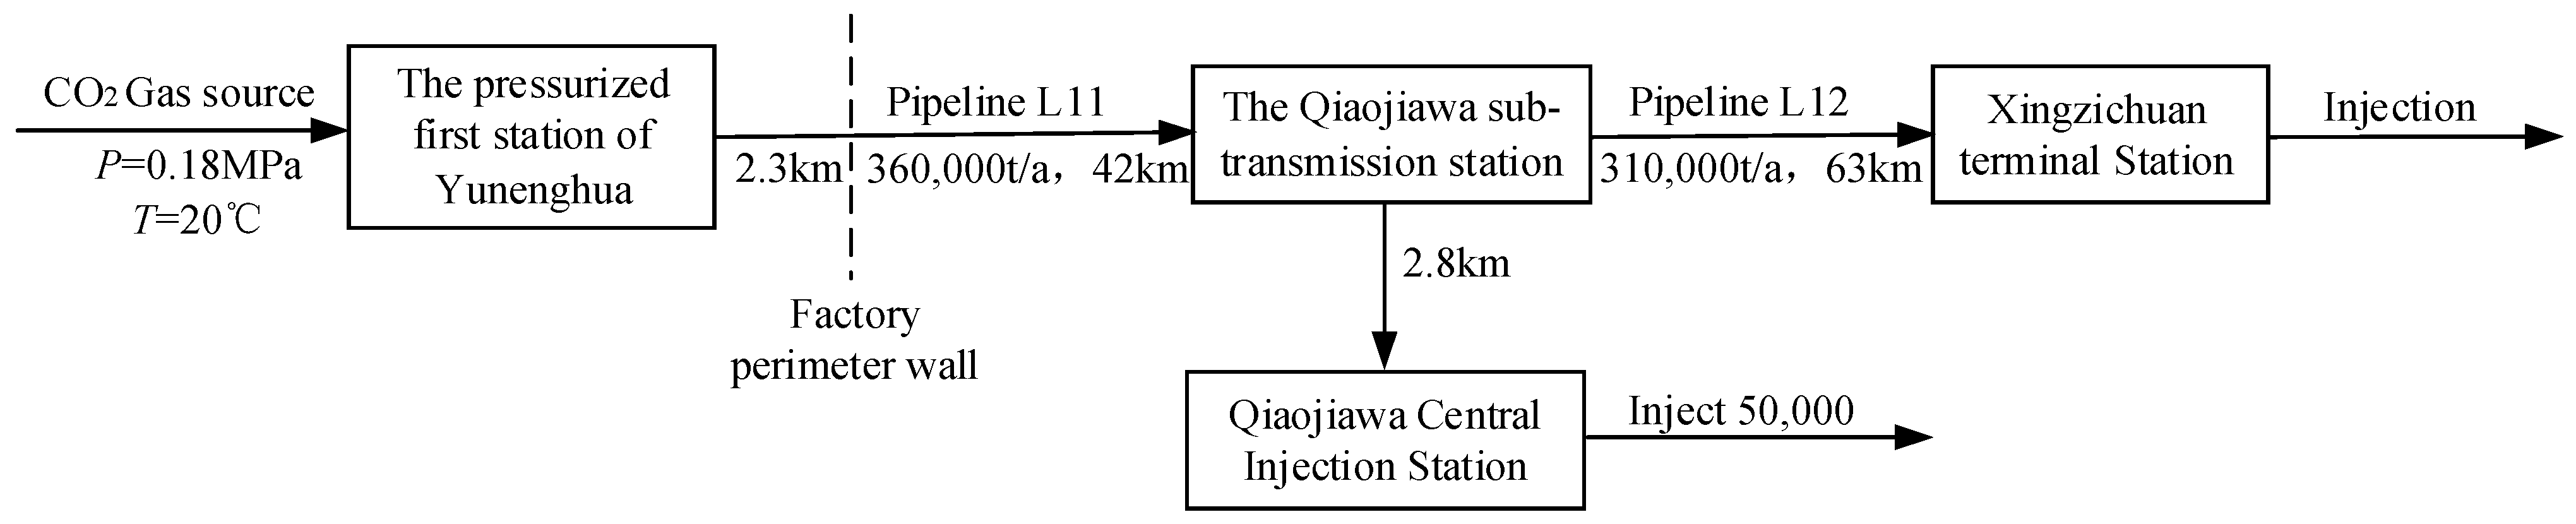
The CO2 pipeline transportation process plan for Yanchang Petroleum Group’s 360,000 t/a CCUS will be from transporting the high-purity CO2 captured by Yulin Nenghua to Qiaojiawa and Huaziping blocks for oil drive and sequestration, and the transportation flow chart is shown in Figure 9.
In this study, the first 5 km of pipeline from the pressurized first station of Yunenghua to the Qiaojiawa sub-transmission station is taken as the object of the study, and a single leaking pipeline is selected for dynamic simulation of different leakage locations and different leakage quantities, to test the application of the CO2 leakage detection model proposed in this study in actual engineering. The simulation results of the pipeline parameters for the optimal transmission scheme selected for the whole section of pipeline under conventional design are summarized in Table 4.
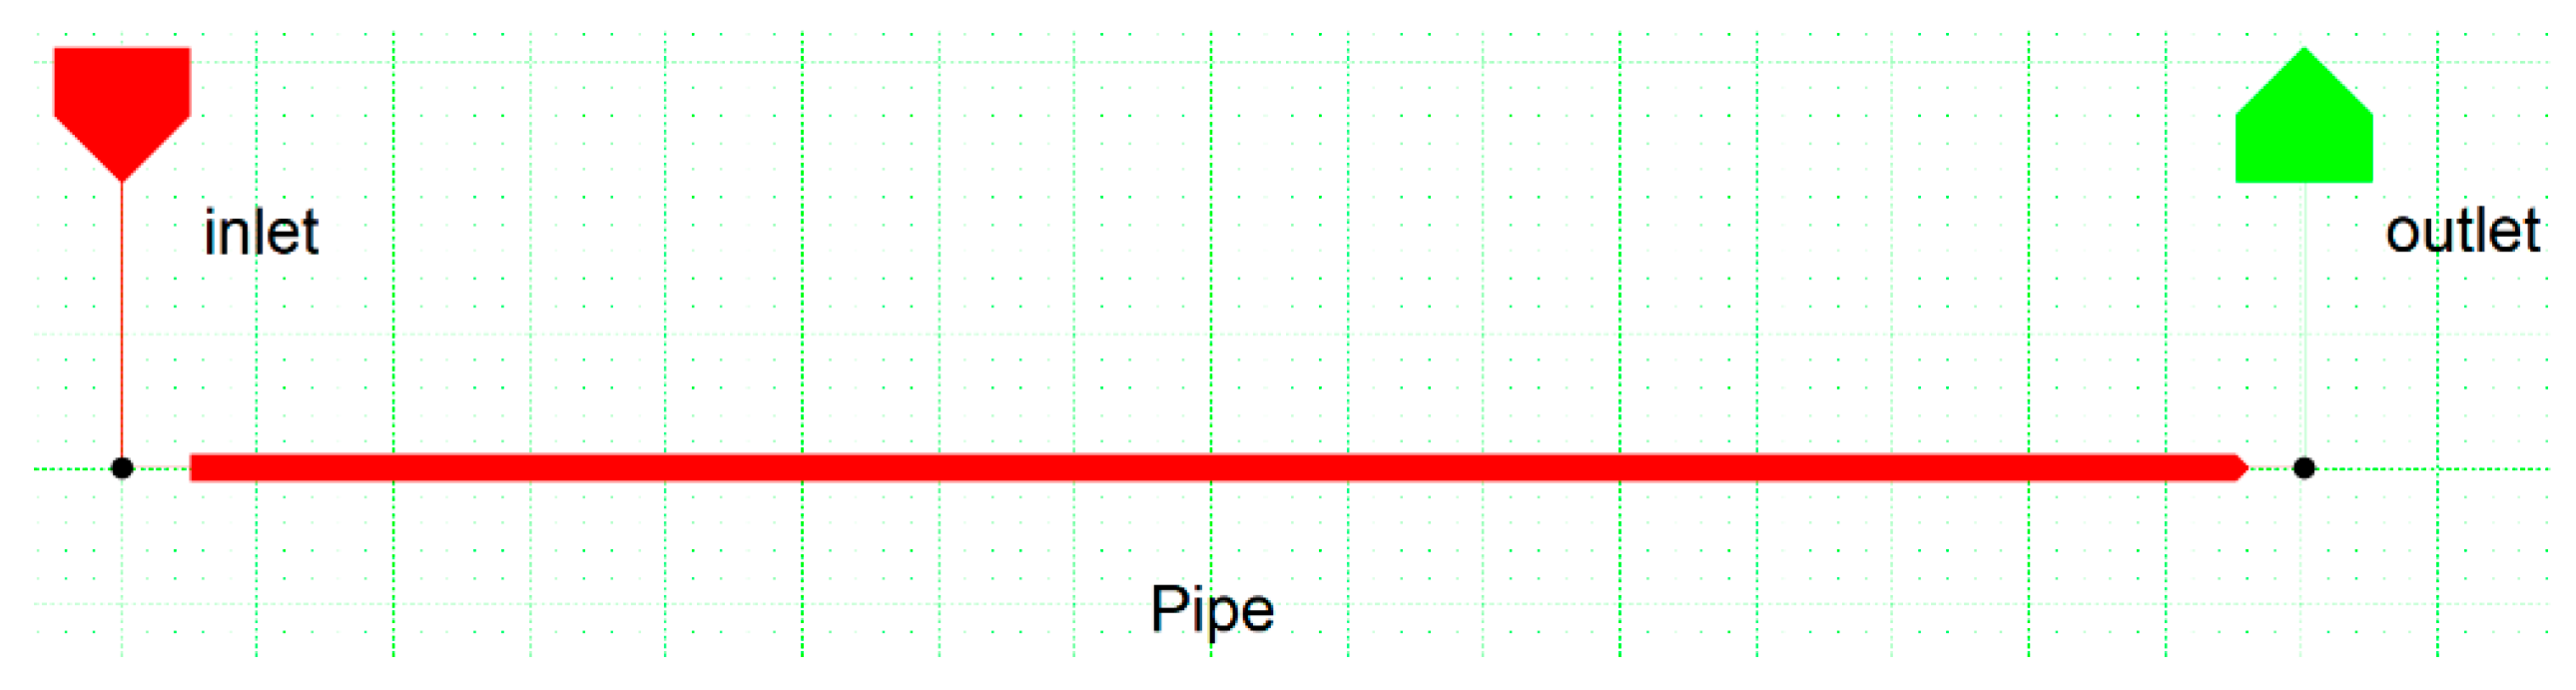
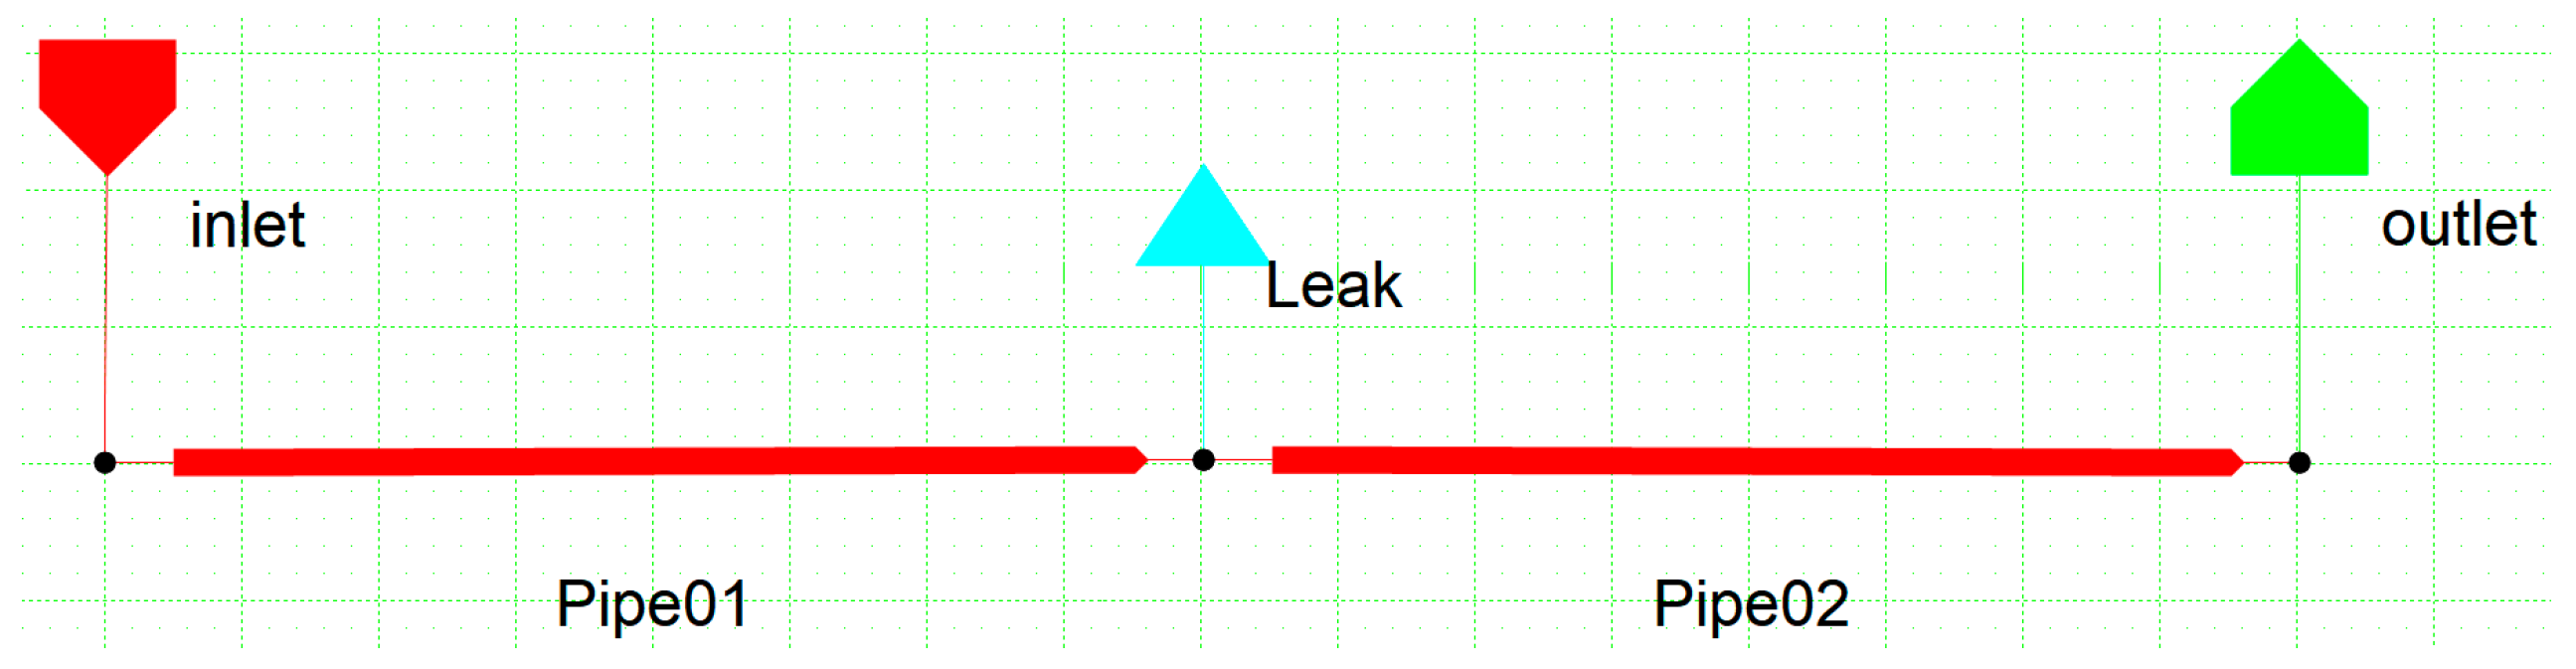
The density of the X80 pipeline steel pipe used in this scheme is 7850 kg·m−3, the elastic modulus of the pipe is 206 GPa, the Poisson’s ratio of the pipe is 0.31, and the yield strength and yield strength of the pipe are 555 MPa and 625 MPa, respectively. The pipeline model established in TGNET is shown in Figure 10 and Figure 11, and the first station of Yunenghua Booster Station is set as the inlet point, and the node of outlet at 5 km is set as the node of gas.

5.2. Parameter Settings

According to the actual pipe transmission parameters of the Yanchang Oilfield CCUS project, the required parameters for the model steady-state calculation and transient calculation are set, and the basic pipeline parameters introduced above are entered in the TGNET software, including pipeline length, pipe diameter, wall thickness, etc. We set the pipe roughness to 0.03 mm, the viscosity constant is 0.0110125, the PTV selection complete calculation, the friction coefficient Reynolds number transition zone is lower limit to 2100, the upper limit is 3900, and the pipeline conveying flow is also set to 11.9 kg·s−1. The energy of negative pressure wave signals generated by pipeline leakage is predominantly concentrated within the 0.01–3 Hz frequency range [40]. According to Nyquist-type, if the highest frequency of a continuous signal is f m a x , then the sampling frequency must satisfy f s 2 f m a x . Consequently, the sampling frequency is set to 10 Hz. The other parameters required for simulation are shown in Table 5.
The gas source components referenced in this study are shown in Table 6. In addition to setting up the gas source component in TGNET, the physical property parameters, including impurity CO2, need to be calculated using the GERE 2008 state equation in REFPROP (version 9.1) software to prepare for subsequent negative pressure wave velocity calculation [41].

5.3. Localization Performance Under Different Leakage Volumes

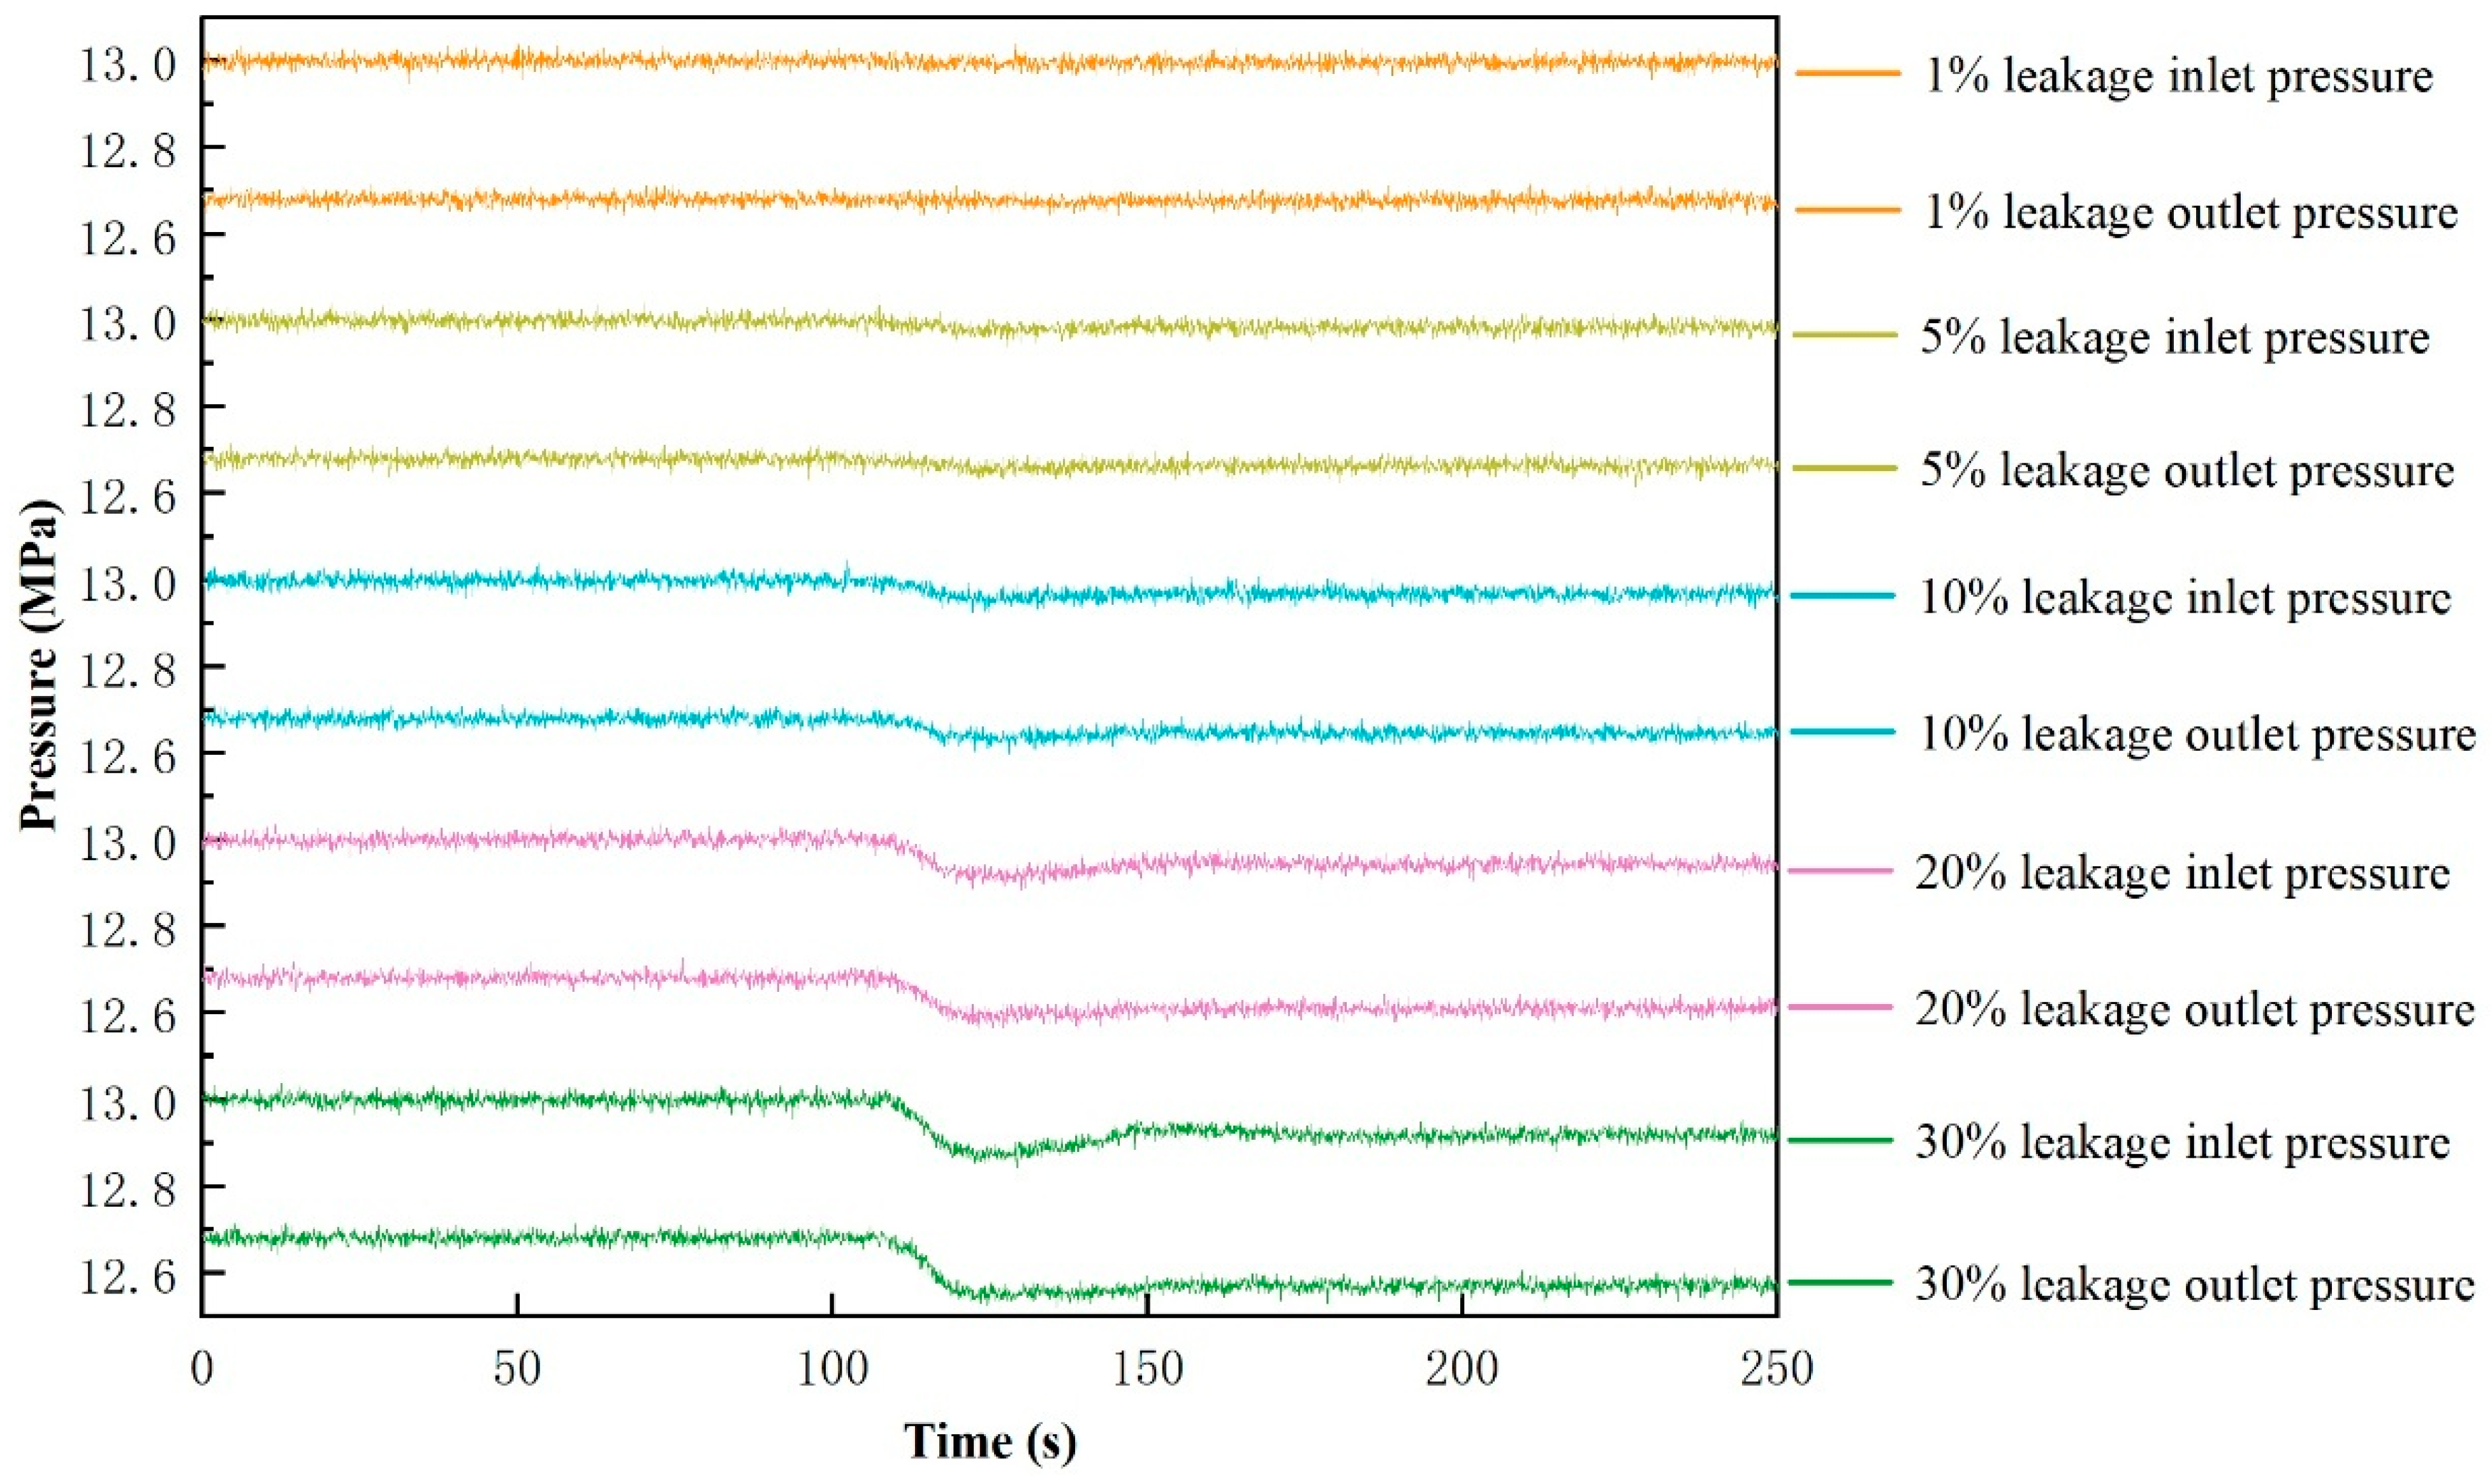
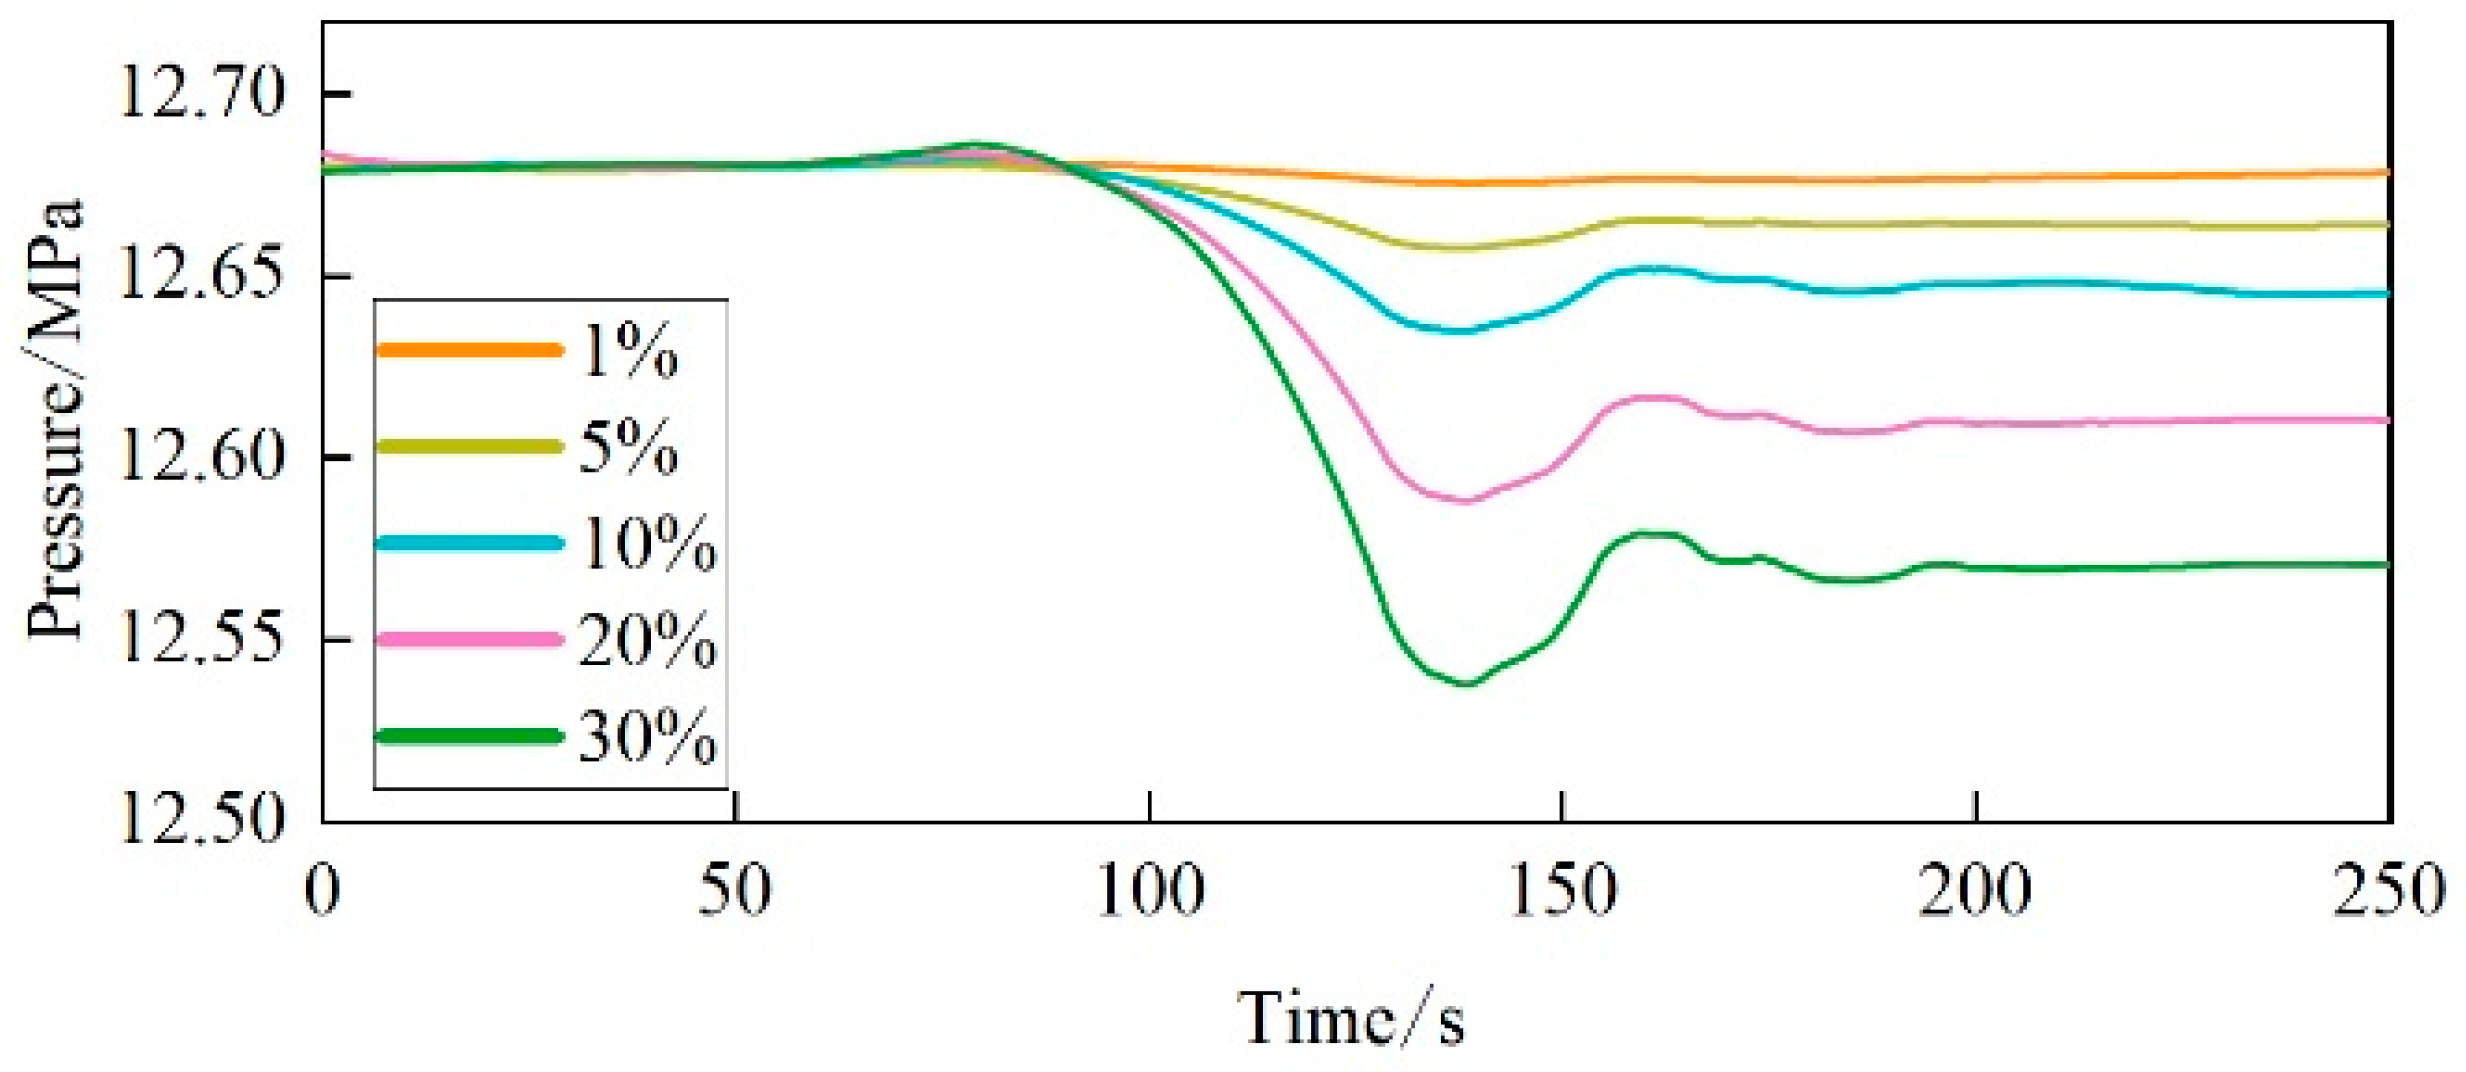
The leakage point is set at 2500 m of the pipeline, and the leakage aperture and leakage coefficient are adjusted so that the leakage amount is 1%, 5%, 10%, 20% and 30%, respectively. The localization performance under different leakage amounts is simulated and obtained. The inlet pressure and outlet pressure under different leakage amounts are shown in Figure 12.
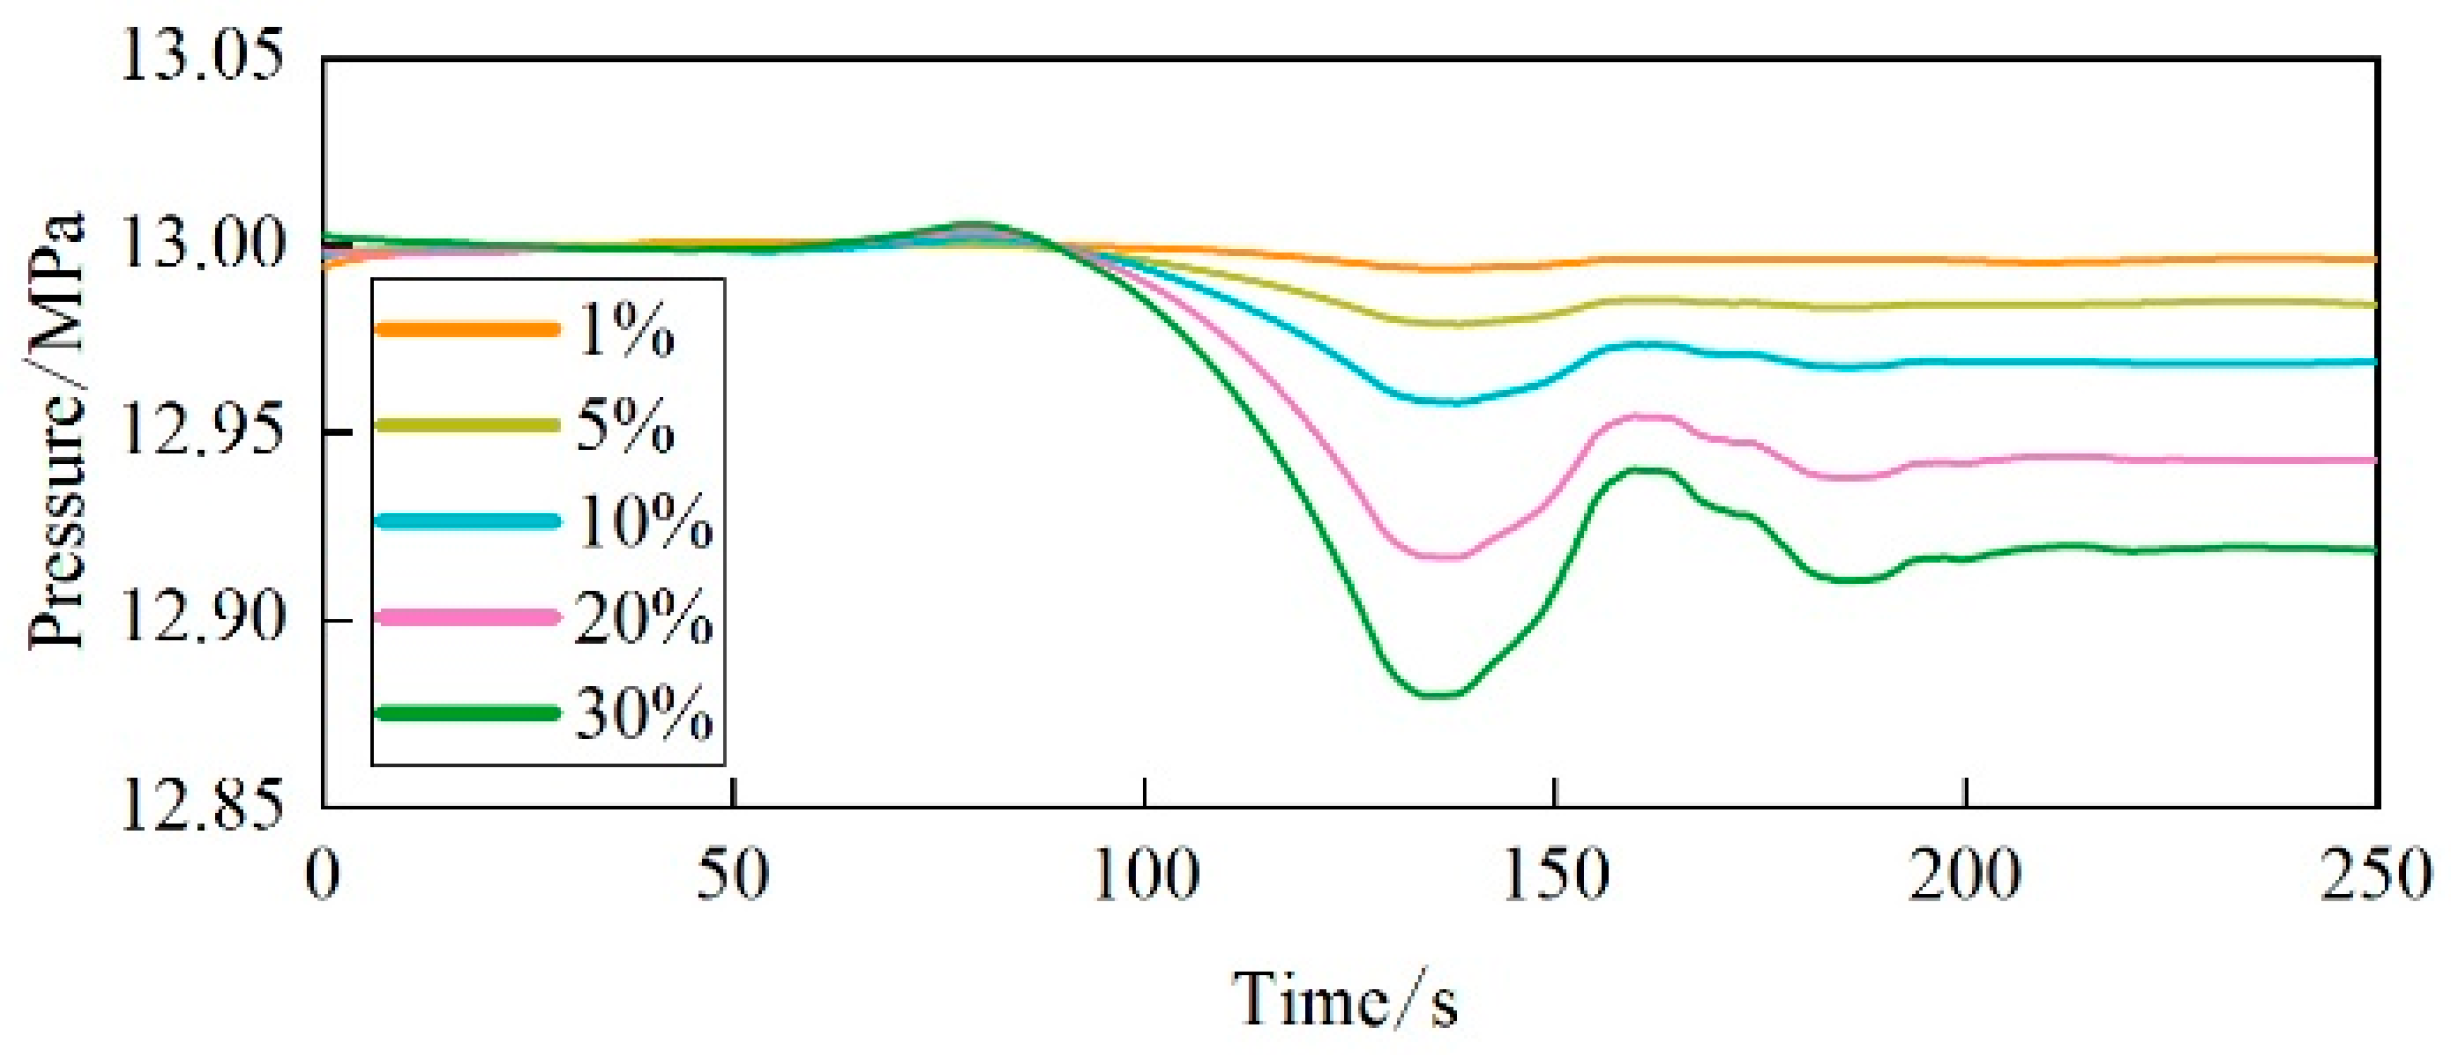
As shown in Figure 12, leakage volume significantly impacts the pressure waveforms at the inlet and outlet. When leakage is minimal, noise oscillations can substantially obscure the falling edge of the pressure waveform carrying leakage information, making it difficult to analyze the pressure waveform’s decay time without filtering. Noise reduction was applied to the acquired pressure signals using wavelet transform denoising technology. The denoised inlet and outlet pressure curves for different leakage rates are shown in Figure 13 and Figure 14.
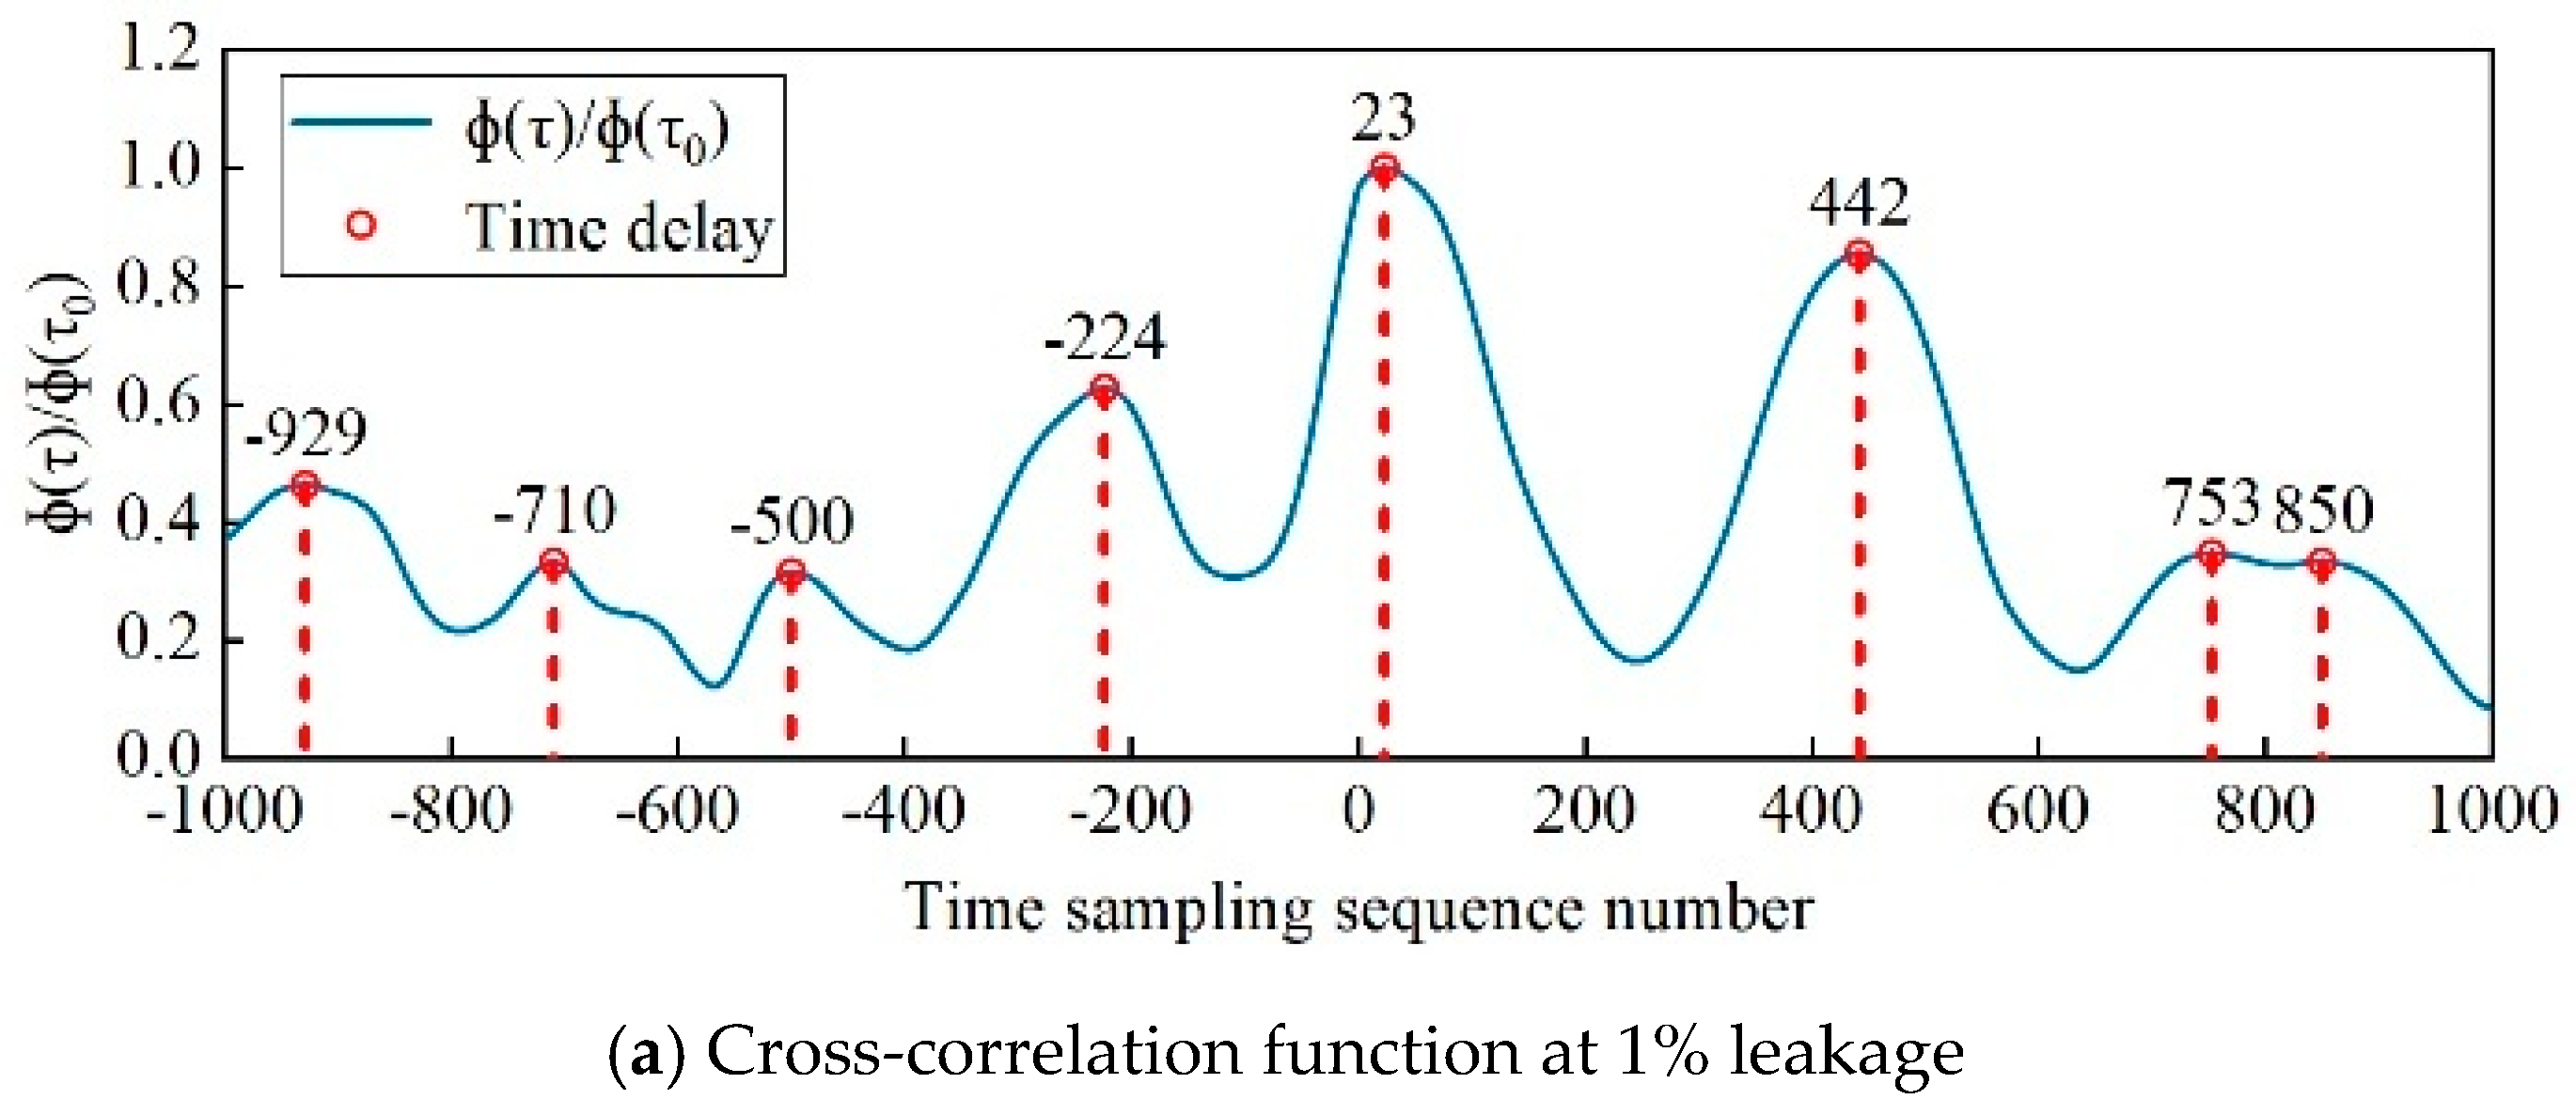
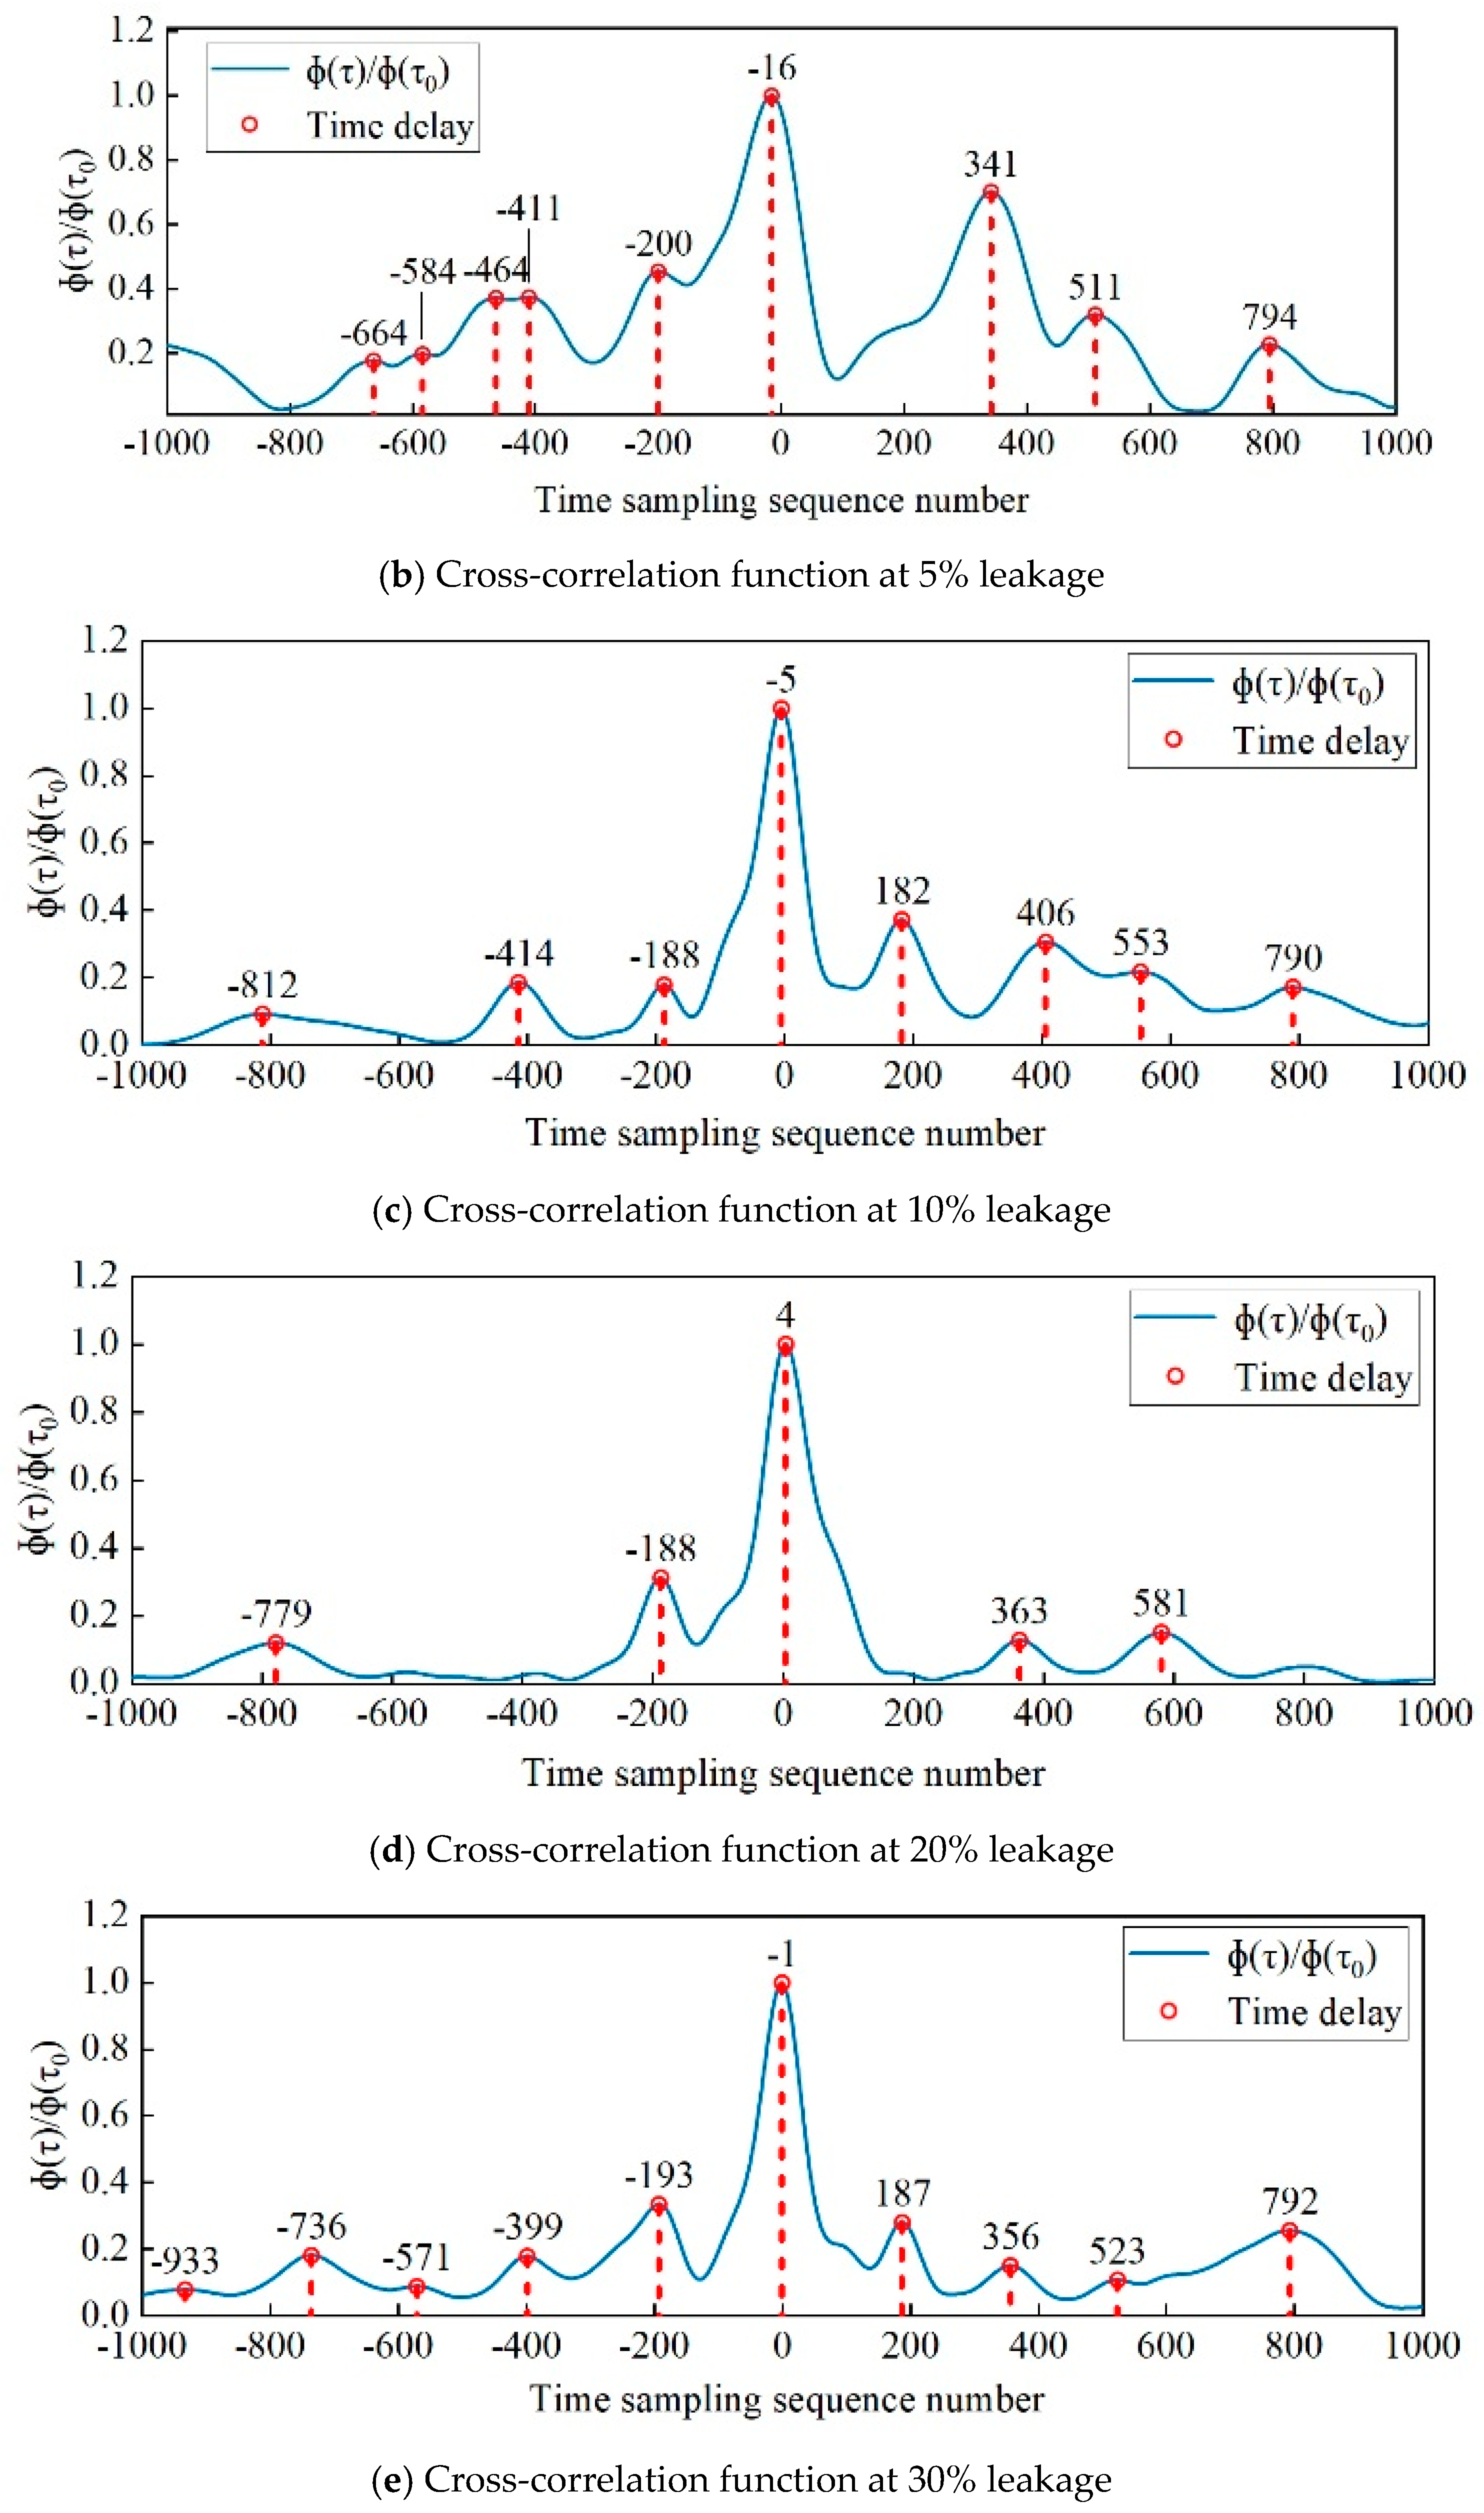
As shown in the figure, after applying wavelet transform-based noise reduction, all leakage scenarios exhibit distinct pressure drop characteristics 90s after leakage onset. The pressure drop process is clearly defined with pronounced peaks and troughs, effectively enhancing the signal-to-noise ratio of the negative pressure waveform. Cross-correlation analysis of the pressure data from Figure 13 and Figure 14 yields the cross-correlation functions for pressure signals at different leakage rates, as depicted in Figure 15.
As shown in Figure 15, when the leakage volume is small, the magnitude of the pressure drop caused by leakage is approximately equal to the amplitude of some noise fluctuations, leading to increased correlation between the noise signal and the leakage signal. However, when the leakage volume increases to 10%, the peak of the maximum correlation function becomes significantly higher than other peaks, enabling more precise detection of time-difference information.
Based on the pipeline transport parameters for supercritical CO2 at 360,000 t/a from Yanchang Oilfield and relevant X80 parameters, combined with the formula for calculating the negative pressure wave velocity within the pipeline (6), the negative pressure wave velocity a within the pipeline is obtained as:
a = K ρ 1 + K E   ·   D e C = 101.25   ×   10 6 880 1 + 101.25   ×   10 6 2.06   ×   10 11   ×   156 6 ( 1 0.31 2 ) = 337.38   m / s
We calculate the leakage location at different leak rates when the leakage point is 2500 m away. Taking the cross-correlation function of pressure at a 30% leakage rate as an example, the negative pressure wave method is used to calculate the leakage point location. The time difference between the arrival of the negative pressure wave at the pipeline inlet and outlet is −0.1 s. Based on Equation (7), the distance x from the leakage point to the pipeline inlet is calculated as:
x = L + a × Δ t 2 = 5000 + 337.38 × ( 0.1 ) 2 = 2483.13   m
Using the total pipeline length as the normalization reference not only avoids amplifying errors from leakage near the starting point but also reflects the localization capability across the entire pipeline scale. Therefore, the relative error is expressed as:
δ = x x 0 L × 100 %
where x is the actual detection location, m; x 0 is the actual leakage location, m; and L is the total pipeline length, m.
The relative error in calculating the leakage detection location was determined to be 0.34%. The simulation calculation process for leakage rates of 5%, 10%, 20%, and 30% was identical to that for 30%. The estimated leakage point values at different leakage locations were calculated, with the relative error parameter data summarized in Table 7.
As shown in Table 7, the leakage detection method for supercritical CO2 pipelines, based on negative pressure wave signals combined with cross-correlation analysis, exhibits positioning accuracy closely correlated with leakage magnitude. By enhancing negative pressure wave characteristics and employing cross-correlation analysis, this method effectively addresses the challenges of indistinct negative pressure wave features and localization difficulties during low-leakage conditions. When leakage exceeds 5%, the relative localization error is controlled within ±5.40%. According to the performance evaluation principles for leakage detection systems outlined in API RP 1130 (Computational Pipeline Monitoring for Liquids), this localization accuracy meets the preliminary localization requirements for rapid identification and regional determination in engineering applications.

6. Conclusions

(1) Leveraging the fact that severe Joule–Thomson effects during supercritical CO2 pipeline leakage generate significant temperature–pressure fluctuations, a negative pressure wave method based on dynamic modeling is proposed for detecting leakage in supercritical CO2 pipelines. Addressing the issue of large mean pressures in supercritical fluids resulting in indistinct characteristic signals, a mean-value conversion method is introduced to transform pressure curves into differential pressure curves.
(2) When a pipeline leakage occurs, pressure signals detected at different pipeline locations exhibit strong cross-correlation. By analyzing the cross-correlation of pressure differential signals, the time difference for negative pressure waves to reach various locations can be determined. This cross-correlation analysis provides high accuracy in leakage detection timing, with overall relative error controlled within ±1.5%, enabling more precise localization of the leakage.
(3) Through leakage simulation of the 360,000 t/a CO2 pipeline project in Yanchang Oilfield, this study analyzes the application of a leakage detection method combining negative pressure waves with cross-correlation analysis on actual long-distance CO2 pipelines. The positioning accuracy of this method at leakage points with varying leakage rates is closely correlated with the magnitude of the leakage. When the leakage rate exceeds 5%, the relative error is controlled within ±5.40%, meeting the preliminary localization requirements for rapid identification and regional determination in engineering applications. Building upon this foundation, more precise leakage point localization can be achieved by integrating advanced techniques such as acoustic emission analysis and vibration analysis within the constraints of the preliminary localization results.
(4) This study employs a 5 km pipeline as the numerical simulation condition. In engineering practice, monitoring sensors are typically deployed at shut-off valves every 15 km, effectively limiting the monitoring interval to within 15 km to ensure threshold stability and detection reliability. For pipelines at the 15 km scale, the propagation distance of negative pressure waves is relatively short, resulting in limited waveform attenuation and distortion effects. Consequently, upstream and downstream pressure signals exhibit high similarity. When employing this leakage detection method, the requirements for signal amplitude and correlation peaks are relatively reduced, thereby allowing for a more lenient minimum detectable leakage threshold.
(5) Negative pressure waves experience attenuation when propagating through curved sections. This attenuation reduces the peak amplitude of cross-correlation signals and increases detection uncertainty. Consideration may be given to integrating multi-scale signal processing techniques or combining with other detection methods. When multiple leakage sources exist within the pipeline or leakage locations are randomly distributed, the superposition of negative pressure waves may induce multi-peak phenomena within the cross-correlation function. The interpretability of such phenomena warrants further investigation, and it is recommended that subsequent research delve deeper into this matter.

Author Contributions

Conceptualization, B.C., H.F. and X.W.; methodology, B.C., X.W.; software, H.F., J.B.; validation, H.F. and J.B.; formal analysis, C.T. and W.Q.; investigation, H.F. and C.T.; data curation, H.F.; writing—original draft preparation, H.F., C.T.; writing—review and editing, B.C., H.F., H.X. and A.O.; visualization, H.F. and H.X.; supervision, X.W. and A.O.; project administration, B.C., C.T. and X.W.; funding acquisition, B.C., C.T. and X.W. All authors have read and agreed to the published version of the manuscript.

Funding

This research is supported by the Shaanxi Provincial Natural Science Basic Research Program (2025JC-YBMS-531) and the Scientists of the Xi’an Municipal Science & Technology Bureau+ Engineer Workforce Development Project (25KGYB00003).

Data Availability Statement

Most of the data presented in this paper are included in the main manuscript and additional data are available from the corresponding author upon reasonable request.

Conflicts of Interest

Author Xiangzeng Wang was employed by the company Shaanxi Yanchang Petroleum (Group) Co., Ltd. The remaining authors declare that the research was conducted in the absence of any commercial or financial relationships that could be construed as a potential conflict of interest.

References

  1. Jiang, K.; Ashworth, P. The development of Carbon Capture Utilization and Storage (CCUS) research in China: A bibliometric perspective. Renew. Sustain. Energy Rev. 2021, 138, 110521. [Google Scholar] [CrossRef]
  2. Chen, S.; Liu, J.; Zhang, Q.; Teng, F.; McLellan, B.C. A critical review on deployment planning and risk analysis of carbon capture, utilization, and storage (CCUS) toward carbon neutrality. Renew. Sustain. Energy Rev. 2022, 167, 112537. [Google Scholar] [CrossRef]
  3. Chen, B.; Guo, H.; Cui, W.; Xiao, H. Simulation analysis of leakage and diffusion of CO2 with impurities. Chem. Eng. Oil Gas 2019, 48, 104–109. Available online: https://kns.cnki.net/kcms2/article/abstract?v=-djcopRf0qHelxyiyOtlQIc8JO_1D16Yx3ph41PqTAep0F6yXYkD72exKQndsDzusTL9aIuELDASxA-vjObhZWN7KCs6XpRBxrDriwa6uArWTp5vtF013I7WxF4aLm1DZ6embCN8KiyRPCjVEPg_Vo8TydUeGB6a6uVOS1on2GrtUQgMUh1eaCOQtO32xOSI&uniplatform=NZKPT&language=CHS (accessed on 12 July 2019). [CrossRef]
  4. Li, S.; Zhang, Y.; Lin, Q.; Li, Y.; Liang, X. Topography modelling for potentially leaked CO2 diffusion and its application in human health risk assessment for carbon capture, utilization, and storage engineering in China. Int. J. Greenh. Gas Control 2022, 119, 103714. [Google Scholar] [CrossRef]
  5. Khan, M.N.; Mir, A.; Mond, M.A.; Riaz, M.; Ahmad, I. Volumetric flow and pressure gradient-based leak detection system for oil and gas pipelines. Int. J. Oil Gas Coal Technol. 2020, 25, 340–356. [Google Scholar] [CrossRef]
  6. Zhang, H.; Shen, M.; Huo, Z.; Zhang, Y.; Shu, L.; Li, Y. Research on Gas Drainage Pipeline Leakage Detection and Localization Based on the Pressure Gradient Method. Processes 2024, 12, 1590. [Google Scholar] [CrossRef]
  7. Adefila, K.; Yan, Y. A A compendium of CO2 leakage detection and monitoring techniques in carbon capture and storage (CCS) pipelines. In Proceedings of the Eurocon 2013; IEEE: Piscataway, NJ, USA, 2013; pp. 1328–1335. [Google Scholar] [CrossRef]
  8. Li, X.; Ma, Y. Research on Leakage Localization in Gaseous CO2 Pipelines Using the Acoustic Emission Method. Appl. Sci. 2025, 15, 10501. [Google Scholar] [CrossRef]
  9. Cui, X.; Yan, Y.; Guo, M.; Han, X. Leakage detection and localization study of CO2 transportation devices based acoustic emission. Instrum. Tech. Sens. 2016, 407, 136–140+164. Available online: https://kns.cnki.net/kcms2/article/abstract?v=-djcopRf0qFuKoaLaoAd1hvanYiJWag65mthYtQ1ZIN604sSsqp5xBVsOhRwb-E3s7dpVuIGkqCLyniLlhtW1PNjN2KxpgmkrgGYSBbjekONEbzfHZ6_KT-YbfJA-x76X0vUfk5808_yjAwv968seSoNvJ1K4q3TeLQjrI-_nCQDQWyU8puDjfdmTzXYeXu6&uniplatform=NZKPT&language=CHS (accessed on 7 February 2017).
  10. Wang, Z.; Wang, H.; Fu, L.; Mu, S.; Wang, L. Pipeline detection method based on multiple-pressure sensor and negative pressure wave. Transducer Microsyst. Technol. 2015, 34, 115–118. [Google Scholar] [CrossRef]
  11. Wang, Y.; Chen, H.; Yang, Y.; Zhou, H.; Zhang, G.; Ren, B.; Yuan, Y. An Adaptive Grid Generation Approach to Pipeline Leakage Rapid Localization Based on Time Reversal. Sensors 2025, 25, 1753. [Google Scholar] [CrossRef]
  12. Jiang, Z.; Wang, Y.; Ning, H.; Yang, Y. Research on Application of Convolutional Gated Recurrent Unit Combined with Attention Mechanism in Water Supply Pipeline Leakage Identification and Location Method. Water 2025, 17, 575. [Google Scholar] [CrossRef]
  13. Xiao, H.; Zhang, Y.; Wang, J. Virtual error quantification of cross-correlation algorithm for solids velocity measurement in different gas fluidization regimes. Chem. Eng. Sci. 2021, 246, 117013. [Google Scholar] [CrossRef]
  14. Xiao, H.; Oloruntoba, A.; Ke, X.; Gao, K.; Duan, L.; Liu, C.; Zhang, Y.; Wang, J. Improving the precision of solids velocity measurement in gas-solid fluidized beds with a hybrid machine learning model. Chem. Eng. Sci. 2024, 285, 119579. [Google Scholar] [CrossRef]
  15. Yang, Z.; Hu, Y. A data fusion algorithm for CO2 leakage monitoring based on improved Kalman filter. J. Nanyang Inst. Technol. 2021, 13, 59–64. [Google Scholar] [CrossRef]
  16. Zhang, H.; Li, C.; Luo, G.; Cui, Y. Real-time detection and location system for pipeline leakage. Chem. Eng. Oil Gas 2004, 33, 214–216. Available online: https://kns.cnki.net/kcms2/article/abstract?v=-djcopRf0qEt-ghodDX4tdX7xX_gHTJfZ6H6od0jVZvJr0mlmSv7bqDe2i1qondj0M0IazWeh_9JcaeLis7-NTZz9635hb31Qy0p21d4-oTZtciguq87pnbkLM-op4Z8G7iwGxzwtZND9xosnAnednD4vAf5JWAKFOFc-FdXapNvrtBuOIUS5g==&uniplatform=NZKPT&language=CHS (accessed on 19 August 2005).
  17. Liu, B.; Jiang, Z.; Nie, W. Negative pressure wave denoising based on VMD and its application in pipeline leak location. J. Mech. Sci. Technol. 2021, 35, 5023–5032. [Google Scholar] [CrossRef]
  18. Chen, X.; Jiang, Z.; Li, J.; Zhao, Z.; Cao, Y. Research on Signal Noise Reduction and Leakage Localization in Urban Water Supply Pipelines Based on Northern Goshawk Optimization. Sensors 2024, 24, 6091. [Google Scholar] [CrossRef]
  19. Chen, Q.; Jiao, J.; Xing, X.; Sheng, X.; Li, X. Dynamic Simulation and Influencing Factor Analysis of Water Hammer Process of Supercritical Carbon, Dioxide Transportation Pipeline during Valve Closing. J. Xi’an Shiyou Univ. (Nat. Sci. Ed.) 2025, 40, 133–142. Available online: https://kns.cnki.net/kcms2/article/abstract?v=-djcopRf0qHIyev4o2XGMy3ezY7IoQSBDvMB6h7cDGI0yDpYcLzQUSRnT09cE0DLsmg38B0iBmE9usr6TEfquoS5jsPE-Nrv29qWLUh_niKOCONmjki3lXztnPGwn4UxMIbrxv7a7zlHWif0boD3vDDc0dMTDxCBNC76-g7p9kS8YGZ7Xh8NlpaOtzOGjY4z&uniplatform=NZKPT&language=CHS (accessed on 21 May 2025).
  20. Li, R. Research and Application of Negative Pressure Wave Pipeline Leakage Detection Based Combined Signal Processing. Master’s Thesis, Xi’an Shiyou University, Xi’an, China, 2023. Available online: https://link.cnki.net/doi/10.27400/d.cnki.gxasc.2023.001090 (accessed on 16 December 2023).
  21. Wang, H.; Wang, L.; Wu, X.; YU, L.; Wu, J.; Fu, K.; Zheng, J.; Zhang, T. The algorithm improvement of pipeline leak detection based on negative pressure wave. Oil Gas Storage Transp. 2018, 37, 541–545. Available online: https://link.cnki.net/urlid/13.1093.TE.20171116.1016.004 (accessed on 16 November 2017).
  22. Liao, J. Research on Pipeline Leak Detection and Location Based on Negative Pressure Wave Method. Master’s Thesis, Zhejiang Sci-Tech University, Hangzhou, China, 2017. Available online: https://kns.cnki.net/kcms2/article/abstract?v=-djcopRf0qGnr2tTjNOMjnK-ZzOJC9HCyRvOUvxSoXyjLvVzdHxlNZWkT9S5eXv15LMKS49y4w7OFKiOtJo9P-JJsdPk3OxMc9_cdiOVc6d1J354jAK3j1jznli5BRwXssAYzVpg8286whKImWbEw7L7NT0-u0yLOR20a2PFC7scl0fx0ZhZ5aT-EtOYWIRQ&uniplatform=NZKPT&language=CHS (accessed on 16 June 2017).
  23. Wang, H.; Li, Q.; Luo, Y.; Wang, W.; Wang, L.; Zhang, T. A Similarity based locating method of negative pressure wave caused by pipeline leakage. Oil Gas Storage Transp. 2021, 40, 679–684. Available online: https://link.cnki.net/urlid/13.1093.TE.20210510.1525.004 (accessed on 11 May 2021).
  24. Zhang, Z.; Gao, M.; Chen, X.; Wei, X.; Liang, J.; Wu, C.; Wang, L. The Joule–Thomson effect of (CO2+ H2) binary system relevant to gas switching reforming with carbon capture and storage (CCS). Chin. J. Chem. Eng. 2023, 54, 215–231. [Google Scholar] [CrossRef]
  25. Parahovnik, A.; Ahmed, P.; Peles, Y. Two-phase flow, pressure drop, and Joule-Thomson effect in a micro-orifice with trans critical carbon dioxide flow. J. Supercrit. Fluids 2022, 188, 105649. [Google Scholar] [CrossRef]
  26. Han, J.; Mou, H.; Wang, Y.; Jiang, X. The application study of correlation analytic method in oil conveying pipeline’s leakage detection and location. Nucl. Electron. Detect. Technol. 2007, 27, 154–156. Available online: https://kns.cnki.net/kcms2/article/abstract?v=-djcopRf0qEH66sd-dcCgjM7TXwLZ3aVOC1BQ5DcruOCXT_ou6Ecrq2FZWOYkTt-APmDH_7azM4XqVh0jLY8JYTeKFZ05-Zoe4zYmQWJcNwSlUsUkRGJJtL6y1gaPIY66o2gCNDTghHPVRlSiBPNAIf3W1L_gOkHoMzN5Zi8kI1hEogE-Qq2kA==&uniplatform=NZKPT&language=CHS (accessed on 5 February 2007).
  27. Xiao, H.; Zhang, Y.; Wang, J. Correlating measurement qualities of cross-correlation based solids velocimetry with solids convection-mixing competing mechanism in different gas fluidization regimes. Chem. Eng. Sci. 2022, 253, 117602. [Google Scholar] [CrossRef]
  28. Derrick, T.; Thomas, J. Time series analysis: The cross-correlation function. Hum. Kinet. Publ. 2004, 7, 189–205. [Google Scholar]
  29. Xiao, R.; Joseph, P.F.; Muggleton, J.M.; Li, J. Limits for leak noise detection in gas pipes using cross correlation. J. Sound Vib. 2022, 520, 116639. [Google Scholar] [CrossRef]
  30. Xu, C.; Liu, P.; Li, Z.; Du, S.; Zhang, Y. Leakage identification method of gas-liquid two-phase flow pipeline based on acoustic emission signal. Oil Gas Storage Transp. 2021, 40, 1131–1137. Available online: https://link.cnki.net/urlid/13.1093.TE.20210722.1302.004 (accessed on 22 July 2021).
  31. Xiao, H.; Zhang, Y.; Hua, Y.; Oloruntoba, A. Quantitative assessment of cross-correlation based particle velocity measurement in different gas fluidization regimes. Adv. Powder Technol. 2021, 32, 3915–3926. [Google Scholar] [CrossRef]
  32. Kristoufek, L. Finite sample properties of power-law cross-correlations estimators. Phys. A Stat. Mech. Its Appl. 2015, 419, 513–525. [Google Scholar] [CrossRef]
  33. Wang, Q.; Zheng, X.; Xue, S.; Yuan, H.; Fu, M. Leakage localization method for gas pipelines using cross localization based on time difference of arrival. J. Appl. Acoust. 2020, 39, 472–480. Available online: https://link.cnki.net/urlid/11.2121.o4.20200506.1009.024 (accessed on 8 May 2020).
  34. Li, J.; Zheng, Q.; Qian, Z.; Yang, X. A novel location algorithm for pipeline leakage based on the attenuation of negative pressure wave. Process Saf. Environ. Prot. 2019, 123, 309–316. [Google Scholar] [CrossRef]
  35. Lu, J.; Jiang, X.; Ru, R.; Wang, Z. Numerical Simulation Analysis of Natural Gas Parallel Pipeline Based on TGNET. Pipeline Tech. Equip. 2018, 01, 55–58. Available online: https://kns.cnki.net/kcms2/article/abstract?v=-djcopRf0qFwn69kvQVr1axEee09wFr_6rNgvu9S31pYqRDtRWGprlW4ViBLgF60xBc-nGE-aQQg3crzLS4zt-a5ZFKOsbS-yHtXjhfR_s5uYVMLzBlmmJa21Speky3DJ4jwd13vsdQlPRv6ml1QrlCA6LN8KVzr3WUs3DzuYbaWOarwJ9oFSAVT7CVf0zWl&uniplatform=NZKPT&language=CHS (accessed on 5 March 2018).
  36. Botros, K.K.; Geerligs, J.; Rothwell, B.; Robinson, T. Measurements of decompression wave speed in binary mixtures of carbon dioxide and impurities. J. Press. Vessel. Technol. 2017, 139, 021301. [Google Scholar] [CrossRef]
  37. Munkejord, S.T.; Austegard, A.; Deng, H.; Hammer, M.; Stang, H.J.; Løvseth, S.W. Depressurization of CO2 in a pipe: High-resolution pressure and temperature data and comparison with model predictions. Energy 2020, 211, 118560. [Google Scholar] [CrossRef]
  38. Aursand, E.; Dumoulin, S.; Hammer, M.; Lange, H.; Morin, A.; Munkejord, S.; Nordhagen, H. Fracture propagation control in CO2 pipelines: Validation of a coupled fluid–structure model. Eng. Struct. 2016, 123, 192–212. [Google Scholar] [CrossRef]
  39. Munkejord, S.T.; Deng, H.; Austegard, A.; Hammer, M.; Aasen, A.; Skarsvåg, H.L. Depressurization of CO2-N2 and CO2-He in a pipe: Experiments and modelling of pressure and temperature dynamics. Int. J. Greenh. Gas Control 2021, 109, 103361. [Google Scholar] [CrossRef]
  40. Lan, C. Leakage Detection of Pressurized Water Transmission Pipeline Based on Negative Pressure Wave Method. Master’s Thesis, Xi’an University of Technology, Xi’an, China, 2022. Available online: https://link.cnki.net/doi/10.27398/d.cnki.gxalu.2022.001555 (accessed on 16 September 2024).
  41. Chen, B.; Xiao, H.; Cao, S. Study on the quality of CO2 containing impurities in northern Shaanxi CCUS. Nat. Gas Chem. Chem. 2017, 42, 63–66. Available online: https://kns.cnki.net/kcms2/article/abstract?v=-djcopRf0qH0KclOt_o130D3hiwv5KhNfypiUlP_YvV8BtxZFlOJ01tFnDM2R3HfHdAaOyDmO-i9a5xexiWtZ4amq-xEJfcebbAl8mRV07BncSa1pTo1mOAW_2apmtX4T170Hpzl8Kw2rjA_ZM4KWbP8-h_id_X3HvGomCj7jUOMEXhImx32CrbyWjTj29q3&uniplatform=NZKPT&language=CHS (accessed on 21 July 2017).
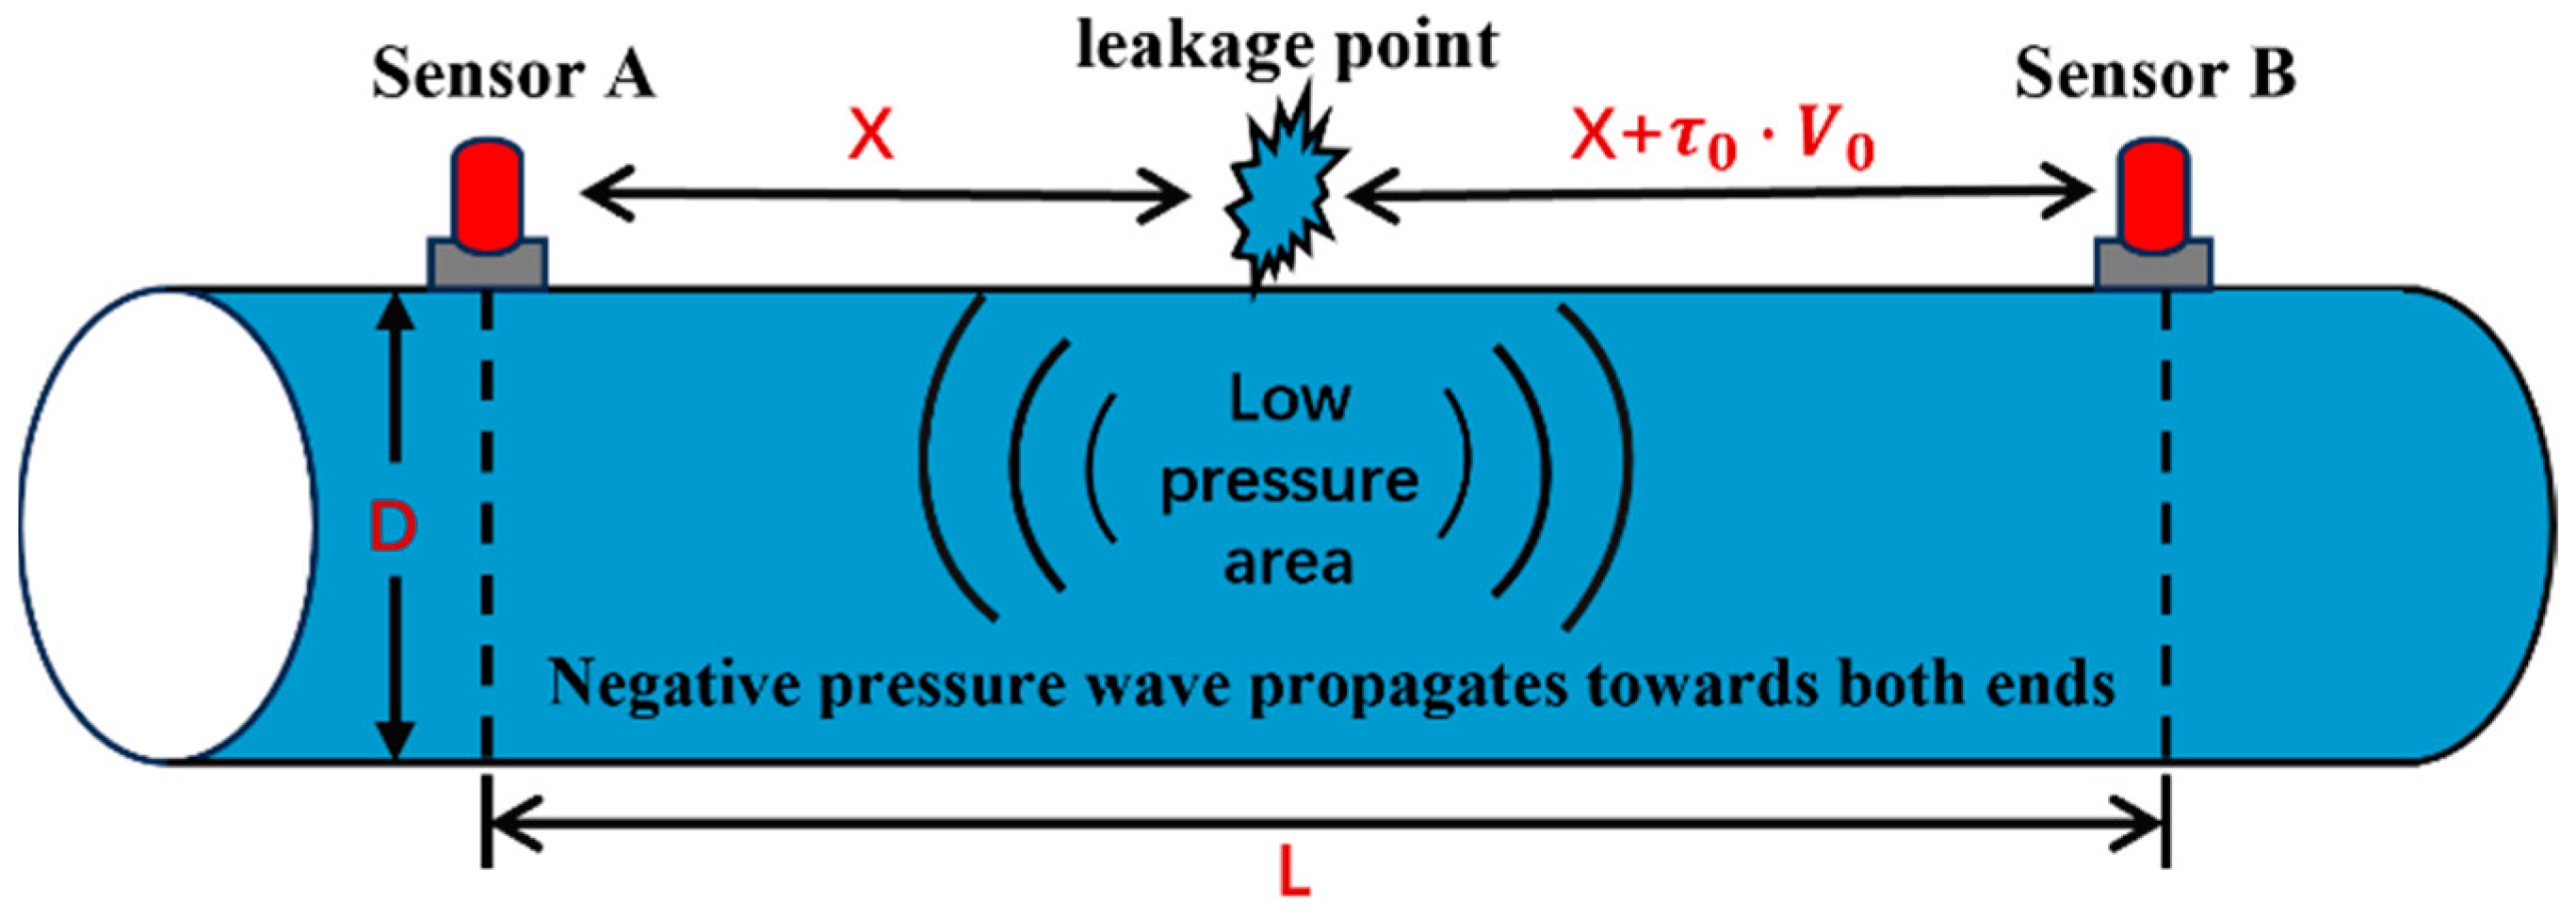
Figure 1. Leakage detection diagram based on negative pressure wave method.
Processes 14 00536 g001
Figure 2. The Joule–Thomson coefficients of CO2 and methane at different temperatures.
Processes 14 00536 g002
Figure 3. Cross-correlation function under pipeline non-leakage conditions.
Processes 14 00536 g003
Figure 4. Cross-correlation function under pipeline leakage conditions.
Processes 14 00536 g004
Figure 5. Supercritical CO2 pipeline leakage detection flow chart.
Processes 14 00536 g005
Figure 6. TGNET simulation of the transient operation model.
Processes 14 00536 g006
Figure 7. Comparison of experimental measurements and simulation results under leakage conditions.
Processes 14 00536 g007
Figure 8. Cross-correlation functions of pressure curves for different sensors groups.
Processes 14 00536 g008
Figure 9. Simplified flow diagram of CO2 transportation in the first phase of the Yanchang Oilfield.
Processes 14 00536 g009
Figure 10. Steady operation model of long-distance CO2 pipeline.
Processes 14 00536 g010
Figure 11. Transient operation model of long-distance CO2 pipeline.
Processes 14 00536 g011
Figure 12. The inlet and outlet pressure curves under different leakage rates.
Processes 14 00536 g012
Figure 13. Inlet pressure curve at different rates of leakage after noise elimination.
Processes 14 00536 g013
Figure 14. Outlet pressure curve at different rates of leakage after noise elimination.
Processes 14 00536 g014
Figure 15. Cross-correlation functions of inlet and outlet pressure signals under different leakage rates.
Processes 14 00536 g015aProcesses 14 00536 g015b
Table 1. Initial conditions of the shock tube experiment.
Experiment NumberPipe Length (m)Inner Diameter (mm)Initial Pressure (MPa)Initial Temperature (°C)Gas Composition (Mole Fraction)
Test#23138.114.82835.994.028% CO2 + 0.1270% H2 + 0.025%He + 5.82%N2
Table 2. Position of the pressure sensor.
Pressure Sensor NumberPT201PT212PT213PT214PT215PT216
Sensor distance (m)0.0819.9929.98639.98449.98261.479
Table 3. Comparison of simulated and experimental values of time difference based on cross-correlation analysis.
Group NumberSensor 1Sensor 2Experimental Measured Drop Time Difference Δ t (s)Detect Time Difference Δ t (m)Relative Error
1PT201PT216−0.1279−0.12900.86%
2PT212PT216−0.0866−0.08740.92%
3PT213PT216−0.0667−0.0659−1.20%
4PT214PT216−0.0441−0.04420.23%
Table 4. Parameters of pipeline transportation under supercritical conditions.
Conveying Process ConditionsConveying Parameters
Inlet pressure (Mpa)13.0
Inlet temperature (°C)45
Pipe materialX80
Pipe diameter (mm)Φ168 × 6.0
Outlet pressure (Mpa)12.68
Outlet temperature (°C)32.6
Pressure drop (Mpa)0.32
Maximum speed (m·s−1)0.74
Minimum speed (m·s−1)0.67
Maximum density (kg·m−3)927.744
Minimum density (kg·m−3)837.424
Table 5. Parameters required for simulation.
ParametersValueUnit
Steady-stateEfficiency coefficient1-
Maximum allowable operating pressure14.2627MPa
ConstraintsEntry nodeLarge traffic: 11.9
Minimum pressure: 13.0
kg·s−1
MPa
Exit nodeMinimum pressure: 12.68
Maximum flow: 11.9
MPa
kg·s−1
Drag coefficient0.96-
TransientLeak hole diameter5mm
Component timing100
5
s
Leakage coefficient1-
Table 6. Gas source composition table.
Gas ComponentsVolume Fraction (%)
CO298.6
H20.2
CO0.5
CH40.00755
N20.2
Ar0.00061
H2S0
CH3OH0.00053
H2O0.02
Table 7. Parameter values at different leakage volumes.
Leakage Δ t /sDetection Position x /mAbsolute Error /mRelative Error δ
1%2.32887.99387.997.76%
5%−1.62230.09−269.91−5.40%
10%−0.52415.65−84.35−1.69%
20%0.42567.4867.481.35%
30%−0.12483.13−16.87−0.34%
Disclaimer/Publisher’s Note: The statements, opinions and data contained in all publications are solely those of the individual author(s) and contributor(s) and not of MDPI and/or the editor(s). MDPI and/or the editor(s) disclaim responsibility for any injury to people or property resulting from any ideas, methods, instructions or products referred to in the content.