Article

Modeling Multi-Fracture Propagation in Fractured Reservoirs: Impacts of Limited-Entry and Temporary Plugging

1
Xinjiang Yaxin Coalbed Methane Resource Technology Research Co., Ltd., Urumqi 830000, China
2
State Key Laboratory of Petroleum Resources and Engineering, China University of Petroleum (Beijing), Beijing 102249, China
3
Petroleum Institute, China University of Petroleum-Beijing at Karamay, Karamay 834000, China
*
Author to whom correspondence should be addressed.
Processes 2026, 14(3), 450; https://doi.org/10.3390/pr14030450
Submission received: 29 December 2025 / Revised: 20 January 2026 / Accepted: 26 January 2026 / Published: 27 January 2026
(This article belongs to the Special Issue New Technology of Unconventional Reservoir Stimulation and Protection)

Abstract

Staged multi-cluster fracturing in horizontal wells is a key technology for efficiently developing unconventional oil and gas reservoirs. Extreme Limited-Entry Fracturing (ELF) and Temporary Plugging Fracturing (TPF) are effective techniques to enhance the uniformity of fracture stimulation within a stage. However, in fractured reservoirs, the propagation morphology of multiple intra-stage fractures and fluid distribution patterns becomes significantly more complex under the influence of ELF and TPF. This complexity results in a lack of theoretical guidance for optimizing field operational parameters. This study establishes a competitive propagation model for multiple hydraulic fractures (HFs) within a stage under ELF and TPF conditions in fractured reservoirs based on the Displacement Discontinuity Method (DDM) and fluid mechanics theory. The accuracy of the model was verified by comparing it with laboratory experimental results and existing numerical simulation results. Using this model, the influence of ELF and TPF on intra-stage fracture propagation morphology and fluid partitioning was investigated. Results demonstrate that extremely limited-entry perforation and ball-sealer diversion effectively mitigate the additional flow resistance induced by both the stress shadow effect and the connection of natural fractures (NFs), thereby mitigating uneven fluid distribution and imbalanced fracture propagation among clusters. ELF artificially creates extremely high perforation friction by drastically reducing the number of perforations or the perforation diameter, thereby forcing the fracturing fluid to enter multiple perforation clusters relatively uniformly. Compared to the unlimited-entry scheme (16 perforations/cluster), the limited-entry scheme (5 perforations/cluster) yielded a 37.84% improvement in fluid distribution uniformity and reduced the coefficient of variation (CV) for fracture length and fluid intake by 54.28% and 44.16%, respectively. The essence of the TPF is non-uniform perforation distribution, which enables the perforation clusters with large fluid intake to obtain more temporary plugging balls (TPBs), so that their perforation friction can be increased and their fluid intake can be reduced, thereby diverting the fluid to the perforation clusters with small fluid intake. Deploying TPBs (50% of total perforations) at the mid-stage of fracturing (50% time) increased fluid distribution uniformity by 37.86% and reduced the CV of fracture length and fluid intake by 72.54% and 58.39%, respectively. This study provides methodological and modeling foundations for systematic optimization of balanced stimulation parameters in fractured reservoirs.

1. Introduction

Staged multi-cluster fracturing in horizontal wells is a crucial technology for the efficient development of fractured oil and gas reservoirs [1,2,3,4]. During hydraulic fracturing, the presence of NFs significantly alters the fracture propagation path, mode, and geometry, thereby affecting the stimulation effectiveness and stimulated reservoir volume (SRV). Field data from downhole cameras and distributed fiber optic monitoring reveal significant non-uniform fluid intake and fracture propagation among clusters during fracturing [5,6]. To address this engineering challenge, two main techniques are currently employed [7]: Extreme Limited-Entry Fracturing (ELF) and Temporary Plugging Fracturing (TPF). ELF regulates fluid intake per cluster by increasing perforation friction to achieve synchronous multi-fracture propagation, while TPF utilizes degradable diverters to plug dominant flow channels, forcing fracturing fluid into under-stimulated areas to achieve synergistic multi-fracture propagation.
Some studies have been conducted on the interaction mechanism between HFs and NFs. Experimentally, Fu et al. [8] established a large-scale experimental system capable of quantitatively simulating the cementation properties of NFs to investigate the interaction mechanisms between HFs and NFs. The results indicate that there are three fundamental interaction modes between HFs and NFs—opening, shearing, and crossing—as well as mixed modes. Geological factors, such as horizontal stress difference, fracture dip angle, and tensile strength, have a significantly greater influence than engineering factors. Increasing the horizontal stress difference, fracture dip angle, tensile strength, and optimizing operational parameters facilitate the crossing of HFs through NFs. Zhang et al. [9] established an experimental model for tight sandstone containing closed cemented natural fracture networks (CCPF). Through triaxial hydraulic fracturing experiments and acoustic emission monitoring, they explored the influence of CCPF with different orientations on HFs propagation behavior. They discovered that the HF morphology was most complex and the number of connected NFs was highest when the angle between the maximum horizontal principal stress and the CCPF was 30–60°. Numerically, Liu et al. [10] employed a cohesive zone finite element model, validated with laboratory experiments, to study the impact of NF’s cementation strength on hydraulic fracturing in volcanic reservoirs. Their results indicated that lower cementation strength leads to lower fracture initiation pressure and more complex propagation. When cementation strength dropped to 0.1, the fracture morphology and stress direction jointly dominated fracture network formation. Suo et al. [11] established a two-dimensional fully coupled hydraulic fracturing numerical model based on the Extended Finite Element Method (XFEM), studying the effects of Young’s modulus, Poisson’s ratio, in situ stress, and fracturing fluid rate on fracture propagation. They found that complex fracture networks are more likely to form when the NF friction coefficient is small and the approach angle is low. Xie et al. [12] investigated HF deflection in NFs and the final fracture geometry using a simplified three-dimensional DDM. The study showed that the width of the fracture segment on the NF is restricted due to the high compressive stress acting on it, which is much smaller than the width before deflection. Yang et al. [13] similarly employed the DDM to describe rock deformation and incorporated the embedded discrete fracture model (EDFM) to simulate fluid flow between fractures and the surrounding rock. Their study revealed that asymmetric distribution of NFs leads to uneven propagation of HFs along their wings, with preferential growth occurring along the wing with lower resistance. Moreover, an increase in the contrast between NFs further amplifies the asymmetry in HFs’ geometry.
Existing research has largely focused on competitive fracture propagation under single NF or simple NF network conditions, lacking a systematic investigation into fracture propagation behaviors in fractured reservoirs under the influence of ELF and TPF processes. This study constructs a coupled “multi-fracture propagation–natural fracture network” model based on the DDM and fluid mechanics. It analyzes the impact of ELF and TPF in fractured reservoirs and proposes an index system for evaluating reservoir stimulation effectiveness. The research results provide a methodological and modeling foundation for the subsequent systematic optimization of ELF and TPF designs in fractured reservoirs.

2. Methodology

2.1. Basic Assumptions

To reduce the difficulty of solving the fracturing model and improve the simulation speed of multi-fracture propagation in the stage, the assumptions in this study are ① that the reservoir is regarded as an isotropic and homogeneous rock with NFs and fracture propagation obeying linear elastic fracture mechanics (LEFM); ② fluid leak-off, perpendicular to the fracture face, follows the Carter model; ③ wellbore friction is much smaller than perforation friction and fracture flow friction, thus friction along the wellbore is neglected; ④ assuming the NFs in the formation have a dip angle of 90°, their development azimuth is determined, and they have frictional interfaces (i.e., a type of NF with little or no cement filling within the fracture interfaces, typically characterized by low interfacial cohesion and shear resistance). Before the intersection, these NFs are in a closed state, and no shear slip failure occurs at their interfaces [12]. ⑤ It is assumed that one temporary plugging ball (TPB) can completely plug one perforation. TPBs are injected with the fracturing fluid, and the number of remaining perforations per cluster after plugging is determined based on the number of TPBs and flow distribution to simulate the plugging effect [14].

2.2. Solid Equations

To accurately simulate the rock deformation induced by fracture opening and the associated stress interference, we employed the DDM. This approach is computationally efficient for modeling multiple fracture propagation as it reduces the dimensionality of the problem by discretizing only the fracture boundaries. The relationship between the induced stress field and the displacement discontinuity is governed by the boundary integral equation considering stress correction [15]:
j = 1 N ( G i j A ss ij u j + G i j A sn ij w j ) = σ i s j = 1 N ( G i j A ns ij u j + G i j A nn ij w j ) = σ i n
where uj and wj are the tangential and normal displacement discontinuities, respectively; A ss ij , A sn ij , A ns ij , and A nn ij are coefficient matrices; σh and σH are the minimum and maximum horizontal principal stresses, Pa; i and j are fracture element indices; and σ i s and σ i n are the tangential and normal stresses on the i-th fracture element, Pa. Gij is the stress correction coefficient, calculated as follows:
G i j = 1 d i j 2.3 d i j 2 + H 2 1.15
where dij is the distance between the center points of the i-th and j-th elements, m, and H is the fracture height, m.
During propagation, the fracture growth direction is not arbitrary but is dictated by the local stress state at the tip. By applying the maximum circumferential stress criterion, the propagation angle θ can be predicted, and the effective stress intensity factor Ktip can be calculated [16]:
θ = arctan 1 4 ( K I K II ) ± 1 4 K I K II 2 + 8
K tip = cos 2 ( θ 2 ) K I cos ( θ 2 ) 3 K II sin ( θ 2 )
Mode I and Mode II stress intensity factors are calculated based on the tangential and normal displacement discontinuities, geometric dimensions, and rock mechanical properties of the fracture tip element [17]:
K I = 0.806 π E 4 ( 1 v 2 ) Δ a w i
K II = 0.806 π E 4 ( 1 v 2 ) Δ a u i
where E is Young’s modulus, MPa; ν is Poisson’s ratio; and ∆a denotes the element length at the fracture tip, m.

2.3. Fluid Equations

2.3.1. Wellbore Flow Equation

The fluid transport process is modeled as a coupled system involving wellbore distribution and intra-fracture flow. First, to describe the fluid partitioning among different clusters, we apply Kirchhoff’s laws to the wellbore-perforation system. Due to the large wellbore inner diameter and small cluster spacing, the friction of fluid flowing along the wellbore between clusters is small, and its impact on flow distribution can be neglected. The pumping pressure corresponding to each cluster fracture satisfies
p w = p i n , k + p p , k
The perforation friction, which is the key mechanism for the ELF technique, acts as a flow restrictor. It is non-linearly related to the flow rate and perforation characteristics, providing the necessary backpressure to equalize flow distribution [18]:
p p , k = 0.807 ρ Q k 2 n k 2 d k 4 C d 2
Mass conservation dictates that the total injection rate at the surface must equal the sum of flow rates into all individual clusters:
Q T = k = 1 nf Q k

2.3.2. Fracture Fluid Flow Equation

Once the fluid enters the fracture, its motion is governed by the momentum equation. For an incompressible Newtonian fluid flowing between parallel plates (fracture walls), the flow velocity is driven by the pressure gradient within the fracture, described by the simplified Navier–Stokes equation [13]:
ν f = w 2 12 μ p f
where vf is the fluid velocity within the fracture, m/s; w is the fracture width, m; μ is the fluid viscosity, mPa·s; pf is the fluid pressure within the fracture, Pa.
Simultaneously, fluid mass balance within the fracture must account for both fracture volume expansion and fluid loss into the formation. This dynamic process is captured by the continuity equation based on the Reynolds transport theorem [19]:
w t + · ( w · ν f ) + q L = Q k δ ( x - x i n , k )
where qL is the normal leak-off velocity at the fracture wall, m/s; xin,k is the injection point coordinate for the k-th cluster fracture.
The fluid leak-off velocity is calculated using the Carter equation:
q L = 2 C L t - t 0
where CL is the fluid leak-off coefficient, m/s0.5, and t0 is the initial time of fluid leak-off along the fracture wall, s.

2.4. Interaction Model Between HFs and NFs

The complexity of fracture networks in fractured reservoirs arises from the mechanical interaction between HFs and NFs. The decision of whether an HF crosses an NF or is arrested/deflected depends on the competition between the induced stress field at the HF tip and the mechanical strength of the NF interface.
Based on the maximum circumferential stress theory in LEFM, for a new fracture to initiate on the opposite side of an NF, the following two conditions must be simultaneously satisfied: ① the maximum circumferential stress at the HF tip must reach the tensile strength of the rock on the opposite side of the intersection interface; ② neither shear failure nor tensile failure can occur on the upper and lower wings of the NF.
When the tip region of an HF is subjected to far-field in situ stresses, the expressions for the stress components in polar coordinates are as follows [20]:
σ x = σ H + σ h 2 + σ H σ h 2 cos 2 α σ y = σ H + σ h 2 σ H σ h 2 cos 2 α τ x y = σ H σ h 2 sin 2 α
σ r 1 = σ x + σ y 2 + σ x σ y 2 cos 2 θ + τ x y sin 2 θ σ θ 1 = σ x + σ y 2 σ x σ y 2 cos 2 θ τ x y sin 2 θ τ r θ 1 = τ x y cos 2 θ σ x σ y 2 sin 2 θ
σ r 2 = 1 2 2 π r ( K I cos θ 2 ( 3 - cos θ ) + K II sin θ 2 ( 3 cos θ - 1 ) ) σ θ 2 = 1 2 2 π r cos θ 2 ( K I cos 2 θ 3 2 K II sin θ ) τ r θ 2 = 1 2 2 π r cos θ 2 ( K I sin θ + K II ( 3 cos θ - 1 ) )
where α is the angle between the maximum horizontal principal stress and the HF (positive counterclockwise, same below); σx and σy are the stresses along the x and y axes, MPa; τxy is the shear stress on the NF wall under far-field in situ stress, MPa; r and θ are polar coordinates with the HF tip as the origin; σr1, σθ1 and τ1 are the components in polar coordinates of the far-field in situ stress acting on the HF tip region, MPa; and σr2, σθ2 and τ2 are the induced stress components in polar coordinates from the combined Mode I-II HF tip, MPa.
The radial, circumferential, and shear stresses acting on the hydraulic fracture tip region after superposition of multiple stress fields in polar coordinates are as follows:
σ r = σ r 1 + σ r 2 σ θ = σ θ 1 + σ θ 2 τ r θ = τ r θ 1 + τ r θ 2
According to LEFM theory, the stress intensity factors at the initial HF tip are the following:
K I = ( p f + σ θ 1 ) π Δ a K II = τ r θ π Δ a
This is because at the HF tip, the stress components tend to infinity (stress singularity). Therefore, when determining the maximum circumferential tensile stress, the tip point itself cannot be considered; instead, the circumferential tensile stresses at points on a small circle with a radius r = r0 around the tip are compared to determine the maximum circumferential tensile stress, and thus, the fracture initiation angle θ0 is obtained.
The condition for the circumferential stress σθ to reach an extremum is as follows:
σ θ θ = 0
Thus, we obtain the following:
θ 0 = cos 1 ( 3 K II 2 + K I 2 + 8 K I 2 K II 2 K I 2 + 9 K II 2 )
For an HF to cross an NF, conditions ① and ② must be satisfied:
σ θ | θ = θ 0 = T 0
| τ r θ | θ = β < τ 0 μ f ( σ θ | θ = β ) σ θ | θ = β < 0   or   | τ r θ | θ = β π < τ 0 μ f ( σ θ | θ = β π ) σ θ | θ = β π < 0
where T0 is the tensile strength of the rock mass, MPa; τ0 is the cohesion, MPa; μf is the friction coefficient of the NF wall; σθ|θ=β, σθ|θ=β−π are the normal stress components on the left and right wings of the NF wall (when the approach angle is β) from the HF tip stress field, MPa; and τ|θ=β, τ|θ=β−π are the shear stress components on the left and right wings of the NF wall (when the approach angle is β) from the HF tip stress field, MPa.
Equations (20) and (21) constitute the critical mechanical criteria for an HF crossing an NF. If this criterion is not met, the NF will be segmented into new fracture elements, meaning that HF will deflect and propagate along the natural fracture direction. This deflection mechanism of HFs is a key controlling factor in forming complex non-planar fracture networks.

2.5. Model Solution Workflow

The solution approach and methodology for the aforementioned model comprehensively consider multiple physical processes, including rock deformation, fluid flow, fracturing fluid leak-off, and the interaction between HFs and NFs. Based on the multi-fracture simultaneous propagation model in Section 2.2 and Section 2.3, the stress intensity factor at the tip of the HF can be resolved when it reaches the interface of an NF (where the fluid front and solid front were assumed to coincide by default in this study). By combining the relative positions of the HF and the NF (used to calculate the approach angle) and the mechanical parameters of the NF surfaces (tensile strength, cohesion, friction coefficient, etc.), the propagation direction of the HF is determined according to the interaction criterion proposed in Section 2.4. The specific program design logic is illustrated in Figure 1.

2.6. NF Model

In actual fracturing operations in fractured reservoirs, NFs are often not solitary, making the HF morphology extremely complex. This study assumes that the center points of NFs are randomly distributed and their lengths follow a power-law distribution [21]:
n ( l , L t ) d l = ξ L t D c l ( D l + 1 )
N ( L t ) = ξ D l L t D c l min D l
where n(l, Lt)dl is the total number of NFs with lengths between l and l + dl within a formation region of size Lt; Dc is the fractal dimension for fracture distribution; Dl is the fractal dimension for the fracture length; ξ is a coefficient characterizing fracture density; lmin is the lower size limit of NFs that influence HFs; and N(Lt) is the number of NFs longer than lmin.

2.7. TPBs Allocation Method

To determine the number of remaining perforations after plugging, it is assumed that TPBs are uniformly dispersed in the fracturing fluid. The number of plugged perforations per fracture is calculated as follows [14]:
n plug , k = n b floor ( Q k Q all )
where nplug,k is the number of plugged perforations in the k-th cluster; nb is the total number of ball sealers; Qk is the fluid intake rate of the k-th cluster at the time of plugging, m3/min; Qall is the total fluid intake rate, m3/min; and floor is the floor function (rounding down).
After TPBs are deployed, the number of remaining perforations per cluster satisfies
n r , k = n k n plug , k
where nr,k is the number of remaining perforations in the k-th cluster after plugging.
To accurately describe the relationship between the number of TPBs and the number of perforations, the plugging efficiency for the perforations of the k-th cluster is defined as follows:
η ball , k = n r , k n k
where ηball,k is the temporary plugging efficiency for the k-th cluster.

2.8. Evaluation Indicators for Balanced Reservoir Stimulation

The CV for fracture length and the CV for fracture fluid intake are quantitative parameters characterizing the differences in length and fluid intake among multiple fractures [22]:
C v , l = δ l l m , C v , q = δ q V m
where δl and lm are the standard deviation and mean of the lengths of each cluster, respectively; δq and Vm are the standard deviation and mean of the fluid intake volumes of each cluster, respectively. A smaller CV indicates that the lengths and fluid intakes of the clusters are similar, suggesting relatively balanced fracture propagation; conversely, a higher CV indicates significant differences in length and fluid intake among clusters, suggesting that only dominant fractures propagate during fracturing [23].

2.9. Model Comparison and Verification

This study focuses on fractured reservoirs, so it is essential to validate the interaction and propagation behavior between HF and NF.

2.9.1. Interaction Between HF and NF

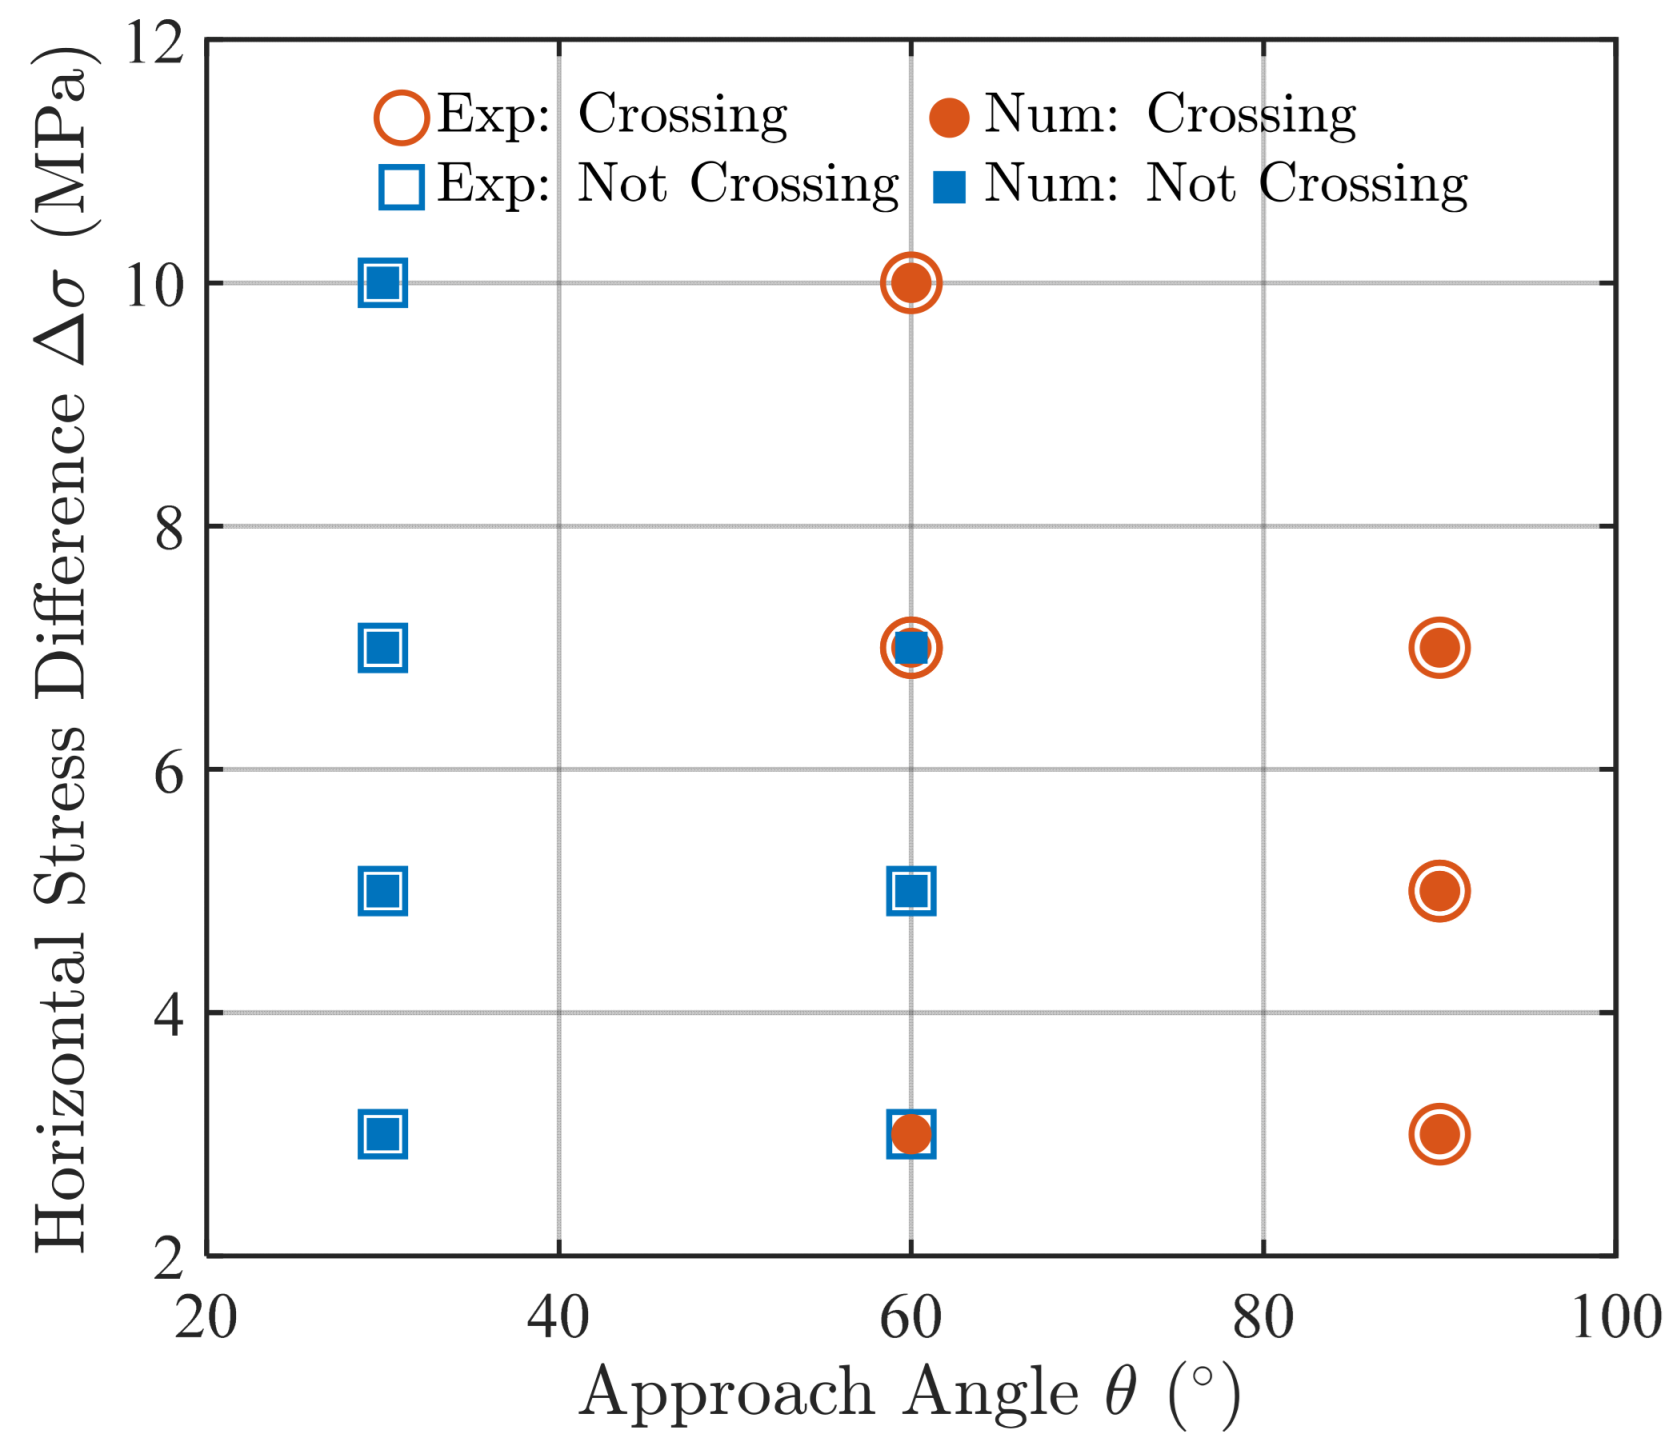
Zhou et al. [24] investigated crossing patterns under different horizontal stress differentials and approach angles through laboratory experiments. In the numerical simulation, we assumed the presence of two symmetrical NFs along the propagation path of the HF, while keeping the remaining input parameters consistent with those used by Zhou et al. [24] in their experiments. A comparison between experimental and numerical results showed agreement in 12 out of 14 crossing predictions (Figure 2). This close match between simulation and experimental data validates the effectiveness of the HF-NF interaction criterion proposed in this study.

2.9.2. Propagation Behavior Between HF and NF

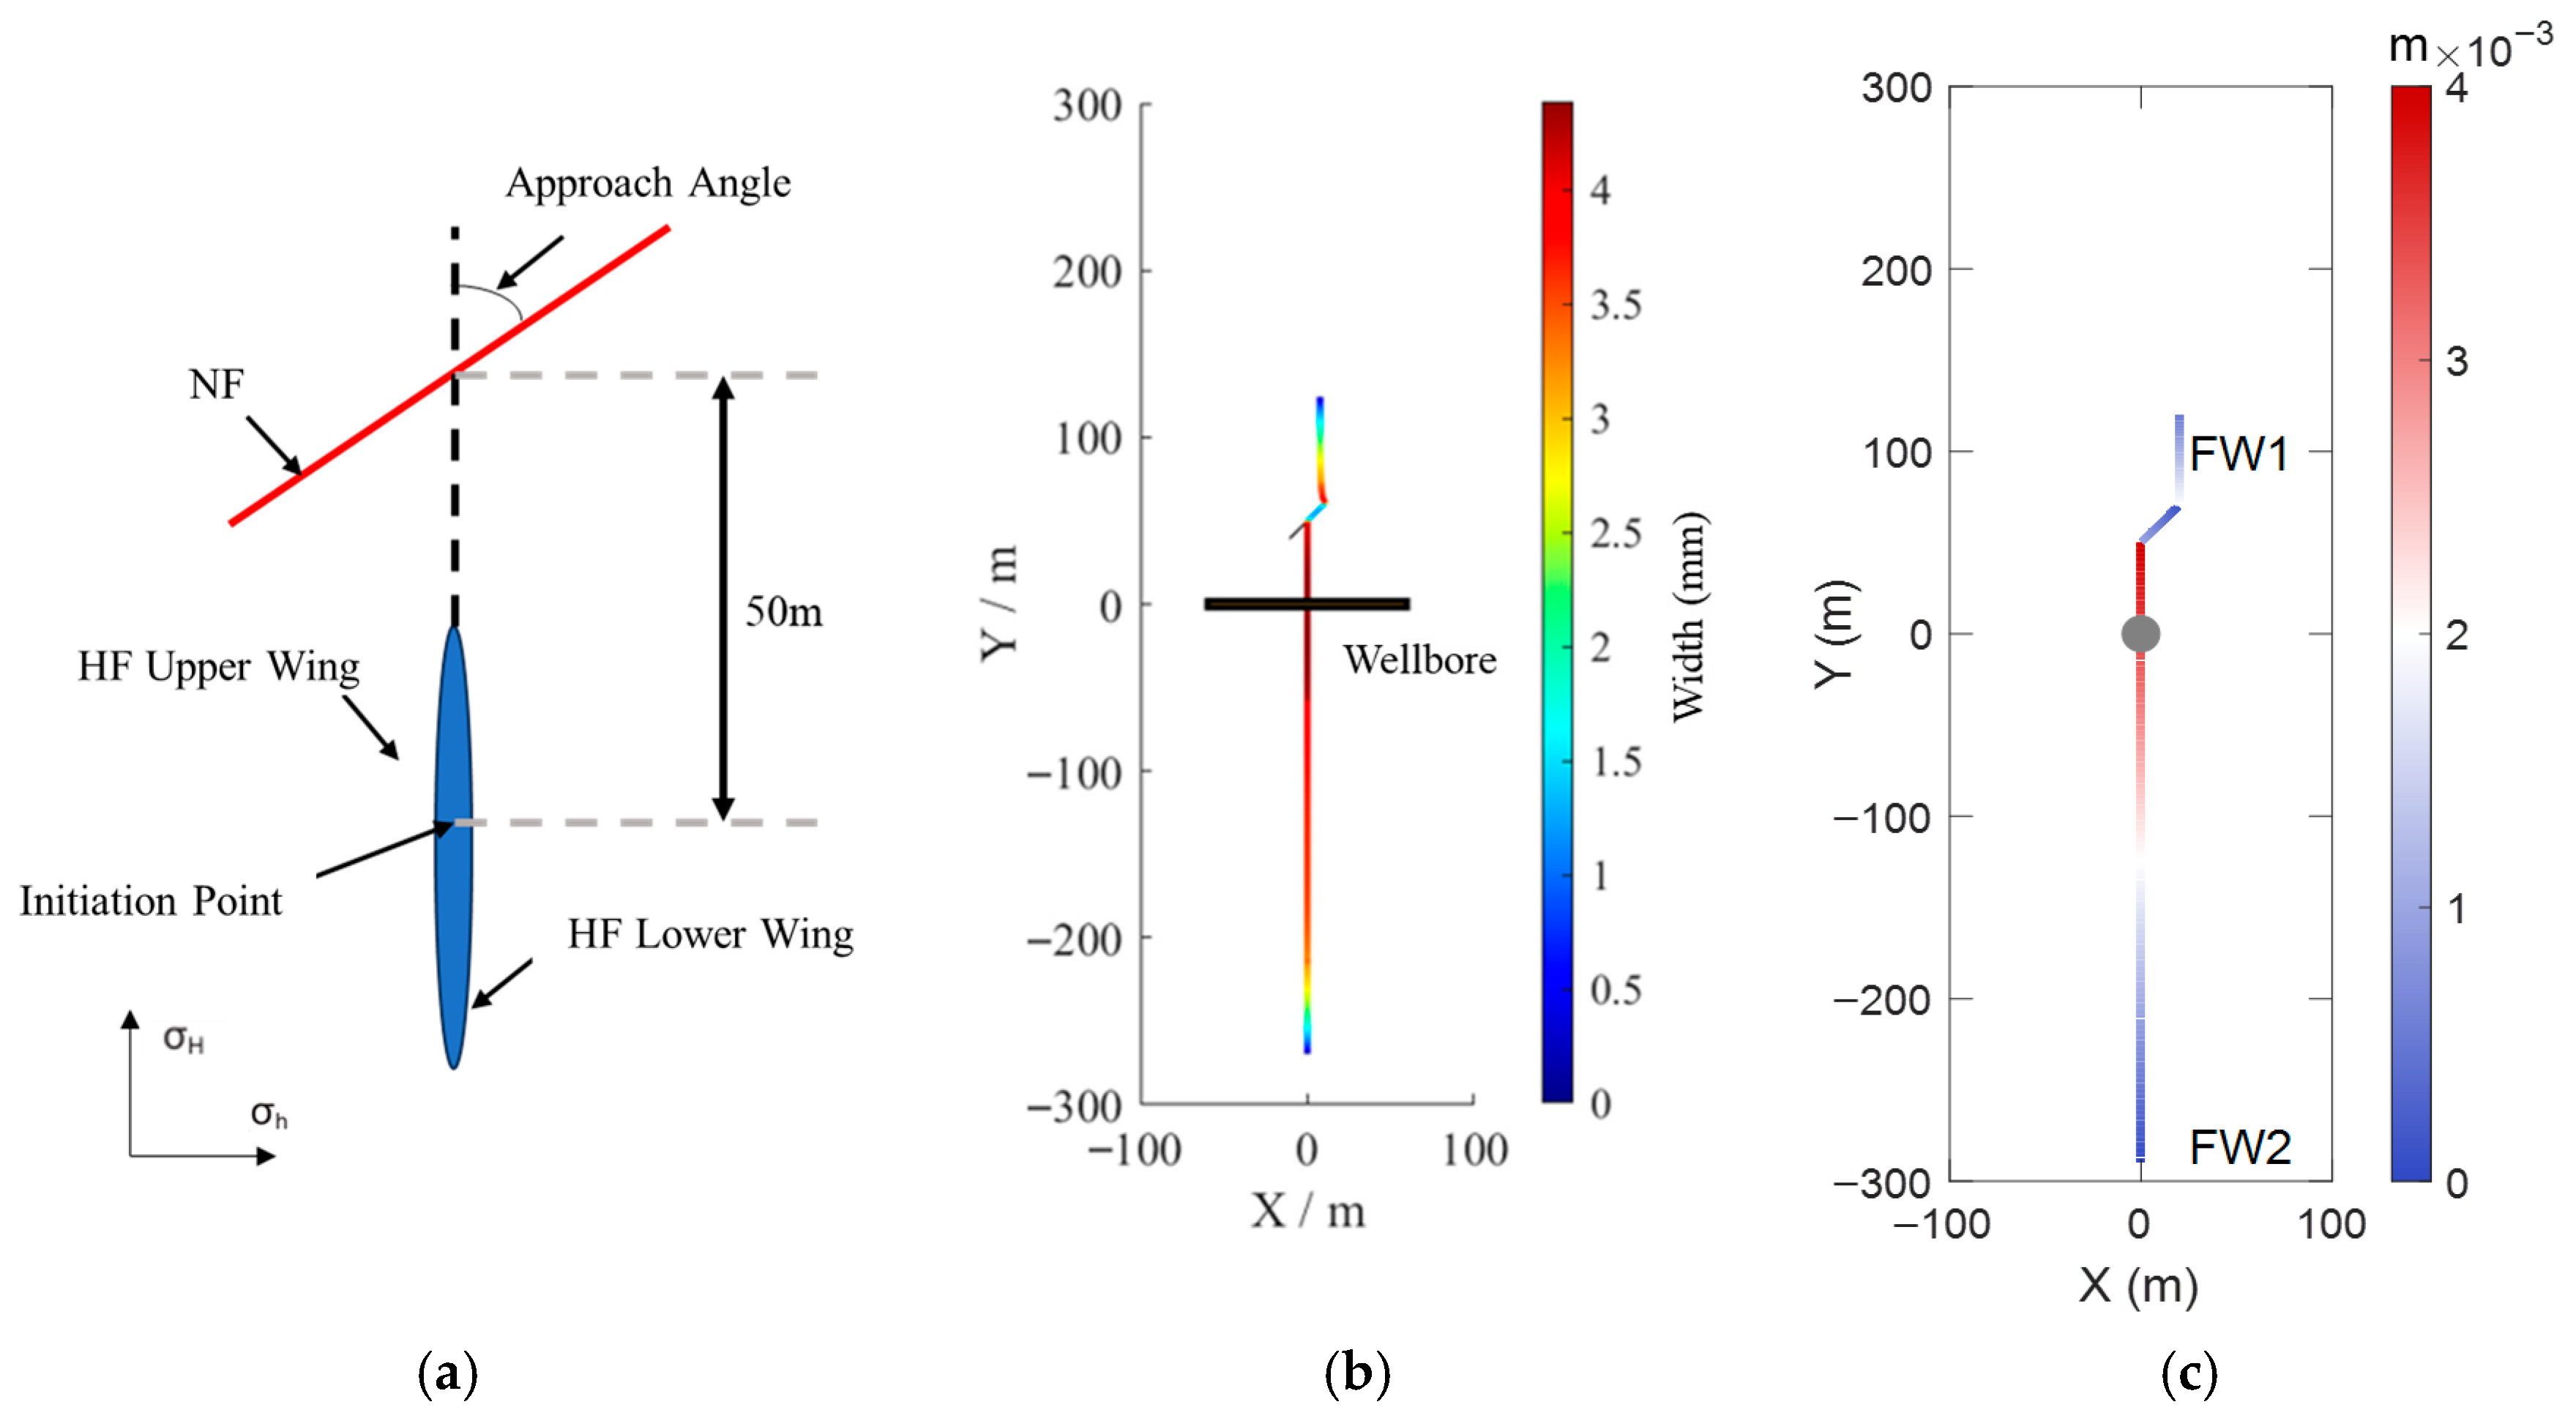
As shown in Figure 3a, an NF with a 45° angle for the x-axis is set 50 m above the HF initiation point. All model parameters are selected to be consistent with Xie et al. [12]. As shown in Figure 3b,c, the simulation results of the proposed model are basically consistent with those of Xie et al. [12] in terms of both fracture morphology and fracture width distribution. Due to the high in situ stress at the NF location and the compression from the right side of the HF, the propagation speed of the upper wing of the HF slows down after deflecting into the NF (the upper wing length is significantly smaller than the lower wing), exhibiting a “width restriction” phenomenon (with a smaller local width of only 1 mm). After deflecting out of the NF, it returns to the direction of the maximum principal stress to continue propagating, and the width shows restorative growth.

3. Model Building and Parameter Setting

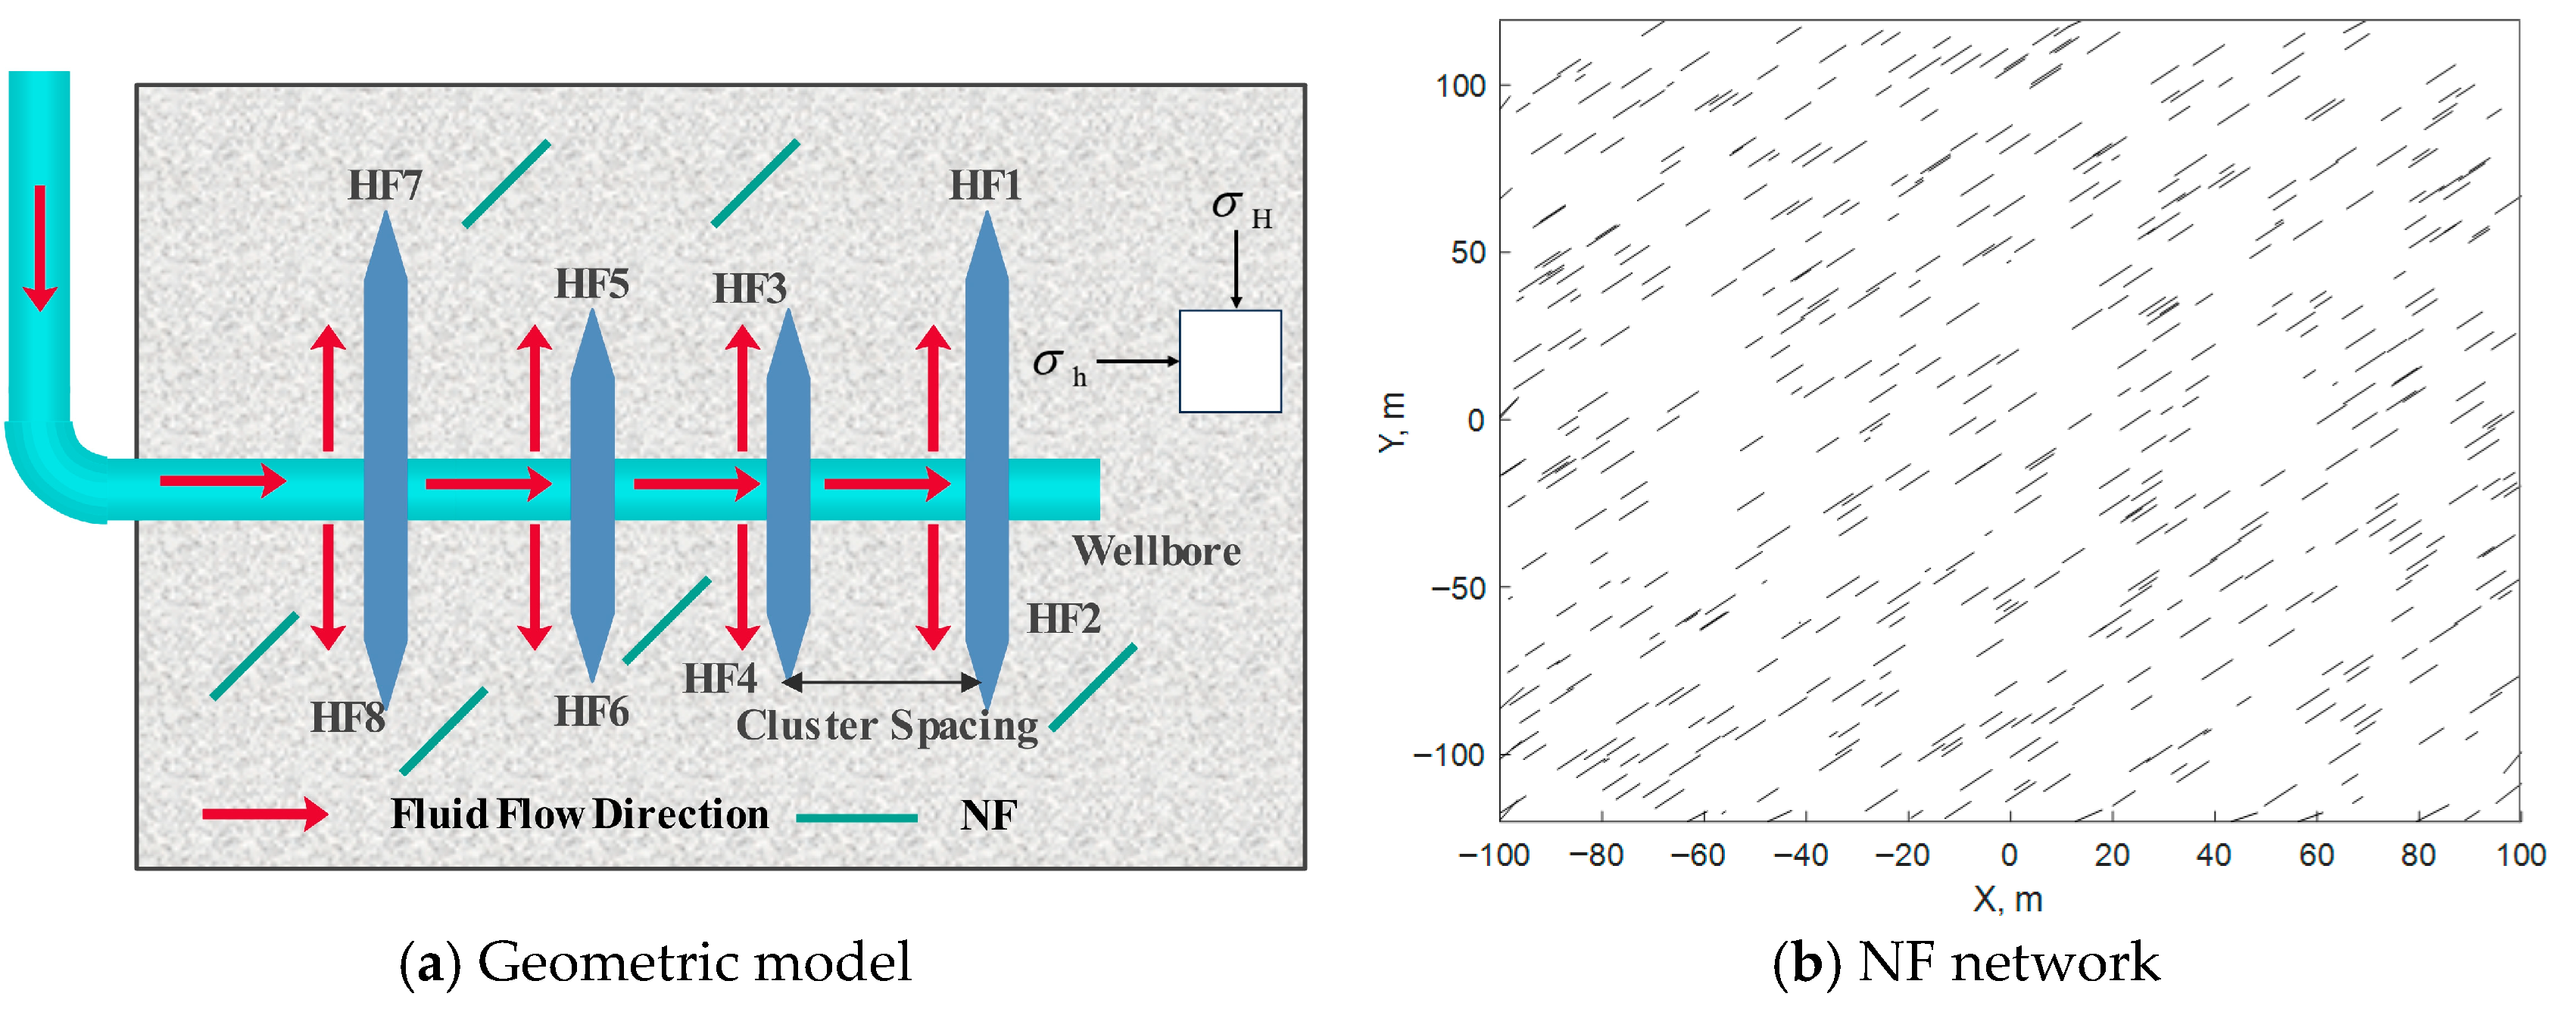
As shown in Figure 4a, four HFs are pre-set within the fracturing stage, with an initial length of 1 m and a cluster spacing of 24 m, aligned along the direction of the maximum horizontal principal stress. Based on the NF network distribution characterization method described in Section 2.5, 500 NFs are set within a 200 m × 240 m region. The lengths of the NFs follow a power-law distribution from 1 to 10 m, and the angle between HFs and NFs is 45°. The specific spatial arrangement is shown in Figure 4b. Taking a fractured volcanic reservoir in Xinjiang Oilfield as an example, Table 1 lists the basic input parameters for the model.

4. Effects of Limited-Entry and Temporary Plugging

4.1. Extreme Limited-Entry Fracturing (ELF)

Non-uniform and non-equal diameter perforation placement can provide additional pressure drop to balance the extra flow resistance introduced by the stress shadow effect [25]. However, the random distribution of natural fractures introduces uncertainty in the propagation and development degree of hydraulic fractures, making it difficult to pre-apply non-uniform, non-equal diameter perforation measures to improve the balanced propagation of hydraulic fractures. Based on this consideration, this study adopts equal diameter and uniform perforation limited-entry measures (default perforation diameter is 10 mm).
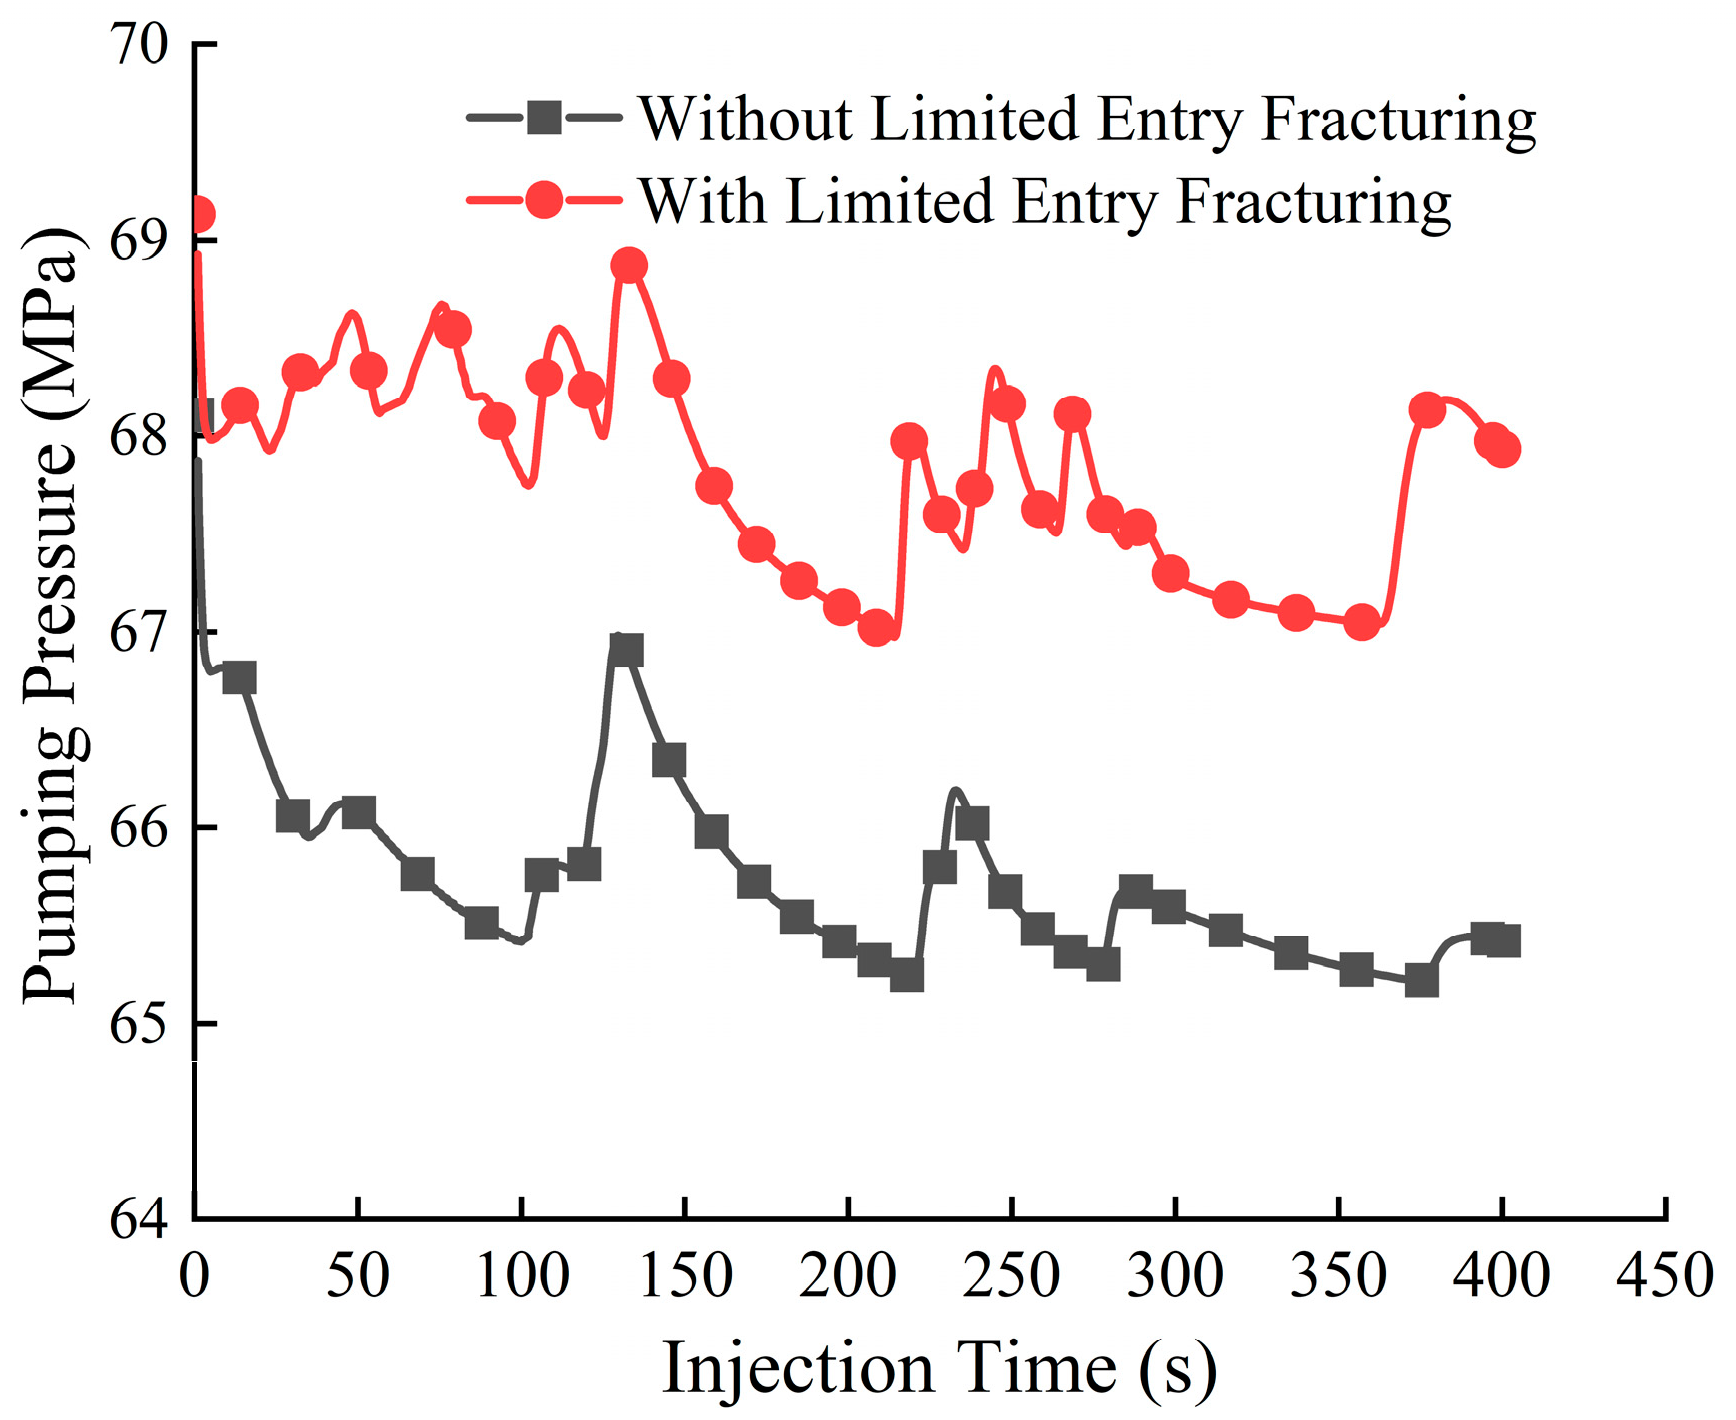
Figure 5 compares the pumping pressure response characteristics between an unlimited-entry perforation scheme (16 perforations/cluster) and a limited-entry scheme (5 perforations/cluster). When HFs connect with NFs, influenced by the heterogeneous in situ stress field and fracture interaction, deflection into NFs induces additional flow resistance, causing pumping pressure to rise [12]; when fractures return to the matrix and propagate perpendicular to the minimum principal stress direction, the pressure shows a declining trend. Therefore, pressure curves for both cases exhibit significant fluctuations. The reduction in the number of perforations significantly increases the pumping pressure for the limited-entry scheme, with its pressure fluctuation range reaching 67.3–69.2 MPa: an increase of 1–4 MPa compared to the unlimited-entry scheme.
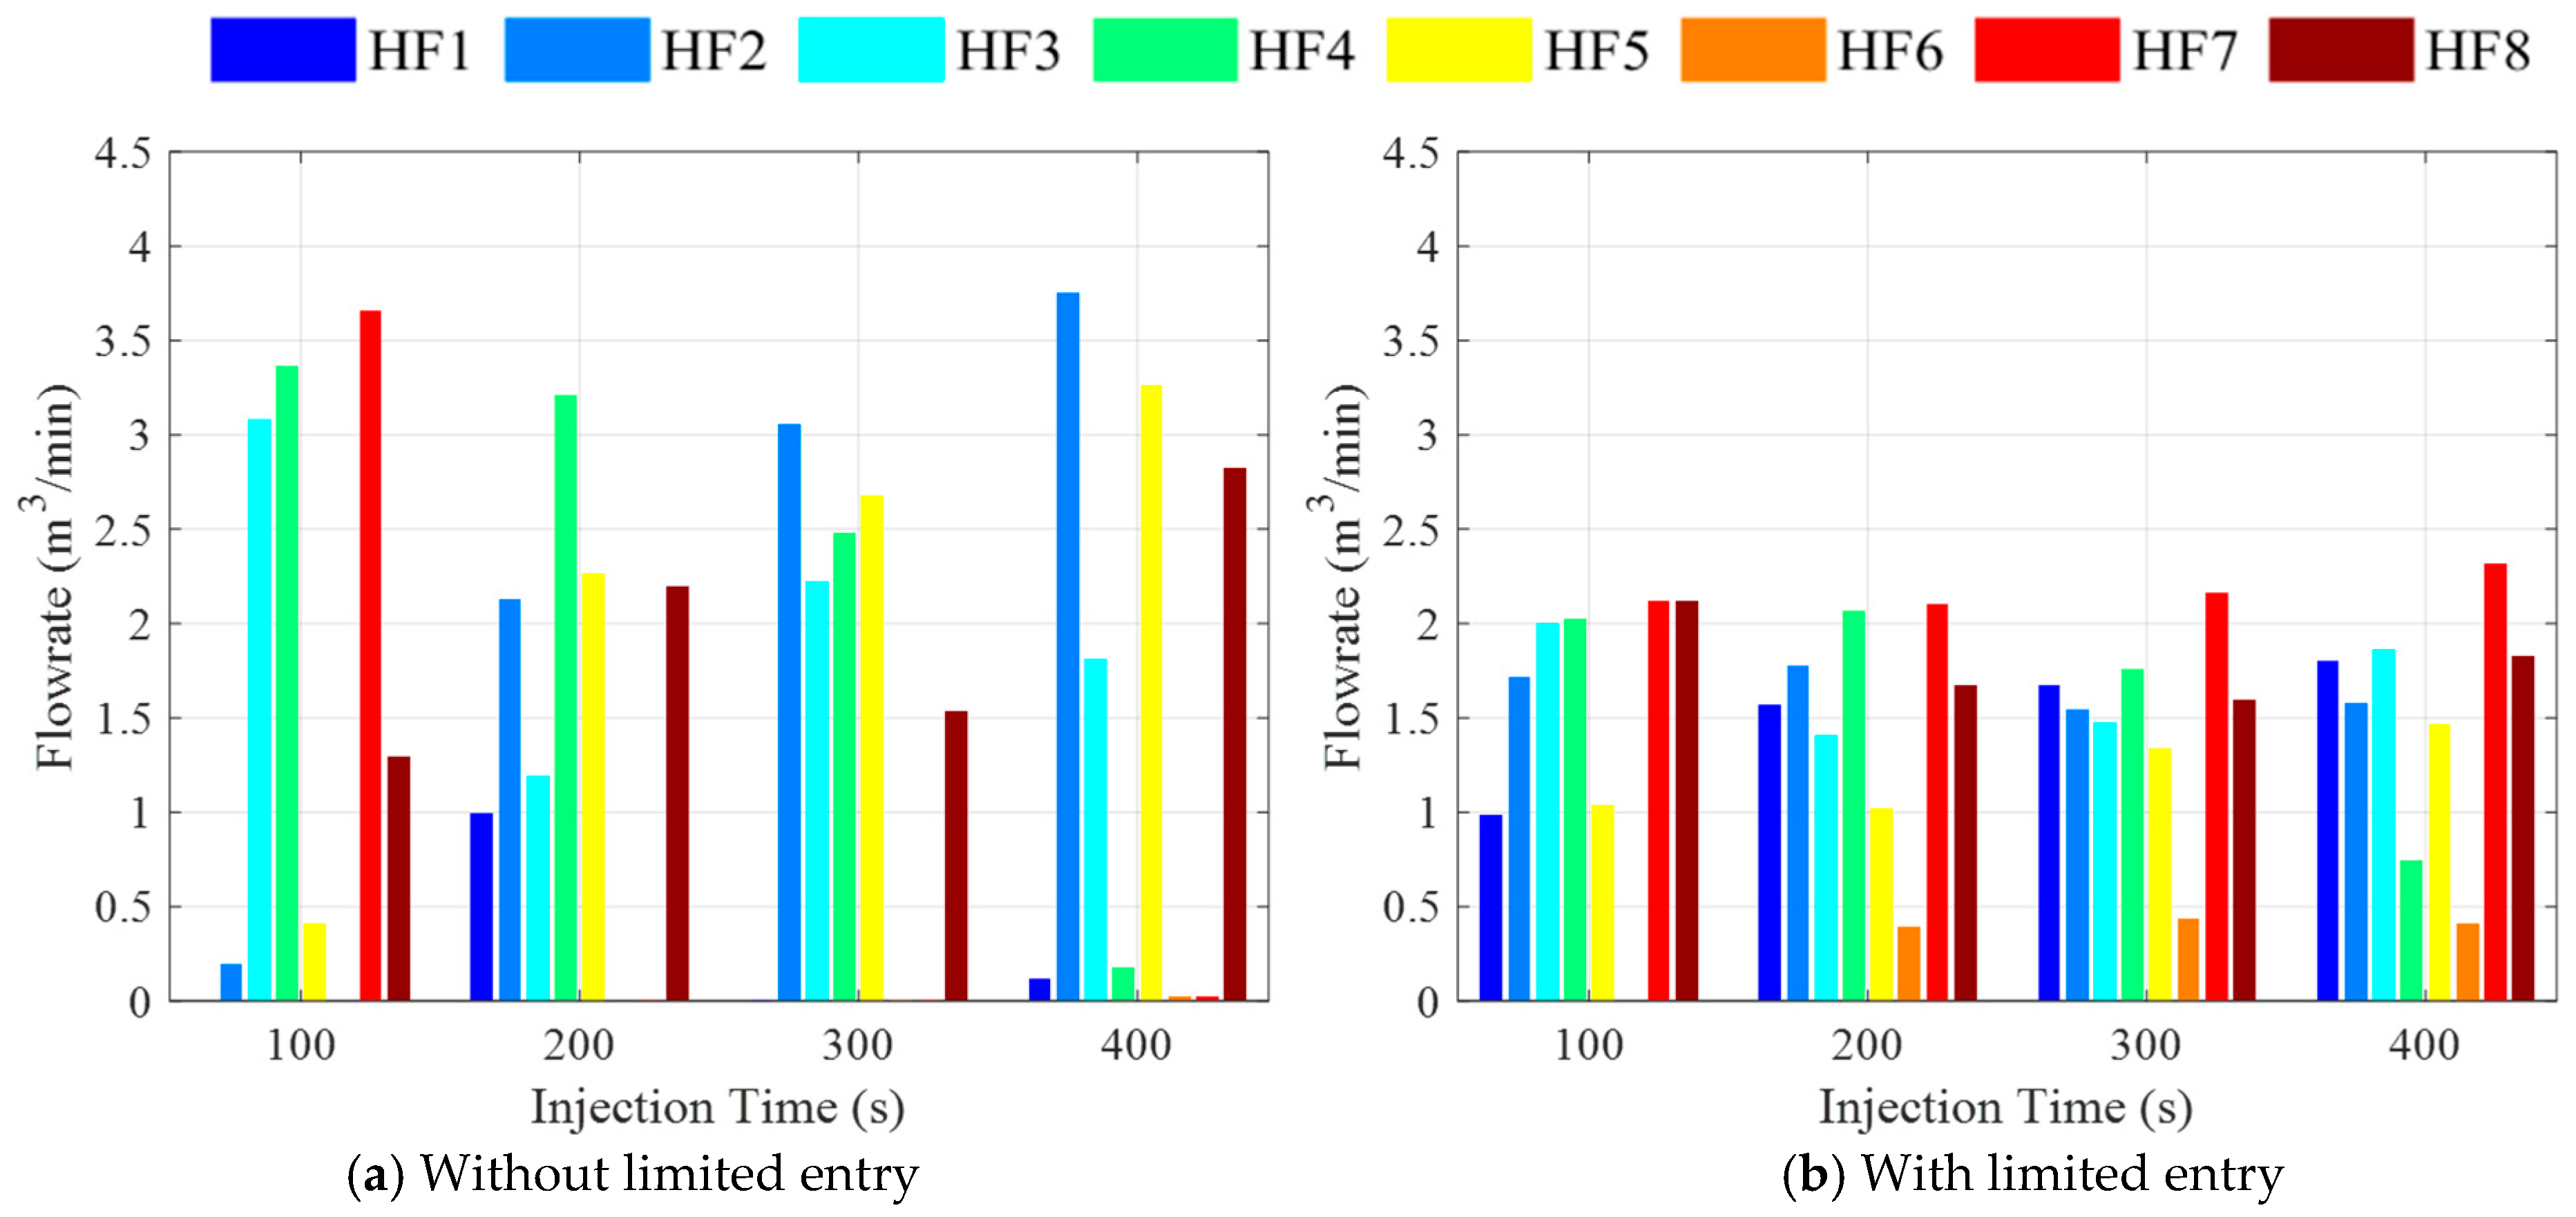
Figure 6 shows the flow distribution curves without and with limited entry. It can be intuitively seen that as the number of perforations per cluster decreases, the distribution range of flow rates among the clusters also narrows. Specifically, when there are 16 perforations per cluster, the flow rates per cluster are distributed between 0 and 3.8 m3/min; when the number of perforations per cluster is reduced to 5, the flow distribution range narrows to 0–2.4 m3/min, and the fluid distribution uniformity improves by 36.84%. Before implementing limited-entry perforation, the flow rates into HF6 and HF7 were zero for most of the pumping period, leading to a halt in fracture propagation. After applying limited-entry perforation, the flow rate into HF6 increased to 0.4 m3/min, while that into HF7 increased to 2.2 m3/min. This indicates that reducing the number of perforations per cluster can significantly improve fluid distribution uniformity, which is beneficial for balanced HF propagation and balanced reservoir stimulation.
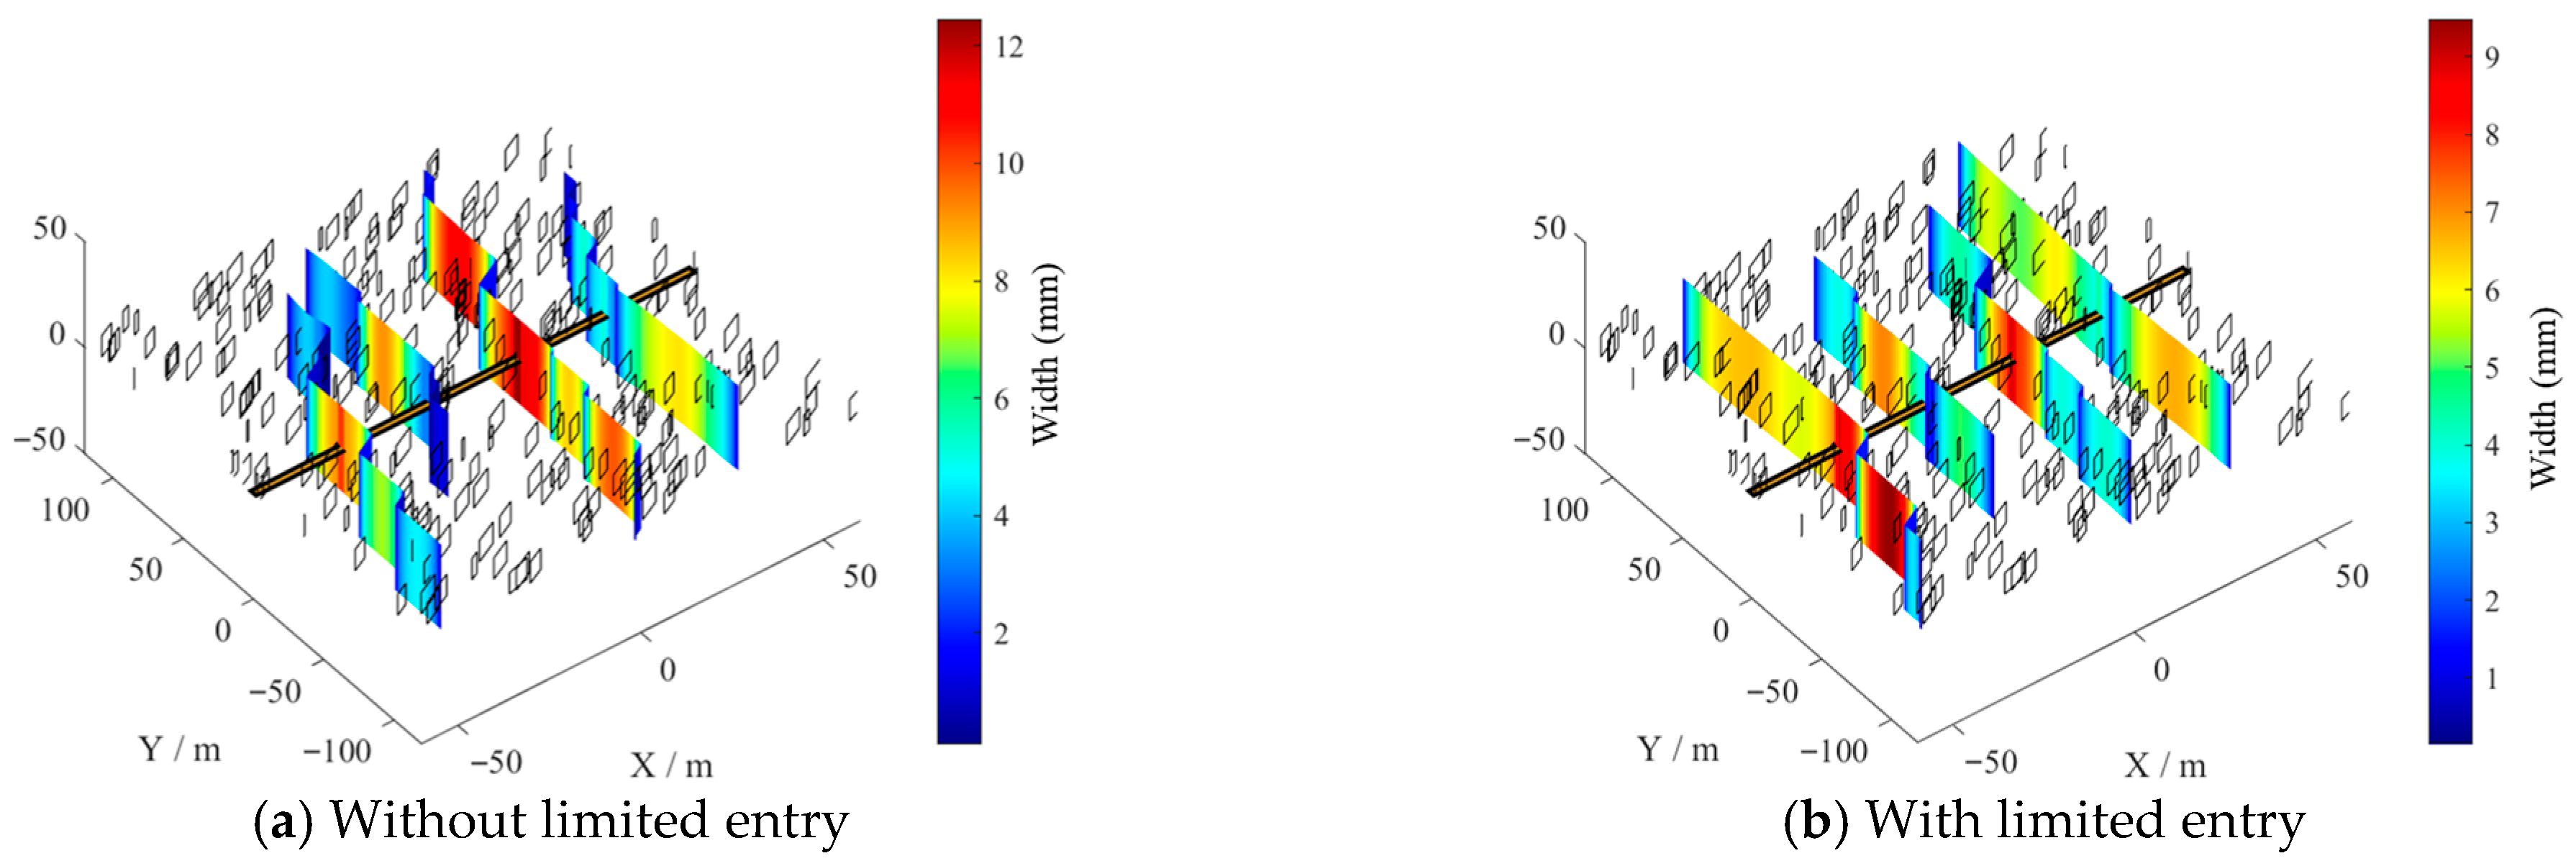
As shown in Figure 7, during the simultaneous propagation of multiple HFs, the presence of NFs and stress interference between fractures causes the spatial morphology of HF to exhibit complex non-planar characteristics. Analysis using Equation (25) shows that compared to the unlimited-entry case, the CV for fracture length and fluid intake after ELF decreased by 54.28% and 44.16%, respectively. This indicates that the ELF technique not only effectively suppresses the stress shadow effect formed by the squeezing of external fractures on internal fractures during propagation but also “balances” the additional flow resistance caused by connecting with NFs, promoting balanced multi-fracture propagation.

4.2. Temporary Plugging Fracturing (TPF)

Although the ELF technique can promote balanced fluid intake per cluster, the low number of designed perforations leads to high perforation friction, resulting in high wellhead pressure (Figure 5), which places greater demands on surface equipment. Furthermore, during ELF operations, perforations become eroded and enlarged after proppant addition, gradually weakening the limited-entry effect [7,23]. In contrast to ELF, TPF utilizes the injection of an appropriate number of TPBs to block some dominant fractures, allowing more fluid to flow into under-stimulated fractures, thereby promoting uniform fluid intake and balanced propagation of multiple fractures. Field construction data from oilfields shows that the perforation efficiency is generally above 85%; the sealing rate of TPBs ranges from 50% to 60%; and the quantity of TPBs designed for a single temporary plugging operation is calculated as the total perforation count × perforation efficiency × sealing rate of TPBs [26]. In this study, the initial number of perforations is set to eight per cluster, and thirty-two ball sealers (half of the total perforations) are injected at 200 s (the mid-point of the treatment time) for dynamic plugging.
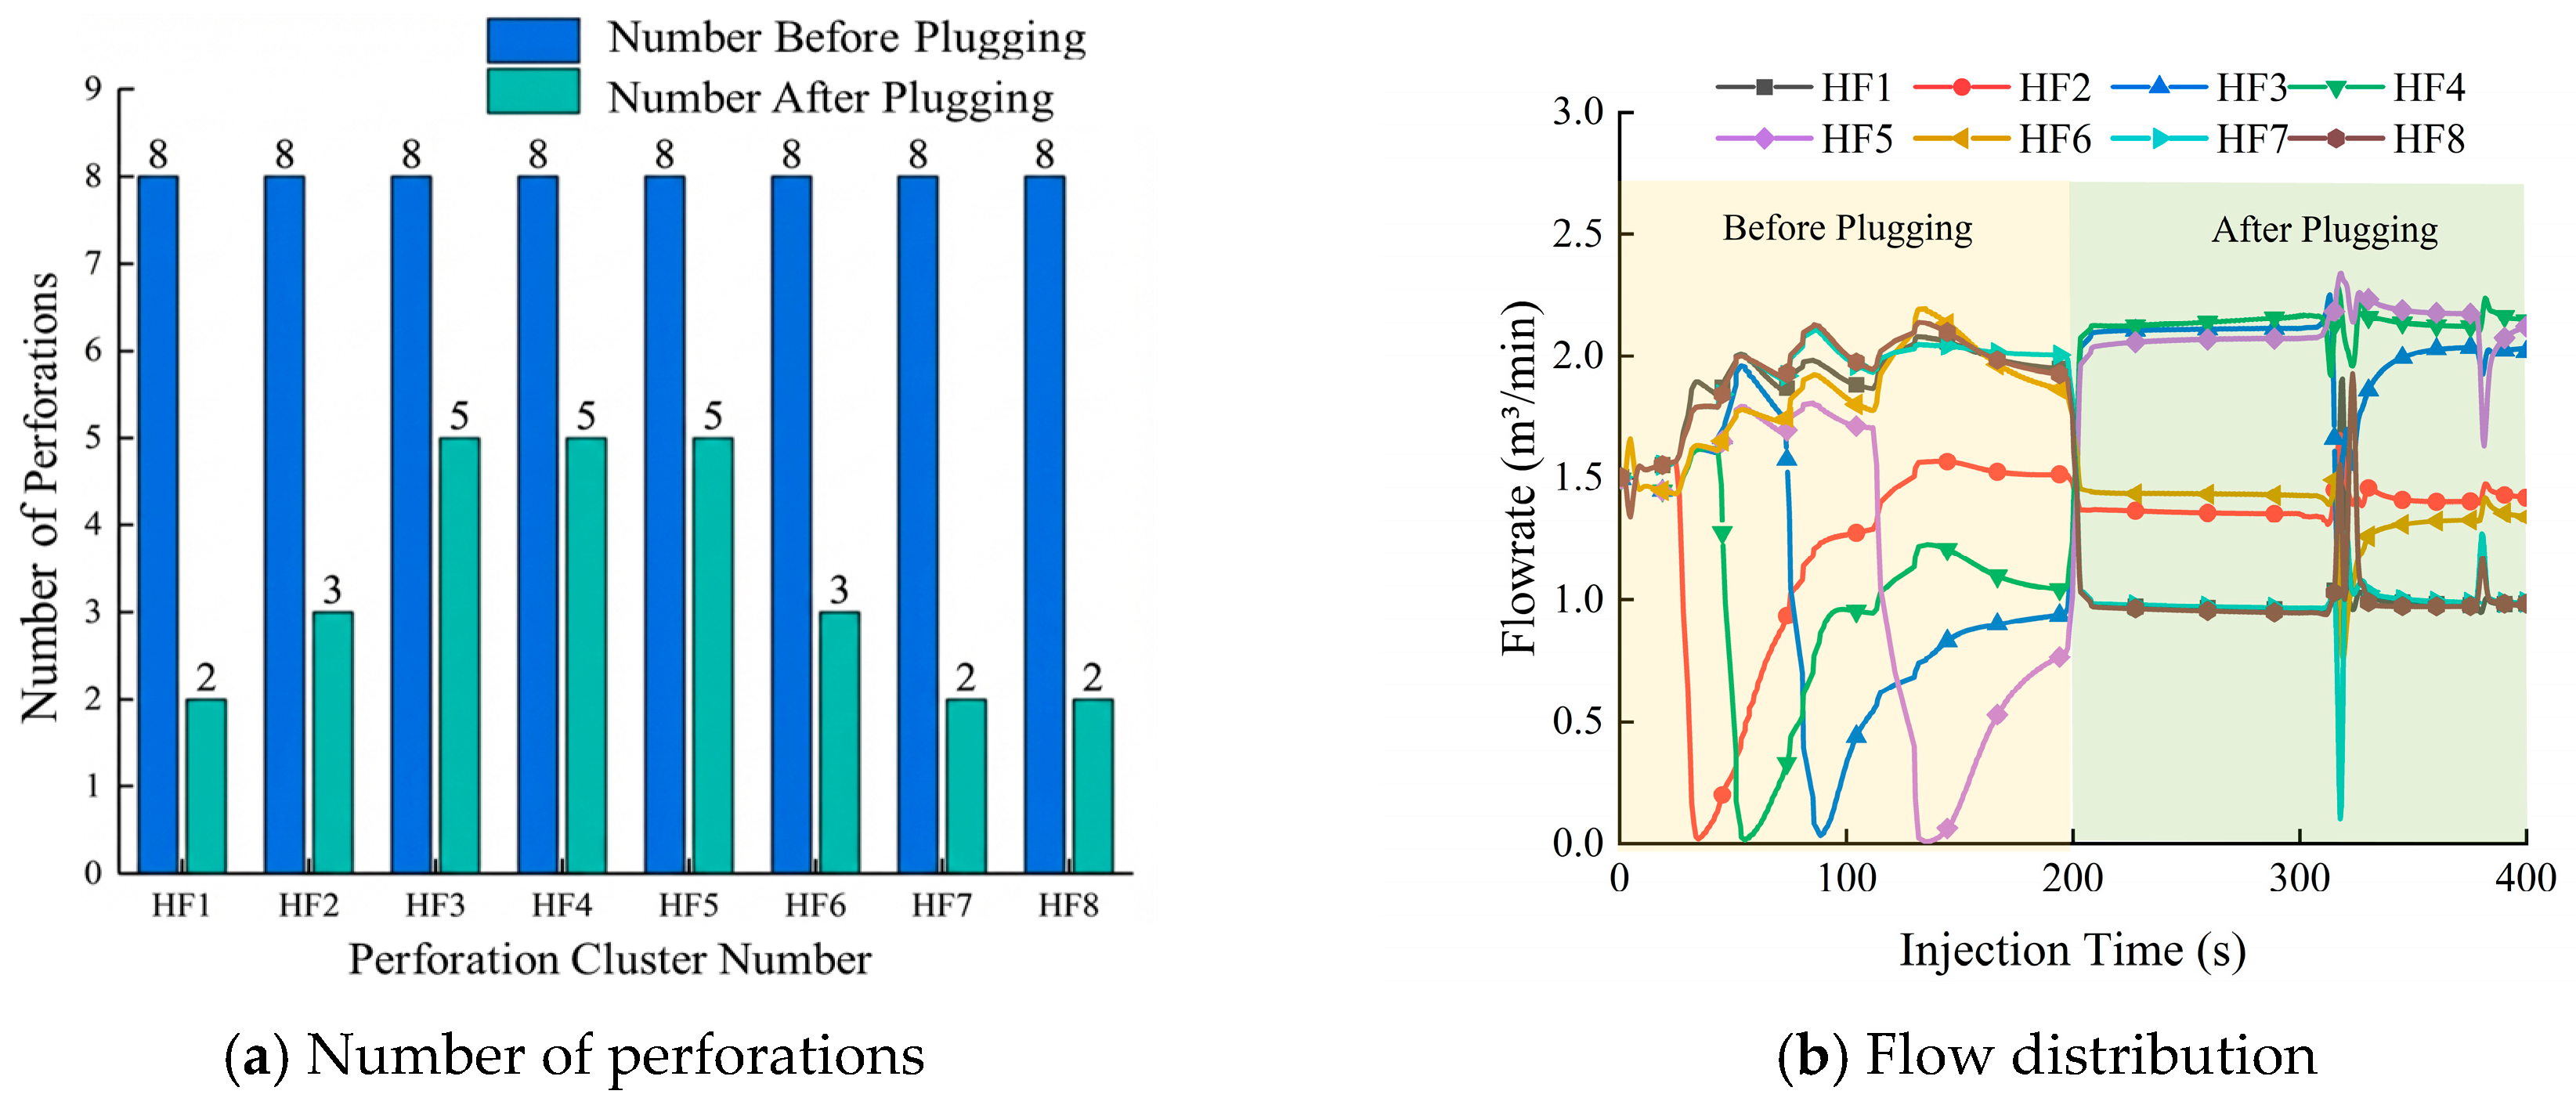
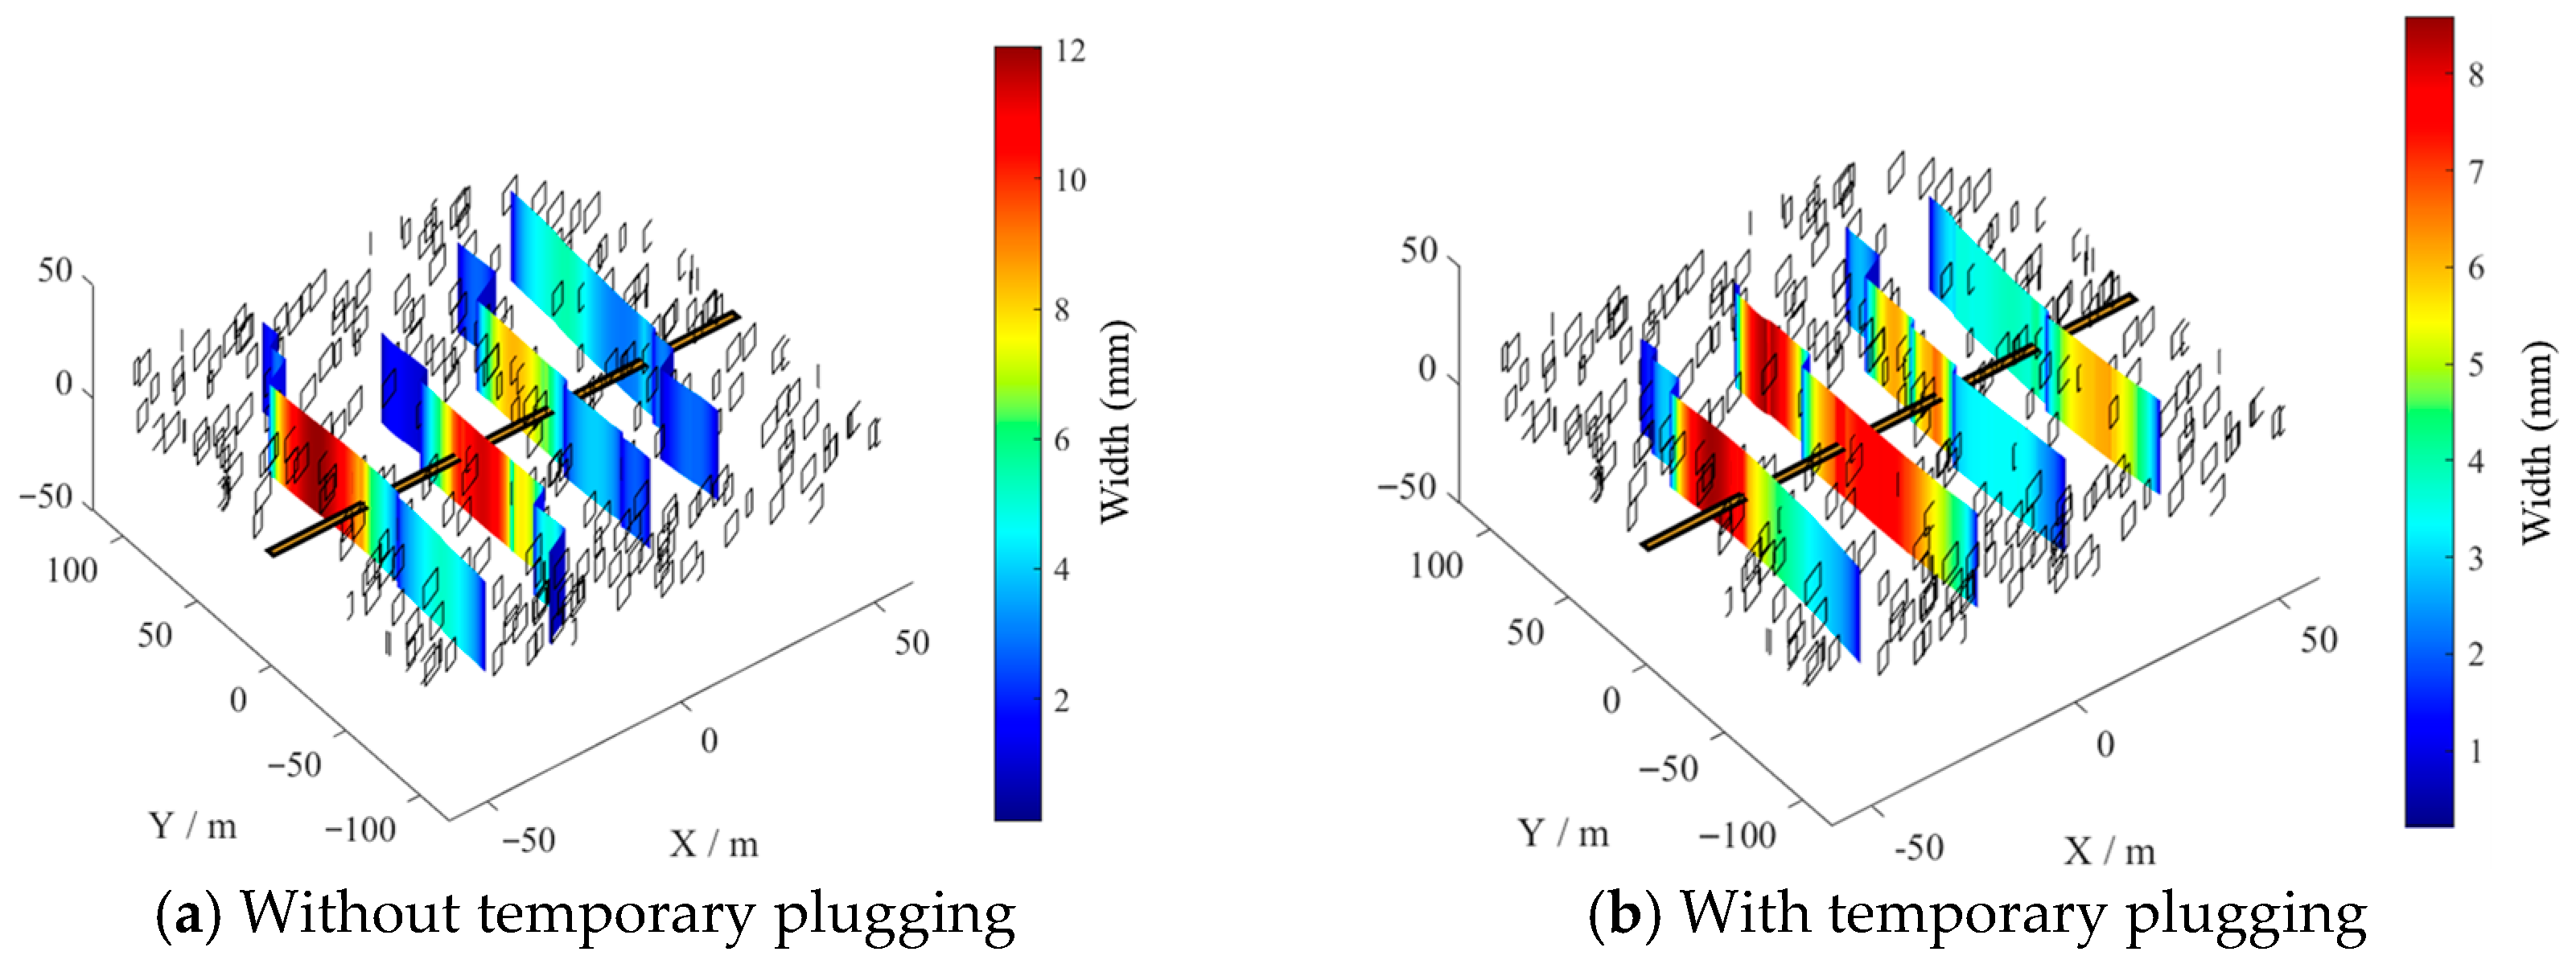
Figure 8 shows the dynamic changes in the number of perforations and flow distribution per cluster during the TPF operation. After adding TPBs, the number of perforations per cluster decreases. The number of perforations for clusters HF1 to HF8 changes to 2, 3, 5, 5, 5, 3, 2, and 2, with corresponding temporary plugging efficiencies of 75%, 62.5%, 37.5%, 37.5%, 37.5%, 62.5%, 75%, and 75%. Before plugging, the flow distribution per cluster ranges from 0.12 to 2.18 m3/min. After adding TPBs, the flow rates per cluster are concentrated in the range of 0.95 to 2.23 m3/min, and fluid uniformity improves by 37.86%. Clusters HF3, HF4, and HF5 have the greatest number of remaining perforations, resulting in reduced flow resistance and increased fluid intake. This indicates that the essence of intra-stage temporary plugging in fractured reservoirs is non-uniform perforation placement, allocating more diverting agents to clusters with higher fluid intake, increasing their perforation friction, and reducing their fluid intake, thus allocating more fluid to clusters with less fluid intake [27].
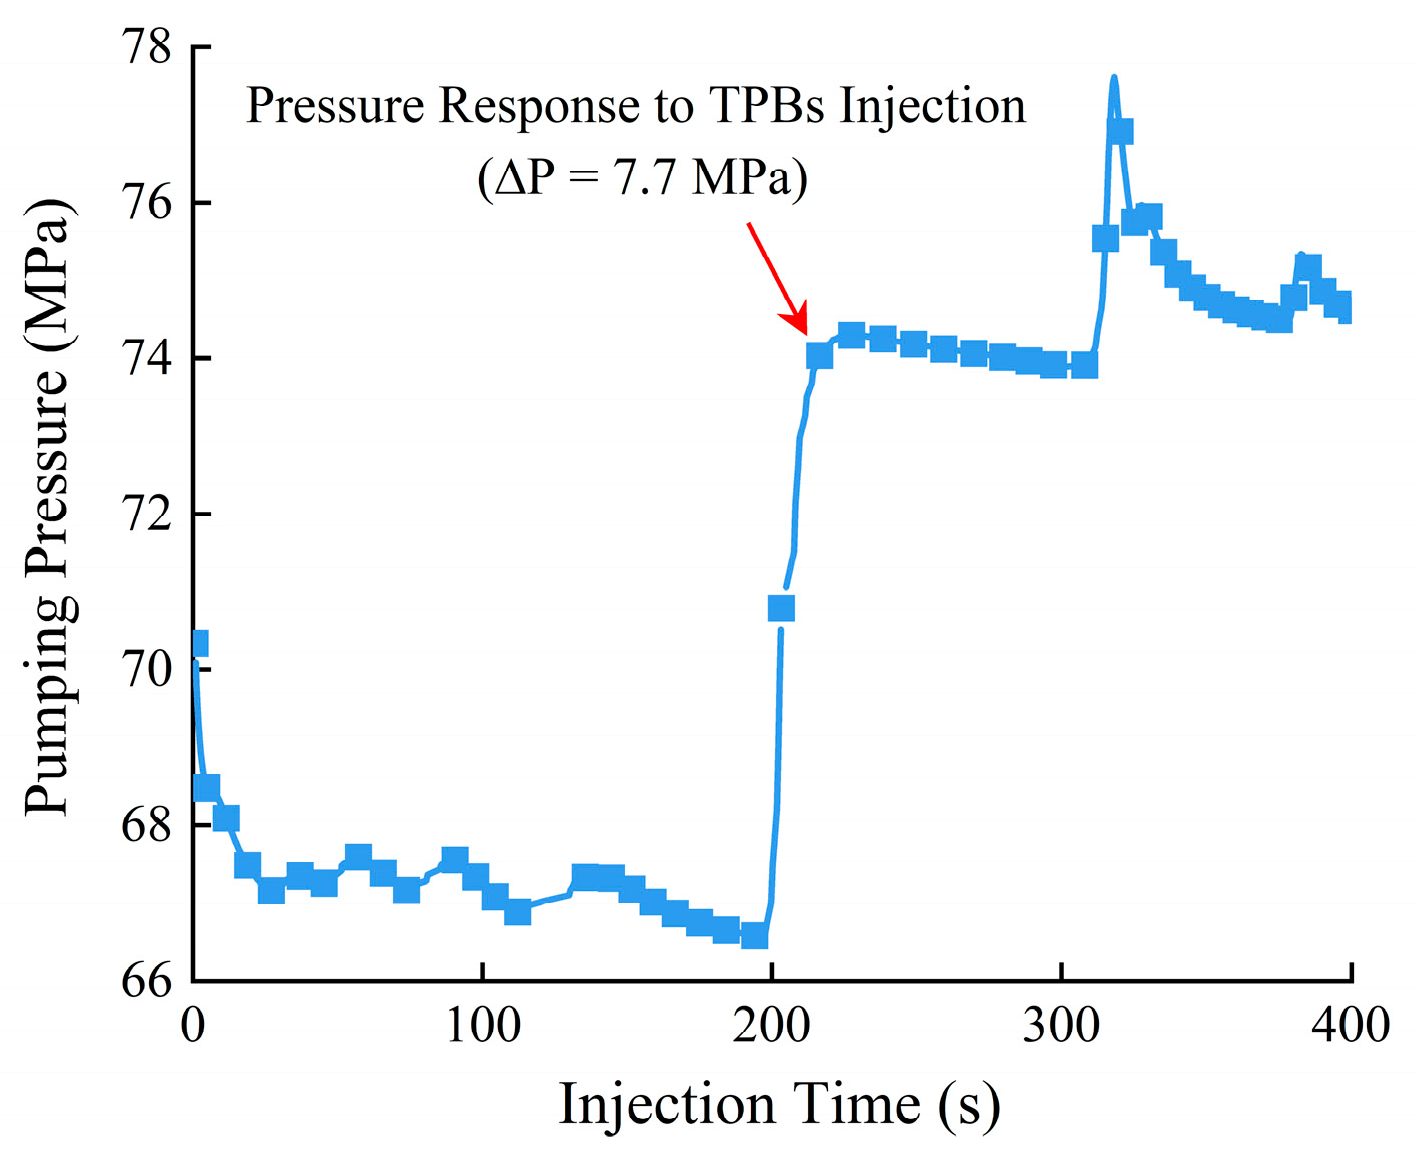
Figure 9 and Figure 10 show the dynamic pumping pressure response curve and the final fracture geometries without and with temporary plugging, respectively. The simulation results demonstrate that after implementing TPF, the pumping pressure rapidly increases by 7.1 MPa, which is within a reasonable range. In the laboratory experiments conducted by Zou et al. [28], the increase in pressure amplitude reached approximately 12 MPa after introducing single-sized TPBs. Comparing the fracture morphology after stimulation, the fractures in each stage using the temporary plugging propagation were relatively balanced. The CV for fracture length and fluid intake decreased by 72.54% and 58.39%, respectively, proving the effectiveness of the temporary plugging technique in promoting balanced multi-fracture propagation in fractured reservoirs.

5. Discussion

The numerical model developed in this study couples multiple physical processes, including rock deformation, fluid flow, leak-off, the interaction between HF and NF, and ball sealer plugging. This establishes a robust workflow and framework for analyzing the impacts of ELF and TPF on fracture propagation within naturally fractured reservoirs. However, in realistic reservoir conditions, NFs exhibit varying dip and strike angles alongside distinct initial stress states [29]. The current two-dimensional model simplifies these spatial complexities and cannot fully characterize the three-dimensional nature of HF-NF interactions. Consequently, a fully non-planar three-dimensional model is required to comprehensively investigate these complex behaviors. This represents a limitation of the current study, which we aim to address in future work. Furthermore, while this study focuses on the fundamental impacts of ELF and TPF, field-scale challenges—such as perforation erosion, diverter distribution efficiency, degradation capability, and placement accuracy—remain critical factors. Integrating these field constraints to systematically optimize perforation and temporary plugging parameters in fractured reservoirs will be the focus of our subsequent research.

6. Conclusions

Addressing the challenges of complex influencing factors on fluid distribution and complex propagation morphology for intra-stage multi-fractures in fractured reservoirs, this study, based on the DDM and coupled physical processes such as fluid flow, fracture network propagation, perforation throttling, and perforation plugging, constructs a complex fracture network propagation model for fractured reservoirs under the influence of limited-entry and temporary plugging. The characteristics of fluid partitioning and propagation morphology for intra-stage multi-fractures are studied. The main conclusions are as follows:
(1) Due to stress shadow and the influence of NFs, final fracture morphology in fractured reservoirs exhibits significant non-planar propagation characteristics, with large differences in length and width among clusters. ELF and TPF can effectively alleviate problems of uneven fluid intake and imbalanced propagation among clusters.
(2) ELF artificially creates extremely high perforation friction by drastically reducing the number of perforations or the perforation diameter, thereby forcing the fracturing fluid to enter multiple perforation clusters relatively uniformly. Based on the parameters in this study, when using the limited-entry technique, reducing the number of perforations per cluster from 16 to 5 increases pumping pressure by 1–4 MPa, improves fluid distribution uniformity by 36.84%, and reduces the CV for fracture length and fluid intake by 54.28% and 44.16%, respectively.
(3) The core of TPF lies in utilizing non-uniform perforation distribution. This allows perforation clusters with high fluid intake to receive more TPBs, thereby increasing their perforation friction, reducing their fluid intake, and ultimately diverting flow to clusters with lower intake. Based on the parameters in this study, when using the temporary plugging technique, injecting TPBs equivalent to 50% of the total perforations after pumping half of the total fluid volume, the pumping pressure after plugging increases by 7.1 MPa, fluid distribution uniformity improves by 37.86%, and the CV for fracture length and fluid intake decrease by 72.54% and 58.39%, respectively.

Author Contributions

Writing—original draft, W.L.; Conceptualization, H.L.; Methodology: T.L.; Formal analysis: C.D.; investigation, T.N.; validation, P.H.; Software: M.H.; Writing—review and editing, B.W. All authors have read and agreed to the published version of the manuscript.

Funding

This research was funded by the National Natural Science Foundation of China (Grant No. 52374057), the Xinjiang “Tianshan Talent” Training Program (Grant No. 2023TSYCCX0004), the Key Research and Development Program of Xinjiang Uygur Autonomous Region (Grant No. 2024B01013-1), and the Xinjiang Tianshan Innovation Team Program (Grant No. 2024D14004).

Data Availability Statement

The original contributions presented in this study are included in the article. Further inquiries can be directed to the corresponding author.

Conflicts of Interest

Authors Wenjie Li, Hongjian Li, Tianbin Liao, Chao Duan, Tianyu Nie and Pan Hou were employed by Xinjiang Yaxin Coalbed Methane Resource Technology Research Co., Ltd. The remaining authors declare that the research was conducted in the absence of any commercial or financial relationships that could be construed as potential conflicts of interest.

References

  1. Tang, X.; Zhu, H.; Che, M.; Wang, Y. Complex fracture propagation model and plugging timing optimization for temporary plugging fracturing in naturally fractured shale. Pet. Explor. Dev. 2023, 50, 152–165. [Google Scholar] [CrossRef]
  2. Zhang, L.; Wang, B.; Lv, Z.; Lv, B.; Li, L.; Zhou, H. Intelligent optimization of integral fracturing in unconventional reservoirs. Xinjiang Oil Gas 2024, 20, 36–43. [Google Scholar]
  3. Huang, L.; Liao, X.; Chen, C.; Tan, P.; Tan, J.; Wang, C. Numerical simulation of competitive propagation of 3D multi-cluster hydraulic fractures in fractured shale gas reservoirs. J. Eng. Geol. 2024, 32, 1292–1300. [Google Scholar] [CrossRef]
  4. Zhou, H.; Yan, T.; Trivedi, J.; Wang, B.; Zhou, F. Investigating rock properties and fracture propagation pattern during supercritical CO2 pre-fracturing in conglomerate reservoir. Adv. Geo-Energy Res. 2025, 17, 95–106. [Google Scholar] [CrossRef]
  5. Somanchi, K.; Brewer, J.; Reynolds, A. Extreme limited-entry design improves distribution efficiency in plug-and-perforate completions: Insights from fiber-optic diagnostics. SPE Drill. Complet. 2018, 33, 298–306. [Google Scholar] [CrossRef]
  6. Cramer, D.; Friehauf, K.; Roberts, G.; Whittaker, J. Integrating DAS, treatment pressure analysis and video-based perforation imaging to evaluate limited entry treatment effectiveness. In Proceedings of the SPE Hydraulic Fracturing Technology Conference and Exhibition, The Woodlands, TX, USA, 5–7 February 2019; SPE: Richardson, TX, USA, 2019; p. D031S007R001. [Google Scholar] [CrossRef]
  7. Li, M.; Zhou, F.; Huang, G.; Wang, B.; Hu, X.; Li, H. Finite element simulation method for multi-cluster fracturing in horizontal wells based on pipe elements. J. China Univ. Pet. 2022, 46, 105–112. [Google Scholar] [CrossRef]
  8. Fu, H.; Huang, L.; Hou, B.; Weng, D.; Guan, B.; Zhong, T.; Zhao, Y. Experimental and numerical investigation on interaction mechanism between hydraulic fracture and natural fracture. Rock Mech. Rock Eng. 2024, 57, 10571–10582. [Google Scholar] [CrossRef]
  9. Zhang, J.; Li, Y.; Pan, Y.; Wang, X.; Yan, M.; Shi, X.; Zhou, X.; Li, H. Experiments and analysis on the influence of multiple closed cemented natural fractures on hydraulic fracture propagation in a tight sandstone reservoir. Eng. Geol. 2021, 281, 105981. [Google Scholar] [CrossRef]
  10. Liu, Z.; Pan, Z.; Li, S.; Zhang, L.; Wang, F.; Han, L.; Zhang, J.; Ma, Y.; Li, H.; Li, W. Study on the effect of cemented natural fractures on hydraulic fracture propagation in volcanic reservoirs. Energy 2022, 241, 122845. [Google Scholar] [CrossRef]
  11. Suo, Y.; Chen, Z.; Rahman, S.; Yan, H. Numerical simulation of mixed-mode hydraulic fracture propagation and interaction with different types of natural fractures in shale gas reservoirs. Environ. Earth Sci. 2020, 79, 279. [Google Scholar] [CrossRef]
  12. Xie, J.; Huang, H.; Ma, H.; Zeng, B.; Tang, J.; Yu, W.; Wu, K. Numerical investigation of effect of natural fractures on hydraulic-fracture propagation in unconventional reservoirs. J. Nat. Gas Sci. Eng. 2018, 54, 143–153. [Google Scholar] [CrossRef]
  13. Yang, C.; Yang, Z.; Wang, H.; Jiang, L.; Yi, L.; Cheng, Y.; Yi, D. Mechanisms of non-uniform propagation of hydraulic fractures: A comprehensive numerical investigation. Eng. Anal. Bound. Elem. 2025, 178, 106307. [Google Scholar] [CrossRef]
  14. Li, M.-H.; Zhou, F.-J.; Wang, B.; Hu, X.-D.; Wang, D.-B.; Zhuang, X.-Y.; Han, S.-B.; Huang, G.-P. Numerical simulation on the multiple planar fracture propagation with perforation plugging in horizontal wells. Pet. Sci. 2022, 19, 2253–2267. [Google Scholar] [CrossRef]
  15. Hu, M.; Wang, B.; Zhang, L.; Xin, X.; Yang, L.; Zhou, F. The comparison of hydraulic fracturing with two different staged methods: A numerical study. Phys. Fluids 2025, 37, 96620. [Google Scholar] [CrossRef]
  16. Erdogan, F.; Sih, G.C. On the crack extension in plates under plane loading and transverse shear. J. Basic Eng. 1963, 85, 519–525. [Google Scholar] [CrossRef]
  17. Olson, J.E. Fracture Mechanics Analysis of Joints and Veins. Ph.D. Thesis, Stanford University, Stanford, CA, USA, 1991. [Google Scholar]
  18. Cheng, W.; Jiang, G.; Jin, Y. Numerical simulation of fracture path and nonlinear closure for simultaneous and sequential fracturing in a horizontal well. Comput. Geotech. 2017, 88, 242–255. [Google Scholar] [CrossRef]
  19. Wang, Y.; Guo, T.; Chen, M.; Jia, X.; Weng, D.; Qu, Z.; Hu, Z.; Zhang, B.; Wang, J. Numerical simulation on multi-well fracturing considering multiple thin layers in vertical direction. Int. J. Rock Mech. Min. Sci. 2024, 183, 105951. [Google Scholar] [CrossRef]
  20. Xu, W.; Zhao, J.; Rahman, S.S.; Li, Y.; Yuan, Y. A comprehensive model of a hydraulic fracture interacting with a natural fracture: Analytical and numerical solution. Rock Mech. Rock Eng. 2019, 52, 1095–1113. [Google Scholar] [CrossRef]
  21. Wu, K.; Olson, J.E. Numerical investigation of complex hydraulic-fracture development in naturally fractured reservoirs. SPE Prod. Oper. 2016, 31, 300–309. [Google Scholar] [CrossRef]
  22. Huang, G. Study on Hydraulic Fracture Propagation and Pressure Response Considering Perforation Erosion. Master’s Thesis, China University of Petroleum, Beijing, China, 2023. [Google Scholar]
  23. Chen, X. Numerical Simulation Study on the Heterogeneous Propagation of Multiple Fractures in Staged Multi-Cluster Fracturing of Horizontal Wells. Ph.D. Thesis, Southwest Petroleum University, Chengdu, China, 2018. [Google Scholar]
  24. Zhou, J.; Chen, M.; Jin, Y.; Zhang, G.Q. Analysis of fracture propagation behavior and fracture geometry using a tri-axial fracturing system in naturally fractured reservoirs. Int. J. Rock Mech. Min. Sci. 2008, 45, 1143–1152. [Google Scholar] [CrossRef]
  25. Wu, K.; Olson, J.; Balhoff, M.T.; Yu, W. Numerical analysis for promoting uniform development of simultaneous multiple-fracture propagation in horizontal wells. SPE Prod. Oper. 2017, 32, 41–50. [Google Scholar] [CrossRef]
  26. Jiang, X.; Chang, Y.; Jia, G. Application of temporary plugging and balanced fracturing technology. in the reservoir stimulation of Linxing deep coalbed. Drill. Eng. 2025, 52, 127–133. [Google Scholar]
  27. Chen, M. Numerical Simulation Study on Competitive Propagation of Multiple Fractures in Staged Multi-Cluster Fracturing of Horizontal Wells. Ph.D. Thesis, China University of Petroleum, Beijing, China, 2020. [Google Scholar]
  28. Zou, Y.; Li, Y.; Yang, C.; Zhang, S.; Ma, X.; Zou, L. Fracture propagation law of temporary plugging and diversion fracturing in shale reservoirs under completion experiments of horizontal well with multi-cluster sand jetting perforation. Pet. Explor. Dev. 2024, 51, 715–726. [Google Scholar] [CrossRef]
  29. Tang, J.; Li, J.; Zhang, Z.; Fan, Y.; Jiang, W.; Meng, S.; Zhao, X. Differential impacts of multi-scale natural fractures on hydraulic fracture network formation. Earth-Sci. Rev. 2025, 272, 105315. [Google Scholar] [CrossRef]
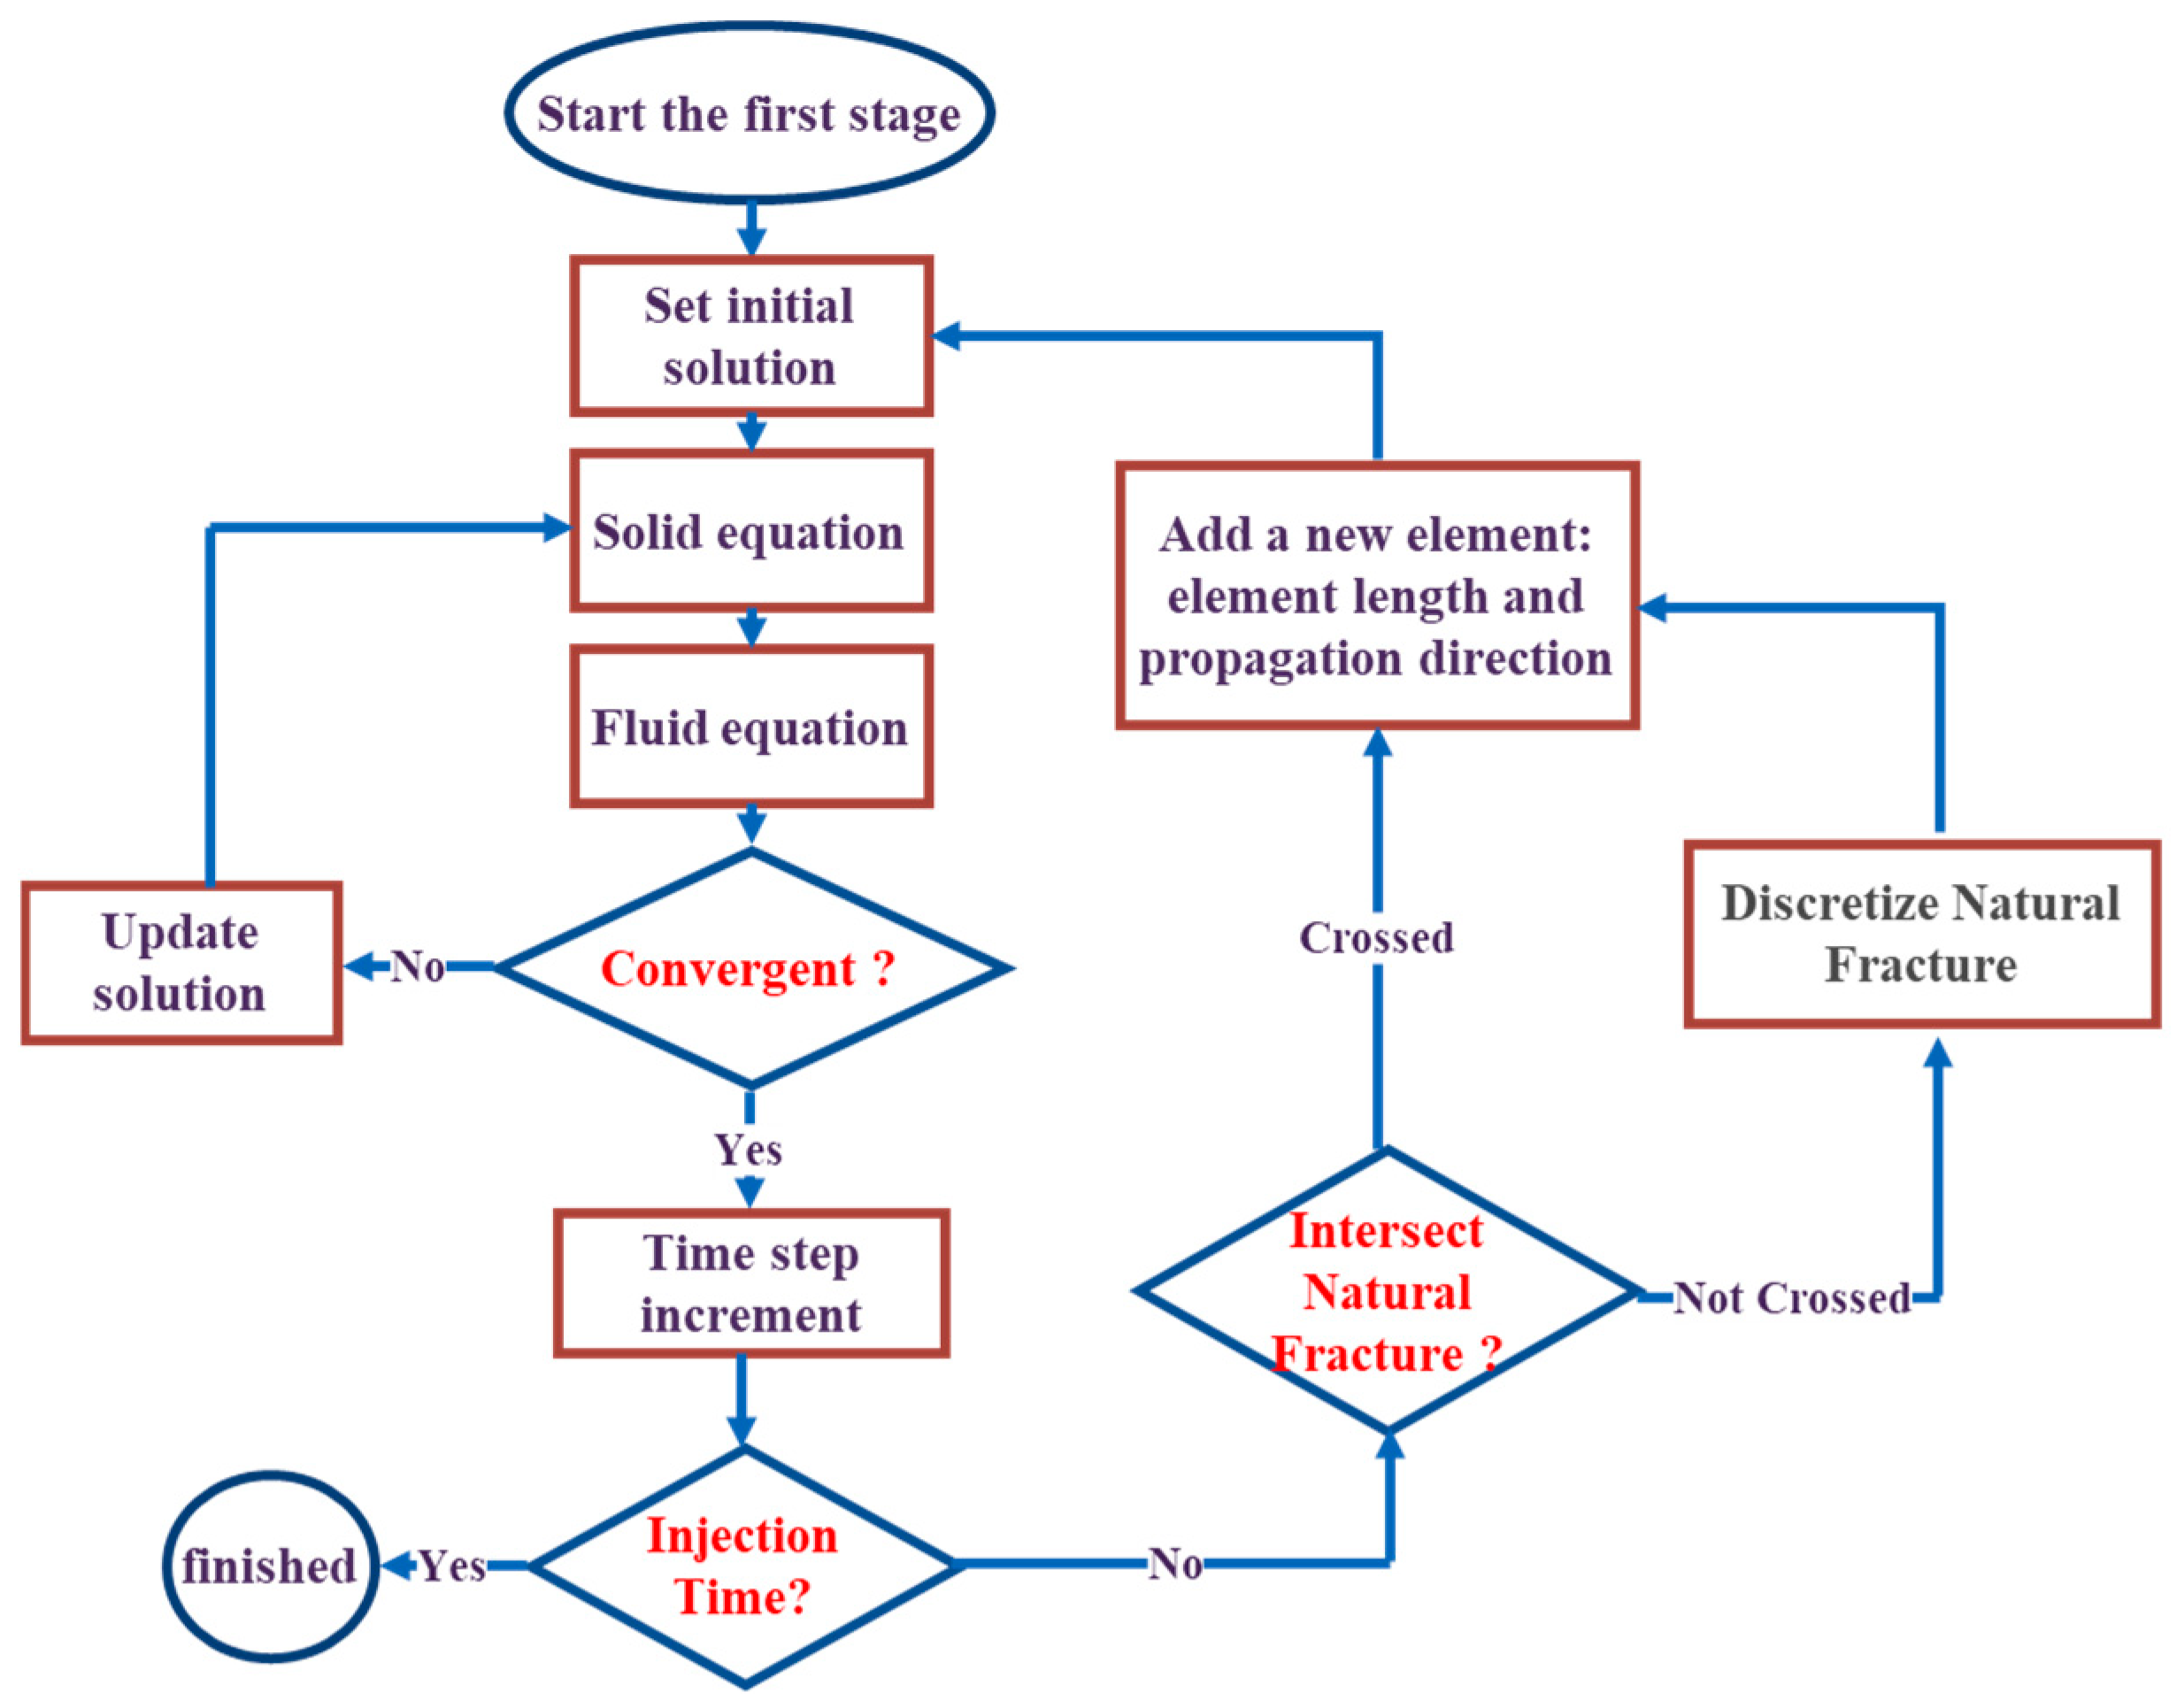
Figure 1. Flow chart of the fracture propagation.
Processes 14 00450 g001
Figure 2. Comparison of experiment and numerical simulation results.
Processes 14 00450 g002
Figure 3. Schematic diagram of fracture intersection and comparison of simulation results. (a) Schematic of fracture intersection. (b) Simulation results from this study. (c) Simulation result adapted from Xie et al.’s study [12].
Processes 14 00450 g003
Figure 4. Multi-fracture propagation model and NF network model.
Processes 14 00450 g004
Figure 5. Pumping pressure curves without and with limited-entry fracturing.
Processes 14 00450 g005
Figure 6. Comparison of flow distribution without and with limited entry.
Processes 14 00450 g006
Figure 7. Fracture propagation results without and with limited entry.
Processes 14 00450 g007
Figure 8. Perforation quantity and flow distribution before and after temporary plugging.
Processes 14 00450 g008
Figure 9. Dynamic variation curve of pumping pressure during the temporary plugging process.
Processes 14 00450 g009
Figure 10. Fracture propagation results with and without consideration of temporary plugging.
Processes 14 00450 g010
Table 1. Input parameters of the model.
CategoryParameterValue
Geological parametersReservoir height (m)40.0
Young’s modulus (GPa)32.0
Poisson’s ratio0.3
Fracture toughness (MPa·m1/2)0.72
Reservoir leak-off coefficient (m/s1/2)2.54 × 10−8
Minimum horizontal principal stress (MPa)60.0
Maximum horizontal principal stress (MPa)80.0
NF parametersAngle with the initial hydraulic fracture (°)45
Fracture length (m)1–10
Tensile strength (MPa)5.0
Interface cohesion (MPa)0
Interface friction|coefficient0.2
Engineering parametersInjection rate (m3·min−1)12.0
Injection time (s)400.0
Fracturing fluid density (kg·m−3)1000
Fracturing fluid viscosity (mPa·s)30.0
Fracture spacing (m)24.0
Disclaimer/Publisher’s Note: The statements, opinions and data contained in all publications are solely those of the individual author(s) and contributor(s) and not of MDPI and/or the editor(s). MDPI and/or the editor(s) disclaim responsibility for any injury to people or property resulting from any ideas, methods, instructions or products referred to in the content.