Article

Formation Pore-Pressure Prediction in Carbonate Rocks of the Luzhou Block, Southern Sichuan Basin, Based on Hydro-Mechanical Coupling

1
Oil and Gas Technology Research Institute, PetroChina Southwest Oil & Gasfield Company, Chengdu 610017, China
2
PetroChina Southwest Oil & Gasfield Company, Chengdu 610051, China
*
Author to whom correspondence should be addressed.
Processes 2026, 14(20), 3310; https://doi.org/10.3390/pr14203310
Submission received: 25 August 2026 / Revised: 2 October 2026 / Accepted: 12 October 2026 / Published: 14 October 2026

Abstract

Accurate formation pore-pressure prediction is essential for defining a safe drilling-fluid density window and preventing lost circulation, influx, kicks, and wellbore instability. This requirement is particularly difficult to satisfy in the Luzhou Block of the southern Sichuan Basin, where thick carbonate successions are characterized by strong vertical lithological variation, complex pore systems, and heterogeneous mechanical properties. A subset of 77 drilling complications was identified within carbonate intervals from 13 wells, and the compiled drilling-event dataset contains 193 recorded operational events, demonstrating the need for a pressure-prediction method that is more suitable for carbonate formations. Conventional empirical approaches, represented by the Eaton method, are generally effective in normally compacted clastic rocks but may become unreliable in carbonates because acoustic transit time is controlled not only by effective stress but also by lithology, diagenesis, fractures, vugs, and fluid–rock interactions. In this study, a pore-pressure prediction model is developed within a hydro-mechanical coupling framework. Under the assumptions of a homogeneous porous medium, linear-elastic small deformation, constrained horizontal strain, and undrained loading, Biot poroelasticity is used to quantify stress transfer between the rock skeleton and the pore fluid. A dimensionless hydro-mechanical response term is then introduced into the pressure-prediction equation to represent the fraction of overburden stress supported by the pore fluid. The model is assessed using Well A in the 205-well area and Well B in the 203-well area, with available offset-well pressure observations used as reference constraints. Relative to the Eaton method, the proposed approach produces smoother and geologically more consistent pressure profiles in carbonate intervals and agrees more closely with measured pressure data from offset wells. The reported correlation coefficients increase from −0.21 to 0.34 for Well A and from 0.67 to 0.89 for Well B, while the corresponding normalized standard deviations decrease from 0.3036 to 0.0816 and from 0.3445 to 0.1088, respectively, corresponding to relative reductions in normalized standard deviation of approximately 73.1% and 68.4%. These results indicate that, for the carbonate intervals evaluated in Wells A and B, explicitly accounting for fluid–solid coupling can reduce prediction variability and improve consistency with the available offset-well pressure observations. The results support the local applicability of the proposed approach in the studied 203- and 205-well areas.

1. Introduction

Formation pore pressure is a principal input to drilling-fluid design and wellbore-stability assessment. A pressure profile helps assess influx risk and interpret the relationship between wellbore pressure, losses and mechanical instability, together with the in situ stress state and rock strength. In carbonate successions, pore structure and fracture development complicate pressure interpretation. Drilling-based work in northeastern Sichuan explicitly distinguished porous and fractured carbonate formations when interpreting abnormal pressure [1]. A pressure-prediction method for such rocks therefore needs a geological basis and an evaluation appropriate to the available reference measurements.
The Luzhou Block in the southern Sichuan Basin contains extremely thick carbonate formations and has experienced frequent drilling complications. The formations encountered above the Longmaxi Formation include multiple carbonate-dominated intervals together with sandstone, mudstone, shale, and evaporite layers. Their contrasting depositional fabrics, diagenetic histories, pore geometries, and mechanical responses generate strong vertical heterogeneity in well-log curves. Statistical records from 13 wells contain 193 drilling-related complications, including stuck points, oil and gas influxes, lost-circulation events, collapse or block falling, pipe sticking, and kicks. The recorded complication depths were cross-referenced with the interpreted stratigraphic and lithological intervals, and 77 events occurring within carbonate-dominated intervals were classified as carbonate-related complications. This classification indicates the stratigraphic occurrence of the events rather than a direct causal attribution to abnormal pore pressure. Nevertheless, pore-pressure uncertainty is relevant to several of these drilling risks because it directly affects the safe drilling-fluid density window. Underestimation of formation pressure may increase the likelihood of influxes and kicks, whereas overestimation may lead to excessive drilling-fluid density and promote lost circulation in fractured or vuggy carbonate intervals. Collapse and sticking may also be affected indirectly through changes in the effective-stress state around the wellbore, together with rock strength and geological heterogeneity. Although not all downhole events are caused solely by abnormal pore pressure, pressure uncertainty is a major factor that narrows the operational window and increases the probability that drilling-fluid density will be either insufficient to balance the formation or excessive enough to induce losses.
Conventional log-based pore-pressure prediction commonly uses effective stress and departures from a normal compaction trend. Eaton’s sonic equation [2] converts the measured-to-normal acoustic relationship into an effective-stress estimate. Bowers [3] distinguishes loading and unloading velocity–effective-stress relations and accounts for mechanisms beyond undercompaction. Eberhart-Phillips et al. [4] investigated the joint effects of effective pressure, porosity and clay content on sandstone velocities; their work is a rock-physics relationship, not a carbonate-specific pressure-validation study. These approaches should not be grouped with fracture-gradient equations, which estimate a different pressure limit. Their transfer to carbonates depends on calibration and on separating pressure effects from lithological and diagenetic influences.
Carbonate acoustic properties are affected by depositional texture, cementation, dissolution, dolomitization and fractures or vugs. Similar effective stresses can therefore coexist with different acoustic responses. Compressibility-based prediction [5] and the fracture-aware effective-stress formulation of Cheng et al. [6] already address aspects of this problem. These studies motivate the use of rock and fluid properties, but they do not eliminate the need for representative inputs and pressure calibration. The remaining question is how an established effective-stress or poroelastic formulation behaves in a particular carbonate succession, and whether the evidence separates predictive skill from calibration and smoothing.
Hydro-mechanical coupling provides an established description of deformation and pore-pressure response in a saturated porous medium. Biot poroelasticity relates these responses through the drained moduli, Biot coefficient, Biot modulus and undrained properties [7]. The stress-transfer coefficient derived under specified boundary conditions is a material response to incremental loading. Using that coefficient in a field-scale absolute-pressure equation requires an additional modeling assumption, which is made explicit in Section 3.4.
Recent publications define the context for the present application. Makarian et al. [8] combined laboratory and log information to characterize fluid-dependent elastic and seismic behavior in a carbonate reservoir. Li et al. [9] compared equivalent-depth, Eaton and effective-stress predictions in the Luzhou Block using core acoustic calibration. Their study already demonstrates that a calibrated effective-stress approach can improve on a compaction-trend baseline in this setting. Consequently, higher agreement than Eaton alone is not evidence of methodological novelty.
The closest related work is Guo et al. [10], who used poroelastic coupling for carbonate and shale formations in Luzhou, introduced regional pressure-zone coefficients and combined the approach with Eaton according to lithology. The present study shares the poroelastic foundation and does not claim that coupling or its application to Luzhou is new. Its narrower focus is the contrasting continuous profiles of Wells A and B in the 205- and 203-well areas, especially the response of the Maokou and Qixia intervals, and the limits of the existing offset-pressure comparison. The distinction is the scope of the local assessment, not a new constitutive law or a demonstrated independent regional dataset.
Rivera et al. [11] also compared and calibrated acoustic pressure methods for calcareous formations using well logs and seismic information. Taken together, these studies show that input selection, lithological treatment, calibration and reference data are essential to interpreting an accuracy claim. The literature comparison here is qualitative; no common-dataset benchmark against these recent methods is available.
The main research question of this study is whether a hydro-mechanical coupling formulation based on poroelastic stress transfer can provide more stable and geologically consistent pore-pressure estimates than the conventional Eaton method in heterogeneous carbonate formations of the Luzhou Block. We hypothesize that explicitly accounting for solid–fluid stress coupling can reduce the sensitivity of pore-pressure prediction to lithology-related sonic anomalies while maintaining consistency with regional pressure observations. To test this hypothesis, the hydro-mechanical coupling model and the Eaton method are applied to Well A in the 205-well area and Well B in the 203-well area, and their predictions are quantitatively compared against available offset-well pressure observations at stratigraphically equivalent depths to assess model consistency using the correlation coefficient, normalized standard deviation, and normalized centered RMSE. Pressure-profile continuity and geological consistency are also considered as complementary indicators. The purpose of this comparison is to assess the applicability and limitations of the coupling approach in the studied well areas rather than to claim universal superiority over existing pressure-prediction methods.

2. Geological Setting and Drilling Challenges

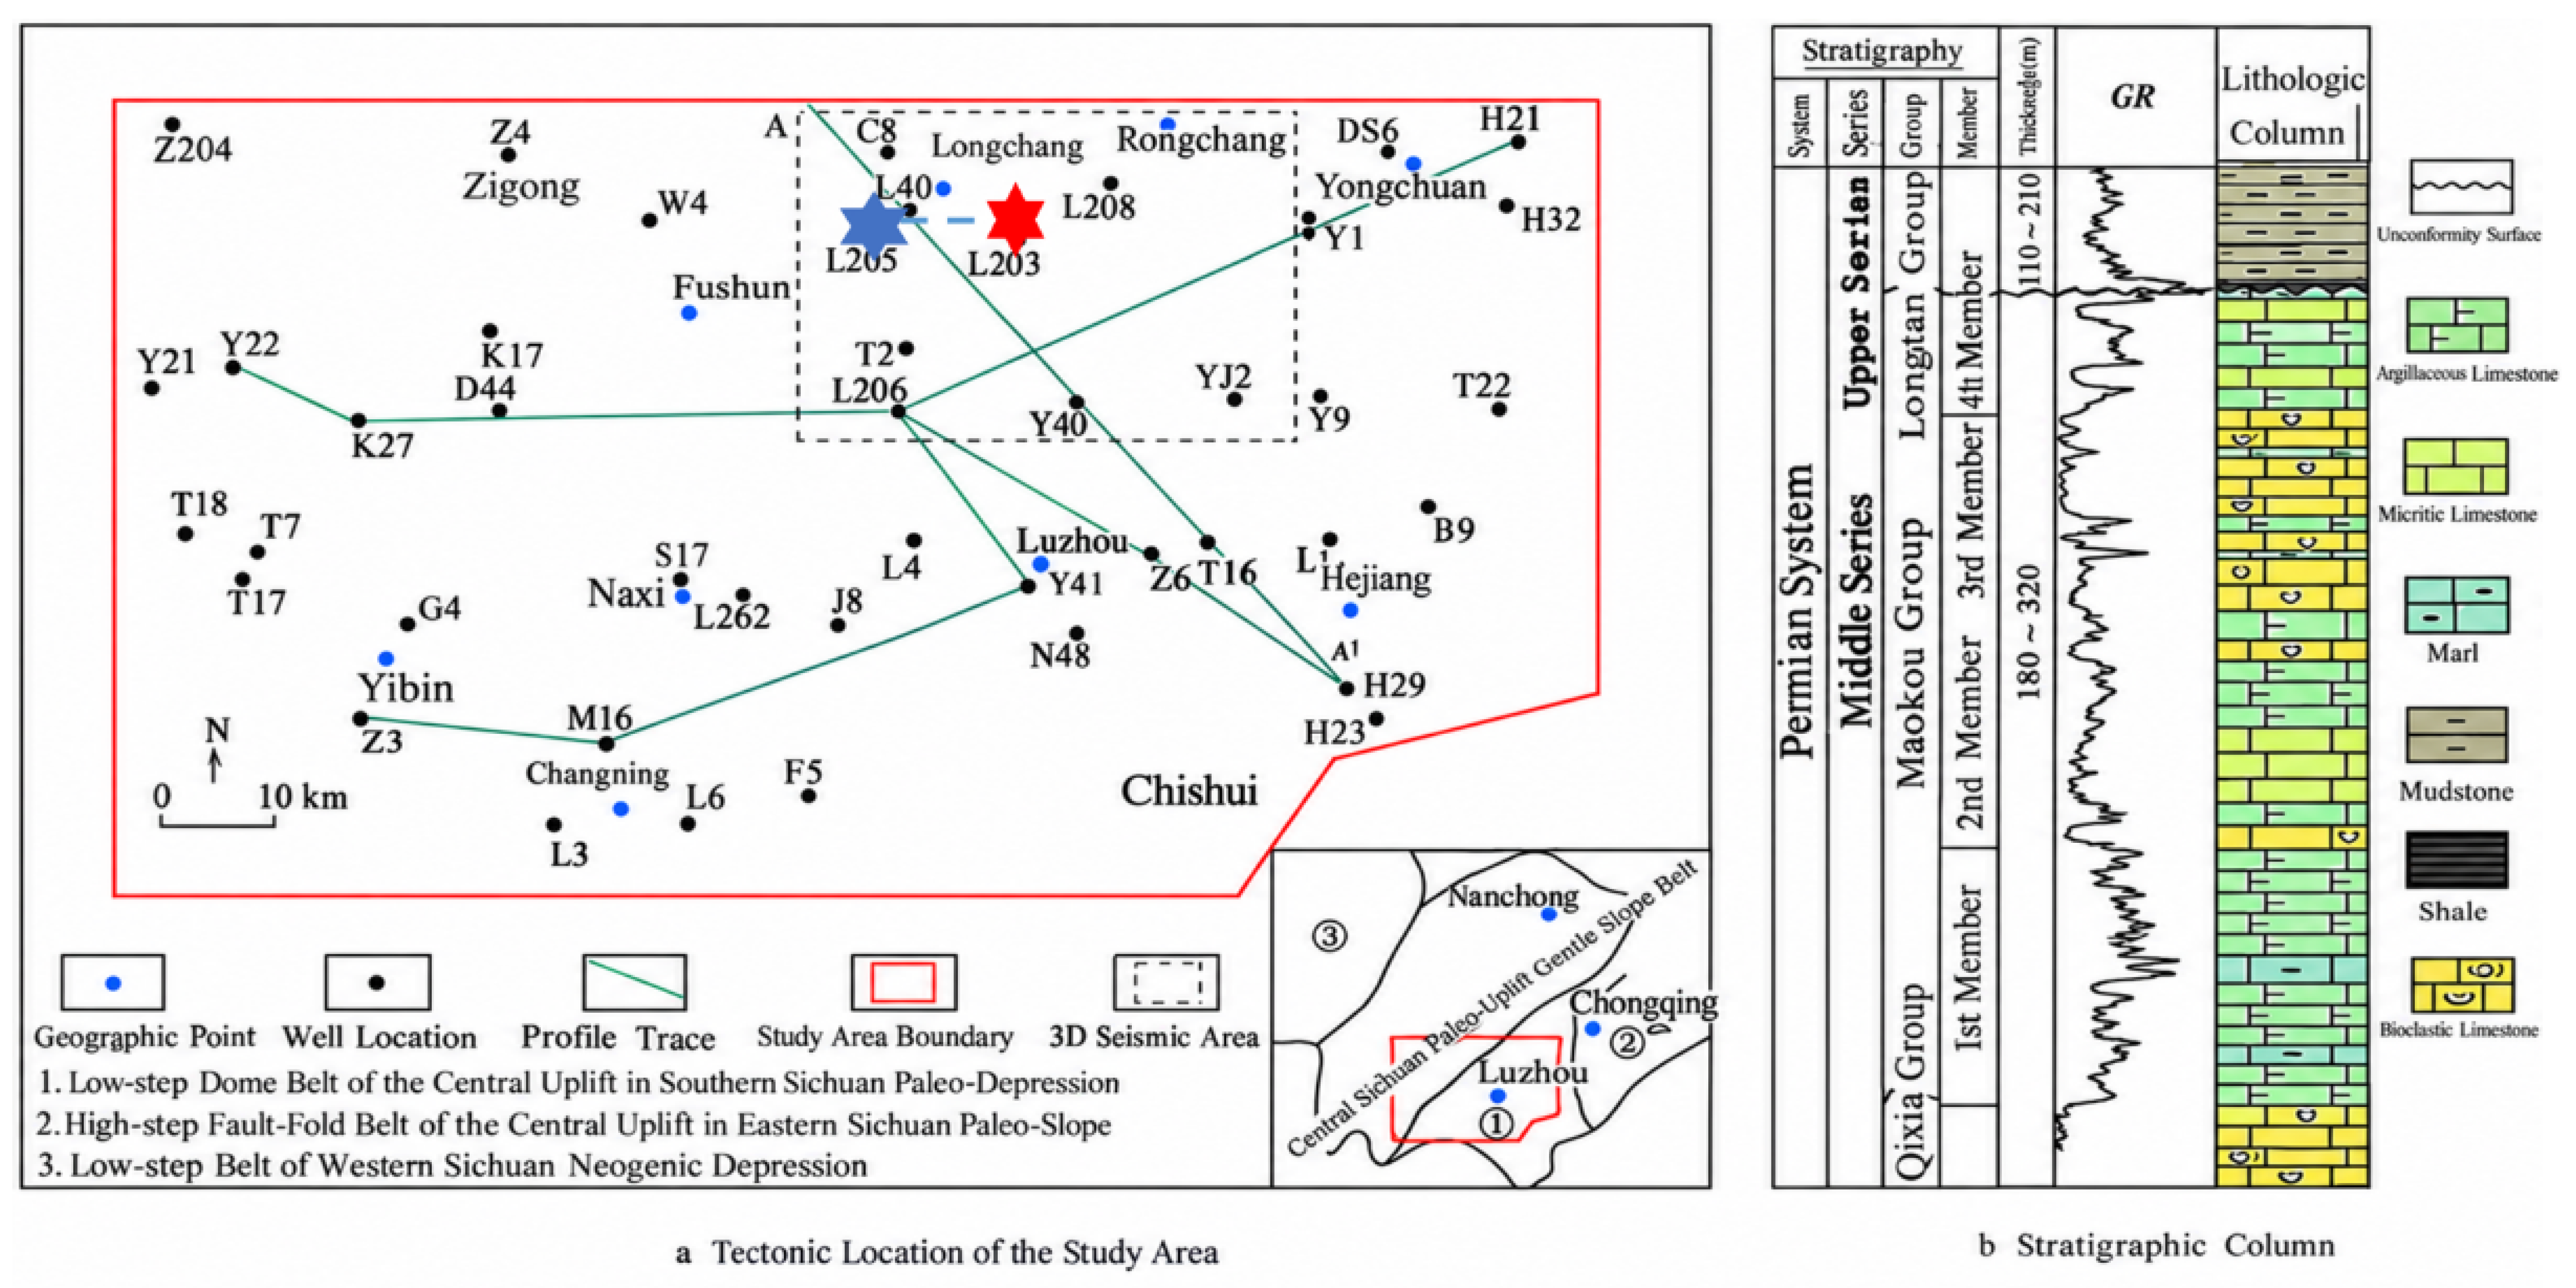
The Luzhou Block lies in the southern Sichuan Basin and contains a structurally and lithologically heterogeneous succession [9,10]. The Middle Permian carbonate section has been affected by karst development and stratigraphic erosion, which complicate lateral correlation [12]. Figure 1 shows the tectonic setting and a representative Middle Permian stratigraphic column [12]. The section discussed in the well-log and pressure figures extends from the Jialingjiang Formation to the Qixia Formation; it does not document pressure behavior in the deeper Hanjiadian Formation.
Among the carbonate-dominated intervals encountered during drilling, the Jialingjiang, Maokou, and Qixia formations exhibit representative lithological characteristics. The Jialingjiang Formation consists mainly of dolostone, limestone, and gypsum, resulting in marked lithological heterogeneity and associated variations in elastic properties and well-log responses over relatively short depth intervals. The upper Maokou Formation is dominated by dark-gray to brownish-gray bioclastic limestone, whereas the lower part mainly comprises argillaceous bioclastic limestone with locally developed chert. The upper Qixia Formation is composed mainly of light-gray fine-crystalline to micritic limestone, whereas the lower part is characterized by dark-gray limestone containing chert nodules. Above the Longmaxi Formation, these carbonate units are interbedded with clastic and evaporitic strata, creating a vertically heterogeneous mechanical and hydraulic system.
The drilling records demonstrate the engineering consequence of this complexity. Across 13 wells, 53 stuck points, 62 oil and gas influxes, 47 lost-circulation events, 20 collapse or block-falling events, six pipe-sticking events, and five kicks were recorded, giving a total of 193 complications. These events involve different primary mechanisms and should not all be attributed directly to abnormal formation pressure. Oil and gas influxes and kicks are most directly associated with insufficient wellbore pressure relative to formation pressure [13]. In contrast, lost-circulation events in carbonate formations are primarily associated with natural or drilling-induced fractures, vugs, cavities, and other highly conductive loss zones; excessive wellbore pressure may additionally initiate or extend fractures and thereby promote fluid losses [14,15]. Collapse and block-falling events are mainly associated with mechanical wellbore instability, in which changes in pore pressure and the surrounding effective-stress state can contribute to compressive or shear failure around the borehole [16]. Stuck points and pipe-sticking events may result from multiple mechanisms, including wellbore instability, differential sticking, inadequate hole cleaning, and cuttings accumulation [17]. Formation-pressure uncertainty can nevertheless influence several of these events by changing the effective-stress condition and the available drilling-fluid density window.
Two wells were selected for model evaluation: Well A in the 205-well area and Well B in the 203-well area. The selection was based on three considerations: first, both wells provide continuous well-log and lithological information across the principal stratigraphic intervals investigated in this study, including the Jialingjiang, Feixianguan, Changxing, Longtan, Maokou, and Qixia formations; second, stratigraphically equivalent offset-well pressure observations are available for quantitative comparison; third, the two wells exhibit contrasting lithological and log-response characteristics, allowing the model to be evaluated under different geological and petrophysical conditions. The two wells are therefore considered representative of the contrasting local conditions encountered in the 203- and 205-well areas, rather than statistically representative of the entire Luzhou Block. Their use is intended to assess the applicability of the proposed method across different local stratigraphic and log-response patterns within the study area. Offset-well pressure measurements at equivalent depths were used as the reference for assessing prediction performance. In this study, the offset-well pressure data were selected based on stratigraphic equivalence and regional geological consistency rather than direct substitution of the target-well pressure profile. The depth correlation between wells was performed according to the interpreted stratigraphic framework, including the Jialingjiang, Feixianguan, Changxing, Longtan, Maokou, and Qixia formations identified from well logs and lithological information. Previous studies in the Luzhou Block have demonstrated that these carbonate intervals are regionally distributed and can be correlated between different well areas based on stratigraphic markers and lithological characteristics. The offset-well pressure measurements used in this study were obtained from available formation-pressure evaluation data [11]. The use of wells from two areas allows the model to be evaluated under different combinations of lithology and log response rather than being tested only within a single local stratigraphic profile.
According to the relevant geological reports, Wells A and B are approximately 16.9 km apart in plan view. The pressure data for both wells were obtained from historical formation-pressure records, including pressure values obtained or derived through several field procedures, such as shut-in pressure extrapolation during intermediate formation tests, conversion from fluid-level observations, and pressure evaluation after volumetric stimulation.
The pressure observations used in this study were obtained from formation-pressure evaluation records under field drilling conditions. Before being used for model comparison, the pressure data were screened according to three criteria: (1) reliable pressure acquisition procedures with documented test conditions; (2) clear stratigraphic correlation between the offset wells and the target wells; and (3) exclusion of abnormal pressure points affected by obvious operational disturbances. The retained pressure observations were converted into equivalent mud density (g/cm3) for consistent comparison with the predicted pressure profiles.
The comparison at equivalent depths was based on stratigraphic correlation rather than identical numerical well depths. Formation boundaries, lithological and well-log characteristics, regional marker beds, and available seismic structural information were jointly used to identify equivalent stratigraphic intervals. In particular, the blue-gray mudstone at the base of the Jia 2-2 submember can serve as a regional marker bed, while the black shale of the Liangshan Formation provides an auxiliary marker for correlation.

3. Hydro-Mechanical Coupling Model

3.1. Conceptual Basis

The proposed model is based on the coupled deformation of a saturated porous rock and the pressure response of the pore fluid. During burial and sedimentation, the vertical overburden stress increases. If the formation is well drained, much of the load is progressively transferred to the solid skeleton as fluid escapes and the pore volume decreases. If drainage is restricted, the fluid content cannot adjust rapidly enough, and a larger fraction of the applied load is supported by the pore fluid. The resulting pressure increase reduces the effective stress carried by the skeleton. This stress-partitioning mechanism is the physical foundation for abnormal pore pressure and is represented explicitly in poroelastic constitutive equations.
For the analytical derivation, the formation is treated as a homogeneous, continuous, saturated porous medium that undergoes linear-elastic small deformation. Horizontal deformation is assumed to be constrained during one-dimensional burial compaction, so the dominant deformation and stress increments are vertical. These assumptions do not reproduce every fracture, vug, or lithological interface in a carbonate reservoir, but they provide a tractable continuum description of the average stress transfer between the solid skeleton and the pore fluid. The resulting model is intended as a field-scale pressure-prediction tool rather than a fully resolved numerical simulation of discrete heterogeneity.

3.2. Poroelastic Constitutive Relationships

Under constrained deformation, the incremental vertical total stress is related to the vertical strain and the pore-pressure increment by Equation (1):
d σ z = K + 4 G 3 d ε z + αdp
where G is the drained shear modulus, K is the drained bulk modulus of the porous rock skeleton, α is the Biot effective-stress coefficient, p is pore pressure, σz is vertical total stress, and εz is vertical strain. Stress and pressure variables σz and p are expressed in MPa, whereas elastic parameters K, G, Ku, and M are expressed in GPa. During numerical evaluation, all stress-related quantities are converted into a consistent unit system to maintain dimensional consistency. Strain, porosity, and Biot-related coefficients are dimensionless. The first term on the right-hand side represents the load carried by deformation of the drained skeleton, whereas the second term represents the contribution of pore pressure to the total-stress increment.
The pressure response can also be written in terms of deformation and the increment of fluid content, ζ, as follows:
dp = M(αdεz + dζ)
where M is the Biot modulus. The fluid-content variable ζ represents the change in fluid volume per unit bulk volume relative to the reference state. Equation (2) shows that pore pressure increases when deformation reduces the available pore volume or when the fluid content changes under constrained conditions. Combining Equations (1) and (2) gives the vertical strain increment in terms of the total-stress increment and the fluid-content increment:
d ε z = B 1 + v u 3 1 − v u 1 B K u d σ z − dζ
where Ku is the undrained bulk modulus and νu is the saturated undrained Poisson’s ratio. The undrained bulk modulus is related to the drained moduli and the Biot parameters by:
K u = K + α 2 M = 2 G 1 + v u 3 1 − 2 v u = αM B
and the Skempton coefficient B is expressed as [7]
B = α K f α − ϕ 1 − α K f + K ϕ
where ϕ is porosity and Kf is the bulk modulus of the formation fluid. The Skempton coefficient quantifies the magnitude of the pore-pressure response to an applied isotropic stress increment under undrained conditions. A larger B generally indicates that a greater fraction of the external load is transferred to the pore fluid, whereas a smaller value implies that the rock skeleton carries a larger share of the load. The equations also show that the pore-pressure response depends jointly on rock compressibility, fluid compressibility, porosity, and the Biot coefficient. Acoustic transit time remains sensitive to effective stress, but in carbonate rocks it is also influenced by mineral composition, pore type and geometry, cementation and dissolution, dolomitization, and fractures or vugs. Therefore, acoustic transit time alone may not uniquely constrain the pore-pressure response in heterogeneous carbonate intervals, particularly where lithological and diagenetic effects are significant [18,19,20].

3.3. Undrained Simplification

The undrained condition adopted here should be interpreted as an interval-scale end-member approximation. In a poroelastic medium, whether the response approaches drained or undrained behavior depends on the competition between the characteristic timescale of stress loading or pressure generation and that of hydraulic diffusion. The latter is controlled by permeability, fluid mobility and compressibility, rock-frame compressibility, storage capacity, and drainage length [21,22]. When loading occurs more rapidly than pore-fluid pressure can dissipate, as may occur in relatively low-permeability or hydraulically isolated intervals, the response approaches the undrained limit, and the change in fluid content can be approximated as dζ = 0. Restricted fluid escape during sufficiently rapid burial or other stress-loading processes is also a recognized mechanism for retaining excess pore pressure in sedimentary basins [22]. Conversely, higher permeability, connected fractures or vugs, greater fluid mobility, or sufficiently long drainage times allow excess pore pressure to dissipate, and the formation response becomes partially drained or drained. Therefore, the present dζ = 0 assumption is used to derive the limiting poroelastic pressure response under restricted drainage conditions. Under this idealization, the pore fluid is locally retained within the representative porous volume, and substitution of dζ = 0 into Equation (3) yields the vertical strain increment under constrained undrained loading:
d ε z = 1 + v u 1 − v u d σ z 3 K u
Substitution of this strain relation into Equation (2) gives the pore-pressure increment generated by the applied vertical stress increment:
dp = αMd ε z = B 1 + v u 3 1 − v u d σ z
The dimensionless factor B(1 + νu)/[3(1 − νu)] describes the efficiency of stress transfer from the solid skeleton to the pore fluid under the assumed boundary conditions. In the following formulation, this factor is denoted βHM. Its value integrates the effects of fluid compressibility and rock deformation and therefore provides a physically interpretable alternative to a purely empirical log-response ratio. The derivation also clarifies that the pressure increment will vary with lithology because the elastic properties, porosity, and Biot parameters of limestone, dolostone, mudstone, sandstone, and evaporite are different.
More specifically, lithological variability enters the formulation through the parameters Φ, K, G, α, B, and vu, rather than through an empirical lithology label. For each lithological interval, the corresponding elastic and poroelastic parameters are assigned according to the lithological interpretation and representative rock-property data. These parameters determine the undrained response and the hydro-mechanical stress-transfer coefficient βHM = B(1 + νu)/[3(1 − νu)]. Consequently, a change in lithology modifies the fraction of the applied stress increment transferred to the pore fluid and therefore produces a quantitatively different pore-pressure response. Stiffer and less compressible rock frames generally retain a larger fraction of the load in the solid skeleton, whereas more compliant and porous lithologies can produce a stronger pore-fluid pressure response under restricted drainage conditions. Thus, the lithological effect is propagated explicitly through the poroelastic parameters into βHM and subsequently into the predicted pore pressure.

3.4. Practical Pore-Pressure Equation

For comparison, the conventional Eaton sonic method can be written as
p = σ v − σ v − p 0 Δ t N Δ t p N
where σv is the overburden stress, p0 is the normal hydrostatic pore pressure, ΔtN is the sonic transit time on the normal compaction trend, Δtp is the measured sonic transit time at the same depth, and N is the Eaton exponent. In this study, the normal compaction trend was established from the relatively normally compacted intervals identified from available sonic-log responses and geological interpretation. Because carbonate formations contain strong lithological and diagenetic heterogeneity, the selected trend represents an empirical reference rather than a universal compaction relationship. The Eaton exponent was retained at the conventional value of 3 following the original formulation and common engineering practice, so that the Eaton method could serve as a consistent baseline for comparison rather than being regionally re-optimized for the present dataset. The Eaton equation converts the deviation of the measured acoustic response from the normal trend into the fraction of effective stress retained by the rock skeleton. Its performance therefore depends on the existence of a reliable normal compaction trend and on the assumption that the acoustic anomaly is primarily pressure controlled. In Equation (9), σv, p0, and p have the same pressure unit (MPa), ensuring that the calculated pore-pressure value remains dimensionally consistent.
To account for hydro-mechanical coupling in carbonate formations, the sonic-trend ratio is replaced by the poroelastic response term, yielding
p = σ v − σ v − p 0 β HM n HM
Equation (9) is not a direct rearrangement of the linear Biot constitutive equation. Instead, it introduces a nonlinear field-scale extension of the incremental poroelastic response, where nHM accounts for deviations caused by lithological heterogeneity, incomplete drainage, and scale-dependent stress transfer.
Where βHM = B(1 + νu)/[3(1 − νu)] and nHM is a dimensionless coupling exponent used to represent the nonlinear amplification or attenuation of the hydro-mechanical response at the field scale. The term (βHM)nHM is dimensionless and represents the retained stress fraction in the proposed pressure formulation. In Equation (9), βHM is treated as a stress-retention factor derived from Biot poroelastic theory. For physically reasonable conditions where 0 < βHM < 1, decreasing βHM reduces the proportion of overburden stress retained by the rock skeleton, resulting in a larger fraction of stress being transferred to pore-fluid support. Consequently, the predicted pore pressure increases as βHM decreases. This mathematical behavior is consistent with the physical interpretation of enhanced solid-fluid stress transfer. The exponent nHM is calibrated using available log response, lithological interpretation, and offset-well pressure data under physically constrained conditions to avoid excessive empirical fitting.

3.5. Field Implementation Workflow

The practical implementation consists of five sequential steps. First, the lithological column and well-log curves are quality controlled and depth matched, and the carbonate and non-carbonate intervals are identified. Second, the vertical overburden stress σv and the hydrostatic reference pressure p0 are established along the well trajectory. For the well-level inversion of nHM, an average overburden equivalent density of 2.45 g/cm3 was adopted as an engineering approximation because the available geological and drilling design documents provide pressure constraints but do not tabulate a complete continuous bulk-density profile. Third, the poroelastic parameters required to evaluate Ku, B, and βHM are assigned or calibrated for the relevant lithologies. The sources and determination methods of the key poroelastic parameters used in the model are summarized in Table 1. In this study, these parameters were determined from published experimental measurements and established poroelastic relationships rather than directly optimized against offset-well pressure data. Fourth, the coupling exponent nHM is constrained using representative offset-well pressure measurements. The calibration was performed using the available formation-pressure observations located within stratigraphically equivalent carbonate intervals. The selected pressure points were matched according to formation boundaries, lithological markers, and well-log characteristics. During calibration, nHM was adjusted within a physically reasonable range to reproduce the regional pressure trend rather than individual pressure fluctuations. Because the available pressure dataset is limited, the same observations are currently used for parameter calibration and subsequent model performance assessment. Therefore, the present evaluation should not be interpreted as independent validation or independent predictive accuracy. Instead, the results represent an assessment of model consistency under the available geological and pressure constraints. Future work will establish separate calibration and validation datasets using additional wells and independent pressure measurements.
For the present application, the representative poroelastic parameters were assigned using the midpoint values of the physically reasonable ranges listed in Table 1. In particular, B = 0.70 and vu = 0.325, giving βHM = B(1 + νu)/[3(1 − νu)]. The well-area coupling exponent was then constrained from the pressure information reported in the geological and drilling designs. Thickness-weighted pressure coefficients were calculated for the principal carbonate intervals, yielding approximately 1.097 for Well A in the 205-well area and 1.129 for Well B in the 203-well area. Using the corresponding hydrostatic reference and overburden-stress profile, the resulting effective coupling exponents were nHM = 0.09 for Well A and nHM = 0.12 for Well B. These values are therefore well-area calibration parameters rather than universal constants. The calibrated nHM values are specific to the available pressure constraints and should be further tested using independent datasets before broader application.
In practice, nHM should be limited to a physically reasonable range rather than freely optimized, because it represents the nonlinear amplification or attenuation of the hydro-mechanical response at the field scale rather than an independent fitting parameter. A reasonable range can be determined based on the expected variation in lithological heterogeneity, uncertainty in poroelastic parameters, and the consistency between predicted and measured pressure trends. To avoid over-calibration, nHM should be calibrated using limited representative pressure points and evaluated together with geological constraints, pressure-profile continuity, and independent statistical indicators rather than minimizing the deviation from offset-well measurements alone. Finally, Equation (9) is evaluated continuously with depth, and the resulting pressure profile is compared with measured pressure points and with the Eaton prediction.
In this study, the fundamental poroelastic parameters, α, B, M, Kf, K and G, were not treated as free fitting parameters. The representative parameter ranges also demonstrate how lithological differences are transmitted quantitatively into the pressure calculation. Limestone and dolostone generally exhibit higher frame stiffness and lower to moderate porosity, whereas sandstone and mudstone/shale may exhibit different combinations of frame compressibility, porosity, and Biot–Skempton response. In the present formulation, these differences modify B and vu, and hence βHM, before the pressure equation is evaluated. The listed ranges should therefore be regarded as physically reasonable literature bounds for parameter assignment rather than universal constants for individual lithologies, because porosity, diagenesis, effective stress, fracture development, and fluid properties can cause substantial within-lithology variability. They were determined from published experimental measurements and established poroelastic relationships for saturated carbonate rocks. Only the dimensionless coupling exponent nHM was calibrated using representative offset-well pressure data, with geological constraints applied to avoid over-calibration.
This workflow preserves the engineering simplicity of a one-dimensional pressure profile while introducing a physically meaningful stress-transfer term. It also allows lithological information to enter through the elastic and poroelastic parameters instead of forcing all intervals to follow a single acoustic compaction relationship. Because the current study focuses on model comparison using two wells, the implementation is deliberately parsimonious. For regional application, parameter calibration should be repeated for additional well areas and stratigraphic units, and the uncertainty of each input parameter should be propagated into a prediction envelope rather than reporting only a single deterministic curve.

3.6. Assumptions and Applicability

The proposed formulation should be interpreted in light of its assumptions. The continuum model does not explicitly resolve discrete fractures, karst cavities, or abrupt permeability barriers. The undrained approximation should also be interpreted in a timescale-dependent sense. It is most appropriate for relatively low-permeability or hydraulically compartmentalized intervals in which the loading or pressure-generation timescale is shorter than the characteristic drainage timescale. In contrast, highly permeable intervals, well-connected fracture or vug networks, high fluid mobility, or slow loading relative to hydraulic diffusion may permit substantial pressure dissipation. For such conditions, a partially drained transient poroelastic formulation would be more appropriate. Therefore, the present model represents the restricted-drainage end member of the hydro-mechanical response. The model also assumes linear elasticity and small strain; irreversible compaction, pressure-dependent fracture closure, and inelastic damage are not included. In addition, the field-scale exponent nHM requires calibration, which means that the model is not completely parameter free. These limitations do not negate the value of the approach, but they define the conditions under which the predicted pressure should be treated as an interval-scale estimate.
Despite these simplifications, hydro-mechanical coupling is particularly relevant to the Luzhou carbonate succession because it separates the mechanism of stress transfer from the non-unique acoustic response of carbonate rocks. The model is expected to be most useful where conventional compaction trends are unstable, where lithology changes rapidly, and where offset pressure data are sufficient to constrain the effective coupling response. It may be used together with, rather than as a universal replacement for, conventional methods: agreement among independent methods increases confidence, whereas divergence can identify intervals requiring additional geological or geomechanical interpretation.

4. Model Application, Results, and Discussion

4.1. Well-Log and Lithological Characteristics

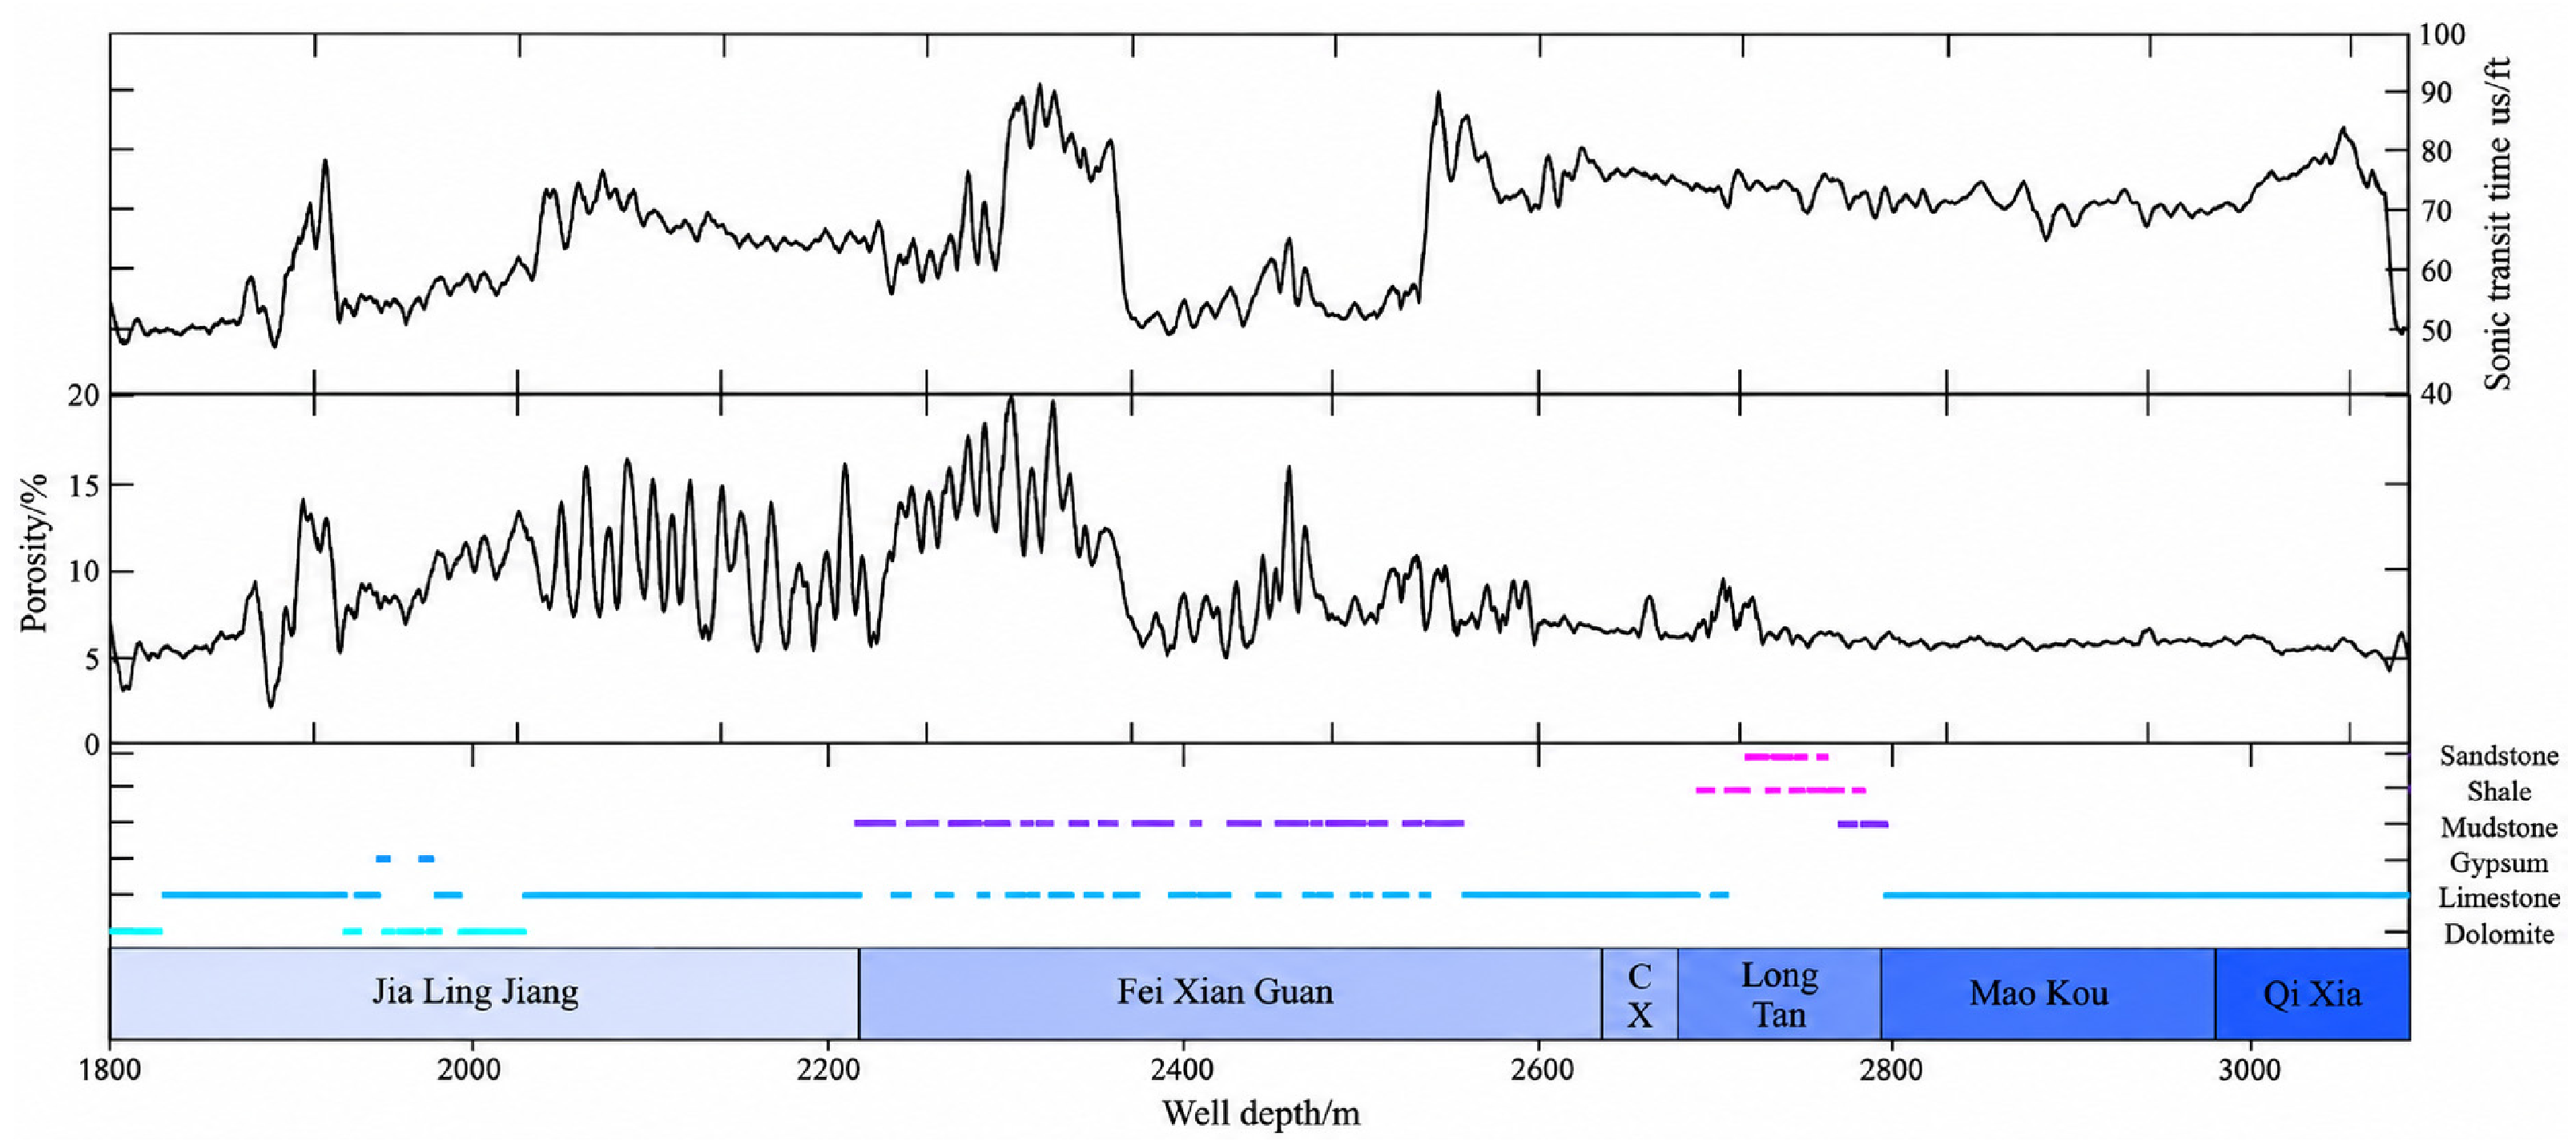
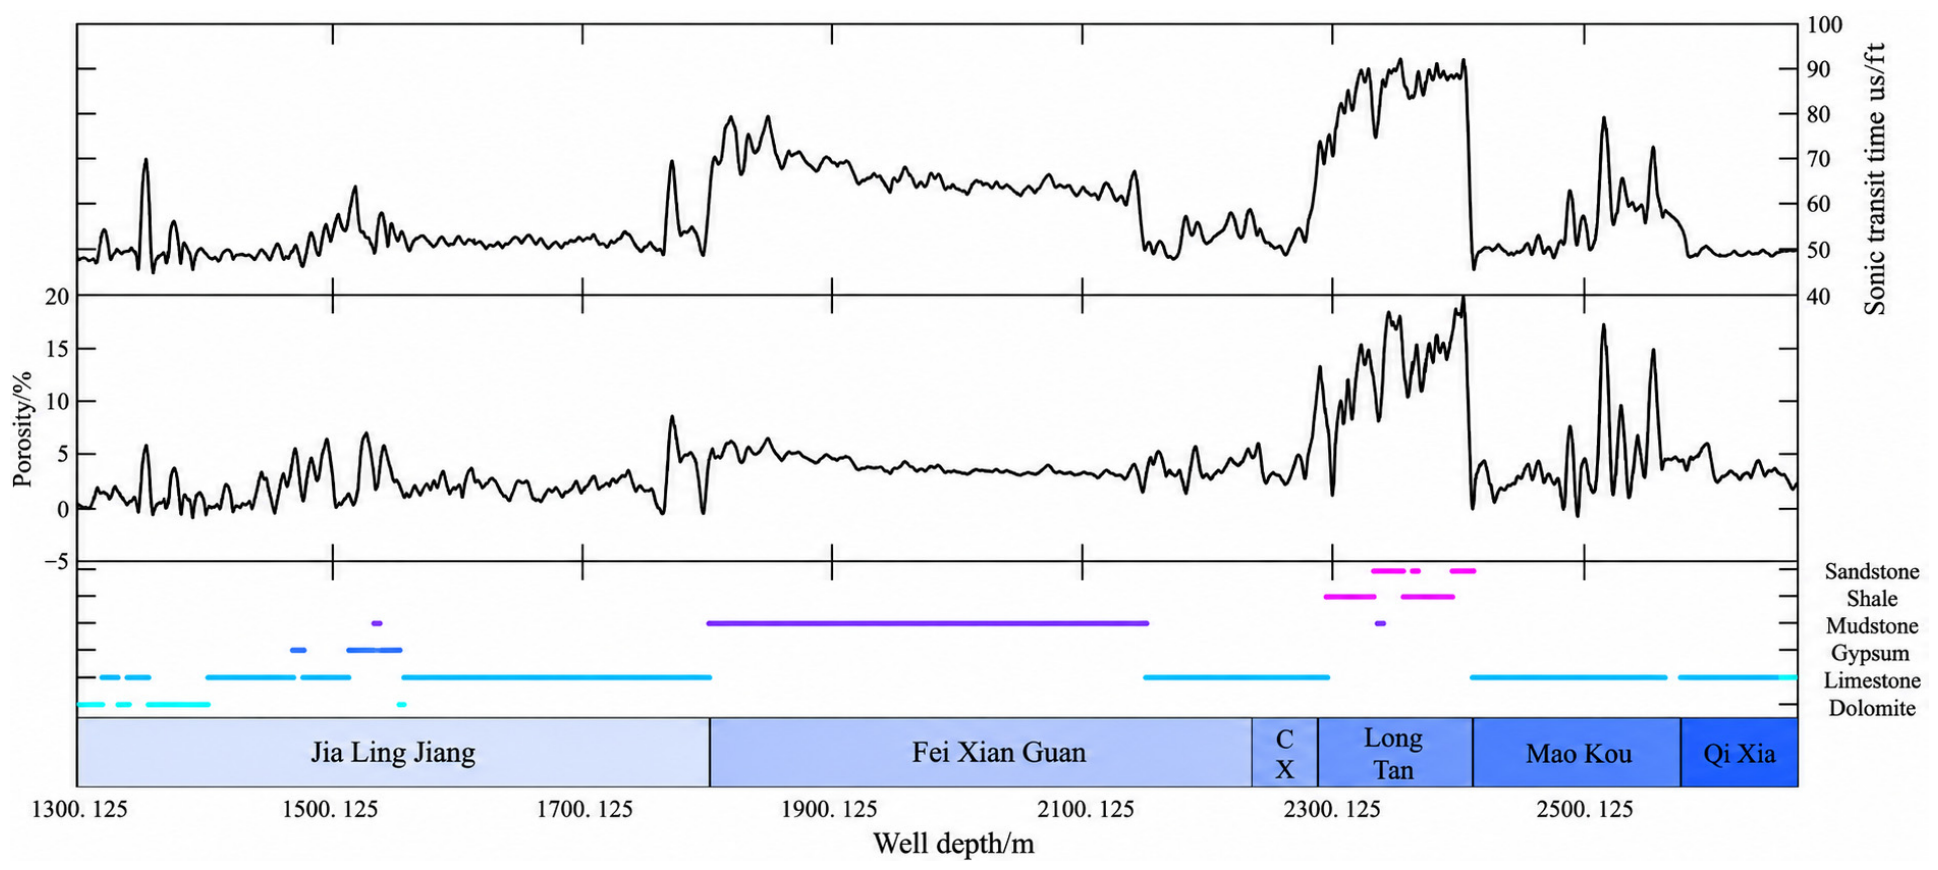
Figure 2 and Figure 3 show the selected sonic transit-time, porosity, and lithological interpretation curves for Wells A and B. Both wells penetrate a vertically heterogeneous succession in which carbonate units are interbedded with sandstone, shale, mudstone, and gypsum. The sonic curves display pronounced fluctuations rather than a smooth monotonic compaction trend. The porosity curves also vary strongly, especially near formation boundaries and within intervals containing mixed lithology. These features indicate that a single normal compaction trend cannot represent the entire drilled section and that changes in transit time may reflect lithological and diagenetic effects in addition to pressure.
Well A in the 205-well area shows substantial sonic and porosity variation through the Jialingjiang and Feixianguan formations, followed by additional discontinuities around the Changxing–Longtan transition and the Maokou and Qixia carbonate intervals. Well B in the 203-well area exhibits a different response pattern: the lower part of the Jialingjiang Formation is comparatively stable, the Feixianguan interval contains broad variations in transit time, and the Maokou–Qixia section is characterized by abrupt local changes. The contrasting profiles provide a useful test of whether the coupling model can maintain stable pressure predictions under different log patterns.

4.2. Pore-Pressure Profile of Well A

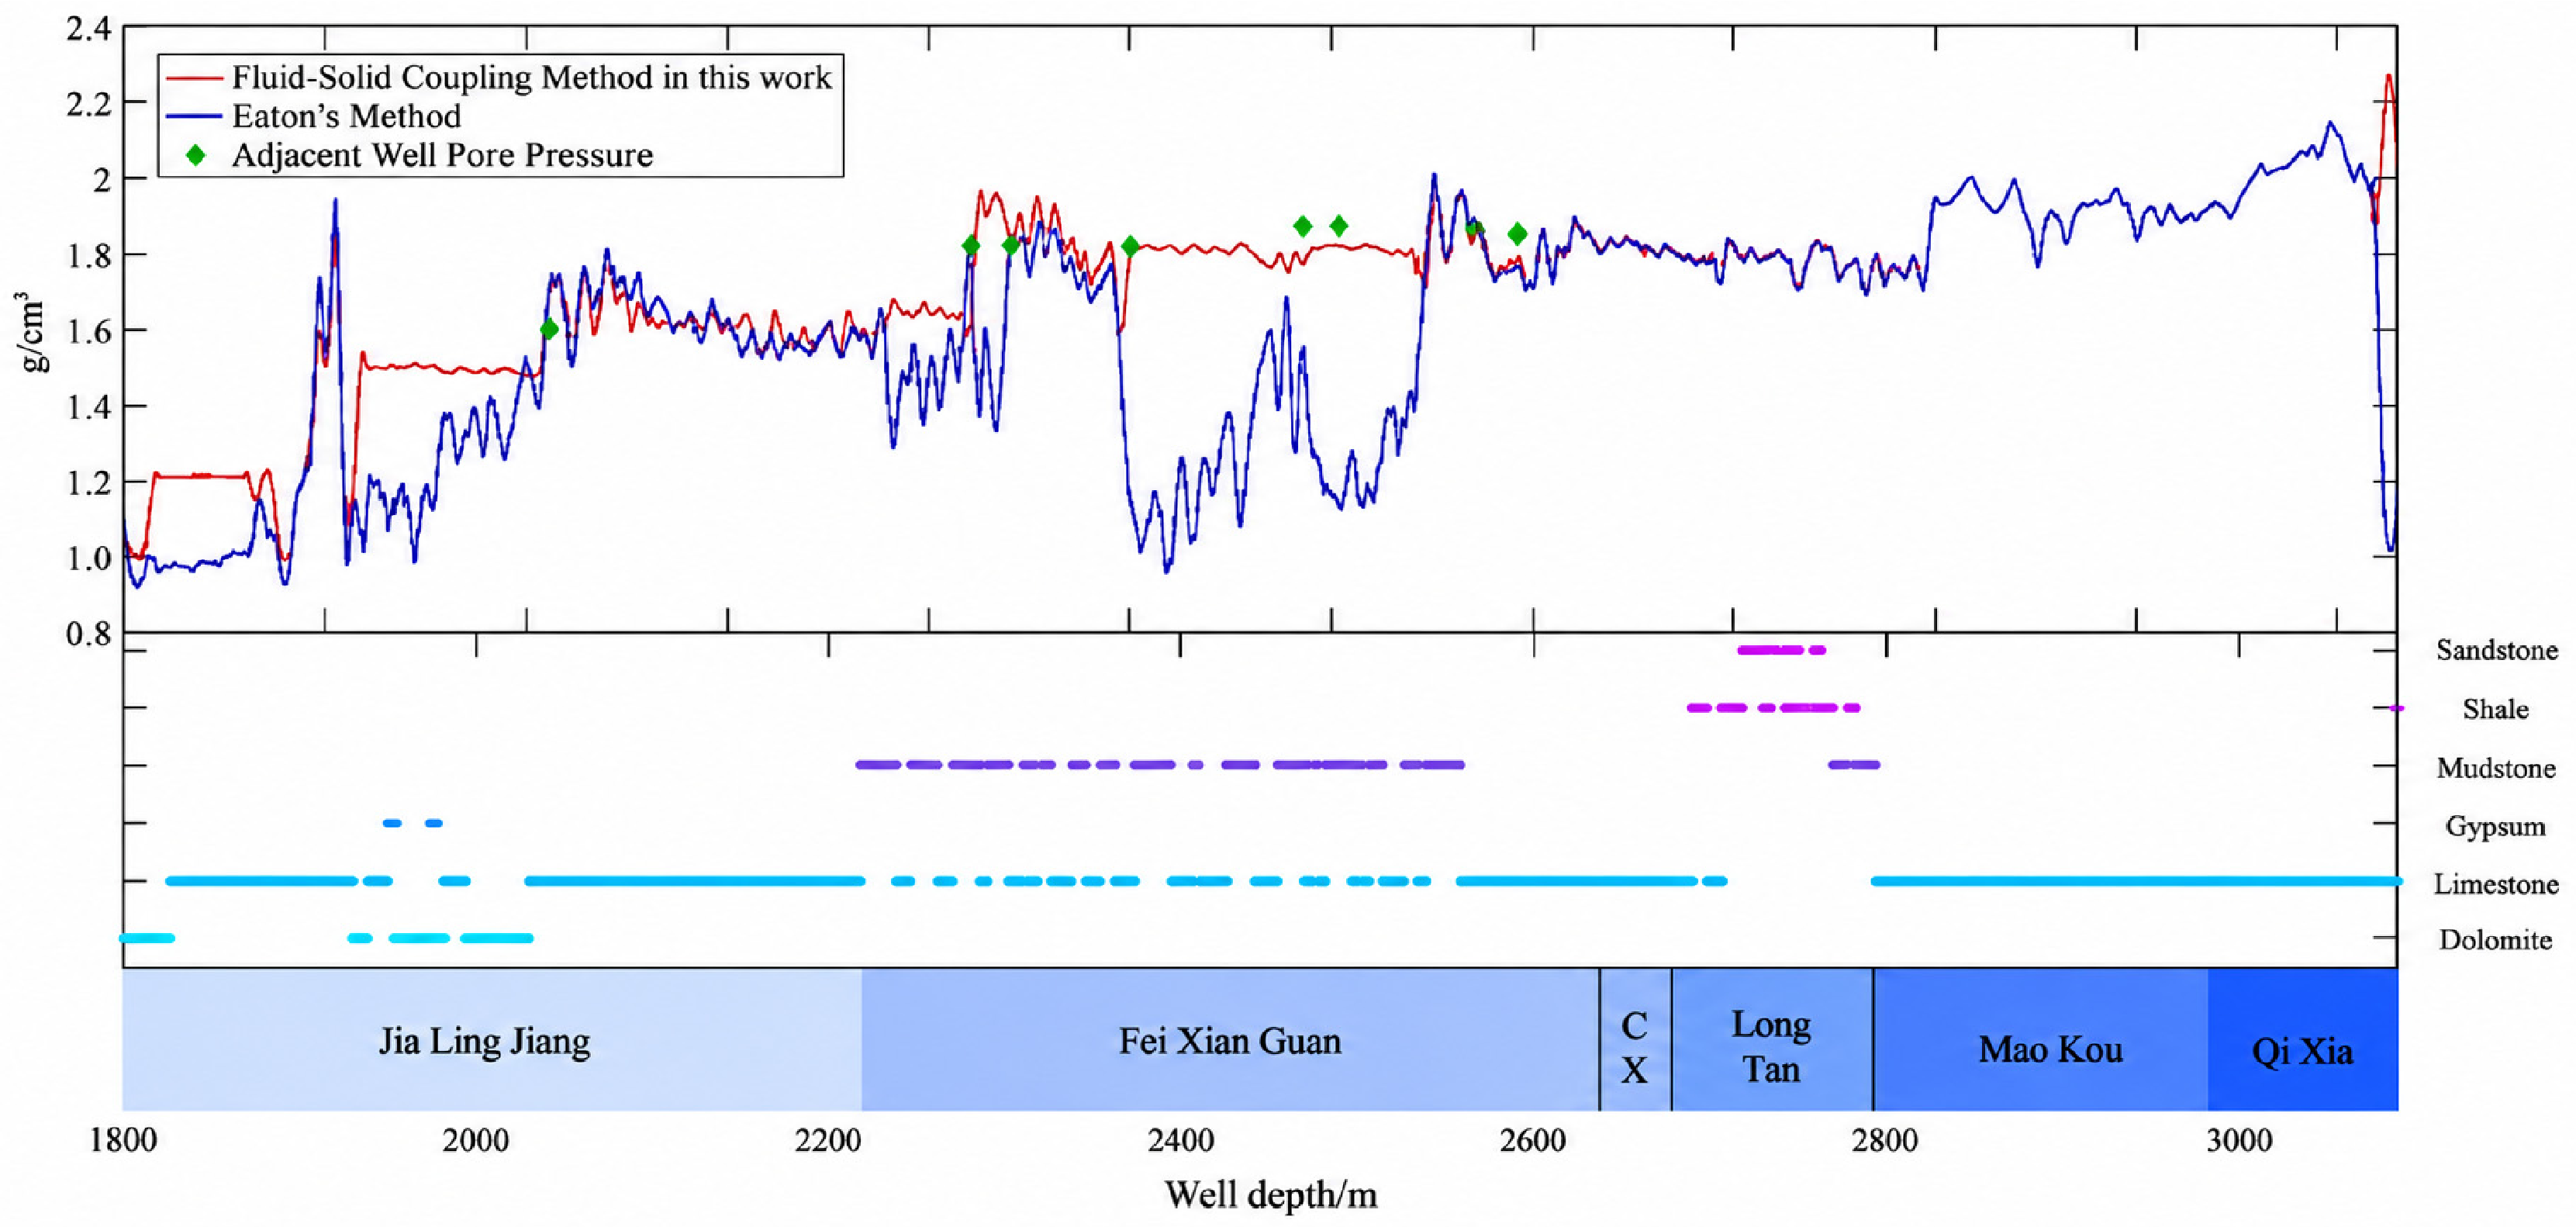
Figure 4 compares the hydro-mechanical coupling prediction, the Eaton prediction, and the available offset-well pressure measurements for Well A. The coupling model predicts an equivalent pressure density (expressed as equivalent mud density) of approximately 1.00–1.55 g/cm3 in the Jialingjiang Formation. The predicted range increases to 1.54–1.81 g/cm3 in the Feixianguan Formation and to approximately 1.58–2.01 g/cm3 from the Changxing Formation through the Hanjiadian interval. The pressure profile follows the broad stratigraphic increase in pressure while retaining local variations associated with changes in lithology and the inferred poroelastic response.
The contrast with the Eaton curve is most evident in the carbonate-dominated intervals. Where the acoustic transit time departs sharply from a smooth compaction trend, the Eaton prediction develops large-amplitude oscillations and local pressure reductions that are not supported by the offset pressure points. In the Maokou and Qixia formations, these deviations are particularly strong. The coupling method substantially suppresses these unrealistic fluctuations and remains closer to the measured pressures. This behavior does not imply that the carbonate section is homogeneous; rather, it indicates that the pressure estimate is less directly controlled by every short-wavelength variation in the sonic log.

4.3. Pore-Pressure Profile of Well B

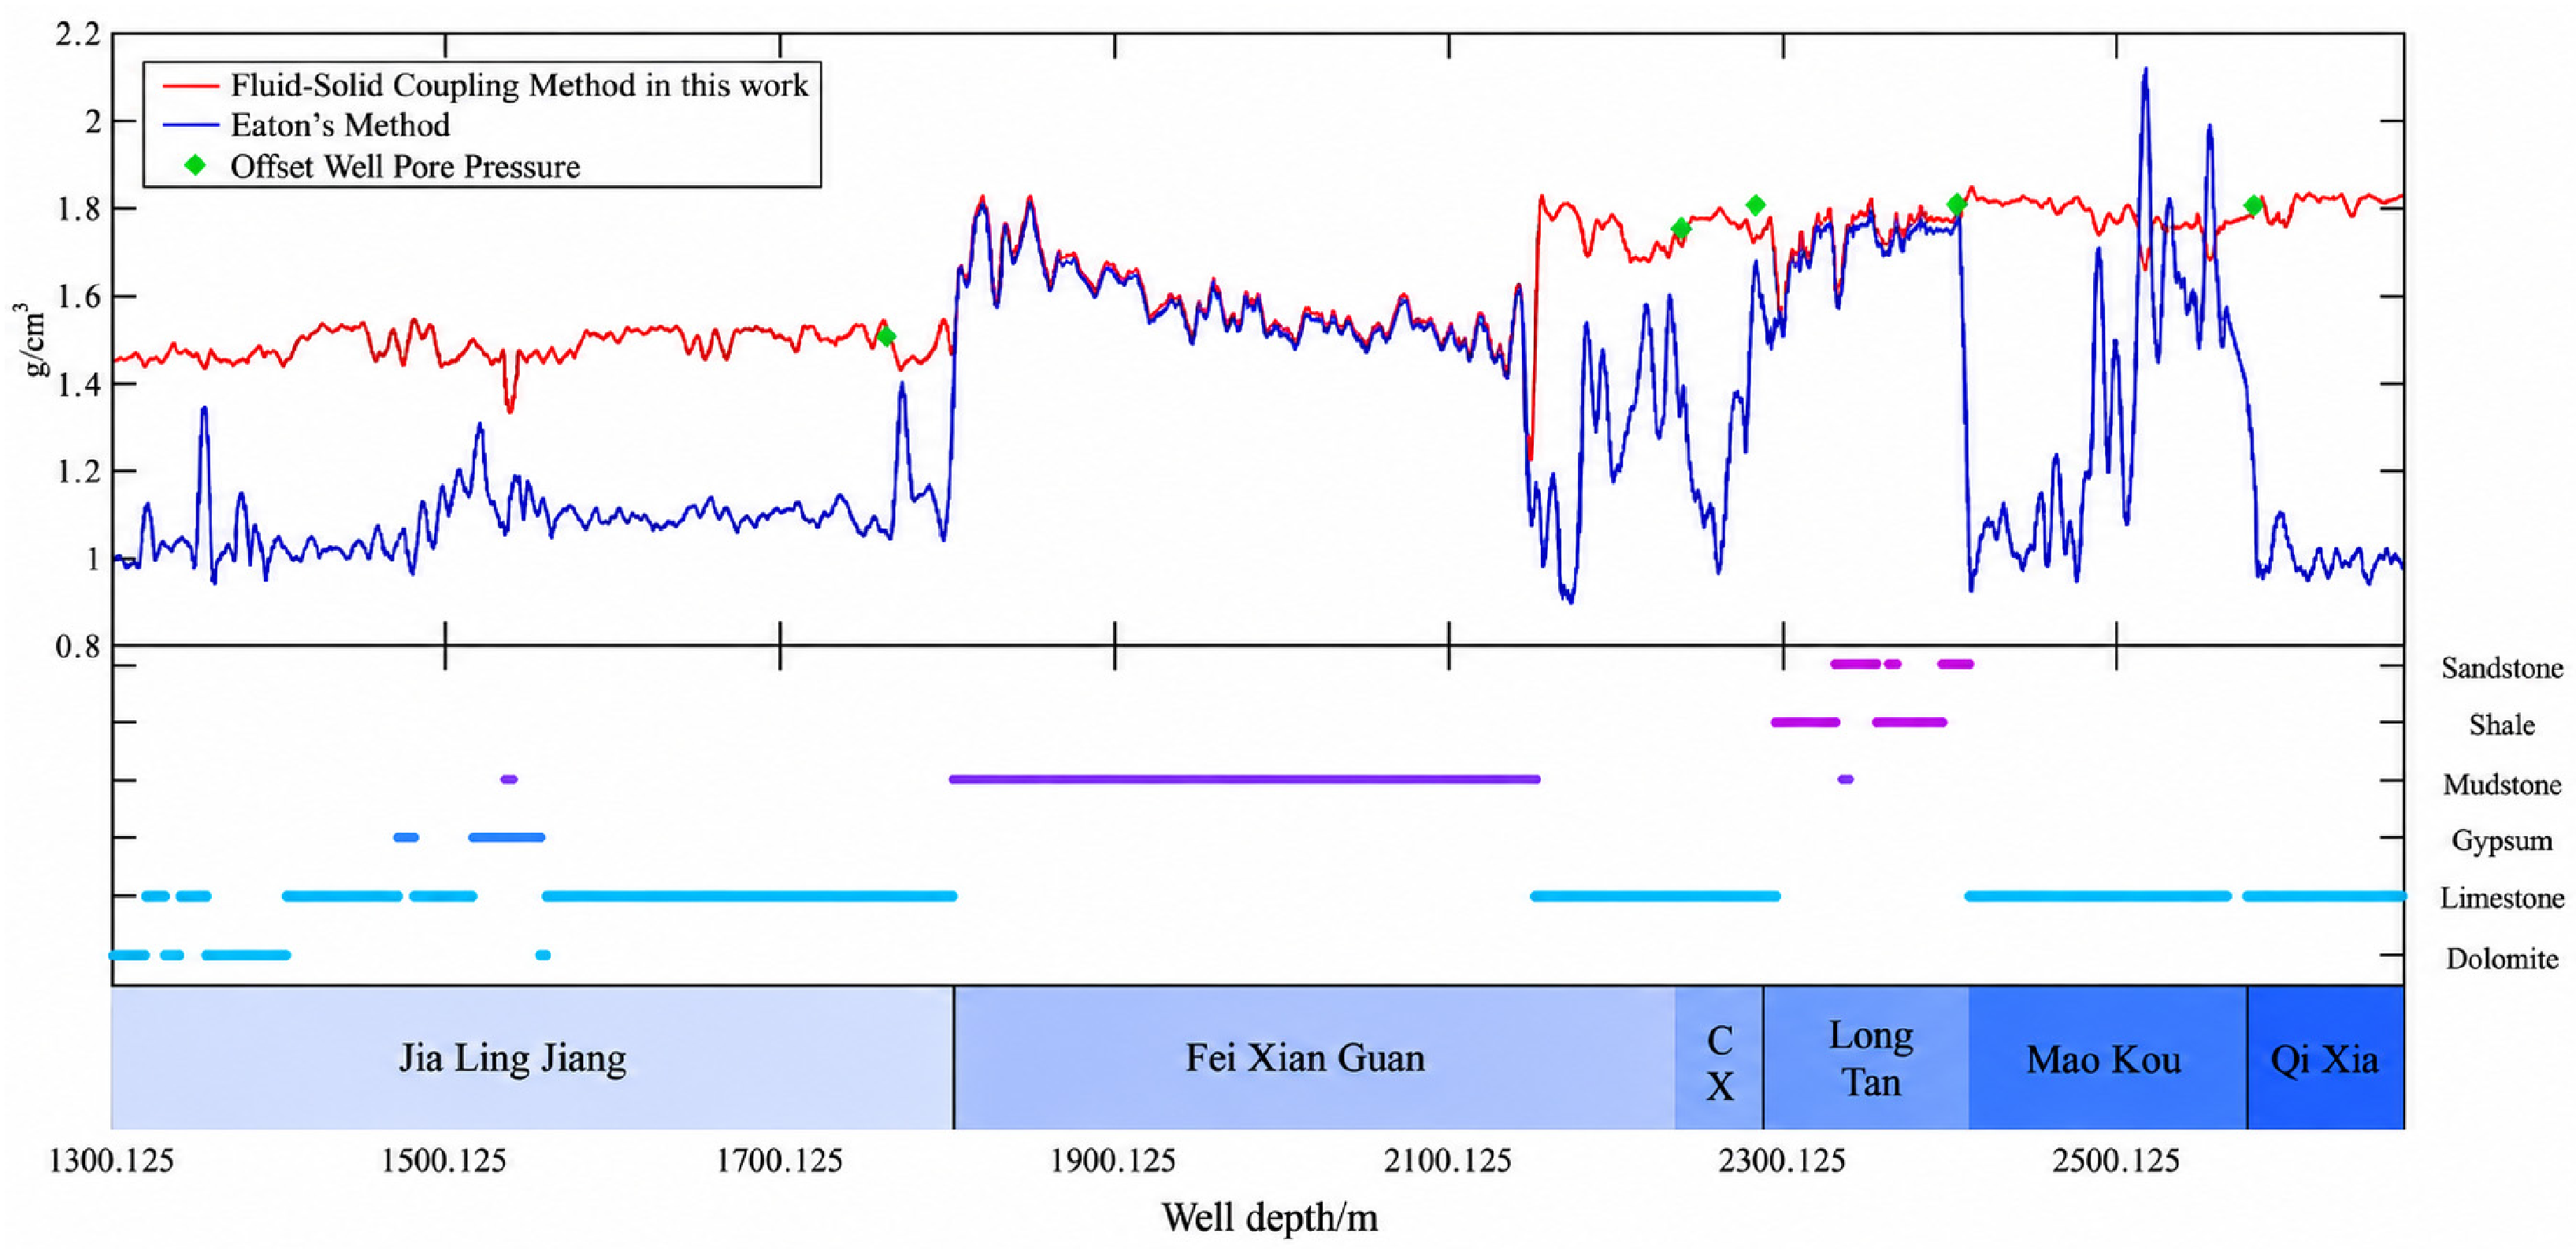
For Well B, the hydro-mechanical coupling model predicts a pore-pressure gradient of approximately 1.39–1.56 g/cm3 in the Jialingjiang Formation, 1.34–1.86 g/cm3 in the Feixianguan Formation, and 1.58–2.05 g/cm3 from the Changxing Formation to the Hanjiadian interval (Figure 5). The predicted profile captures the gradual pressure increase and the local high-pressure intervals identified by the measured offset-well data. Although the absolute log pattern differs from Well A, the model again produces a comparatively stable response across the carbonate succession.
The Eaton method performs reasonably in several non-carbonate or more uniform intervals, where the acoustic response more closely resembles a conventional compaction trend. Its reliability decreases in the Maokou and Qixia carbonate sections, where the predicted curve shows abrupt decreases and high-frequency variability. The mismatch is consistent with the geological expectation that sonic velocity in carbonate rocks is controlled by multiple factors. By linking pressure to the poroelastic stress-transfer coefficient, the coupling model reduces the sensitivity of the prediction to acoustic anomalies that may not be pressure related.

4.4. Statistical Evaluation

Measured pore pressures from offset wells at equivalent depths were used as the reference for quantitative evaluation. The pressure observations used for statistical comparison were obtained from formation-pressure evaluation records rather than continuous pressure logging. Therefore, each observation represents a discrete pressure constraint at a specific stratigraphic position. The number of available pressure points was limited by the field measurement conditions, with eight and five reference points available for Wells A and B, respectively. The offset-well pressure points were treated as external reference observations from offset wells rather than direct measurements from the prediction wells. Because the reference observations were obtained from offset wells at stratigraphically equivalent depths, the statistical comparison is interpreted primarily as an assessment of regional pressure consistency rather than a direct substitute for in-well validation. Differences in well spacing and hydraulic connectivity are therefore regarded as potential sources of uncertainty in the comparison. It should be noted that the available offset-well pressure dataset was also used to constrain the coupling exponent nHM. Therefore, the present comparison should be regarded as a calibration-constrained performance assessment rather than a fully independent validation. The reported statistical indicators reflect the consistency between the predicted and reference pressure trends under the available constraints, but they should not be interpreted as independent predictive accuracy. The statistical results should consequently be interpreted as an assessment of model consistency and applicability within the studied well areas rather than as an unbiased prediction benchmark. Independent validation using additional wells or pressure measurements not involved in parameter calibration will be necessary in future studies. For Well B, the correlation coefficient between the coupling-model prediction and the measured pressures is 0.89, compared with 0.67 for the Eaton method. For Well A, the corresponding coefficients are 0.34 and −0.21. For Well A, the Eaton method yields a negative correlation coefficient of −0.21, indicating that, at the available reference points, the predicted pressure variations tend to differ from the direction of variation represented by the offset-well pressure observations. This result suggests relatively weak agreement of the Eaton prediction with the available reference data for Well A. However, the negative correlation should not be attributed solely to model performance. The available offset-well pressure observations are limited in number and unevenly distributed with depth, making the correlation coefficient sensitive to individual local mismatches. In addition, the strong lithological and petrophysical heterogeneity of the carbonate intervals can introduce sonic variations unrelated directly to pore-pressure changes, thereby affecting the Eaton prediction. The use of offset-well rather than direct in-well pressure measurements also introduces uncertainty associated with interwell geological variability and possible pressure compartmentalization. Therefore, the negative correlation is interpreted as the combined consequence of method sensitivity, geological heterogeneity, and limitations of the available reference dataset.
The reported standard deviations further demonstrate the improvement in prediction stability. For Wells A and B, the standard deviations associated with the coupling model are 0.0816 and 0.1088, respectively, compared with 0.3036 and 0.3445 for the Eaton method. To quantify the change in prediction variability relative to the Eaton method, the relative reduction in normalized standard deviation is defined as:
I = S D Eaton − S D HM S D Eaton × 100 %
where I represents the prediction accuracy improvement, SDEaton is the standard deviation of the Eaton prediction, and SDHM is the standard deviation of the hydro-mechanical coupling prediction.
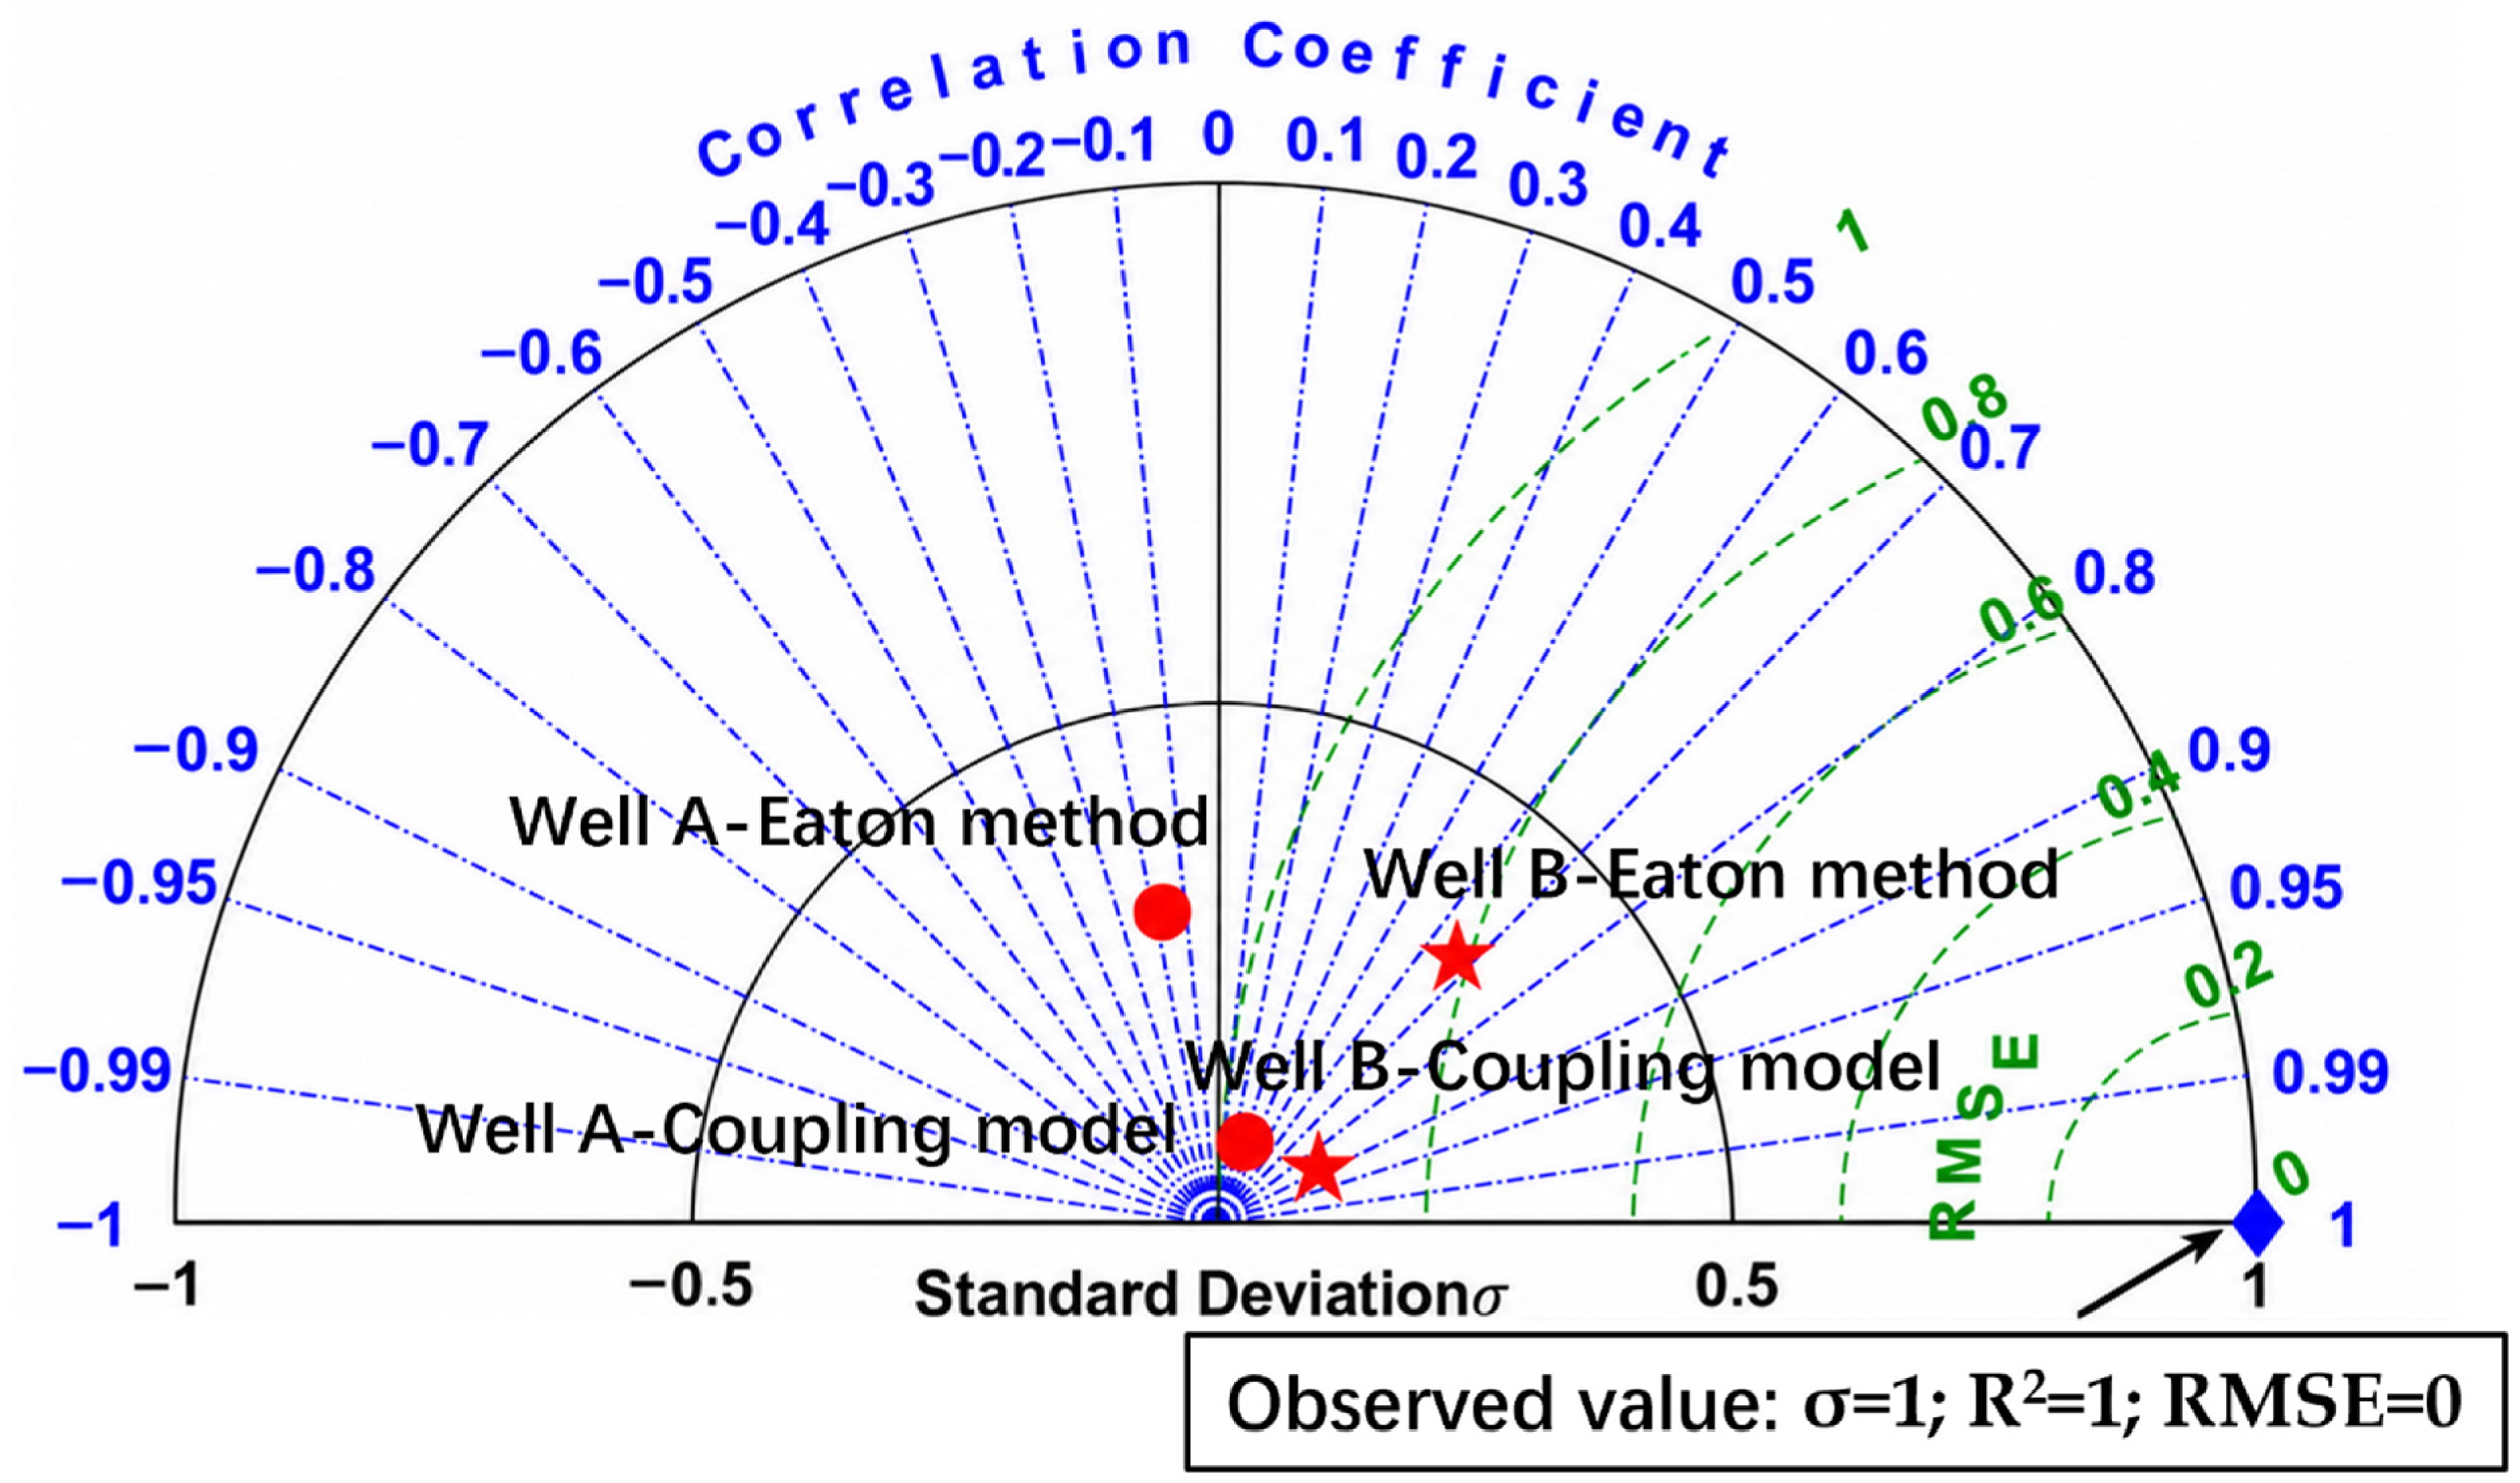
The quantitative evaluation was conducted using offset-well pressure observations at stratigraphically equivalent depths as the reference. To provide a more transparent and comprehensive statistical comparison, the correlation coefficient, normalized standard deviation, and normalized centered RMSE are evaluated jointly. The numerical normalized centered RMSE values corresponding to the Taylor diagram are now explicitly reported in Table 2, in addition to their graphical representation in Figure 6. These indicators are interpreted together to assess the agreement between the predicted and reference pressure characteristics. The Taylor diagrams in Figure 6 provide an integrated comparison of correlation, normalized standard deviation, and centered RMSE for the two prediction methods. The coupling model shows higher correlation coefficients and lower normalized standard deviations for both wells, whereas the centered RMSE exhibits different responses between the two wells. Therefore, the model performance is evaluated jointly using these statistical indicators rather than based on a single metric. Relative to the Eaton method, the normalized standard deviation is reduced by approximately 73.1% for Well A and 68.4% for Well B. For Well A, the correlation coefficient of 0.34 remains moderate after model improvement. This is mainly related to the limited number and uneven distribution of available offset-well pressure measurements. Sparse pressure observations provide only discrete constraints for model evaluation, and the correlation coefficient is therefore sensitive to local mismatches caused by complex lithological variations and possible pressure compartmentalization in carbonate formations. Therefore, the performance of Well A should be interpreted together with the reduced standard deviation, RMSE, and smoother pressure profile rather than using correlation coefficient alone. Table 2 summarizes the available statistical indicators.
The reduced standard deviation obtained by the hydro-mechanical coupling model should not be interpreted solely as increased prediction accuracy. In particular, excessively low variability may indicate over-smoothing if the predicted profile fails to reproduce important pressure fluctuations. In this study, the reduced standard deviation is considered together with the correlation coefficient, pressure-profile consistency, and geological constraints. The coupling model does not simply minimize pressure variation but incorporates hydro-mechanical interactions through Biot poroelasticity, which helps maintain the overall pressure trend while reducing unrealistic fluctuations caused by lithological heterogeneity and acoustic anomalies.

4.5. Interpretation of Model Performance

The improved performance can be explained by the different physical quantities used by the two methods. The Eaton sonic method interprets deviations from a normal acoustic trend primarily in terms of changes in effective stress. In clastic formations dominated by mechanical compaction, this interpretation is often reasonable. In carbonate rocks, however, sonic transit time is also influenced by mineral composition, crystal texture, total porosity, pore type and geometry, cementation and dissolution, fractures, vugs, and fluid-related effects [18,19,20]. Experimental and rock-physics studies have shown that these factors can produce substantial velocity variations even among carbonate rocks with comparable porosity or stress conditions. Consequently, part of the observed sonic variation may reflect lithological and diagenetic heterogeneity rather than pore-pressure change alone. This non-uniqueness can reduce the reliability of a sonic-based pore-pressure interpretation unless an appropriate normal compaction trend and local pressure calibration are available. As a result, the sonic ratio may overreact to short-scale heterogeneity and generate pressure fluctuations that have no direct mechanical basis.
To place this interpretation on a quantitative basis, published carbonate rock-physics data demonstrate that pore structure can introduce substantial sonic-velocity variability that cannot be explained by porosity alone. Weger et al. [20] reported that porosity alone accounted for P-wave velocity variations with an R2 of 0.542, whereas incorporating quantitative descriptors of pore-network complexity, pore size, and microporosity increased the R2 to 0.840. Eberli et al. [19] further showed that carbonate samples with comparable porosity may differ in P-wave velocity by more than 2500 m/s; at a porosity of approximately 39%, measured velocities ranged from about 2400 to 5000 m/s. These quantitative observations demonstrate that pore geometry, microporosity, cementation, dissolution, and vug-related pore structures can generate substantial acoustic variability independently of pore-pressure changes. In the present study, the strongest short-wavelength fluctuations of the Eaton prediction occur mainly in the carbonate-dominated Maokou and Qixia intervals, whereas the hydro-mechanical coupling model reduces the normalized standard deviation from 0.3036 to 0.0816 in Well A and from 0.3445 to 0.1088 in Well B, corresponding to reductions of 73.1% and 68.4%, respectively. The corresponding correlation coefficients change from −0.21 to 0.34 and from 0.67 to 0.89. Furthermore, based on the parameter ranges adopted in Table 1 (B = 0.4–1.0) and (vu = 0.25–0.40), the stress-transfer coefficient βHM = B(1 + νu)/[3(1 − νu)] ranges approximately from 0.22 to 0.78. This range illustrates quantitatively how variations in porosity, rock-frame compressibility, and associated poroelastic properties can substantially modify the fraction of applied stress transferred to the pore fluid. Therefore, the observed improvement is quantitatively consistent with the reduced sensitivity of the coupling formulation to lithology- and pore-structure-induced sonic anomalies. However, these results should be interpreted as an association rather than a direct attribution of the improvement to individual fractures or vugs.
The performance of the Eaton method in this study should therefore be interpreted within the limitations of the adopted empirical parameters. A regionally optimized Eaton exponent or a more detailed normal compaction trend may improve its performance; however, such calibration requires additional independent pressure measurements and is beyond the scope of the present dataset.
For Well A, the moderate correlation coefficient after model improvement is partly related to the limited number and uneven distribution of available offset-well pressure measurements. Sparse pressure observations provide only discrete constraints for model calibration and subsequent performance assessment, making the correlation coefficient more sensitive to local mismatches caused by complex lithological variations and pressure compartmentalization in carbonate formations. Therefore, the improved correlation should be interpreted together with the reduced standard deviation and smoother pressure profile rather than as an isolated statistical indicator.
The hydro-mechanical model instead starts from the partition of total stress between the solid skeleton and the pore fluid. The Biot and Skempton coefficients, together with the drained and undrained elastic moduli, describe how compressible the coupled system is and how efficiently an imposed load is converted into pressure. This mechanism is relevant across different lithologies, even though the parameter values must change with rock type. In the present application, the coupling term acts as a stabilizing physical constraint: it allows pressure to respond to formation deformation without requiring each sonic anomaly to be interpreted as an overpressure anomaly.
The results also show that the proposed method and the Eaton method can yield similar trends in non-carbonate intervals. This agreement is important because it suggests that the coupling approach does not necessarily distort the pressure profile where conventional compaction-based interpretation is valid. Instead, its principal advantage appears in the carbonate intervals where the Eaton assumption becomes weak. A combined workflow may therefore be practical: conventional methods can be retained as a baseline, while the coupling model provides an independent estimate and a diagnostic of intervals where lithological effects dominate the acoustic response.
A local sensitivity analysis was additionally performed for the calibrated coupling exponent. The baseline values were nHM = 0.09 for Well A and nHM = 0.12 for Well B, and each value was varied by ±20%. Thus, the sensitivity ranges were 0.072–0.108 for Well A and 0.096–0.144 for Well B. Because 0 < βHM < 1, the predicted pore pressure increases monotonically with increasing nHM. For βHM = 0.458, the retained-stress term (βHM)nHM varies from approximately 0.945 to 0.919 for Well A and from approximately 0.928 to 0.894 for Well B over the tested ranges. These moderate and monotonic changes indicate that the model response remains stable around the calibrated values and that no abrupt numerical sensitivity occurs within the tested physically constrained interval. Nevertheless, because nHM is empirically constrained, the model should not be regarded as parameter-free.
A full independent one-at-a-time perturbation of α, B, νu, ϕ, Kf, and nHM was not applied because these parameters are constitutively coupled rather than mutually independent. In particular, B is determined from the Biot coefficient, porosity, fluid bulk modulus, and rock-frame properties, whereas νu is related to the undrained elastic response. Independently varying both B and its governing parameters would therefore introduce internally inconsistent parameter combinations and potentially double-count the same source of uncertainty. A comprehensive sensitivity analysis should instead preserve these poroelastic relationships and vary independent rock and fluid properties jointly within lithology-specific ranges.
Previous studies have demonstrated that carbonate pore-pressure prediction remains challenging because acoustic responses are affected by multiple geological factors beyond effective stress. Li et al. [9] compared equivalent-depth, Eaton, and effective-stress approaches in the Luzhou Block and showed that incorporating calibrated geological constraints could improve the consistency of pressure prediction compared with a purely empirical compaction trend. Similarly, Guo et al. [10] introduced regional pressure-zone coefficients and combined poroelastic concepts with Eaton-based prediction to account for lithological differences in the same geological area. Compared with these studies, the present work adopts a different formulation by explicitly introducing the Biot poroelastic stress-transfer mechanism into the pressure equation, allowing lithological effects to be represented through physically meaningful parameters such as the Biot coefficient, Skempton coefficient, and elastic properties rather than through empirical regional coefficients alone. The improved consistency observed in Wells A and B is therefore interpreted as a consequence of reduced sensitivity to short-wavelength sonic anomalies in heterogeneous carbonate intervals. Meanwhile, the present results are consistent with previous findings that pressure prediction in carbonate formations requires integration of geological constraints and rock-physics information rather than reliance on a single acoustic indicator. However, because the current assessment is based on two wells and calibration-constrained pressure observations, further comparison with independent datasets is required before extending the approach to broader carbonate reservoirs.

4.6. Engineering Implications and Limitations

For drilling engineering, a smoother and more geologically consistent pore-pressure profile can provide additional support for defining the safe drilling-fluid density window. However, the reduced prediction variability observed in the present comparison should not be interpreted as a quantified reduction in pore-pressure uncertainty, because no formal uncertainty quantification was performed. The statistical indicators used here are intended to characterize comparative prediction consistency within the evaluated wells rather than to provide a probabilistic measure of model uncertainty. In the Luzhou Block, this is directly relevant to the simultaneous risks of influx and lost circulation. Underprediction may leave the well underbalanced in overpressured intervals, whereas overprediction may lead to an excessive equivalent circulating density and induce losses in fractured or vuggy carbonates. The coupling model can therefore support the selection of drilling-fluid density, casing setting depth, and pressure-monitoring priorities. It may also improve post-event diagnosis by distinguishing pressure-related anomalies from log fluctuations caused primarily by lithology.
The present performance assessment is limited to two wells and a restricted number of offset pressure measurements, which were also involved in constraining the coupling exponent. Therefore, independent validation using additional wells or pressure measurements not involved in calibration remains necessary. The statistical metrics should therefore be interpreted as evidence of feasibility rather than as a basin-wide performance guarantee. Additional wells are required to determine whether a single coupling exponent can be transferred across well areas or whether separate calibrations are needed for individual formations. Future work should extend the present local sensitivity test to a comprehensive multi-parameter uncertainty and sensitivity analysis that preserves the constitutive dependence among α, B, νu, ϕ, Kf, and nHM, incorporates lithology-specific parameter distributions, and compares the resulting prediction envelopes with independent pressure measurements acquired in the target wells. Incorporating fracture density, karst development, and permeability-dependent drainage would further improve the model in highly heterogeneous carbonate intervals. The present quantitative analysis does not separately parameterize fracture density, vug volume, porosity, or other individual heterogeneity descriptors at each reference depth. Therefore, the observed performance differences are interpreted as being consistent with the combined influence of carbonate heterogeneity rather than as a quantitative attribution to any individual geological factor. Future work may further extend this framework by incorporating interval-scale heterogeneity descriptors to investigate their respective contributions to pressure-prediction behavior. Future work should combine image-log-derived fracture density, vug occurrence, and interval-scale porosity with pressure-prediction errors to establish direct quantitative relationships between carbonate heterogeneity and model performance.
Another important requirement is reference-data quality. Offset-well measurements may not represent exactly the same pressure compartment, and depth matching across structurally complex formations can introduce uncertainty. The calibration data should therefore be screened for stratigraphic equivalence, measurement reliability, and evidence of hydraulic communication. When these controls are applied, the hydro-mechanical coupling model offers a transparent framework in which geological interpretation, rock mechanics, and pressure data can be integrated rather than treated as independent inputs.
Despite the improved prediction performance, several limitations of the proposed model should be acknowledged. First, the current model is established based on simplified assumptions, including homogeneous porous media, linear elasticity, and undrained conditions, which may not fully represent the complex geological characteristics of carbonate formations with fractures, vugs, and strong heterogeneity. Second, the model validation is currently limited to two wells, and further verification using more wells from different geological settings is required to evaluate its regional applicability. In addition, the influence of parameters such as the Biot coefficient, Skempton coefficient, elastic properties, and coupling exponent on prediction uncertainty requires further investigation. Future studies should incorporate more geological constraints, parameter sensitivity analysis, and uncertainty quantification to improve the robustness and practical applicability of the proposed model.

5. Conclusions

A hydro-mechanical coupling model was developed and evaluated for pore-pressure prediction in the carbonate formations of the Luzhou Block. The main conclusions are summarized as follows:
(1)
The carbonate successions in the Luzhou Block exhibit strong lithological and petrophysical heterogeneity, resulting in significant variations in sonic response and porosity. These characteristics weaken the reliability of conventional acoustic-trend methods that rely mainly on normal compaction assumptions.
(2)
A hydro-mechanical coupling model was established based on Biot poroelasticity under constrained, linear-elastic, and undrained conditions. By introducing a dimensionless coupling response term, the model represents the stress-transfer mechanism between the rock skeleton and pore fluid and provides a physically based alternative for carbonate pore-pressure prediction.
(3)
Application to Well A in the 205-well area and Well B in the 203-well area shows that, for the carbonate intervals evaluated in these two wells, the coupling model produces smoother and more geologically consistent pressure profiles than the Eaton method, particularly where the acoustic response exhibits strong lithological and pore-structure-related variability.
(4)
Within the two evaluated wells, the proposed approach reduces the sensitivity of pore-pressure prediction to individual sonic anomalies and provides a useful alternative framework for pressure evaluation in the studied carbonate intervals. However, the present results represent a two-well calibration-constrained assessment rather than an independent validation for carbonate formations. Additional wells, independent pressure measurements, uncertainty analysis, and improved treatment of fractures and drainage conditions are required before regional-scale application can be established.

Author Contributions

Conceptualization, Y.S.; Methodology, Y.Z.; Software, Y.L. and T.T.; Validation, T.T.; Formal analysis, X.G.; Investigation, L.X.; Data curation, Y.L., Y.Z. and X.G.; Writing—original draft, L.X.; Writing—review and editing, Y.S. All authors have read and agreed to the published version of the manuscript.

Funding

This research received no external funding.

Data Availability Statement

The original contributions presented in this study are included in the article. Further inquiries can be directed to the corresponding author.

Conflicts of Interest

Yu Sang and Yatian Li were employed by the PetroChina Southwest Oil & Gasfield Company, Chengdu 610051, China; Lianbin Xia, Tianyi Tan, Yuting Zhang and Xiangmin Guo were employed by the Oil and Gas Technology Research Institute, PetroChina Southwest Oil & Gasfield Company, Chengdu 610017, China. The funder was not involved in the study design, collection, analysis, interpretation of data, the writing of this article or the decision to submit it for publication.

References

  1. Wang, Z. Detection of abnormal pressure while drilling in carbonate formations of northeastern Sichuan Basin. Acta Pet. Sin. 2012, 33, 1068–1075. [Google Scholar] [CrossRef]
  2. Eaton, B.A. The Equation for Geopressure Prediction from Well Logs. In Proceedings of the Fall Meeting of the Society of Pe-troleum Engineers of AIME, Dallas, TX, USA, 28 September–1 October 1975. SPE-5544-MS. [Google Scholar] [CrossRef]
  3. Bowers, G.L. Pore Pressure Estimation from Velocity Data: Accounting for Overpressure Mechanisms Besides Undercompac-tion. SPE Drill. Complet. 1995, 10, 89–95. [Google Scholar] [CrossRef] [Scilit]
  4. Eberhart-Phillips, D.; Han, D.H.; Zoback, M.D. Empirical relationships among seismic velocity, effective pressure, porosity, and clay content in sandstone. Geophysics 1989, 54, 82–89. [Google Scholar] [CrossRef] [Scilit]
  5. Atashbari, V.; Tingay, M.; Zareian, M.H. Compressibility Method for Pore Pressure Prediction. In Proceedings of the Abu Dhabi International Petroleum Exhibition and Conference, Abu Dhabi, United Arab Emirates, 11–14 November 2012. SPE-156337-MS. [Google Scholar] [CrossRef] [Scilit]
  6. Cheng, Y.; Shi, X.; Li, L.; Wu, L.; Mei, W. A novel pore pressure prediction model of carbonate formation with fracture devel-opment. J. China Univ. Pet. (Ed. Nat. Sci.) 2013, 37, 83–87, 97. [Google Scholar] [CrossRef]
  7. Cheng, A.H.-D. Poroelasticity; Springer: Cham, Switzerland, 2016. [Google Scholar] [CrossRef] [Scilit]
  8. Makarian, E.; Abad, A.B.M.N.; Manaman, N.S.; Mansourian, D.; Elyasi, A.; Namazifard, P.; Martyushev, D.A. An efficient and comprehensive poroelastic analysis of hydrocarbon systems using multiple data sets through laboratory tests and geophysical logs: A case study in an Iranian hydrocarbon reservoir. Carbonates Evaporites 2023, 38, 37. [Google Scholar] [CrossRef] [Scilit]
  9. Li, W.; Luo, P.; Li, Y.; Zhou, J.; Hu, X.; Wang, Q.; He, Y.; Zhang, Y. Comparison and Application of Pore Pressure Prediction Methods for Carbonate Formations: A Case Study in Luzhou Block, Sichuan Basin. Energies 2025, 18, 2647. [Google Scholar] [CrossRef] [Scilit]
  10. Guo, J.; Ma, Y.; Li, Y.; Fu, Z.; Chen, Y.; He, D. Prediction method of pore pressure of carbonate rock and shale considering regional differences—A case study of the Luzhou block in southern Sichuan. J. Pet. Explor. Prod. Tech-Nology 2025, 15, 157. [Google Scholar] [CrossRef] [Scilit]
  11. Rivera, M.; Montes, L.A.; Castillo, L.A. Pore pressure estimation of the calcareous formations in the Middle Magdalena Valley Basin, Colombia. Acta Geophys. 2025, 73, 1349–1361. [Google Scholar] [CrossRef] [Scilit]
  12. Feng, L.; Liu, H.; Tan, L.; Xia, J.; Wu, Y.; Chen, C.; Zeng, Y.; Yu, T. Karst palaeogeomorphology restoration and hydrocarbon geological significance: A case study of the Middle Permian Maokou Formation in the Luzhou area of the Sichuan Basin. Fault-Block Oil Gas. Field 2023, 30, 60–69. [Google Scholar]
  13. Muojeke, S.; Venkatesan, R.; Khan, F. Supervised data-driven approach to early kick detection during drilling operation. J. Pet. Sci. Eng. 2020, 192, 107324. [Google Scholar] [CrossRef] [Scilit]
  14. Pang, H.; Chen, M.; Wang, H.; Jin, Y.; Lu, Y.; Li, J. Lost circulation pattern in the vug-fractured limestone formation. Energy Rep. 2023, 9, 941–954. [Google Scholar] [CrossRef] [Scilit]
  15. Feng, Y.; Gray, K.E. Review of fundamental studies on lost circulation and wellbore strengthening. J. Pet. Sci. Eng. 2017, 152, 511–522. [Google Scholar] [CrossRef] [Scilit]
  16. Zhang, J.; Bai, M.; Roegiers, J.-C. Dual-porosity poroelastic analyses of wellbore stability. Int. J. Rock Mech. Min. Sci. 2003, 40, 473–483. [Google Scholar] [CrossRef] [Scilit]
  17. Issa, M.A.; Alrazzaq, A.A.A.; Mukhtar, Y. Review of the Mechanisms for Preventing, Diagnosing, and Treatment of Pipe Sticking in Drilling Operations. Iraqi J. Chem. Pet. Eng. 2023, 24, 133–140. [Google Scholar] [CrossRef] [Scilit]
  18. Anselmetti, F.S.; Eberli, G.P. Controls on Sonic Velocity in Carbonates. Pure Appl. Geophys. 1993, 141, 287–323. [Google Scholar] [CrossRef] [Scilit]
  19. Eberli, G.P.; Baechle, G.T.; Anselmetti, F.S.; Incze, M.L. Factors Controlling Elastic Properties in Carbonate Sediments and Rocks. Lead. Edge 2003, 22, 654–660. [Google Scholar] [CrossRef] [Scilit]
  20. Weger, R.J.; Eberli, G.P.; Baechle, G.T.; Massaferro, J.L.; Sun, Y.-F. Quantification of Pore Structure and Its Effect on Sonic Velocity and Permeability in Carbonates. AAPG Bull. 2009, 93, 1297–1317. [Google Scholar] [CrossRef] [Scilit]
  21. Detournay, E.; Cheng, A.H.-D. Fundamentals of Poroelasticity. In Comprehensive Rock Engineering: Principles, Practice and Projects, Vol. II, Analysis and Design Methods; Fairhurst, C., Ed.; Pergamon Press: Oxford, UK, 1993; pp. 113–171. [Google Scholar]
  22. Dugan, B.; Sheahan, T.C. Offshore sediment overpressures of passive margins: Mechanisms, measurement, and models. Rev. Geophys. 2012, 50, RG3001. [Google Scholar] [CrossRef] [Scilit]
  23. Biot, M.A. Theory of deformation of a porous viscoelastic anisotropic solid. J. Appl. Phys. 1956, 27, 459–467. [Google Scholar] [CrossRef] [Scilit]
  24. Skempton, A.W. The Pore-Pressure Coefficients A and B. Geotechnique 1954, 4, 143–147. [Google Scholar] [CrossRef] [Scilit]
  25. Berryman, J.G. Single-scattering approximations for coefficients in Biot’s equations of poroelasticity. J. Acoust. Soc. Am. 1992, 91, 551–571. [Google Scholar] [CrossRef] [Scilit]
Figure 1. Tectonic setting of the study area, locations of Well A (blue star lcon) in the 205-well area and Well B (red star lcon) in the 203-well area, and representative stratigraphic column of the Middle Permian (modified after Ref. [12]). The regional inset shows the principal structural setting of the Luzhou Block, and the dashed box in the main map indicates the 3D seismic survey area used to support stratigraphic and structural correlation.
Processes 14 03310 g001
Figure 2. Selected well-log curves and lithological interpretation for Well A in the 205-well area.
Processes 14 03310 g002
Figure 3. Selected well-log curves and lithological interpretation for Well B in the 203-well area.
Processes 14 03310 g003
Figure 4. Comparison of pore-pressure predictions and offset-well pressure measurements (expressed as equivalent mud density, g/cm3) for Well A in the 205-well area.
Processes 14 03310 g004
Figure 5. Comparison of pore-pressure predictions and offset-well pressure measurements (expressed as equivalent mud density, g/cm3) for Well B in the 203-well area.
Processes 14 03310 g005
Figure 6. Taylor diagram comparing the Eaton method and the hydro-mechanical coupling model for Wells A and B. The reference/observational point represents the offset-well pressure observations used for calibration-constrained performance assessment. The observational reference is normalized to a correlation coefficient of 1 and a normalized standard deviation of 1, with a normalized centered root-mean-square error of 0. The correlation coefficient describes the similarity in variation between the predicted and observed pressures; the standard deviation σ represents the variability of the pressure data; and the normalized centered root-mean-square error (RMSE) represents the centered deviation between the predicted and observed pressure patterns after normalization. In the diagram, the angular position represents the correlation coefficient, the radial distance represents the normalized standard deviation, and the distance from each model point to the observational reference point represents the normalized centered RMSE.
Processes 14 03310 g006
Table 1. Sources and determination methods of key poroelastic parameters used in the hydro-mechanical coupling model.
ParameterMeaningDetermination MethodRange
αBiot effective stress coefficientCalculated from drained bulk modulus and grain bulk modulus using literature-based poroelastic relationship0.6–1.0 for carbonate rocks [7,23]
BSkempton coefficientCalculated from poroelastic parameters rather than pressure fitting0.4–1.0 for saturated carbonate formations [7,24]
KDrained bulk modulusObtained from carbonate elastic properties reported in the literature and lithology-based assignment20–80 GPa
GDrained shear modulusDerived from elastic modulus and Poisson’s ratio relationship10–40 GPa
KuUndrained bulk modulusCalculated using drained bulk modulus, Biot coefficient, and Biot modulusHigher than K [7]
MBiot modulusCalculated from Biot coefficient, porosity, grain modulus, and fluid modulus5–30 GPa [23]
KfFluid bulk modulusAssigned according to formation fluid properties reported in the literature2.0–2.5 GPa (water-based fluid) [25]
vuUndrained Poisson’s ratioCalculated from elastic parameters under saturated conditions0.25–0.40 [7]
nHMHydro-mechanical coupling exponentCalibrated using limited offset-well pressure data under geological constraintsdimensionless
Table 2. Statistical comparison of pore-pressure prediction performance.
WellMethodnCorrelationNormalized SDNormalized Centered RMSERelative Reduction in Normalized SD (%)
Well AHydro-mechanical coupling80.340.08160.975373.1%
Well AEaton8−0.210.30361.1044
Well BHydro-mechanical coupling50.890.10880.904568.4%
Well BEaton50.670.34450.8106
Note: Correlation coefficients and standard deviations are dimensionless statistical indicators. The relative reduction in normalized standard deviation is calculated with respect to the Eaton method. Correlation coefficients and normalized centered RMSE are independent statistical indicators and are not included in this percentage calculation.
Disclaimer/Publisher’s Note: The statements, opinions and data contained in all publications are solely those of the individual author(s) and contributor(s) and not of MDPI and/or the editor(s). MDPI and/or the editor(s) disclaim responsibility for any injury to people or property resulting from any ideas, methods, instructions or products referred to in the content.