Abstract
A plasma-assisted ammonia jet flame igniter was developed in this study to address the limitations of conventional spark ignition at high pressures. The effect of pressure on plasma discharge characteristics, optical emission spectra, and exhaust gas emission was systematically investigated, providing new insights into the mechanisms of plasma-assisted ammonia ignition under high-pressure conditions. The results indicate that increased chamber pressure elevates gas density, which in turn raises the voltage required to sustain an arc discharge at 0.4 MPa and markedly reduces the frequency of arc drift. Spectral analysis shows that higher pressure inhibits atomic oxygen lines (777.2 nm and 844.6 nm) while intensifying the molecular nitrogen bands between 350–450 nm. A corresponding decrease in electron excitation temperature is also observed. In terms of exhaust composition, hydrogen concentration demonstrates a bifurcated behavior, rising with pressure under fuel-rich conditions (the equivalence ratio φ > 1.2) and falling under fuel-lean conditions (φ ≤ 1). Conversely, NO concentration consistently decreases with increasing pressure across all test conditions. The ammonia concentration in the exhaust gas shows opposite pressure dependencies at different equivalence ratios. It increases with rising pressure for φ ≥ 1, while it decreases with increasing pressure for φ < 1.
1. Introduction
With its high octane number, superior anti-knock capability, multiple production routes, and well-developed infrastructure for storage and transport, ammonia is considered a viable alternative to conventional fossil fuels [1,2]. Research on its use in internal combustion engines has advanced significantly in recent decades. However, major challenges persist, such as high ignition energy, a narrow flammability range, slow flame speed, low volumetric energy density, and considerable NOX emissions [3,4]. Consequently, recent efforts have prioritized the development of improved ignition strategies, including high-energy ignition, multi-point ignition, and fuel blending [5,6].
Plasma technology is rapidly evolving and has been employed across various fields, including healthcare, manufacturing, agriculture, and aerospace. In particular, plasma-assisted combustion has emerged over the past twenty years as a highly promising approach, demonstrating a strong ability to enhance combustion efficiency, reduce emissions, and improve fuel reforming processes [7,8,9,10]. The high-energy electrons and reactive species present in plasma promote the dissociation and ionization of reactants and drive electron excitation processes [11]. As a result, plasma produces abundant high-energy electrons, ions, and excited-state particles that facilitate chemical reactions, thereby enabling rapid ignition and accelerated combustion of the mixture [12]. When applied to the ignition and combustion of ammonia gas, plasma provides higher ignition energy compared to conventional spark plug systems. Furthermore, plasma discharge serves as an effective means of enhancing combustion performance while simultaneously reducing nitrogen oxide (NOX) emissions [13]. Therefore, plasma technology presents a dual advantage for ammonia fuel by simultaneously improving combustion efficiency and reducing NOX emissions [14,15].
To enhance ignition efficiency, reliability, and combustion stability under harsh engine conditions, researchers have extensively investigated plasma-based ignition systems. Sraishi et al. developed a corona discharge plasma igniter, which was shown to deliver higher energy output compared to conventional spark plugs and enable stable combustion even under lean fuel conditions [16,17]. In another study, Bulat et al. examined the ignition of a propane/air mixture in both subsonic and supersonic flows, with and without plasma assistance. Their results indicated that plasma streamer discharge generates multiple ignition kernels, facilitating rapid ignition and extending the stable ignition limit [18]. Similarly, Mun Seok Choe et al. designed a plasma jet spark plug and conducted comparative experiments in a constant-volume combustion chamber. Their findings revealed that the plasma jet plug outperformed conventional spark plugs in ignition performance, flame propagation, and flame velocity [19]. Jia et al. evaluated a sliding arc plasma igniter under simulated low-temperature, low-pressure, and high-altitude conditions. Their results demonstrated an approximately 67% extension of the lean burn limit compared to standard spark plugs [20]. You et al. examined how electrode gap size influences the structure of a plasma jet. They observed that a larger gap expands the high-temperature core region and intensifies the jet, but an excessively wide electrode gap leads to significant energy dissipation, adversely affecting the service life and compromising ignition reliability of the plasma generator [21].
Previous studies have demonstrated that plasma-assisted combustion can significantly accelerate ignition, extend the lean flammability limit, and improve combustion stability. However, under practical operating conditions, plasma generation remains challenged by component erosion induced by high thermal loads, as well as strong sensitivity to gas flow rate, igniter configuration, and power supply characteristics. Moreover, most existing studies have focused on atmospheric-pressure operation or simplified discharge systems, resulting in a limited understanding of plasma-assisted ignition under higher-pressure conditions.
In contrast to previous studies, this work systematically investigates the effect of pressure on discharge behavior, spectral characteristics, and exhaust emissions under flowing conditions. The results provide direct experimental evidence of how pressure influences plasma stability and energy transfer in an ammonia ignition system. These findings offer practical insights into the coupling among pressure, flow, and plasma discharge, and are intended to support the performance optimization of plasma jet igniters for high-pressure ammonia combustion applications.
2. Materials and Methods
Figure 1a illustrates the schematic of the plasma jet ignitor experimental system. The plasma igniter was powered by a continuous high-voltage supply operating at 20 kHz. Ammonia and air were supplied from their respective cylinders, with their mass flow rates precisely metered and controlled by mass flow controllers (Beijing Jingliang Co., Beijing, China, ACU10FD–LC and ACU10FD–MC). An 8-channel spectrometer (Avantes BV, Apeldoorn, The Netherlands, AvaSpec–ULS2048) was employed to obtain the optical emission spectrum. The voltage and current signals of the igniter during operation were recorded and stored by the oscilloscope (RIGOL Technologies Co., Beijing, China, DHO4804). H2, NH3, and NOX emissions in the exhaust were monitored with a dedicated hydrogen analyzer (Shanghai Xiyu Equipment Co., Shanghai, China, SKY6000–XYH2S) and a flue gas analyzer (ECOM GmbH, Iserlohn, Germany, ECOM–EN3).
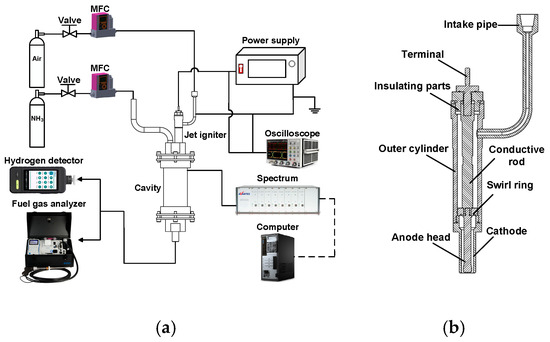
Figure 1.
(a) Experimental setup; (b) plasma-assisted ammonia jet flame ignitor.
A detailed view of the laboratory-developed plasma-assisted ammonia jet flame ignitor is presented in Figure 1b. The device consists of a terminal, sealing gaskets, an insulating component, a conductive rod, a swirl ring, an outer cylinder, an intake pipe, an anode head, and a cathode. The intake pipe is fixed to the outer wall of the igniter by welding. The components are mainly matched by threads, and gaskets are used to achieve sealing. The insulating part material is polyetheretherketone; the sealing gasket material is polytetrafluoroethylene; the swirl ring is ceramic; and the outer cylinder, intake pipe, and conductive parts are all made of 304 stainless steel.
3. Results
3.1. The Discharge Characteristics of Plasma-Assisted Ammonia Jet Flame Ignitor
The operational stability of a plasma-assisted ammonia jet flame ignitor can be assessed through its discharge characteristics, particularly the evolution of voltage and current over time. Figure 2 presents the typical voltage and current waveforms of the jet igniter under the following operating conditions: a chamber pressure of 0.1 MPa, an air flow rate of 30 SLM, a minimum electrode gap of 2 mm, and a power supply setting of 180 W.
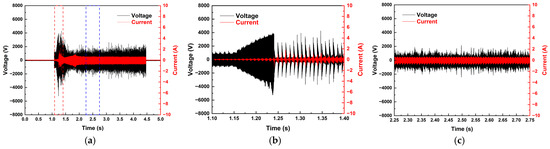
Figure 2.
Typical discharge voltage and current evolution of the plasma-assisted ammonia jet flame ignitor at atmospheric pressure: (a) complete discharge evolution ((b,c) indicate the red and blue dashed regions); (b) breakdown process; (c) arc-sustaining process.
A complete discharge process consists of two stages, namely the electrical breakdown stage and the arc-sustaining stage, as shown in Figure 2b,c. When the plasma power supply is activated, a high AC voltage causes gas breakdown at the narrowest electrode gap, forming an initial arc. This arc is then elongated by the flowing gas, leading to increased impedance and higher energy demand. When the arc length surpasses a critical threshold, beyond the power supply’s sustaining capability, it extinguishes. The process immediately repeats with a new breakdown at the minimum gap, resulting in a periodic, self-sustaining discharge cycle.
3.2. The Effect of Pressure on the Breakdown Process
To evaluate the influence of pressure on the breakdown characteristics, the peak breakdown voltage was measured under different pressure conditions, as shown in Figure 3. It is evident that the breakdown voltage increases monotonically with increasing pressure. At an air flow rate of 10 L/min, the peak breakdown voltage increases from 4.99 kV to 10.67 kV as pressure increases.
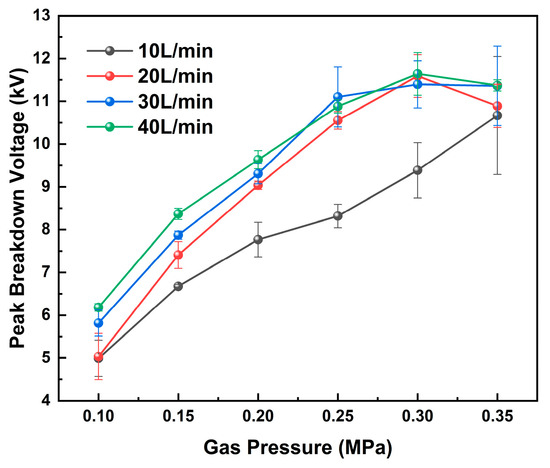
Figure 3.
The effect of pressure on the peak breakdown voltage.
The increasing trend of breakdown voltage with pressure can be explained from the perspectives of electric field intensity and electron collision physics. In gas discharges, the electron mean free path () is commonly given by:
where is the gas number density, and is the effective electron–neutral collision cross section. In the context of gas discharge and plasma analysis, the gas number density can be expressed as follows:
where is the gas pressure, is the Boltzmann constant, and is the gas temperature. By combining Equations (1) and (2), it follows that the electron mean free path is inversely proportional to the gas pressure. As pressure increases, the electron mean free path decreases, thereby reducing the energy gained by electrons between successive collisions. To satisfy the ionization condition, a higher electric field intensity is therefore required, leading to an increase in the breakdown voltage.
This trend is consistent with the qualitative description of Paschen’s law. According to Paschen’s law and streamer discharge theory [22], for a given electrode gap, the breakdown voltage typically exhibits a U-shaped dependence on the product of pressure and gap distance ( value). As the value increases, the breakdown voltage initially decreases, reaches a minimum, and then increases. Paschen’s law expresses the breakdown voltage as follows:
where is the electrode gap distance (2 mm). and are gas-specific constants, and is the secondary electron emission coefficient. For air, the commonly used values of the Paschen constants and are and , and . In the present experiments, the investigated range (200–800 Pa·m) is much greater than the Paschen minimum for air ( Pa·m). The operating conditions fall on the right-hand side of the Paschen curve, where an increasing breakdown voltage with increasing is generally expected, which agrees with the observed trend. Taking an air flow rate of 10 L/min as an example, the breakdown voltage calculated based on Paschen’s law is approximately 8.8 kV at 0.1 MPa and increases to about 28.9 kV at 0.4 MPa. These theoretical values are much higher than the experimentally measured breakdown voltages. This discrepancy can be attributed to several factors. Paschen’s law is derived under the assumption of a uniform electric field and a static gas environment, whereas the present plasma jet ignition configuration involves a highly non-uniform electric field and a strong gas flow. The convective transport associated with the jet flow enhances heat and charged-particle losses, thereby increasing the effective breakdown threshold.
In addition to pressure, the effect of gas flow rate on breakdown voltage was also examined. During the breakdown voltage measurements, the air flow rate was varied from 10 to 40 L/min. The results indicate that the peak breakdown voltage increases with increasing gas flow rate.
As the gas flow rate increases, a distinct shear layer develops between the high-velocity jet core and the surrounding quiescent or low-velocity gas, leading to enhanced velocity gradients and flow instabilities in that region [23,24]. Within the shear-dominated region, the intensified turbulence promotes both thermal convection and the transport of charged and reactive species [25], effectively redistributing the deposited electrical energy over a larger volume. As a result, local gas temperature gradients are reduced, and the plasma channel tends to broaden, causing a more spatial distribution of current density. This process inhibits current constriction and weakens the local electric field enhancement within the discharge channel. Consequently, a higher applied voltage is required to initiate breakdown in order to compensate for the reduced effective ionization efficiency and increased convective losses [26].
3.3. The Effect of Pressure on the Arc-Sustaining Process
To systematically evaluate the arc-sustaining process of the plasma-assisted ammonia jet flame ignitor, voltage–current characteristics were measured at a fixed power supply setting of 180 W and 20 kHz, with chamber pressure varying from 0.1 to 0.4 MPa. Waveforms were recorded over a 100 ms duration using a digital oscilloscope, as summarized in Figure 4.
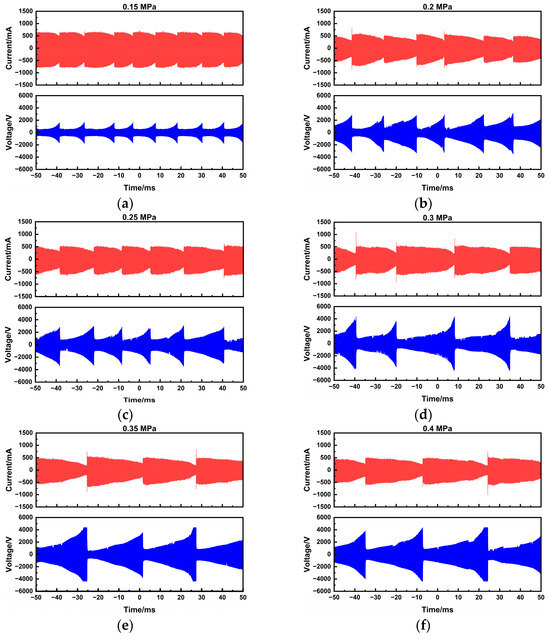
Figure 4.
Discharge voltage and current waveforms of the plasma-assisted ammonia jet flame ignitor under various pressures: (a) 0.15 MPa; (b) 0.2 MPa; (c) 0.25 MPa; (d) 0.3 MPa; (e) 0.35 MPa; (f) 0.4 MPa.
Although the general trends in discharge voltage and current remain consistent with those observed at atmospheric pressure, increasing the chamber pressure raises the gas density. This higher density increases the resistance to arc motion, resulting in a noticeable reduction in the arc sliding speed even at a constant gas flow rate of 10 SLM. Moreover, increased pressure causes arc contraction and enhances energy dissipation, rendering the arc less deformable and more difficult to sustain in motion, which ultimately lowers the sliding frequency. The peak discharge voltage also increases significantly with pressure, rising from 1.8 to 2.2 kV at 0.1 MPa to 3.0–4.5 kV at 0.4 MPa.
Since breakdown voltage is often associated with statistical uncertainty, to characterize the overall trend of discharge voltage and current amid the inherent stochasticity of arc discharge, the average values over a 100 ms discharge duration were calculated using the following formula:
where is the average power, and are the instantaneous voltage and current, and define the discharge interval, and is the recorded discharge duration.
Figure 5 shows the average discharge voltage and current of the plasma jet ignitor under varying pressure and flow conditions. At a flow rate of 10 SLM, the average voltage increases from 360 V to 514 V as pressure rises from 0.1 to 0.4 MPa, while the current decreases from 185 mA to 95 mA. This behavior is consistent with the breakdown process. As pressure increases, the number density of gas molecules rises, shortening the electron mean free path. A shorter mean free path limits the energy electrons gain from the electric field, reducing their ability to ionize gas molecules through collisions. Consequently, a higher voltage is required to sustain the discharge at the same electrode gap.
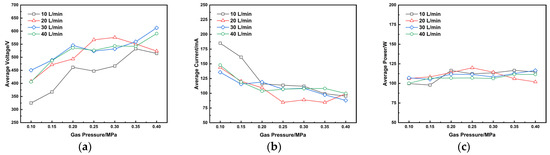
Figure 5.
The effect of pressure on the arc-sustaining process: (a) average discharge voltage; (b) average discharge current; (c) average discharge power of the plasma jet igniter.
The average discharge power at different pressures is illustrated in Figure 4c. It can be observed that during the discharge process, the actual average power remains in the range of 100–120 W, showing no significant dependence on increasing chamber pressure. This is primarily attributable to the output characteristics of the power supply. Throughout the discharge process, the power supply was set to maintain a constant output of 180 W. As the chamber pressure increased, the voltage increased and the current decreased correspondingly, resulting in a roughly constant average discharge power.
3.4. The Effect of Pressure on Spectral Characteristics
The fundamental principle of optical emission diagnostics lies in the photon emission from excited-state particles generated during plasma discharge. Each particle type possesses a unique set of energy levels, resulting in a characteristic “fingerprint” spectrum. Analyzing this emission from a gliding arc discharge, therefore, permits the determination of the plasma’s chemical composition and the states of its constituents, forming a critical basis for probing underlying reaction kinetics and ignition mechanisms.
A typical emission spectrum of the gliding arc discharge under atmospheric pressure is presented in Figure 6. When operating with air as the working gas (without ammonia ignition), the plasma-assisted ammonia jet flame ignitor emission is primarily distributed between 300 nm and 850 nm. The spectral lines within the 350–450 nm range exhibit higher intensity. Characteristic lines from nitrogen species and oxygen atoms are identified, including the Second Positive System N2 (C2Πu → B2Πg) bands at 337.1 nm and 357.8 nm, and the First Negative System of N2+ (B2Σu+ → X2Σg+) at 391.4 nm, and atomic oxygen lines at 777.4 nm and 844.6 nm. As oxygen atoms act as crucial catalysts in combustion, their spectral presence serves as a key indicator for assessing the efficacy of the plasma-assisted ammonia jet flame ignitor. These results demonstrate that plasma-assisted ignition provides a substantial quantity of excited molecules, particles, and free radicals. These highly reactive species facilitate subsequent combustion chemical reactions, thereby enhancing the overall ignition and combustion performance.
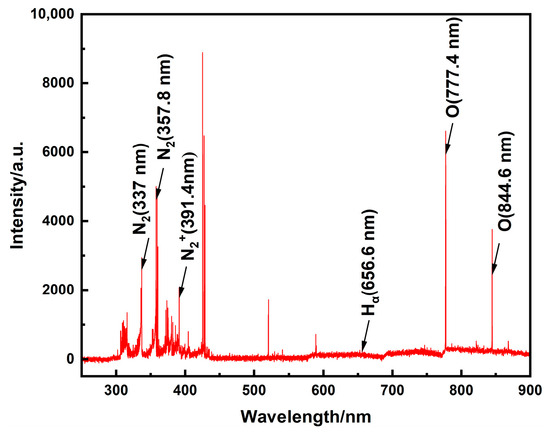
Figure 6.
Emission spectrum of a plasma-assisted ammonia jet flame ignitor under atmospheric pressure.
To investigate the effect of pressure on the emission spectra, measurements were conducted at various pressure conditions with an air flow rate ranging from 10 to 40 SLM. As shown in Figure 7, the emission intensity of oxygen atomic lines declines with increasing chamber pressure. The attenuation is primarily attributed to two factors. First, higher pressure increases gas density, which shortens the electron mean free path and reduces the energy electrons gain from the electric field, thereby decreasing the population of high-energy electrons available for exciting oxygen atoms. Second, the higher gas density promotes collisional quenching of excited oxygen atoms, a non-radiative process that competes with and increasingly dominates over radiative transitions as pressure rises, thus reducing the probability of photon emission.
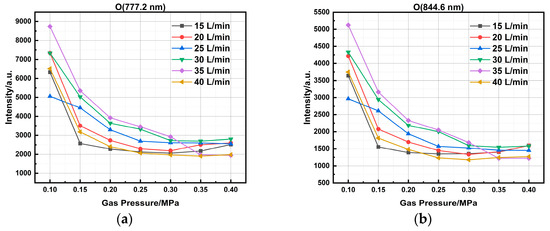
Figure 7.
Variation in the emission intensity of the O characteristic line at different pressure conditions: (a) O characteristic line at 777.2 nm; (b) O characteristic line at 844.6 nm.
The pressure dependence of nitrogen band emission is displayed in Figure 8. Both the emission intensity and the spectral density of nitrogen molecular bands in the 350–450 nm range increase markedly with rising chamber pressure. A quantitative measure is provided by the N2 Second Positive Band at 357.8 nm. The intensity increases from 4027.15 a.u. to 36,008.23 a.u., representing an approximately 8-fold enhancement over the investigated pressure range. Two interrelated mechanisms explain these observations. Firstly, increased gas density enhances the collision frequency between charged particles and neutral N2 molecules, leading to a higher rate of excitation and thus greater emission intensity. Secondly, the same increase in density promotes collisional broadening, which merges adjacent rotational–vibrational lines.
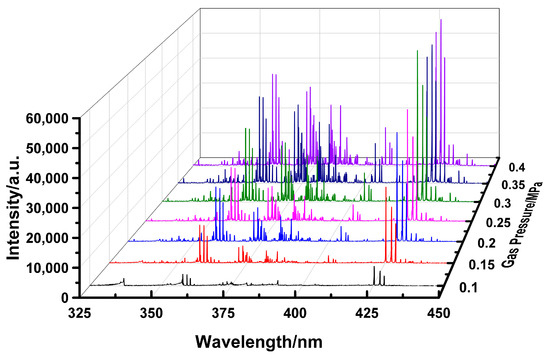
Figure 8.
Variation in characteristic nitrogen molecular spectral lines with pressure.
To assess the practical implications for ignition, spectra were captured during ammonia combustion at φ = 0.6 under various pressures, as shown in Figure 9. Similar to the spectral evolution observed in air discharge, the emission intensities of the oxygen atomic lines at 777.4 nm and 844.6 nm decreased significantly with increasing chamber pressure, while the nitrogen-dominated emission in the 350–450 nm range is simultaneously enhanced. This consistent trend underscores the general influence of pressure on the plasma’s radiative properties, regardless of the presence of ammonia.
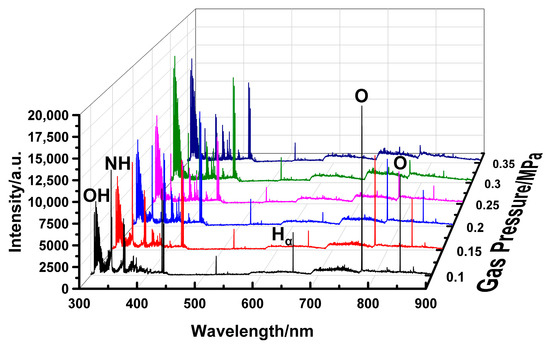
Figure 9.
Emission spectra of ammonia ignited by an igniter under different cavity pressure conditions (φ = 0.6).
The pressure-dependent emission spectra from ammonia combustion at φ = 0.6 are displayed in Figure 9. Analysis focuses on NH and H emission, as these species are direct indicators of ammonia decomposition. As shown in Figure 10, the Hα line is observable only up to 0.25 MPa, beyond which its intensity declines by about 80%. This attenuation is attributed to the excitation mechanism of the Hα line, which originates from the collisional excitation of hydrogen atoms by high-energy electrons. Higher pressure drastically reduces the mean electron energy and the high-energy tail of the electron energy distribution function. Furthermore, the increased gas density promotes collisional quenching of excited H atoms, a non-radiative de-excitation pathway that successfully competes with photon emission, resulting in line broadening and diminished peak intensity. The emission intensity of the NH radical follows a comparable trend, decreasing from 11,628.5 a.u. to 4387.6 a.u. with increasing pressure. This consistent reduction in the signal from both primary decomposition products suggests that higher cavity pressure inhibits the overall ammonia decomposition rate under the studied lean condition.
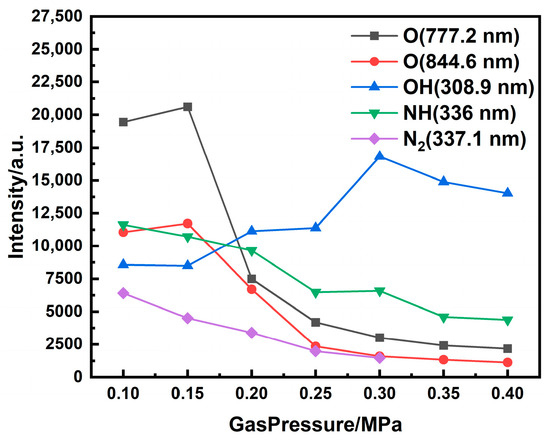
Figure 10.
Spectral line intensities during ammonia ignition vs. chamber pressure (φ = 0.6).
In plasma diagnostics, the electron excitation temperature serves as a crucial indicator of energy exchange efficiency between electrons and heavy particles. The sliding arc plasma generated by the jet igniter, while inherently non-equilibrium, is commonly treated under the local thermodynamic equilibrium (LTE) approximation. Within an LTE region, the population densities of different energy levels obey the Boltzmann distribution [27]:
where subscripts 1 and 2 refer to an upper and a lower energy level, respectively; is population density; denotes the statistical weight; is the level energy; is the Boltzmann constant; and is the excitation temperature to be determined. The measured intensity of a spectral line arising from the transition from level 1 to level 2 is related to the population of the upper level by:
where is the line intensity, is the Planck constant, is the speed of light, is the frequency of emission spectral lines, and is the transition probability. Combining Equations (5) and (6) for two different spectral lines yields a practical formula for calculating the excitation temperature:
Because the working medium in this study was air, the discharge spectrum was rich in nitrogen molecular bands. Consequently, the widely used dual-line method was adopted, utilizing two prominent N2 lines at 337.1 nm and 357.7 nm. The necessary atomic parameters for these lines are summarized in Table 1. It should be clarified that the excitation temperature obtained in this work is a spectroscopic temperature, which characterizes the population distribution of excited atomic states rather than the actual physical temperature of the jet igniter or the bulk gas. The excitation temperature is commonly used as an effective indicator of energy exchange between electrons and heavy particles in non-equilibrium plasmas. The physical temperature of the igniter during operation is generally much lower than the excitation temperature. Therefore, the excitation temperature reported here should be interpreted as a local plasma parameter, rather than the macroscopic thermal temperature of the igniter. Figure 11 displays the calculated electron excitation temperature for different chamber pressures, revealing a pronounced negative correlation. A representative case at an equivalence ratio of 1 shows a decrease from 10,290 K to 1682 K as pressure rises from 0.1 MPa to 0.4 MPa. This significant reduction is attributed to a synergistic effect under elevated pressure. The increased gas density shortens the electron mean free path, limiting the energy electrons can gain from the electric field. Simultaneously, more frequent collisions with neutral species and ions promote rapid energy dissipation. Together, these mechanisms suppress the energy transfer efficiency from electrons to heavy particles, thereby lowering the overall plasma excitation temperature.

Table 1.
Spectral data for nitrogen molecules.
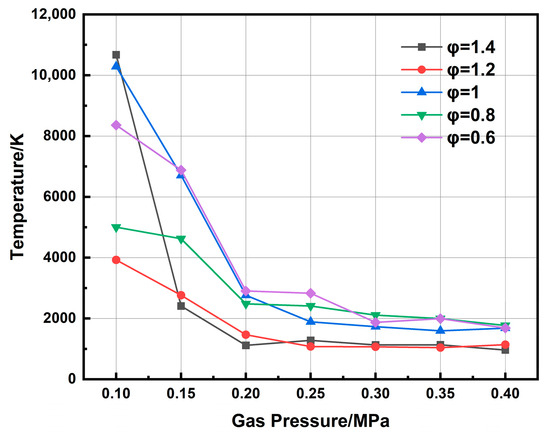
Figure 11.
Effect of pressure on electron excitation temperature.
3.5. The Effect of Pressure on Exhaust Gas Composition
During the plasma-assisted ignition of ammonia, hydrogen is primarily generated through ammonia cracking. The analysis of hydrogen concentration in the exhaust gas reveals the influence of chamber pressure on this process. As shown in Figure 12, hydrogen concentration exhibits different trends depending on the equivalence ratio.
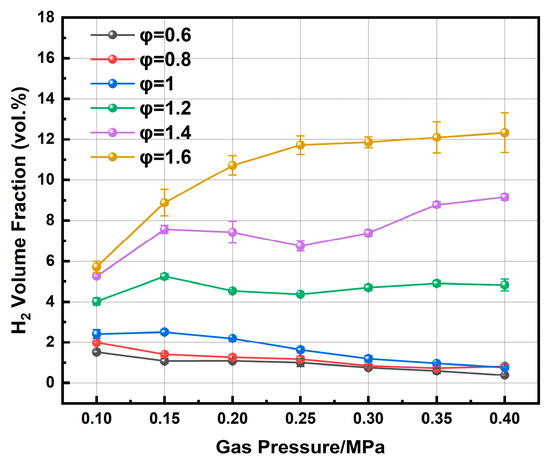
Figure 12.
Effect of pressure on hydrogen concentration.
As summarized in Table 2, the hydrogen yield increases with rising pressure for φ > 1.2. For instance, at φ = 1.6, it rises from 5.73% at atmospheric pressure to 12.33% at 0.4 MPa. At φ = 1.2, the increase is more modest, from 4.02% to 4.82%. This trend can be attributed to enhanced ammonia decomposition under fuel-rich conditions, where the plasma energy is more efficiently diverted to break N-H bonds, resulting in higher H2 yields. Furthermore, the lean-fuel environment reduces competing reactions involving oxygen, such as the oxidation of ammonia, thereby promoting the cracking pathway. Conversely, the hydrogen content slightly decreases with increasing pressure, at φ ≤ 1. This trend may stem from the higher oxygen, which promotes the oxidation of ammonia over its decomposition, consuming NH3 that would otherwise produce H2.
Table 2.
Effect of pressure on H2 concentration under lean and rich conditions during plasma-assisted ammonia ignition.
The exhaust ammonia concentration was measured at equivalence ratios from 0.6 to 1.4 under chamber pressures ranging from 0.10 to 0.35 MPa, as shown in Figure 13. The pressure dependence of NH3 concentration exhibits distinctly different trends depending on the equivalence ratio. Under lean conditions (φ = 0.6 and 0.8), the NH3 concentration generally decreases with increasing pressure, although slight non-monotonic variations are observed at intermediate pressures. The NH3 concentration shows an overall increasing trend with pressure at φ = 1.0, accompanied by local fluctuations. In contrast, the NH3 concentration remains relatively high and increases more markedly at higher pressures under rich conditions (φ = 1.2 and 1.4).
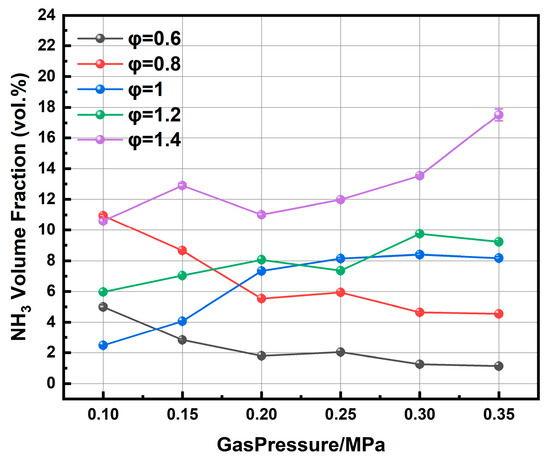
Figure 13.
Effect of pressure on ammonia concentration.
Figure 14 shows that NO concentration decreases markedly with rising pressure at equivalence ratios between 0.6 and 1.6. The concentration of NO in the exhaust gas is closely correlated with that of NH3. However, while NO consistently decreases with increasing pressure at different equivalence ratios, the NH3 concentration exhibits distinct pressure-dependent trends depending on the equivalence ratio.
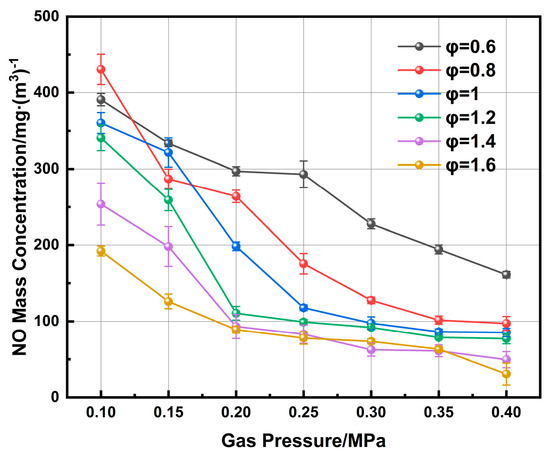
Figure 14.
Effect of pressure on nitric oxide concentration.
The reaction mechanisms involved in this study are illustrated in Figure 15. The influence of pressure on NO formation is primarily attributed to the inhibition of O and OH radical generation under high-pressure conditions [28,29].
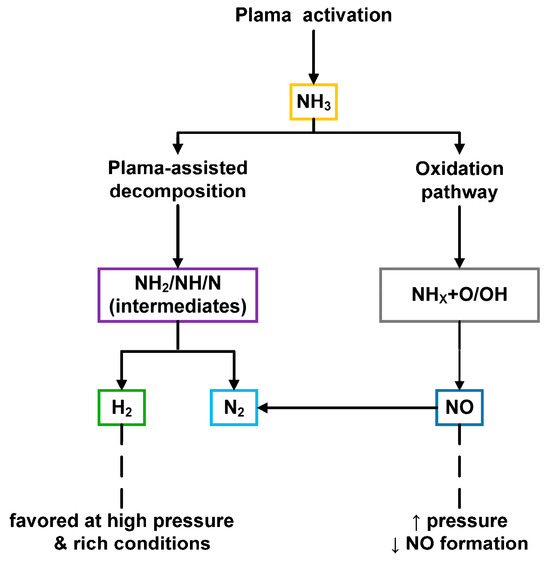
Figure 15.
Schematic of reaction mechanism.
As chamber pressure increases, the gas number density increases, shortening the electron mean free path and reducing the energy gained per collision. This decreases the population of high-energy electrons responsible for generating reactive species such as O and OH. Meanwhile, the higher pressure accelerates three-body reactions (), which enhances the consumption of OH and H radicals and further inhibits NO formation [30,31]. Under lean conditions (φ < 1), although oxygen is abundant, the pressure-induced inhibition of reactive oxygen species limits effective ammonia oxidation, leading to a decrease in NO concentration and a net reduction or slight variation in NH3 with pressure. Near stoichiometric conditions (φ = 1), ammonia decomposition and oxidation pathways compete more directly. Moderate pressure enhances collision frequency and partial activation, whereas further pressure increase intensifies collisional quenching and inhibits oxidative pathways, resulting in a non-monotonic dependence of NH3 on pressure and a continued decline in NO formation. Under rich conditions (φ > 1), oxygen availability is limited and plasma-assisted ammonia decomposition becomes dominant. Increased pressure favors stepwise NH3 activation and stabilization of NHx intermediates while inhibiting O- and OH-driven reactions, thereby reducing NO formation and leading to a slight decrease or even accumulation of unconverted NH3. Overall, the observed pressure effect is governed by electron energy degradation and equivalence-ratio-dependent redistribution of reaction pathways, rather than a simple enhancement of ammonia oxidation.
4. Conclusions
In this study, we designed and developed a plasma jet igniter utilizing a continuous power supply to systematically investigate its effectiveness in promoting ammonia combustion, with particular emphasis on the influence of chamber pressure on discharge characteristics, spectral properties, and exhaust composition. The experimental results provide a comprehensive understanding of the pressure-dependent behavior of the plasma and its interaction with ammonia fuel, leading to the following key conclusions:
(1) Increased chamber pressure reduces the gas flow velocity, leading to a notable decrease in arc sliding frequency. The higher chamber pressure results in increased gas density, which shortens the mean free path of electrons. As a result, electrons acquire less energy during acceleration in the electric field, and collisional ionization with gas molecules becomes more difficult. Therefore, a higher breakdown voltage is required to initiate and sustain the plasma arc at a fixed electrode gap. For example, the peak voltage necessary to sustain the arc increases from 1.8–2.2 kV at atmospheric pressure (0.1 MPa) to 3.0–4.5 kV at 0.4 MPa. In contrast, the current and power are primarily determined by the operational characteristics of the power supply itself and show no increasing trend with pressure.
(2) For a jet igniter using air as the working gas, pressure significantly affects the spectral characteristics of nitrogen molecules and ions. With increasing chamber pressure, the emission intensity and spectral line density of the nitrogen molecular band in the wavelength range of 350 to 450 nm are markedly enhanced. Furthermore, the electron excitation temperature during ammonia ignition, calculated via the dual-line method, demonstrates a decreasing trend as pressure increases.
(3) Measurements of H2 and NO concentrations in the exhaust of the jet igniter reveal distinct trends. H2 concentration increases with increasing chamber pressure under fuel-rich conditions, whereas it decreases under stoichiometric or lean conditions. Meanwhile, NO concentration decreases with increasing pressure under all tested conditions. The NH3 concentration in the exhaust gas exhibits different pressure-dependent trends at different equivalence ratios. It increases with increasing pressure when φ ≥ 1, whereas it decreases as the pressure rises when φ < 1.
In summary, this work demonstrates that plasma jet ignition is a viable approach for enabling ammonia combustion by effectively generating reactive species that enhance chemical reactivity. However, ignition performance is significantly influenced by chamber pressure. These findings offer critical insights into the operational design parameters of plasma igniters, emphasizing the necessity of managing higher voltage requirements and elucidating pressure-dependent reaction pathways for future applications in ammonia-fueled engines. Optimizing igniter design and operational protocols to account for pressure-related effects will be essential to achieve reliable, efficient, and low-emission combustion in practical engine systems.
Author Contributions
Conceptualization, Z.W.; methodology, Z.L., Z.W. and L.C.; software, Y.Z.; validation, Z.L., Z.W. and L.C.; formal analysis, Z.L., Y.L. and Z.W.; investigation, L.C.; resources, L.C.; data curation, J.G. and Z.L.; writing—original draft preparation, Z.L.; writing—review and editing, Z.L., Z.W. and L.C.; visualization, Z.W.; supervision, Q.L. and L.C.; project administration, Q.L. and L.C.; funding acquisition, L.C. All authors have read and agreed to the published version of the manuscript.
Funding
This work is supported by the National Natural Science Foundation of China (T2341001, 12405244), and the independent project of the Energy Research Institute of Hefei Comprehensive National Science Center (Anhui Energy Laboratory; 22KZS304, 22KZS301, and 24KZS301).
Data Availability Statement
The original contributions presented in this study are included in the article. Further inquiries can be directed to the corresponding authors.
Acknowledgments
The authors wish to thank the Institute of Energy, Hefei Comprehensive National Science Center, and Anhui University of Science and Technology.
Conflicts of Interest
The authors declare no conflicts of interest.
References
- Dimitriou, P.; Javaid, R. A Review of Ammonia as a Compression Ignition Engine Fuel. Int. J. Hydrogen Energy 2020, 45, 7098–7118. [Google Scholar] [CrossRef]
- Morlanés, N.; Katikaneni, S.P.; Paglieri, S.N.; Harale, A.; Solami, B.; Sarathy, S.M.; Gascon, J. A Technological Roadmap to the Ammonia Energy Economy: Current State and Missing Technologies. Chem. Eng. J. 2021, 408, 127310. [Google Scholar] [CrossRef]
- Mashruk, S.; Shi, H.; Mazzotta, L.; Ustun, C.E.; Aravind, B.; Meloni, R.; Alnasif, A.; Boulet, E.; Jankowski, R.; Yu, C.; et al. Perspectives on NOX Emissions and Impacts from Ammonia Combustion Processes. Energy Fuels 2024, 38, 19253–19292. [Google Scholar] [CrossRef] [PubMed]
- Mashruk, S.; Kovaleva, M.; Chong, C.T.; Hayakawa, A.; Okafor, E.; Valera-Medina, A. Nitrogen Oxides as a By-Product of Ammonia/Hydrogen Combustion Regimes. Chem. Eng. Trans. 2021, 89, 613–618. [Google Scholar] [CrossRef]
- Lacoste, D.A. Flames with Plasmas. Proc. Combust. Inst. 2023, 39, 5405–5428. [Google Scholar] [CrossRef]
- Kim, W.; Cohen, J. Plasma-Assisted Combustor Dynamics Control at Realistic Gas Turbine Conditions. Combust. Sci. Technol. 2021, 193, 869–888. [Google Scholar] [CrossRef]
- Shah, Z.A.; Mehdi, G.; Congedo, P.M.; Mazzeo, D.; De Giorgi, M.G. A Review of Recent Studies and Emerging Trends in Plasma-Assisted Combustion of Ammonia as an Effective Hydrogen Carrier. Int. J. Hydrogen Energy 2024, 51, 354–374. [Google Scholar] [CrossRef]
- Matveev, I.B.; Serbin, S.I.; Wolf, K. Plasma-Assisted Ammonia Combustion—Part 1: Possibilities of Plasma Combustion of Ammonia in Air and Oxygen. IEEE Trans. Plasma Sci. 2023, 51, 1446–1450. [Google Scholar] [CrossRef]
- Matveev, I.B.; Serbin, S.I. Plasma-Assisted Ammonia Combustion—Part 2: Combustion of Ammonia in Oxygen. IEEE Trans. Plasma Sci. 2023, 51, 2290–2294. [Google Scholar] [CrossRef]
- Matveev, I.B.; Serbin, S.I. Plasma-Assisted Ammonia Combustion—Part 3: Combustion of Ammonia in Air. IEEE Trans. Plasma Sci. 2024, 52, 1157–1161. [Google Scholar] [CrossRef]
- Bao, A.; Lou, G.; Nishihara, M.; Adamovich, I. On the Mechanism of Ignition of Premixed CO-Air and Hydrocarbon-Air Flows by Nonequilibrium RF Plasma. In Proceedings of the 43rd AIAA Aerospace Sciences Meeting and Exhibit, Reno, NV, USA, 10–13 January 2005. [Google Scholar] [CrossRef]
- Ni, G.; Zhao, P.; Cheng, C.; Song, Y.; Toyoda, H.; Meng, Y. Characterization of a Steam Plasma Jet at Atmospheric Pressure. Plasma Sources Sci. Technol. 2012, 21, 015009. [Google Scholar] [CrossRef]
- Wang, Y.; Sun, J.; Liu, Q.; Chen, L.; Gu, M.; Liu, D.; Huang, X.; Wang, S. NOx Formation Mechanism of Plasma Assisted Ammonia Combustion: A Reactive Molecular Dynamics Study. Energy 2024, 293, 130706. [Google Scholar] [CrossRef]
- Tang, G.; Jin, P.; Bao, Y.; Chai, W.S.; Zhou, L. Experimental Investigation of Premixed Combustion Limits of Hydrogen and Methane Additives in Ammonia. Int. J. Hydrogen Energy 2021, 46, 20765–20776. [Google Scholar] [CrossRef]
- Bittencourt, J.A. Waves in Warm Plasmas. In Fundamentals of Plasma Physics; Bittencourt, J.A., Ed.; Springer: New York, NY, USA, 2004; pp. 453–482. ISBN 978-1-4757-4030-1. [Google Scholar]
- Shiraishi, T.; Urushihara, T. Fundamental Analysis of Combustion Initiation Characteristics of Low Temperature Plasma Ignition for Internal Combustion Gasoline Engine; SAE Technical Paper; SAE: Warrendale, PA, USA, 2011. [Google Scholar]
- Shiraishi, T.; Urushihara, T.; Gundersen, M. A Trial of Ignition Innovation of Gasoline Engine by Nanosecond Pulsed Low Temperature Plasma Ignition. J. Phys. Appl. Phys. 2009, 42, 135208. [Google Scholar] [CrossRef]
- Bulat, M.P.; Bulat, P.V.; Denissenko, P.V.; Esakov, I.I.; Grachev, L.P.; Lavrov, P.V.; Volkov, K.N.; Volobuev, I.A. Plasma-Assisted Ignition and Combustion of Lean and Rich Air/Fuel Mixtures in Low- and High-Speed Flows. Acta Astronaut. 2020, 176, 700–709. [Google Scholar] [CrossRef]
- Choe, M.S.; Lee, K.T.; Kim, K.S.; Choi, D.S. Effect of the Plasma Jet Ignition and Flame Kernel Under the Combustion Process in a Constant Volume Combustion Chamber. Int. J. Automot. Technol. 2020, 21, 833–842. [Google Scholar] [CrossRef]
- Jia, M.; Zhang, Z.; Cui, W.; Song, H.; Huang, Z. Experimental Investigation of a Gliding Discharge Plasma Jet Igniter. Chin. J. Aeronaut. 2022, 35, 116–124. [Google Scholar] [CrossRef]
- You, B.; Yang, J.; Liu, X.; Kong, L.; Yan, S.; Zhang, Z. Experimental Research on Dynamic Characteristics of Plasma Ignition Jet. In Proceedings of the ASME Turbo Expo 2020: Turbomachinery Technical Conference and Exposition, Virtual, 21–25 September 2020; American Society of Mechanical Engineers Digital Collection. ASME: New York, NY, USA, 2021. [Google Scholar]
- Dominguez, A. Derivation of the Paschen Curve Law. In ALPhA Laboratory Immersion; Princeton Plasma Physics Laboratory: Princeton, NJ, USA, 2014. [Google Scholar]
- Whalley, R.D.; Walsh, J.L. Turbulent Jet Flow Generated Downstream of a Low Temperature Dielectric Barrier Atmospheric Pressure Plasma Device. Sci. Rep. 2016, 6, 31756. [Google Scholar] [CrossRef]
- Morabit, Y.; Whalley, R.D.; Robert, E.; Hasan, M.I.; Walsh, J.L. Turbulence and Entrainment in an Atmospheric Pressure Dielectric Barrier Plasma Jet. Plasma Process. Polym. 2020, 17, 1900217. [Google Scholar] [CrossRef]
- Liu, F.; Zhang, D.; Wang, D. The Influence of Air on Streamer Propagation in Atmospheric Pressure Cold Plasma Jets. Thin Solid Film. 2012, 521, 261–264. [Google Scholar] [CrossRef]
- Pai, D.Z.; Lacoste, D.A.; Laux, C.O. Nanosecond Repetitively Pulsed Discharges in Air at Atmospheric Pressure—The Spark Regime. Plasma Sources Sci. Technol. 2010, 19, 065015. [Google Scholar] [CrossRef]
- Imran, M.; Rehman, N.U.; Zaka-ul-Islam, M.; Shafiq, M.; Zakaullah, M. Correlation between Excitation and Electron Temperature in 50 Hz Pulsed Ar–O2 Mixture Plasma. Optik 2016, 127, 3312–3315. [Google Scholar] [CrossRef]
- Zhan, H.; Li, S.; Yin, G.; Hu, E.; Huang, Z. Experimental and Kinetic Study of Ammonia Oxidation and NOX Emissions at Elevated Pressures. Combust. Flame 2024, 263, 113129. [Google Scholar] [CrossRef]
- García-Ruiz, P.; Uruén, M.; Abián, M.; Alzueta, M.U. High Pressure Ammonia Oxidation in a Flow Reactor. Fuel 2023, 348, 128302. [Google Scholar] [CrossRef]
- Hayakawa, A.; Goto, T.; Mimoto, R.; Kudo, T.; Kobayashi, H. NO Formation/Reduction Mechanisms of Ammonia/Air Premixed Flames at Various Equivalence Ratios and Pressures. Mech. Eng. J. 2015, 2, 14-00402. [Google Scholar] [CrossRef]
- Cai, T.; Zhao, D.; Gutmark, E. Overview of Fundamental Kinetic Mechanisms and Emission Mitigation in Ammonia Combustion. Chem. Eng. J. 2023, 458, 141391. [Google Scholar] [CrossRef]


Disclaimer/Publisher’s Note: The statements, opinions and data contained in all publications are solely those of the individual author(s) and contributor(s) and not of MDPI and/or the editor(s). MDPI and/or the editor(s) disclaim responsibility for any injury to people or property resulting from any ideas, methods, instructions or products referred to in the content. |
© 2026 by the authors. Licensee MDPI, Basel, Switzerland. This article is an open access article distributed under the terms and conditions of the Creative Commons Attribution (CC BY) license.