Article

Two-Stage Environmental Response of Sporosarcina pasteurii: Stepwise Alkaline–Low-NaCl Exposure and Subsequent Temperature Challenge

1
College of Hydraulic and Civil Engineering, Xinjiang Agricultural University, Urumqi 830052, China
2
Xinjiang Key Laboratory of Hydraulic Engineering Security and Water Disasters Prevention, Urumqi 830052, China
*
Author to whom correspondence should be addressed.
Processes 2026, 14(18), 3003; https://doi.org/10.3390/pr14183003 (registering DOI)
Submission received: 29 July 2026 / Revised: 12 September 2026 / Accepted: 18 September 2026 / Published: 20 September 2026
(This article belongs to the Special Issue Advances in Bioprocess Technology, 2nd Edition)

Abstract

Microbially induced calcium carbonate precipitation (MICP) is influenced by the physiological response of ureolytic bacteria to local environmental backgrounds. This liquid-culture process-screening study examined responses of Sporosarcina pasteurii ATCC 11859 under combined alkaline–low-NaCl backgrounds and elevated temperatures relevant to inland aeolian-sand environments. Cultures were sequentially exposed to five pH-NaCl backgrounds at 30 °C, followed by temperature treatments (35–41 °C) under three selected backgrounds. Cell density (OD600), urease activity, and apparent dry precipitate mass (ADPM), used as an operational dry-residue endpoint, were measured. Temperature, pH–NaCl background, and their interaction significantly affected urease activity and OD600, whereas ADPM showed a significant temperature effect but was not interpreted as quantitative CaCO3 production. A composite analysis indicated that pH 9.3, 1.4‰ NaCl and 35–37 °C represented a coordinated liquid-culture response range. At pH 9.3, 1.4‰ NaCl, and 37 °C, urease activity, OD600, and ADPM were 1.155 mM urea min−1, 1.662, and 1.14 g, respectively. Overall, the identified range provides a practical liquid-culture basis for subsequent sand-tray stabilization tests under aeolian-sand conditions.

1. Introduction

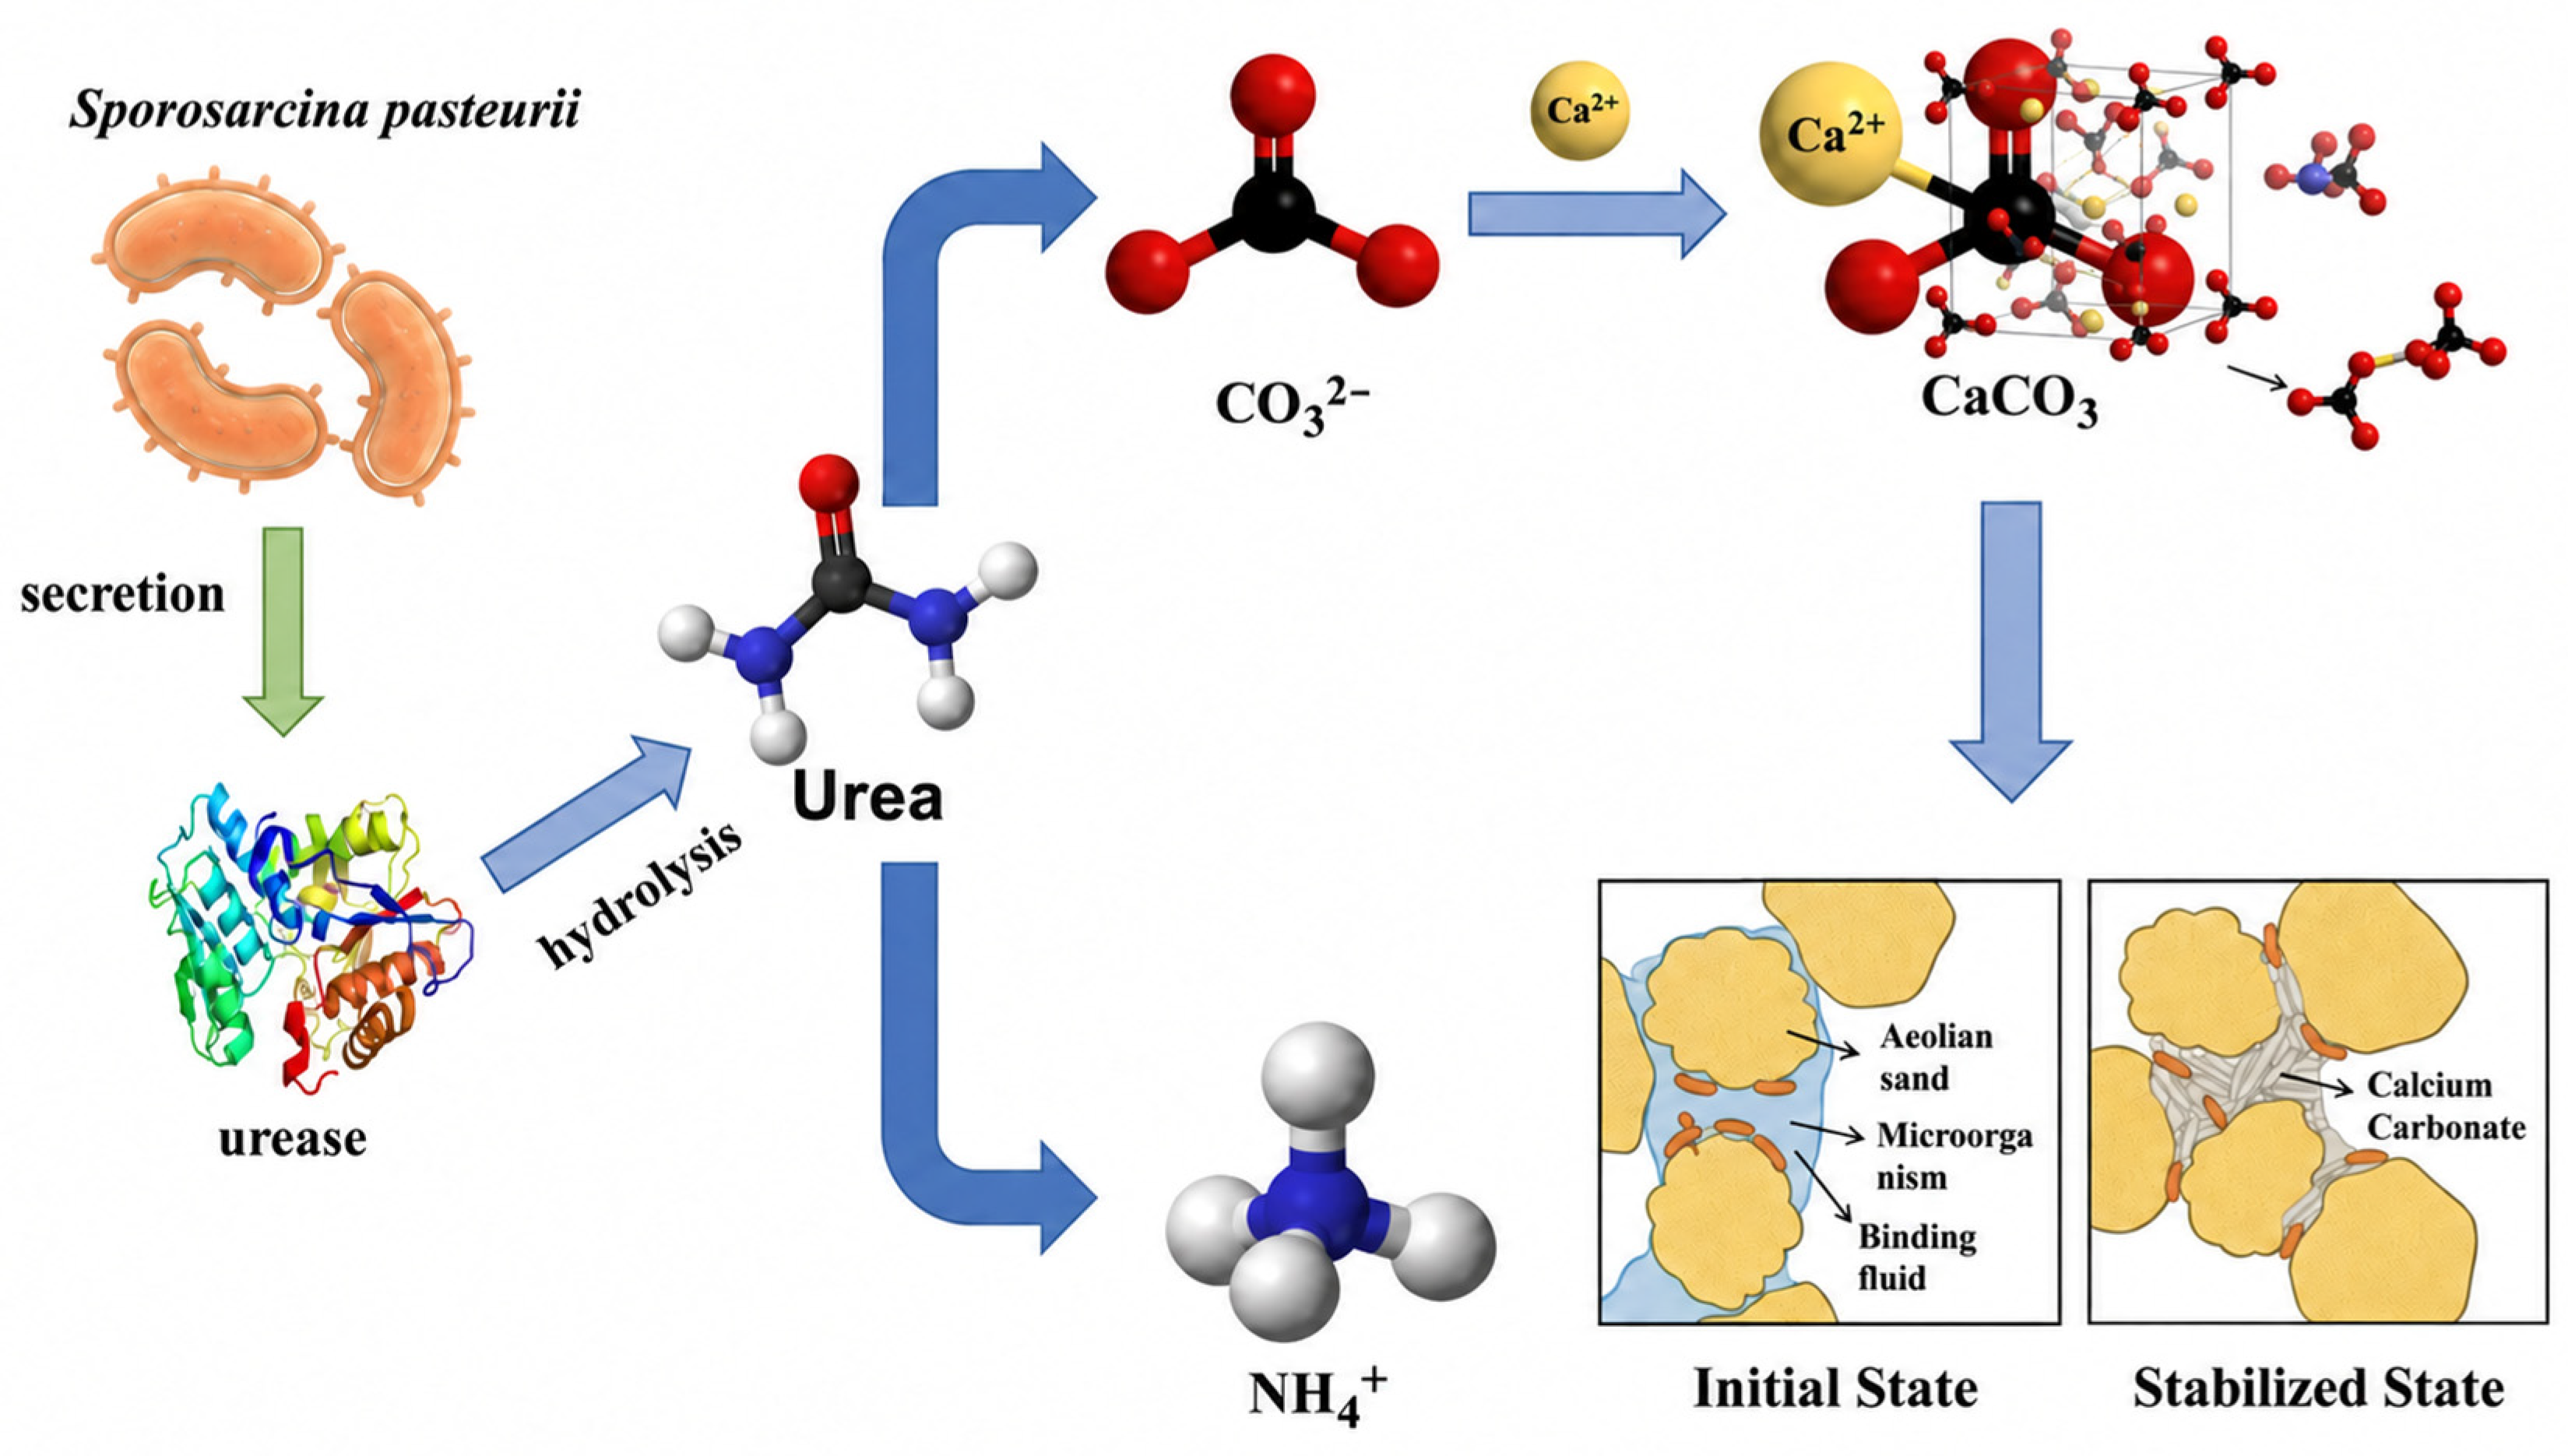
Microbially induced calcium carbonate precipitation (MICP) has emerged as a promising bio-mediated approach for aeolian sand stabilization and desertification control because the precipitated CaCO3 can coat sand grains and form interparticle bridges, thereby improving particle bonding, reducing wind erosion, and enhancing substrate stability [1,2,3,4,5,6]. The primary reaction processes are illustrated in Equations (1) and (2), and the bonding mechanism is detailed in Figure 1. This technology has shown significant potential in engineering applications and desertification control [7,8,9,10,11].
The engineering performance of MICP depends not only on carbonate precipitation itself but also on whether the introduced microorganisms maintain sufficient growth and ureolytic activity under site-specific environmental conditions [12]. The aeolian sands considered in this study are characterized by a moderately alkaline and low-salinity background. According to the environmental data adopted here, the target sands exhibit a pH range of 8.66–9.54 (average: 9.22), salinity of approximately 0.05–1.86‰, and summer daily maximum air temperatures of 28–33 °C [13,14]. Notably, moderate alkalinity and low NaCl do not necessarily represent severe stresses individually for S. pasteurii. Recent screening showed relatively high OD600 and urease activity around pH 9 and 1.75 g/L NaCl, indicating that this range may represent a favorable or transitional physiological window rather than an extreme saline–alkaline condition [15]. These conditions differ from the high-salinity marine environment and strongly alkaline cementitious systems commonly investigated in MICP adaptation studies. However, moderate alkalinity and low NaCl should not necessarily be regarded as severe stresses individually for Sporosarcina pasteurii. Rather, pH and NaCl jointly define the extracellular chemical environment encountered by the cells: pH can influence growth and ureolytic activity, whereas NaCl modifies the ionic and osmotic background. Therefore, the present study focuses on the bacterial response to this site-specific combined chemical background rather than assuming additive or synergistic effects.
Recent studies have begun to extend MICP research beyond extreme saline or alkaline systems. In particular, native ureolytic communities isolated from aeolian sand have recently been evaluated under variations in temperature, alkalinity, and sodium-salt concentration and compared with S. pasteurii [16]. Aeolian-sand studies have demonstrated the feasibility of S. pasteurii-based treatment under moderately alkaline field-relevant conditions [3,4,5], while recent saline–alkaline studies have examined bacterial responses across broader pH and NaCl gradients. At the same time, gradient adaptation has been investigated in seawater, drilling-fluid, and concrete-related environments [17,18,19,20]. Thus, the research gap is not the complete absence of studies under alkaline or relatively low-salinity conditions, but the limited characterization of S. pasteurii within a site-derived alkaline–low-added-NaCl window representative of inland Xinjiang aeolian sand. In particular, few studies have linked such an environmentally targeted chemical background with sequential culture exposure followed by an elevated-temperature challenge. This gap motivated the two-stage screening design adopted in the present study.
Accordingly, this study aimed to characterize the liquid-culture responses of Sporosarcina pasteurii within a site-derived alkaline–low-added-NaCl window representative of Xinjiang aeolian sand, followed by an elevated-temperature challenge. Cell density (expressed as OD600), urease activity, and apparent dry precipitate mass (ADPM) were used to characterize growth, culture-level ureolytic activity, and retained dry-residue response, respectively. ADPM was included as an operational liquid-culture screening endpoint rather than as a quantitative measure of purified CaCO3 production. The objective was to identify a candidate range of coordinated liquid-culture responses within this environmental window and to provide an empirical basis for subsequent sand-scale validation.
CO(NH2)2 + 2H2O → CO32− + 2NH4+
Ca2+ + CO32− → CaCO3

2. Materials and Methods

2.1. Materials

The bacterial strain used in this experiment was Sporosarcina pasteurii (ATCC 11859), obtained from the Shanghai Microbial Culture Collection Center, Shanghai, China. The quantities of reagents for the liquid medium are detailed in Table 1. The pH was adjusted to 8.4 using 1 mol/L NaOH. The medium was then autoclaved at 121 °C and 0.1 MPa for 20 min, cooled, and stored for later use.

2.2. Sequential pH–NaCl Exposure and Liquid-Culture Response Evaluation

This experiment used a two-stage liquid-culture screening design consisting of sequential exposure to combined pH-NaCl backgrounds followed by a temperature–response assessment [20,21]. This design was used to characterize short-term culture-level responses under staged chemical and thermal exposure; it was not intended to demonstrate stable or heritable tolerance enhancement.

2.2.1. Combined pH-NaCl Gradient Exposure (Phase I)

Building upon previous research on the acclimation of Sporosarcina pasteurii to high-alkaline, high-salinity, and seawater environments, and taking into account factors influencing the desert environment of Xinjiang [13,14], a two-stage sequential-exposure design combining pH-NaCl conditioning and temperature assessment was implemented. This procedure exposed the strain sequentially to progressively higher pH and added-NaCl conditions. Studies suggest that gradually increasing environmental pH, salinity, or target medium concentration is more effective in maintaining bacterial viability than abrupt acclimation under a single intense stress condition. Additionally, previous studies have reported that gradual acclimation may help maintain bacterial viability and carbonate precipitation performance under progressively intensified stress conditions. Three independent sequential-exposure culture lines were established from separate inoculations (n = 3). Within each culture line, the culture was transferred successively through Groups 1–5; therefore, measurements obtained at the five pH-NaCl exposure stages were treated as repeated observations from the same culture line. Technical replicate measurements, where performed, were averaged to obtain a single value for each biological replicate before statistical analysis. Technical replicates were not treated as independent experimental units and therefore did not contribute to the sample size or degrees of freedom.
Phase I primarily aimed to characterize the strain response to combined pH-NaCl backgrounds. Adhering to the gradient acclimation approach for selecting mineralizing microorganisms, five sequential pH-NaCl exposure stages were defined at 30 °C (Table 2):
The sequential-exposure procedure was as follows:
Using a seed culture in the logarithmic growth phase as the starter, sequential pH-NaCl exposure was performed at 30 °C and 200 rpm. Specifically, the seed culture was first inoculated into Group 1 for 48 h of cultivation. Following this period, the culture was transferred to Group 2 at a constant inoculum volume for another 48 h. The culture was then sequentially transferred to gradient levels 3 through 5 using the same protocol.
After the cultivation period, OD600, urease activity, and ADPM were measured to characterize relative cell density, culture-level ureolytic activity, and retained dry-residue response, respectively.

2.2.2. Temperature–Response Assessment After pH-NaCl Exposure (Phase II)

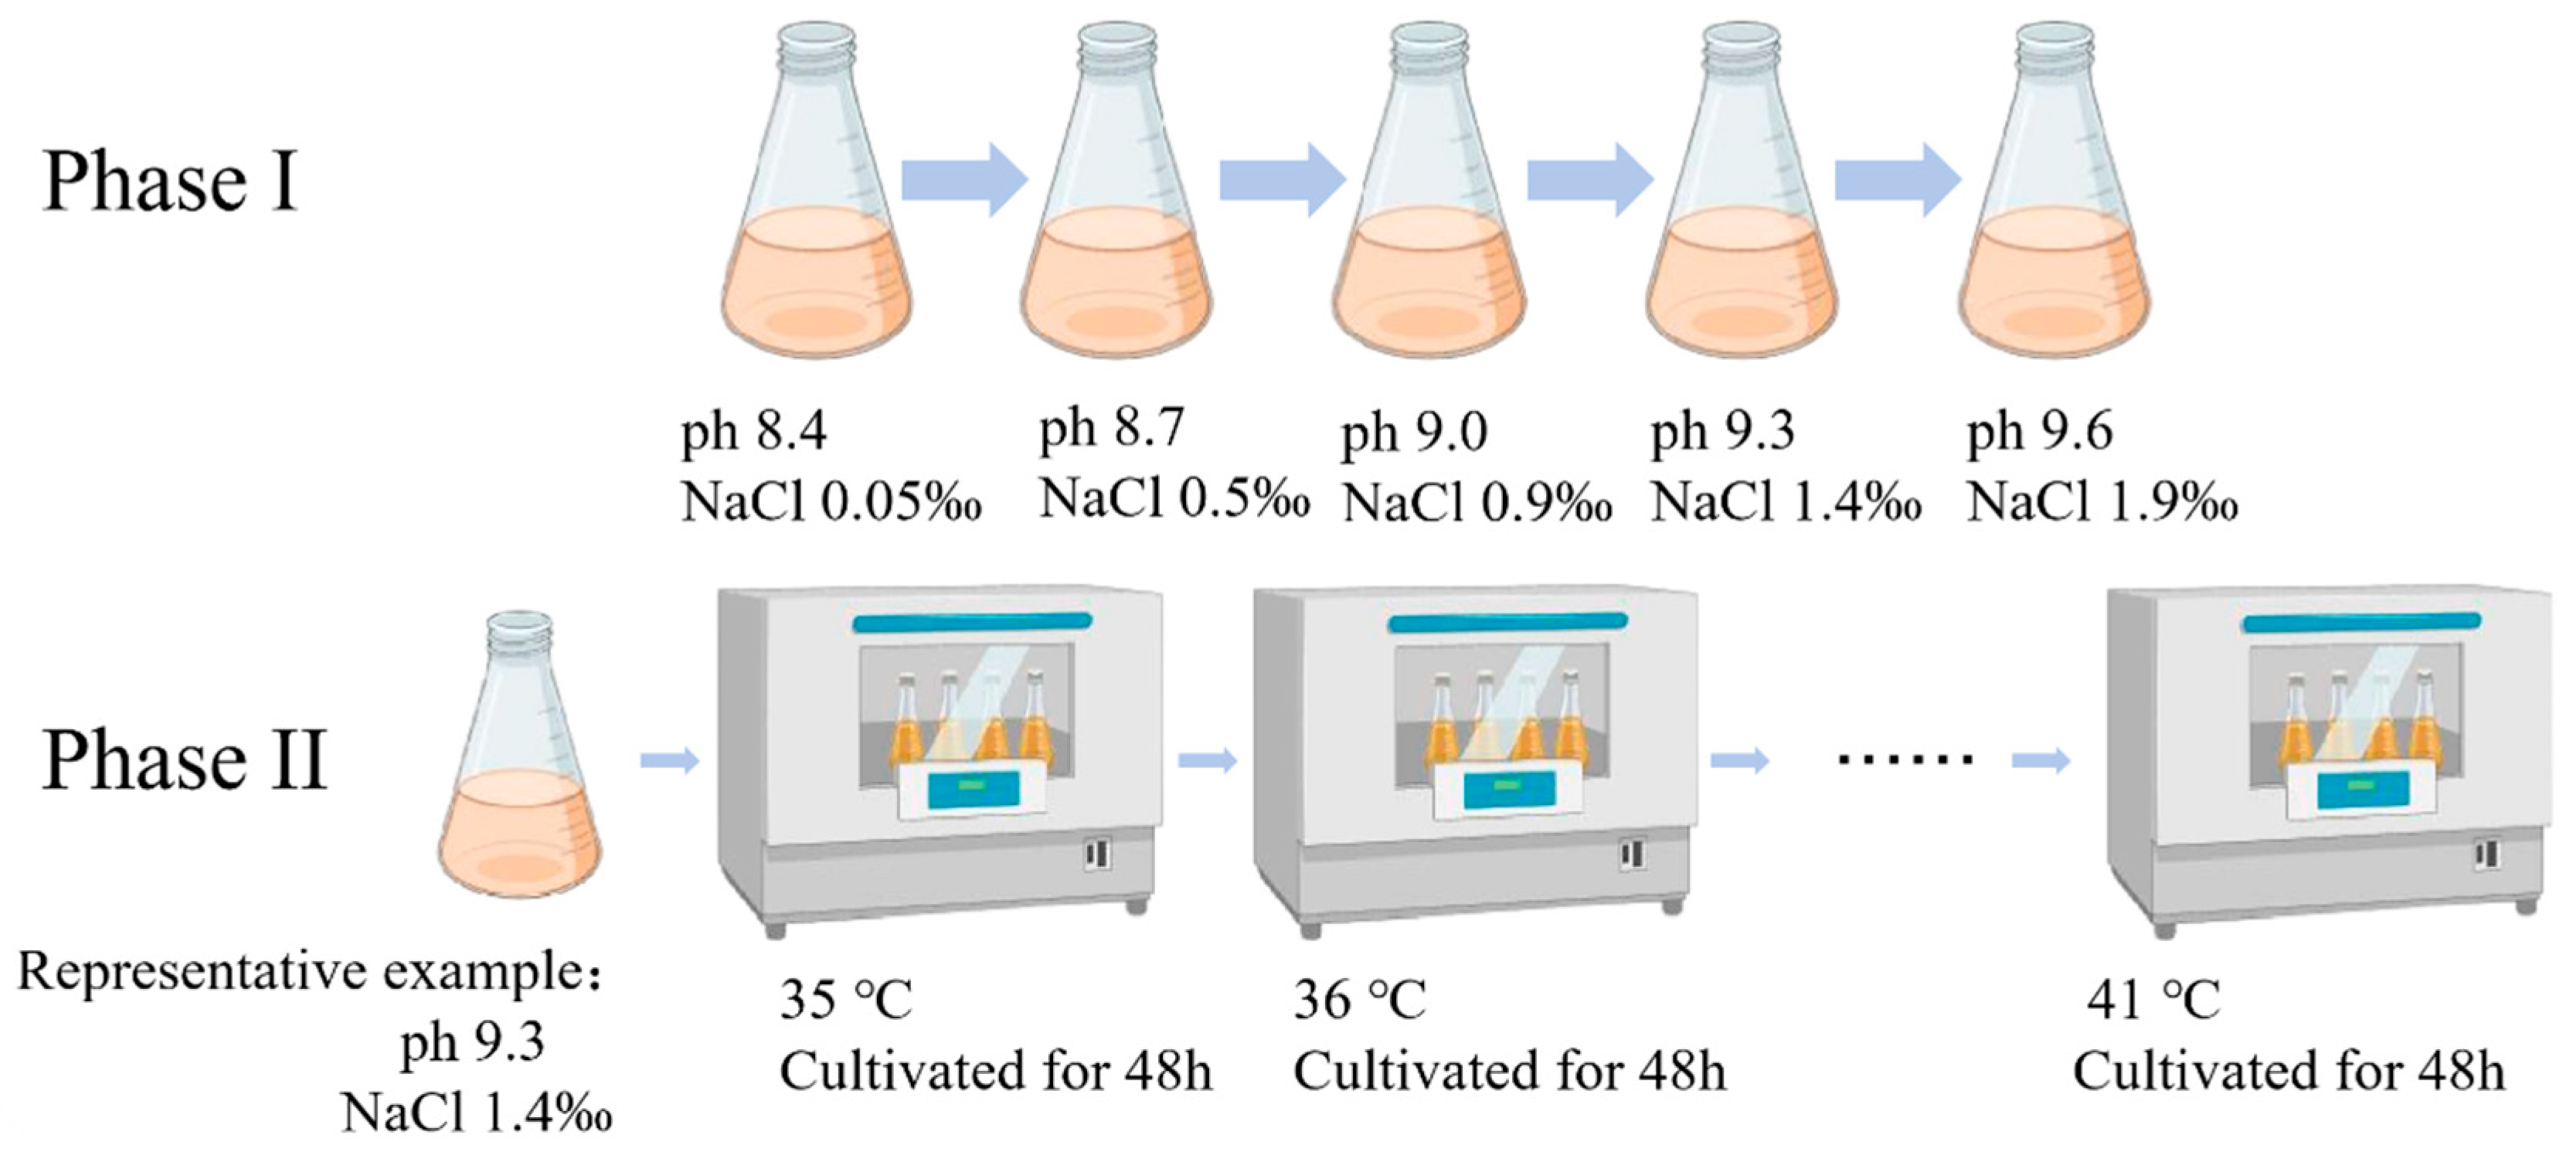
Building on the Phase I pH-NaCl exposure, the three selected groups underwent further temperature–response assessment (Figure 2). Groups 3–5 were selected because their pH values of 9.0–9.6 covered the average and near-upper pH range of the target aeolian-sand environment, whereas the selection was not based solely on the highest Phase I value of any individual response indicator.
Temperature Settings: At three conditions, pH 9.0 + 0.9‰ NaCl, pH 9.3 + 1.4‰ NaCl, and pH 9.6 + 1.9‰ NaCl, seven incubation temperatures were set: 35, 36, 37, 38, 39, 40, and 41 °C. Although the reported summer daily maximum air temperature of the target aeolian-sand region is approximately 28–33 °C, air temperature does not fully represent the thermal environment experienced at an exposed desert surface. Field observations in the Gurbantunggut Desert of Xinjiang have shown that solar-heated sandy surfaces can reach substantially higher temperatures than the overlying air, with maximum surface temperatures exceeding 50 °C under summer conditions. Therefore, the range of 35–41 °C was selected as an elevated-temperature challenge to examine the thermal response boundary of the strain under conditions potentially relevant to strongly heated near-surface desert environments. The constant-temperature treatments were not intended to reproduce the natural diurnal temperature cycle of aeolian sand [22].
Temperature Treatment: The culture obtained from each corresponding Phase I condition was used as the seed stock. A 2 mL aliquot was inoculated separately for each temperature condition and incubated at 200 rpm for 48 h under constant-temperature shaking.
Parameter Monitoring: At the end of the cultivation period, OD600, urease activity, and ADPM were measured. Temperature–response curves were plotted to characterize the effects of temperature on OD600, urease activity, and the operational ADPM response under the different pH–NaCl backgrounds.

2.2.3. Urease Activity Assay

Sporosarcina pasteurii, employed in this experiment, produces urease as part of its metabolic process. Urease catalyzes the hydrolysis of urea into NH4+ and CO32−, which can increase the solution conductivity. This conductivity-based assay was therefore used as a culture-level ureolytic activity indicator rather than as a direct measure of intracellular enzyme content.
① For each assay, 2 mL of bacterial suspension was transferred into a sterile beaker, followed by the addition of 18 mL of 1.1 mol/L urea solution prepared by dissolving 6.6 g of urea in 100 mL of distilled water.
② After the mixture had equilibrated at 25 °C, conductivity was recorded at 0 and 5 min using a conductivity meter, with conductivity expressed in mS cm−1. The mean conductivity increase rate was calculated as
Mean   conductivity   increase   rate   ( mS   cm 1   min 1 ) = E C 5 min E C initial 5
R EC = EC 5 EC 0 5
where EC0 and EC5 are the conductivity values measured at 0 and 5 min, respectively, and REC is the mean conductivity increase rate expressed in mS cm−1 min−1. Urease activity was then calculated following the conductivity-based method reported by Konstantinou et al. [23], in which the conductivity change is converted to the amount of hydrolyzed urea using an empirical coefficient of 11.11:
UA = REC × 11.11
Therefore,
UA = EC 5 EC 0 5 × 11.11
where UA is expressed as mM urea hydrolyzed min−1. The coefficient 11.11 represents the empirical conversion between conductivity change and urea hydrolysis.

2.2.4. Determination of Apparent Dry Precipitate Mass (ADPM)

Apparent dry precipitate mass (ADPM) was determined using a gravimetric liquid-culture procedure adapted from the approach reported by Xiao et al. [20], in which a Sporosarcina pasteurii suspension was reacted with cementation solution and the recovered solid was subsequently oven-dried and weighed. In the present study, ADPM was defined operationally as the total dry residue retained after removal of the reaction supernatant. Because no post-reaction washing step or Ca-free bacterial-background correction was included in the original experimental protocol, ADPM may contain biomineral-associated solids together with bacterial biomass, cellular debris, residual culture-medium constituents, and residual reaction reagents. Accordingly, ADPM was used only as a comparative liquid-culture dry-residue endpoint and was not interpreted as quantitative pure CaCO3 production or biomineralization efficiency.
① Dry-solid formation reaction: A 10 mL aliquot of bacterial suspension was transferred into a reaction vessel and mixed with 10 mL of cementation solution. The mixture was sealed and allowed to react for 24 h at the designated experimental temperature.
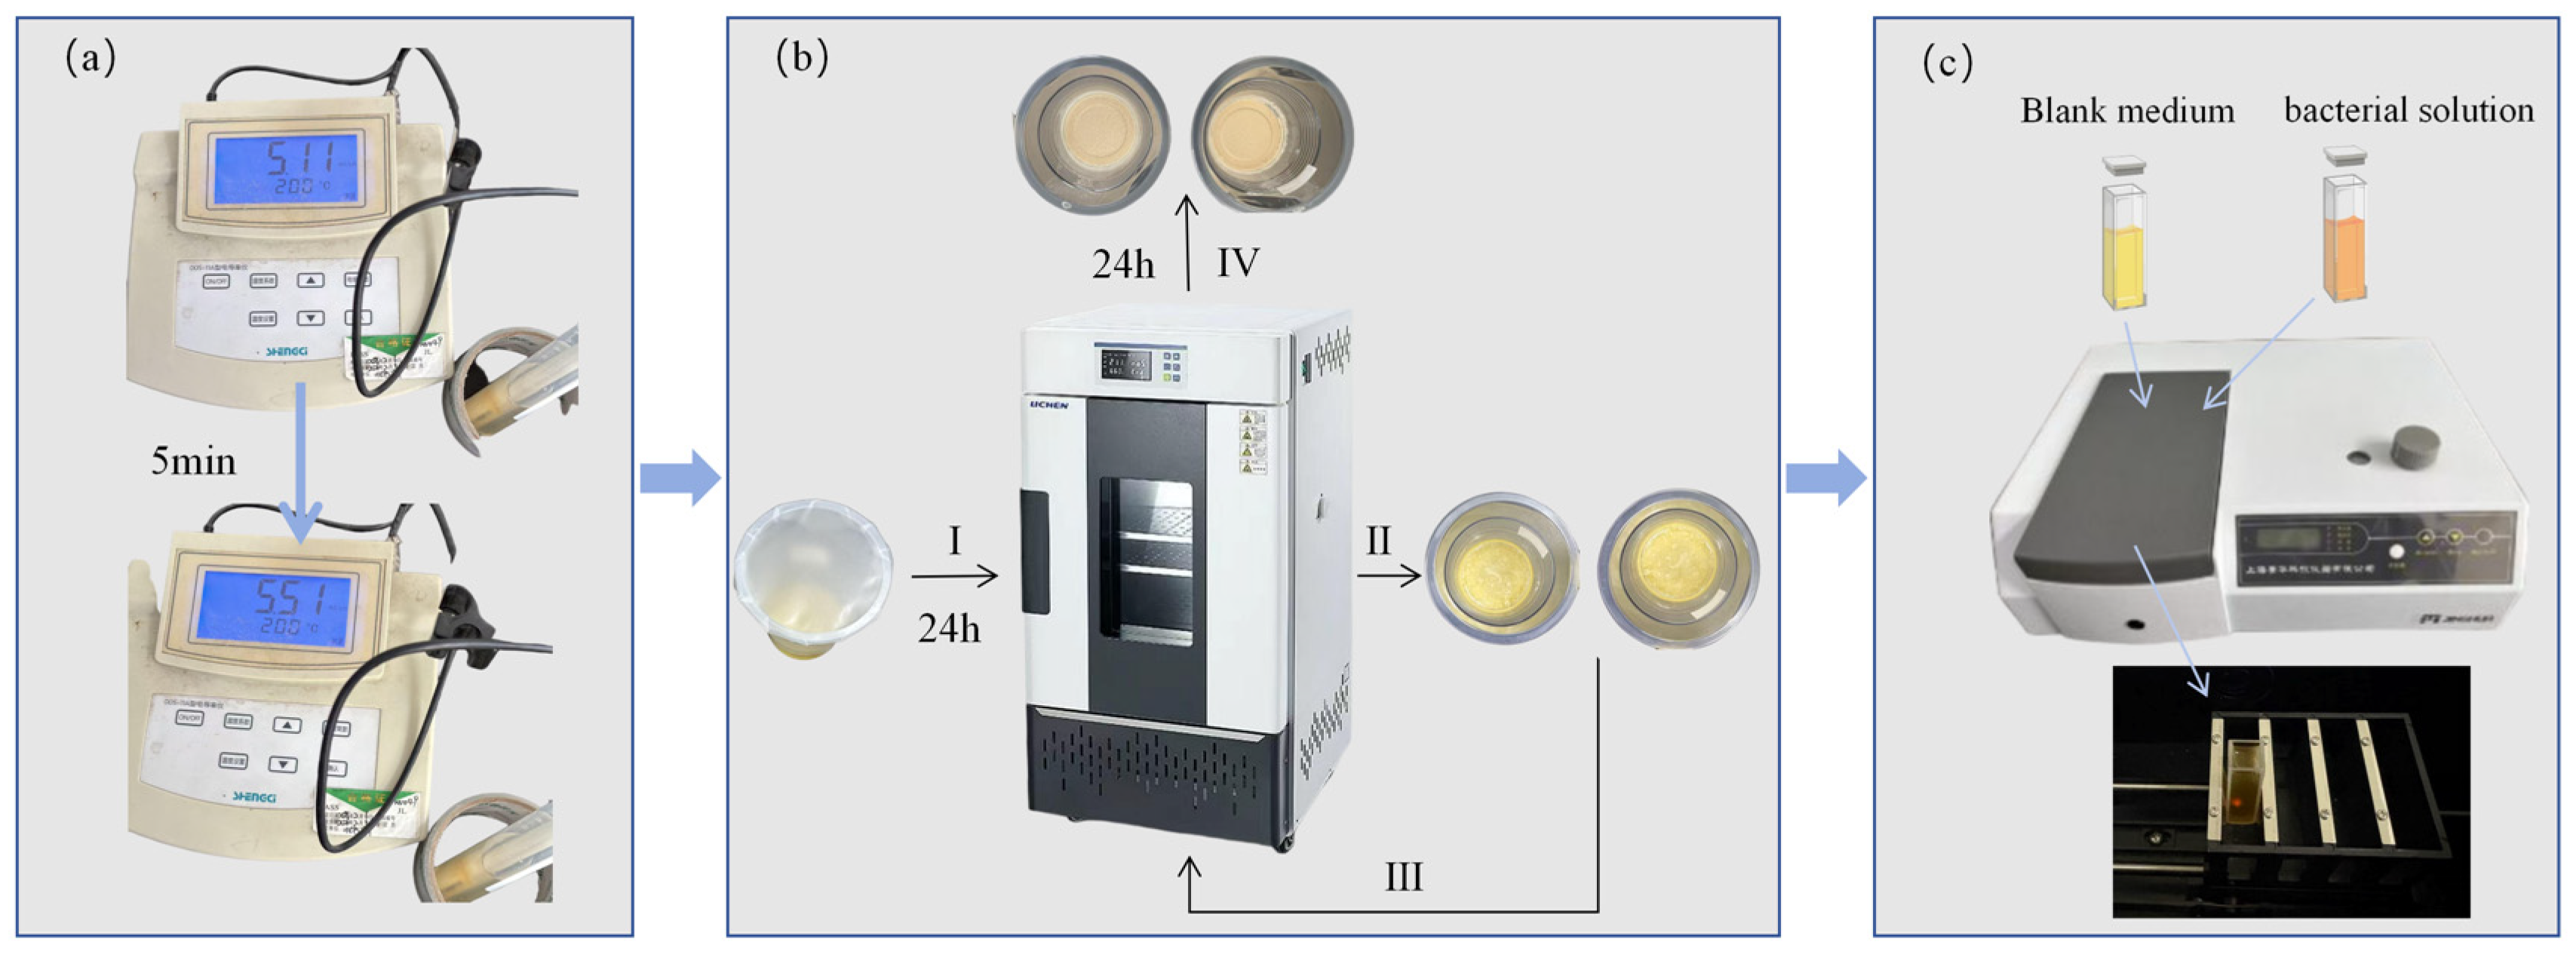
② ADPM determination: After the reaction period, the supernatant was carefully decanted from the reaction vessel without an additional washing step. The remaining wet residue, together with the reaction vessel, was maintained in a temperature-controlled oven for 24 h at the temperature corresponding to each experimental treatment. Thus, the drying temperature was 30 °C for all Phase I samples and 35–41 °C for the corresponding Phase II temperature treatments (Figure 3b). The vessel containing the residual solids was subsequently weighed, and ADPM was calculated as
ADPM = m1 − m0
where m1 is the mass of the reaction vessel containing the residual solids after the 24 h temperature-controlled drying period and m0 is the initial mass of the empty reaction vessel. The gravimetric procedure was adapted from the previously reported liquid-culture MICP approach [20].

2.2.5. OD600 (Relative Cell Density) Measurement

As depicted in Figure 3c, this experiment utilized a 721 visible spectrophotometer (Shanghai Jinghua Technology Instrument Co., Ltd., Shanghai, China) to measure the optical density (OD600) of the bacterial suspension at 600 nm. The OD600 measurement primarily reflects turbidity changes due to the scattering and absorption of incident light by suspended cells. Within a specific linear range, OD600 correlates positively with microbial biomass (cell concentration) and serves as an indicator of microbial growth levels.
① Measure the OD600 at 600 nm using the 721 visible spectrophotometer. After powering on the instrument, allow it to warm up for at least 30 min. Set the measurement wavelength to 600 nm and use a 1 cm pathlength cuvette.
② In Transmittance (%T) mode, insert the light-shielding block (or close the optical path) to perform zero calibration, ensuring that the reading is 0%T.
③ Remove the light-shielding block. Using the blank medium as the reference, switch to Absorbance (A) mode to complete the baseline correction (reference reading A = 0, or 100%T in %T mode). Finally, remove the blank medium and insert the bacterial culture for measurement.

2.2.6. Multi-Indicator Coordination and Weighting Sensitivity Analysis

A multi-indicator coordination analysis was conducted using only the 21 Phase II treatments, comprising three pH-NaCl backgrounds and seven temperature treatments [24]. The three Phase I values measured at 30 °C were excluded because they were obtained during the preceding sequential-exposure stage and did not constitute part of the Phase II temperature–response experiment. For each Phase II treatment, three independent culture replicates were established by separate inoculations. Urease activity, OD600, and ADPM were measured independently for each replicate, and the arithmetic mean of the three biological replicates was used in the normalization, entropy-weight calculation, composite scoring, and ranking analysis.
Because urease activity, OD600, and apparent dry precipitate mass (ADPM) had different units and numerical ranges, the data were normalized using min–max normalization:
x ij = x ij min x j max x j min x j
where xij is the mean value of indicator j for treatment i and xij is the corresponding normalized value.
The proportion of treatment i for indicator j was calculated as
p ij = x ij i = 1 m x ij
The information entropy and divergence of each indicator were calculated as
e j = 1 ln m i = 1 m p ij ln p ij
dj = 1 − ej
where m = 21. When pij = 0, the term pijlnpij was defined as zero. The objective entropy weight was then calculated as
w j o = d j j = 1 n d j
where n = 3. The predefined subjective weights for urease activity, OD600, and ADPM were set to 0.20, 0.30, and 0.50, respectively. The comparatively large predefined weight assigned to ADPM was part of the original exploratory multi-indicator screening scheme and should not be interpreted as assigning equivalent weight to quantitative CaCO3 production. Because ADPM is an operational dry-residue endpoint, the resulting composite score was used only to compare coordination among the measured liquid-culture responses rather than to quantify biomineralization efficiency or define an absolute optimum. The combined weight was calculated as
w j α = 1 α w j o + α w j s
where w j o and w j s are the objective and subjective weights, respectively. The primary composite analysis used α = 0.5.
To assess the sensitivity of the treatment ranking to the objective–subjective mixing coefficient, α was varied from 0 to 1 at intervals of 0.1. For each α value, the combined weights and composite scores of all 21 Phase II treatments were recalculated using the unrounded objective weights and the same normalized indicator values:
S i α = j = 1 3 w j α x ij
Treatment rankings were compared across the 11 α values. Ranking stability was evaluated by comparing the highest-ranked treatment and by calculating Spearman rank correlations relative to the ranking obtained at α = 0.5. The composite score was interpreted as supplementary evidence of coordination among the three measured responses rather than as an absolute optimization criterion. The combined weights, top-three rankings, and ranking-stability results are provided in Tables S1–S3 and Figure S1.

2.2.7. Statistical Analysis

All data are presented as the mean ± standard deviation (SD) of three independent biological replicates. The biological replicate, rather than the technical measurement, was treated as the experimental unit throughout the statistical analysis. Where technical replicate measurements were available, they were first averaged within each biological replicate, and only these biological-replicate-level values were entered into the statistical analysis. For Phase I, urease activity, OD600, and ADPM measured at the five sequential pH-NaCl exposure stages were analyzed separately using one-way repeated-measures ANOVA, with exposure stage treated as the within-culture-line factor and the three independent sequential culture lines treated as repeated experimental units. Because sphericity was not assumed, Geisser–Greenhouse correction was applied to the overall tests, followed by Sidak-corrected paired comparisons between exposure stages. For Phase II, the effects of temperature and pH-NaCl background, as well as their interaction, were analyzed separately for urease activity, OD600, and ADPM using ordinary two-way ANOVA. When a significant temperature × pH–NaCl background interaction was detected, simple-effects multiple comparisons were performed using Sidak adjustment. Temperatures were compared pairwise within each pH–NaCl background, and the three pH–NaCl backgrounds were compared pairwise within each temperature. Adjusted p values < 0.05 were considered statistically significant. A p value < 0.05 was considered statistically significant. Statistical analyses were performed using GraphPad Prism 11.

3. Results

3.1. Phase I Responses to the Combined pH-NaCl Gradient (30 °C)

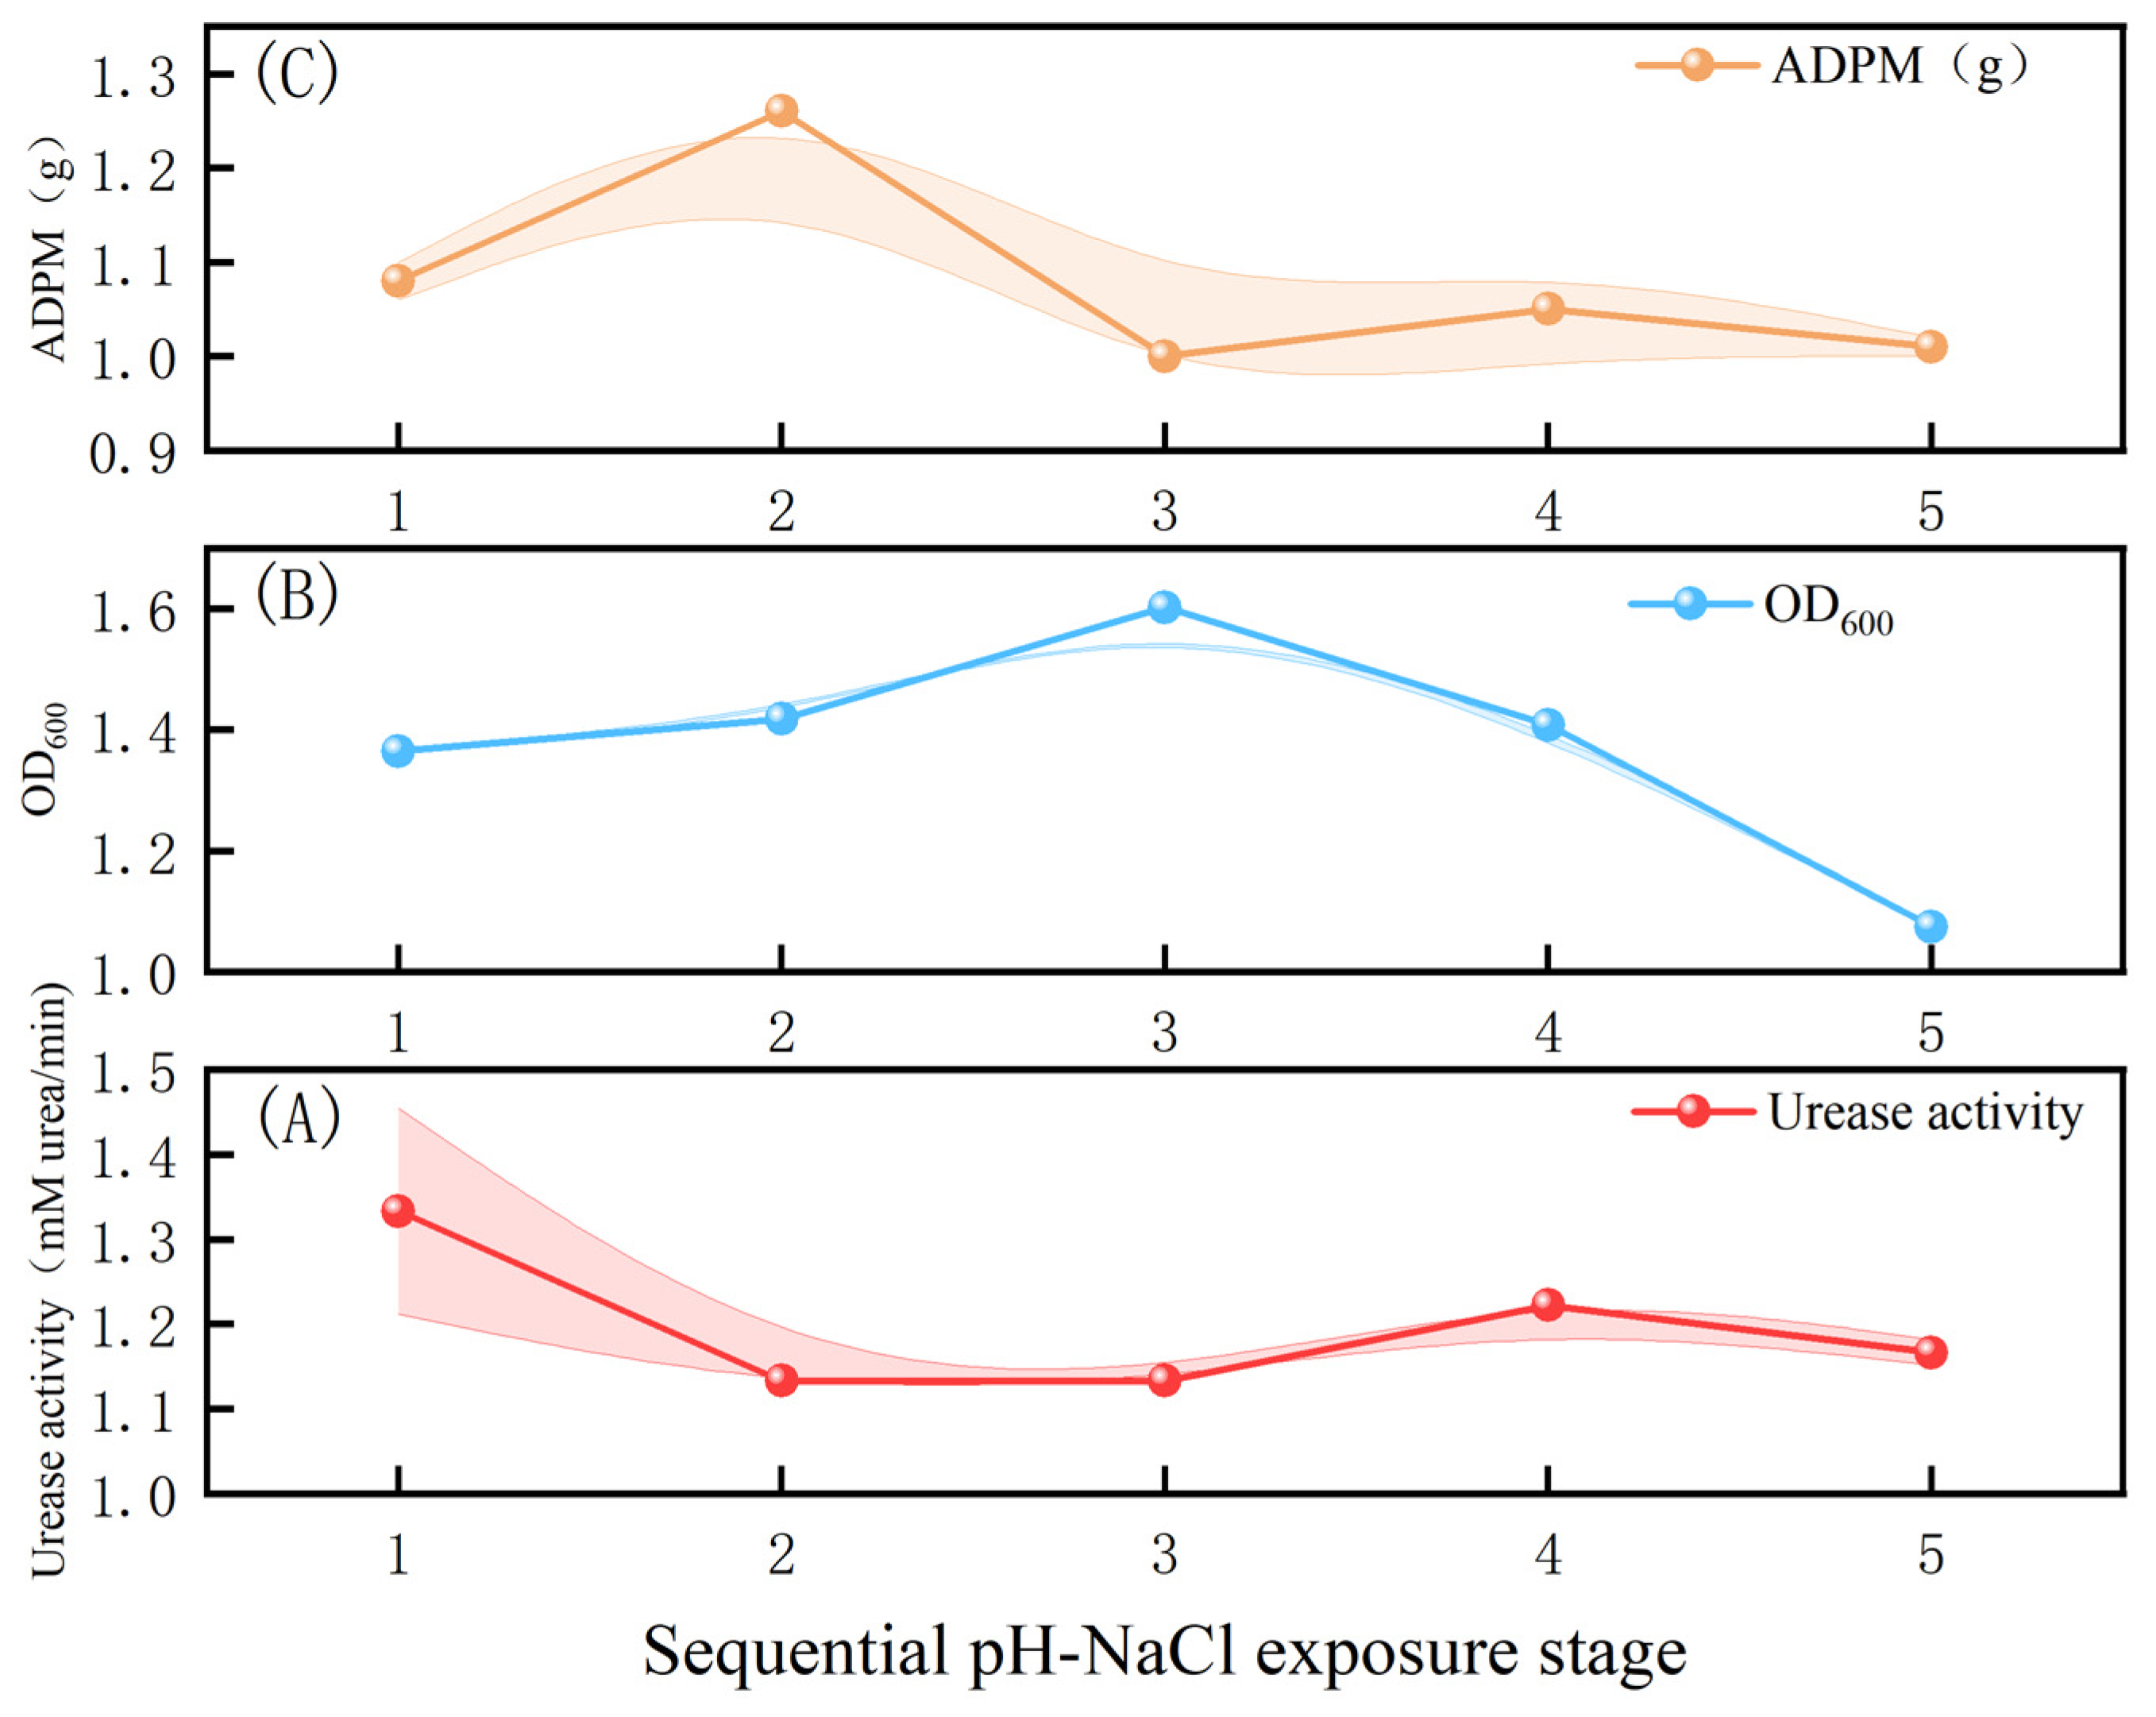
Figure 4 illustrates that during Phase I, urease activity showed its highest mean value in Group 1 (1.3332 mM urea min−1) and remained measurable at the later, higher pH-NaCl exposure stages, with values of 1.2221 mM urea min−1 in Group 4 (pH 9.3, 1.4‰ NaCl) and 1.1666 mM urea min−1 in Group 5 (pH 9.6, 1.9‰ NaCl). These results indicate that, at 30 °C, the strain retained measurable urease activity throughout the five sequential pH-NaCl exposure stages, including at the highest tested condition of pH 9.6 and 1.9‰ NaCl. One-way repeated-measures ANOVA with Geisser–Greenhouse correction showed no significant overall effect of sequential pH-NaCl exposure stage on urease activity (F(1.069, 2.138) = 7.170, p = 0.1085) but significant effects on OD600 (F(1.128, 2.256) = 4015.775, p = 0.0001) and ADPM (F(1.923, 3.847) = 17.117, p = 0.0123).
OD600 peaked at 1.602 in Group 3 (pH 9.0, 0.9‰ NaCl), whereas the mean ADPM in this group was 1.00 g. The numerically highest mean ADPM was observed in Group 2 (1.26 g; pH 8.7, 0.5‰ NaCl). Although the overall effect of sequential exposure stage on ADPM was significant, none of the individual pairwise differences remained significant after Sidak correction. Thus, the numerical maxima of urease activity, OD600, and ADPM occurred at different sequential exposure stages.
Sidak-corrected paired comparisons detected no significant differences in urease activity among the five sequential exposure stages. Overall, the three response variables exhibited different numerical patterns across the sequential exposure stages.
Considering the average pH of the study area (9.22), Groups 3–5 (pH 9.0–9.6) were selected for subsequent temperature–response assessment. This selection prioritized coverage of the dominant alkaline range of the study area, particularly pH 9.0 and 9.3, while also including a near-upper-bound condition (pH 9.6) to assess the reliability of the strain response under more extreme conditions.

3.2. Temperature Responses After Phase I pH-NaCl Exposure

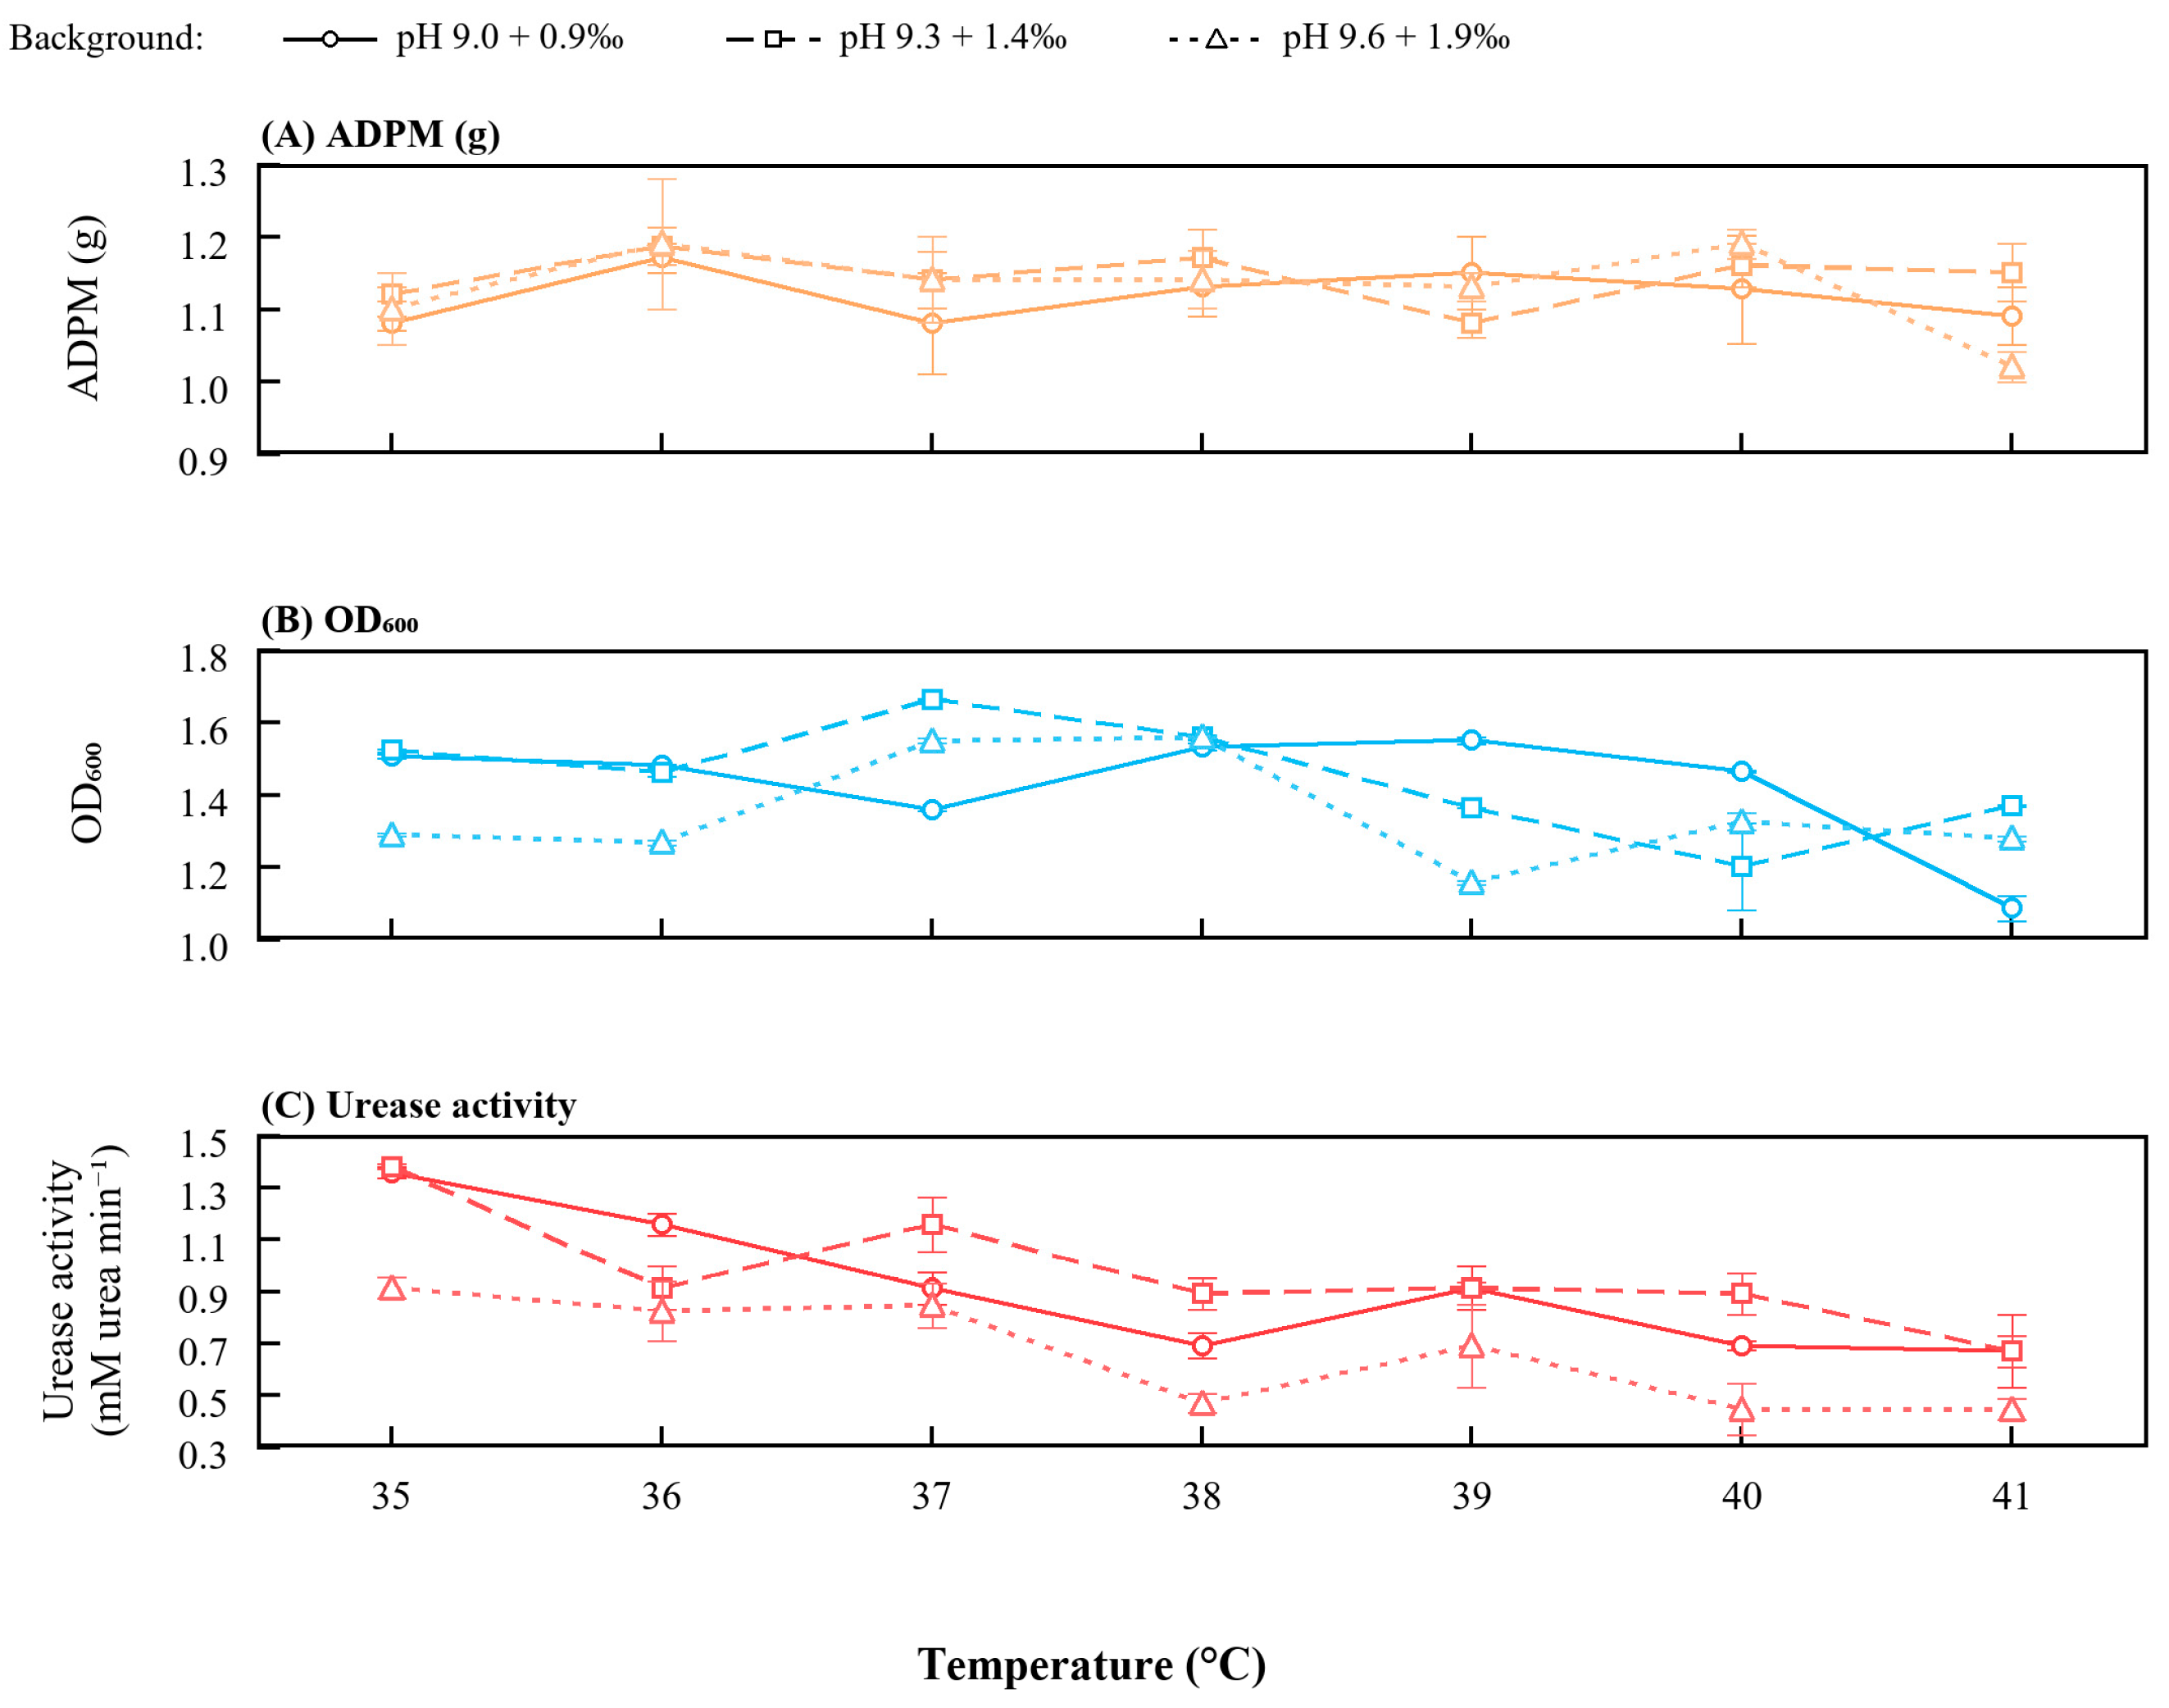
The three selected pH-NaCl backgrounds showed distinct metric-specific responses to the Phase II temperature treatments (Figure 5A–C). Two-way ANOVA indicated significant effects of temperature, pH-NaCl background, and their interaction on urease activity (interaction: F(12,42) = 5.075, p < 0.0001; temperature: F(6,42) = 69.733, p < 0.0001; pH-NaCl background: F(2,42) = 92.894, p < 0.0001). Similar significant effects were observed for OD600 (interaction: F(12,42) = 69.700, p < 0.0001; temperature: F(6,42) = 130.714, p < 0.0001; pH-NaCl background: F(2,42) = 75.543, p < 0.0001). For ADPM, temperature had a significant main effect (F(6,42) = 5.295, p = 0.0004), whereas the main effect of pH-NaCl background was not significant (F(2,42) = 1.802, p = 0.1776). The interaction between temperature and pH-NaCl background did not reach the predefined significance level (F(12,42) = 1.949, p = 0.0554). These results indicate that urease activity and OD600 were more strongly dependent on the combined temperature and pH-NaCl background than ADPM.
Sidak-adjusted simple-effects comparisons further resolved these interactions. For urease activity, under the pH 9.0 and 0.9‰ NaCl background, the 35 °C treatment was significantly higher than the 37–41 °C treatments (adjusted p < 0.001), whereas the difference between 35 and 36 °C was not significant (adjusted p = 0.066). Under pH 9.3 and 1.4‰ NaCl, urease activity at 35 °C was significantly higher than at 36–41 °C, including 37 °C (adjusted p = 0.025). At 37 °C, the pH 9.3 and 1.4‰ NaCl background showed significantly higher urease activity than both pH 9.0 and 0.9‰ NaCl (adjusted p = 0.0013) and pH 9.6 and 1.9‰ NaCl (adjusted p < 0.001).
For OD600, under the pH 9.3 and 1.4‰ NaCl background, the value at 37 °C was significantly higher than at all other tested temperatures (all adjusted p < 0.001). At 37 °C, OD600 also differed significantly among all three pH–NaCl backgrounds, with the highest value occurring at pH 9.3 and 1.4‰ NaCl (all adjusted p < 0.001). In contrast, no significant between-background differences in OD600 were detected at 38 °C (adjusted p > 0.60). Complete Sidak-adjusted pairwise comparisons are provided in Tables S4 and S5.
As shown in Figure 5C, urease activity showed the clearest background-dependent temperature response. Under pH 9.0 and 0.9‰ NaCl, urease activity decreased from 1.355 mM urea min−1 at 35 °C to 0.689 mM urea min−1 at 38 °C, followed by a partial increase at 39 °C. Under pH 9.3 and 1.4‰ NaCl, urease activity was highest at 35 °C (1.378 mM urea min−1), remained relatively high at 37 °C (1.155 mM urea min−1), and then declined at higher temperatures. Under pH 9.6 and 1.9‰ NaCl, urease activity was consistently lower and decreased markedly above 37 °C. These results indicate that the pH 9.3 and 1.4‰ NaCl background better maintained ureolytic activity within the 35–37 °C candidate range.
Figure 5B shows that OD600 responded differently from urease activity. Under pH 9.3 and 1.4‰ NaCl, OD600 reached the highest value observed in Phase II at 37 °C (1.662) and remained relatively high at 38 °C (1.557). Under pH 9.6 and 1.9‰ NaCl, OD600 also increased at 37–38 °C, but this increase was accompanied by lower urease activity (Figure 5C). Therefore, increased cell density under the more alkaline and saline background did not necessarily indicate a correspondingly high ureolytic response.
In Figure 5A, ADPM varied within a narrower range than urease activity and OD600, and its response was mainly temperature-dependent. The pH 9.3 and 1.4‰ NaCl background maintained comparable ADPM values across 35–38 °C, while also supporting relatively high urease activity and OD600 within 35–37 °C. Taken together, the three stacked profiles show that the best-supported condition should not be selected from the maximum of one indicator alone. Instead, pH 9.3, 1.4‰ NaCl, and 35–37 °C represent a coordinated liquid-culture response range for subsequent sand-tray stabilization validation.

3.3. Results of Multi-Indicator Coordination and Weighting Sensitivity Analysis

The entropy-weight analysis assigned objective weights of 0.5045, 0.2912, and 0.2043 to urease activity, OD600, and ADPM, respectively (Table 3). Predefined subjective weights were 0.20, 0.30, and 0.50, respectively. Although ADPM received the largest predefined subjective weight, the composite score was used to describe coordination among measured liquid-culture responses rather than as a stand-alone optimization criterion. At α = 0.5, the combined weights were 0.3523 for urease activity, 0.2956 for OD600, and 0.3522 for ADPM.
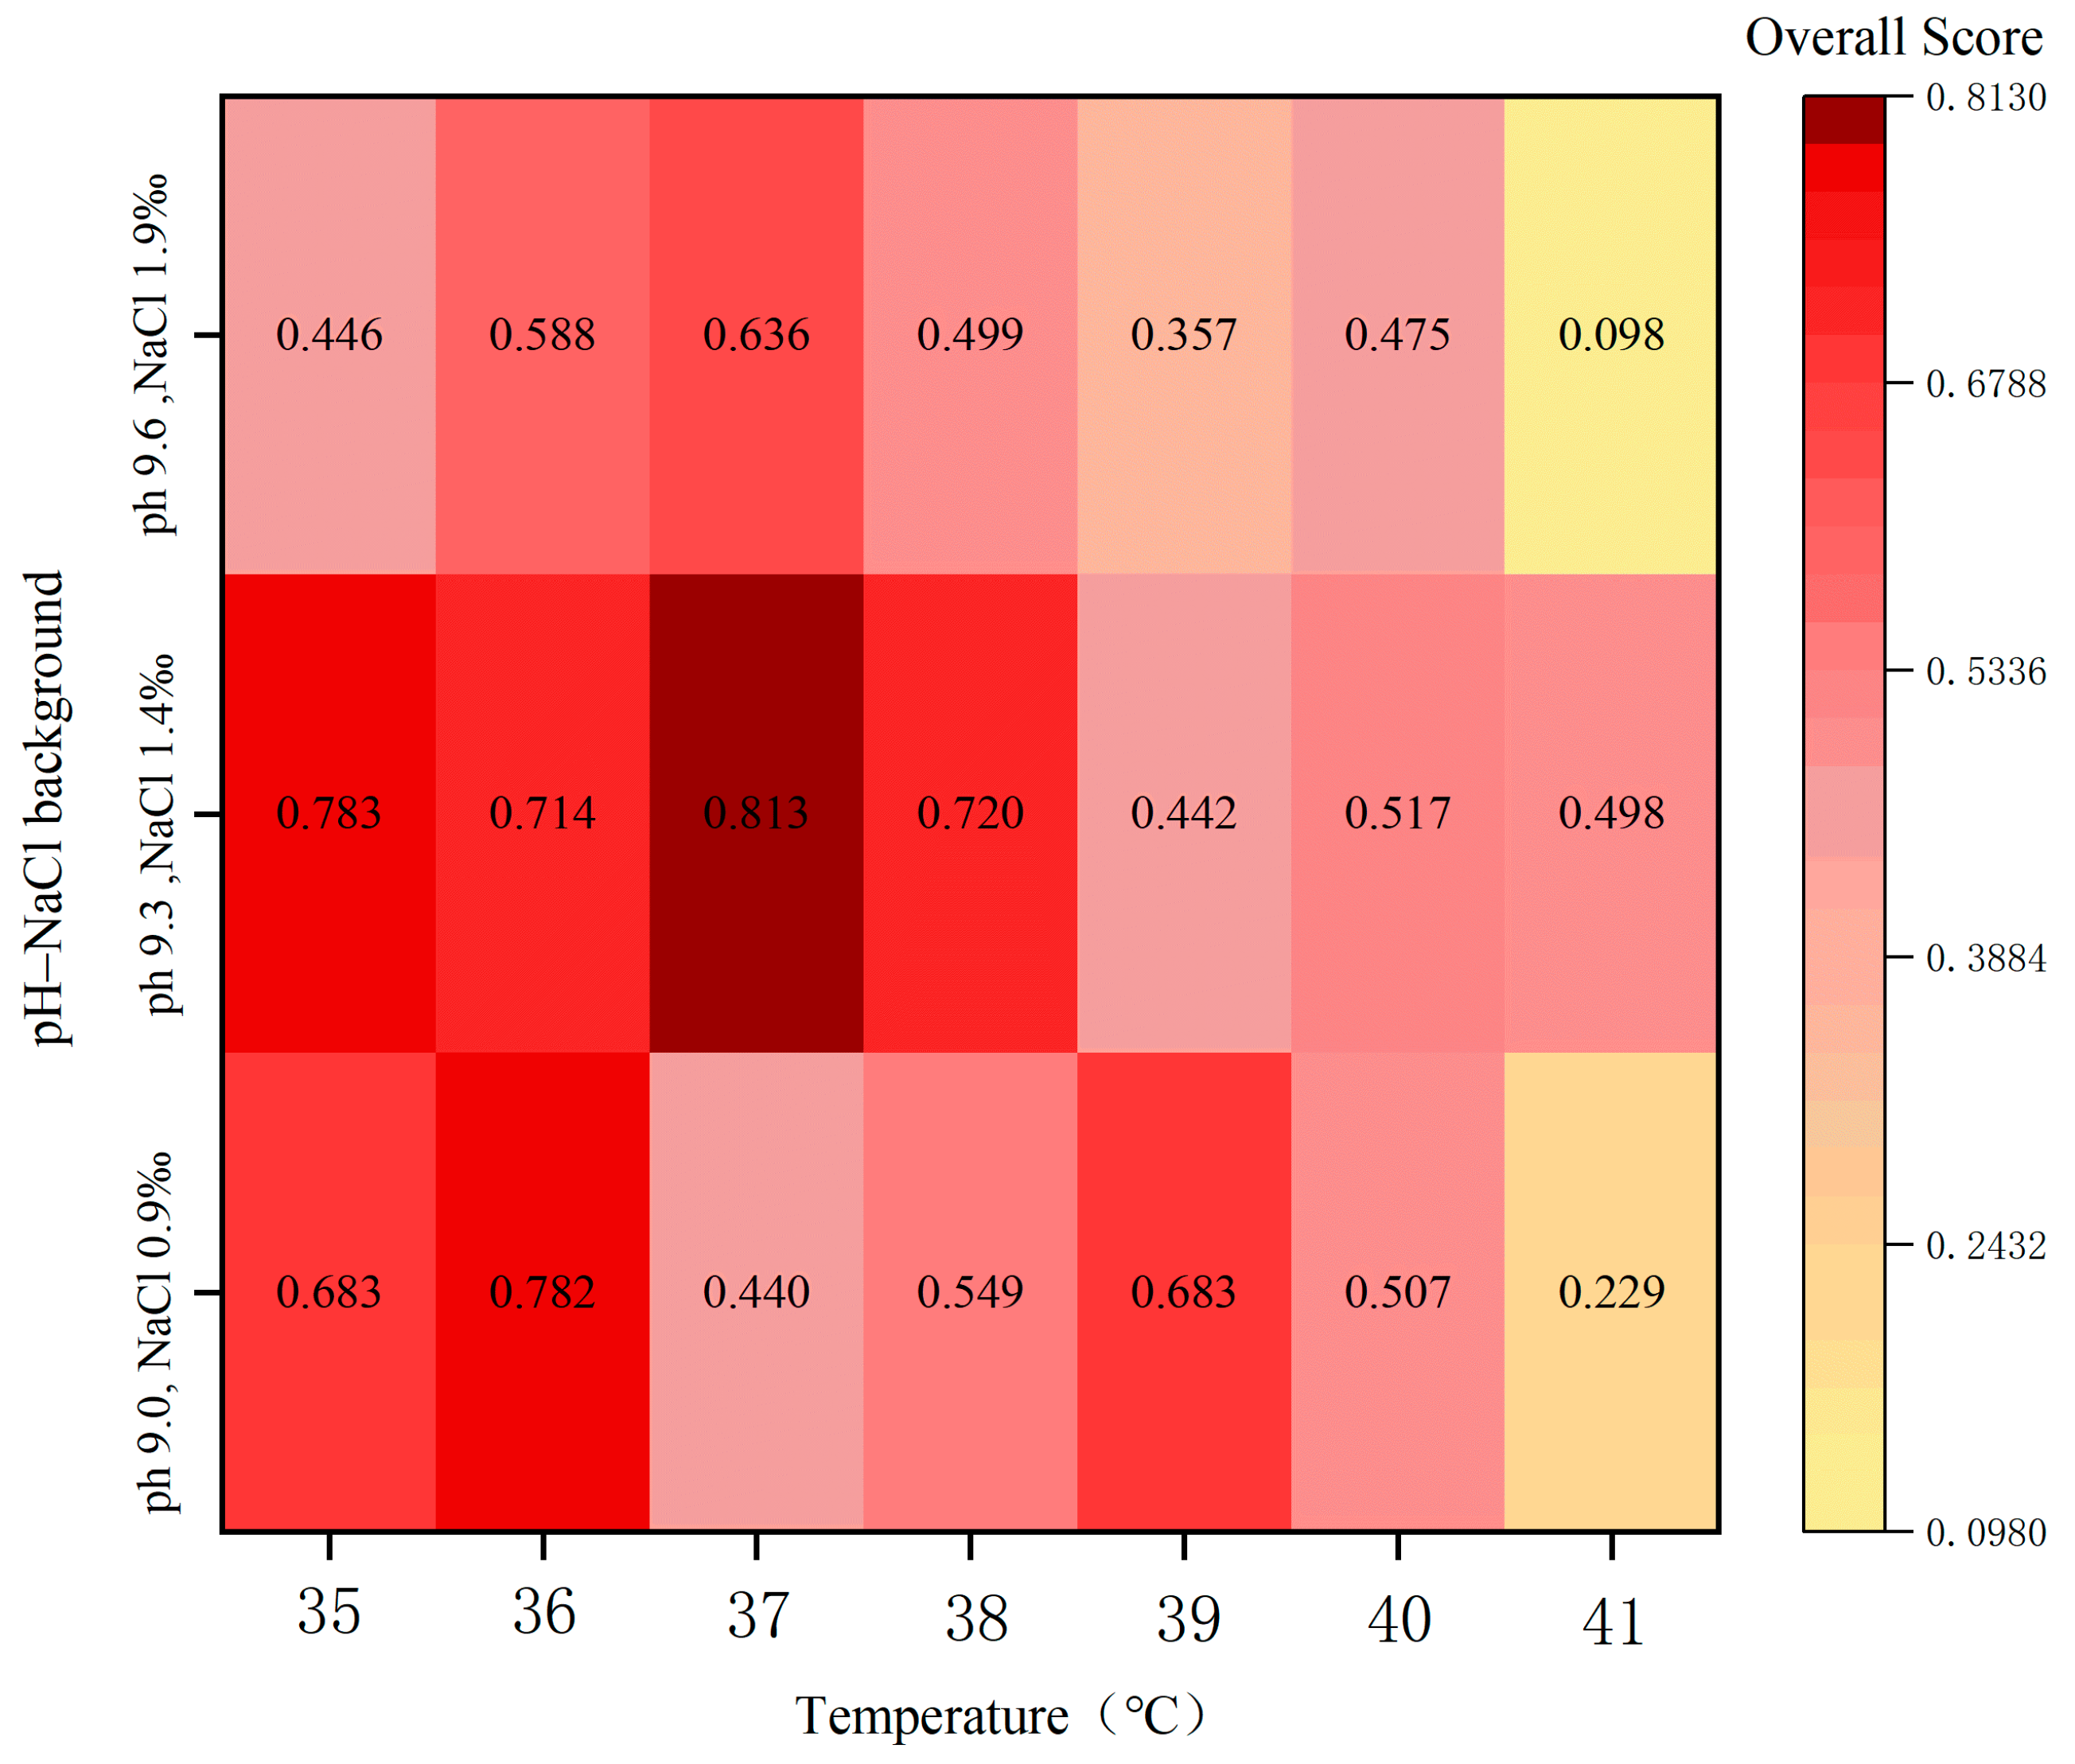
As shown in Figure 6, the composite scores showed that the pH 9.3 and 1.4‰ NaCl background formed a relatively high-score region around 35–37 °C, whereas the pH 9.6 and 1.9‰ NaCl background showed lower scores at several elevated-temperature treatments. These results identify a coordinated response range rather than a definitive operating optimum.
The composite ranking results are presented in Table 4. At α = 0.5, the highest composite score was obtained at 37 °C, pH 9.3, and 1.4‰ NaCl (0.813), followed by 35 °C, pH 9.3, and 1.4‰ NaCl (0.783), and 36 °C, pH 9.0, and 0.9‰ NaCl (0.782). Composite scores are reported to three decimal places to avoid implying unwarranted numerical precision. Treatment rankings were determined using the unrounded composite scores. Overall, the results suggest that pH 9.3, 1.4‰ NaCl, and 35–37 °C represented a candidate liquid-culture response range for subsequent sand-based validation.
The weighting-sensitivity analysis showed that the identity of the highest-ranked treatment depended partly on α. The pH 9.3, 1.4‰ NaCl, and 35 °C treatment ranked first at α = 0.0–0.2, whereas the corresponding 37 °C treatment ranked first at α = 0.3–1.0. For the 37 °C treatment, the composite score changed from 0.8198 at α = 0 to 0.8053 at α = 1. Spearman rank correlations relative to α = 0.5 ranged from 0.9208 to 1.0000. These results indicate that the overall ranking structure was relatively stable, whereas the ordering of the two leading treatments remained dependent on the objective–subjective mixing coefficient.
To further clarify the coordinated performance of the highest-ranked treatment relative to the two next-ranked conditions, the individual response indicators of the three leading treatments were quantitatively compared (Table 5).
Quantitative comparison of the three highest-ranked treatments further illustrates the basis for the coordinated advantage of the pH 9.3, 1.4‰ NaCl, and 37 °C treatment. Compared with the second-ranked treatment at 35 °C under the same pH–NaCl background, the 37 °C treatment exhibited a 9.3% higher OD600 and a 1.8% higher ADPM, although its urease activity was 16.1% lower. Compared with the third-ranked treatment at pH 9.0, 0.9‰ NaCl, and 36 °C, the 37 °C treatment showed the same urease activity, a 12.3% higher OD600, and a 2.6% lower ADPM. Its composite score was approximately 3.8% and 4.0% higher than those of the second- and third-ranked treatments, respectively. These results indicate that the first-ranked treatment was not superior in every individual indicator; rather, its higher composite score arose from a comparatively balanced combination of ureolytic activity, cell-density response, and dry-precipitate accumulation.
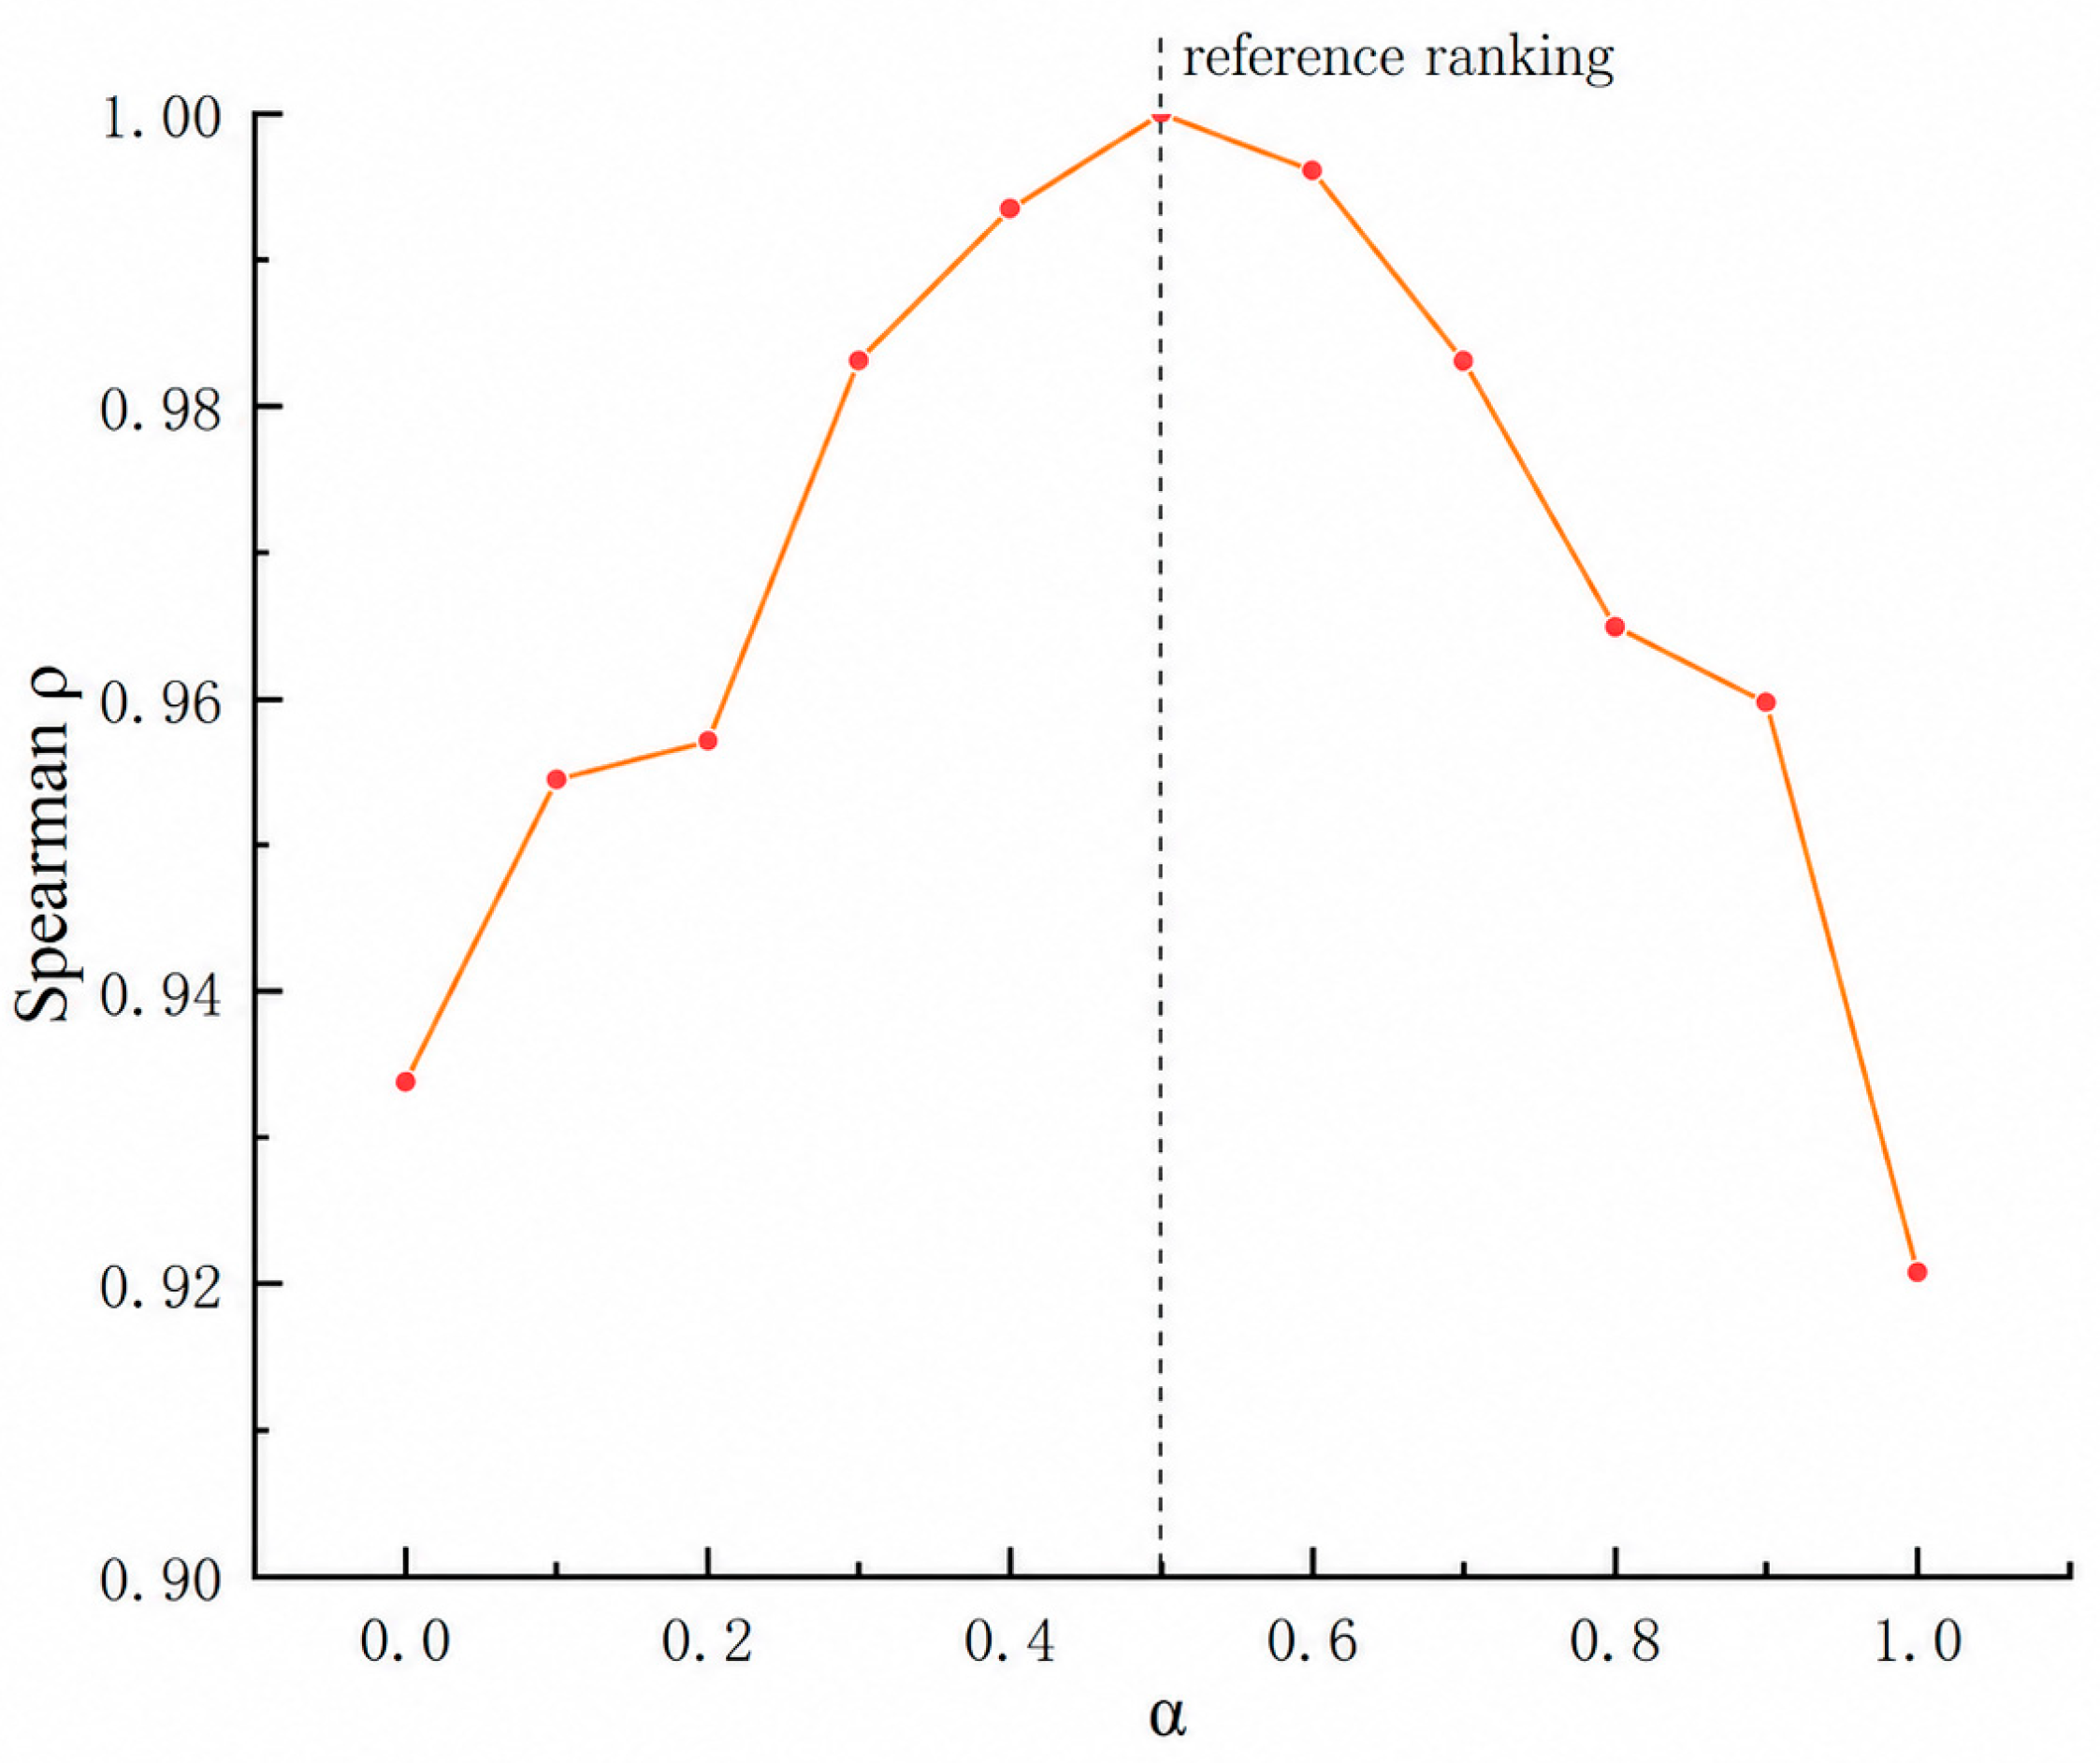
The weighting-sensitivity analysis showed that the identity of the highest-ranked treatment depended partly on α. The pH 9.3, 1.4‰ NaCl, and 35 °C treatment ranked first at α = 0.0–0.2, whereas the corresponding 37 °C treatment ranked first at α = 0.3–1.0. To further evaluate the robustness of the complete treatment-ranking structure, Spearman rank correlations were calculated between the ranking obtained at each α value and that obtained at α = 0.5 (Figure 7).
Spearman’s ρ ranged from 0.9208 to 1.0000 across α = 0–1. The coefficient increased from 0.9338 at α = 0 to 1.0000 at α = 0.5 and subsequently decreased to 0.9208 at α = 1.0. All coefficients remained above 0.92, indicating that the overall ranking structure was relatively stable despite changes in the relative contributions of objective and subjective weights. The highest agreement was observed near α = 0.4–0.6. Nevertheless, the change in the identity of the top-ranked treatment indicates that the distinction between the two leading conditions remained sensitive to the weighting assumption.

4. Discussion

4.1. Responses to the Combined pH-NaCl Gradient During Phase I

Because the five pH–NaCl conditions were applied sequentially within each culture line, the response measured at each stage reflected both the current pH–NaCl background and the preceding exposure history. More importantly, pH and NaCl concentration were increased simultaneously during Phase I, creating a confounded design in which their independent effects could not be separated. This design therefore does not allow causal attribution of the observed responses to pH, NaCl concentration, or ionic strength individually, nor does it allow conclusions regarding additive or synergistic interactions between these factors. Accordingly, the Phase I results should be interpreted only as responses to the combined pH–NaCl background and exposure sequence. Urease activity remained measurable throughout the tested gradient, whereas OD600 increased up to Group 3 and subsequently decreased under the higher combined pH–NaCl conditions. The numerically highest mean values of urease activity, OD600, and ADPM occurred at different exposure stages, indicating that cell-density response, ureolytic activity, and retained dry-residue accumulation did not vary synchronously.
The different response patterns of OD600 and urease activity may reflect their distinct sensitivities to the combined extracellular environment. The relatively high OD600 observed in Group 3 did not correspond to the highest urease activity, indicating that greater culture turbidity did not necessarily imply greater culture-level ureolytic activity. One possible explanation is that cellular resources under combined environmental stress may be distributed differently between biomass production, physiological maintenance, and urease-related metabolism. Therefore, this interpretation should be regarded only as a physiological hypothesis related to the combined exposure condition rather than as a demonstrated mechanism attributable specifically to pH or NaCl.
Previous saline–alkaline adaptation studies of Sporosarcina pasteurii have generally focused on substantially harsher environments. For example, gradient domestication in artificial seawater with a salinity of approximately 35‰ resulted in bacterial concentrations exceeding 97% of the freshwater level after five-gradient domestication [20]. Dikshit et al. reported detectable MICP activity at NaCl supplementation up to 10%, although urease activity declined markedly above 5% NaCl [25], whereas Liu et al. obtained an adaptively evolved strain capable of maintaining growth and ureolytic activity under 35 g/L NaCl combined with pH 12 [15]. In contrast, the present study examined a low-added-NaCl range of 0.05–1.9‰ combined with pH 8.4–9.6, selected to represent the low-salt alkaline background of inland aeolian sand. Accordingly, the contribution of this study is not the establishment of a higher saline–alkaline tolerance threshold, but the characterization of culture-level responses within an environmentally targeted low-added-NaCl alkaline window followed by an elevated-temperature challenge.
The numerically higher mean ADPM observed in Group 2 was not used as the sole criterion for Phase II selection. Because ADPM was treated only as an operational dry-residue endpoint, the Phase II backgrounds were selected primarily to cover the average and near-upper pH range of the target aeolian-sand environment rather than according to the maximum value of any single response indicator.

4.2. Background-Dependent Temperature Responses During Phase II

The Phase II results demonstrated that the temperature responses of urease activity and OD600 depended strongly on the preceding pH–NaCl background. Significant interactions between temperature and pH–NaCl background were detected for both biological indicators. For ADPM, a significant temperature-associated difference was detected, whereas the main effect of pH–NaCl background and the temperature × background interaction were not significant. Because the post-reaction residue was maintained at the temperature corresponding to each treatment, the observed ADPM variation cannot be attributed exclusively to a biological temperature response and is therefore interpreted descriptively.
Under the pH 9.0 and 0.9‰ NaCl background, urease activity was highest at 35 °C, whereas OD600 varied non-monotonically across the temperature range. Under pH 9.3 and 1.4‰ NaCl, urease activity remained relatively high at 35–37 °C and OD600 reached its Phase II maximum at 37 °C. Under pH 9.6 and 1.9‰ NaCl, relatively high OD600 values at 37–38 °C were accompanied by lower urease activity, further indicating that greater cell-density response did not necessarily correspond to greater ureolytic activity. Taken together, the urease activity and OD600 responses indicate that the pH 9.3 and 1.4‰ NaCl background maintained comparatively favorable biological responses within the 35–37 °C candidate range.

4.3. Multi-Indicator Coordination and Weighting Sensitivity

The composite analysis was used as an exploratory approach to characterize coordination among urease activity, OD600, and ADPM within the 21 Phase II treatments. At α = 0.5, the treatment at pH 9.3, 1.4‰ NaCl, and 37 °C obtained the highest composite score (0.813), followed closely by the corresponding 35 °C treatment (0.783) and the pH 9.0, 0.9‰ NaCl, and 36 °C treatment (0.782). The leading treatments did not exhibit the maximum value of every individual indicator but maintained relatively high values across the measured responses.
The sensitivity analysis showed that the identity of the highest-ranked treatment depended partly on the objective–subjective mixing coefficient. The pH 9.3, 1.4‰ NaCl, and 35 °C treatment ranked first at α = 0.0–0.2, whereas the corresponding 37 °C treatment ranked first at α = 0.3–1.0. Spearman rank correlations relative to α = 0.5 ranged from 0.921 to 1.000, indicating that the overall ranking structure remained relatively stable despite changes in the two leading treatments. Accordingly, pH 9.3, 1.4‰ NaCl, and 35–37 °C is better interpreted as a coordinated candidate range than as a unique optimum. Given the methodological limitations of ADPM discussed below, the composite ranking should be regarded as supplementary exploratory evidence rather than a quantitative measure of biomineralization efficiency.

4.4. Limitations and Implications for Further Validation

Several limitations should be considered when interpreting the present results. First, pH and added NaCl were varied simultaneously during Phase I, resulting in a confounded experimental design. Consequently, the independent effects of pH and NaCl cannot be separated, and the present data cannot support causal or mechanistic conclusions regarding the contribution of either factor alone or their possible interaction. The Phase I results should therefore be interpreted strictly as responses to the combined pH–NaCl background. Future studies should employ a fully factorial design in which pH and NaCl are varied independently. Second, the sequential exposure was short-term and was designed to characterize culture-level responses rather than stable or heritable tolerance; therefore, the persistence of the observed responses after prolonged cultivation or repeated passage remains unknown. Third, only S. pasteurii ATCC 11859 was examined, whereas indigenous ureolytic bacteria from desert environments may exhibit different responses to alkaline, saline, and thermal conditions. Future studies should therefore combine independent pH and NaCl treatments with long-term adaptive cultivation and comparative evaluation of locally isolated ureolytic strains.
The gravimetric ADPM measurement also has important methodological limitations. Although the procedure was adapted from a previously reported liquid-culture MICP gravimetric approach [20], no post-reaction washing step, Ca-free bacterial-background correction, or abiotic reagent blank was included in the original protocol. Recent liquid-culture MICP studies have incorporated washing steps before drying and gravimetric determination. For example, Mostafa et al. [26] washed the recovered precipitate twice with distilled water before drying and weighing, whereas Fouladi et al. [27] washed MICP precipitates twice with deionized water and ethanol to remove residual reactants and biomass before oven-drying. In contrast, because the precipitates in the present study were not washed after reaction, ADPM may include bacterial biomass, cellular debris, residual culture-medium salts and other medium constituents, unreacted reaction components, and biomineral-associated solids. Accordingly, ADPM cannot be interpreted as the dry mass of purified CaCO3.
Moreover, the residual solids were dried for 24 h at the temperature corresponding to each treatment rather than at a standardized temperature to constant mass. Therefore, differences in residual moisture may also have contributed to the observed Phase II ADPM variation. Future studies should employ washed precipitate recovery, appropriate bacterial and abiotic controls, standardized drying to constant mass, and direct mineralogical or chemical quantification of CaCO3.
Finally, liquid-culture screening cannot fully reproduce bacterial attachment, restricted transport, nutrient gradients, and solid–liquid interfaces within aeolian-sand pores. Therefore, the pH 9.3, 1.4‰ NaCl, and 35–37 °C range should be regarded as a candidate condition for sand-scale validation rather than a fixed field-operating target [28,29,30]. For practical MICP application, pH 9.3 and 1.4‰ added NaCl may serve as preliminary conditioning references during bacterial-suspension preparation, but native pore-water pH and salinity should first be characterized and unnecessary field-scale chemical adjustment should be avoided. The 35–37 °C range may similarly inform bacterial handling and injection during summer construction; prolonged exposure of bacterial suspensions to excessive surface heating should be minimized, for example, by scheduling treatment during cooler periods and protecting storage or delivery systems from direct solar heating. Sand-column, sand-tray, and field-scale tests incorporating direct CaCO3 measurements and engineering-performance indicators are required before these conditions can be translated into field practice.

5. Conclusions

This study characterized the liquid-culture responses of Sporosarcina pasteurii ATCC 11859 to sequentially applied pH-NaCl and elevated-temperature conditions relevant to aeolian-sand environments. Because pH and NaCl concentration were varied simultaneously during Phase I, the observed responses represent the combined pH-NaCl background rather than their independent effects. During Phase II, urease activity and OD600 showed significant background-dependent temperature responses, whereas ADPM was affected mainly by temperature and exhibited a weaker interaction pattern.
The composite analysis of the 21 Phase II treatments showed that, at α = 0.5, pH 9.3, 1.4‰ NaCl, and 37 °C produced the highest composite score. However, sensitivity analysis showed that the corresponding 35 °C treatment ranked first when α was 0.0–0.2, whereas the 37 °C treatment ranked first when α was 0.3–1.0. Accordingly, pH 9.3, 1.4‰ NaCl, and 35–37 °C should be regarded as a relatively coordinated candidate response range rather than as a unique optimum.
Overall, ADPM was retained as an operational liquid-culture dry-residue endpoint rather than as a quantitative measure of CaCO3 production. The identified pH 9.3, 1.4‰ NaCl, and 35–37 °C range should therefore be regarded as a coordinated candidate liquid-culture response range rather than as an absolute optimum for biomineralization efficiency. Direct evaluation of CaCO3 accumulation in treated aeolian sand is required for subsequent sand-scale validation.

Supplementary Materials

The following supporting information can be downloaded at https://www.mdpi.com/article/10.3390/pr14183003/s1: Figure S1. Sensitivity of representative Phase II treatment rankings to the objective–subjective mixing coefficient α; Table S1. Combined indicator weights under different values of the objective–subjective mixing coefficient α for the 21 Phase II treatments; Table S2. Top three Phase II treatments and their composite scores under different values of the objective–subjective mixing coefficient α; Table S3. Spearman rank correlations between the complete treatment ranking at each α value and the ranking obtained at α = 0.5; Table S4. Šídák-adjusted simple-effects pairwise comparisons for urease activity in Phase II; Table S5. Šídák-adjusted simple-effects pairwise comparisons for OD600 in Phase II.

Author Contributions

J.W.: Conceptualization, funding acquisition, methodology, project administration, supervision, writing—review and editing. H.Z.: Investigation, supervision, writing—original draft. Z.L.: Conceptualization, writing—original draft, writing—review and editing. Y.L.: Conceptualization, writing—review and editing. All authors have read and agreed to the published version of the manuscript.

Funding

This work was supported by the Open Research Topics of Xinjiang Key Laboratory of Hydraulic Engineering Security and Water Disasters Prevention for 2024 (No. ZDSYS-JS-2024-10), the 2024 Basic Research Fund for Higher Education Institutions of Xinjiang Uygur Autonomous Region (No. XJEDU2025J048), and the Tianshan Innovation Team of Xinjiang Uygur Autonomous Region, China (grant number 2025D14024).

Data Availability Statement

The datasets generated and/or analyzed during the current study are available from the corresponding author on reasonable request.

Conflicts of Interest

The authors declare no conflicts of interest.

References

  1. Zhang, J.; Lan, Y.; Zhao, H.; Zhou, J.; Chen, X.; Shi, X. Experimental study on cementation performance of aeolian sand by microbial mineralization technology. Res. Explor. Lab. 2022, 41, 60–64. [Google Scholar] [CrossRef]
  2. Zhang, K.; Tang, C.-S.; Jiang, N.-J.; Pan, X.-H.; Liu, B.; Wang, Y.-J.; Shi, B. Microbial-induced carbonate precipitation (MICP) technology: A review on the fundamentals and engineering applications. Environ. Earth Sci. 2023, 82, 229. [Google Scholar] [CrossRef] [Scilit] [PubMed]
  3. Cao, H.; Gao, G.; Rao, L.; Zhang, Y.; Sun, Z.; Zhang, J.; Wang, T.; Ding, G.; Zhao, H. Microbially induced calcium carbonate precipitation to combat desertification: A field application experiment. J. Clean. Prod. 2024, 468, 143085. [Google Scholar] [CrossRef] [Scilit]
  4. Meng, H.; Gao, Y.; He, J.; Qi, Y.; Hang, L. Microbially induced carbonate precipitation for wind erosion control of desert soil: Field-scale tests. Geoderma 2021, 383, 114723. [Google Scholar] [CrossRef] [Scilit]
  5. Naeimi, M.; Chu, J.; Khosroshahi, M.; Zenouzi, L.K. Soil stabilization for dunes fixation using microbially induced calcium carbonate precipitation. Geoderma 2023, 429, 116183. [Google Scholar] [CrossRef] [Scilit]
  6. Fan, W.; Xiao, Y.; Cao, B.; Wu, S.; Cui, H.; Chu, J.; Liu, H. Effects of biostimulation treatment methods on mechanical properties and microstructure characteristics of biocemented soil. Acta Geotech. 2025, 20, 2163–2184. [Google Scholar] [CrossRef] [Scilit]
  7. Barkouki, T.H.; Martinez, B.C.; Mortensen, B.M.; Weathers, T.S.; De Jong, J.D.; Ginn, T.R.; Spycher, N.F.; Smith, R.W.; Fujita, Y. Forward and inverse bio-geochemical modeling of microbially induced calcite precipitation in half-meter column experiments. Transp. Porous Media 2011, 90, 23–39. [Google Scholar] [CrossRef] [Scilit]
  8. DeJong, J.T.; Soga, K.; Kavazanjian, E.; Burns, S.; van Paassen, L.A.; Al Qabany, A.; Aydilek, A.; Bang, S.S.; Burbank, M.; Caslake, L.F.; et al. Biogeochemical processes and geotechnical applications: Progress, opportunities and challenges. Géotechnique 2013, 63, 287–301. [Google Scholar] [CrossRef] [Scilit]
  9. Liang, S.-H.; Xie, Y.-P.; Deng, Y.-S. Microbially induced calcium carbonate precipitation technique progress and review of engineering applications. J. Guangdong Univ. Technol. 2024, 41, 11–22. [Google Scholar] [CrossRef]
  10. Dagliya, M.; Satyam, N.; Sharma, M.; Garg, A. Experimental study on mitigating wind erosion of calcareous desert sand using spray method for microbially induced calcium carbonate precipitation. J. Rock Mech. Geotech. Eng. 2022, 14, 1556–1567. [Google Scholar] [CrossRef] [Scilit]
  11. Chen, Y.; Wang, S.; Tong, X.; Kang, X. Towards the sustainable fine control of microbially induced calcium carbonate precipitation. J. Clean. Prod. 2022, 377, 134395. [Google Scholar] [CrossRef] [Scilit]
  12. Erdmann, N.; Strieth, D. Influencing factors on ureolytic microbiologically induced calcium carbonate precipitation for biocementation. World J. Microbiol. Biotechnol. 2023, 39, 61. [Google Scholar] [CrossRef] [Scilit] [PubMed]
  13. Ma, X.; Li, S.; Jin, Z. Response of soil chemical properties to afforestation in surface of shifting sand: A case study on shelterbelt of open channel in Gurbantunggut Desert. Bull. Soil Water Conserv. 2015, 35, 206–212. [Google Scholar] [CrossRef]
  14. Zhu, B.; Yang, X.; Rioual, P.; Liu, Z.; Li, C.; Xiong, H. Composition of soluble salts in aeolian sands from sandy deserts of northern China and their environmental implications. Quat. Sci. 2011, 31, 1029–1044. [Google Scholar] [CrossRef]
  15. Liu, J.; Xu, H.; Dong, M.; Cheng, Z.; Mi, C.; Sun, S.; Zhu, R.; Han, P. Adaptive Evolution of Sporosarcina pasteurii Enhances Saline-Alkali Resistance for High-Performance Concrete Crack Repair via MICP. Microorganisms 2025, 13, 1526. [Google Scholar] [CrossRef] [Scilit] [PubMed]
  16. Mortensen, B.M.; Haber, M.J.; Dejong, J.T.; Caslake, L.F.; Nelson, D.C. Effects of environmental factors on microbial induced calcium carbonate precipitation. J. Appl. Microbiol. 2011, 111, 338–349. [Google Scholar] [CrossRef] [Scilit] [PubMed]
  17. Li, K.; Wei, L.; Zhao, J.; Li, W.; Jiang, L.; Dang, J.; Liu, H.; Gao, H. Experimental study on self-healing of marine concrete cracks by saline-alkaline domesticated and optimized microorganisms. Mater. Rep. 2025, 40, 1–18. [Google Scholar] [CrossRef]
  18. Du, Z.-H.; Li, Z.-J.; Chen, J.-X.; Ma, Z.-Y.; Guo, G.-D.; Zhang, H.; Wang, S. Temperature- and alkali-resistant induced domestication of Bacillus pasteurii in drilling fluid and its borehole wall enhancement properties. Pet. Sci. 2024, 21, 4358–4375. [Google Scholar] [CrossRef] [Scilit]
  19. Meng, Y.; Xu, X.; Ding, Y.; Wang, Y.; Cai, Z.; Tian, B. Gradient domestication and selection of mineralizing microorganisms suitable for the internal environment of hydraulic concrete. J. Hydraul. Eng. 2024, 55, 698–710. [Google Scholar] [CrossRef]
  20. Yao, X.; Deng, H.-F.; Li, J.-L.; Cheng, L.; Zhu, W.-X. Study on the domestication of Sporosarcina pasteurii and strengthening effect of calcareous sand in seawater environment. Rock Soil Mech. 2022, 43, 395–404. [Google Scholar] [CrossRef]
  21. Lin, W.; Gao, Y.; Lin, W.; Zhuo, Z.; Wu, W.; Cheng, X. Seawater-based bio-cementation of natural sea sand via microbially induced carbonate precipitation. Environ. Technol. Innov. 2023, 29, 103010. [Google Scholar] [CrossRef] [Scilit]
  22. Mamtimin, A.; Wang, Y.; Sayit, H.; Yang, X.; Yang, F.; Huo, W.; Zhou, C. Seasonal Variations of the Near-Surface Atmospheric Boundary Layer Structure in China’s Gurbantünggüt Desert. Adv. Meteorol. 2020, 2020, 6137237. [Google Scholar] [CrossRef] [Scilit]
  23. Konstantinou, C.; Wang, Y.; Biscontin, G.; Soga, K. The role of bacterial urease activity on the uniformity of carbonate precipitation profiles of bio-treated coarse sand specimens. Sci. Rep. 2021, 11, 6161. [Google Scholar] [CrossRef] [Scilit] [PubMed]
  24. Li, H.; Li, D.; Li, Y. A multi-index assessment method for evaluating coverage effectiveness of remote sensing satellite. Chin. J. Aeronaut. 2018, 31, 2023–2033. [Google Scholar] [CrossRef] [Scilit]
  25. Dikshit, R.; Dey, A.; Kumar, A. Sporosarcina pasteurii can Efficiently Precipitate Calcium Carbonate at High Salt Concentration. Geomicrobiol. J. 2022, 39, 123–134. [Google Scholar] [CrossRef] [Scilit]
  26. Mostafa, N.G.; Ghezelbash, G.R.; Shafiei, M. Crystal precipitation in bio-slurry: Effects of urea and calcium chloride using non-growing Sporosarcina pasteurii. FEMS Microbiol. Lett. 2025, 372, fnaf083. [Google Scholar] [CrossRef] [Scilit] [PubMed]
  27. Fouladi, A.S.; de Souza Heleno Santos, O.; Li, Y.; Arulrajah, A. Synergic effect of sodium alginate in the microbially induced calcium carbonate precipitation. Int. J. Biol. Macromol. 2026, 379, 153989. [Google Scholar] [CrossRef] [Scilit] [PubMed]
  28. Chen, Y.; Wang, S.; Tong, X.; Kang, X. Crystal transformation and self-assembly theory of microbially induced calcium carbonate precipitation. Appl. Microbiol. Biotechnol. 2022, 106, 3555–3569. [Google Scholar] [CrossRef] [Scilit] [PubMed]
  29. Wang, S.; Chen, Y.; Chen, R.; Ma, X.; Kang, X. Steerable artificial magnetic bacteria with target delivery ability of calcium carbonate for soil improvement. Appl. Microbiol. Biotechnol. 2023, 107, 5687–5700. [Google Scholar] [CrossRef] [Scilit] [PubMed]
  30. Chen, Y.; Liu, Z.-Y.; Xia, Z.; Li, L.; Huang, D.-W.; Kang, X. Leveraging the Fine-Control MICP framework for cross-scale geoenvironmental applications: A roadmap of innovations and challenges. Geoenvironmental Disasters 2026, 13, 21. [Google Scholar] [CrossRef] [Scilit]
Figure 1. Schematic illustration of ureolysis-driven calcium carbonate precipitation during MICP.
Processes 14 03003 g001
Figure 2. Schematic illustration of the sequential pH-NaCl exposure in Phase I and the temperature–response assessment in Phase II. The pH 9.3 and 1.4‰ NaCl background is shown as a representative Phase II example; the same temperature treatments of 35–41 °C were applied to all three selected pH-NaCl backgrounds.
Processes 14 03003 g002
Figure 3. Experimental procedures for (a) conductivity measurement at 0 and 5 min, (b) liquid-culture dry-residue formation and ADPM determination by oven-drying and weighing, and (c) OD600 measurement using blank medium and bacterial suspension.
Processes 14 03003 g003
Figure 4. Phase I responses of Sporosarcina pasteurii to sequential combined pH-NaCl exposure at 30 °C: (A) urease activity, (B) OD600 and (C) apparent dry precipitate mass (ADPM) at five successive exposure stages. Data are presented as mean ± SD of three independent sequential culture lines (n = 3). Statistical analysis was performed using one-way repeated-measures ANOVA with Geisser–Greenhouse correction, followed by Sidak-corrected paired comparisons. Different lowercase letters indicate significant pairwise differences between exposure stages (p < 0.05).
Processes 14 03003 g004
Figure 5. Temperature–response profiles of Sporosarcina pasteurii after Phase I pH-NaCl exposure. (A) Apparent dry precipitate mass (ADPM, g), (B) OD600, and (C) urease activity under three selected pH-NaCl backgrounds. Data are presented as mean ± SD of three biological replicates (n = 3). The pH-NaCl backgrounds are distinguished by line styles and markers. Two-way ANOVA was used to evaluate the effects of temperature, pH-NaCl background, and their interaction on each response variable. Sidak-adjusted simple-effects comparisons following significant interactions are reported in Tables S4 and S5.
Processes 14 03003 g005
Figure 6. Heatmap of composite scores calculated from urease activity, OD600 and ADPM for the 21 Phase II treatments at α = 0.5.
Processes 14 03003 g006
Figure 7. Spearman rank correlation between the complete treatment ranking at each α value and the ranking obtained at α = 0.5. Higher ρ values indicate greater similarity in the overall ranking structure. The dashed vertical line indicates the reference weighting coefficient (α = 0.5).
Processes 14 03003 g007
Table 1. Primary components and concentrations of bacterial culture medium.
ComponentConcentration
Yeast extract20 g/L
NH4Cl15 g/L
MnSO4·H2O12 mg/L
NiCl2·6H2O24 mg/L
Table 2. Sequential pH-NaCl exposure scheme.
GrouppHNaCl/‰
18.40.05
28.70.5
39.00.9
49.31.4
59.61.9
Table 3. Entropy-derived objective weights, predefined subjective weights and combined weights at α = 0.5 for the Phase II treatments.
IndicatorEntropy Value, e_jDegree of Difference, d_jObjective WeightSubjective WeightCombined Weight at α = 0.5
Urease activity0.92100.07900.50450.20000.3523
OD6000.95440.04560.29120.30000.2956
ADPM0.96800.03200.20430.50000.3522
Table 4. Composite scores and treatment rankings calculated at α = 0.5.
Treatment IDTemperature (°C)NaCl (‰)pHUrease Activity (mM urea min−1)OD600ADPM (g)Composite ScoreRank
1350.99.01.3551.5051.080.6836
2351.49.31.3781.5211.120.7832
3351.99.60.9111.2881.100.44616
4360.99.01.1551.4801.170.7823
5361.49.30.9111.4601.190.7145
6361.99.60.8221.2661.190.5889
7370.99.00.9111.3581.080.44018
8371.49.31.1551.6621.140.8131
9371.99.60.8441.5471.140.6368
10380.99.00.6891.5311.130.54910
11381.49.30.8891.5571.170.7204
12381.99.60.4671.5571.140.49913
13390.99.00.9111.5491.150.6837
14391.49.30.9111.3621.080.44217
15391.99.60.6891.1561.130.35719
16400.99.00.6891.4641.130.50712
17401.49.30.8891.2001.160.51711
18401.99.60.4441.3241.190.47515
19410.99.00.6671.0851.090.22920
20411.49.30.6671.3681.150.49814
21411.99.60.4441.2771.020.09821
Composite scores are displayed to three decimal places; rankings were determined using the unrounded values.
Table 5. Quantitative comparison of the three highest-ranked Phase II treatments at α = 0.5.
RankTreatment ConditionUrease Activity (mM urea min−1)OD600ADPM (g)Composite Score
1pH 9.3, 1.4‰ NaCl, 37 °C1.1551.6621.140.813
2pH 9.3, 1.4‰ NaCl, 35 °C1.3781.5211.120.783
3pH 9.0, 0.9‰ NaCl, 36 °C1.1551.4801.170.782
Disclaimer/Publisher’s Note: The statements, opinions and data contained in all publications are solely those of the individual author(s) and contributor(s) and not of MDPI and/or the editor(s). MDPI and/or the editor(s) disclaim responsibility for any injury to people or property resulting from any ideas, methods, instructions or products referred to in the content.