1. Introduction
Triply periodic minimal surface (TPMS) structures offer a promising geometric platform for condensation-related and heat-transfer applications because they provide continuous, interconnected, and curvature-rich surfaces [
1,
2]. TPMS are mathematically defined minimal surfaces that repeat periodically in three spatial directions and have zero mean curvature [
3]. Similar highly curved periodic structures are also observed in biological systems, such as the mitochondria of
Chaos carolinensis, suggesting that such morphologies can support efficient transport and spatial organization [
4]. In engineering applications, TPMS architectures are typically generated using trigonometric equations and arranged into periodic lattice structures along the x-, y-, and z-directions [
5]. In addition to direct trigonometric definitions and optimization-based design, phase-field approaches have been used to model gyroid formation and transitions among periodic morphologies. Cell-dynamics simulations have examined field-induced transitions between gyroid and cylindrical structures, while coupled Cahn–Hilliard and Swift–Hohenberg equations have been used to investigate three-dimensional pattern formation and morphological phase transitions [
6,
7]. These computational approaches provide complementary theoretical methods for studying the formation and evolution of TPMS structures. Their high surface-area-to-volume characteristics and continuous pathways make them attractive for thermal management, condensation, and fluid-interaction applications [
8]. However, their complex geometry, thin features, and limited accessible regions also create challenges for manufacturing, post-processing, and surface characterization.
Laser powder bed fusion (LPBF) enables the fabrication of complex metallic TPMS geometries that are difficult to produce using conventional manufacturing methods [
9,
10]. However, LPBF-fabricated structures often exhibit process-induced surface features and defects, including balling, porosity, irregular roughness, cracks, loss of alloying elements, oxide inclusions, partially melted particles, and staircase effects associated with layer-wise fabrication [
11]. These features arise from melt-pool instability, local thermal gradients, rapid solidification, powder adhesion, and geometric constraints such as overhangs and curved surfaces [
12,
13,
14]. More broadly, studies of as-cast stainless steel (SS) have demonstrated that alloy composition and cooling rate can alter solidification mode, ferrite content, and secondary-phase formation, emphasizing the sensitivity of stainless-steel microstructures to composition and thermal history [
15]. In TPMS structures, these effects can be more pronounced because thin features, internal curvatures, limited accessibility, and build orientation can restrict powder removal and complicate post-processing [
16].
Previous studies on additively manufactured TPMS structures have demonstrated that surface quality varies significantly with geometry, feature size, processing conditions, and build direction. LPBF-fabricated A20X aluminum TPMS heat sinks have shown surface roughness variations, partially melted particles, loose powder, staircase effects, balling, and uneven layer characteristics when examined using optical profiling and SEM [
17]. Similar challenges have been reported for 17-4 PH SS TPMS lattices, where manufacturability is affected by thin features, build direction, and residual or unmelted powder on the surface [
18]. In polymer-based TPMS structures fabricated by fused filament fabrication, the TPMS pattern itself has been shown to dominate tensile behavior relative to printing parameters such as speed, layer height, and line width [
19]. These studies indicate that TPMS structures cannot be evaluated only from nominal geometry or bulk material properties; surface morphology and manufacturing-induced deviations must also be characterized at relevant length scales.
Surface condition is also important because microscale and nanoscale irregularities can influence wetting behavior and act as local stress concentrators [
20]. In additively manufactured NiTi lattice struts, surface characterization and stress concentration analysis showed that strut diameter and inclination angle significantly affected geometric accuracy, surface texture, and stress concentration [
21]. Similarly, studies on LPBF-fabricated small-scale tensile specimens have shown that structure scale affects surface morphology and mechanical behavior through heat accumulation, melt-pool morphology, scan-track overlap, and layer-wise buildup [
22]. These findings are relevant to TPMS geometries because curved and interconnected surfaces may amplify staircase effects, balling, and roughness variations that are not fully captured by conventional two-dimensional or line-based measurements.
The interaction between surface morphology and wetting behavior has also been explored in TPMS-inspired and microstructured surfaces [
23,
24]. Numerical analysis of miniature TPMS substrates has shown that pore size, contact angle, impact velocity, and surface geometry can influence droplet rebound, adhesion, and impalement behavior [
25]. Compared with flat substrates, TPMS structures can alter droplet dynamics because their porous and curved geometries influence local air retention and solid–liquid contact [
25,
26]. However, the ability of a surface to support anti-wetting or water-shedding behavior depends not only on designed geometry but also on the actual manufactured surface condition, including roughness, defects, and coating uniformity [
27,
28].
A key limitation in characterizing TPMS and other complex additively manufactured surfaces is that conventional line-based measurements may not fully represent spatially heterogeneous roughness, curvature, or defect distribution. Line-based measurements provide useful information along a defined path but cannot capture the full topological complexity of interconnected, negatively curved, or defect-rich structures. Prior work using modeling approaches for curved carbon TPMS has emphasized that areal methods can provide more complete spatial characterization of complex surfaces [
29]. X-ray micro-tomography has also been used as a non-destructive method to visualize internal features and porosity in complex additively manufactured structures [
30]. These studies highlight the need for characterization approaches that connect surface morphology, roughness, and compositional analysis across multiple length scales.
Surface and material characterization provide complementary information for evaluating LPBF-fabricated structures [
31]. Surface characterization focuses on morphology, topography, roughness, and localized features, whereas compositional characterization provides information on elemental distribution and surface chemical variation [
32,
33,
34]. Digital optical microscopy and scanning electron microscopy (SEM) are widely used for multiscale analysis because they provide complementary visualization across different surface length scales [
35]. Three-dimensional optical microscopy can generate surface profiles and roughness measurements, including average maximum profile height, Rz. Rz provides greater sensitivity to peak-to-valley variations and is useful when extreme surface features are important [
36,
37]. For LPBF structures, where balling, pores, coating cracks, and scan-track features may produce localized peaks and valleys, roughness metrics should be interpreted together with direct imaging.
SEM further extends characterization by enabling higher-resolution observation of surface morphology [
38]. Secondary electron imaging is useful for examining surface topography, while backscattered electron imaging can provide compositional contrast. When coupled with energy-dispersive X-ray spectroscopy (EDS), SEM can also provide elemental mapping and semi-quantitative chemical information from localized regions of interest [
39]. This combination is valuable for LPBF-fabricated SS structures because surface elemental composition and distribution may vary after thermal aging, mechanical blasting, and hydrophobic coating. Oxide formation, precipitate distribution, contamination, coating chemistry, and substrate exposure can influence surface condition and subsequent functional relevance. Therefore, integrating optical microscopy, 3D surface profiling, SEM, and EDS allows the surface to be examined as both a geometrically and chemically modified interface. The value of multiscale characterization extends across architected metallic-material systems. In multiscale titanium-matrix composites, complementary microstructural and mechanical analyses have linked reinforcement architecture and microscale internal stress to creep resistance, while systematic characterization across processing conditions has revealed the evolution and redistribution of reinforcing phases and matrix features [
40,
41].
Despite the growing body of work on TPMS design, LPBF manufacturing, surface roughness, and wetting-related surface behavior, fewer studies have integrated surface imaging, roughness profiling, and elemental analysis across multiple length scales to examine LPBF-induced features in TPMS structures and post-processing effects on representative flat surfaces. This gap is important because complex TPMS geometries contain curved, interconnected, and locally inaccessible regions that make conventional surface assessment difficult, while flat companion samples provide controlled regions for comparing treatment effects. Aging, shot blasting, and hydrophobic coating can modify the surface through different mechanisms: thermal aging can alter oxide-related surface chemistry, shot blasting can reshape asperities and redistribute surface irregularities, and hydrophobic coating can change apparent surface morphology and elemental composition while introducing discontinuities such as cracks or non-uniform coverage. An integrated characterization approach is therefore needed to distinguish geometry-dependent LPBF surface features from treatment-dependent changes in morphology, roughness, coating condition, and elemental composition.
The objective of this study is to characterize LPBF-fabricated 17-4 PH SS TPMS prototypes and representative flat plates across multiple length scales. The contribution of this work is the use of specimen geometries and characterization methods to separate geometry-dependent LPBF features observed on curved TPMS prototypes from treatment-region differences observed on accessible flat plates. Hirox digital microscopy is used to examine geometry-dependent LPBF surface features on the TPMS prototypes, including anisotropic textures, staircase-like transitions, and pore presence. The flat plates provide controlled regions for comparing the effects of aging, shot blasting, hydrophobic coating, and combined blasting-coating using Hirox imaging and 3D profiling, SEM, and EDS. These complementary methods characterize surface morphology, profile roughness response, coating continuity, and elemental composition. By linking surface morphology, profile roughness, coating condition, and elemental composition, this study provides an integrated assessment of geometry- and treatment-dependent surface conditions in LPBF-fabricated SS structures and supports LPBF process refinement and post-processing evaluation.
3. Results
The Results are presented according to the complementary characterization methods used in this study. Features are described according to the calibrated scale bars, magnifications, and approximate analyzed ranges reported for each characterization method. Hirox digital microscopy was used to examine macro- to microscale surface features of the TPMS prototypes and flat plates. Hirox 3D profiling was used to evaluate the surface roughness response of the flat plate treatment regions, while SEM and EDS provided higher-resolution morphological and elemental information from selected flat plate regions.
3.1. Hirox Imaging of Macro- to Microscale TPMS
Hirox digital microscopy was first used to examine the top surfaces of the LPBF-fabricated TPMS prototypes. For each TPMS prototype, the Hirox multifocal capture function combined multiple two-dimensional images acquired at different focal planes, producing a focused image of the macro- to microscale surface features. The resulting images showed the non-planar and curved nature of TPMS top surfaces, where peaks, valleys, grooves, and scan-track-related textures form a complex three-dimensional surface network.
The bright regions observed in the Hirox images correspond to local variations in surface reflectivity. These variations are associated with changes in local surface slope, scan-track orientation, and surface height. Across the examined TPMS surfaces, the surface texture appeared non-uniform and anisotropic, with visible alignment along laser scan paths and local geometric features. Directional ripples and striations were observed over the 5000–1000 µm scale range, indicating the presence of layer-wise and scan-path-related surface features associated with LPBF fabrication.
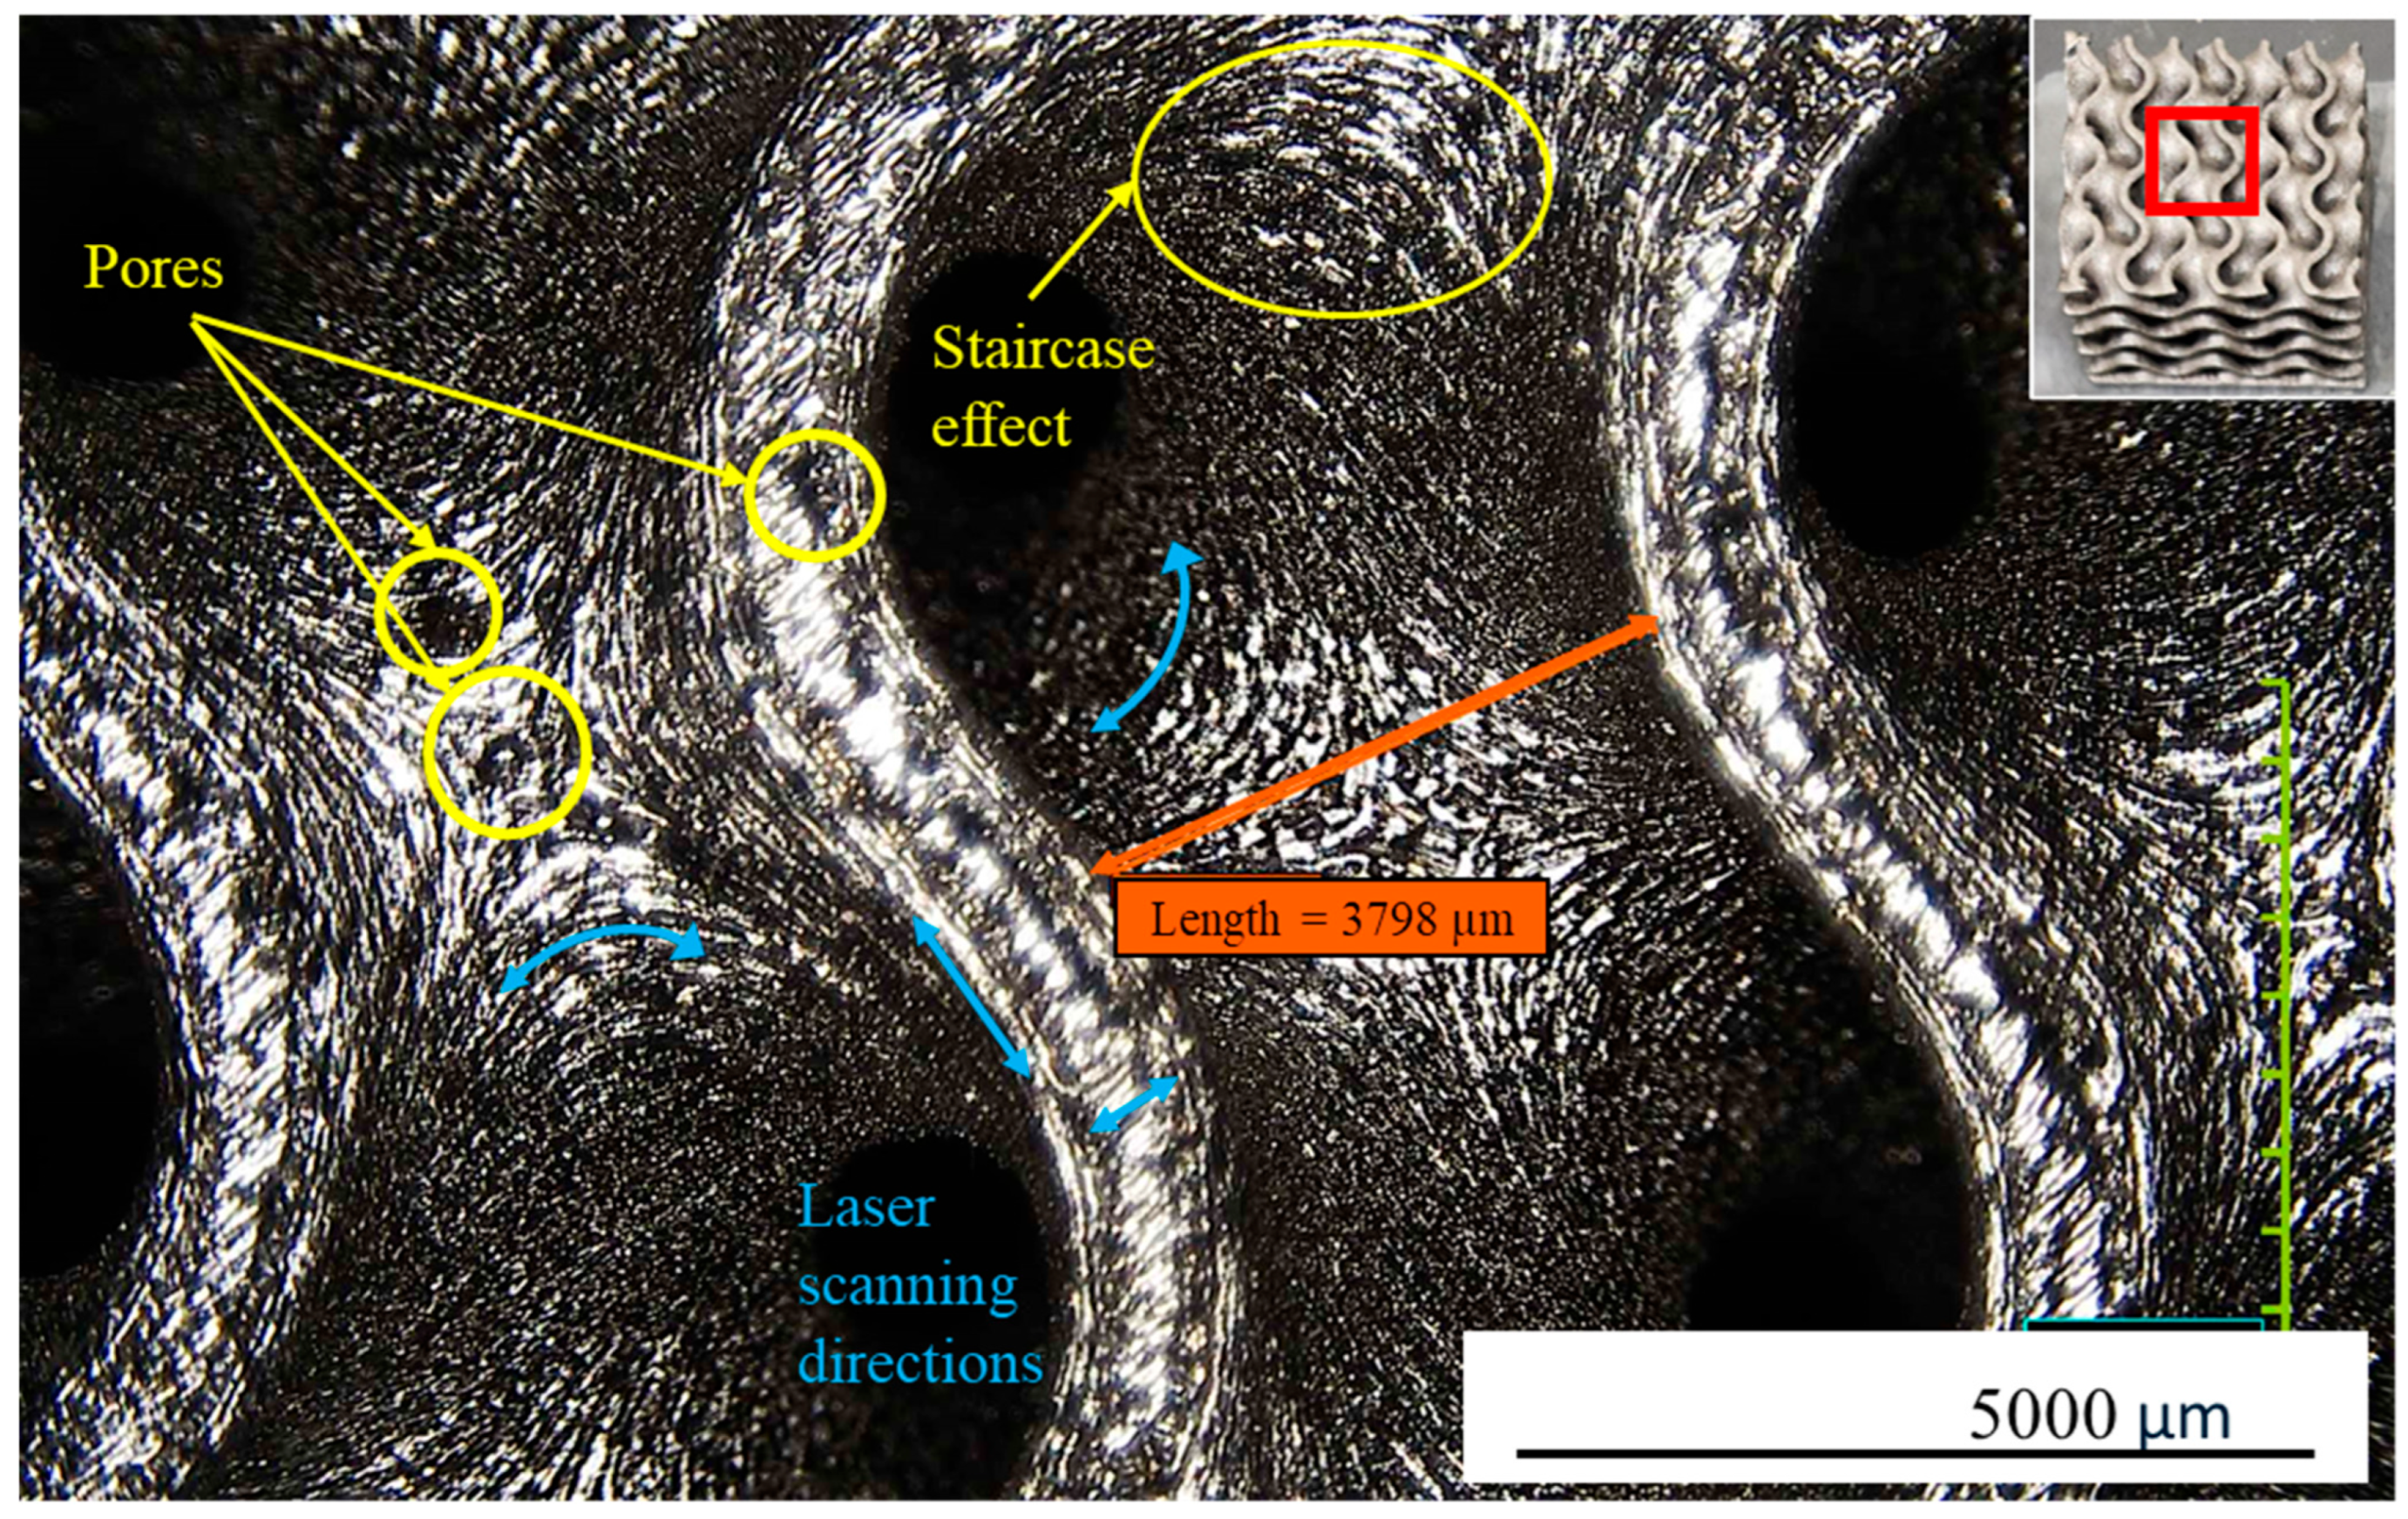
In the Gyroid prototype, features consistent with LPBF-induced surface irregularities, including pores and staircase-like surface transitions, were visible at the 5000 µm scale, as shown in
Figure 2. The blue double arrows indicate the apparent laser scanning directions on the curved surface. The apparent scan-pattern orientation varied with the local TPMS geometry. Within the examined field of view, no substantial accumulation of loose powder was visually apparent, although localized pores and surface-height variations were present.
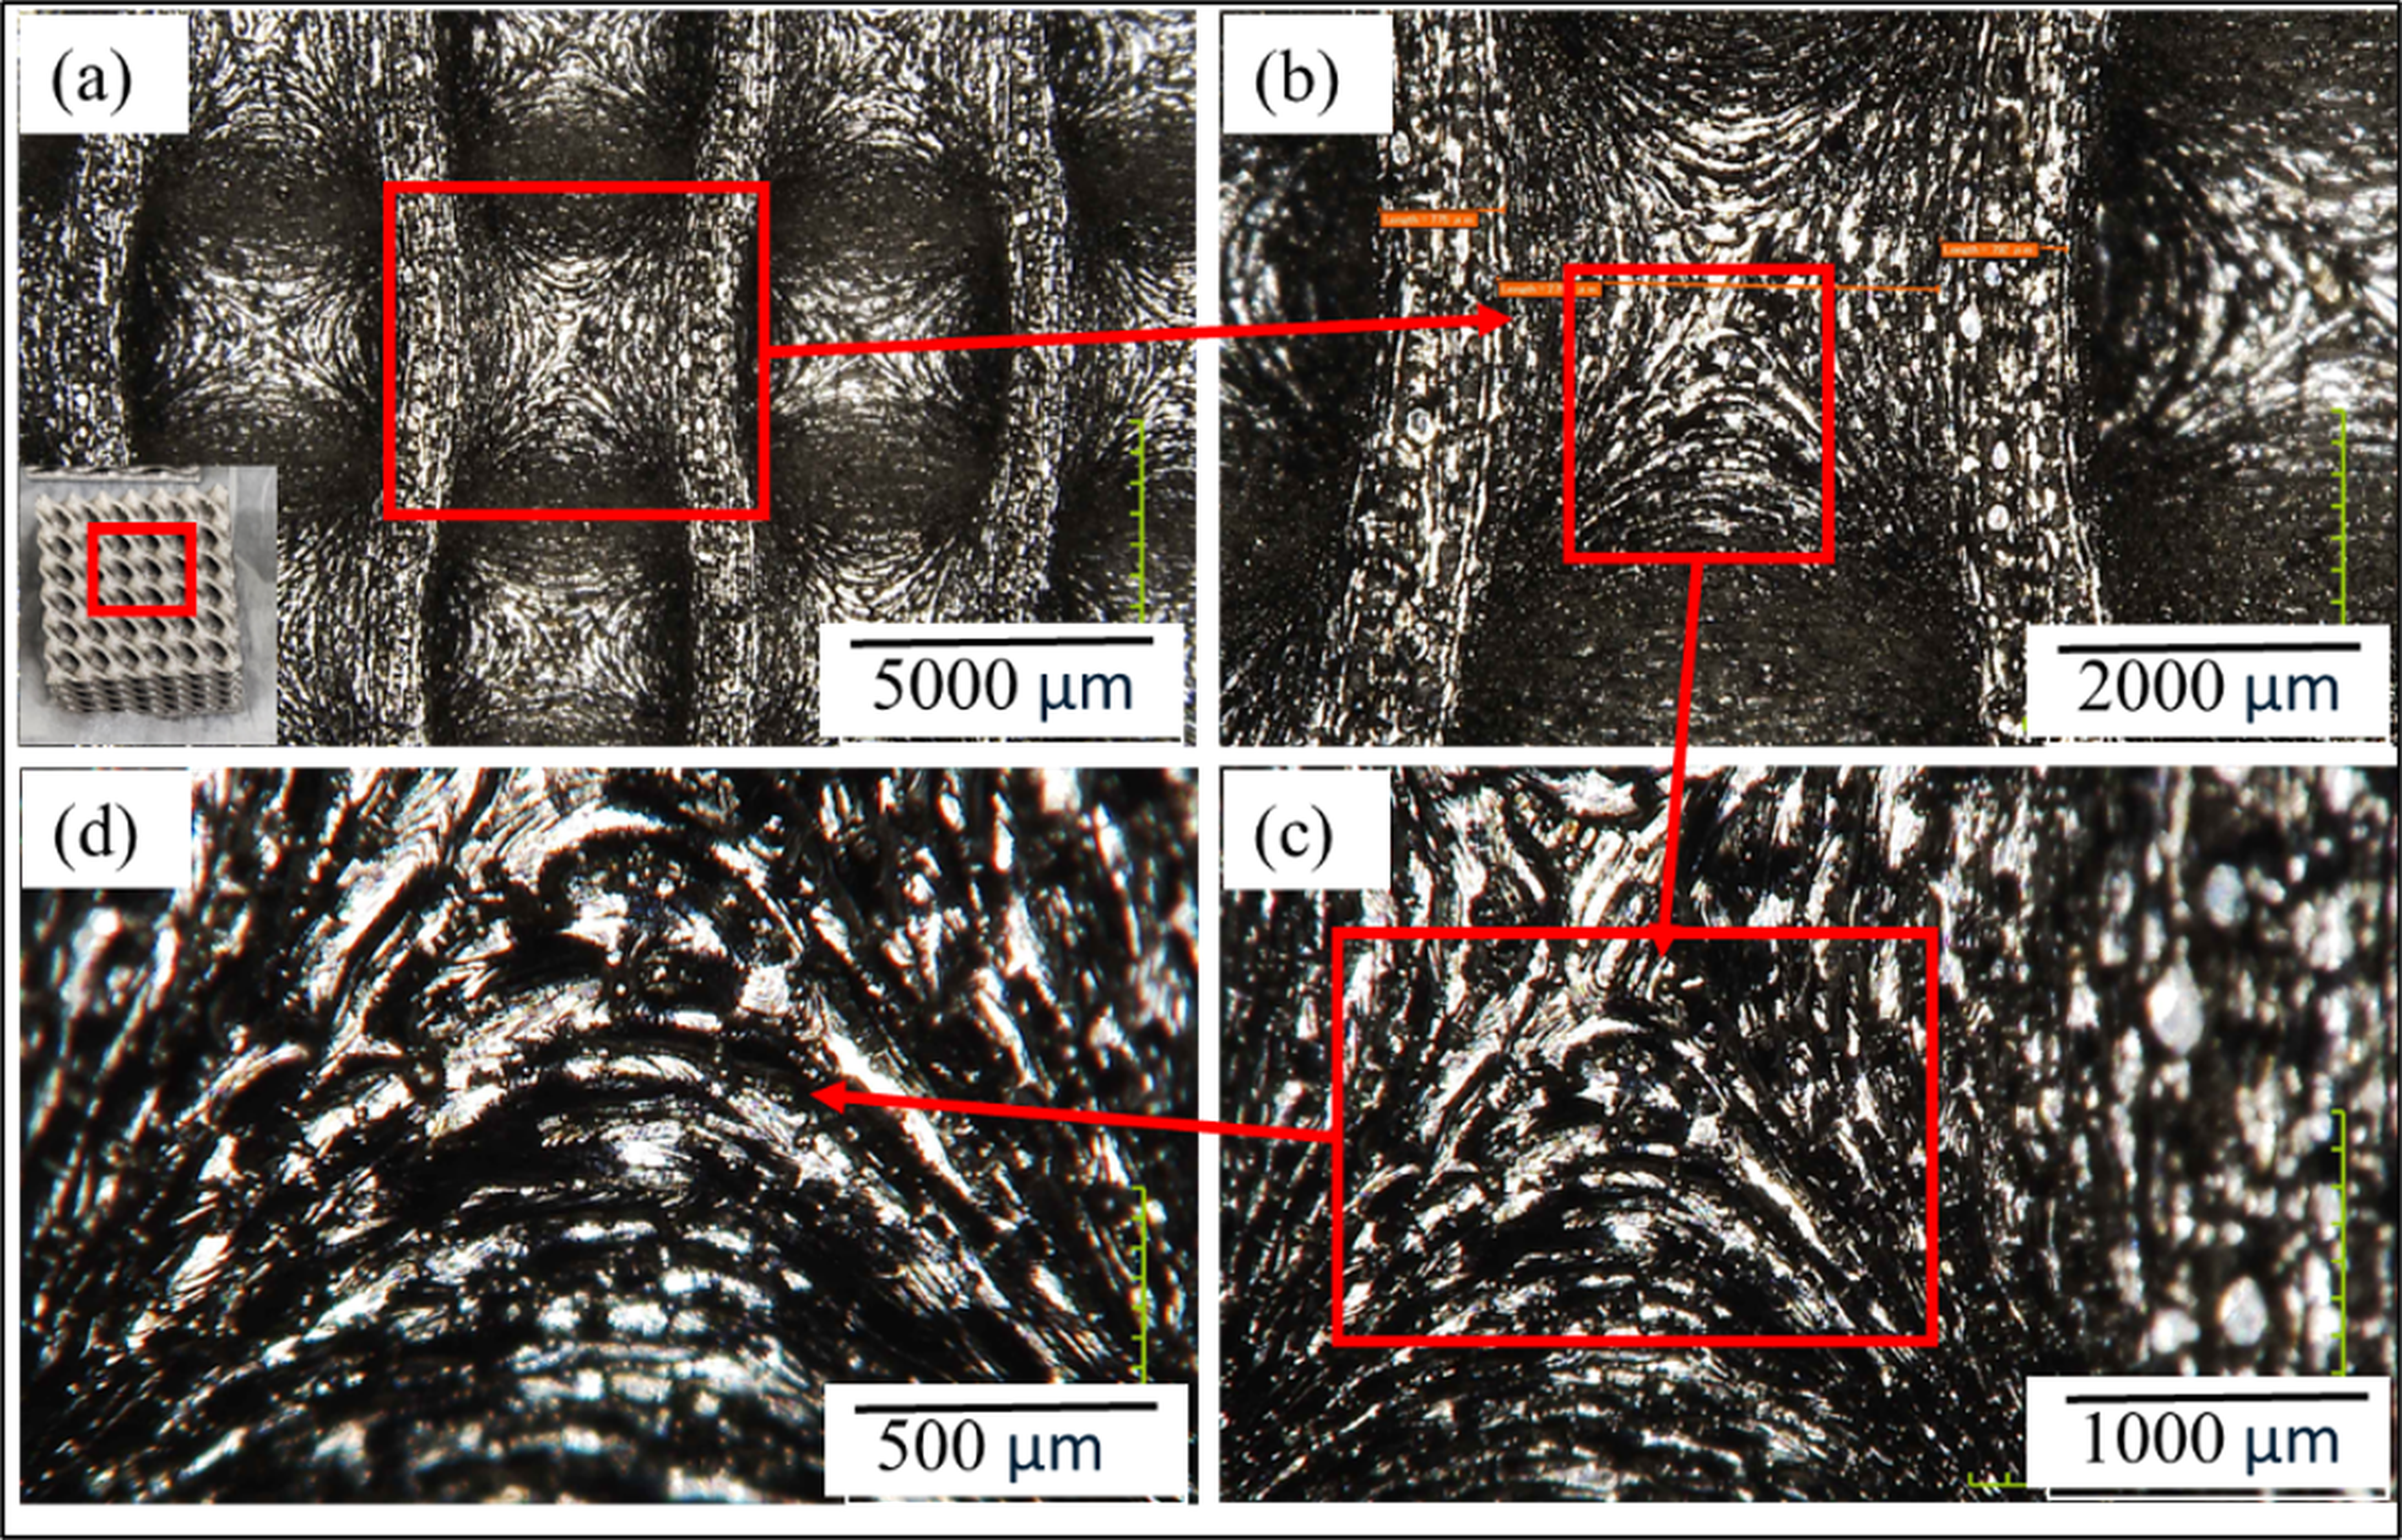
The progressively magnified regions in the Diamond prototype further revealed the spatial variation in surface morphology across the TPMS surface, as shown in
Figure 3. The regions marked by red boxes and arrows show increasingly smaller surface areas, where the scan-pattern features become more evident. At lower magnification, the scan texture appeared as broader directional bands, whereas finer ridges, grooves, and localized irregularities became visible at higher magnification. The surface features varied between edge regions and interior regions, with some regions showing finer features and others showing more densely packed or coarse surface patterns.
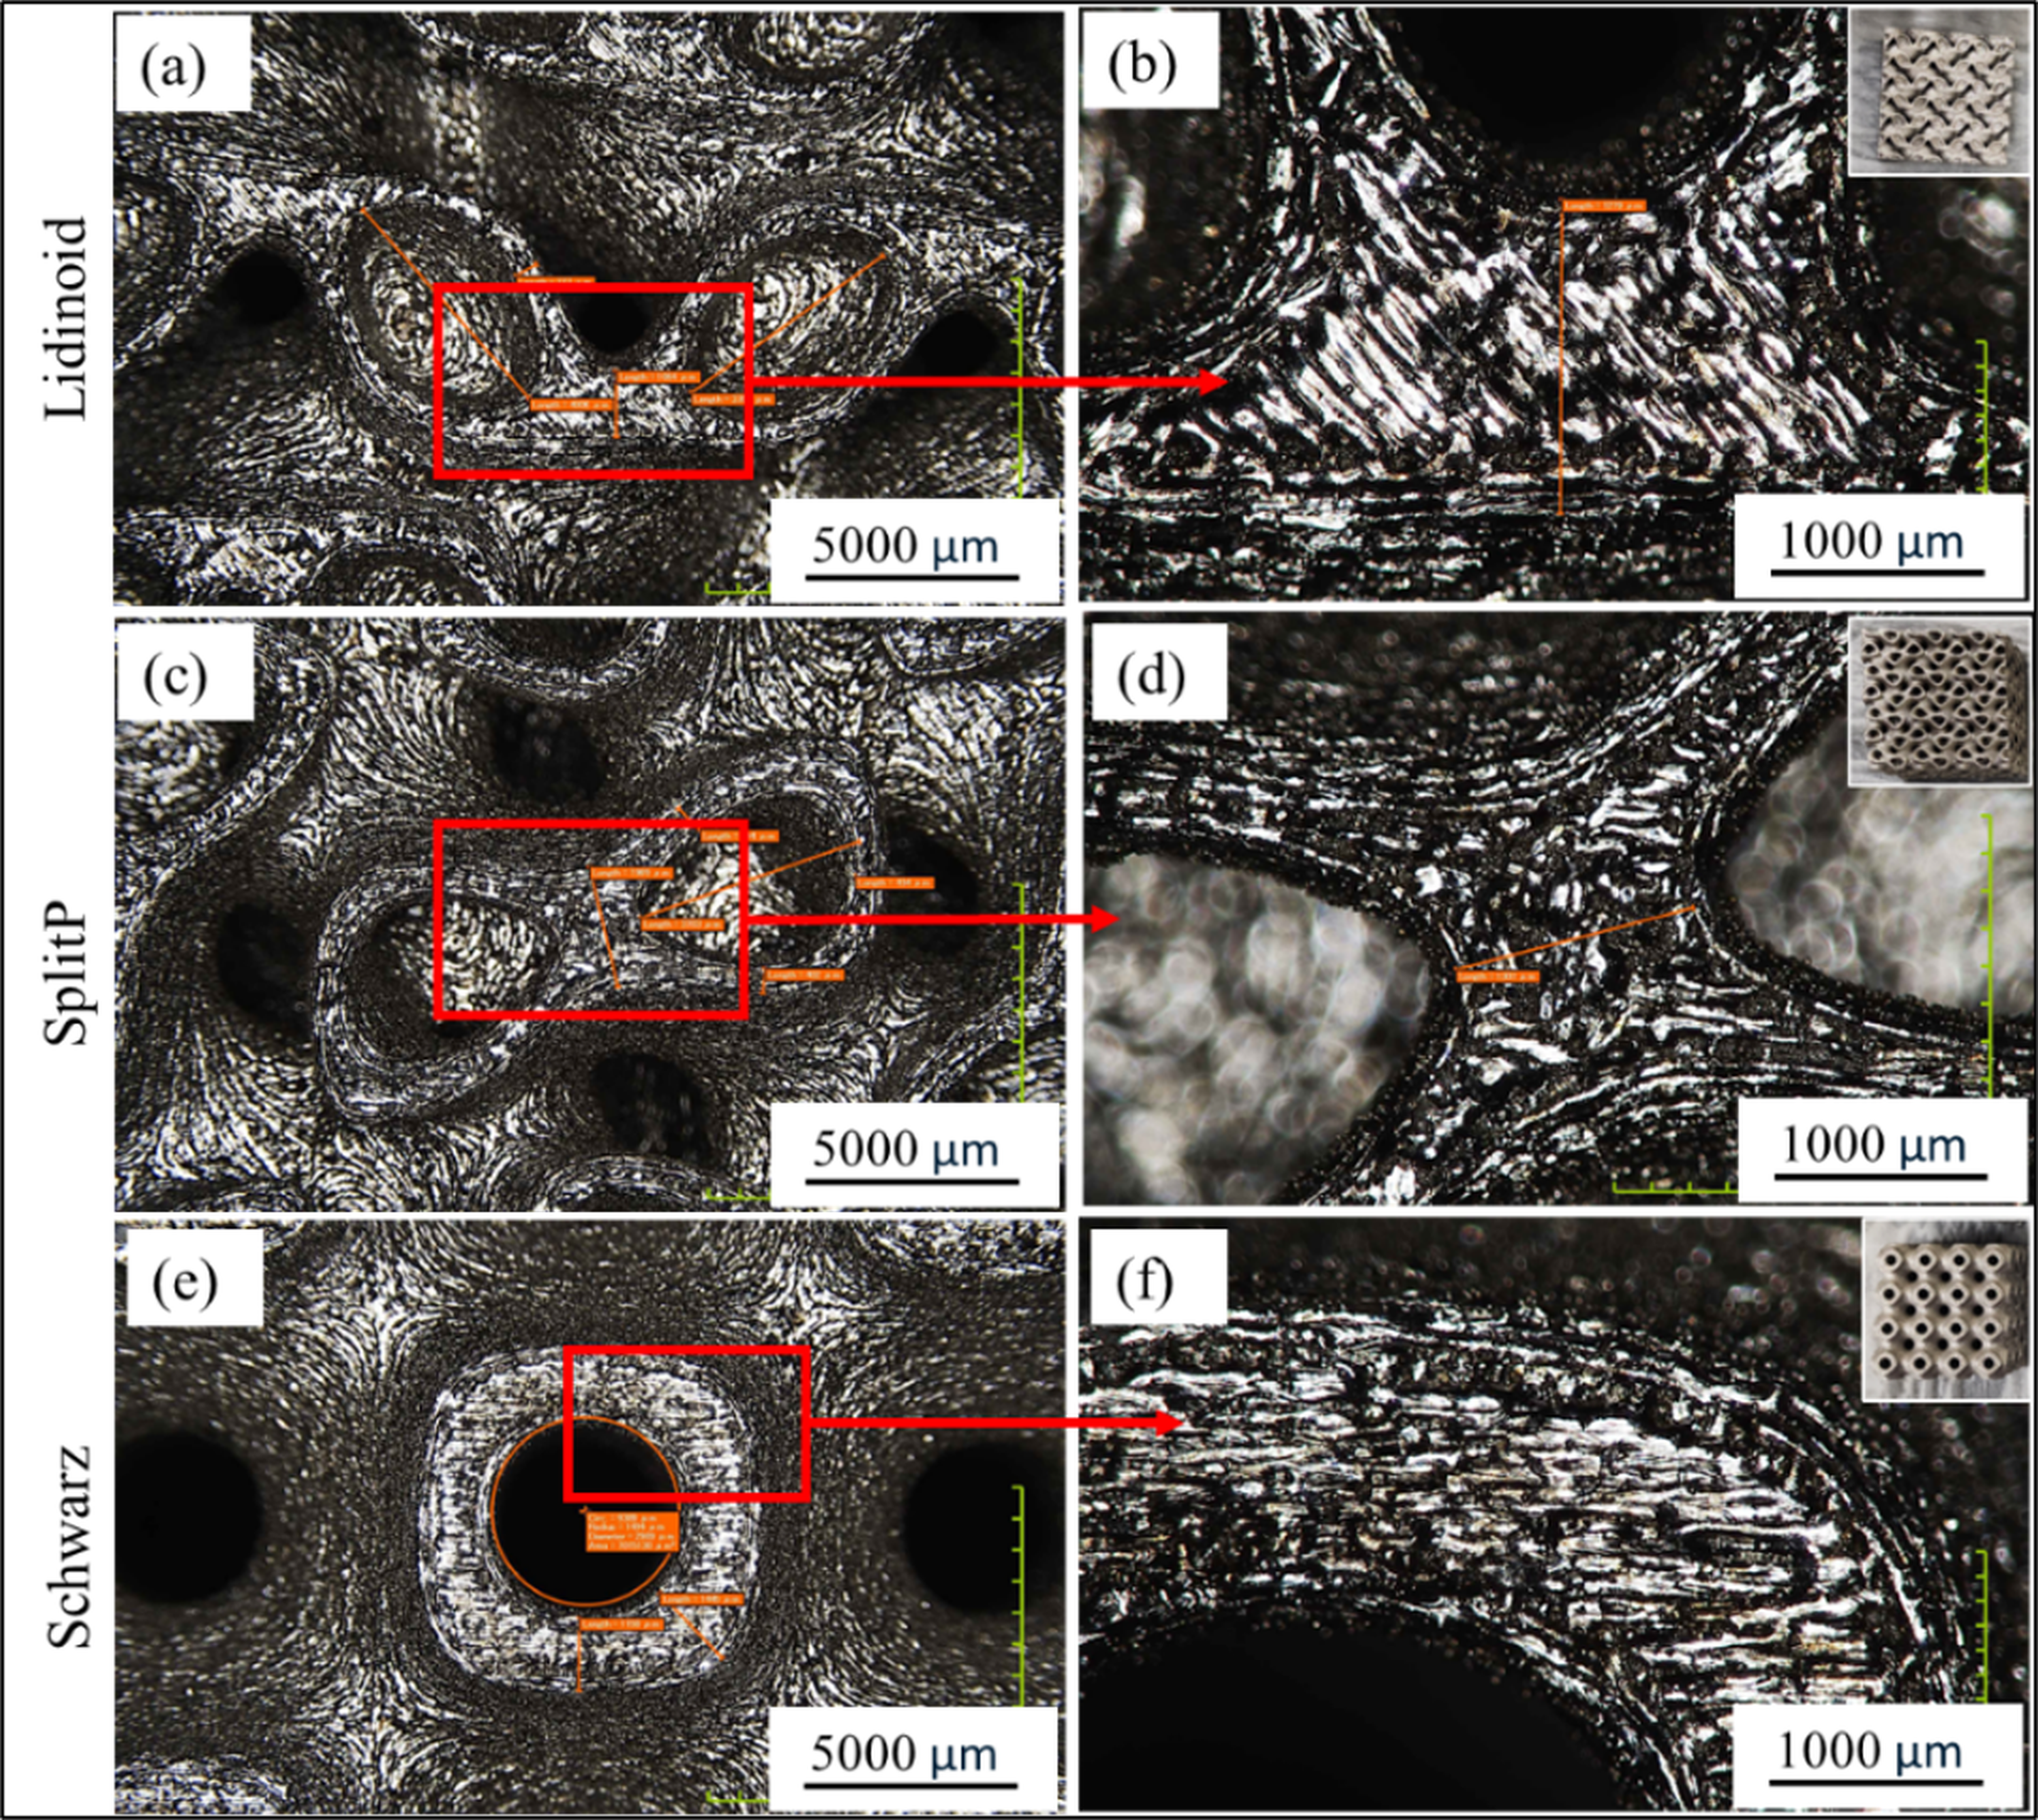
Similar scan-related surface features were observed on the Lidinoid, SplitP, and Schwarz prototypes, as shown in
Figure 4. The 5000 µm images showed the overall top-face morphology of each geometry, while the 1000 µm images revealed finer surface patterns, grooves, and localized height variations. Across these TPMS geometries, the surface morphology varied with local curvature and geometric orientation. Small voids, pits, and embedded particle-like features were observed in selected regions. These observations were consistent with previously reported LPBF surface features, including pores and partially melted powder particles [
11,
17].
3.2. Hirox Imaging of Macro- to Microscale Flat Plates
3.2.1. Characterization of Surface Treatment Regions
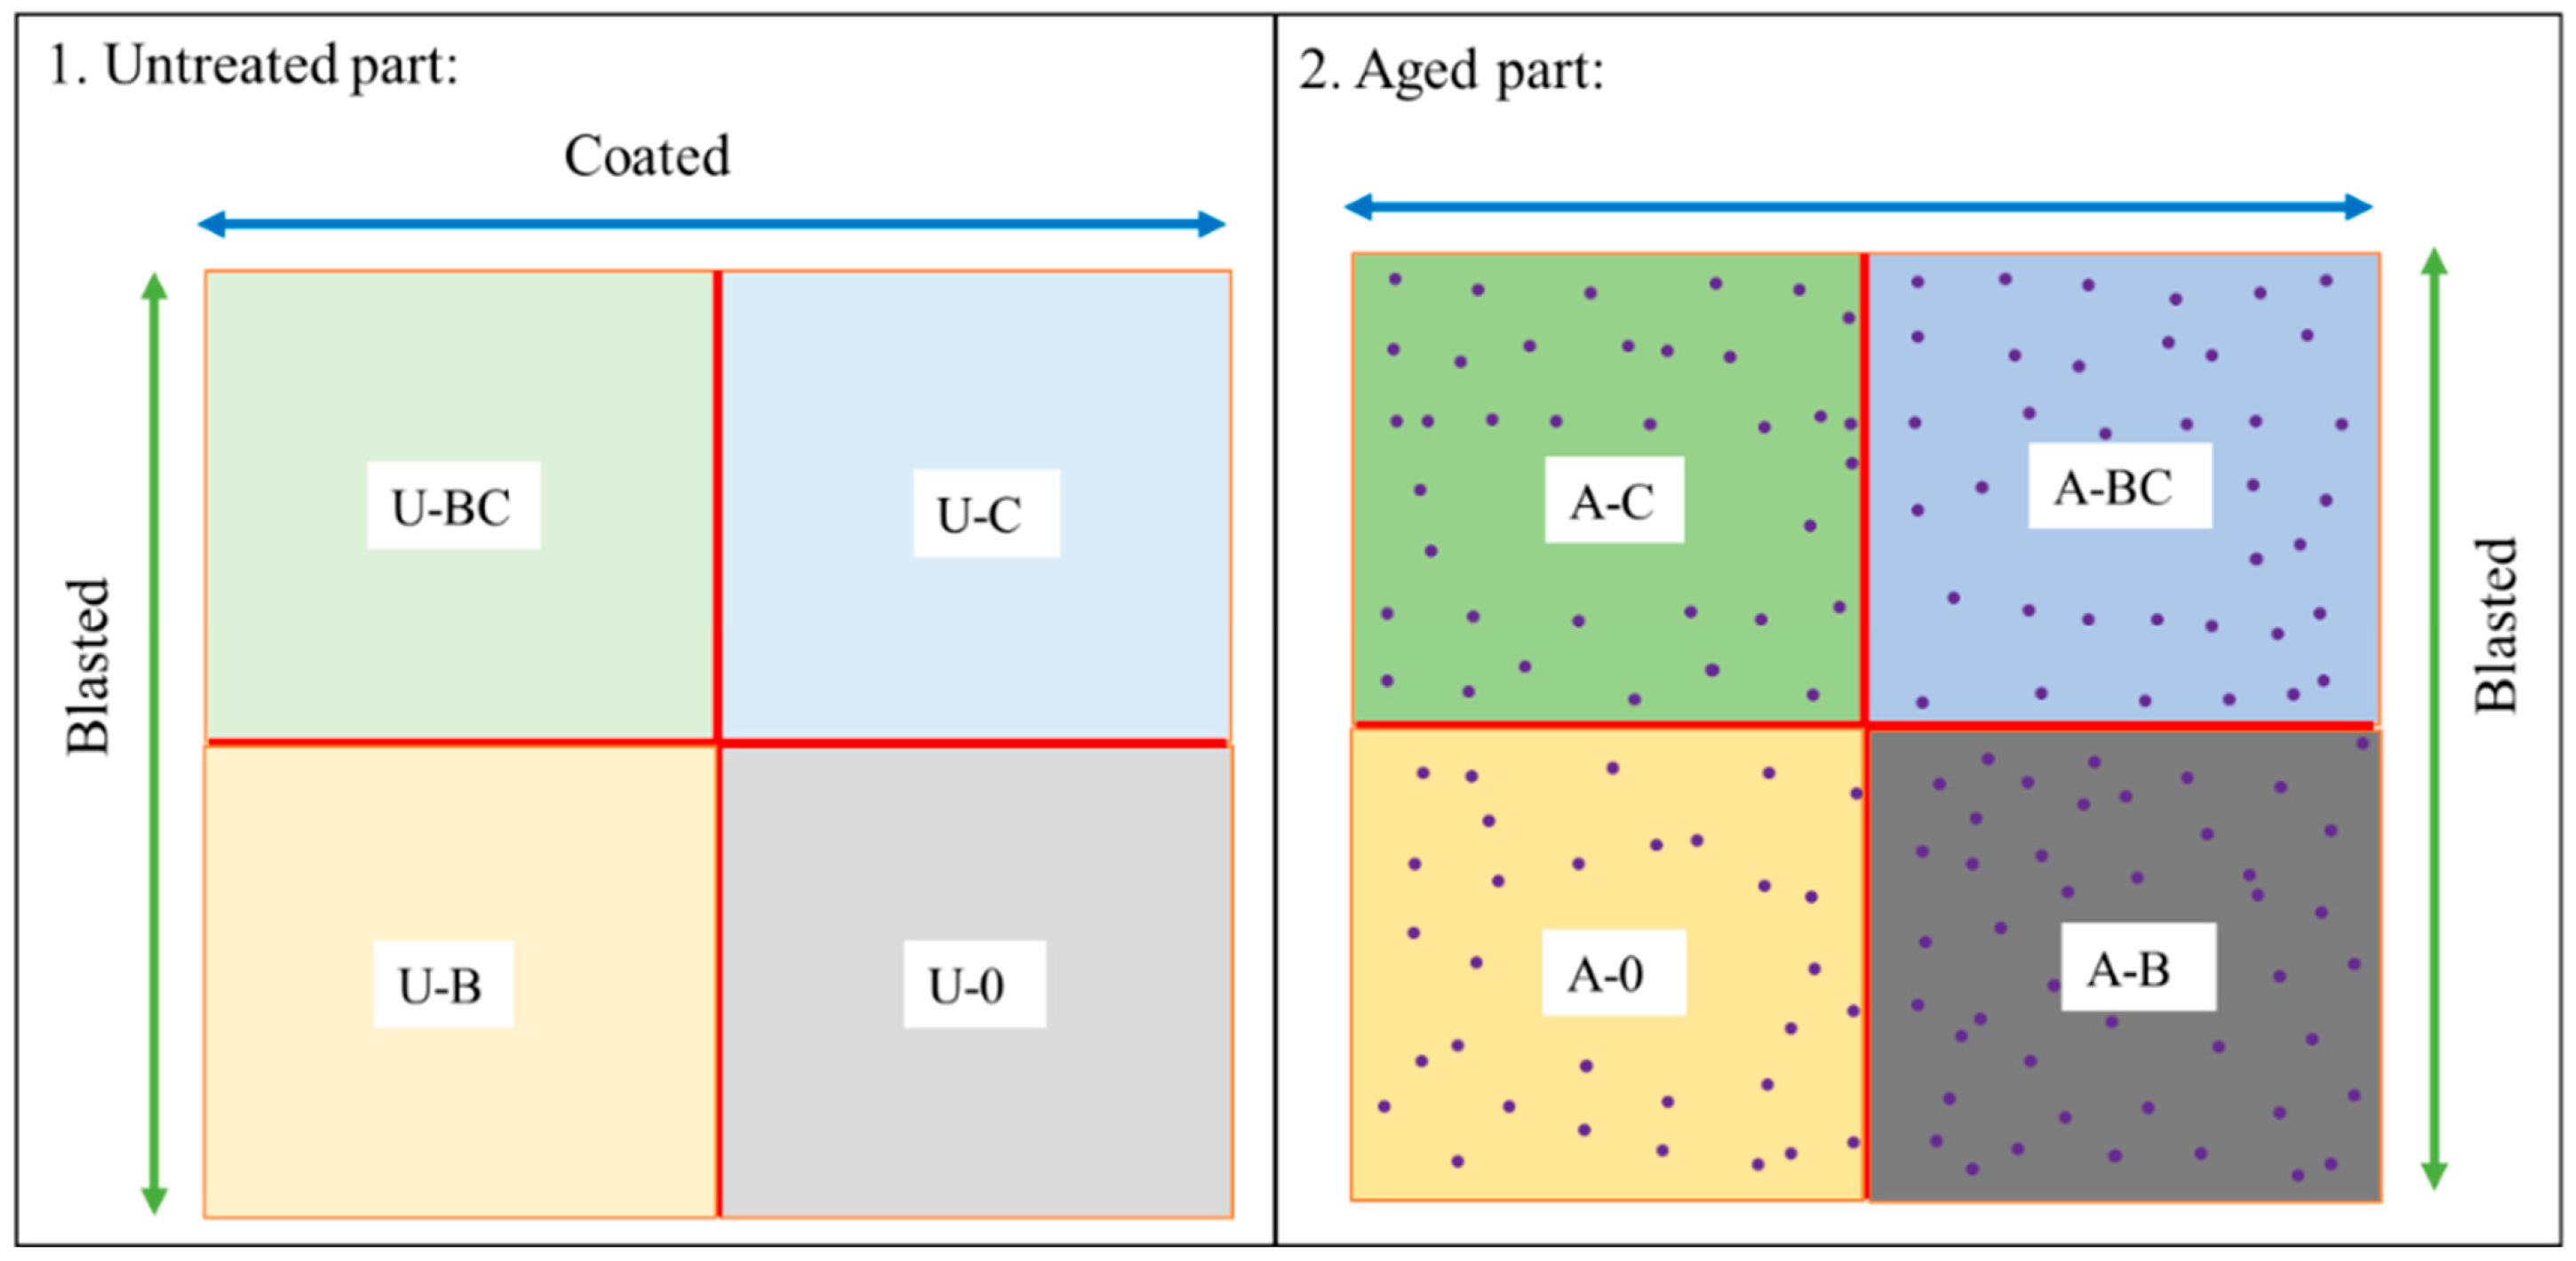
The flat plate treatment regions were examined using Hirox digital optical microscopy over the reported 2000–500 µm scale range. Regions subjected to comparable blasting and coating conditions were presented together to compare the untreated and aged plates. The treatment codes correspond to the surface-treatment matrix described in
Section 2.2.
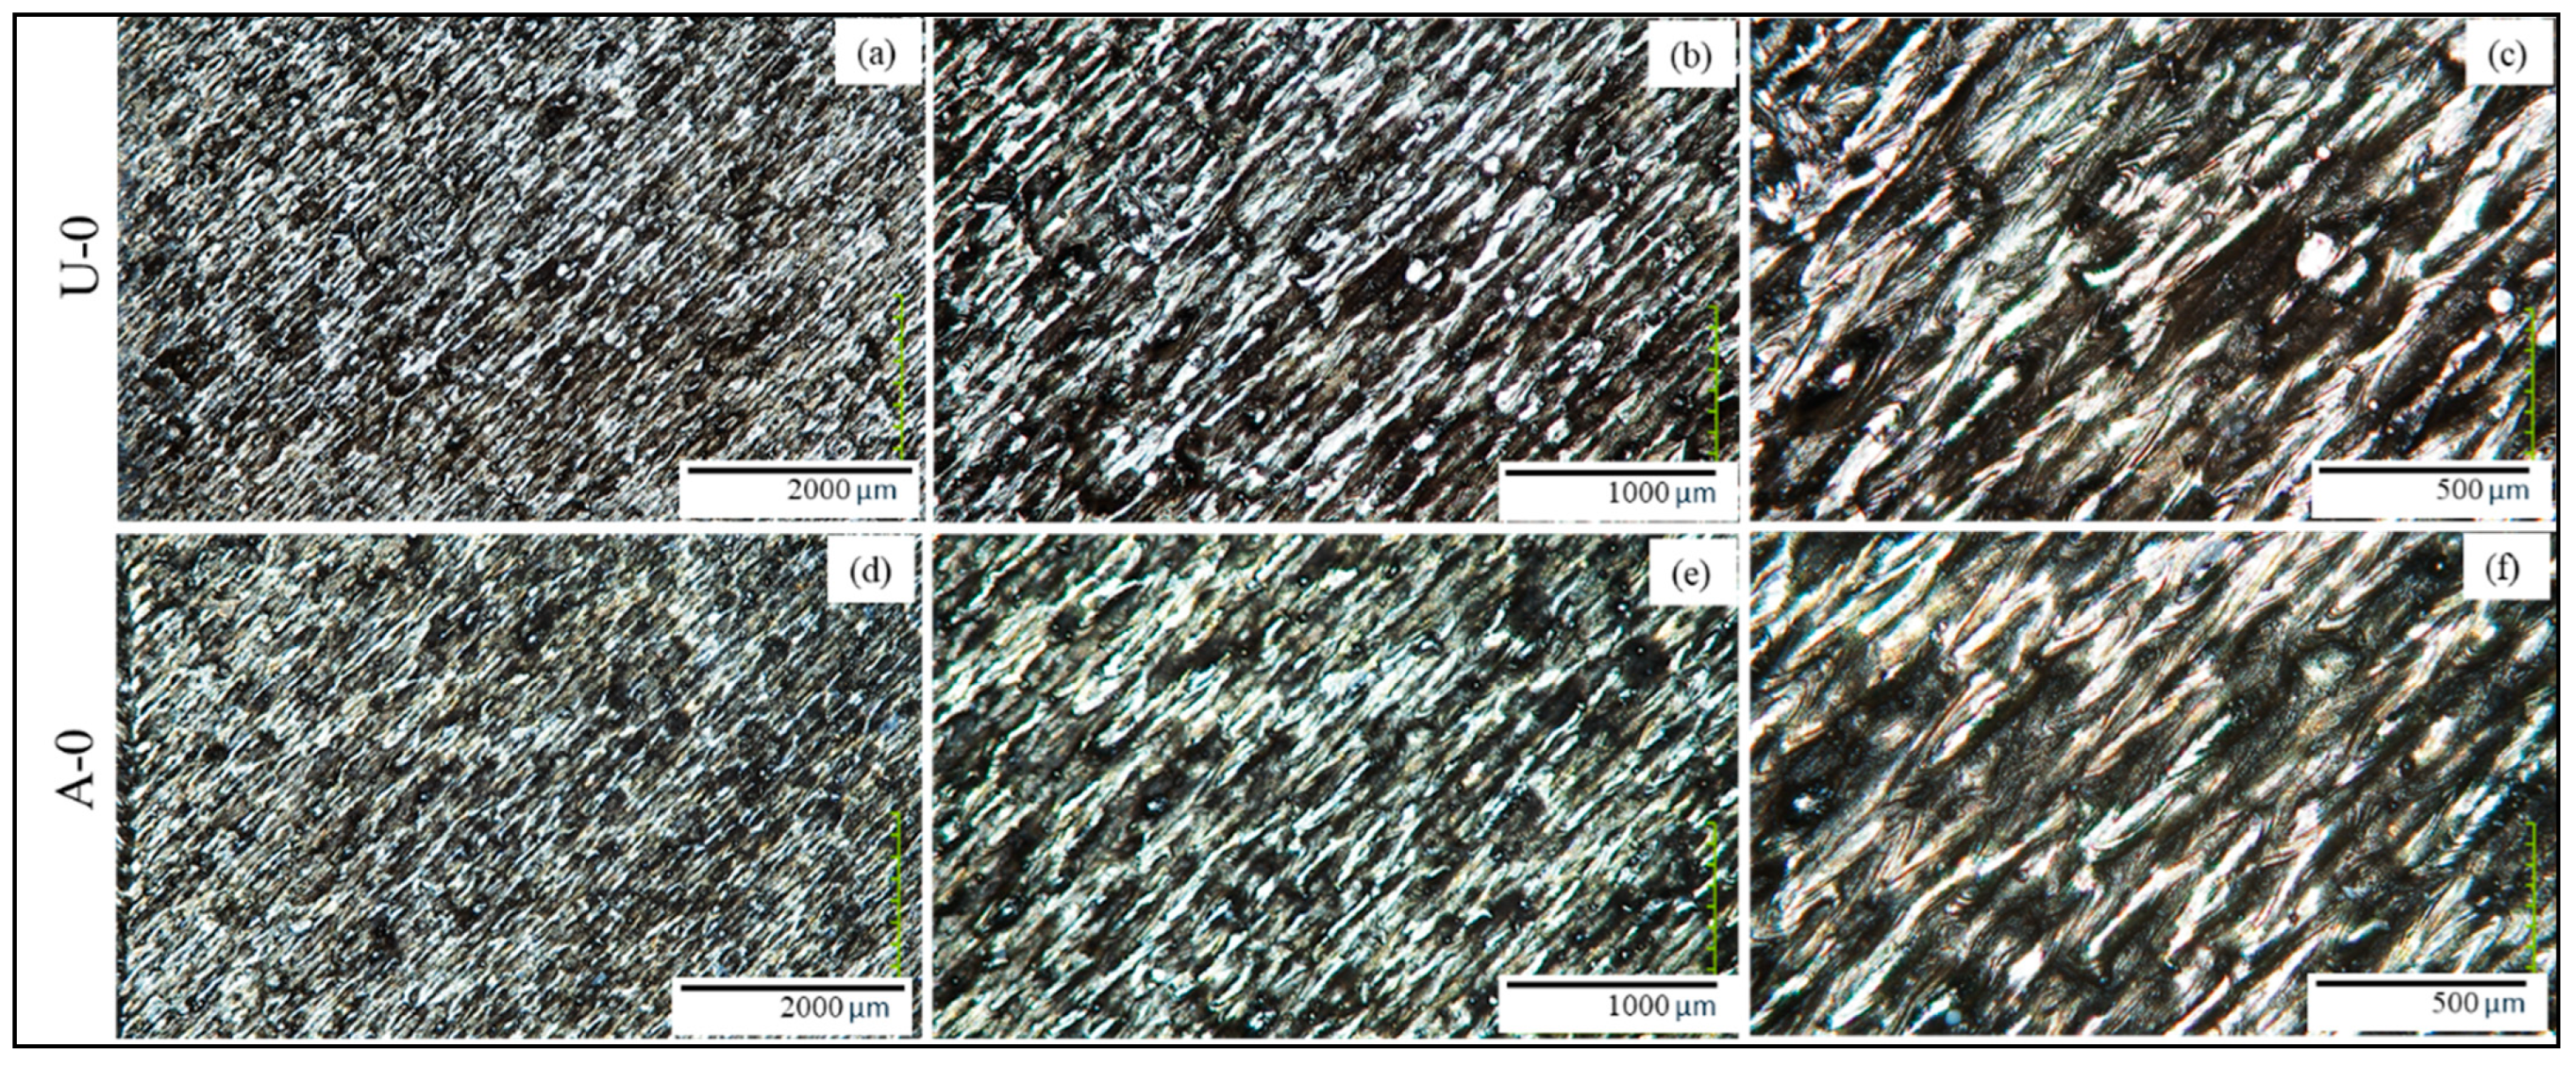
The U-0 and A-0 regions showed similar directional surface textures, as shown in
Figure 5. In both cases, striated macro-patterns were visible across the examined magnification range, consistent with laser scan-path features generated during LPBF fabrication. The streaked regions showed higher reflectivity than adjacent groove regions. At higher magnification, particularly at the 500 µm scale, localized cavity-like and particle-like surface features were observed. These features were morphologically comparable to the scan-related textures and localized irregularities observed on the TPMS prototypes and to LPBF surface features reported previously [
11,
17].
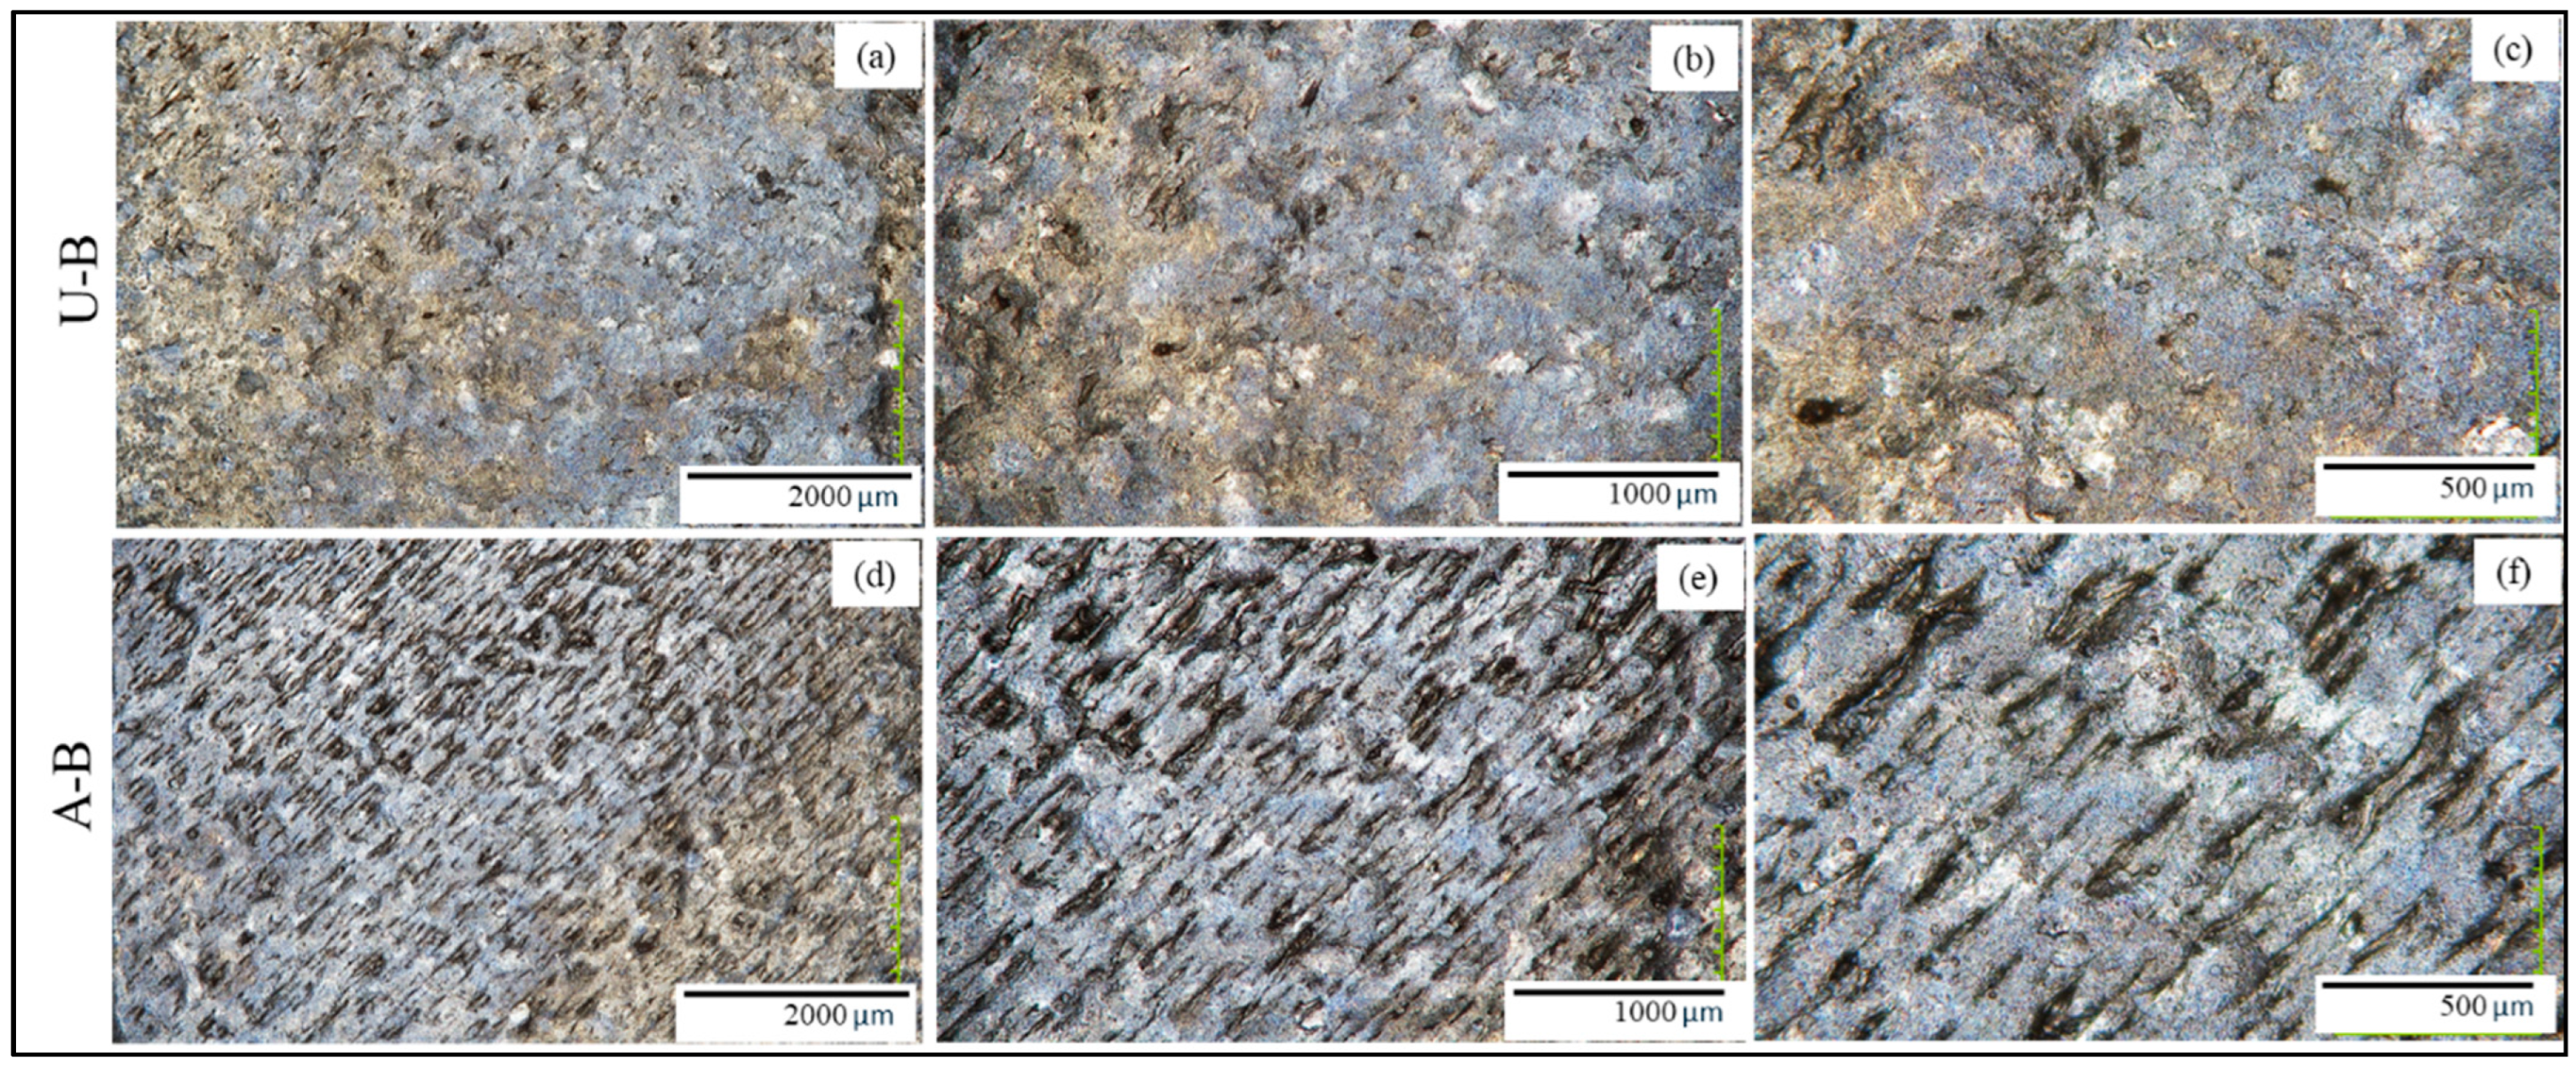
The blasted regions showed clear changes in surface morphology relative to the corresponding non-blasted regions, as shown in
Figure 6. In the U-B region, the surface appeared more irregular and less directionally striated than U-0, with scattered dark pits and reduced visibility of the original macro-scale scan texture. In the A-B region, some residual scan-related texture remained visible, and the blasting effect appeared less pronounced than in U-B within the examined field of view. Within the examined fields of view, the aged and untreated surfaces exhibited different residual scan-pattern visibility after blasting.
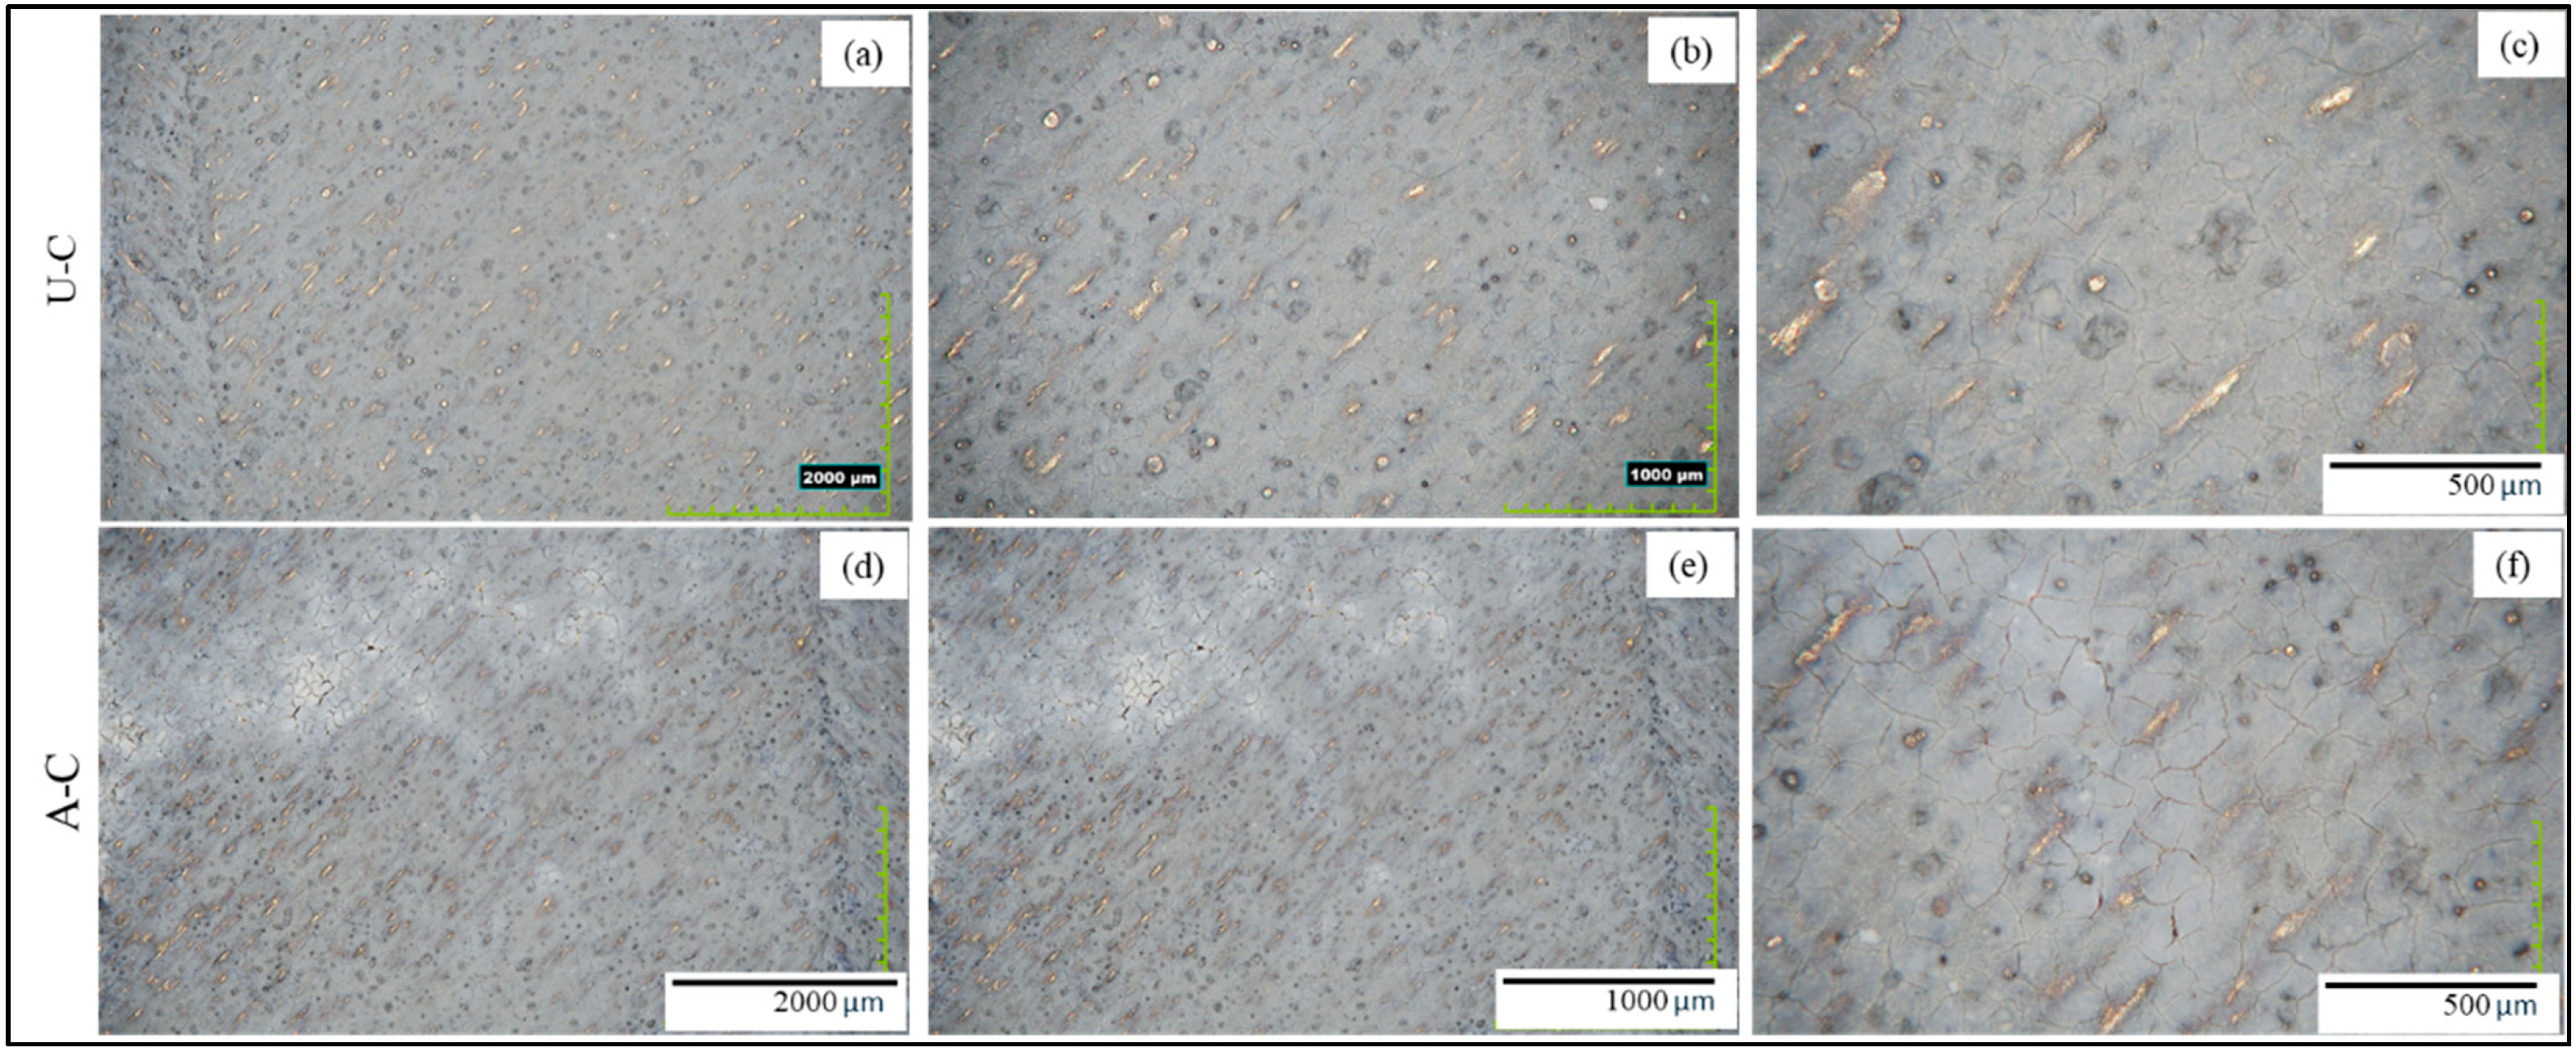
The coated regions, U-C and A-C, showed partial surface coverage by the hydrophobic spray coating, as shown in
Figure 7. In both regions, gray coating coverage was visible, but shiny peaks, directional scan-pattern features, and circular pore-like features remained visible in selected areas. This indicates that the coating did not completely cover or obscure the underlying LPBF surface morphology. At higher magnification, irregular cracks were visible within the coating layer. Variations in gray contrast were also observed, consistent with spatial variation in apparent coating coverage or distribution across the examined regions.
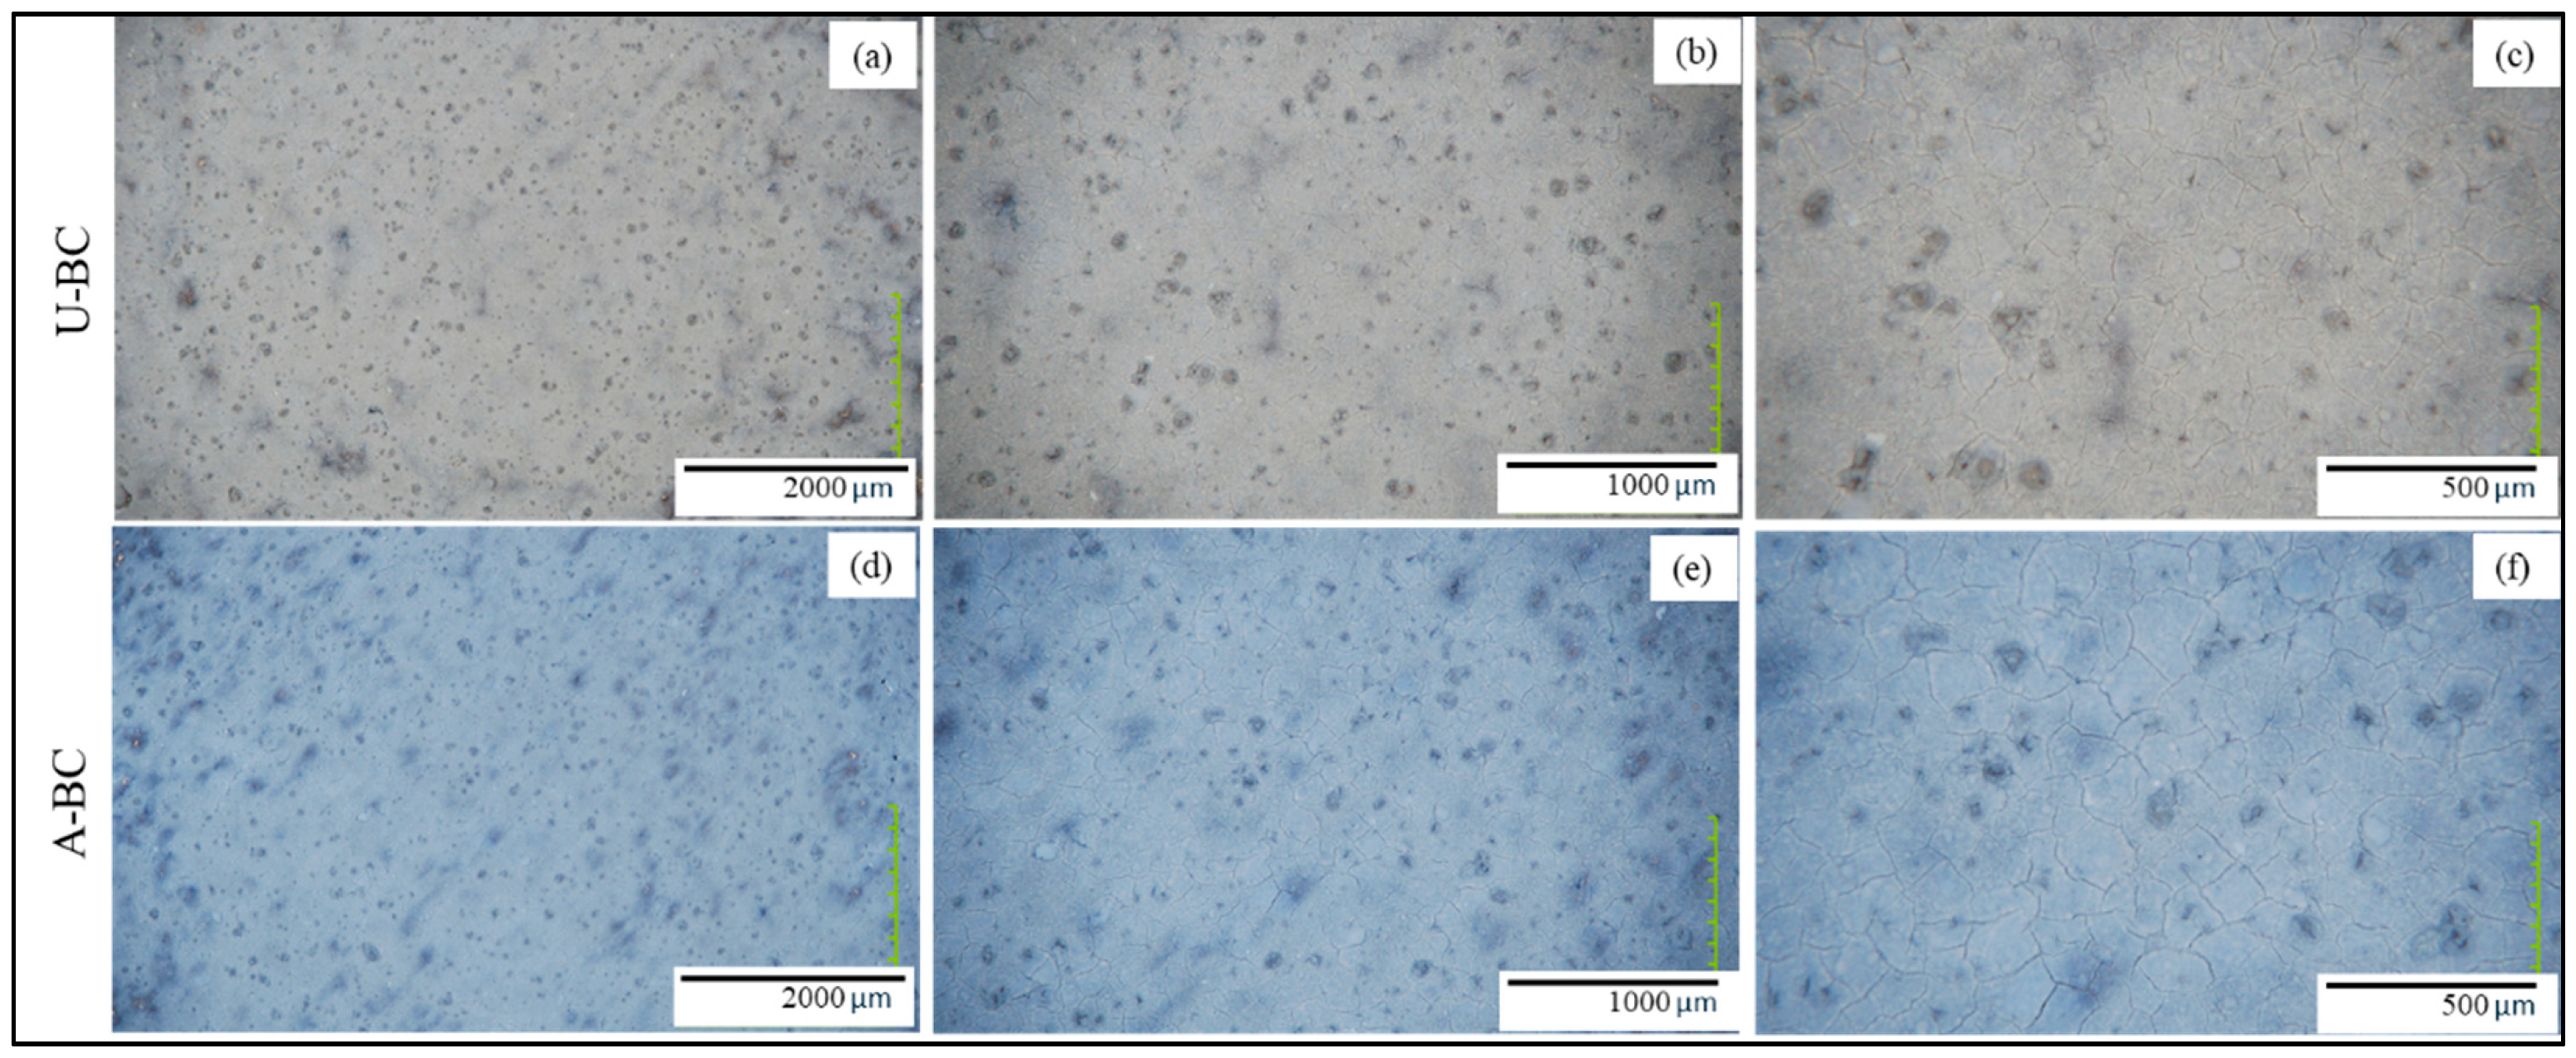
The blasted-plus-coated regions, U-BC and A-BC, showed more uniform visual coverage than the coated-only regions, as shown in
Figure 8. In these regions, the original directional scan texture was less visible or only subtly visible beneath the coating. However, cracks in the coating layer remained evident at higher magnification. Dark regions were also observed in selected areas and may correspond to local coating discontinuities or underlying surface features. The A-BC images appeared to have a blue tint due to automatic color adjustment during Hirox imaging; visually, the actual coating color was gray, similar to U-BC. Within the examined fields of view, the blasted-plus-coated regions showed greater apparent coverage of the underlying substrate than the coated-only regions, although coating cracks remained visible.
3.2.2. Surface Roughness from Hirox 3D Profiling
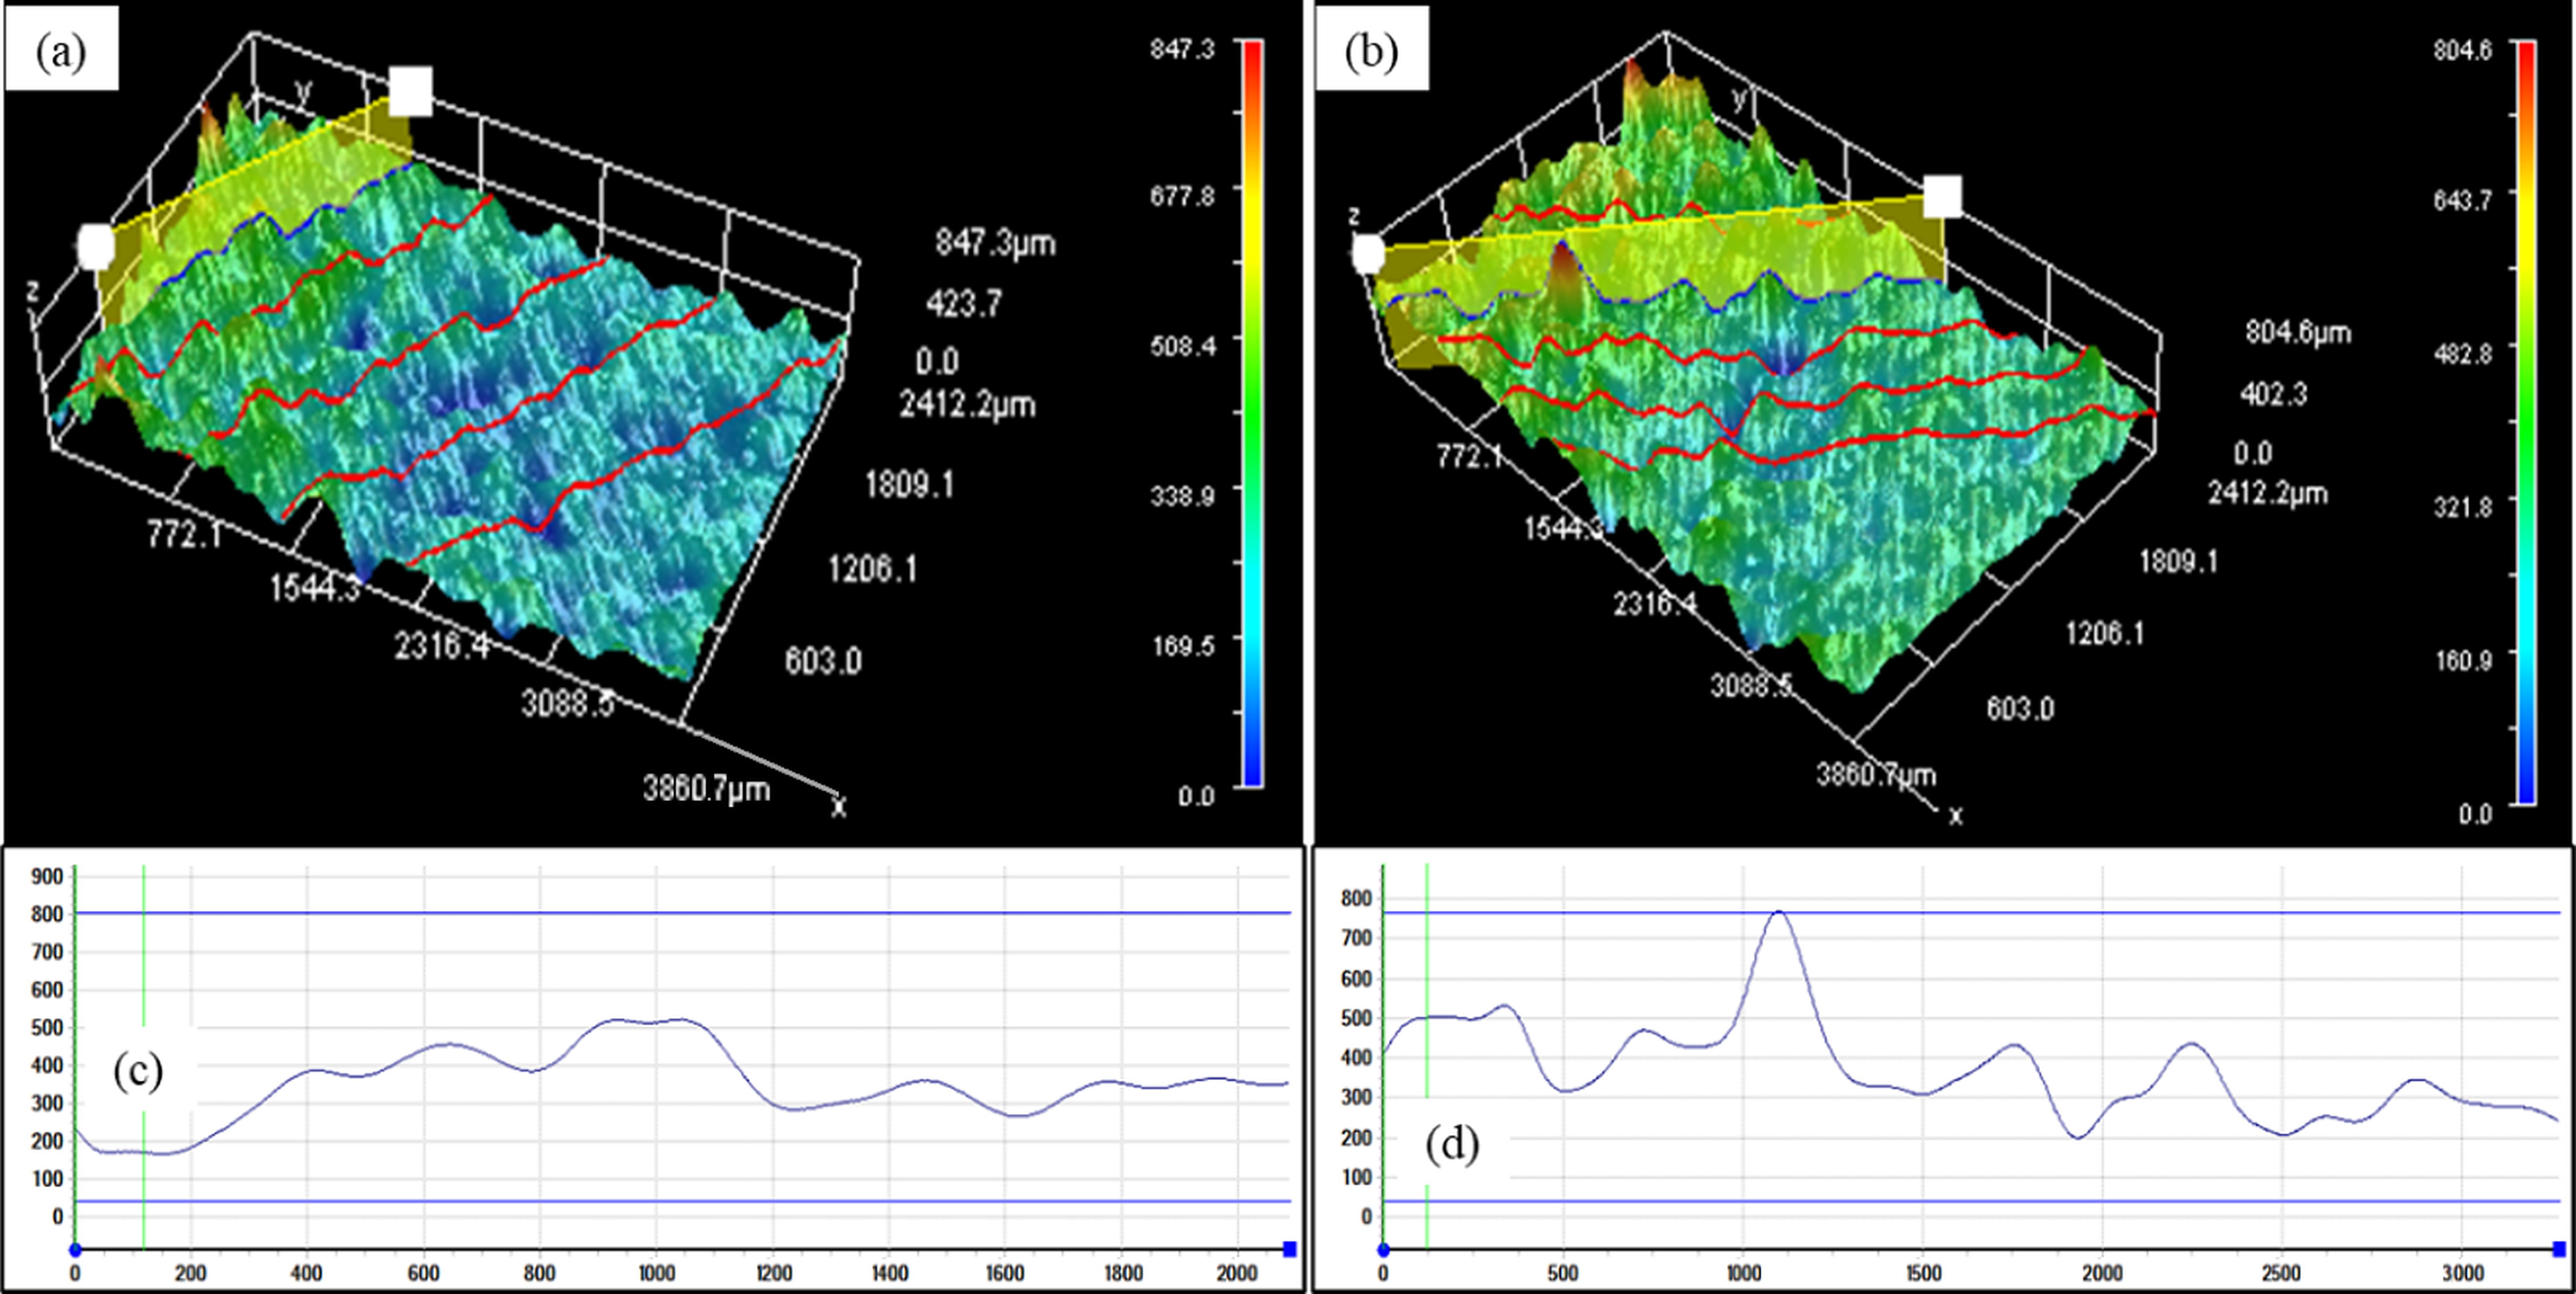
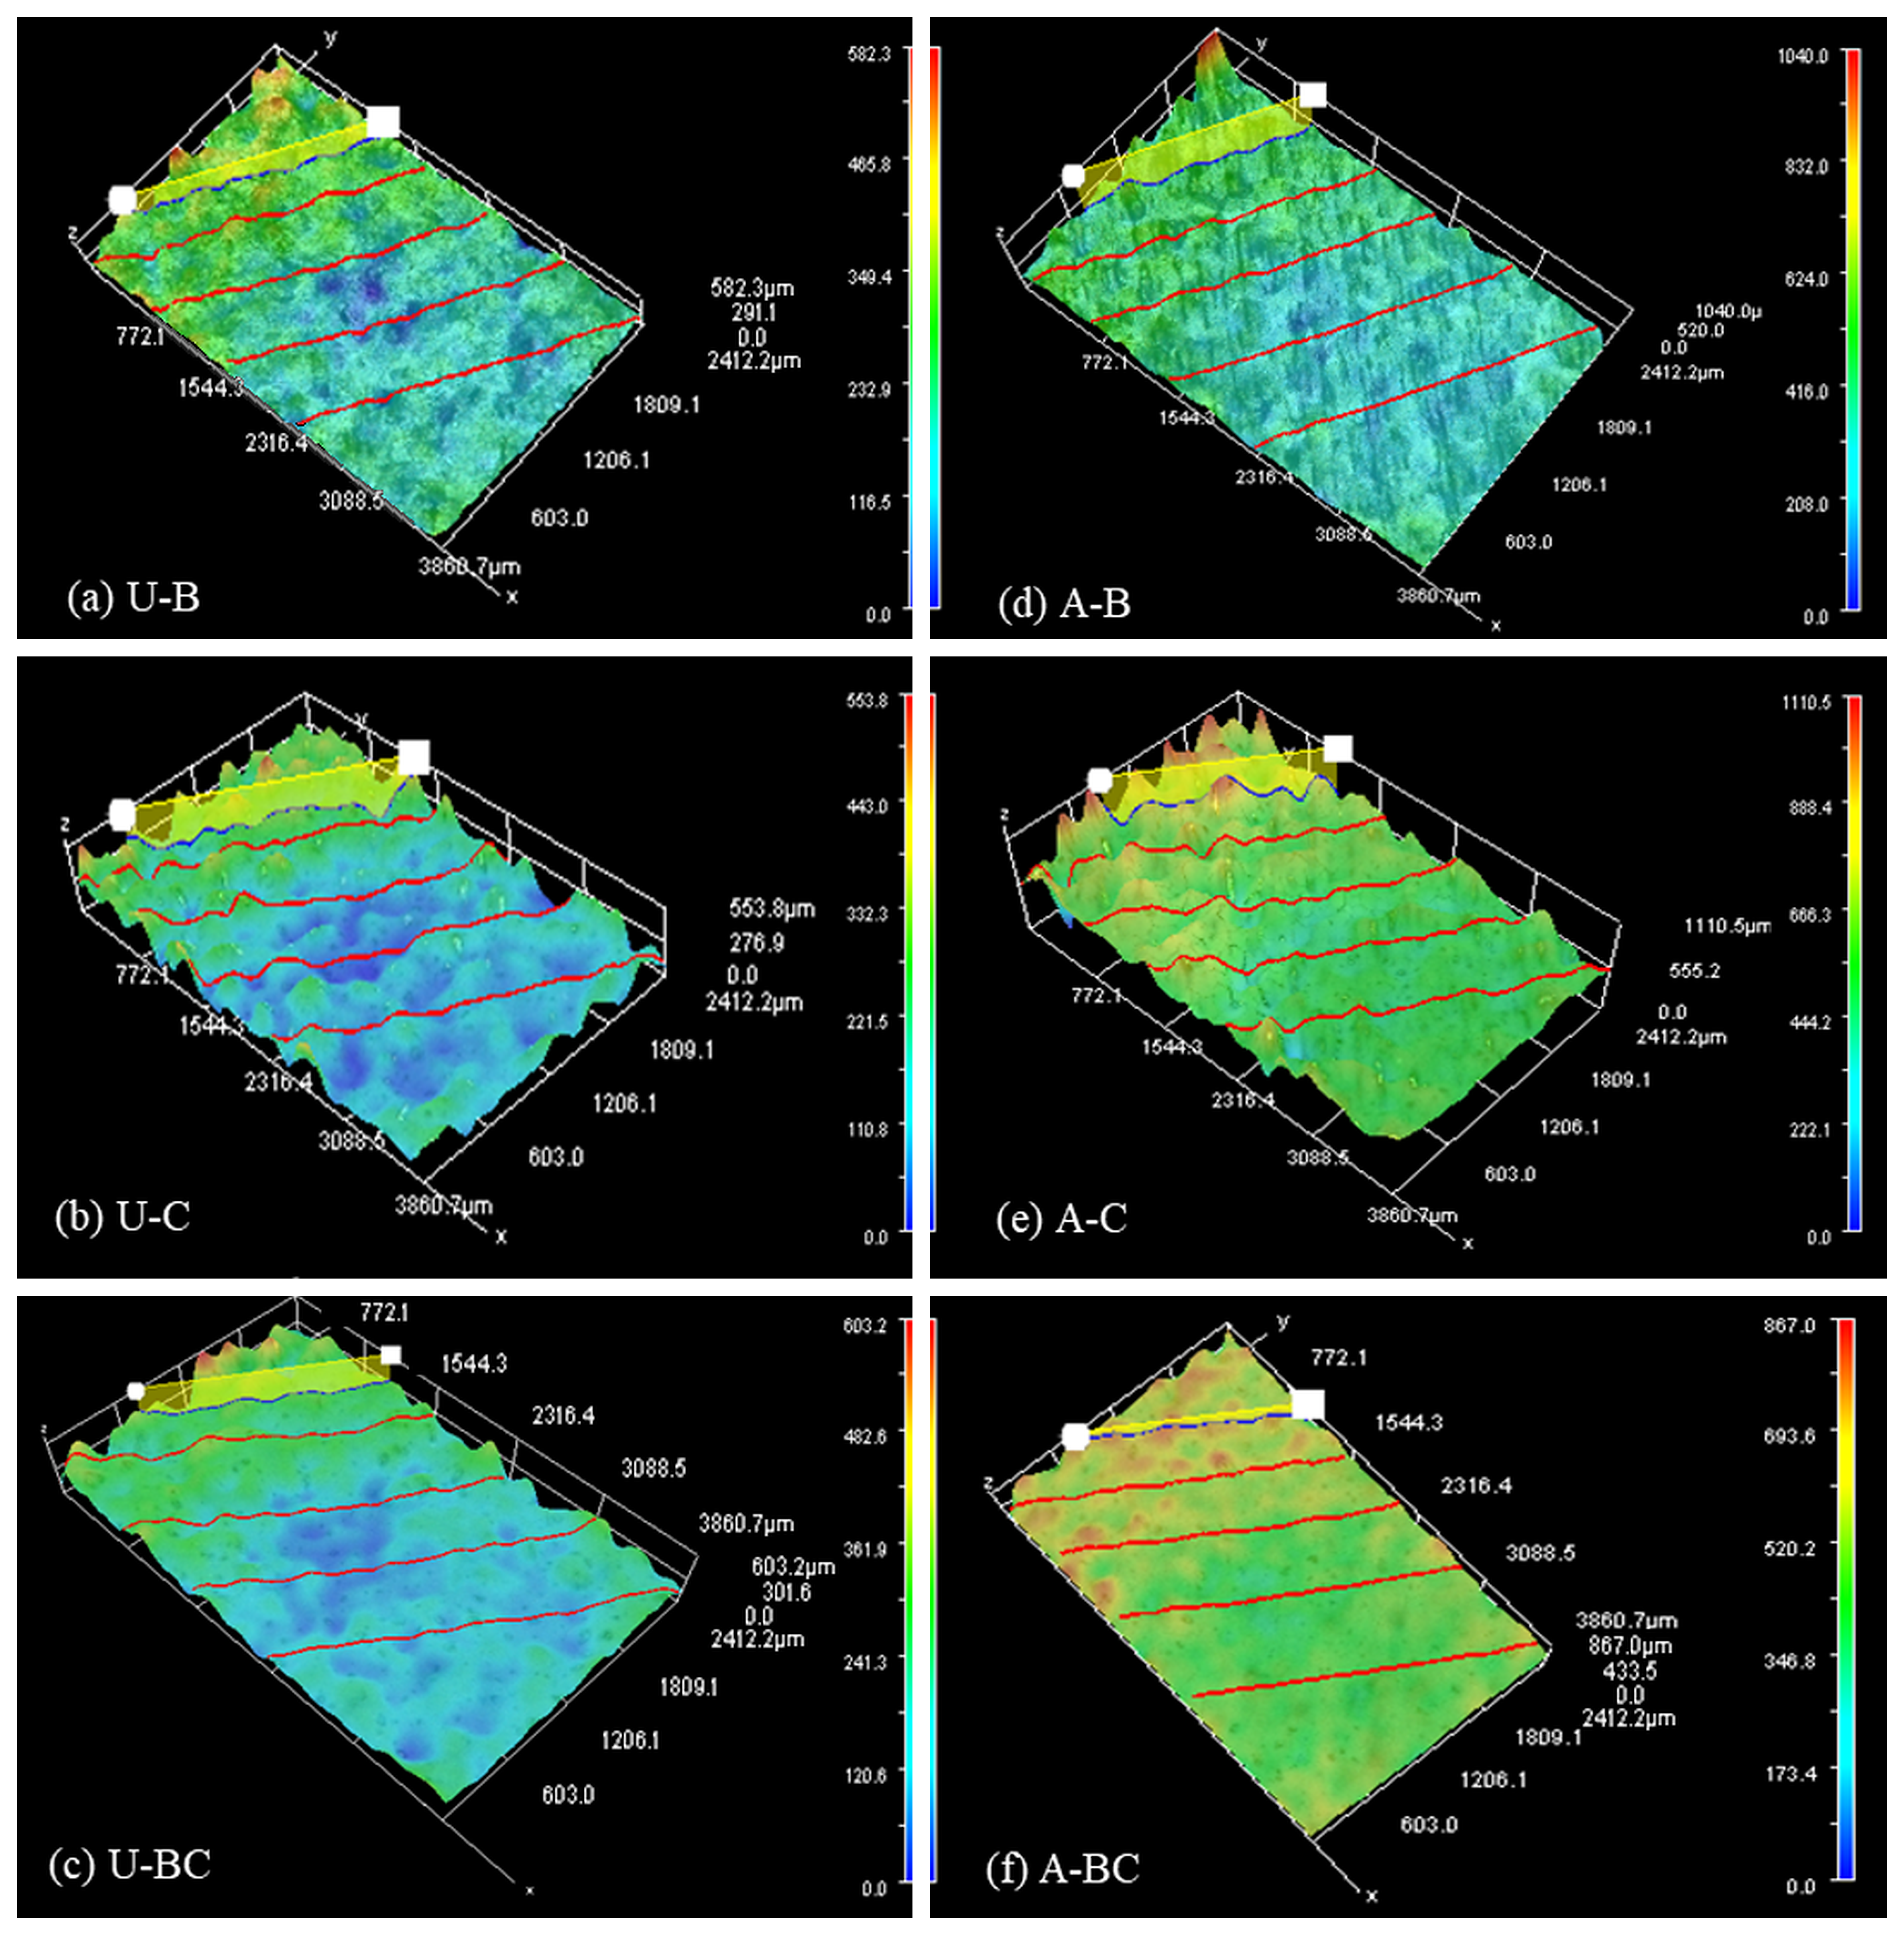
Hirox 3D surface profiling was used to generate three-dimensional surface representations and obtain profile-based roughness measurements across the flat plate treatment regions. The color gradient represented relative surface height, with blue and red corresponding to lower and higher reconstructed positions, respectively. The upper limit of the displayed color scale was automatically adjusted according to the height range captured in each reconstruction. Consequently, matching colors in different reconstructions did not represent a common absolute height scale and must not be used for direct cross- treatment comparison. Quantitative treatment-region comparisons were based on the profile-derived Rz values rather than the color distributions. The 3D maps were therefore interpreted together with the corresponding profile traces and measured Rz values.
For the untreated and aged reference surfaces, the U-0 and A-0 regions showed wave-like surface undulations and scan-related height variations, as shown in
Figure 9. The cross-sectional profile lines were positioned approximately perpendicular to the visible LPBF surface pattern to capture prominent roughness variations. The maximum displayed heights within the reconstructed capture ranges were approximately 847 µm for U-0 and 805 µm for A-0. These displayed heights describe the captured reconstruction ranges and were not interpreted as the corresponding Rz values.
The blasted, coated, and blasted-plus-coated regions showed different surface height distributions in the 3D profiles, as shown in
Figure 10. The maximum displayed heights within the reconstructed capture ranges were approximately 582 µm for U-B, 554 µm for U-C, 603 µm for U-BC, 1040 µm for A-B, 1110 µm for A-C, and 867 µm for A-BC. Each panel retains the font formatting, annotation positions, coordinate labels, and independently adjusted height-display range generated in the Hirox study. Consequently, colors and color-bar positions should not be compared directly among panels, and quantitative treatment-region comparisons are based on the profile-derived Rz values rather than the visual appearance of the color maps.
The U-B and A-B regions showed comparatively more uniform textures than several coated regions, with fewer prominent peak-valley contrasts in the 3D visualizations. In contrast, U-C and U-BC showed a greater number of valley-like regions, while A-C and A-BC showed prominent peak features within the examined fields of view. These differences reflect both the actual surface height variations and the predefined upper and lower capture limits used during the 3D imaging process. Although the 3D capture parameters were kept constant, local height changes introduced by blasting and coating could shift the reference midpoint of the automated height scale and affect the visual prominence of surface features.
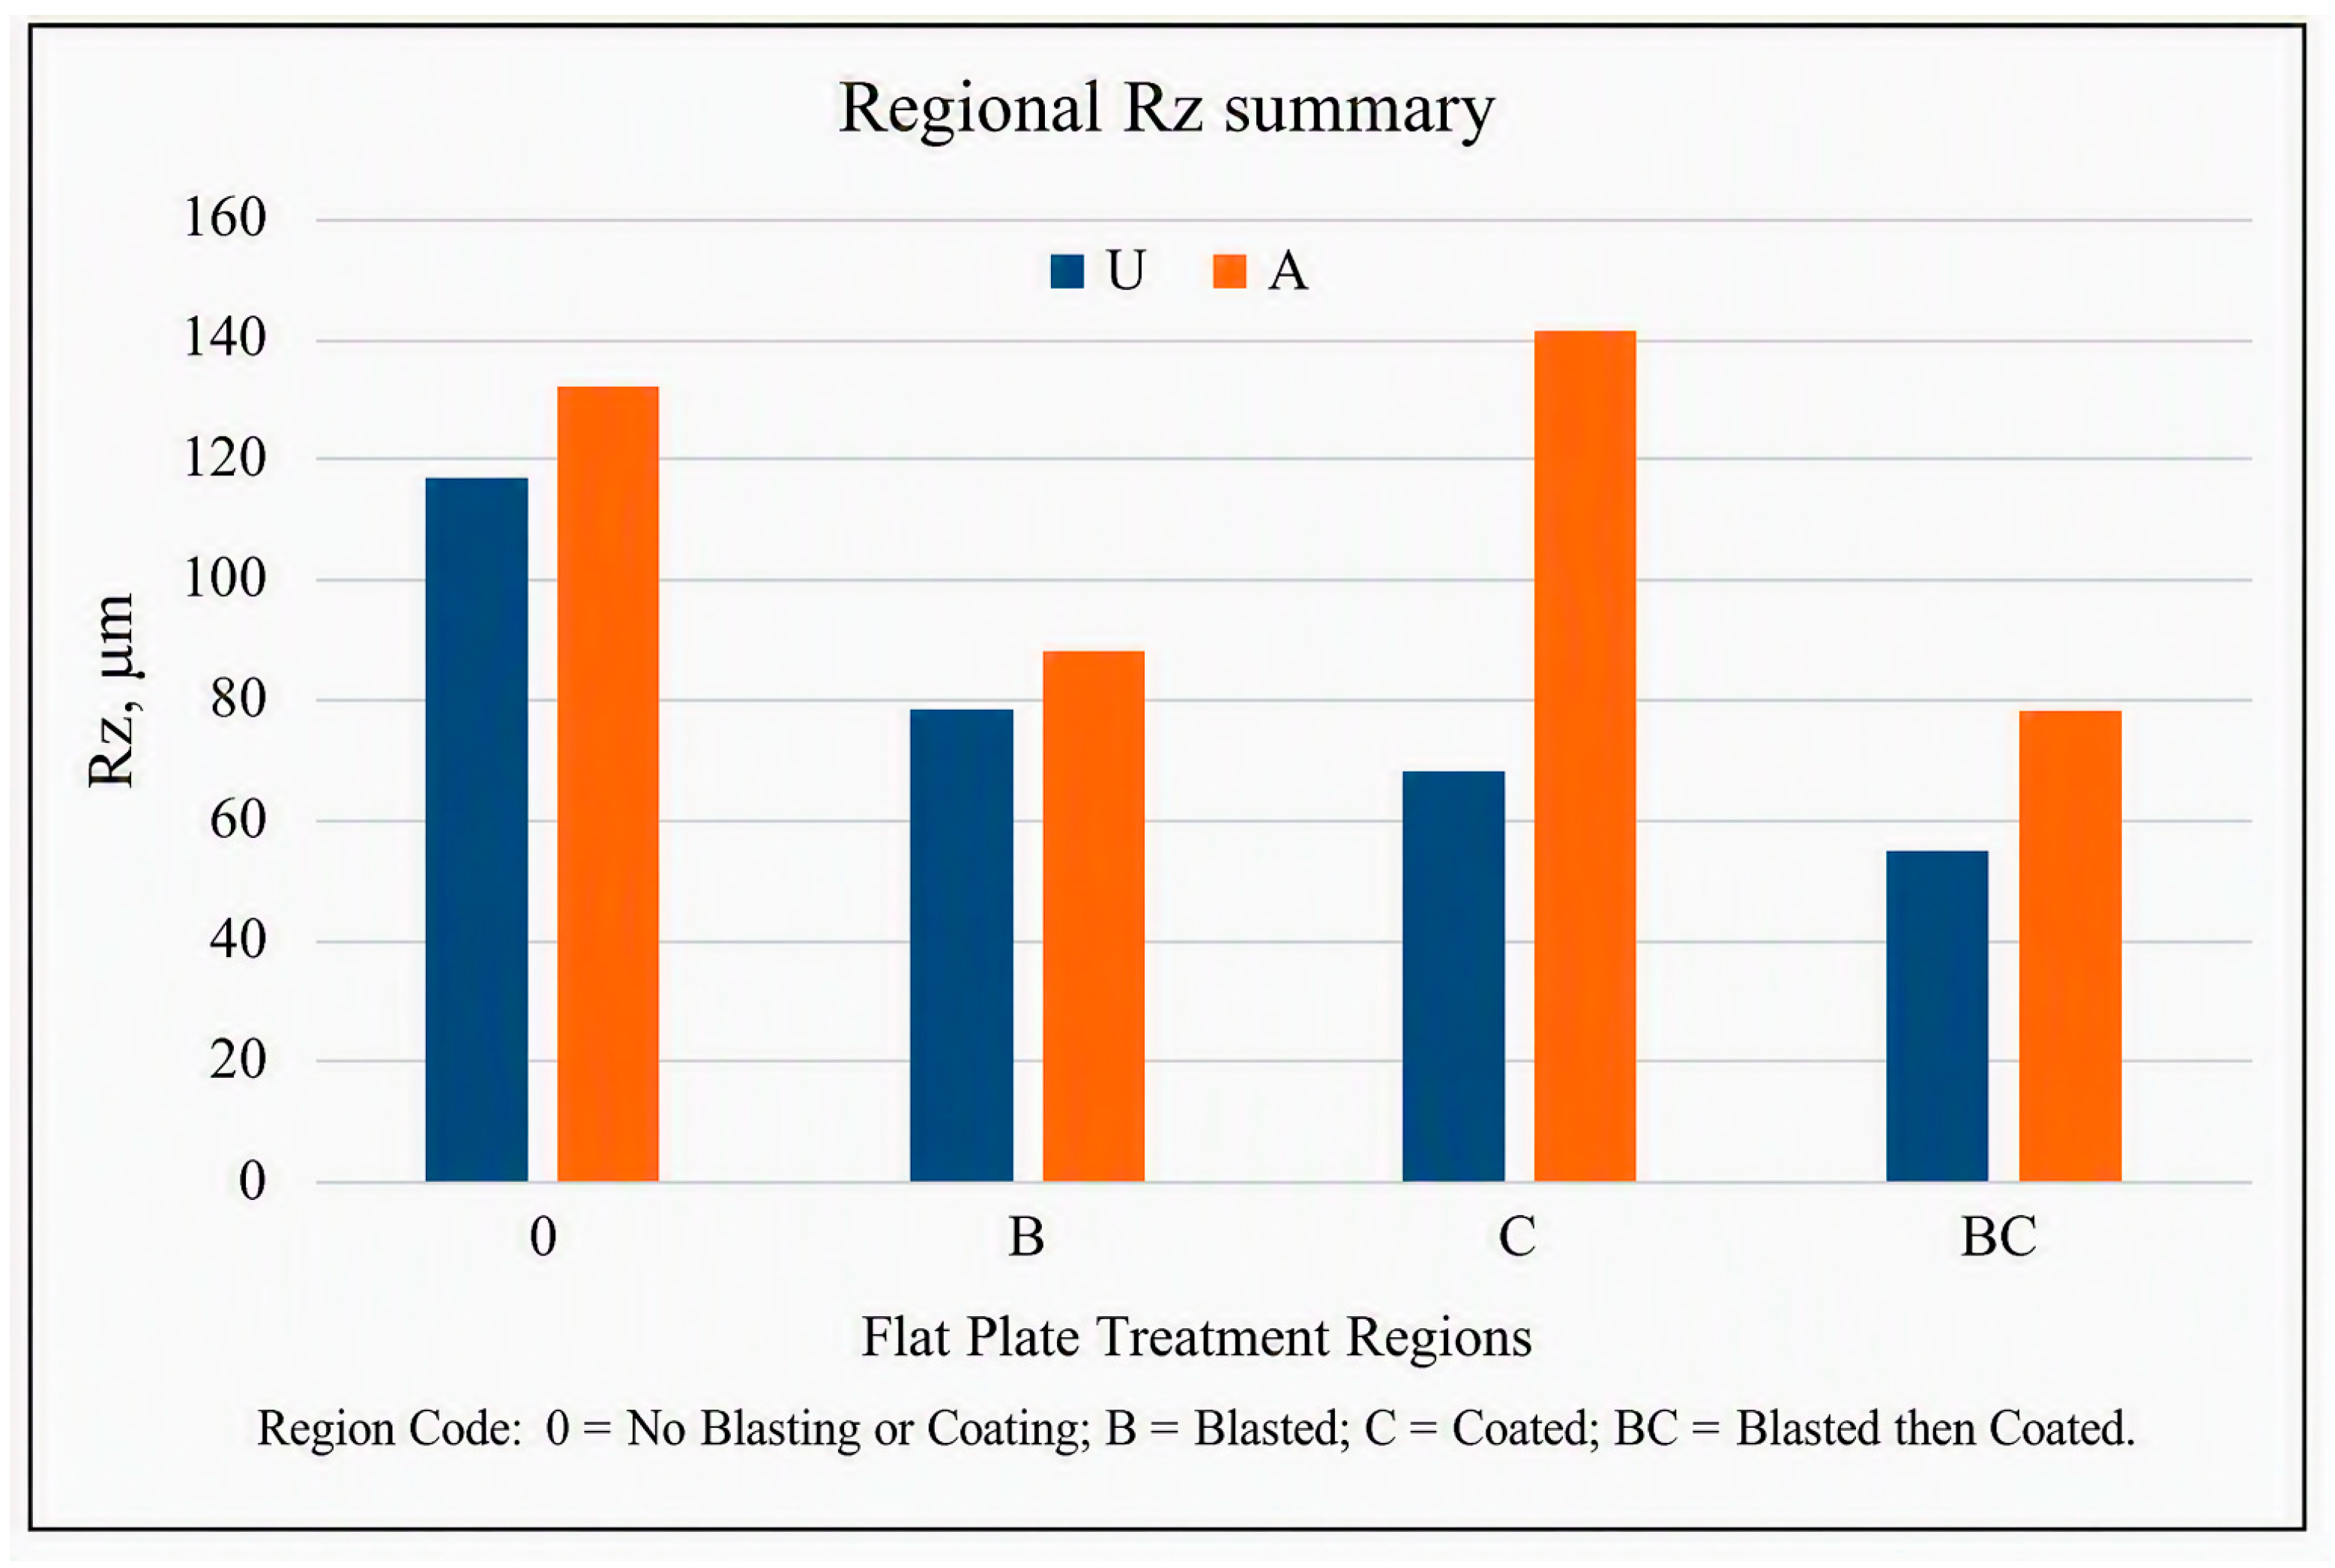
The reported geometric mean Rz values obtained from five orientation-selected profile lines within each flat plate region are summarized in
Figure 11. The five lines were repeated within-region measurements rather than independent treatment replicates. Individual profile-line values and uncertainty estimates were not included in the study. The regional geometric means followed the numerical ordering A-0 > U-0, A-B > U-B, A-C > U-C, and A-BC > U-BC; within both the U and A plate series, the BC region had the smallest reported geometric mean. Because each applied condition occupied only one region and spatial position was confounded with condition, these numerical differences are reported as observations from the examined regions and are not interpreted as statistically supported treatment effects.
Interpretation of the regional comparisons is constrained by the treatment layout. Because each condition occupied a unique plate position, any regional difference may reflect treatment, initial LPBF surface variation, spatial differences in scan-track morphology, edge proximity, or a combination of these factors. No untreated control region was repeated across plate positions, and no treatment assignment was randomized or permuted. The present data therefore support characterization of the eight examined regions but do not permit estimation of an independent treatment effect.
3.3. SEM Imaging of Flat Plates
SEM imaging was used to examine the flat plate treatment regions at higher spatial resolution. Each untreated and aged flat plate contained four treatment regions corresponding to the surface treatment map. SEM observations were used to evaluate LPBF-induced morphology, blasting-related surface modification, and coating morphology.
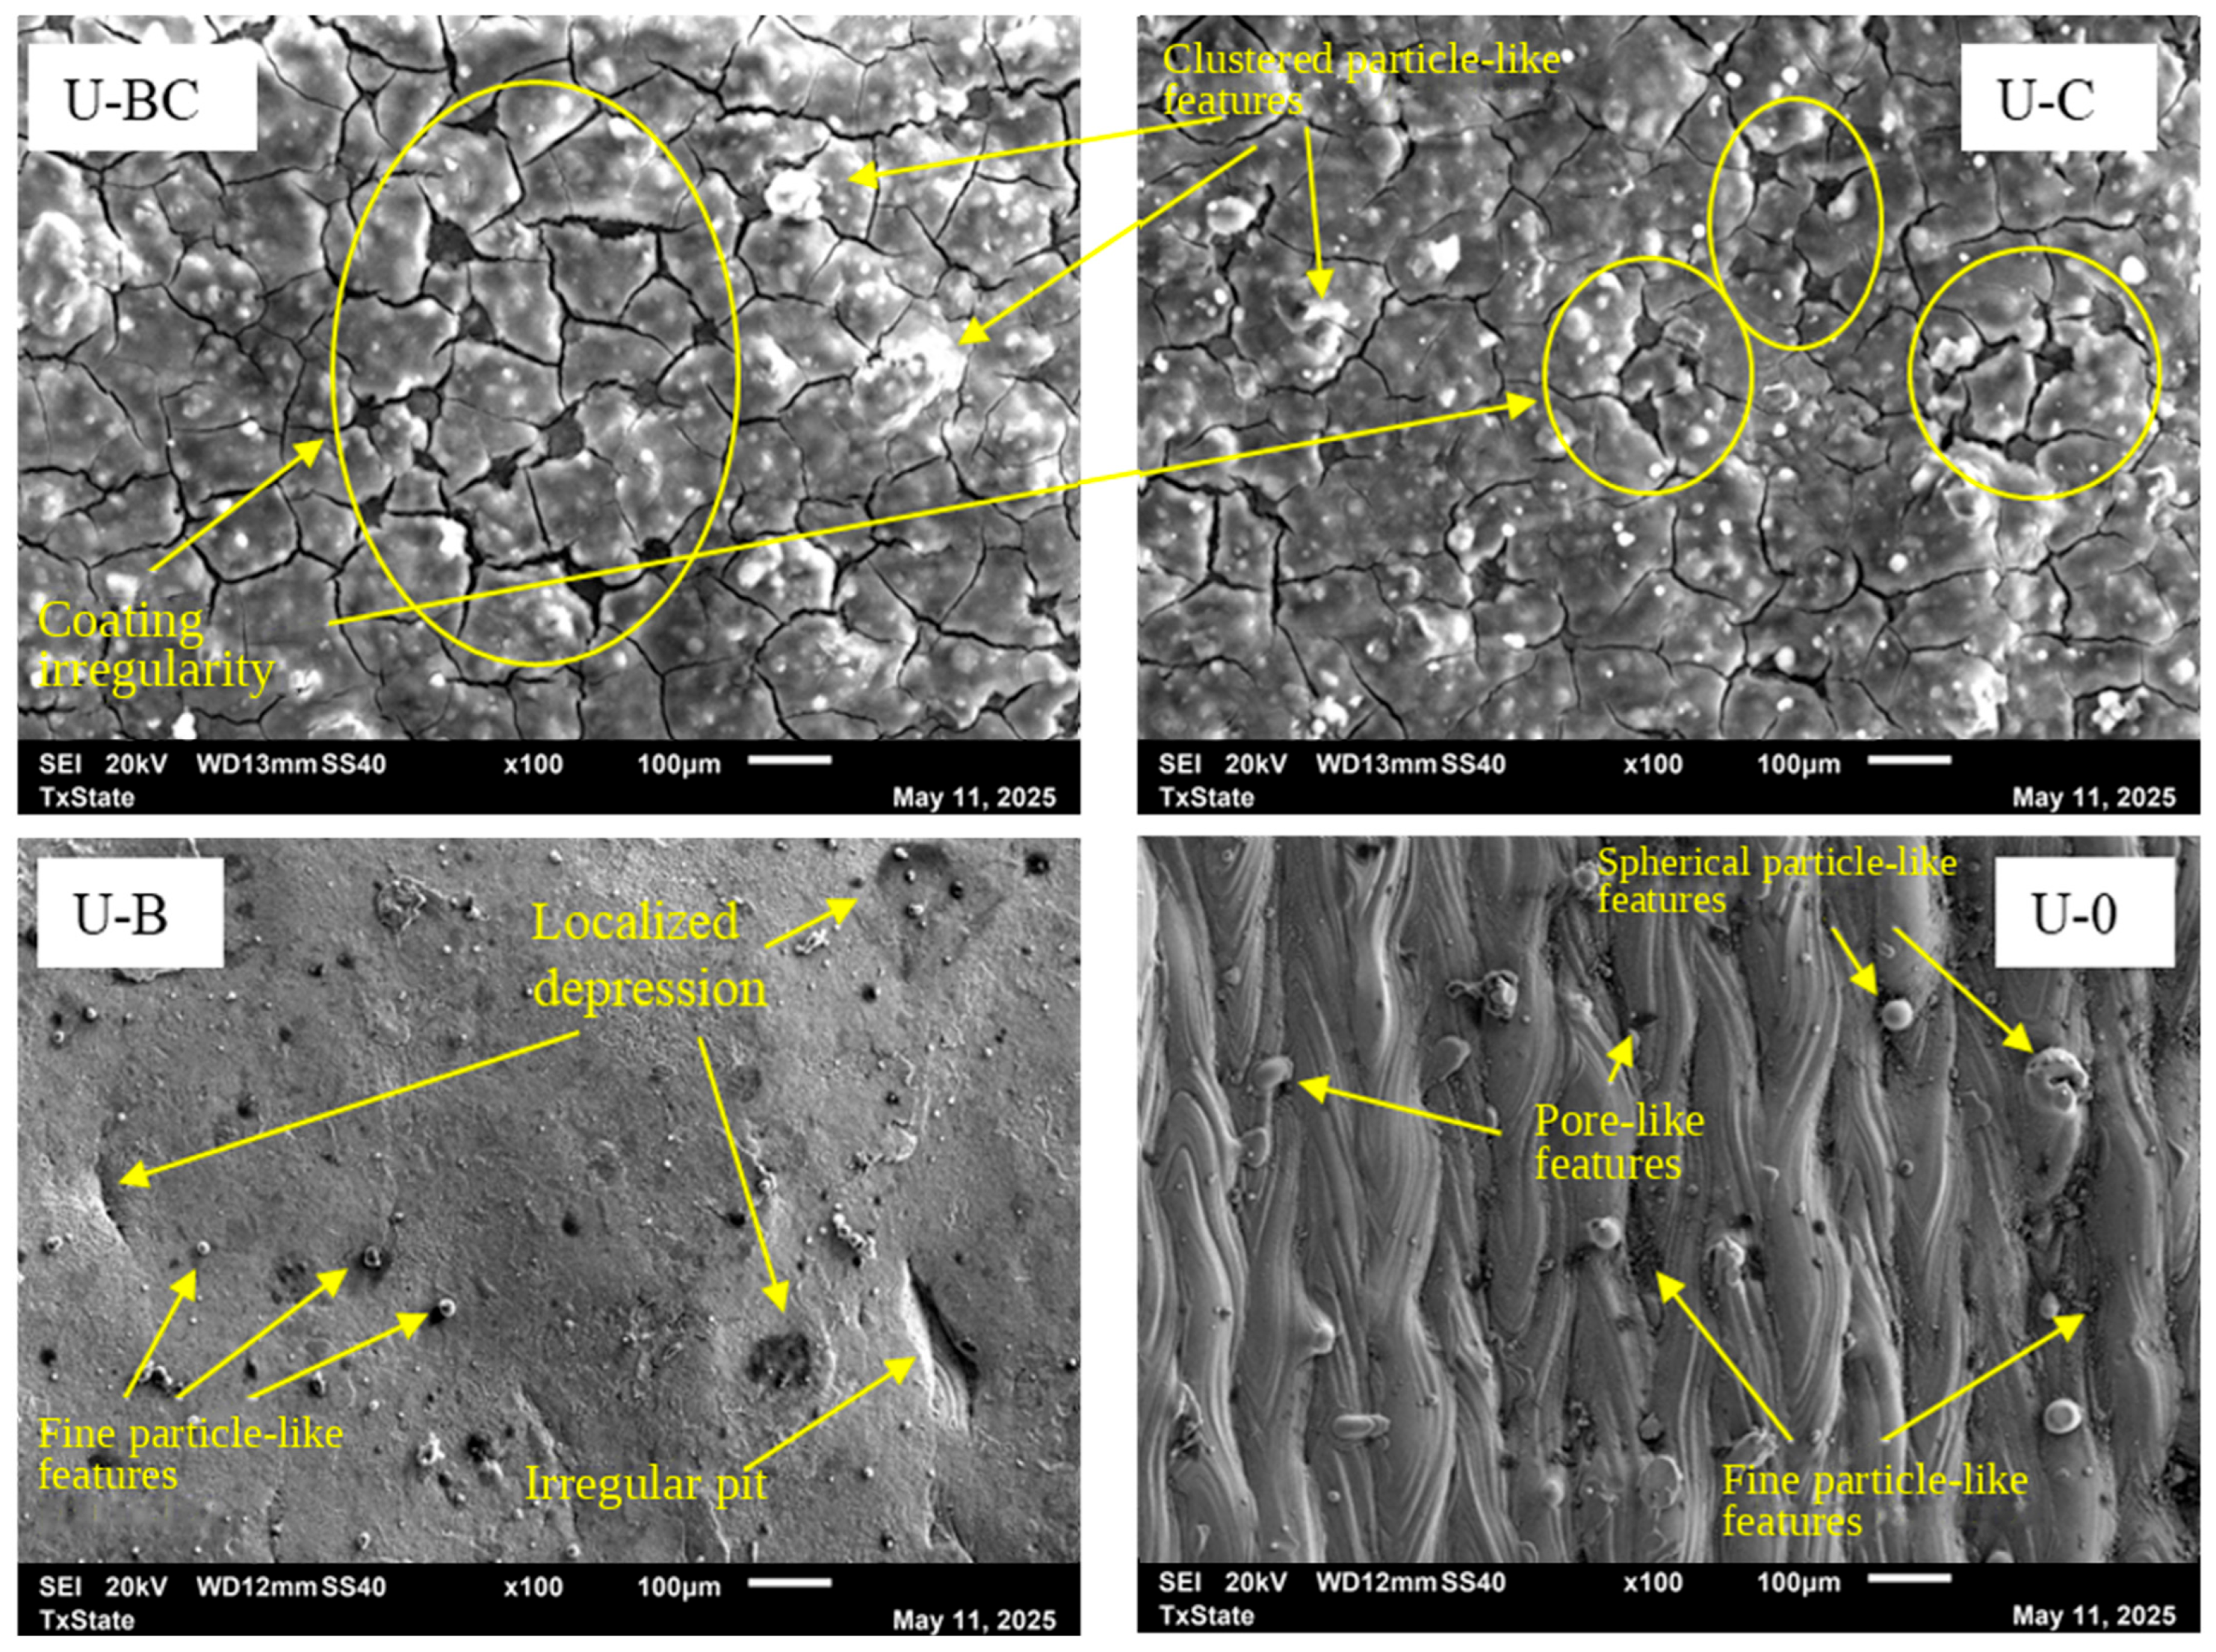
Figure 12 shows SEM micrographs of the four treatment regions on the untreated flat plate. In the U-0 region, linear scan-path features were clearly visible, together with spherical particle-like features consistent in appearance with LPBF balling, pore-like surface features, and fine particle-like features. These features are consistent with LPBF-induced morphology described in previous studies [
11,
17]. The scan-path morphology produced pronounced topographical contrast at the examined scale, while selected areas within individual ridges and grooves appeared comparatively uniform at higher magnification.
In the U-B region, the original linear scan pattern was less visible after blasting. The surface contained localized depressions, irregular pits, and fine particle-like features. Some of the fine particles may correspond to residual LPBF powder particles or particles introduced or embedded during the blasting process; however, these sources cannot be distinguished solely from morphology because both the substrate and blasting media are metallic.
The U-C region showed an unevenly coated surface with visible cracks and localized coating irregularities. The U-BC region showed a similar coated morphology, including irregular cracks and clustered particle-like features within the coating layer. In both coated regions, the coating altered the visible surface texture relative to the uncoated regions. Localized coating irregularities were visible during SEM imaging, which may be associated with electron-beam interaction with the non-conductive coating.
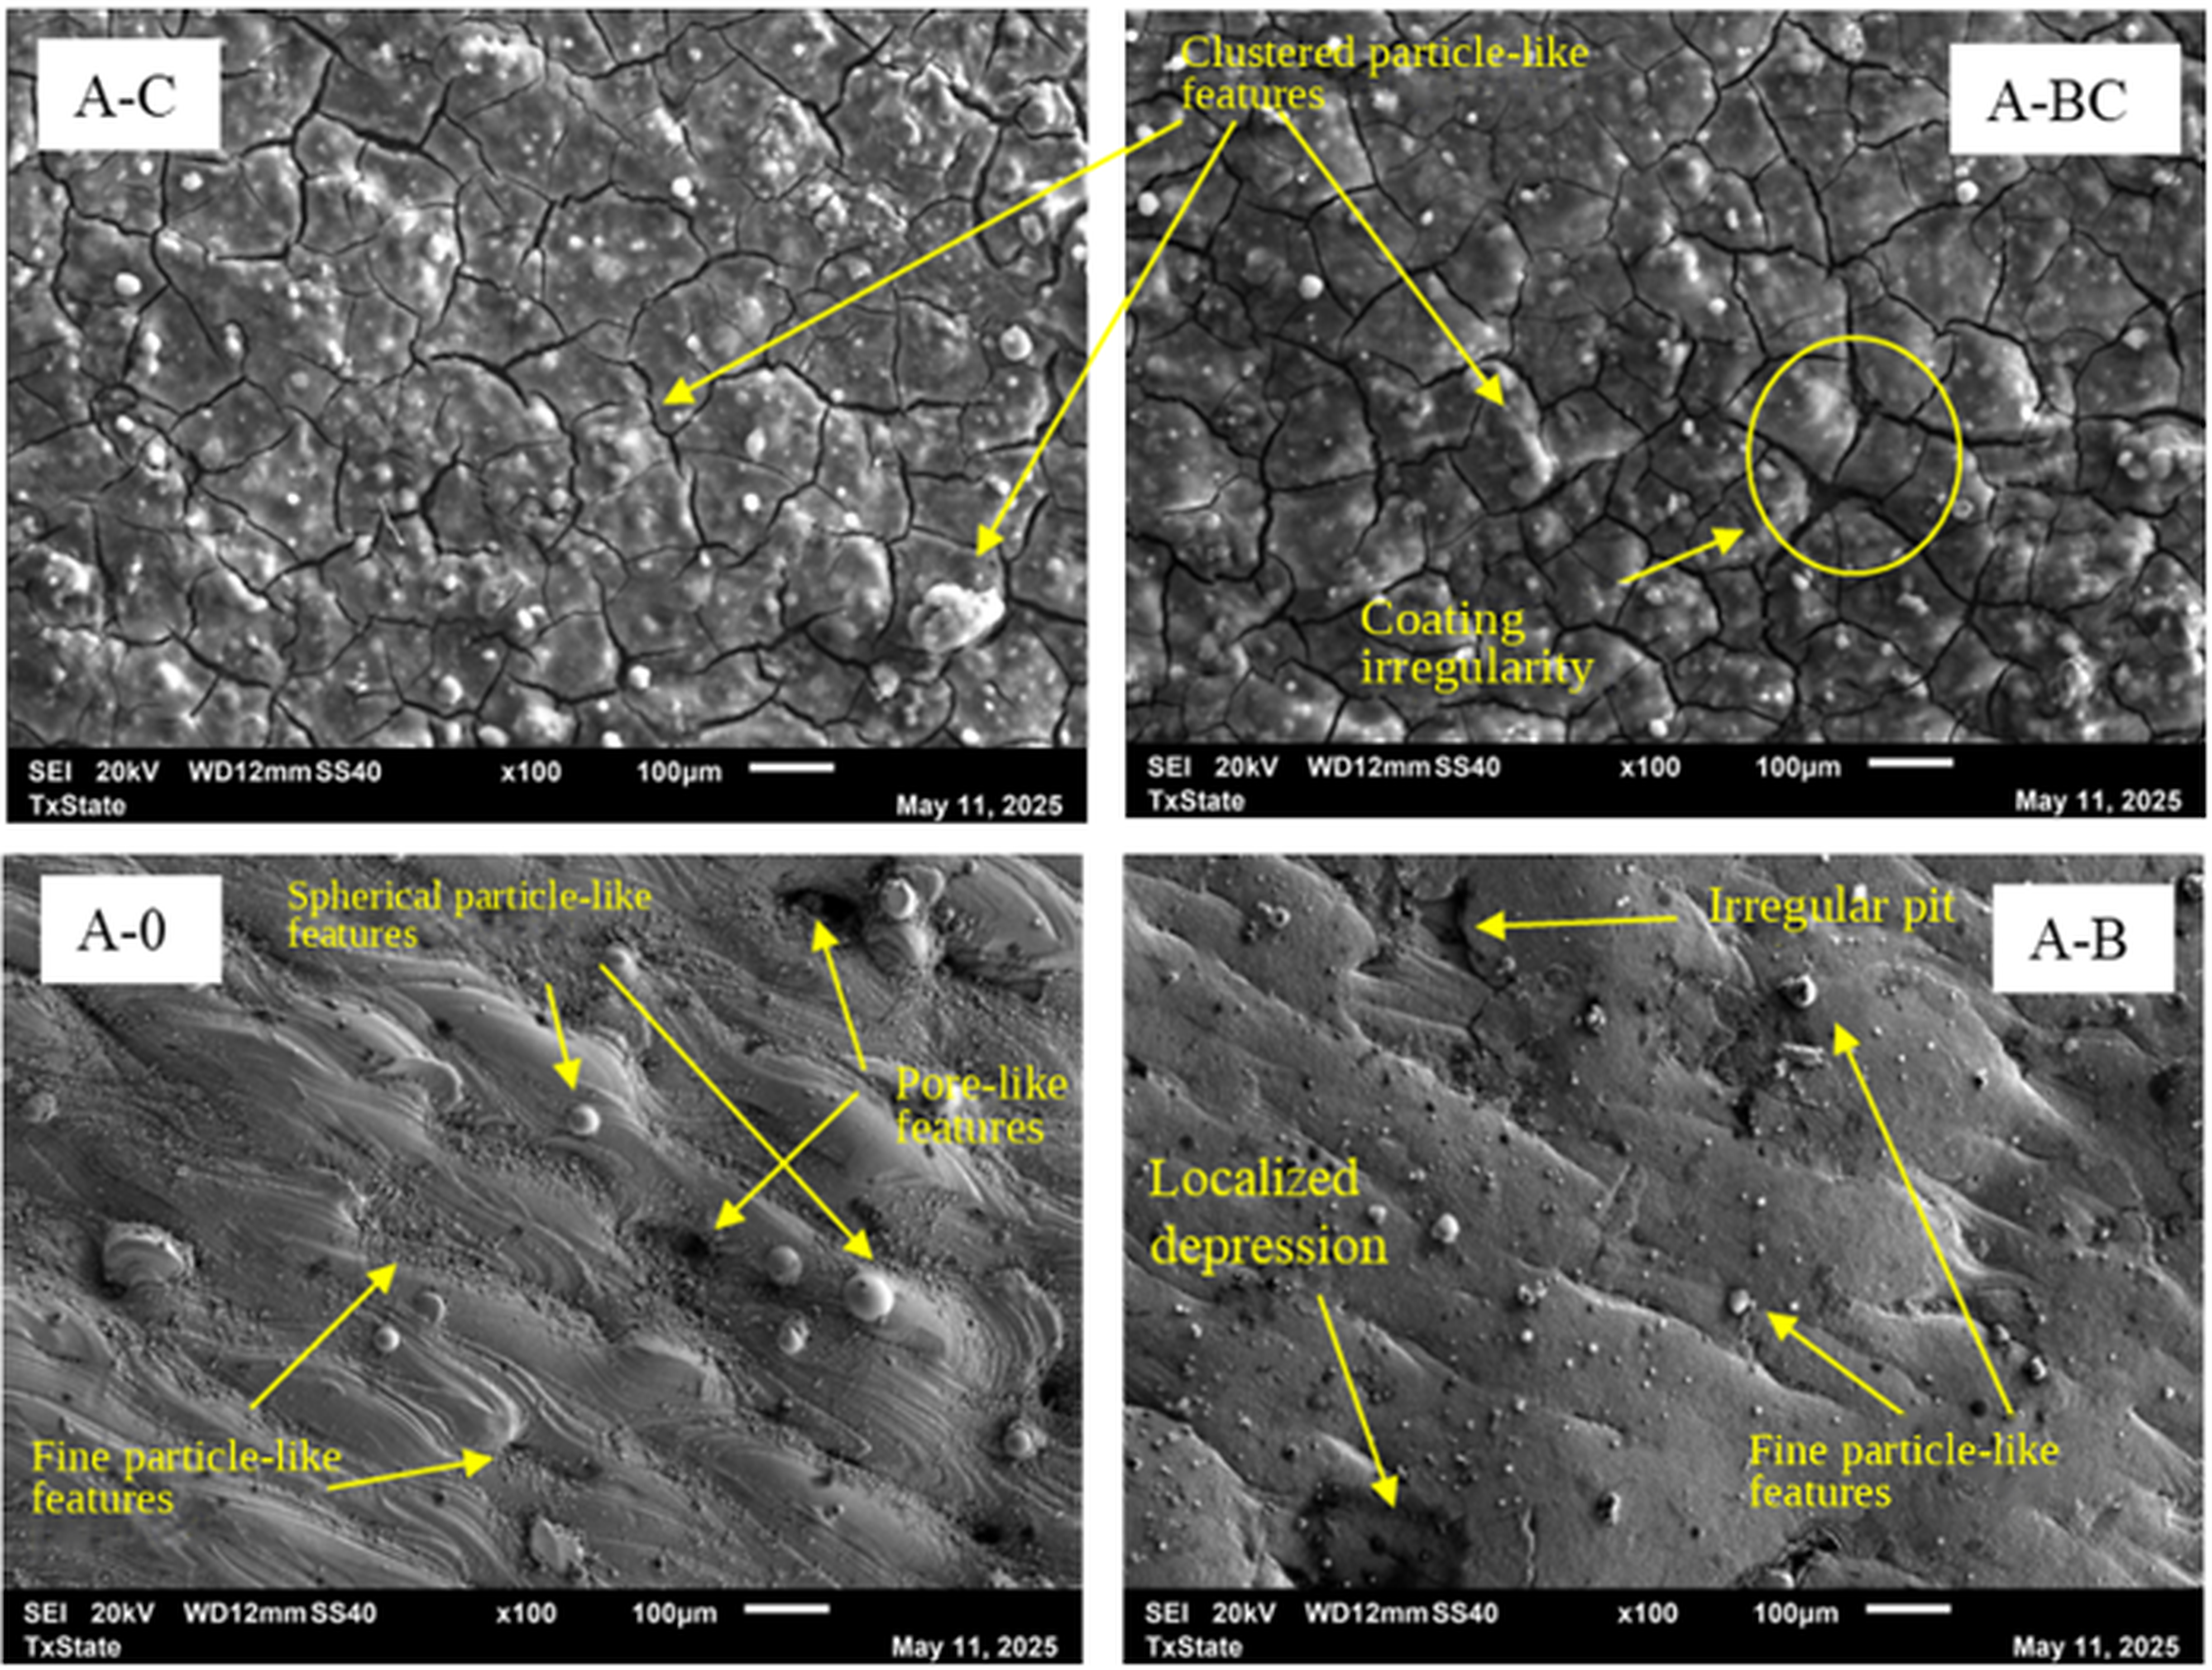
Figure 13 shows SEM images of the aged flat plate treatment regions. The A-0 region displayed elongated groove-like scan features, spherical particle-like features, pore-like surface features, and fine particle-like features, similar to U-0. A greater apparent density of fine particle-like features was visible within the selected A-0 field of view than within the selected U-0 field of view. These features are consistent with surface changes associated with the aging condition and are further examined through EDS analysis.
In the A-B region, blasting reduced the visibility of balling and surface particle accumulation compared with A-0, and the surface appeared locally flattened in several areas. Localized depressions, irregular pits, and fine particle-like features were also observed. Some remnants of the original striated LPBF pattern remained visible, indicating that blasting did not fully remove the underlying scan-related morphology in the aged condition. The A-C and A-BC regions showed coating cracks and clustered particle-like features comparable to those observed in U-C and U-BC. Compared with the untreated coated regions, the aged coated regions showed less localized coating irregularities during SEM imaging within the examined areas.
3.4. EDS Analysis of Surface Elemental Composition
3.4.1. Elemental Mapping
EDS mapping was used to examine the spatial distribution of selected elements on representative flat plate regions. The mapping results provide information on localized elemental distribution, substrate exposure, and coating-related chemistry.
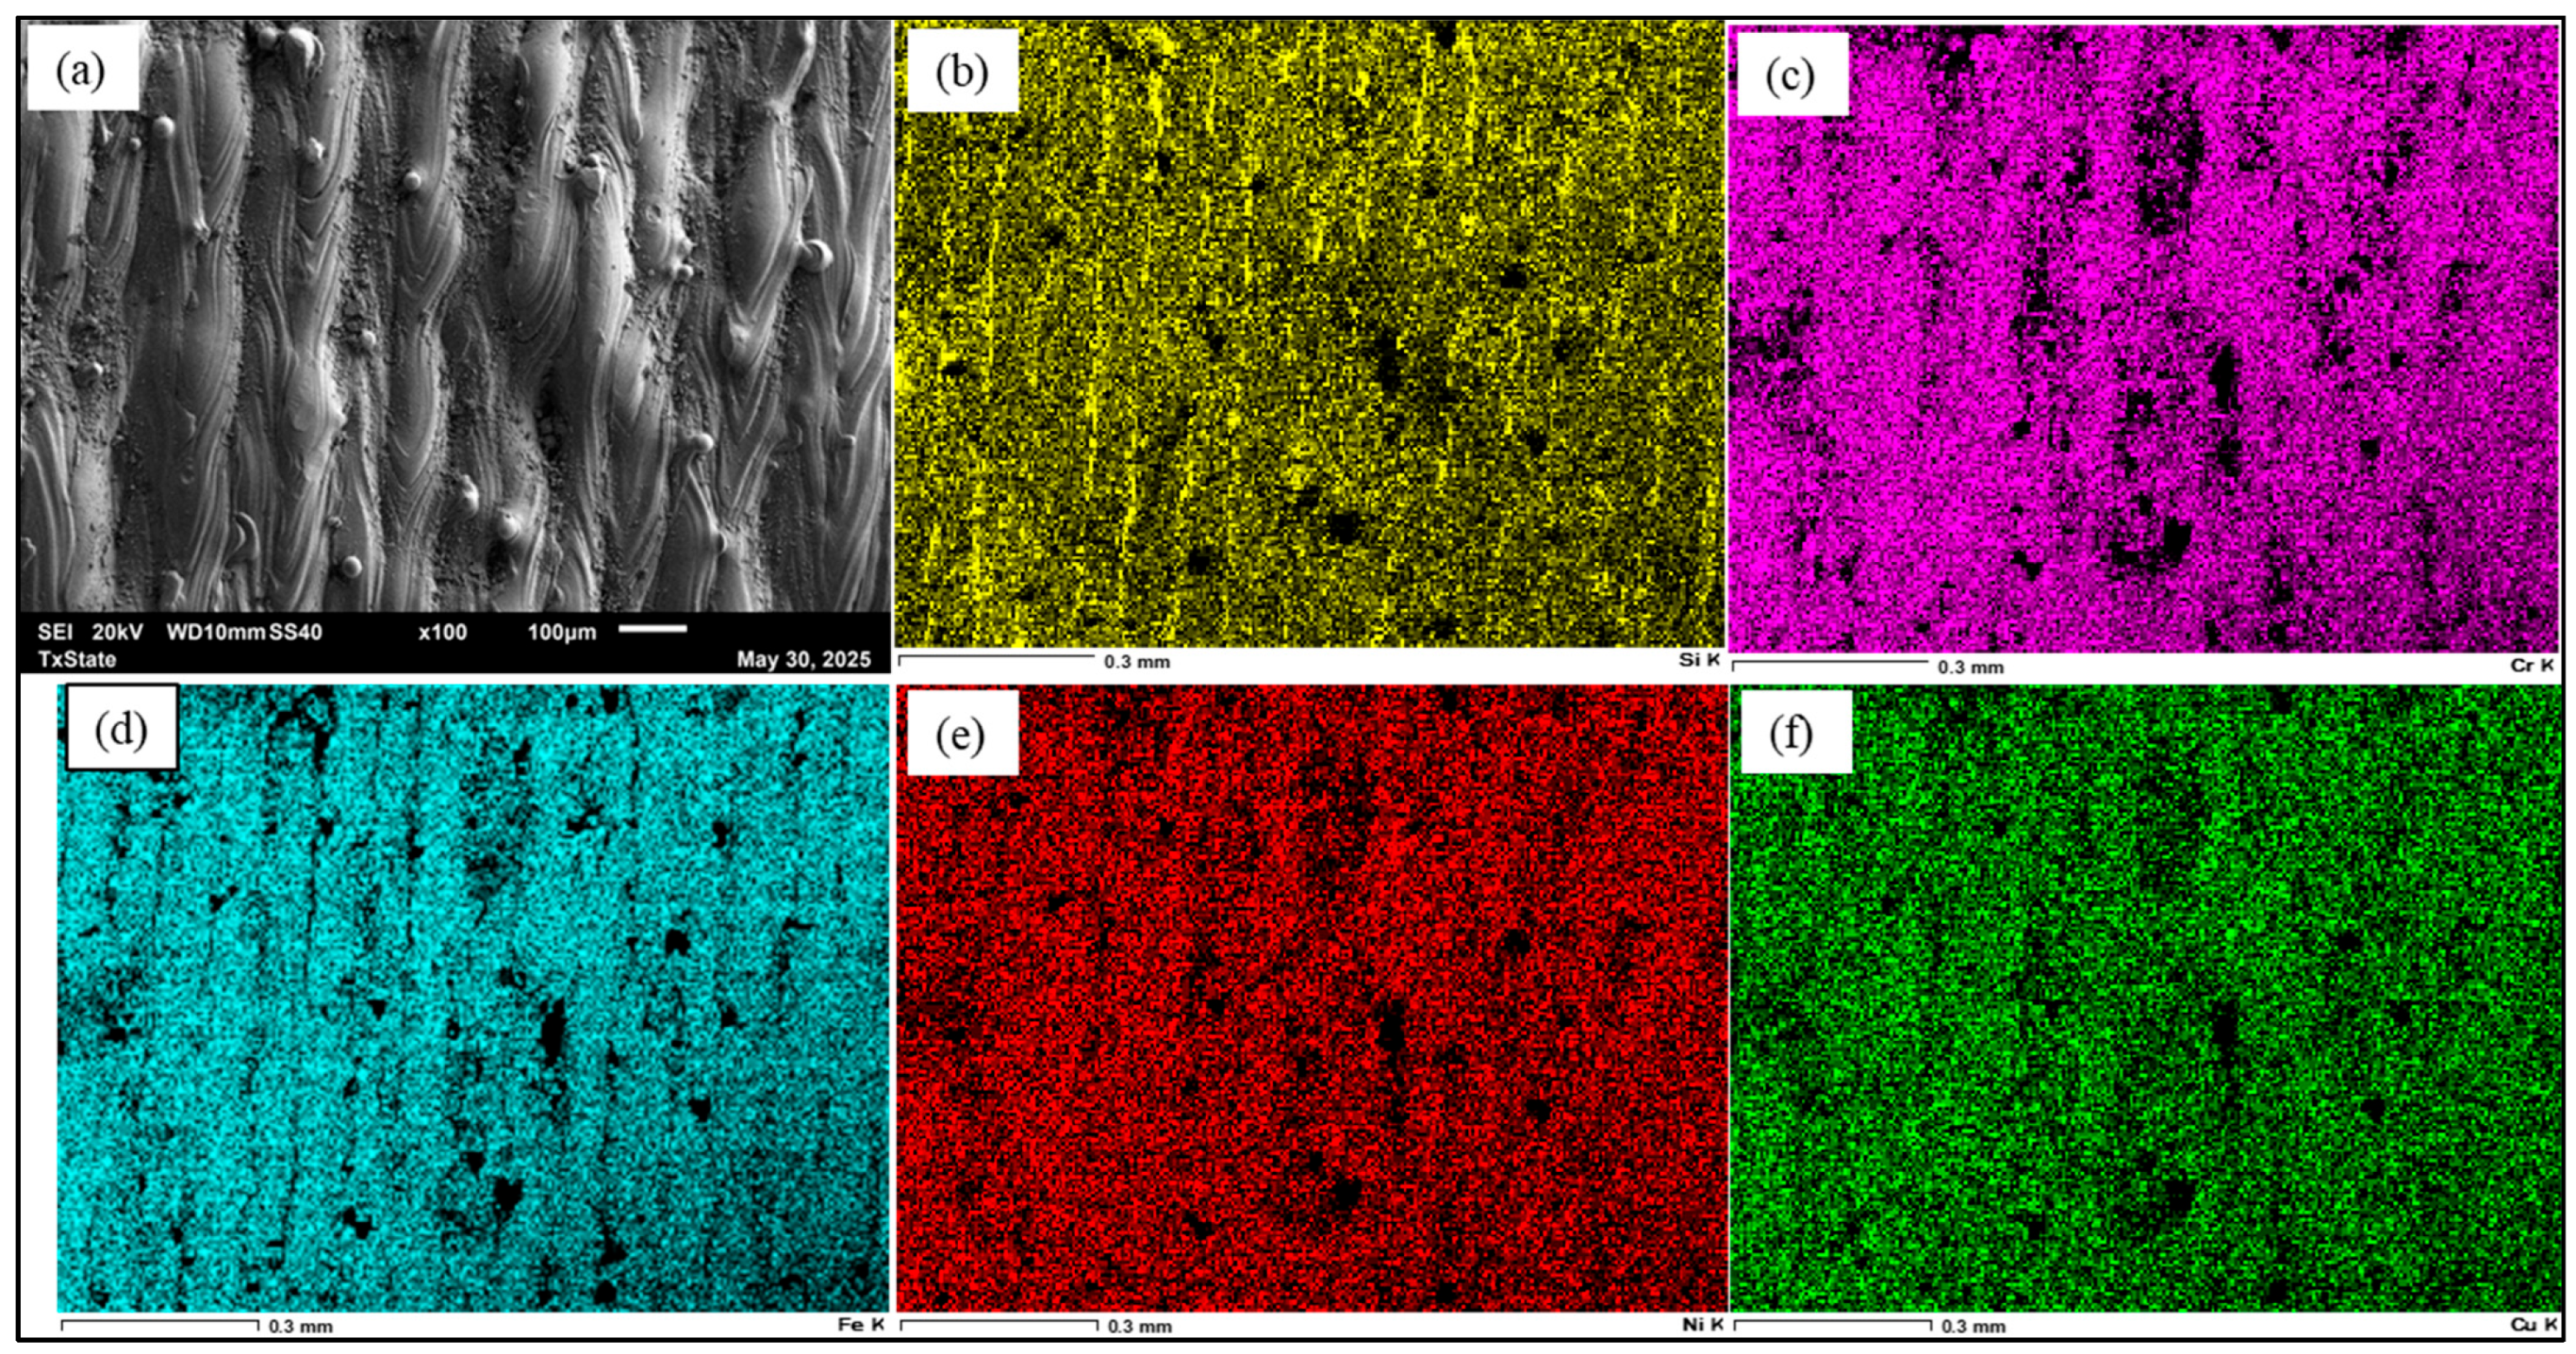
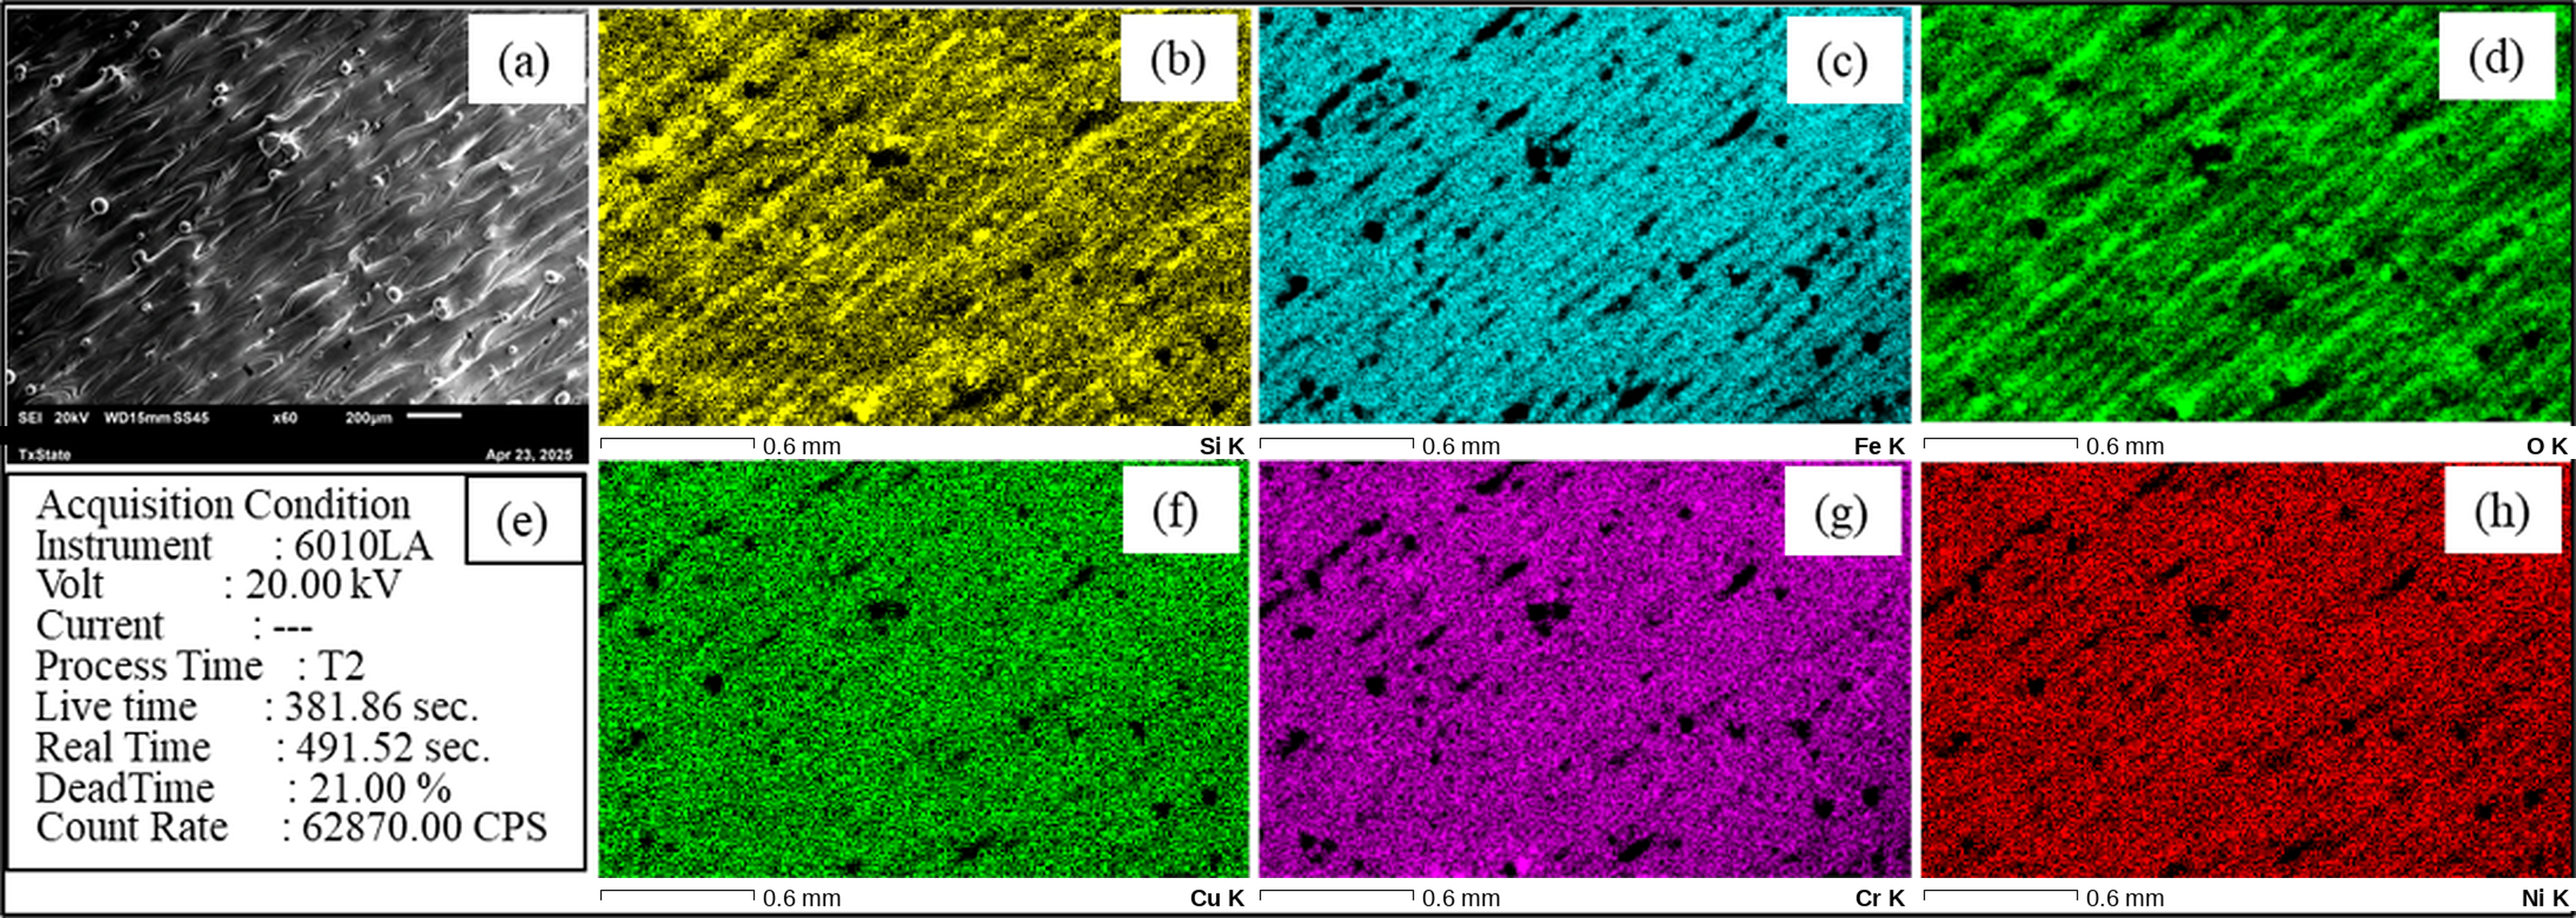
The EDS mapping of the U-0 region in
Figure 14 showed the expected major elemental constituents of 17-4 PH SS, including Fe, Cr, Ni, Cu, and Si. The elemental maps showed relatively uniform distribution across the examined surface. Dark patches and striated regions were visible in selected maps and corresponded spatially to pores, edges, or surface height variations associated with the LPBF surface morphology.
The EDS mapping of the A-0 region showed elemental constituents similar to those observed in U-0, as shown in
Figure 15. Cu- and Ni-rich regions appeared in a patchy distribution, while Si and Cr were more evenly distributed across the examined area. Fe and O followed portions of the macro-scale surface pattern associated with the LPBF scan morphology. Black lines and patches in the elemental maps corresponded to regions with reduced detected signal, which may be associated with local microcavities, surface height variation, or geometric shadowing during analysis.
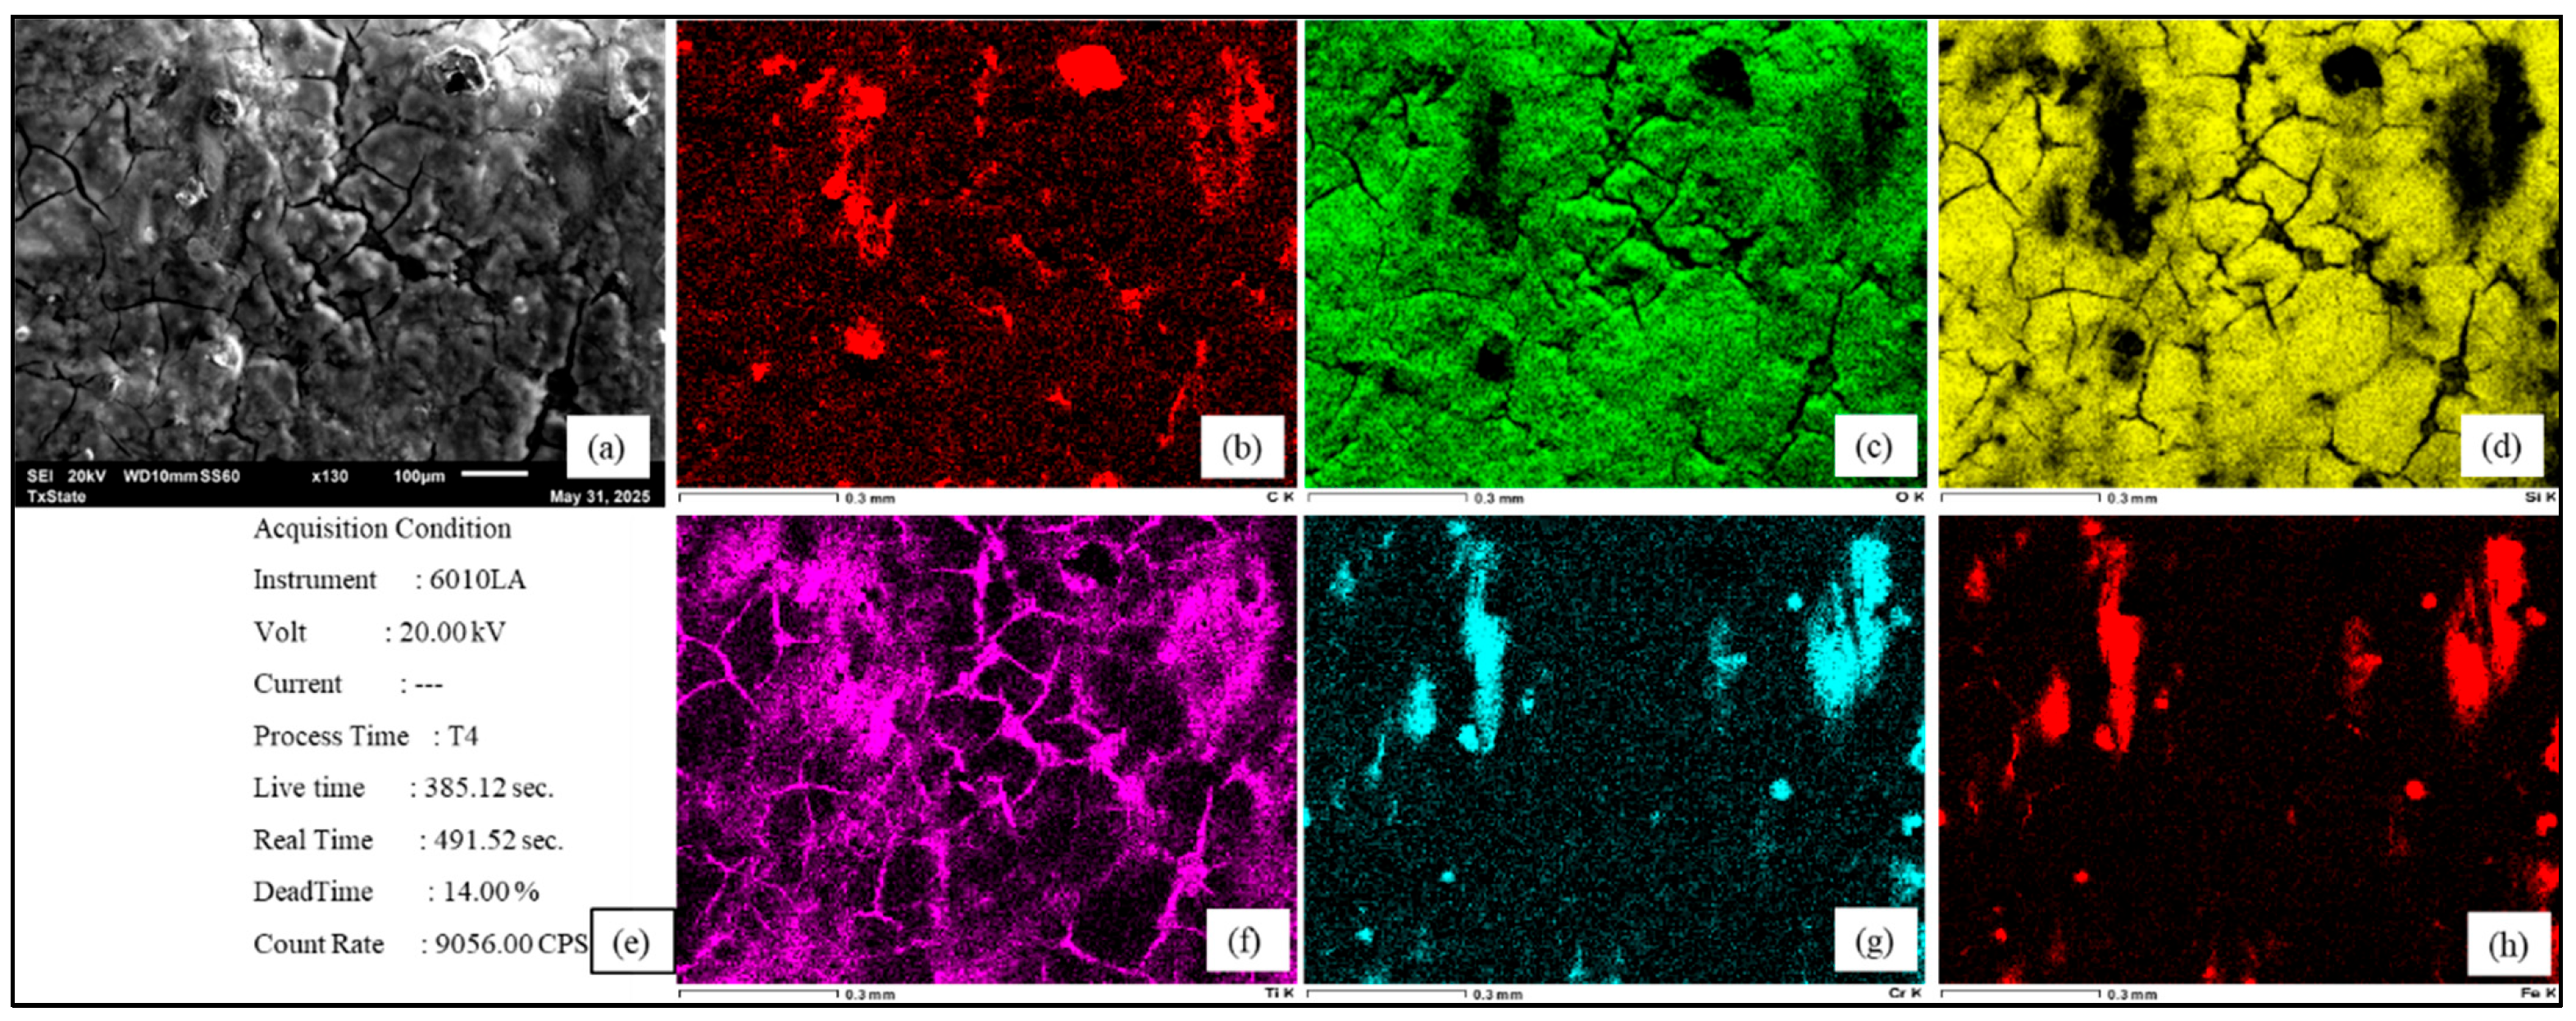
The EDS mapping of the U-C region showed strong Si and O signals across the coated surface, as shown in
Figure 16. The distribution of Si and O indicates that the coating contains a silicon-oxygen-rich matrix. Carbon was also detected on the coated surface. Because the coated sample had been handled and exposed before analysis, and because additional cleaning was avoided to prevent disruption of the coating layer, the carbon signal may include surface contamination or mounting-related contributions. Ti was detected in selected crack regions, indicating the presence of Ti-containing material within or near coating discontinuities. The presence of Ti may be associated with Ti-containing additives in commercial hydrophobic coatings [
44,
45,
46]; however, the specific Ti-containing phase cannot be confirmed by EDS alone. Localized Cr and Fe signals indicated substrate contribution within the EDS interaction volume, particularly near visible coating discontinuities. Because no cross-sectional analysis or direct coating-thickness measurement was performed, these signals were not used to estimate coating thickness or characterize the coating–substrate interface.
3.4.2. Quantification of Surface Elemental Composition
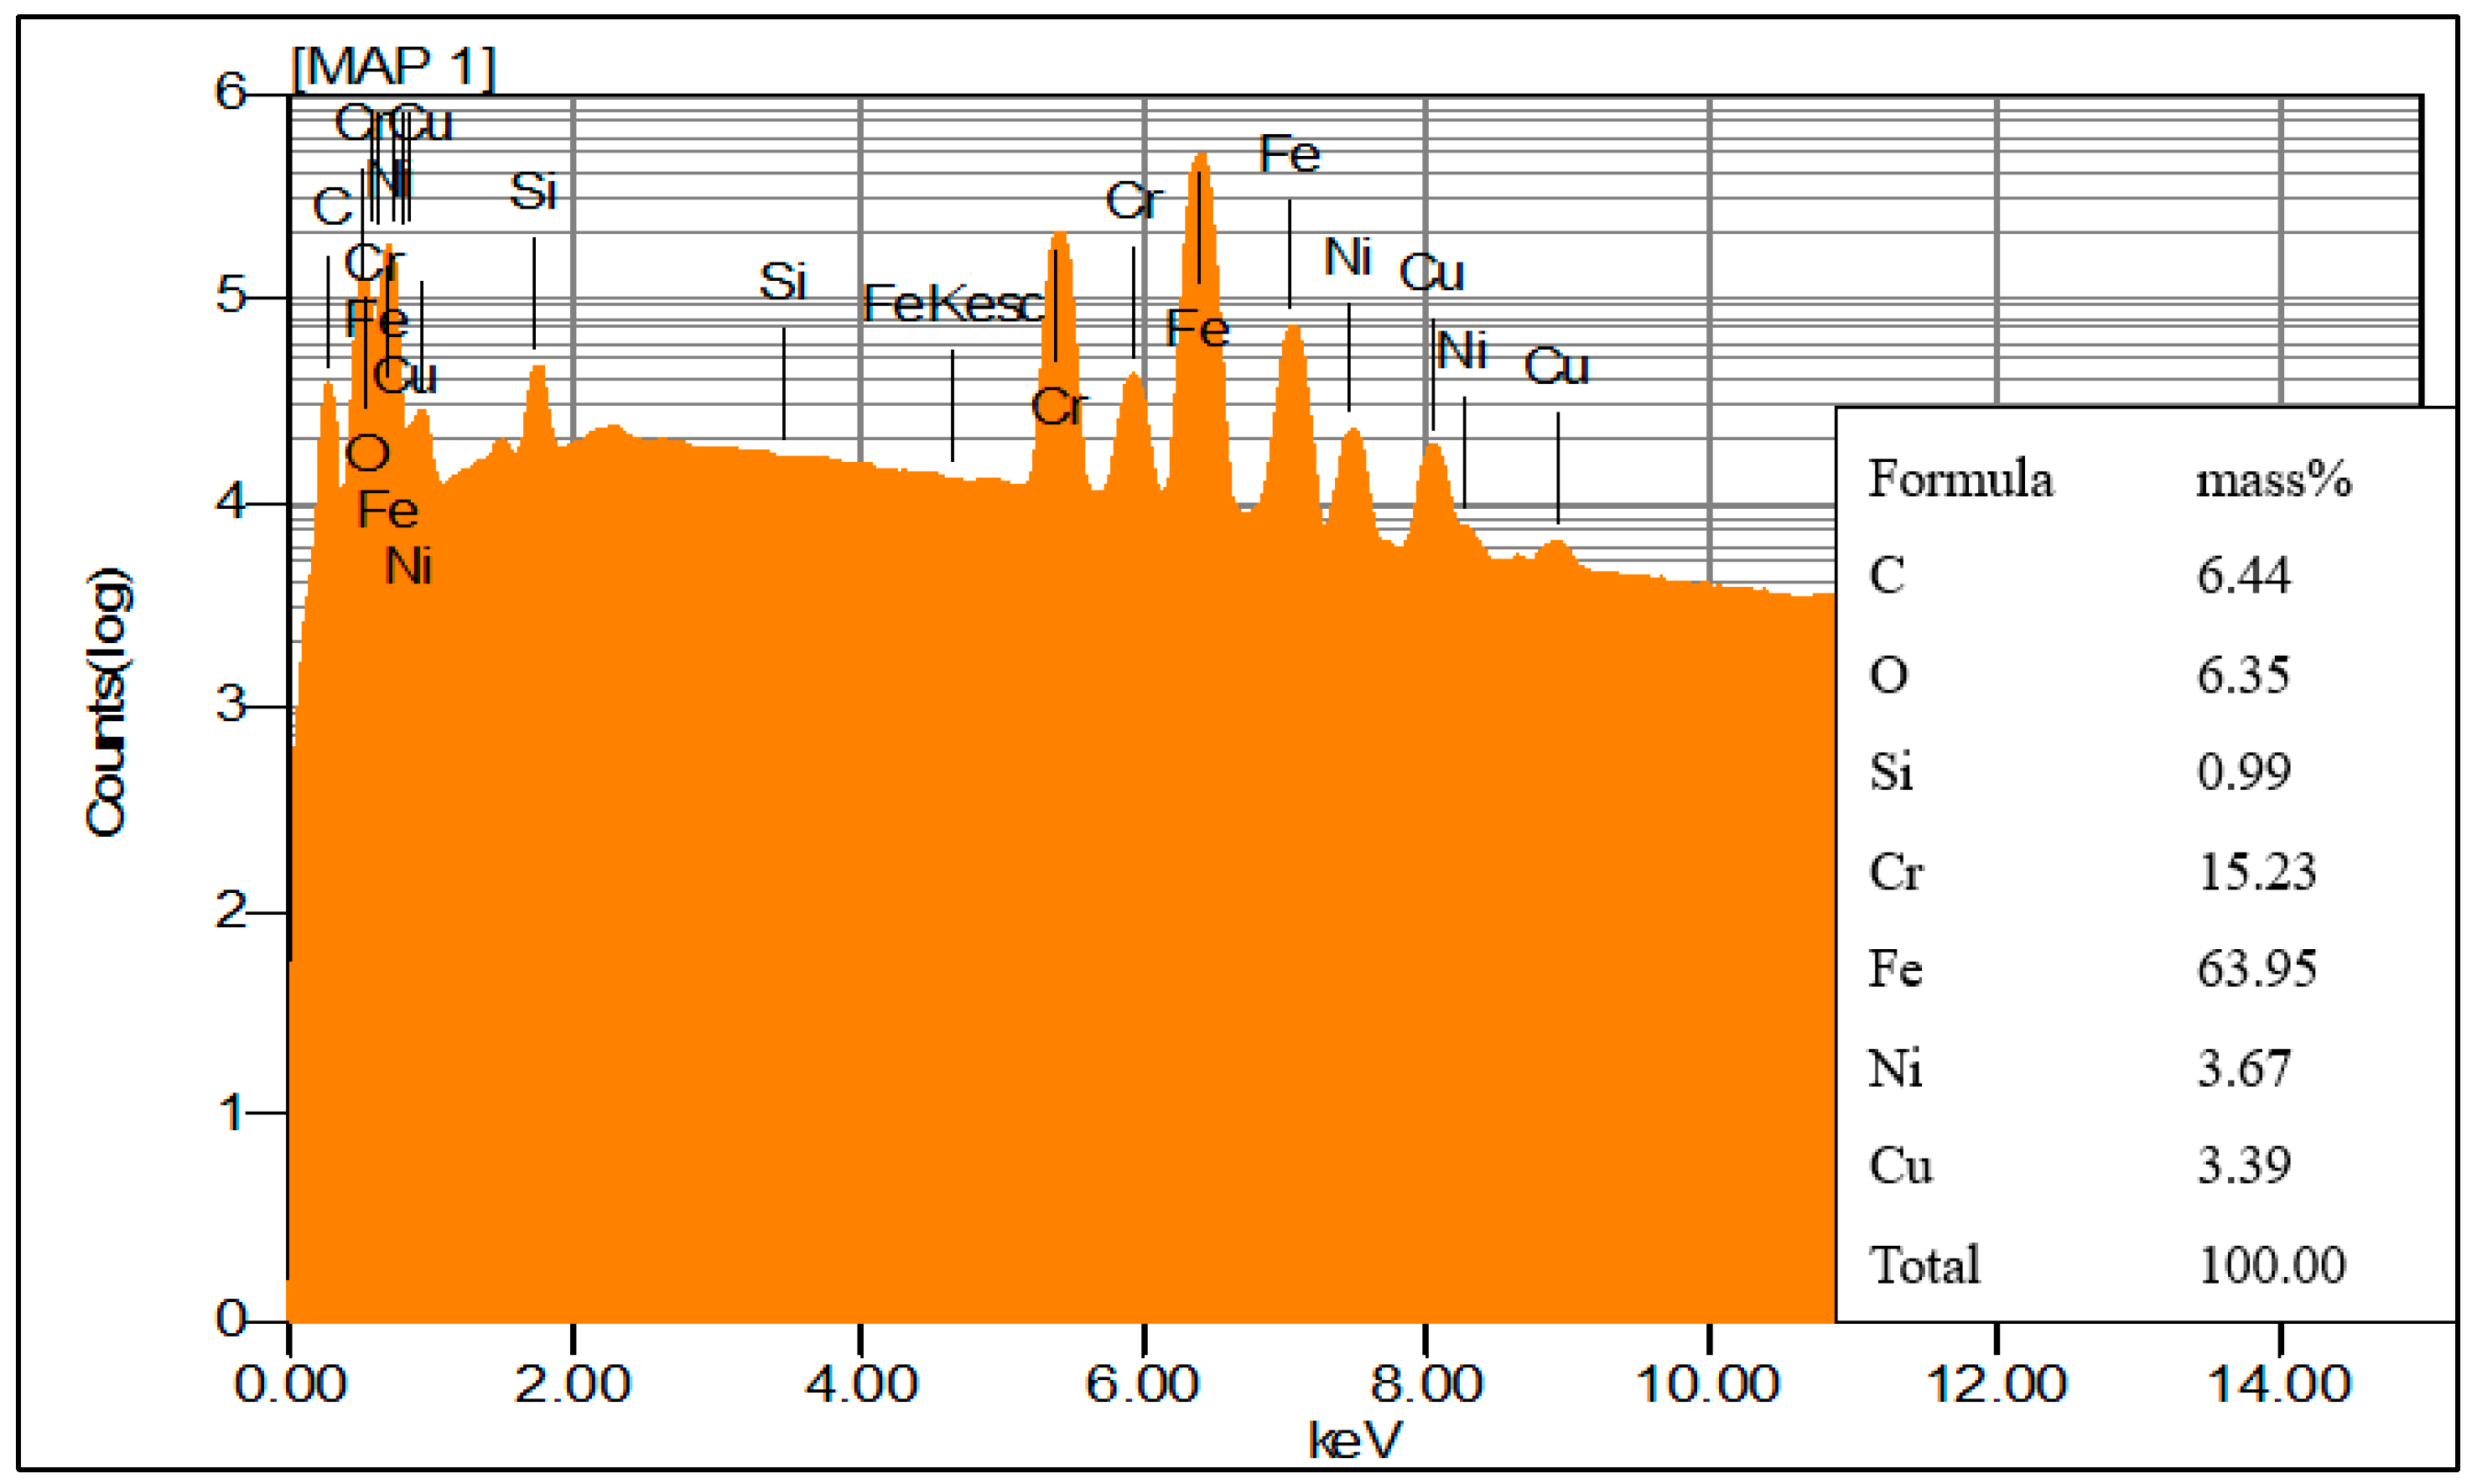
The EDS log-count spectra were used to identify elemental peaks and estimate mass percentage contributions for selected regions. The logarithmic intensity scale allowed both major and minor elemental peaks to be visualized within the same spectrum.
Figure 17 shows the log-count spectrum for the A-0 region, where Fe and Cr were the dominant elements, along with detectable C and O.
For the A-0 region, EDS quantification showed a predominantly Fe-based composition, with Fe contributing approximately 63.95 mass%, followed by Cr at 15.23 mass%, C at 6.44 mass%, O at 6.35 mass%, Ni at 3.67 mass%, Cu at 3.39 mass%, and Si at 0.99 mass%. The detected Cr, Ni, and Cu contents are consistent with the expected alloying elements of 17-4 PH SS. The C and O signals indicate surface-associated contributions that may include carbonaceous contamination, surface oxidation, or oxide-related features associated with processing and aging.
Table 3 reports the localized EDS-estimated elemental composition of the U-0, A-0, and U-C analysis regions. The uncoated U-0 and A-0 regions contained Fe, Cr, Ni, Cu, and Si signals expected for 17-4 PH SS, whereas the U-C interaction volume was dominated by coating-associated O, Si, and C signals together with localized substrate contribution. The EDS estimates represent near-surface interaction volumes and were not used to assess compliance with a bulk-alloy specification.
The U-0 region contained 10.08 mass% C and 4.33 mass% O, while A-0 contained 6.44 mass% C and 6.35 mass% O. These values reflect the surface-sensitive nature of EDS analysis and may include contributions from surface contamination, mounting materials, oxide films, powder surface oxidation, or oxidation during LPBF processing and aging.
The U-C region showed a markedly different surface composition compared with U-0 and A-0. The coated region contained high O and Si contents, with O at 50.44 mass% and Si at 26.84 mass%, indicating a silicon–oxygen-rich coating surface. Carbon was also detected at 15.86 mass%. Ti was detected only in the U-C region at 3.35 mass%, while Fe and Cr were present at lower levels, 2.69 mass% and 0.82 mass%, respectively. The lower Fe and Cr signals relative to U-0 and A-0 are consistent with reduced substrate contribution within the analyzed U-C interaction volume.
4. Discussion
The multiscale characterization documented differences in surface morphology, profile roughness, coating condition, and localized elemental composition among the examined TPMS prototypes and flat plate regions. The Hirox images of the TPMS prototypes revealed anisotropic surface textures aligned with the laser scan paths, along with localized pores, staircase-like transitions, and scan-track-related height variations. These features were more apparent on the curved TPMS surfaces than on the flat plate regions, which is consistent with the geometric constraints of layer-wise fabrication. In TPMS geometries, local curvature, thin features, and changing surface orientation can make the scan-path morphology more spatially variable and can also increase the difficulty of powder removal and post-processing. Therefore, the observed differences between TPMS prototypes and flat plates support the use of both sample types: TPMS prototypes provide information about geometry-dependent LPBF surface features, while flat plates allow more controlled comparison of aging, blasting, and coating effects.
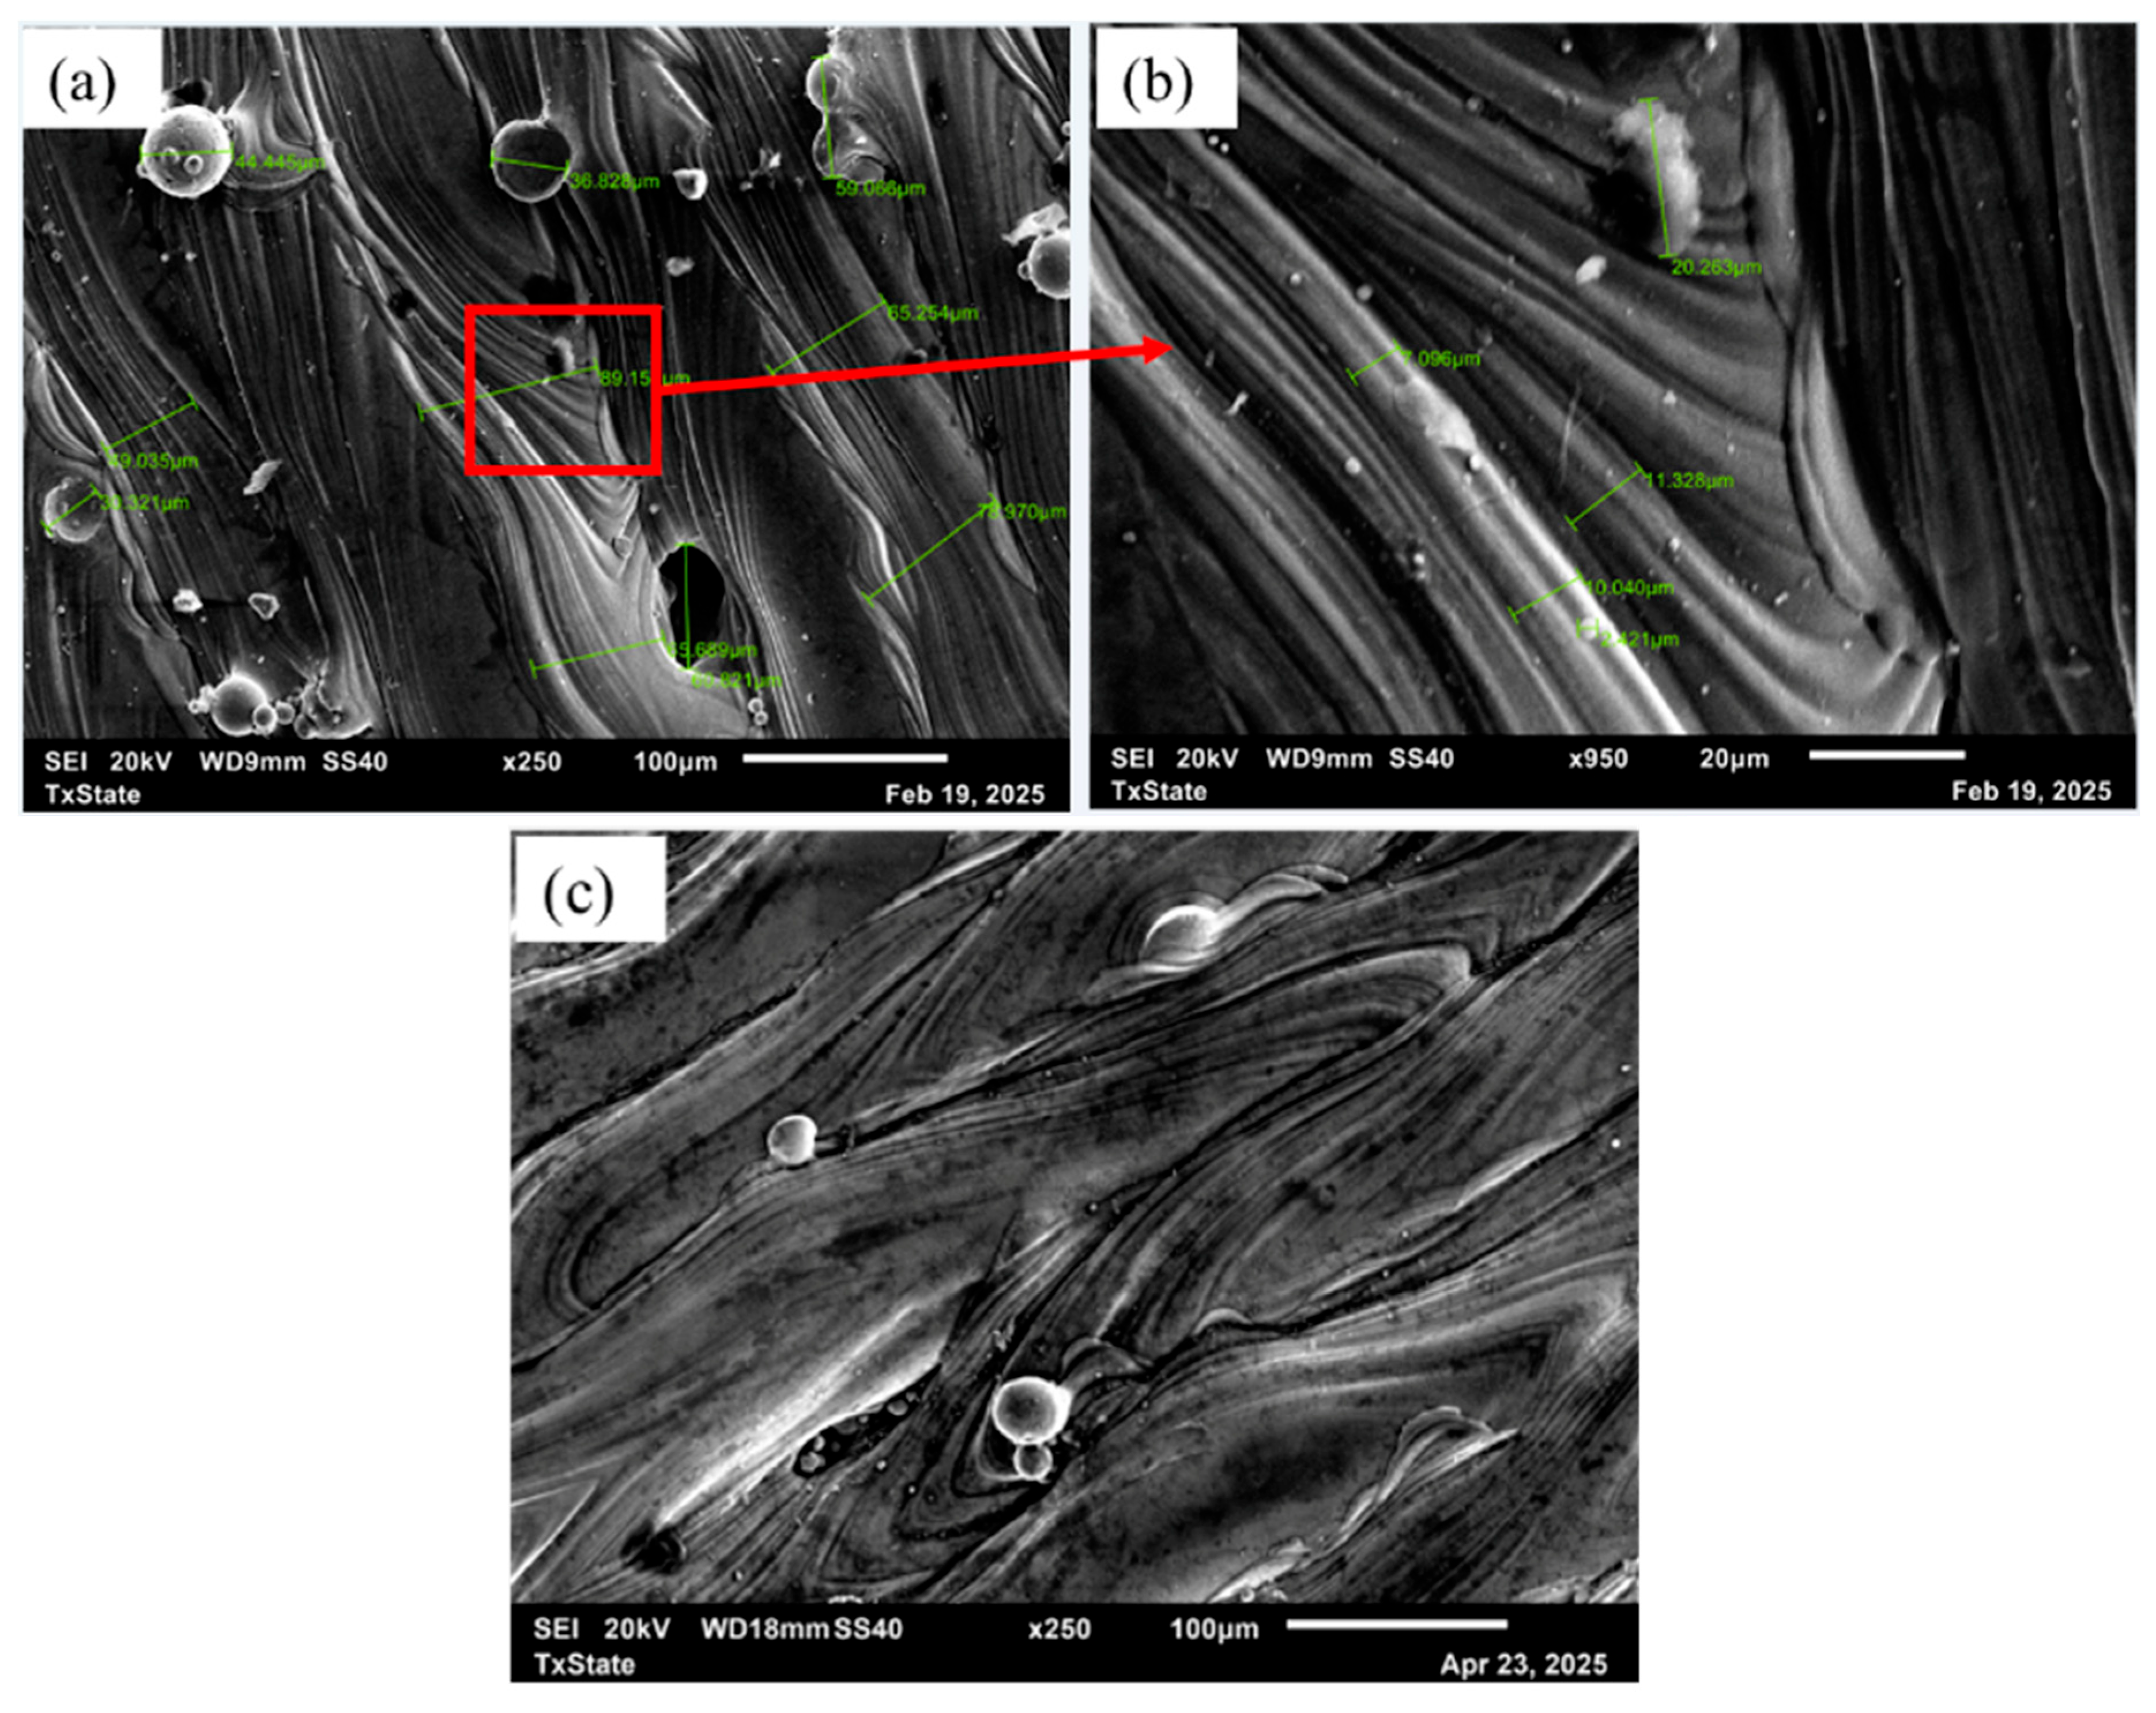
The SEM observations further clarify the LPBF-induced morphology identified by Hirox imaging. In the untreated U-0 region, the visible scan-track pattern, powder balling, pores, and particle-like surface features indicate that the as-fabricated surface retained characteristic LPBF surface irregularities. Balling is generally associated with melt-pool instability, where molten material can break up and solidify into spherical or near-spherical particles attached to the surface. In the present SEM images, particle-like features with approximate sizes in the 20–60 µm range were observed on the untreated surface as shown in
Figure 18a. These features are consistent with the LPBF-related defects identified in the study and with prior reports of partially melted powder, balling, and surface particle adhesion in powder bed fusion processes [
11,
17].
At higher magnification, localized fine particles were also observed within selected defect regions, as shown in
Figure 18b. These fine particle-like features may be associated with several possible LPBF-related sources, including condensed metal vapor, spatter redeposition, fine oxide particles, or local precipitate-related features. However, the present SEM images alone cannot distinguish between these formation mechanisms. The EDS results provide elemental information from selected regions but do not determine the composition, phase identity, or formation pathway of individual fine particle-like features. Therefore, the fine particle-like features indicate localized surface heterogeneity rather than confirmation of a specific particle type. Particle-specific compositional or phase-sensitive characterization would be required to establish their composition and origin.
The aged A-0 surface showed elongated scan-related features, visible dark lines along the surface pattern, and a greater apparent density of fine particles compared with the untreated surface within the examined field of view, as shown in
Figure 18c. These observations are consistent with the EDS results, which showed detectable oxygen and carbon contributions on the aged surface and localized elemental variations. The A-0 interaction volume contained a higher estimated oxygen contribution than U-0; however, this regional difference cannot be attributed solely to thermal aging because plate identity, spatial position, surface topography, contamination, and oxide condition were not independently controlled. In addition, the patchy Cu- and Ni-rich regions observed in the EDS maps of A-0 are consistent with the precipitation-hardening nature of 17-4 PH SS during aging. However, because the present study used surface-sensitive EDS rather than phase-specific analysis, these results should be interpreted as evidence of localized elemental redistribution and surface chemical variation rather than direct confirmation of specific precipitate phases. Together, the SEM and EDS observations document morphological and elemental differences between the selected A-0 and U-0 regions but do not isolate an independent aging effect.
Within the examined plate layout, the geometric mean Rz values for U-B and A-B were numerically lower than those for U-0 and A-0, respectively, and the selected SEM fields showed reduced scan-pattern visibility. These observations are consistent with surface smoothing under the reported blasting condition but should not be generalized to different shot media, pressures, distances, angles, or treatment durations. Plastic deformation of projecting asperities, displacement or removal of weakly attached material, and local surface compaction during shot impact are plausible mechanisms for the observed smoothing. However, material-removal rate, local thickness change, plastic strain, and compaction depth were not measured; therefore, the relative contribution of each mechanism could not be determined. In addition, the fixed regional layout does not allow the contribution of blasting to be quantified independently from pre-existing positional variation in the LPBF surface. Coating may subsequently reduce profile variation by partially filling valleys, whereas non-uniform deposition may introduce additional peaks or discontinuities. The selected SEM fields showed reduced visibility of the linear scan pattern together with localized depressions and irregular pits after blasting. However, the blasting response was not identical between the untreated and aged surfaces. A-B retained more visible scan-related morphology than U-B within the selected fields of view. The measurements do not identify the cause of this regional difference. The selected profile orientation preferentially sampled variation across the visible scan tracks. Profiles parallel to the tracks, or areal roughness parameters, could yield different values; therefore, the reported Rz values do not provide an orientation-independent description of the surfaces. In addition, because each treatment was assigned to a different region on one untreated baseline plate or one aged plate, treatment and spatial position were not fully separable. Natural positional variation in the LPBF surfaces may therefore have contributed to the observed regional differences.
The coating results demonstrate that the hydrophobic spray modified the apparent surface morphology but did not produce complete or uniform coverage across all regions. Hirox imaging showed that coated-only regions retained visible shiny peaks, scan-pattern features, and pore-like regions, indicating that the coating did not fully cover or obscure the underlying LPBF surface morphology. SEM imaging further showed coating cracks, localized irregularities, and clustered particle-like features within the coating layer. The EDS maps of the coated U-C region showed strong silicon and oxygen signals, indicating a silicon–oxygen-rich coating surface, while localized Fe and Cr signals indicated substrate contribution within the EDS interaction volume near visible coating discontinuities. These observations support the conclusion that the coating layer was spatially non-uniform under the conditions used in this study. The investigation is limited to the coating application without delving into the number of spray passes, spray distance, drying interval, curing conditions, ambient conditions, or final coating thickness. These missing application parameters could limit reproducibility and prevent quantitative comparison of coating deposition among the analyzed regions.
The observed coating cracks may reflect the combined effects of solvent-driven shrinkage, non-uniform drying, and the heterogeneous LPBF substrate. Scan-track ridges, adhered particles, pore-like surface features, and local height gradients may disrupt coating leveling and produce spatially non-uniform constraints during drying. The original coating formulation used acetone as a solvent in the step-2 spray [
47], and rapid solvent evaporation can contribute to non-uniform film formation and crack development. However, because the present study did not directly measure drying kinetics, adhesion strength, or coating mechanical properties, the coating cracks should be interpreted primarily as observed morphological evidence of coating discontinuity. Therefore, the results indicate non-uniform coating coverage and possible coating integrity concerns, rather than providing a direct durability measurement.
Within the examined plate regions, U-BC and A-BC had the smallest reported geometric mean Rz values in their respective plate sets and showed less visible underlying scan-track texture than U-C and A-C, respectively. These results are consistent with blasting producing a smoother base surface before coating and with the combined-condition regions exhibiting more even apparent coating coverage. Thus, the combined blasted-plus-coated condition produced the lowest measured regional roughness within both examined plate sets. Because each condition occupied a unique, non-replicated plate position, the magnitude and general applicability of this treatment response should be confirmed using independently replicated specimens. Coating cracks remained visible in the U-BC and A-BC fields, indicating that the combined-condition regions were not free of coating discontinuities.
The EDS results highlight the importance of combining morphological and chemical characterization. The untreated and aged regions showed Fe-, Cr-, Ni-, Cu-, and Si-containing compositions consistent with 17-4 PH SS, while the coated region showed a markedly different surface chemistry dominated by oxygen and silicon. Carbon was detected in all analyzed regions, with higher values in the coated region. Because EDS is surface-sensitive and the samples were mounted and handled during preparation, the carbon signal may include contributions from surface contamination, mounting materials, or coating-related chemistry. Similarly, the oxygen signal may arise from surface oxides, powder surface oxidation, aging-related oxidation, or oxygen-containing coating constituents, depending on the region analyzed. These results demonstrate that EDS provides useful elemental composition and distribution information, but the interpretation must consider sample preparation, surface sensitivity, and the possibility of overlapping contributions from substrate, coating, contamination, and oxide layers.
The detection of Ti in the coated U-C region is also significant because Ti was not detected in the untreated or aged substrate regions. This indicates that Ti is associated with the coating or coating-related surface features rather than the base 17-4 PH SS substrate. In the EDS maps, Ti appeared in selected crack regions, suggesting that Ti-containing material may be present within or near coating discontinuities. Because EDS identifies elemental composition rather than chemical bonding, the specific Ti-containing phase cannot be confirmed from EDS alone. The presence of Ti may be associated with Ti-containing additives in commercial hydrophobic coatings, but additional chemical analysis would be required to confirm the compound form or distribution of Ti within the coating [
44,
45,
46]. This interpretation avoids over-assigning Ti to a specific compound while still connecting the EDS observation to the coating chemistry.
Overall, the results document complementary morphological, profile-roughness, coating-condition, and localized elemental observations across the examined specimens and regions. Hirox imaging captured macro- to microscale scan textures, staircase-like features, pores, and roughness patterns, while SEM revealed finer LPBF-induced defects, coating cracks, and localized surface heterogeneity. EDS provided complementary information on substrate-associated and coating-associated elemental distributions within selected interaction volumes. The combination of these techniques is therefore important because no single characterization method fully captures the surface condition of LPBF-fabricated TPMS and flat plate samples. For example, 3D optical profiling provides useful roughness trends, but the automatically scaled height maps and local field-of-view effects require careful interpretation. SEM provides higher-resolution morphology but over smaller regions. EDS provides elemental information but cannot by itself confirm chemical bonding or phase identity. The integrated approach therefore provides a broader characterization-based understanding of how LPBF fabrication and post-processing treatments influence surface morphology, roughness, and elemental composition.
5. Conclusions
The multiscale characterization conducted in this study examined geometry-dependent LPBF surface features on 17-4 PH SS TPMS prototypes and regional differences in surface morphology, profile roughness, coating condition, and localized elemental composition across representative flat plates containing different applied condition regions. By integrating Hirox imaging and 3D profiling, SEM, and EDS, the study characterized surface conditions across multiple length scales, providing a layered understanding of surface morphology, roughness, and elemental composition. This characterization approach is especially relevant for applications in which surface quality can influence functional performance.
Hirox imaging confirmed anisotropic surface textures aligned with LPBF laser scan paths, along with pore presence and staircase-like surface features. The staircase effect was observed on the curved TPMS surfaces but not on the flat plate surfaces, indicating the influence of local geometry on LPBF-induced surface morphology. Hirox 3D profiling documented regional differences in the reported geometric mean Rz values across the plate treatment map. The blasted-plus-coated regions had the smallest reported geometric mean Rz values within both plate sets. Because each condition occupied a unique plate region, the design did not allow the independent effects of aging, blasting, coating, and their combinations to be separated from plate-region variability. These results indicate that profile roughness should be interpreted together with direct surface imaging, particularly for LPBF-fabricated structures containing scan-track-related features and localized surface irregularities.
SEM imaging revealed common LPBF-related surface features, including balling, pores, and particle adhesion. The SEM observations showed regional surface-morphology differences, including residual scan patterns, localized depressions, irregular pits, and variations in the apparent density of fine particle-like features within the examined fields of view. In addition, cracks and non-uniformity were observed in the hydrophobic coating layer, indicating that improved surface preparation or an alternative coating approach should be considered when a more uniform coated surface is required.
EDS analysis identified differences in localized elemental signals among the analyzed U-0, A-0, and U-C interaction volumes. These regional differences were not interpreted as independently isolated effects of post-processing or aging. The selected U-0 and A-0 interaction volumes contained Fe, Cr, Ni, Cu, and Si signals, whereas the U-C interaction volume exhibited strong Si and O signals, localized coating-associated elemental features, and reduced substrate contribution. These findings reinforce that both morphological and elemental characteristics should be considered when evaluating post-processed additively manufactured surfaces.
Overall, the findings demonstrate the value of combining complementary methods to document geometry-dependent TPMS features and regional surface condition differences across the examined flat plates. Documenting regional differences in profile roughness, morphology, coating condition, and localized elemental composition provides information for future evaluations of LPBF and post-processing conditions. For researchers and engineers, this work reinforces the need to evaluate surface morphology, roughness, and elemental composition across functional length scales to inform material selection and process refinement.