1. Introduction
Deep marine carbonate reservoirs are key targets for natural gas exploration and development, yet drilling in these formations remains challenging because of strong heterogeneity, multiscale discontinuities, and complex formation pressure systems. In deep carbonate intervals, natural fractures, bedding planes, dissolution cavities, and locally fractured zones can disturb the redistributed stress field around the wellbore after drilling. This stress redistribution, often coupled with thermal and chemical variations, is the fundamental driver of wellbore instability, a mechanism similarly critical in enhanced geothermal systems and hydrate-bearing sediments [
1,
2,
3]. When the induced stress concentration exceeds the rock strength or reactivates pre-existing weak planes, wellbore spalling, collapse, lost circulation, well kicks, and pipe sticking may occur. These problems are especially pronounced in fractured–vuggy carbonate rocks. Structural planes reduce the load-bearing capacity of the rock mass and, at the same time, act as preferential channels for drilling-fluid invasion and pore-pressure transmission. Therefore, wellbore instability in deep carbonate formations should not be regarded only as a failure problem of intact rock, but rather as a coupled geomechanical process controlled by in situ stress, rock mechanical properties, fracture–cavity networks, drilling-fluid invasion, and pressure redistribution [
4,
5,
6].
Previous studies have provided important insights into wellbore stability and pressure prediction in fractured or heterogeneous formations. Dual-porosity poroelastic models have been used to describe the coupled deformation and fluid-flow behavior of naturally fractured reservoirs, providing a theoretical basis for evaluating wellbore stability under drilling-fluid invasion [
7]. Rock failure criteria, including the Mohr–Coulomb and Mogi–Coulomb criteria, have also been widely applied to determine critical mud weights and assess borehole stability under complex stress states [
8,
9]. In addition, well trajectory has been shown to influence stress concentration around the borehole and has therefore been considered in borehole stability analysis and trajectory optimization [
10,
11]. For rock mechanical parameter prediction, empirical correlations between rock strength and physical or logging properties have been developed for sedimentary rocks [
12]. Dynamic–static elastic parameter conversion has also been used to extend discrete laboratory measurements to continuous mechanical profiles along the wellbore [
13]. In parallel, studies on lost circulation in fractured formations have demonstrated that fracture geometry, particle bridging, plugging-zone development, and wellbore strengthening can significantly affect the pressure-bearing capacity of the near-wellbore region [
14,
15], while true-triaxial wellbore-strengthening experiments further show the importance of fracture sealing and fracture reopening pressure [
16].
However, several problems remain for deep marine carbonate formations with well-developed fracture–cavity systems. Laboratory mechanical tests are generally limited to a small number of core samples and therefore cannot fully capture the continuous variation in mechanical properties along the entire well section. Conventional wellbore stability models often simplify the formation as a continuous or equivalent continuous medium, whereas deep carbonate rocks commonly contain intersecting macroscopic fractures, mesoscopic dissolution cavities, and loose microscopic crystal boundaries. Such multiscale pore and fracture systems are closely related to carbonate rock fabric and diagenetic modification [
17,
18], and they can strongly influence acoustic velocity and elastic responses in carbonate rocks [
19]. These discontinuities may cause local mechanical degradation and promote shear slip along weak planes. Moreover, the theoretical fracture pressure or matrix lost-circulation pressure calculated under the assumption of intact rock may be much higher than the actual pressure-bearing capacity of fractured-vuggy intervals. Consequently, the upper limit of the safe mud-weight window may be overestimated, particularly in intervals where natural fractures are hydraulically connected with dissolution cavities. This discrepancy complicates mud-weight design, increasing mud weight is beneficial for collapse prevention, but it may also trigger severe lost circulation in fracture–cavity-developed intervals.
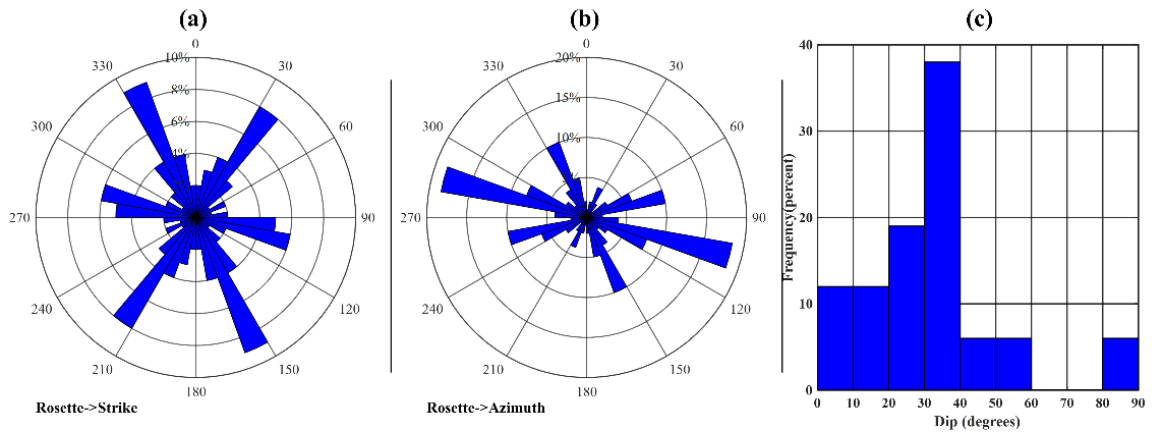
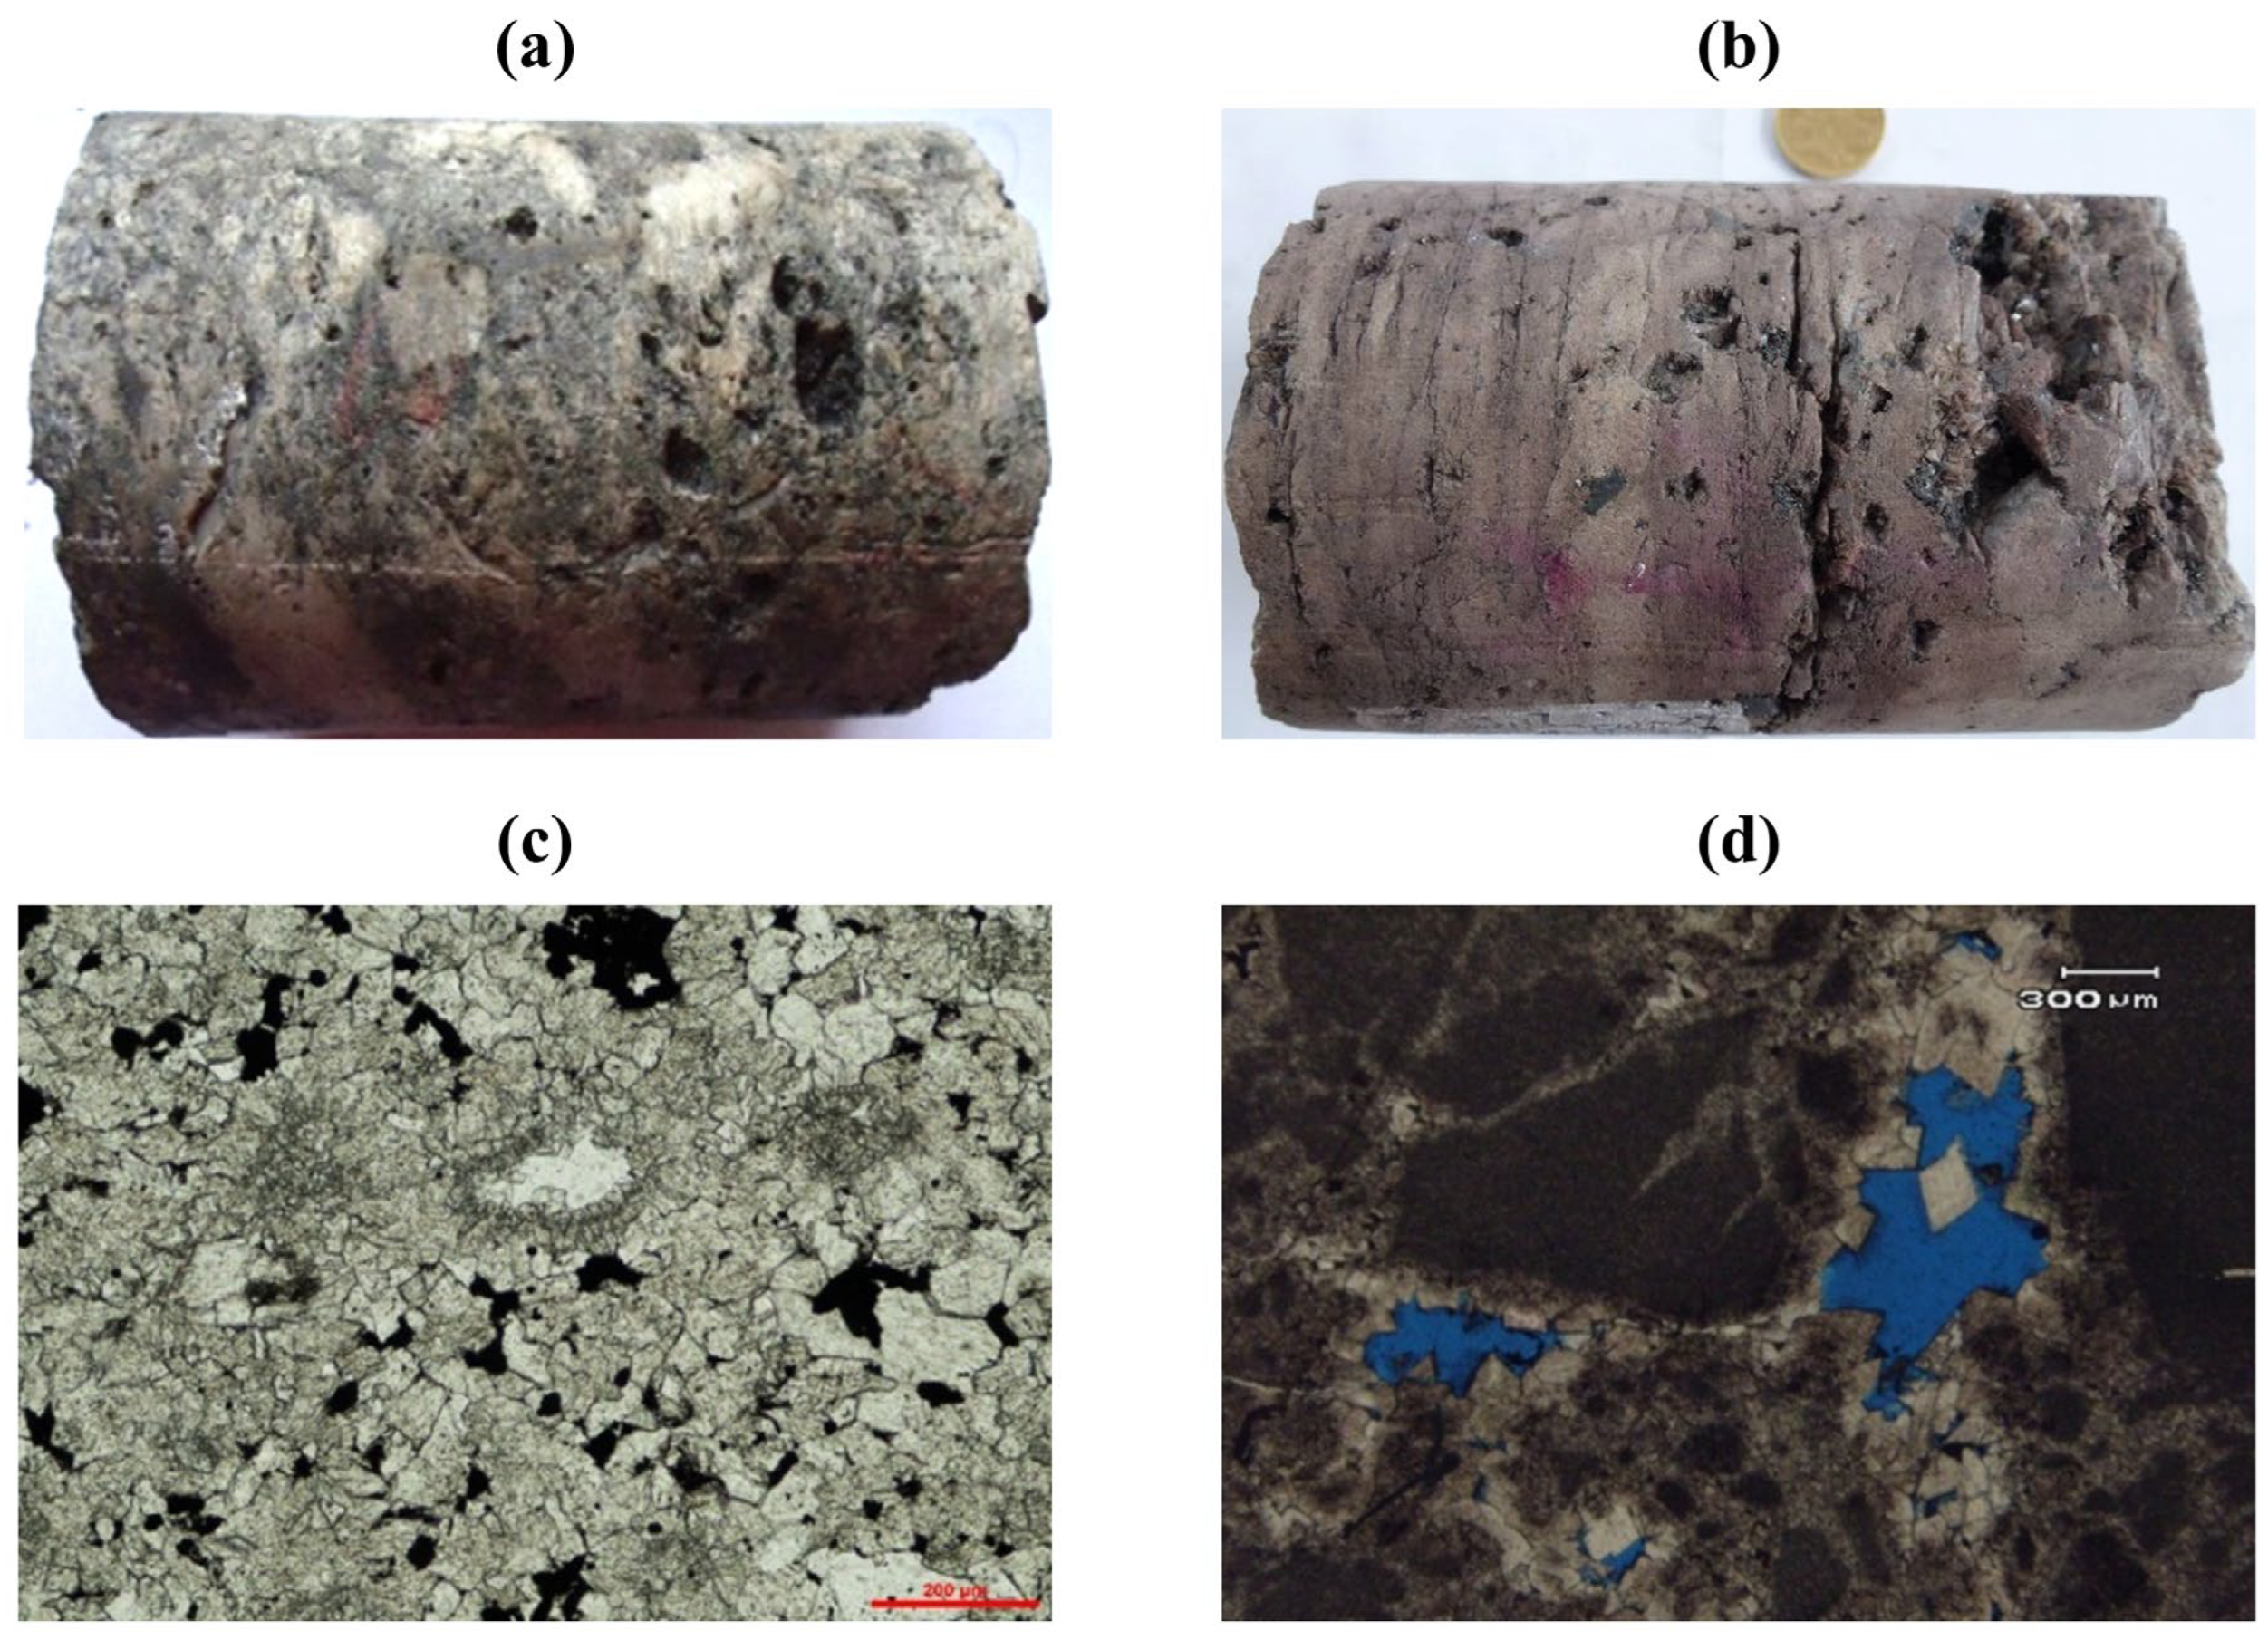
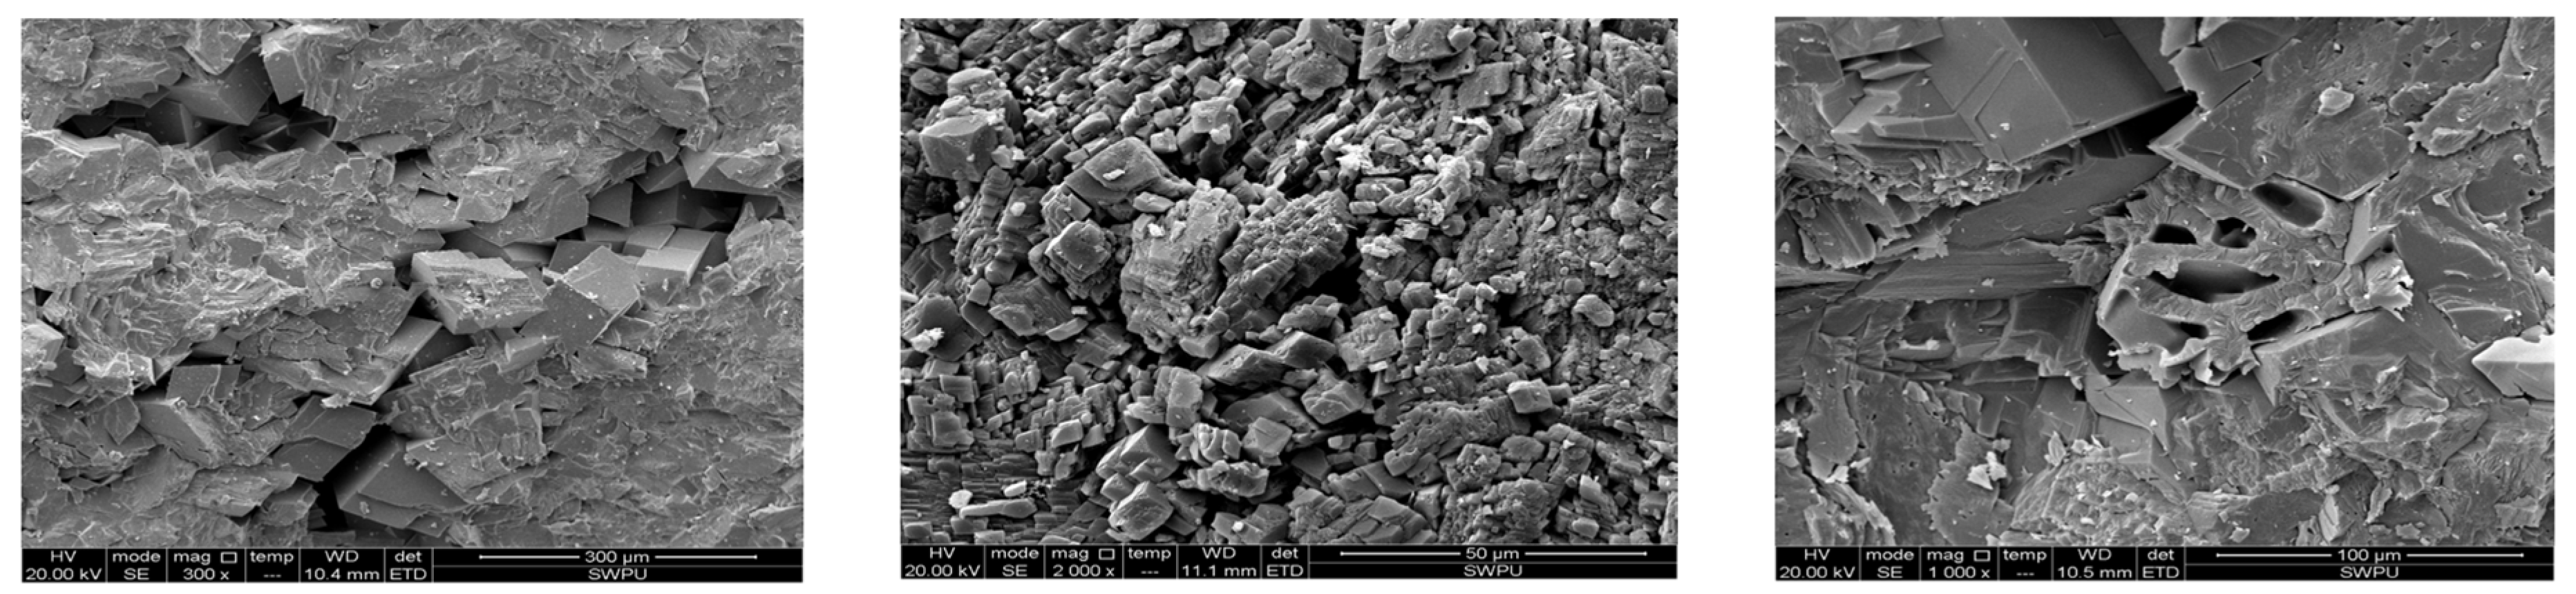
To address these issues, this study investigates the wellbore instability mechanisms and four-pressure profile prediction method for deep marine carbonate rocks by integrating multiscale structural characterization, laboratory rock mechanical testing, well-log-constrained inversion, and field validation. Electrical imaging logs, core observations, and environmental scanning electron microscopy are used to identify macroscopic fractures, mesoscopic dissolution cavities, and microscopic weak boundaries. Triaxial compression tests and Brazilian splitting tests are then conducted to obtain the strength and elastic parameters of carbonate rocks under different confining pressures. Based on acoustic transit time and density logging data, continuous inversion models are established for rock mechanical parameters, including dynamic and static elastic parameters, uniaxial compressive strength, tensile strength, cohesion, and frictional parameters. On this basis, a four-pressure profile prediction method is developed by integrating pore pressure, collapse pressure, lost-circulation pressure, and fracture pressure. The method is further applied to Wells PT-101, and the predicted pressure anomalies are compared with field events such as well kicks, wellbore collapse, pipe sticking, and severe lost circulation. The results provide a quantitative basis for wellbore structure optimization, mud-weight window design, and drilling risk control in deep fractured-vuggy carbonate formations.
3. Experimental Study on the Mechanical Properties and Failure Mechanisms of Deep Carbonate Rocks
The rock mechanical tests were conducted using an RTR-1000 multifunctional rock testing system for coupled multi-field conditions. The system mainly consists of an intelligent servo-control module, a coupled seepage-acoustic monitoring unit, and a thermal environment simulation system. The maximum axial loading capacity of the system is 600 kN, which satisfies the requirements of triaxial compression tests under confining pressures of 0~80 MPa. The temperature control system can simulate deep geothermal conditions up to 150 °C. In addition, the fluid pressure can be controlled with an accuracy of 0.01 MPa, and the displacement sensor has a micrometer-level resolution of 0.001 mm. This platform allows accurate determination of key mechanical properties of rock samples, including uniaxial and triaxial compressive strength, dynamic and static elastic moduli, Poisson’s ratio, and P- and S-wave velocities. The test procedures are consistent with widely used ISRM recommendations for tensile strength and triaxial compression testing [
24,
25]. These data provide a basis for establishing rock failure criteria and validating multi-field coupled constitutive models.
The core samples used in the experiments were collected from five key wells drilled in deep marine carbonate formations in the Sichuan Basin. The coring depths were mainly distributed between 5200 and 6500 m. The lithologies were dominated by microcrystalline limestone, fine-crystalline dolomite, and brecciated dolomite. During sample preparation, full-diameter downhole cores were drilled, cut, and end-ground in strict accordance with the Standard for Test Methods of Engineering Rock Mass. A total of 20 standard Brazilian splitting specimens with a diameter of 50 mm and a thickness of 25 mm, as well as 60 standard cylindrical specimens for uniaxial and triaxial compression tests with a diameter of 25 mm and a height of 50 mm, were prepared. The tests were conducted at a constant strain rate of 1 × 10
−5 s
−1 under fully saturated conditions at room temperature. Four confining pressure levels of 25, 30, 45, and 60 MPa were used in the triaxial tests to simulate different in situ stress conditions.
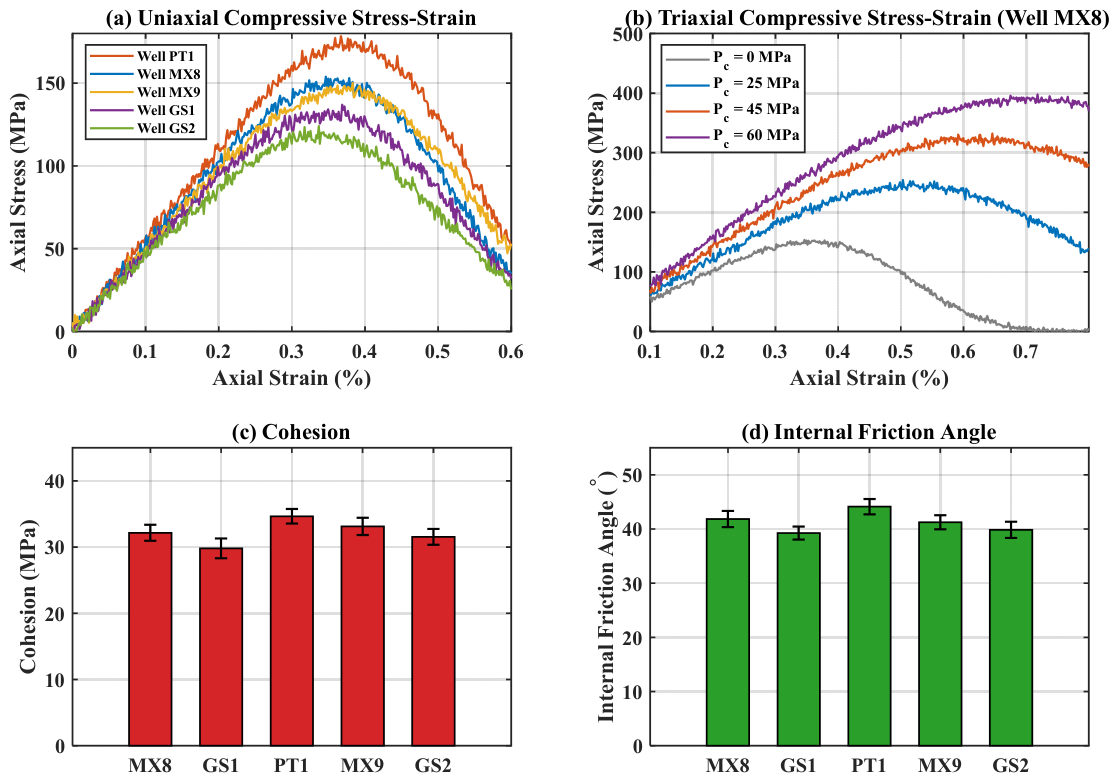
Table 1 and
Table 2 list the representative test results for selected samples across different depths to illustrate the parameter ranges, and representative stress–strain curves are presented in
Figure 4. Meanwhile, the entire dataset of 60 samples was utilized to build the regression models in
Section 4.
A total of 20 standard Brazilian splitting specimens with a diameter of 50 mm and a thickness of 25 mm, as well as 60 standard cylindrical specimens for uniaxial and triaxial compression tests with a diameter of 25 mm and a height of 50 mm, were prepared. Four confining pressure levels of 25, 30, 45, and 60 MPa were used in the triaxial tests to simulate different in situ stress conditions. The uniaxial compression results of selected samples are listed in
Table 1, the triaxial loading results are shown in
Table 2, and representative stress–strain curves are presented in
Figure 4.
The rock mechanical test results summarized in
Figure 4 indicate that the mechanical properties of deep marine carbonate rocks vary significantly among different well areas. Among them, the samples from Well PT1 exhibit the highest overall mechanical strength. Their uniaxial compressive strength (UCS) exceeds 150 MPa, and both cohesion and internal friction angle are the highest among the tested wells, indicating that the rocks in this area are more compact and harder, with strong resistance to shear failure. In contrast, Well GS-1 shows the lowest mechanical parameters, suggesting relatively weak rock masses. The triaxial compressive strength (TCS) curves also clearly reveal a pronounced confining-pressure strengthening effect, which is consistent with the dependence of rock failure on principal stresses [
26]. As the confining pressure increases from 25 to 60 MPa, the peak strengths of the rock samples from all wells increase approximately linearly, which is consistent with the classical Mohr–Coulomb failure criterion. It is also noteworthy that the mechanical evolution trends of Wells MX-8 and MX-9, as well as those of Wells GS-1 and GS-2, show strong similarity. This suggests that wells within the same block or adjacent well locations may have experienced similar depositional environments and diagenetic histories, resulting in comparable macroscopic rock mechanical responses. The shear response of fractured rocks and weak structural planes further explains why fracture orientation and infill state can strongly influence wellbore failure [
27,
28,
29].
4. Multi-Parameter Coupled Prediction Model for Continuous Rock Mechanical Parameter Profiles
The mineral composition and internal structure of carbonate rocks vary with depositional environment and diagenesis. These variations directly influence well log responses. To identify lithology in intervals without core samples, cored intervals are first examined. Lithology is determined through visual core observation, cast thin section analysis, and laboratory chemical tests. Corresponding log data are then compared, including numerical ranges, curve fluctuation patterns, and morphological characteristics. Log response patterns for different carbonate rocks are established by considering the effects of pore structure and rock fabric on sonic and density responses [
19,
30]. These patterns ultimately enable lithology identification in non-cored intervals.
Downhole rock mechanical tests can only provide mechanical information for a specific interval, not for the entire well section. Moreover, downhole coring is difficult and costly. The author therefore correlated a large set of downhole core test data with corresponding in situ log parameters from the same wells. A multi-parameter coupled dynamic inversion model for carbonate rock mechanical properties was developed. This model can predict the full-well rock mechanical profile relatively accurately. It replaces the conventional method of obtaining formation mechanical parameters through downhole core laboratory tests. Similar log-constrained approaches have been widely used for rock strength estimation, pore-pressure prediction, and geomechanical parameter profiling [
12,
31,
32].
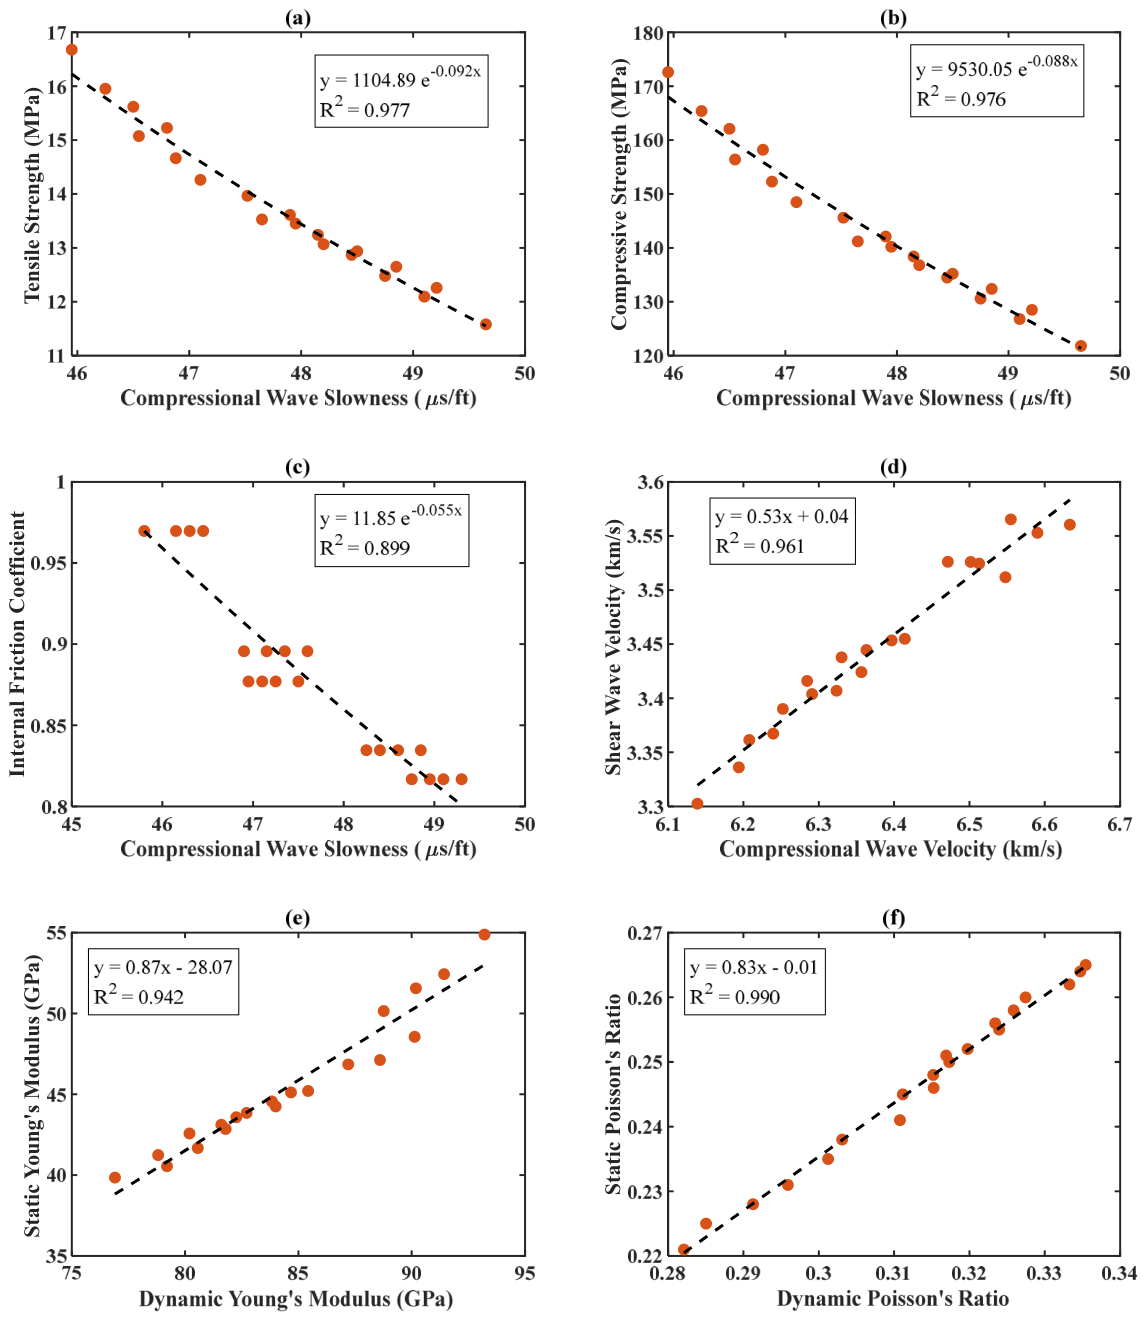
Rock tensile strength is an essential basic parameter for determining formation fracture pressure and guiding fracturing operations. Based on Brazilian splitting tests and calculations, the tensile strength of the carbonate rocks ranges from 10.24 to 16.68 MPa, with an average of 13.25 MPa. The statistical relationship between tensile strength and P-wave slowness is shown in
Figure 5a. Rock compressive strength is a fundamental parameter for obtaining formation collapse pressure. The uniaxial compressive strength of the carbonate rocks ranges from 108.4 to 172.6 MPa, with an average of 138.5 MPa. The statistical relationship between compressive strength and P-wave slowness is shown in
Figure 5b.
Rock shear strength characterizes the ultimate load-bearing capacity of a material to resist sliding instability along structural planes under a shear stress field. Its quantitative description follows the Mohr–Coulomb (M-C) criterion and consists of two components: cohesion and internal friction angle. Cohesion represents the inherent shear resistance generated by rock cementation, whereas the internal friction angle reflects the linear relationship between frictional resistance along the shear failure plane and normal stress. In this study, triaxial compression tests were conducted under four different confining pressures to obtain the compressive strength of the rock samples. The cohesion and internal friction angle were then determined using Mohr stress circles. The experimental results show that the cohesion of the carbonate rocks ranges from 27.10 to 36.60 MPa, with an average value of 31.85 MPa. The internal friction coefficient ranges from 0.750 to 0.970, with an average value of 0.857. In addition, the internal friction coefficient shows a negative correlation with P-wave transit time, as shown in
Figure 5c. Furthermore, a strong linear relationship is observed between the compressional wave velocity and shear wave velocity, as illustrated in
Figure 5d.
The static elastic modulus and static Poisson’s ratio were determined from triaxial compression tests on core samples. These parameters characterize the nonlinear stress–strain response of the rock under quasi-static loading and directly reflect the in situ mechanical behavior of the formation. In contrast, the dynamic elastic modulus and dynamic Poisson’s ratio were calculated from acoustic transit time and density logging data based on elastic wave propagation theory.
Figure 5e,f present the regression relationships between the dynamic elastic parameters derived from well logs and the corresponding static parameters obtained from laboratory measurements. The results indicate a strong positive correlation between the dynamic and static elastic moduli of the carbonate rocks in the target interval, and the dynamic and static Poisson’s ratios also exhibit a positive correlation, consistent with standard poroelastic behavior in carbonate rocks. This difference between static and dynamic elastic parameters has been widely reported for rocks and should be considered when converting log-derived dynamic properties into static geomechanical inputs [
33,
34,
35].
5. Wellbore Instability Mechanisms and Engineering Application of Four-Pressure Profiles
5.1. Lower Limit of the Safe Mud-Weight Window for Carbonate Formations
The lower limit of the safe mud-weight window is constrained by both the formation pore pressure and the critical collapse mud weight and is defined as the greater of the two values. The pore pressure was determined from the inversion of acoustic transit time and density logging data, whereas the critical collapse mud weight was governed by the coupled effects of the in situ stress field, well trajectory, elastic properties, and rock mechanical parameters. Pore-pressure prediction from sonic and density logs has been widely used in drilling geomechanics, particularly where pressure disequilibrium and overpressure mechanisms need to be evaluated [
36,
37]. Considering the high brittleness and strong heterogeneity of carbonate formations, the effective stresses around the wellbore were calculated using a stress distribution model for inclined wells:
where K
1 is the seepage-effect coefficient, and A, B, C, D, E, F, G, H and J are the coordinate transformation coefficients, which are defined as follows:
After the principal stresses around the inclined wellbore were determined, they were substituted into the Mohr–Coulomb (M-C) failure criterion to establish the collapse mud-weight prediction model for carbonate formations:
where f is the formation porosity; μ is Poisson’s ratio of the rock; α is the Biot coefficient; and ϕ is the nonlinear stress correction coefficient. All parameters except porosity are dimensionless, while porosity is expressed as a percentage.
It is important to note that applying the isotropic Mohr–Coulomb criterion directly to intact rock parameters overestimates the stability of fractured intervals. To account for the weak planes and multiscale discontinuities, the intact rock cohesion (Ci) and friction angle (ϕi) were downgraded to rock mass properties (Cm, ϕm) using the Geological Strength Index (GSI) correlation before being input into Equation (3). The GSI was continuously estimated along the wellbore based on the fracture density derived from FMI logs, ensuring that the collapse pressure accurately reflects the mechanical degradation in fracture–cavity zones.
5.2. Upper Limit of the Safe Mud-Weight Window for Carbonate Formations
The upper limit of the safe mud-weight window is constrained by the formation’s resistance to fluid leakage. In highly heterogeneous deep carbonate formations, this limit exhibits a dual-mechanism behavior depending on the multiscale structural characteristics: intact matrix leakage (fracture initiation) and weak-plane leakage (fracture reopening).
- (1)
Intact Matrix Leakage (Fracture Initiation):
In competent rock intervals without natural macroscopic fractures, leakage occurs when the wellbore pressure exceeds the tensile strength of the rock matrix. The fracture pressure gradient is governed by the dynamic elastic properties of the rock, the effective stress ratio, the fracture development state, and the in situ stress field. When the wellbore pressure exceeds the tensile strength of the surrounding formation, tensile stresses induced at the borehole wall may initiate fracture propagation. According to the maximum tensile stress criterion, tensile failure occurs when the following condition is satisfied:
where σmin is the minimum principal stress (MPa);
Pi is the wellbore pressure (MPa); and
σt is the tensile strength of the formation (MPa).
Considering the combined effects of the in situ stress field and pore pressure, the effective circumferential stress, is given by
Since tensile failure generally initiates at the location where the effective circumferential stress reaches its minimum (θ = 0° or 180°), the effective circumferential stress components can be expressed as
The pore pressure effect can be expressed as
Substituting Equations (7) and (8) into Equation (6) gives
By substituting Equation (9) into the fracture criterion, the formation fracture pressure (
Pf) can be derived as follows:
where
Pf is the formation fracture pressure (MPa);
St is the tensile strength of the rock (MPa); and
μ is Poisson’s ratio. The tensile-stress-based interpretation of fracture initiation is consistent with classical hydraulic fracture initiation theory [
38].
- (2)
Weak-Plane Leakage (Fracture Reopening):
In anomaly zones where macroscopic fractures and dissolution vugs are highly developed, the tensile strength across the structural planes is effectively zero. In these intervals, drilling fluid invasion is governed by the fracture reopening mechanism rather than intact rock failure. The critical leakage pressure (
PL) is theoretically equal to the minimum horizontal principal stress (
σh) acting normal to the fracture planes:
This dual-mechanism approach allows for a purely predictive evaluation of the mud-weight upper bound without relying on retrospective dynamic loss parameters. The safe window upper limit is thus defined by Pf in intact formations and PL in fractured zones.
5.3. Development of Four-Pressure Profiles and Mechanistic Analysis of Complex Drilling Conditions
Deep carbonate drilling is highly susceptible to complex downhole events, including lost circulation, well kicks, wellbore collapse, and pipe sticking, owing to the complex geological structures and stress conditions in the study area. Laboratory tests on downhole core samples provide the fundamental rock mechanical parameters of the cored intervals. By correlating the static elastic properties measured in the laboratory with in situ well-log data, regression models for predicting rock mechanical parameters from well logs were established. These models enable reliable prediction of the collapse pressure, lost-circulation pressure, and fracture pressure throughout the entire wellbore, providing a scientific basis for safe drilling operations and wellbore design. In formations containing weak planes or chemically active fractured porous media, weak-plane anisotropy and poromechanical coupling should be incorporated into wellbore stability interpretation [
39,
40].
Well PT1, an exploratory well drilled into the deep carbonate formations of the Sichuan Basin, was selected as a case study. The regression models presented in
Table 3 were first used to construct continuous profiles of the rock mechanical parameters. The maximum and minimum horizontal stress coefficients were then determined using field leak-off test data together with laboratory in situ stress measurements, while the overburden stress profile was calculated from density logging data. Based on the estimated in situ stresses, pore pressure, and rock mechanical parameters, together with the recorded downhole drilling events summarized in
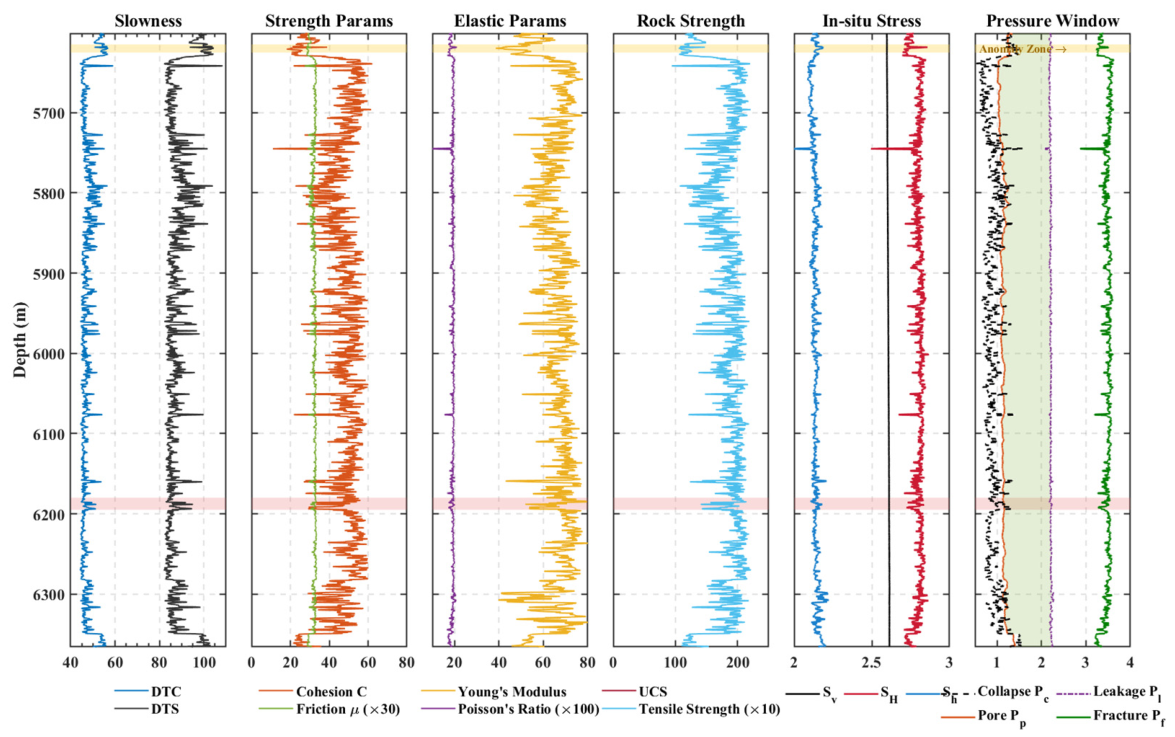
Table 4, Equations (3), (5) and (11) were applied to calculate the collapse pressure, lost-circulation pressure, and fracture pressure profiles of the carbonate formation. The resulting four-pressure profiles are presented in
Figure 6.
Wellbore instability in deep carbonate formations is closely related to the in situ stress field, formation pressure, rock mechanical properties, and fracture development. The target interval of Well PT1 is located at a depth of 5600~6350 m. As shown in
Figure 6, the mechanical properties of the rock exhibit significant heterogeneity. In specific localized intervals, such as the anomaly zone at 5615~5625 m, the compressive strength (UCS), Young’s modulus, and cohesion experience sharp declines. This degradation is typically associated with well-developed microfractures or argillaceous intercalations, which compromise formation integrity. Consequently, the equivalent mud weight required to prevent matrix collapse in this narrow band spikes to approximately 1.20~1.30 g/cm
3, slightly exceeding the local pore pressure of ~1.15 g/cm
3. Drilling fluid invasion along these weakened planes further reduces the internal friction of fracture surfaces, making the section highly susceptible to shear failure and spalling if the mud weight is insufficient. Conversely, the bulk of the formation (e.g., 5700~6100 m and 6200~6350 m) consists of tighter, more competent rock. In these stable sections, the UCS, cohesion, and elastic modulus remain high, and the theoretical collapse pressure generally fluctuates between 0.8 and 1.0 g/cm
3, indicating an inherently more stable wellbore environment.
Lost circulation in these deep carbonates is primarily governed by the presence of natural fractures and dissolution cavities rather than matrix failure. FMI logs and drilling records from Well PT1 suggest that such fracture–cavity systems are locally well-developed, particularly corresponding to the deeper anomaly zone observed around 6180~6195 m. Although the theoretical leak-off pressure calculated for an intact rock matrix remains relatively high across the entire profile, averaging an equivalent density of approximately 2.10~2.20 g/cm
3, these macroscopic geological features substantially reduce the actual pressure containment capacity of the wellbore. Severe lost circulation typically occurs when the dynamic circulating density of the drilling fluid exceeds the critical opening pressure of existing natural fractures or breaks through the secondary fillings within dissolution vugs. This type of fluid loss is characterized by high rates and large volumes, driven by the fracture–cavity network rather than the intrinsic tensile strength of the rock matrix [
41,
42].
Overall, the geomechanical profile of the 5600~6350 m interval reveals a generally wide theoretical safe mud-weight window, bounded by a pore pressure of ~1.15 g/cm3 and a matrix leakage pressure exceeding 2.10 g/cm3. However, drilling safety is heavily dictated by the localized, mechanically weak anomaly zones (e.g., 5615~5625 m and 6180~6195 m). In these specific intervals, mechanical-chemical coupling and fracture weakening elevate the required collapse mud weight to near 1.30 g/cm3, increasing the risk of wellbore collapse along weak planes. Simultaneously, the presence of natural fractures drastically lowers the actual threshold for lost circulation. Therefore, to navigate this complex pressure system, the plugging and anti-collapse properties of the drilling fluid must be prioritized when penetrating microfracture-rich zones. For intervals prone to severe fluid loss, bridging materials and lost-circulation treatments should be prepared in advance to reinforce the wellbore’s pressure-bearing capacity. Where field conditions permit, managed pressure drilling (MPD) techniques could be employed to precisely control the equivalent circulating density, thereby minimizing the risk of fracturing the formation while still providing sufficient support against shear failure.
5.4. Field Case Validation and Mud-Weight Window Optimization
A dynamic interpretation model for rock mechanical parameters was developed for the carbonate formation in Well PT1 based on high-resolution acoustic logging and density logging data. Using well-log-constrained inversion, the depth-dependent distributions of dynamic Young’s modulus, dynamic Poisson’s ratio, uniaxial compressive strength, and in situ stresses were quantitatively characterized for the target interval. These parameters were then used to calculate the four-pressure profiles of the carbonate formation.
The four-pressure prediction method developed in this study was used to evaluate the safe mud-weight window of Well PT-101. The predicted window was then compared with field records of complex downhole events, including well kicks, pipe sticking, lost circulation, and leak-off tests, and was further calibrated based on these observations. Risk-controlled wellbore stability analysis provides a useful framework for refining safe mud-weight windows when formation heterogeneity and uncertainty are significant [
43]. The complex downhole event data for Well PT-101 are listed in
Table 4.
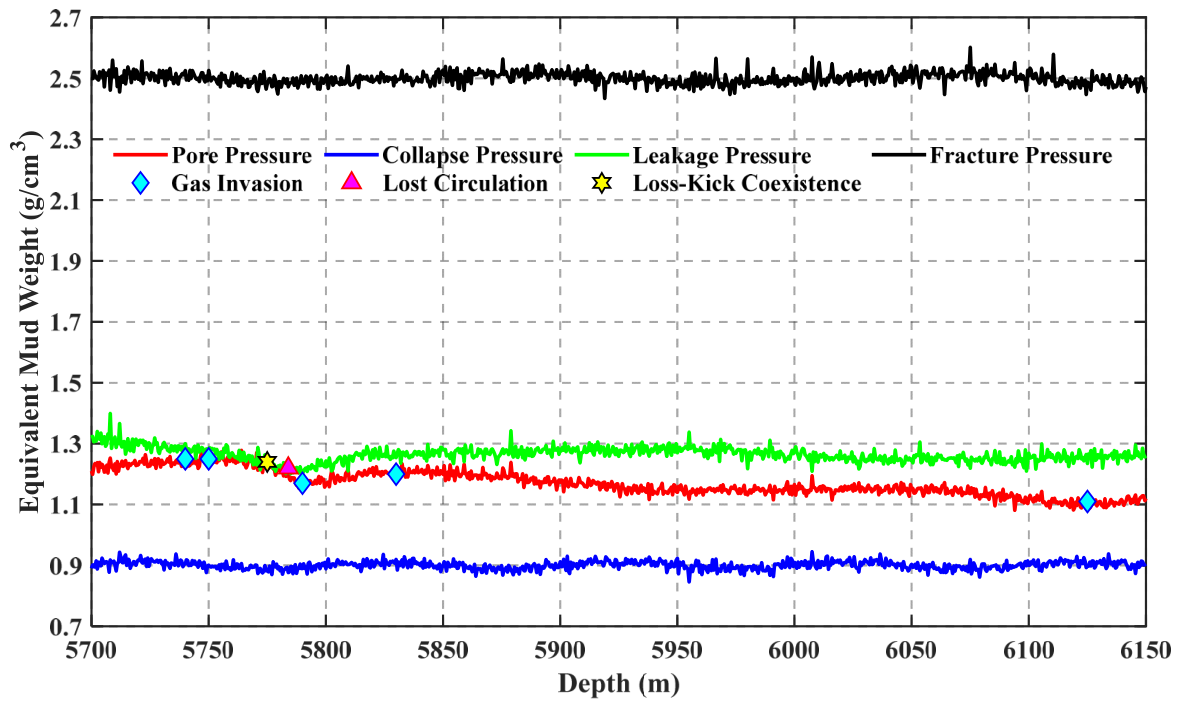
Analysis of the four-pressure profile for the deep carbonate formation in Well PT-101 (
Figure 7) indicates that the pore pressure equivalent mud weight ranges from 1.10 to 1.25 g/cm
3, and the collapse pressure remains relatively stable between 0.85 and 0.95 g/cm
3. The leakage pressure fluctuates between 1.22 and 1.35 g/cm
3, while the fracture pressure is exceptionally high, maintaining a range of 2.45 to 2.55 g/cm
3. Influenced by the strong heterogeneity of the carbonate rocks and the development of natural fractures and dissolution vugs, the leakage pressure exhibits a marked decrease in specific intervals. This creates an extremely narrow safe mud-weight window, particularly between 5740 m and 5800 m, where the window locally diminishes to near zero.
Field records from Well PT-101 closely align with these modeled profiles. Multiple gas invasion events occurred at depths of 5740, 5750, 5790, 5830, and 6125 m. Furthermore, a lost-circulation event was recorded at 5784 m under an equivalent mud weight of 1.22 g/cm3, and a severe loss-kick coexistence occurred at 5775 m at a mud weight of 1.24 g/cm3. The gas invasion points correspond precisely to local high-value zones of pore pressure. Conversely, the lost circulation and coexistence events are highly consistent with the localized dips in the leakage pressure curve, where the gap between pore and leakage pressures essentially closes. These results verify that the proposed modeling method accurately captures the complex downhole conditions of Well PT-101, providing a reliable theoretical basis for subsequent wellbore structure optimization and precise mud-weight design.
To demonstrate the necessity of the proposed multiscale discontinuity model, an ablation analysis was conducted. Using a conventional intact-rock Mohr–Coulomb model, the predicted leakage pressure (fracture initiation) for the 5740~5800 m interval was 2.10~2.20 g/cm3, and the collapse pressure was 0.85 g/cm3. This conventional approach suggests a wide and safe drilling window. However, field data showed severe lost circulation at 1.22 g/cm3. By incorporating the weak-plane slip mechanism and fracture reopening theory (where leakage pressure in fractured zones is governed by the minimum horizontal principal stress rather than matrix tensile strength), our proposed model accurately predicted the leakage pressure drop to 1.22~1.35 g/cm3. This comparison explicitly proves that ignoring multiscale discontinuities leads to a dangerous overestimation of the upper bound of the mud-weight window.
6. Conclusions
(1) Multiscale discontinuities are highly developed in deep carbonate rocks. FMI interpretation and core observations indicate that the formation is characterized by intersecting macroscopic fractures with widths of 1~5 mm and mesoscopic dissolution cavities with diameters of 3~10 mm. SEM observations further reveal dissolution grooves and loose crystal boundaries between mineral crystals. This multiscale fracture–cavity system provides the geological basis for shear slip of the wellbore wall and drilling fluid loss.
(2) The carbonate rocks show a pronounced confining-pressure strengthening effect and regional heterogeneity. Laboratory triaxial mechanical tests show that the uniaxial compressive strength of rocks in the target block ranges from 108.4 to 172.6 MPa, while the cohesion ranges from 27.10 to 36.60 MPa. Based on well-log data such as acoustic transit time, continuous profile inversion models were established for dynamic and static elastic parameters as well as strength parameters. The coefficients of determination (R2) of all regression models are greater than 0.89.
(3) The natural fracture–cavity system fundamentally alters the distribution characteristics of formation pressures. The four-pressure prediction model, established based on weak-plane slip and seepage mechanisms, indicates that although the theoretical leakage pressure of the intact rock matrix averages around 2.10~2.20 g/cm3, the actual leakage pressure drops significantly to 1.22~1.35 g/cm3 due to the opening of natural fractures and cavities. Consequently, the local safe mud-weight window narrows dramatically, diminishing to near zero in specific intervals (e.g., 5740~5800 m), despite the fracture pressure remaining exceptionally high at 2.45~2.55 g/cm3.
(4) The proposed four-pressure profile prediction model demonstrates high reliability in field applications. The prediction results for Well PT-101 show that the localized high-value zones of pore pressure and the localized dips in the leakage pressure curve accurately correspond to actual field events. These include multiple gas invasions at depths of 5740, 5750, 5790, 5830, and 6125 m, a lost-circulation event at 5784 m under an equivalent mud weight of 1.22 g/cm3, and a severe loss-kick coexistence at 5775 m under 1.24 g/cm3. For this type of complex formation, the plugging and anti-collapse properties of the drilling fluid must be prioritized in microfracture-rich zones, while bridging materials and managed pressure drilling (MPD) techniques should be proactively prepared and adopted in fracture–cavity-developed intervals to maintain wellbore stability.



 and
and