Article

Experimental Measurement and Artificial Neural Network Prediction of Dew Point Pressure for Ultra-Deep Condensate Gas

1
State Key Laboratory of Enhanced Oil and Gas Recovery, Beijing 100083, China
2
Research Institute of Petroleum Exploration & Development, PetroChina, Beijing 100083, China
3
Natural Gas Research Institute, Shaanxi Yanchang Petroleum (Group) Co., Ltd., Xi′an 710075, China
4
Institute of Porous Flow & Fluid Mechanics, Chinese Academy of Sciences, Langfang 065007, China
*
Author to whom correspondence should be addressed.
Processes 2026, 14(18), 2956; https://doi.org/10.3390/pr14182956
Submission received: 11 August 2026 / Revised: 14 September 2026 / Accepted: 15 September 2026 / Published: 17 September 2026
(This article belongs to the Section AI-Enabled Process Engineering)

Abstract

The development of oil and gas resources in global petroliferous basins has extended from shallow to deep reservoirs. Dew point pressure (Pd) is a vital parameter for fluid characterization and field development. Accurately and quickly obtaining Pd is crucial for the development of ultra-deep condensate gas reservoirs. The objective of this work is to predict the Pd of condensate gas by an artificial neural network (ANN) model. Ten ultra-deep condensate gas samples were analyzed using an experimental method and the Pd at reservoir temperature was obtained. A total of 113 datasets including 103 collected datasets and 10 measured datasets were adopted for ANN model training and testing. The results show that the average absolute percent relative error (AAPRE) of the developed ANN model between the measured and predicted values on the test set was 4.9589%. The predicted accuracy between the ANN model and widely used equations of state was compared. The results of statistical and graphical analysis show that the ANN model achieves the minimum prediction error. This ANN model can provide the necessary guidance for predicting the Pd for the development of different kinds of reservoirs.

1. Introduction

During the past several decades, technological breakthroughs have been witnessed across the globe in the development of deep and ultra-deep condensate gas reservoirs [1,2,3]. The proven recoverable reserves of oil and gas resources in deep (>4500 m) and ultra-deep (>6000 m) formations account for 40% and 49% of the total, respectively [4]. Condensate gas reservoirs have high economic value due to being oil–gas reservoirs and their lower refining cost [5,6,7]. The phase characteristics of condensate gas depend on pressure–volume–temperature (PVT) properties, and the dew point pressure (Pd) represents an important PVT property [8,9]. During the exploitation of condensate gas reservoirs, retrograde condensation occurs when the pressure declines below the Pd, and a gas–liquid miscible phase region forms [10,11,12]. This phenomenon can subsequently damage production facilities and transmission pipelines, leading a rapid decline in well productivity [13,14]. The accurate determination of Pd is essential for evaluating flow performance, simulating reservoir and well behavior, as well as designing production facilities and assessing reserves [15,16,17,18]. Therefore, accurately determined dew point pressure is a critical issue in development and management of condensate ultra-deep gas reservoirs.
In general, the main approaches to determining the dew point pressure of condensate gas are experimental methods and the thermodynamics equations of state (EOS) method. The determination of dew point pressure for high-pressure condensate gas through constant composition expansion (CCE) experiments has been widely reported in the literature [19,20,21,22,23]. Experimental measurement has the advantage of gaining precise and reliable results, but the costly sample transportation and time consumption often limit its application [24,25]. In the absence of experimental measurements, the EOS method is an option to estimate the Pd of condensate gas. During the EOS calculations, the temperature, components, C7+ molecular weight and other properties have impacts on the dew point pressure [26,27,28,29,30,31]. The prediction accuracy of the EOS method depends on determination of fluid characterization parameters, selected EOSs, and tuning procedures [32,33]. High-temperature and pressure conditions in ultra-deep reservoirs impose substantial challenges on conventional thermodynamic models, resulting in significant inaccuracies in dew point pressure predictions. With the continuous advancement of artificial intelligence, machine learning is widely applied to estimate the PVT properties under complex conditions [34,35,36,37,38,39,40]. As early as 1998, Elsharkawy and Foda [41] developed two general regression neural network (GRNN) models, which were applied to estimate dew point pressure and composition evolution in constant volume depletion (CVD) tests. Thereafter, González [42] improved the accuracy of dew point pressure prediction for retrograde gas reservoirs using a novel neural network model (NNM). Shokir [15] adopted genetic programming combined with an orthogonal least-squares algorithm (GP-OLS) to develop a dew point pressure prediction model for condensate gas. Based on 110 experimental data points, Nowroozi [43] developed a neural fuzzy system (NFS) to predict the dew point pressure. Over the past decade, a growing number of machine learning models were proposed to predict the dew point pressure of condensate gas, including: gene expression programming (GEP) [44,45], the radial basis function (RBF) network [46,47] genetic algorithms (GAs) [37], the adaptive neuro fuzzy inference system (ANFIS) [48], and the least square support vector machine (LSSVM) [49]. With the exploration and development of condensate gas resources advancing into ultra-deep formations, the temperature of most reservoirs has exceeded 180 °C, which poses a significant challenge to determining Pd by experimental method [50,51,52]. Therefore, it is highly significant to establish an efficient and accurate predictive model for dew point pressure in ultra-deep condensate gas reservoirs.
The main focus of this study is to develop a generally applicable artificial neural network (ANN) model to predict the Pd of ultra-deep condensate gas. A comprehensive and reliable ANN model was developed with multi-depth field datasets to predict the Pd. The correlation analysis was used to determine the input parameters of the ANN model. The measured Pd of ultra-deep condensate gas was employed to validate the applicability of the model. The model predictions are most reliable for ultra-deep condensate gas reservoirs with conditions comparable to those covered by the current data. In addition, the accuracy of the Pd predicted by the developed ANN model and three thermodynamic models was compared.

2. Experimental and Data Acquisition

2.1. Apparatus and Materials

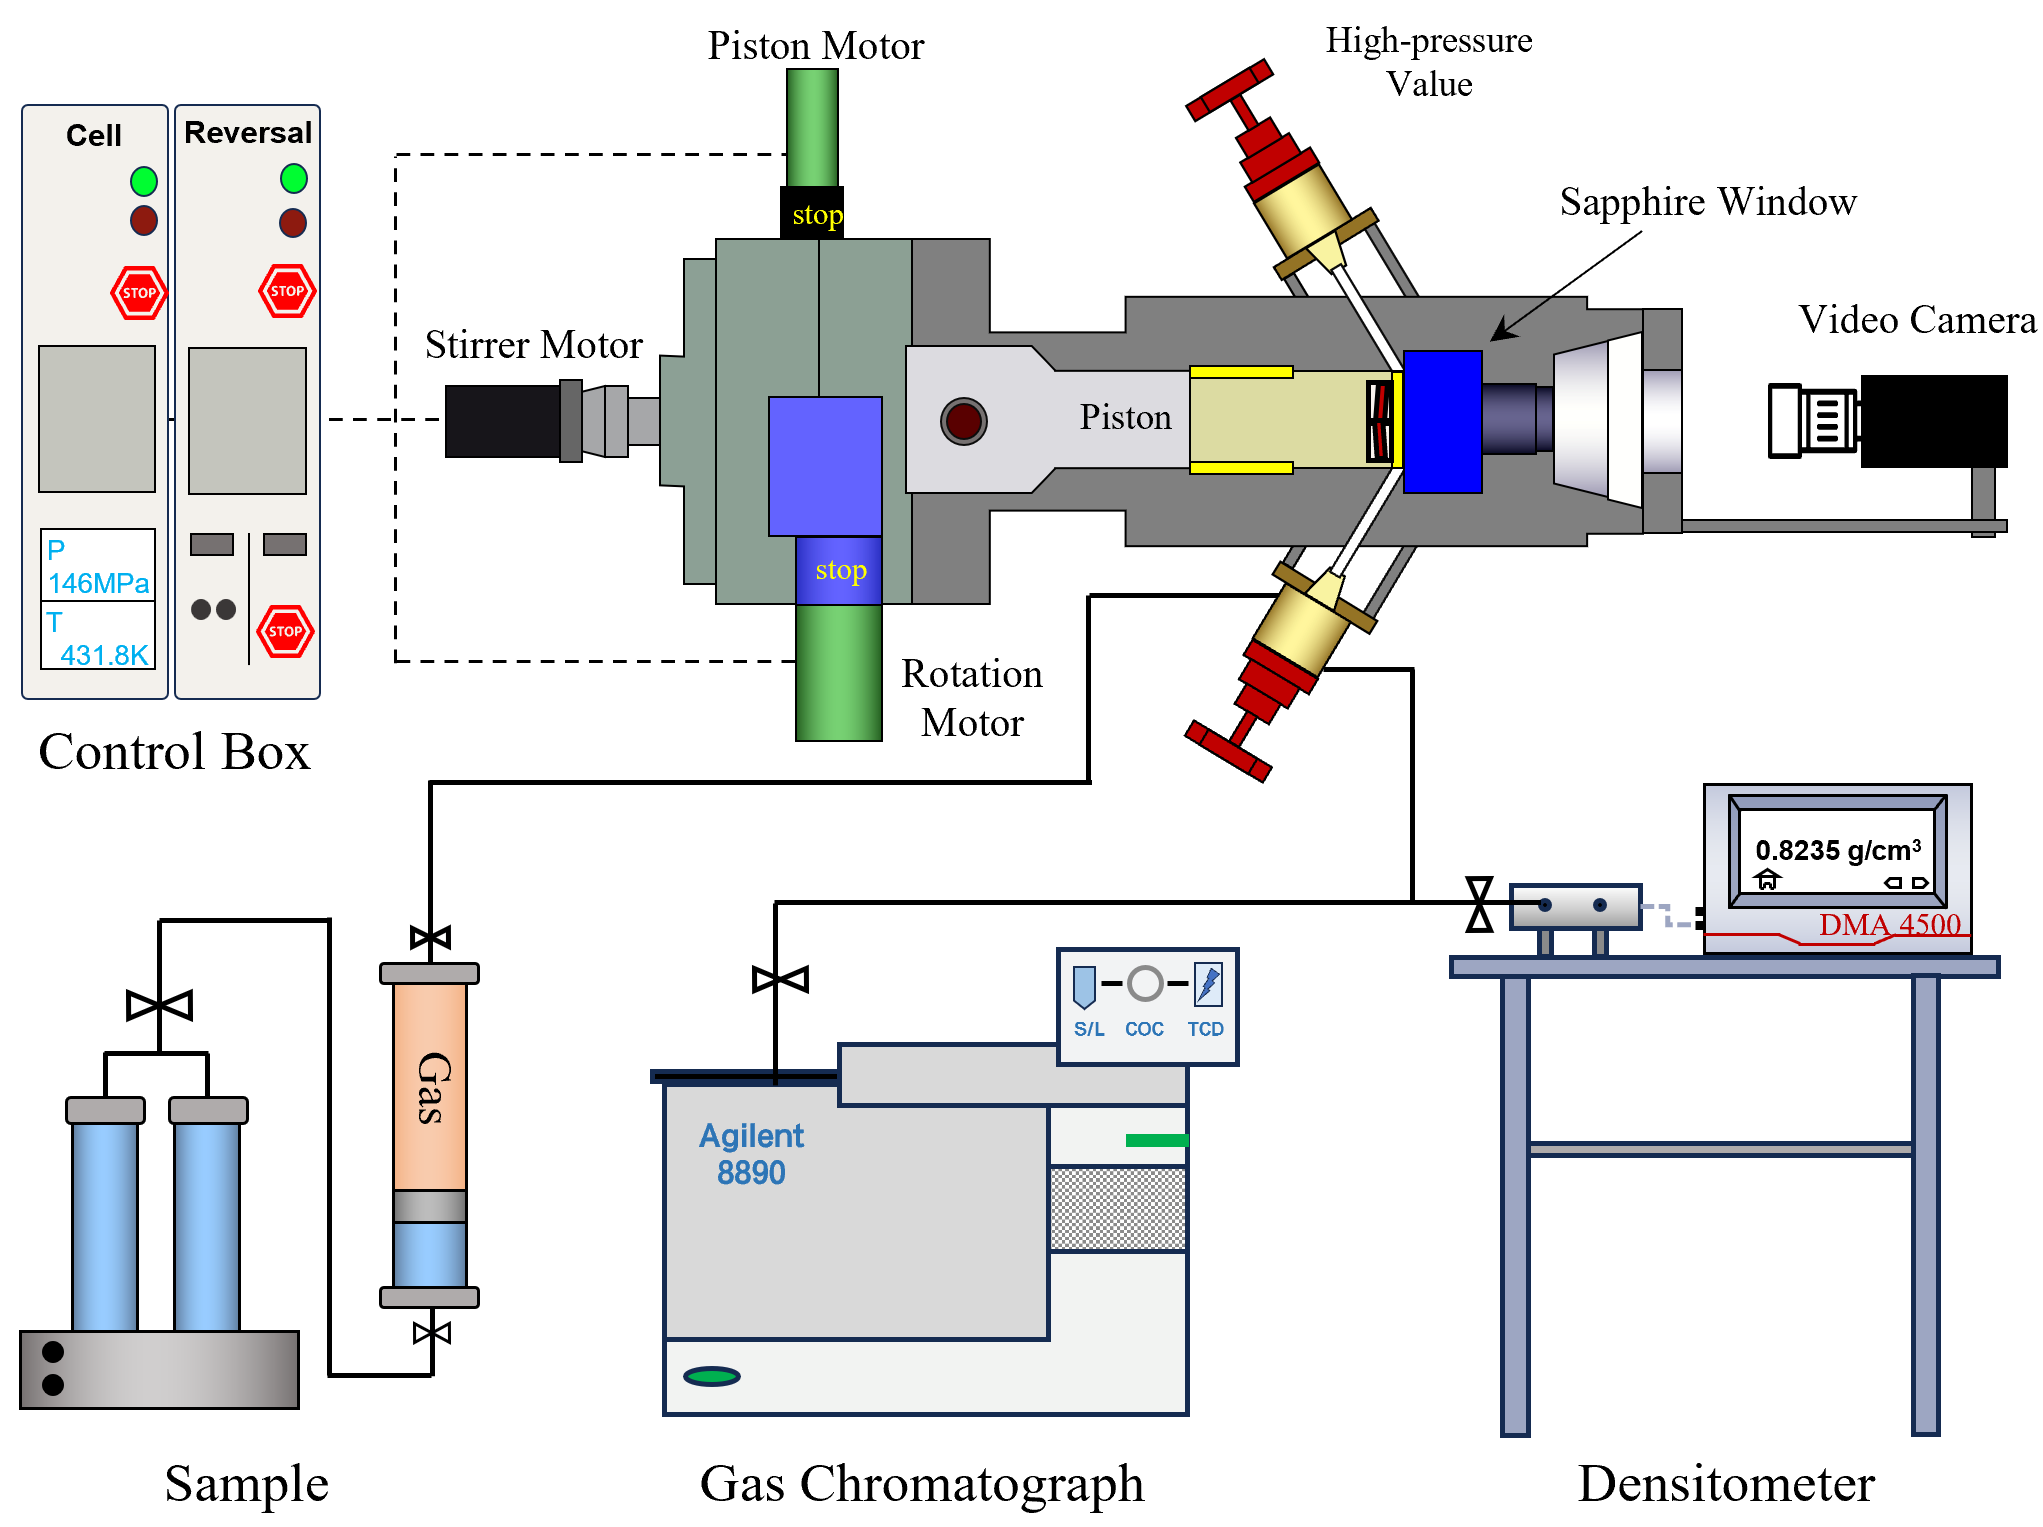
The high temperature and pressure PVT setup, with a maximum operating temperature of 200 °C and pressure of 150 MPa, was used to measure the Pd of ultra-deep condensate gas. The accuracies in temperature and pressure are 0.01 K and 0.01 MPa, respectively. The phase behavior of ultra-deep condensate gas was observed through the sapphire window installed at the front of the PVT cell. In addition, a high-quality imaging system was used to capture and record the process of Pd formation. A densitometer (Anton Paar GmbH, Graz, Austria) and gas chromatograph (GC, Agilent Technologies, Santa Clara, CA, USA) were used to analyze the density and sample components. The schematic diagram of the Pd measurement is depicted in Figure 1.
Ten condensate gas samples used in this work were collected from distinct ultra-deep gas fields in northwestern China. As shown in Table 1, the basic sample properties represent a wide range of reservoir conditions. The reservoir depths range from 5235 to 8455 m, the reservoir temperatures from 124.50 to 167.80 °C, and reservoir pressures from 48.83 to 146.07 MPa.

2.2. Experimental Procedure

The CCE test was employed to measure the Pd of ultra-deep condensate gas. The Pd was determined by detecting the change in light transmittance of the system using an infrared laser. Above the dew point, the fluid is single-phase and affected by gas density and volume; the transmittance increases linearly with decreasing pressure. At the dew point, mist-like droplets appear and the transmittance-change rate changes abruptly, and the pressure at this inflection is taken as the dew point pressure. Detailed descriptions of the experimental procedure have been reported in our previous studies [53,54].

Data Acquisition

One of the core factors that dictates the reliability of the neural network model is the reliability and comprehensiveness of the training dataset [24]. In order to establish the correlation between depth and dew point pressure, reservoir depth was selected as an input parameter. According to the report, fluid compositions, reservoir conditions and fluid properties were key factors determining the Pd values [55,56]. Therefore, the input parameter datasets used in this research include reservoir depth, temperature, pressure, fluid composition and density of condensate oil. The fluid composition was classified into non-hydrocarbon fractions (N2, CO2), volatile hydrocarbon fractions (C1–C4), intermediate hydrocarbon fractions (C5–C6) and heavy fractions (C7+). The only desired output parameter is the Pd value. A total of 103 sets of Pd data were collected from numerous gas fields in China which cover several reservoir types. In addition, 10 sets of Pd data were obtained from laboratory PVT test results. All 113 datasets of data were employed for the development of a neural network model in this study. Table 2 shows the ranges and corresponding statistical parameters of the dataset.

3. Methodology

3.1. Artificial Neural Network

As a typical machine learning algorithm, ANN mimics human brain information processing to explore the relationship between inputs and outputs [57,58]. The network structure consists of parallel layers containing multiple neurons, which can be categorized into input layer, hidden layers, and output layer. The input layer takes input from the datasets, in which each input value corresponds to one neuron in the input layer. The hidden layers with a certain number of neurons are normally optimized by a trial-and-error process, and activation function is employed to transfer the data flow throughout the layers. The output layer is responsible for outputting a value for the exact problem, and the number of neurons is equal to the desired outputs. All neurons between different layers are connected by simple weighted links, and the weights can be either positive or negative. The neurons in the output layer receive signals from the hidden layers and produce final outputs according to relevant weight coefficients. The ANN model is trained using known input–output data to tune the weights between the different layers until the optimization criteria is met.

3.2. Model Architecture

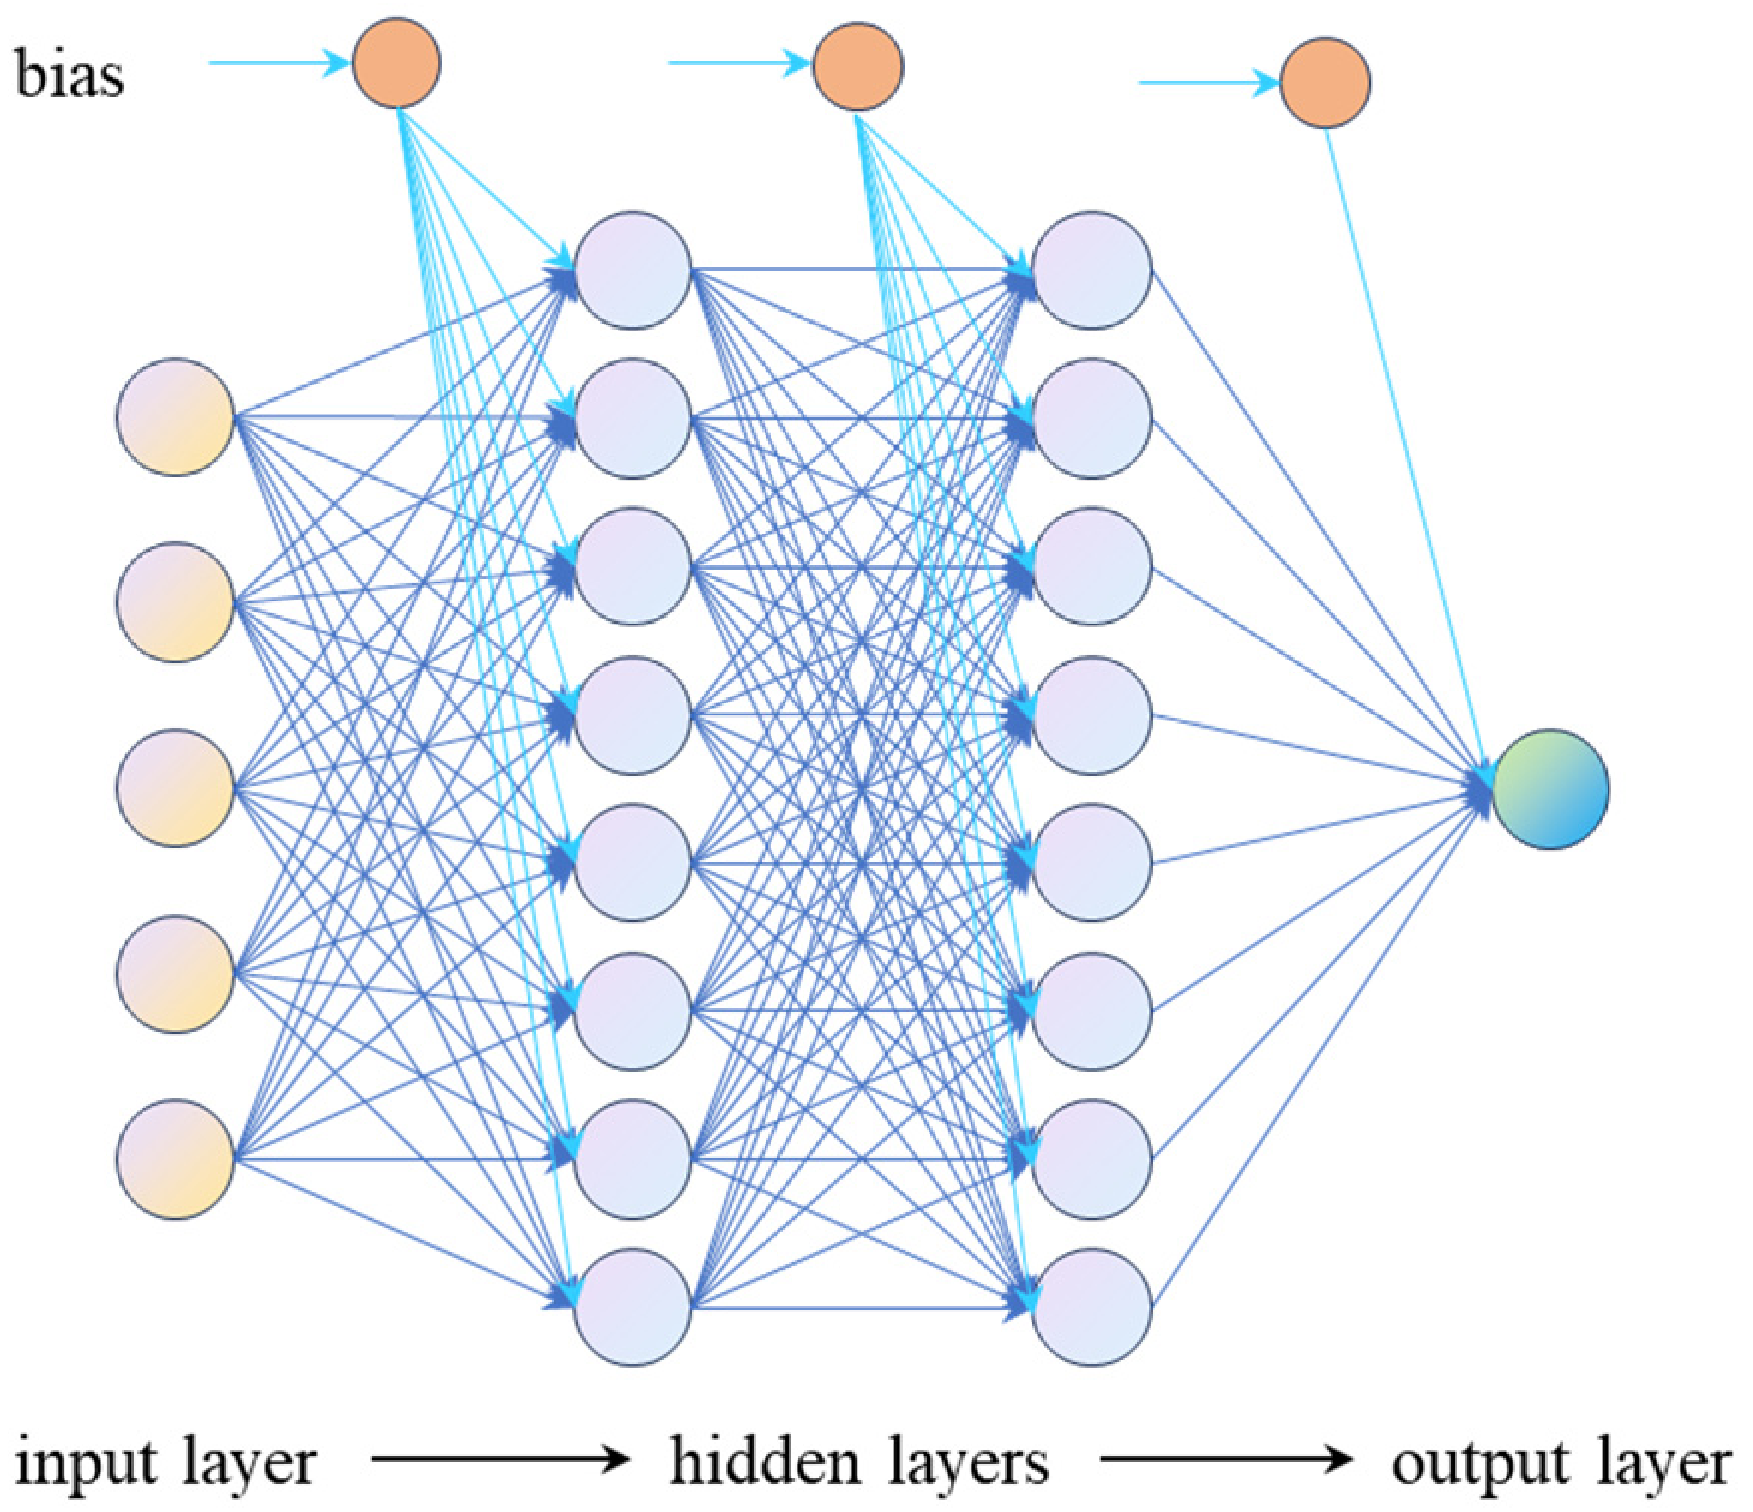
The accuracy of the model is directly dependent on the architecture of the neural network [59]. The model constructed in this study adopts a four-layer structure, including an input layer, two hidden layers and an output layer. According to the sensitivity of Pd to the input parameter, the input layer is configured with 5 input parameters, namely condensate oil density, volatile hydrocarbon fractions, reservoir temperature, reservoir depth and reservoir pressure. Each of the 2 hidden layers contains 8 neurons. The optimal numbers of hidden layers and of neurons within each hidden layer were determined through repeated iterations until the minimum mean squared error (MSE) was reached. The network was trained using the Conjugate Gradient Method. Training was terminated when the mean squared error (MSE) reached the target value of 1 × 10⁻¹⁰. The connection weights were initialized using the Nguyen–Widrow method. The sigmoid function was used as a transfer function. The sigmoid function is expressed by the following:
f   ( S )   = 1 1 + e S
where S is expressed as follows:
S = i = 0 n x i w i
where x ( x 0 , x 1 , x 2 , … x n ) refers to the input vector and w ( w 0 , w 1 , w 2 , … w n ) refers to the corresponding weight vector. The n refers to the dimension of the input parameter.
To reduce the uncertainty associated with random weight initialization, the training procedure was repeated 10 times with different initial weights, and the network achieving the lowest validation MSE was selected as the final model. The output layer uses a linear function as the activation function for the estimation of the dew point pressure. The detailed parameters and general structure of the ANN model are shown in Table 3 and Figure 2, respectively.

3.3. Data Splitting

The total 113 sets of data (measured and collected) were split into three classes. The first class, with 92 sets of data (80%), was allocated to the training phase for constructing and training the neural network model. The second class contained 11 sets of data for validating model reliability and accuracy. Meanwhile, 10 sets of experimental data were utilized to evaluate model performance. Before training, all input and output variables were normalized to the range [−1, 1] by Equation (3), using the statistics of the training set only; the same scaling factors were then applied to the validation and test sets to avoid data leakage.
X = 2 X i X min X max X min 1

4. Results and Discussion

4.1. Experimental Results

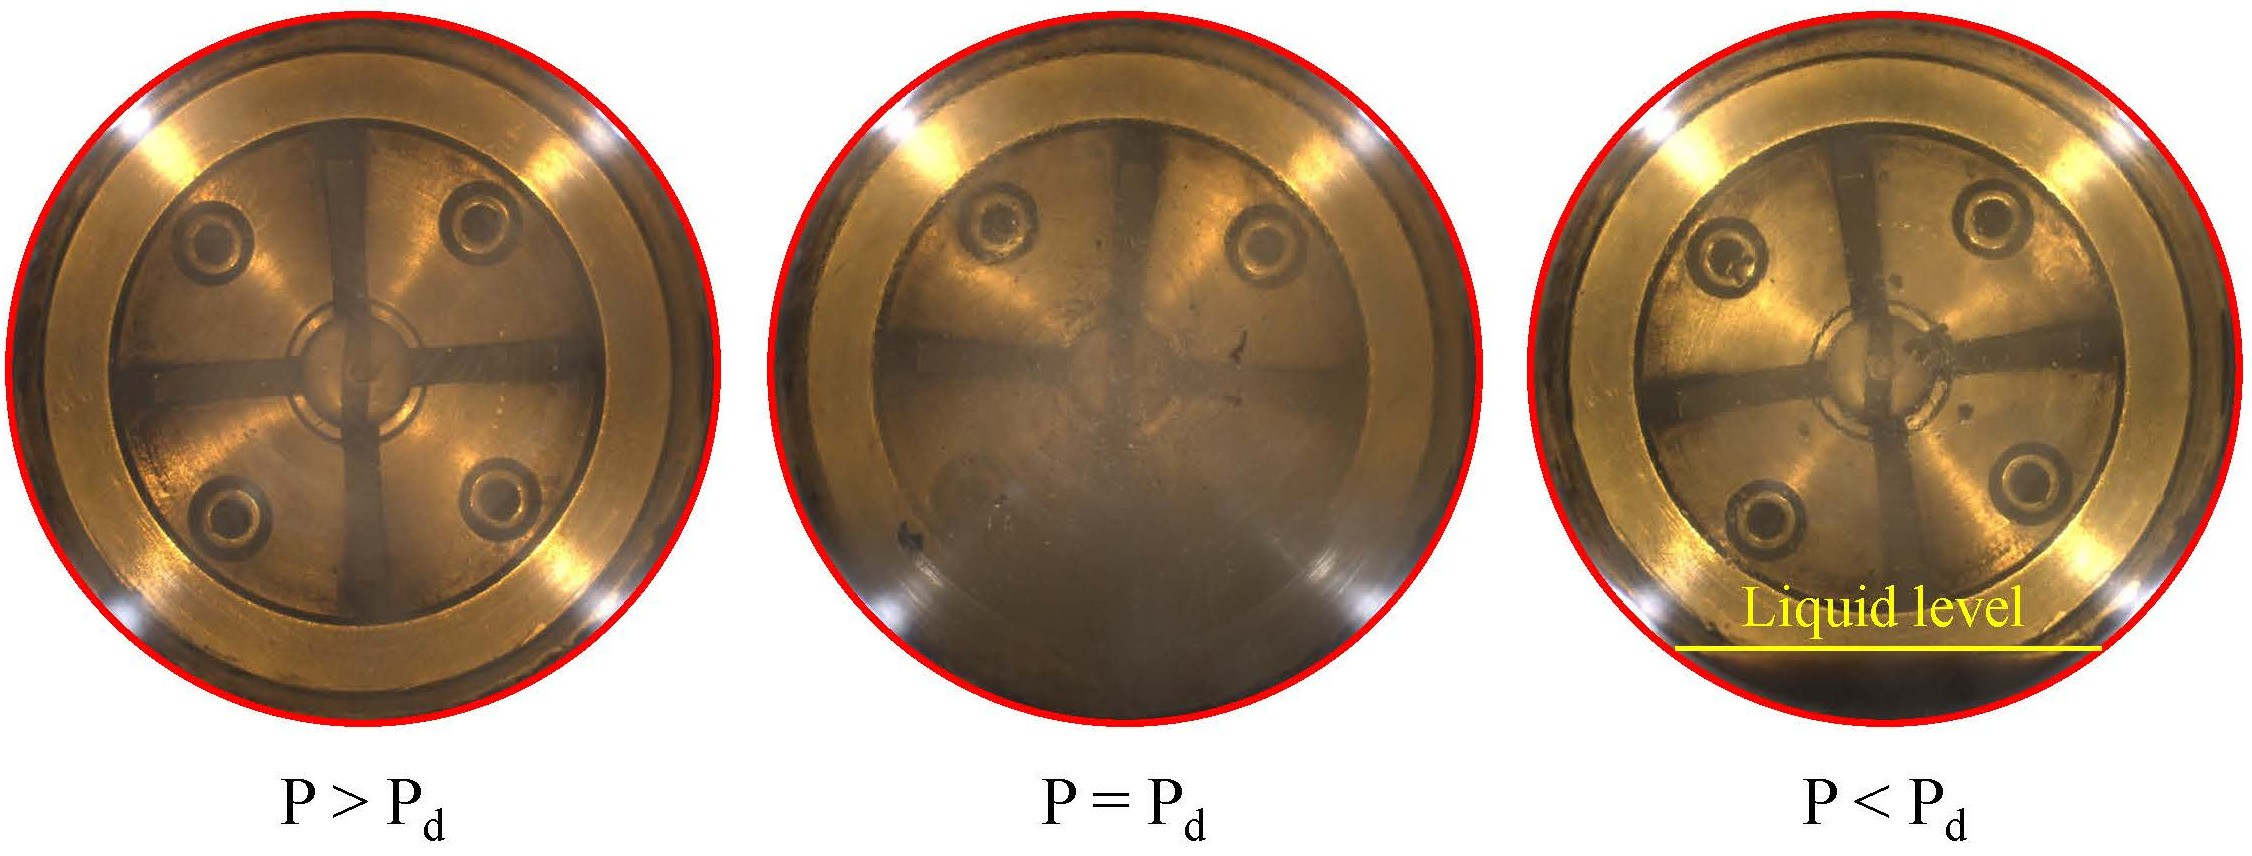
The experiment started at the reservoir pressure (higher than Pd), at which the system exhibited a single gas phase. The variation in fluid-phase behavior in the PVT cell is shown in Figure 3. When the pressure reduced to the Pd, the light transmittance of the fluid declined with the appearance of tiny liquid droplets, and the PVT cell became darkened. With a further decrease in pressure, these droplets gradually condensed and settled at the bottom, forming a clear gas-retrograde liquid interface.
The Pd experimental measurement results of the ultra-deep condensate gas sample are listed in Table 4. The Pd ranges from 38.20 to 53.76 MPa at reservoir temperature. Combined with the fluid components, it was found that Pd exhibits a nonlinear decreasing trend with an increase in the C7+ content. This is because increasing C7+ content raises the average molecular weight and critical temperature of the mixture, while strengthening the intermolecular attraction, making the gas more prone to condensation at a given temperature; thus, the dew point pressure decreases accordingly.

4.2. Variable Impact Analysis

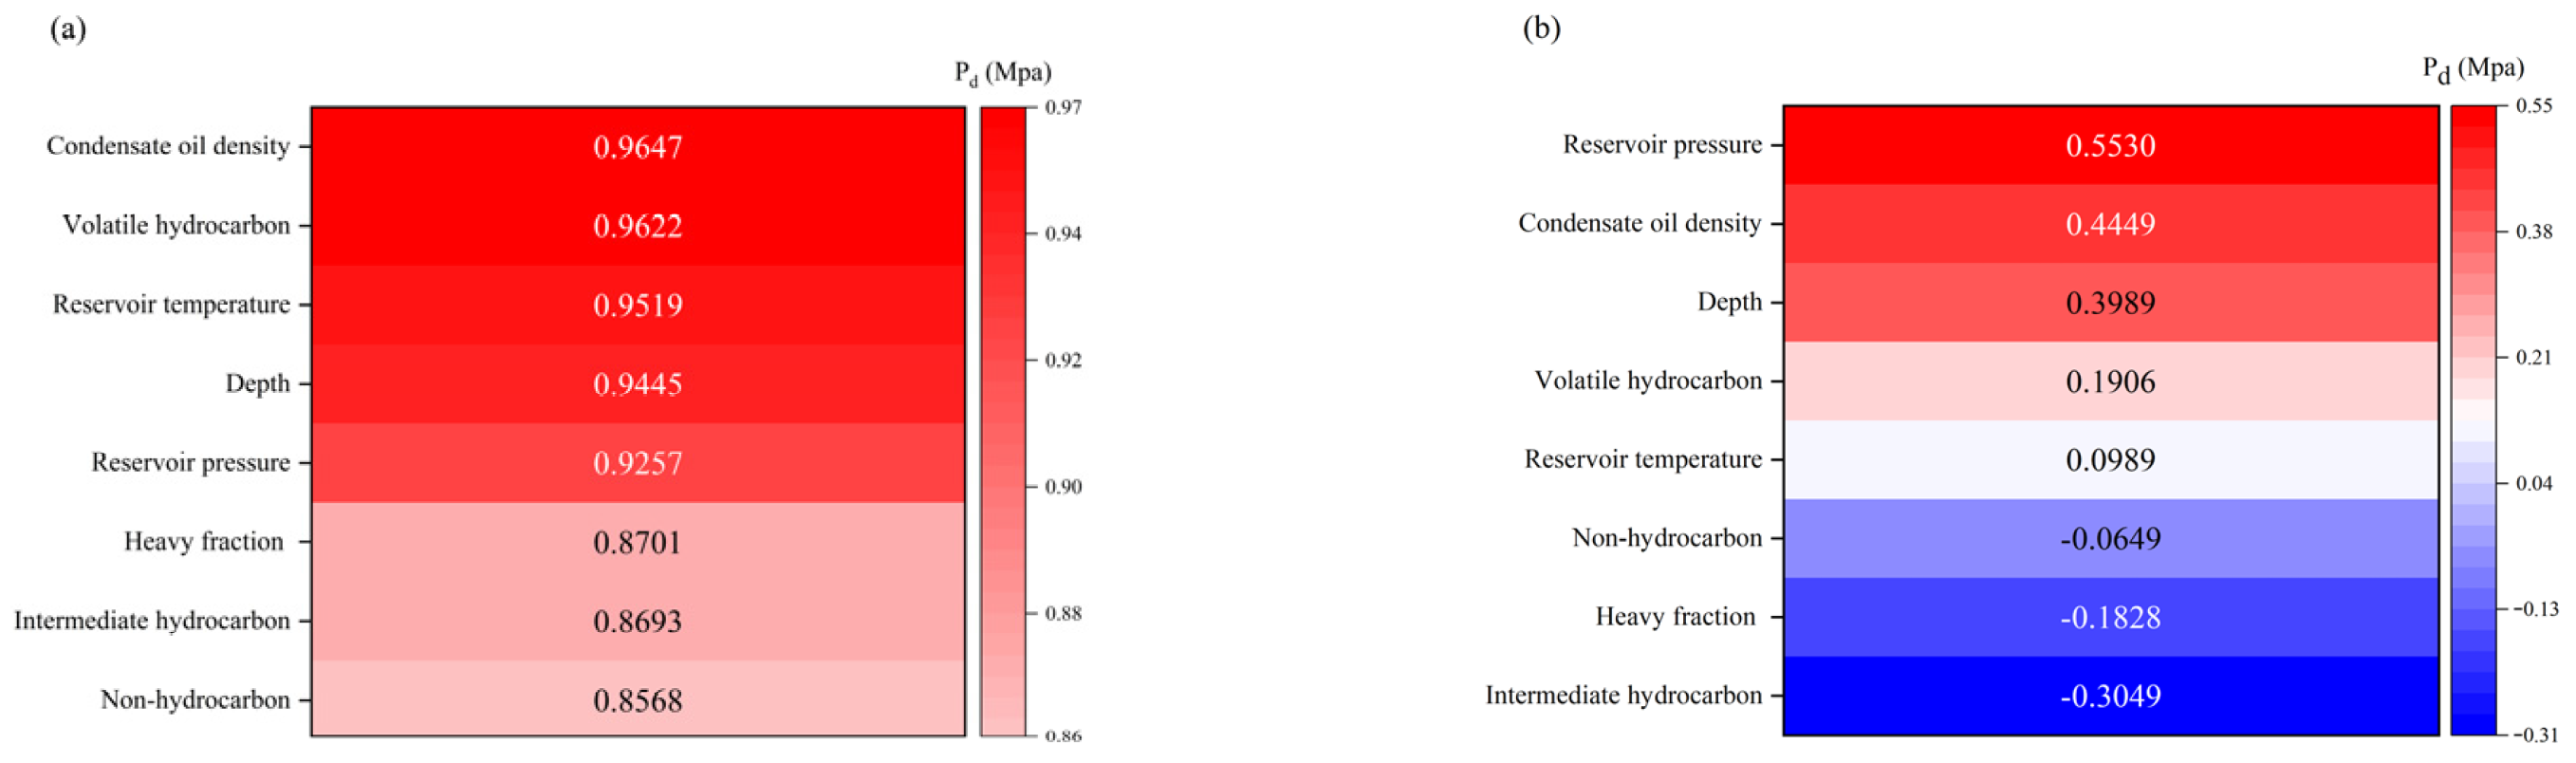
Determining the sensitivity of the target parameter to each input parameter is crucial for improving model prediction accuracy. In this study, the influence of all dataset parameters on the dew point pressure was analyzed using grey relational analysis and the Pearson correlation coefficient. The grey relational degree ranges from 0 to 1, with values closer to 1 indicating a stronger correlation between the input variables and the target variable. The Pearson correlation coefficient ranges from −1 to +1, with values closer to 1 indicating a perfect positive correlation between input and target variables, and values closer to −1 indicating a negative correlation. The analysis results of grey relational analysis and the Pearson correlation coefficient are shown in Figure 4a,b. As shown in Figure 4b, condensate oil density, volatile hydrocarbon fractions, reservoir temperature, reservoir depth and reservoir pressure exhibit a positive correlation with Pd, while Figure 4a indicates that these parameters have a stronger correlation with Pd. Based on the combined results of the sensitivity analysis, these five parameters are the most significant factors influencing the dew point pressure, and are finally selected as input parameters for the ANN model.

4.3. Evaluated Parameters of the Models

The ANN model in this study was evaluated with different statistical quality measures. The statistical quality measures include average absolute percent relative error (AAPRE), average percent relative error (APRE), root mean square error (RMSE), standard deviation (SD) [8] and correlation coefficient (R2). The functions of these measures are shown in Equations (4)–(8).
AAPRE = 1 n i = 1 n E x p . C a l . E x p . × 100
APRE = 1 n i = 1 n E x p . C a l . E x p . × 100
RMSE = 1 n i = 1 n E x p . C a l . 2
SD = 1 n 1 i = 1 n E x p . C a l . E x p . 2
R 2 = 1 i = 1 n E x p . C a l . 2 i = 1 n E x p . E x p ¯ . 2

4.4. Performance Evaluation of the Model

The statistical error evaluation for the ANN model in this study is provided in Table 5. Table 5 shows the prediction deviations of the ANN model for the training set, validation set, test set and the entire dataset, respectively.
The APRE represents the direction and degree of the relative deviation between predicted and experimental data. As shown in Table 5, the APRE values for the training, validation and test sets were −1.2643%, −3.0097% and 0.1872%, respectively. The APRE represents the average direction and magnitude of the relative percentage deviation between predicted and target data. The AAPRE indicates the average absolute relative percentage error between predicted and experimental data, where a lower AAPRE value signifies more reliable prediction results. As shown in Table 5, the AAPRE values for the training, validation and test sets were 8.9877%, 4.6519% and 4.9589%, respectively. The results clearly demonstrate the capability of the utilized ANN model in predicting the Pd of condensate gas samples.
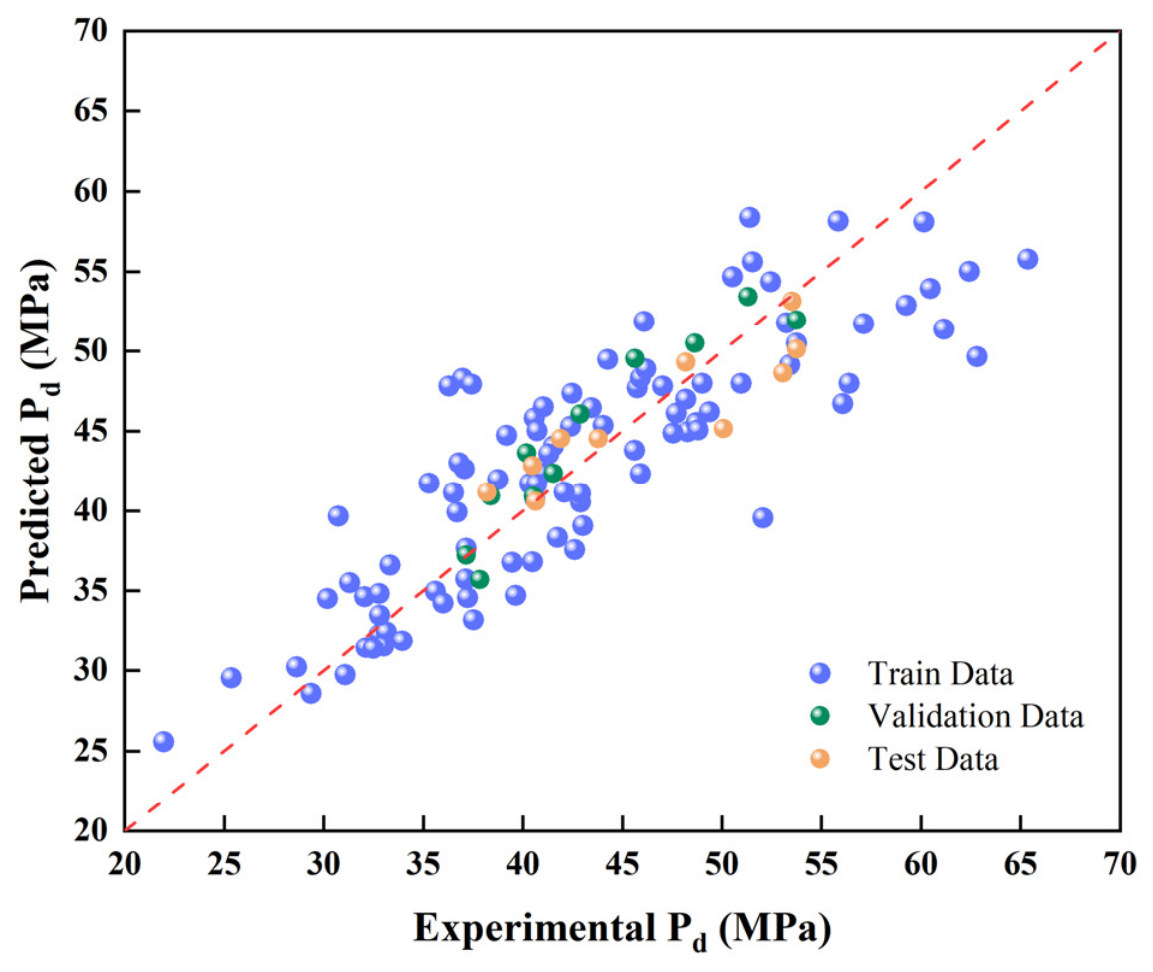
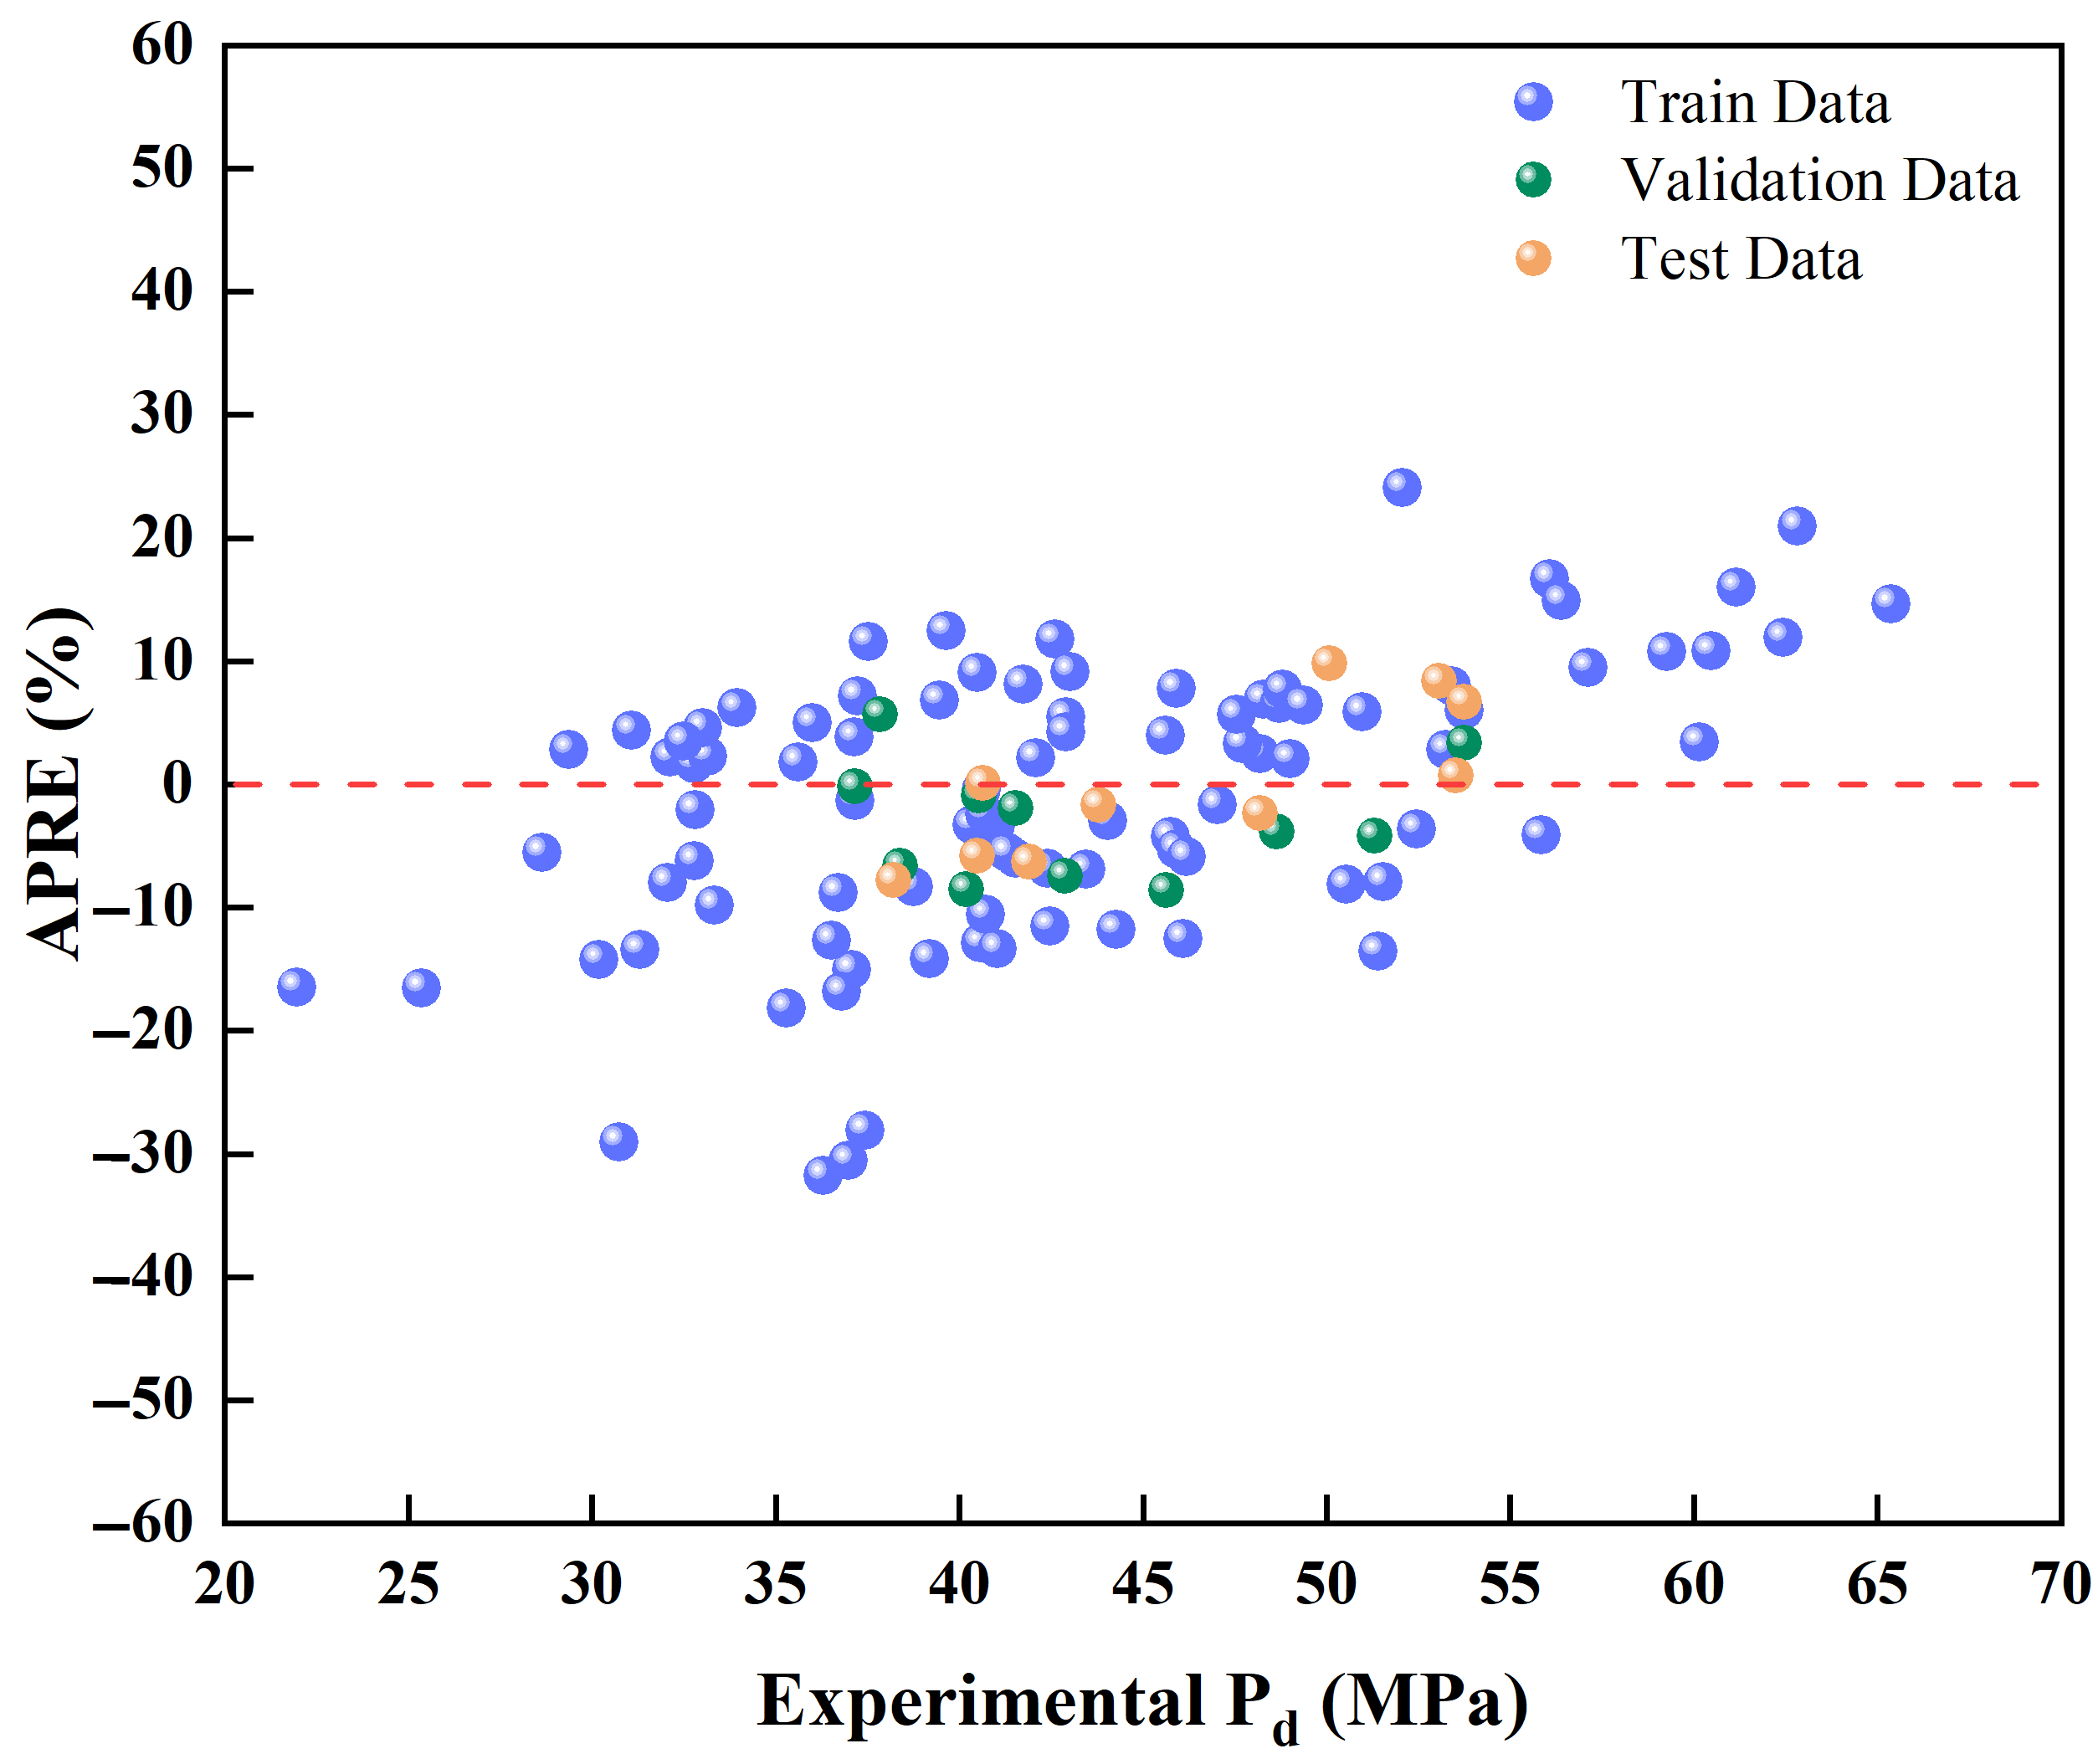
The cross plot of ANN model predictions versus the corresponding experimental values is shown in Figure 5. Almost all of the predicted data are located on the diagonal line, indicating that the ANN model had better accuracy and robustness. Moreover, the APRE of the ANN model is presented in Figure 6. As can be seen from Figure 6, the ANN model shows more data points distributed closely around the zero line, which confirms the accuracy of this model.

4.5. Comparison of ANN Model and Equations of State

In order to further examine the accuracy and stability of the ANN model in this study, the Pd of ten experimental data points (test sets) was calculated using EOS models. Three typical EOS models are adopted for comparative analysis, including the Peng–Robinson (PR) equation [60], Soave–Redich–Kwong (SRK) equation [61], and Perturbed-Chain Statistical Associating Fluid Theory (PC-SAFT) equation [62]. The EOS calculations were performed using the fluid composition and reservoir temperatures. In the EOS calculations, fluid components were used to calculate the critical properties. Binary interaction parameters kij for k C H 4 j , k C O 2 j , and k N 2 j were determined from critical volumes, while kij = 0 was assigned for hydrocarbon–hydrocarbon components. The C7+ fraction was split into single-carbon-number groups using Ahmed’s exponential decay function with Pedersen constraints, and then regrouped into 12 pseudo-components whose critical properties were obtained from the Kesler–Lee correlation. The dew point pressures were determined by solving the vapor–liquid fugacity equality at the reservoir temperature.
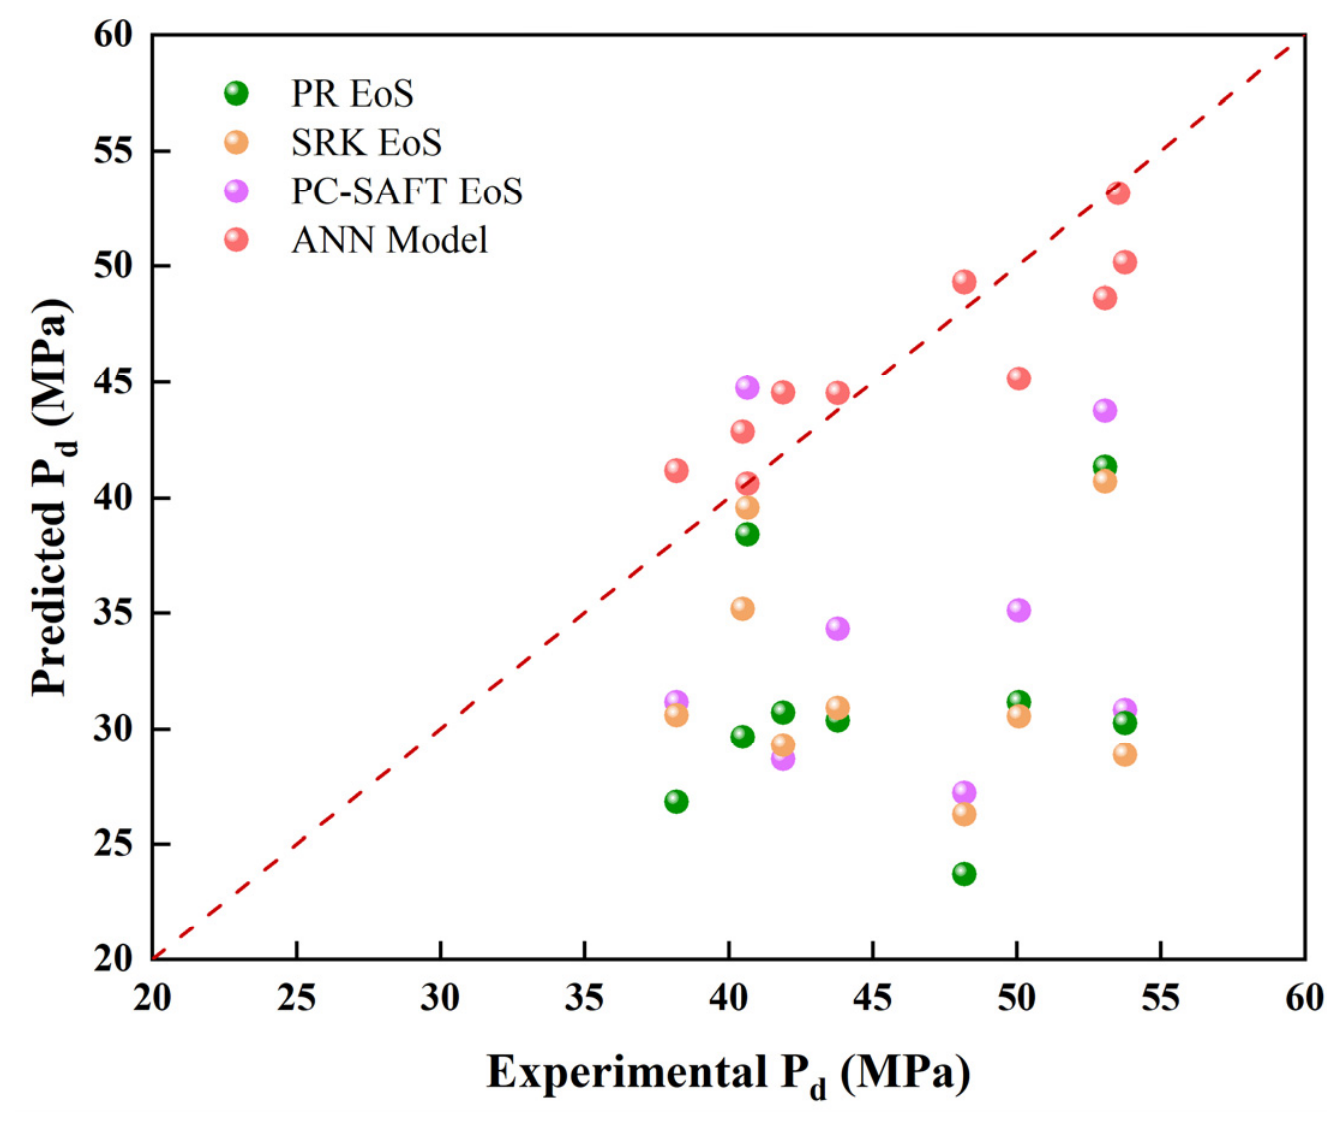
The detailed statistical results of different EOS models are reported in Table 6. Compared with the prediction accuracy of the ANN model, the EOS models exhibit lower accuracy in predicting the Pd of ultra-deep condensate gas. The AAPRE values for PR, SRK and PC-SAFT were 31.7248%, 28.1352% and 29.9300%, respectively, all of which are much higher than the 4.9589% of the ANN model. This indicates that the ANN model has superior performance in predicting Pd values.
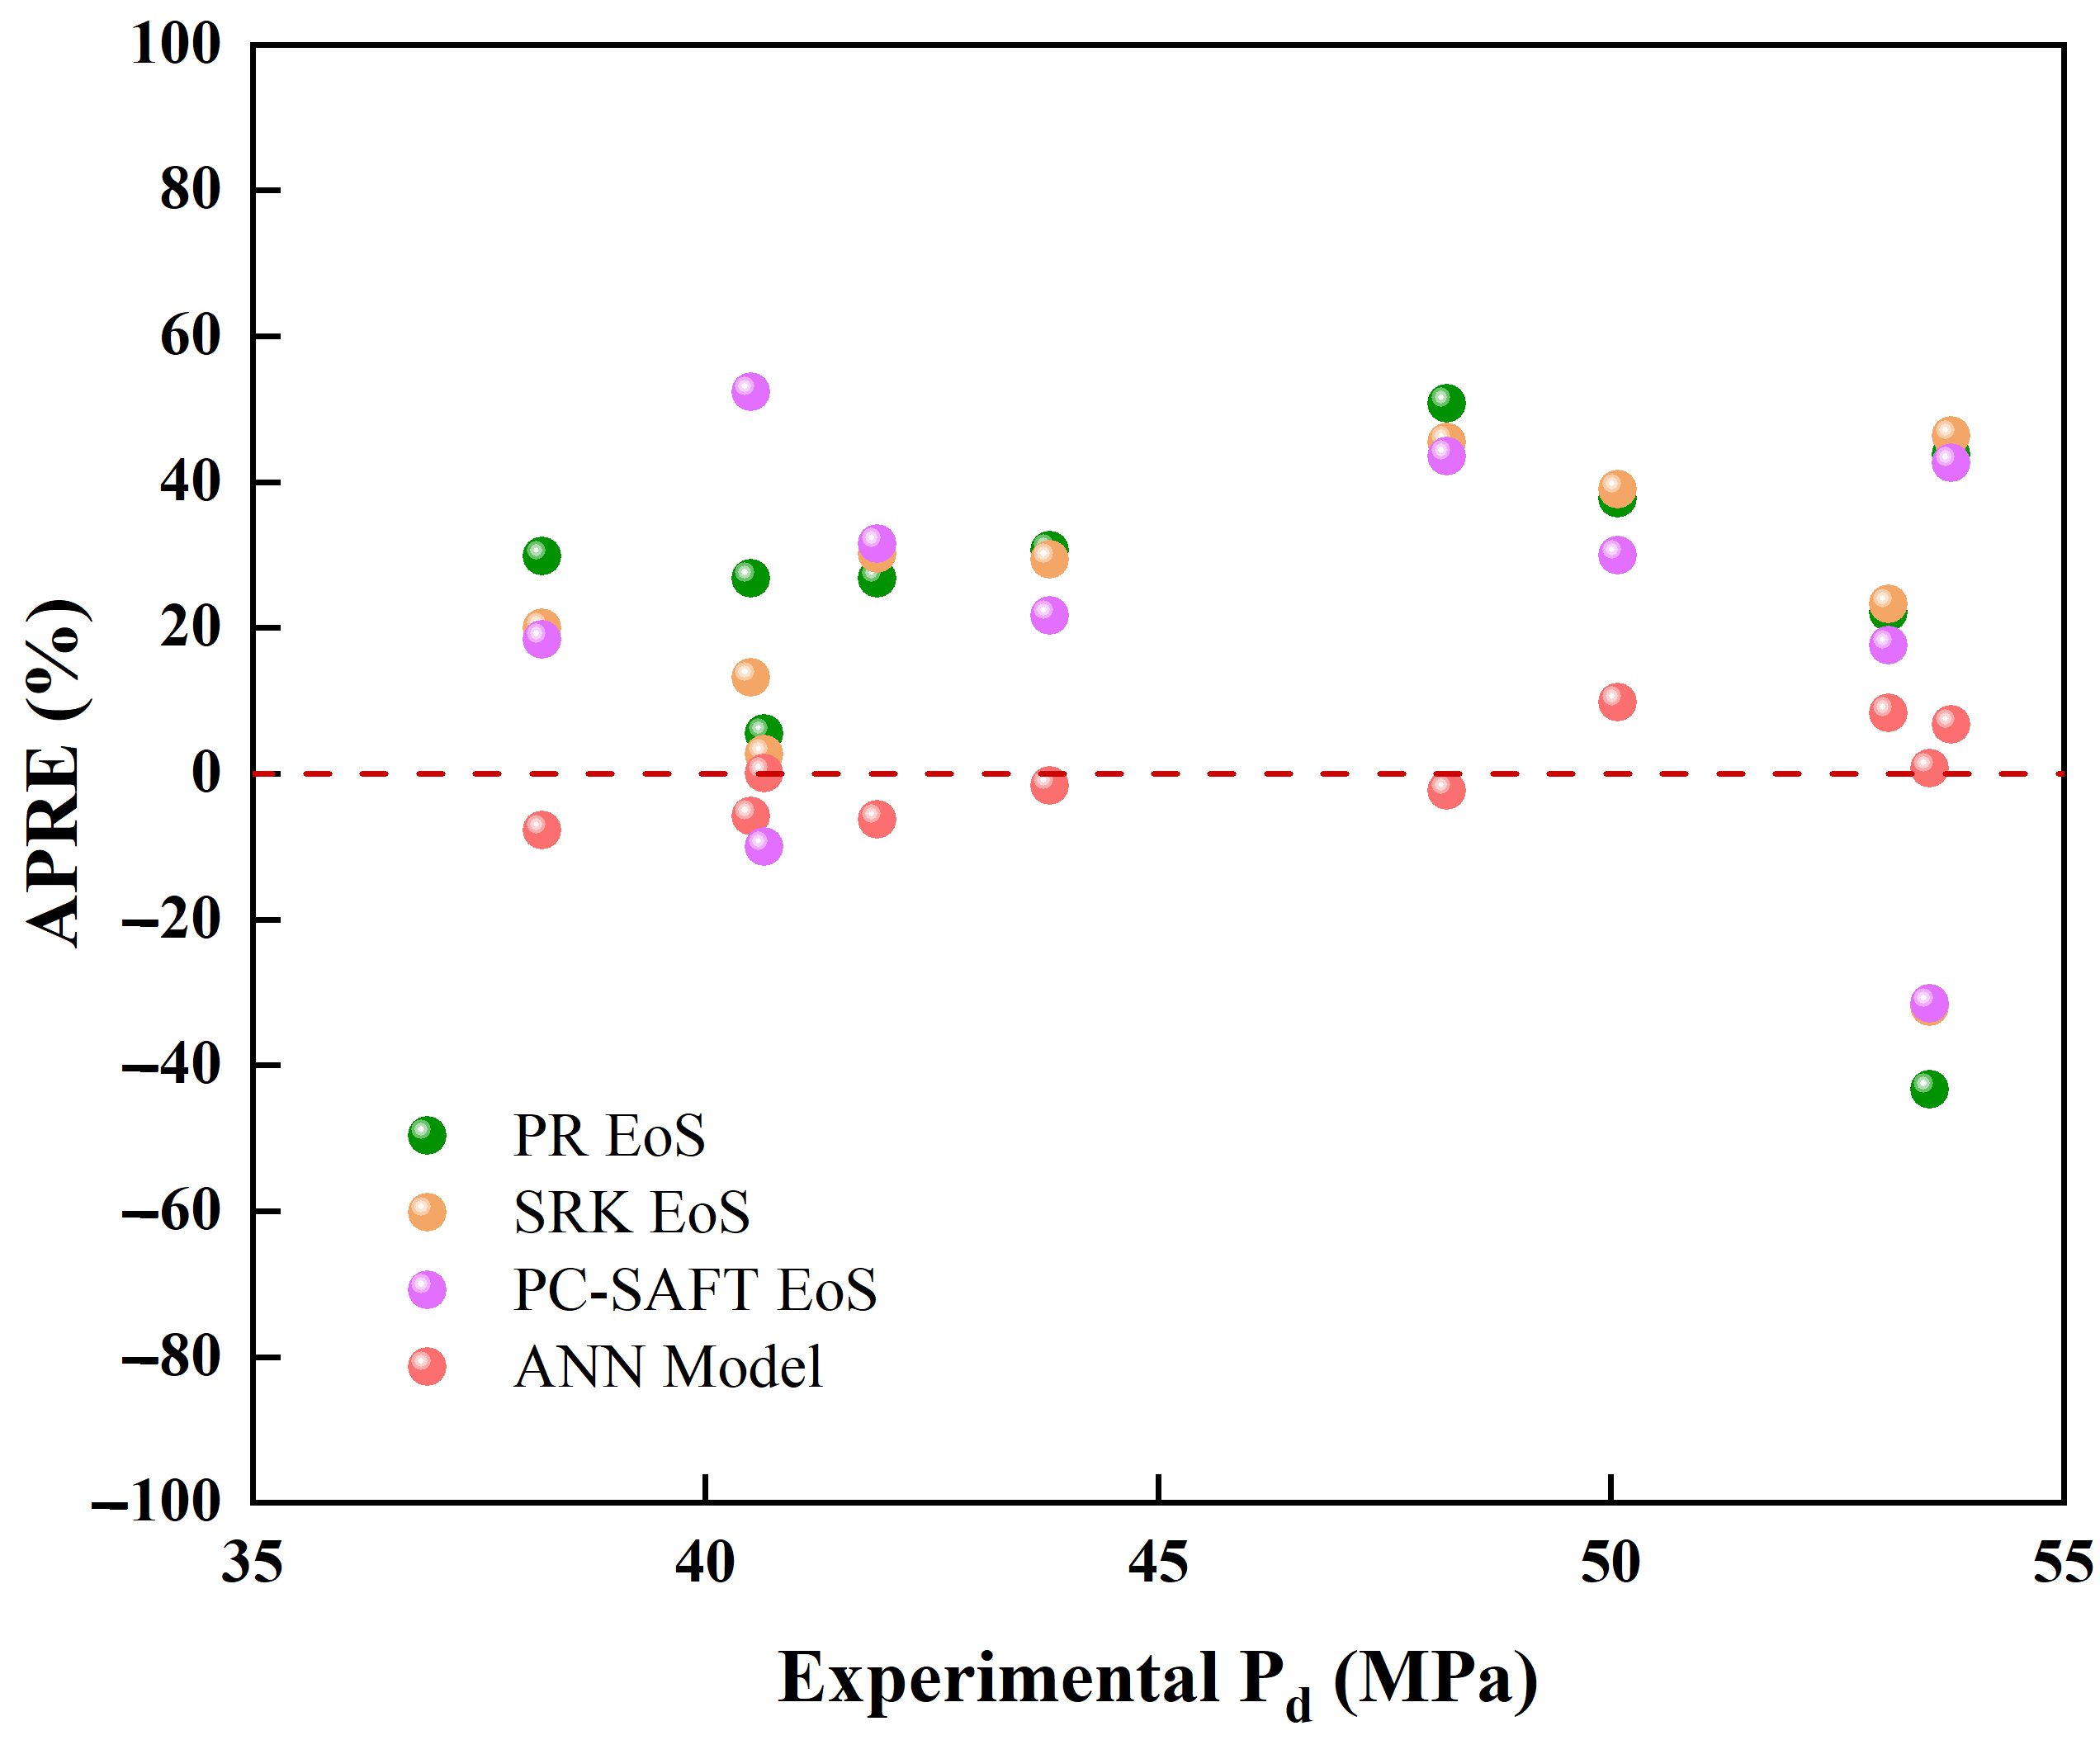
The obtained cross plots for the ANN model and different EOSs are illustrated in Figure 7. According to Figure 7, the ANN model showed a more compact distribution of points around the X = Y line, confirming the higher precision of this method in comparison with EOS models. In addition, the APRE distribution (Figure 8) shows that points predicted by the ANN model are positioned in a small area (error less than 10%) around the zero line. Figure 7 and Figure 8 also confirm the higher predictive accuracy of the ANN model over other EOS models.
Under ultra-deep reservoir conditions (high temperature and pressure), the non-ideal nature of the gas phase is enhanced. The prediction of Pd by EOS relies on binary interaction parameters fitted to experimental data obtained at low temperatures and low pressures, which consequently leads to deviations in the predicted Pd. In contrast, the proposed ANN model directly captures the complex nonlinear relationships from experimental data, mapping five input parameters to the Pd through a multilayer architecture. Therefore, the ANN model achieves higher accuracy in predicting the Pd of ultra-deep condensate gas.

5. Conclusions

In this study, the measurement and prediction of dew point pressure for ultra-deep condensate gas were investigated. Experimental dew point data for ten ultra-deep condensate gas samples, at a depth range from 5235 to 8455 m, were measured using a high-temperature and pressure PVT setup. These experimental data along with 103 sets of data collected from ultra-deep gas fields were used to train and test the ANN model. Results of variable impact analysis showed that condensate oil density, volatile hydrocarbon fractions, reservoir temperature, reservoir depth and reservoir pressure were the most significant parameters governing the dew point pressure, these parameters were consequently adopted as input variables for the ANN model. The results of statistical and graphical analyses showed that the AAPRE of the developed ANN model between the measured and predicted values was 4.9589%. The AAPRE values for PR, SRK and PC-SAFT EOS models were 31.7248%, 28.1352% and 29.9300%, respectively. Compared with PR, SRK and PC-SAFT EOS models, the accuracies of the developed ANN model were verified. The ANN model developed in this article successfully predicts dew point pressure with high accuracy and is computationally convenient, which provides guidance for engineering calculations of dew point pressure in ultra-deep condensate gas reservoirs. It should be noted that the proposed ANN model was developed and validated within the range of the current dataset, and caution should be exercised when extrapolating predictions beyond this data range.

Author Contributions

Y.Z.: contributed to Methodology, Data curation, Validation, Writing—review and editing; A.L.: contributed to Methodology, Writing—original draft; K.Z.: contributed to Funding acquisition, Supervision, Writing—review and editing; Y.C.: contributed to Writing—review and editing; J.G.: contributed to Investigation; Z.S.: contributed to Investigation. All authors have read and agreed to the published version of the manuscript.

Funding

This work was supported by Technology Research Project of PetroChina Company Limited, Research on Multi-component Gas Flooding Technology for Enhanced Oil Recovery (No. 2023ZZ0410), National Major Science and Technology Project “Researchon CO2 Flooding Significantly Enhancing Oil Recovery and Long Term Storage Technology, Researchon Comprehensive Regulation Technology for CO2 Miscibility Enhancement and Conversion” (No. 2024ZD1406601), Research on the Oil Displacement Mechanism of Coupled Regulation of Fluid Phase Behaviorand Mobility by Multi-component Gas (No. 2024DQ03049), and “Oil-Molecule SievingMechanism and Applicability Evaluation of Multicomponent Gas Flooding” (No. 25KTKFSC262).

Data Availability Statement

All data supporting the findings are available from the corresponding author upon reasonable request.

Conflicts of Interest

Authors Yu Zhang, Yaoze Cheng and Jiahao Gao were employed by the company State Key Laboratory of Enhanced Oil and Gas Recovery and Research Institute of Petroleum Exploration & Development, PetroChina. Author Ao Li was employed by the company Natural Gas Research Institute, Shaanxi Yanchang Petroleum (Group) Co., Ltd. Authors Ke Zhang and Zhenlong Song were employed by the company State Key Laboratory of Enhanced Oil and Gas Recovery, Research Institute of Petroleum Exploration & Development, PetroChina and Institute of Porous Flow & Fluid Mechanics, Chinese Academy of Sciences. The remaining authors declare that the research was conducted in the absence of any commercial or financial relationships that could be construed as a potential conflict of interest. The authors declare that this study received funding from Technology Research Project of PetroChina Company Limited. The funder was not involved in the study design, collection, analysis, interpretation of data, the writing of this article or the decision to submit it for publication.

References

  1. Li, J.; Tao, X.; Bai, B.; Huang, S.; Jiang, Q.; Zhao, Z.; Chen, Y.; Ma, D.; Zhang, L.; Li, N.; et al. Geological conditions, reservoir evolution and favorable exploration directions of marine ultra-deep oil and gas in China. Pet. Explor. Dev. 2021, 48, 60–79. [Google Scholar] [CrossRef] [Scilit]
  2. Xu, K.; Yang, H.; Zhang, H.; Ju, W.; Li, C.; Fang, L.; Wang, Z.; Wang, H.; Yuan, F.; Zhao, B.; et al. Fracture effectiveness evaluation in ultra-deep reservoirs based on geomechanical method, Kuqa depression, Tarim Basin, NW China. J. Pet. Sci. Eng. 2022, 215, 110604. [Google Scholar] [CrossRef] [Scilit]
  3. Zeng, L.; Song, Y.; Liu, G.; Tan, X.; Xu, X.; Yao, Y.; Mao, Z. Natural fractures in ultra-deep reservoirs of China: A review. J. Struct. Geol. 2023, 175, 104954. [Google Scholar] [CrossRef] [Scilit]
  4. Yang, H.; Wang, C.; Yang, X.; Zhang, Z.; Guo, X.; Sun, C.; Lyu, X.; Liu, J. Technological progress and scientific significance of the drilling of the ten-thousand-meter ultra-deep well TK1, Tarim Basin, NW China. Pet. Explor. Dev. 2025, 52, 1329–1339. [Google Scholar] [CrossRef] [Scilit]
  5. Liu, Q.; Wang, R.; Zhang, Y.; Sun, C.; Yang, M.; Su, Y.; Wang, W.; Shi, Y.; Chen, Z. Phase transitions and seepage characteristics during the depletion development of deep condensate gas reservoirs. Energy Eng. 2024, 121, 2797–2823. [Google Scholar] [CrossRef] [Scilit]
  6. Thomas, F.B.; Andersen, G.; Bennion, D.B. Gas Condensate Reservoir Performance. J. Can. Pet. Technol. 2009, 48, 18–24. [Google Scholar] [CrossRef] [Scilit]
  7. Haji-Savameri, M.; Menad, N.A.; Norouzi-Apourvari, S.; Hemmati-Sarapardeh, A. Modeling dew point pressure of gas condensate reservoirs: Comparison of hybrid soft computing approaches, correlations, and thermodynamic models. J. Pet. Sci. Eng. 2020, 184, 106558, Correction in J. Pet. Sci. Eng. 2020, 184, 106558. [Google Scholar] [CrossRef] [Scilit]
  8. Larestani, A.; Hemmati-Sarapardeh, A.; Naseri, A. Experimental measurement and compositional modeling of bubble point pressure in crude oil systems: Soft computing approaches, correlations, and equations of state. J. Pet. Sci. Eng. 2022, 212, 110271. [Google Scholar] [CrossRef] [Scilit]
  9. Ghiasi, M.M.; Shahdi, A.; Barati, P.; Arabloo, M. Robust modeling approach for estimation of compressibility factor in retrograde gas condensate systems. Ind. Eng. Chem. Res. 2014, 53, 12872–12887. [Google Scholar] [CrossRef] [Scilit]
  10. Zhang, A.; Fan, Z.; Zhao, L. An investigation on phase behaviors and displacement mechanisms of gas injection in gas condensate reservoir. Fuel 2020, 268, 117373. [Google Scholar] [CrossRef] [Scilit]
  11. Atilhan, M.; Aparicio, S.; Ejaz, S.; Zhou, J.; Al-Marri, M.; Holste, J.J.; Hall, K.R. Thermodynamic characterization of deepwater natural gas mixtures with heavy hydrocarbon content at high pressures. J. Chem. Thermodyn. 2015, 82, 134–142. [Google Scholar] [CrossRef] [Scilit]
  12. Li, C.; Peng, Y.; Dong, J.; Chen, L. Prediction of the dew point pressure for gas condensate using a modified Peng–Robinson equation of state and a four-coefficient molar distribution function. J. Nat. Gas Sci. Eng. 2015, 27, 967–978. [Google Scholar] [CrossRef] [Scilit]
  13. Galatro, D.; Marin-Cordero, F. Considerations for the dew point calculation in rich natural gas. J. Nat. Gas Sci. Eng. 2014, 18, 112–119. [Google Scholar] [CrossRef] [Scilit]
  14. Mokhtari, R.; Varzandeh, F.; Rahimpour, M.R. Well productivity in an Iranian gas-condensate reservoir: A case study. J. Nat. Gas Sci. Eng. 2013, 14, 66–76. [Google Scholar] [CrossRef] [Scilit]
  15. Shokir, E.M.E.M. Dewpoint pressure model for gas condensate reservoirs based on genetic programming. Energy Fuels 2008, 22, 3194–3200. [Google Scholar] [CrossRef] [Scilit]
  16. Fath, A.H.; Pouranfard, A.; Foroughizadeh, P. Development of an artificial neural network model for prediction of bubble point pressure of crude oils. Petroleum 2018, 4, 281–291, Correction in Petroleum 2021, 7, 234. [Google Scholar] [CrossRef] [Scilit]
  17. Louli, V.; Pappa, G.; Boukouvalas, C.; Skouras, S.; Solbraa, E.; Christensen, K.O.; Voutsas, E. Measurement and prediction of dew point curves of natural gas mixtures. Fluid Phase Equilibria 2012, 334, 1–9. [Google Scholar] [CrossRef] [Scilit]
  18. Rafiee-Taghanaki, S.; Arabloo, M.; Chamkalani, A.; Amani, M.; Zargari, M.H.; Adelzadeh, M.R. Implementation of SVM framework to estimate PVT properties of reservoir oil. Fluid Phase Equilibria 2013, 346, 25–32. [Google Scholar] [CrossRef] [Scilit]
  19. Najafi-Marghmaleki, A.; Tatar, A.; Barati-Harooni, A.; Arabloo, M.; Rafiee-Taghanaki, S.; Mohammadi, A.H. Reliable modeling of constant volume depletion (CVD) behaviors in gas condensate reservoirs. Fuel 2018, 231, 146–156. [Google Scholar] [CrossRef] [Scilit]
  20. Sun, C.Y.; Liu, H.; Yan, K.L.; Ma, Q.L.; Liu, B.; Chen, G.J.; Xiao, X.J.; Wang, H.Y.; Zheng, X.T.; Li, S. Experiments and Modeling of Volumetric Properties and Phase Behavior for Condensate Gas under Ultra-High-Pressure Conditions. Ind. Eng. Chem. Res. 2012, 51, 6916–6925. [Google Scholar] [CrossRef] [Scilit]
  21. Guo, P.; Liu, H.; Wang, C.; Du, J.; Fan, B.; Jing, M.; Wang, Z.; Deng, Z.; Zhan, S. The determination of phase behavior properties of high-temperature high-pressure and rich condensate gases. Fuel 2020, 280, 118568. [Google Scholar] [CrossRef] [Scilit]
  22. Esmaeilzadeh, F.; Samadi, F. Modification of Esmaeilzadeh–Roshanfekr equation of state to improve volumetric predictions of gas condensate reservoir. Fluid Phase Equilibria 2008, 267, 113–118. [Google Scholar] [CrossRef] [Scilit]
  23. Regueira, T.; Glykioti, M.L.; Kottaki, N.; Stenby, E.H.; Yan, W. Density, compressibility and phase equilibrium of high pressure-high temperature reservoir fluids up to 473 K and 140 MPa. J. Supercrit. Fluids 2020, 159, 104781. [Google Scholar] [CrossRef] [Scilit]
  24. Zhong, Z.; Liu, S.; Kazemi, M.; Carr, T.R. Dew point pressure prediction based on mixed-kernels-function support vector machine in gas-condensate reservoir. Fuel 2018, 232, 600–609. [Google Scholar] [CrossRef] [Scilit]
  25. Seyyedattar, M.; Ghiasi, M.M.; Zendehboudi, S.; Butt, S. Determination of bubble point pressure and oil formation volume factor: Extra trees compared with LSSVM-CSA hybrid and ANFIS models. Fuel 2020, 269, 116834. [Google Scholar] [CrossRef] [Scilit]
  26. Reamer, H.H.; Sage, B.H. Phase Equilibria in Hydrocarbon Systems. Volumetric and Phase Behavior of the n-Decane-CO2 System. J. Chem. Eng. Data 1963, 8, 508–513. [Google Scholar] [CrossRef] [Scilit]
  27. Nemeth, L.K.; Kennedy, H.T. A correlation of dewpoint pressure with fluid composition and temperature. Soc. Pet. Eng. J. 1967, 7, 99–104. [Google Scholar] [CrossRef] [Scilit]
  28. Marruffo, I.; Maita, J.; Him, J.; Rojas, G. Statistical forecast models to determine retrograde dew pressure and C7+ percentage of gas condensates on basis of production test data of eastern venezuelan reservoirs. In Proceedings of the SPE Latin America and Caribbean Petroleum Engineering Conference, Buenos Aires, Argentina, 25–28 March 2001; p. 69393. [Google Scholar]
  29. Olds, R.H.; Sage, B.H.; Lacey, W.N. Volumetric and phase behavior of oil and gas from paloma field. Trans. AIME 1945, 160, 77–99. [Google Scholar] [CrossRef] [Scilit]
  30. Humoud, A.A.; Aramco, S.; Al-Marhoun, M.A. A new correlation for gas-condensate dewpoint pressure prediction. In Proceedings of the 2001 Society of Petroleum Engineers (SPE) Middle East Oil Show and Conference, Manama, Bahrain, 17–20 March 2001; p. 68230. [Google Scholar]
  31. Carlson, M.M.; Cawston, W.B. Obtaining PVT data for very sour retrograde condensate gas and volatile oil reservoirs: A multidisciplinary mpproach. In Proceedings of the SPE Unconventional Resources Conference/Gas Technology Symposium, Calgary, AB, Canada, 28 April–1 May 1996; p. 35653. [Google Scholar]
  32. Olatunji, S.O.; Selamat, A.; Raheem, A.A.A. Predicting correlations properties of crude oil systems using type-2 fuzzy logic systems. Expert Syst. Appl. 2011, 38, 10911–10922. [Google Scholar] [CrossRef] [Scilit]
  33. Gouda, A.; Attia, A.M. Development of a new approach using an artificial neural network for estimating oil formation volume factor at bubble point pressure of Egyptian crude oil. J. King Saud Univ.-Eng. Sci. 2024, 36, 72–80. [Google Scholar] [CrossRef] [Scilit]
  34. Gharbi, R.B.; Elsharkawy, A.M. Neural network model for estimating the PVT properties of middle east crude oils. In Proceedings of the 1997 Society of Petroleum Engineers (SPE) Middle East Oil Show and Conference, Manama, Bahrain, 15–18 March 1997; p. 37695. [Google Scholar]
  35. Tazikeh, S.; Davoudi, A.; Shafiei, A.; Parsaei, H.; Atabaev, T.S.; Ivakhnenko, O.P. A comparison between the perturbed-chain statistical associating fluid theory equation of state and machine learning modeling approaches in asphaltene onset pressure and bubble point pressure prediction during gas injection. ACS Omega 2022, 7, 30113–30124. [Google Scholar] [CrossRef] [Scilit] [PubMed]
  36. Gouda, A.; Gomaa, S.; Attia, A.; Emara, R.; Desouky, S.M.; El-Hoshoudy, A.N. Development of an artificial neural network model for predicting the dew point pressure of retrograde gas condensate. J. Pet. Sci. Eng. 2022, 208, 109284. [Google Scholar] [CrossRef] [Scilit]
  37. Adetiloye, B. Determination of the dew-point pressure (Dpp) for a gas condensate fluid by genetic algorithm (Ga). In Proceedings of the SPE Annual Technical Conference and Exhibition, New Orleans, LA, USA, 30 September–2 October 2013. SPE 167620-STU. [Google Scholar]
  38. Ahmadi, M.A.; Ebadi, M.; Yazdanpanah, A. Robust intelligent tool for estimating dew point pressure in retrograded condensate gas reservoirs: Application of particle swarm optimization. J. Pet. Sci. Eng. 2014, 123, 7–19. [Google Scholar] [CrossRef] [Scilit]
  39. Arabloo, M.; Rafiee-Taghanaki, S. SVM modeling of the constant volume depletion (CVD) behavior of gas condensate reservoirs. J. Nat. Gas Sci. Eng. 2014, 21, 1148–1155. [Google Scholar] [CrossRef] [Scilit]
  40. Scholkopf, B.; Sung, K.K.; Burges, C.J.; Girosi, F.; Niyogi, P.; Poggio, T.; Vapnik, V. Comparing support vector machines with gaussian kernels to radial basis function classifiers. IEEE Trans. Signal Process. 1997, 45, 2758–2765. [Google Scholar] [CrossRef] [Scilit] [PubMed]
  41. Elsharkawy, A.M.; Foda, S.G. EOS simulation and GRNN modeling of the constant volume depletion behavior of gas condensate reservoirs. Energy Fuels 1998, 12, 353–364. [Google Scholar] [CrossRef] [Scilit]
  42. González, A.; Barrufet, M.A.; Startzman, R. Improved neural-network model predicts dewpoint pressure of retrograde gases. J. Pet. Sci. Eng. 2003, 37, 183–194. [Google Scholar] [CrossRef] [Scilit]
  43. Nowroozi, S.; Ranjbar, M.; Hashemipour, H.; Schaffie, M. Development of a neural fuzzy system for advanced prediction of dew point pressure in gas condensate reservoirs. Fuel Process. Technol. 2009, 90, 452–457. [Google Scholar] [CrossRef] [Scilit]
  44. Kamari, A.; Sattari, M.; Mohammadi, A.H.; Ramjugernath, D. Rapid method for the estimation of dew point pressures in gas condensate reservoirs. J. Taiwan Inst. Chem. Eng. 2016, 60, 258–266. [Google Scholar] [CrossRef] [Scilit]
  45. Ahmadi, M.A.; Elsharkawy, A. Robust correlation to predict dew point pressure of gas condensate reservoirs. Petroleum 2017, 3, 340–347. [Google Scholar] [CrossRef] [Scilit]
  46. Rostami-Hosseinkhani, H.; Esmaeilzadeh, F.; Mowla, D. Application of expert systems for accurate determination of dew-point pressure of gas condensate reservoirs. J. Nat. Gas Sci. Eng. 2014, 18, 296–303. [Google Scholar] [CrossRef] [Scilit]
  47. Najafi-Marghmaleki, A.; Tatar, A.; Barati-Harooni, A.; Choobineh, M.J.; Mohammadi, A.H. GA-RBF model for prediction of dew point pressure in gas condensate reservoirs. J. Mol. Liq. 2016, 223, 979–986. [Google Scholar] [CrossRef] [Scilit]
  48. Nasery, S.; Barati-Harooni, A.; Tatar, A.; Najafi-Marghmaleki, A.; Mohammadi, A.H. Accurate prediction of solubility of hydrogen in heavy oil fractions. J. Mol. Liq. 2016, 222, 933–943. [Google Scholar] [CrossRef] [Scilit]
  49. Arabloo, M.; Shokrollahi, A.; Gharagheizi, F.; Mohammadi, A.H. Toward a predictive model for estimating dew point pressure in gas condensate systems. Fuel Process. Technol. 2013, 116, 317–324. [Google Scholar] [CrossRef] [Scilit]
  50. Zhou, J.; Zhu, J.; Yang, Z.; Sun, Y.; Wang, S.; He, J.; Li, X.; Yi, L. Preparation and application performance of high-temperature and high-pressure resistant microencapsulated acid for acid fracturing in ultra-deep reservoir. Chem. Eng. J. 2025, 525, 170204. [Google Scholar] [CrossRef] [Scilit]
  51. Yongsheng, M.; Xunyu, C.; Maowen, L.; Huili, L.; Dongya, Z.; Nansheng, Q.; Xiongqi, P.; Daqian, Z.; Zhijiang, K.; Anlai, M.; et al. Research advances on the mechanisms of reservoir formation and hydrocarbon accumulation and the oil and gas development methods of deep and ultra-deep marine carbonates. Pet. Explor. Dev. 2024, 51, 795–812. [Google Scholar] [CrossRef] [Scilit]
  52. Shen, A.; Hu, A.; Qiao, Z.; Zheng, J.; She, M.; Pan, L. Development and preservation mechanism of deep and ultra-deep carbonate reservoirs. Sci. China Earth Sci. 2024, 67, 3367–3385. [Google Scholar] [CrossRef] [Scilit]
  53. Li, A.; Zhang, Y.; Zhang, K.; Chen, X.; Cheng, Y.; Yang, X.; Chen, G. Effect of wax content on phase behavior of ultra-deep condensate gas reservoir: Experimental and thermodynamic model. Fuel 2024, 365, 131147. [Google Scholar] [CrossRef] [Scilit]
  54. Zhang, Y.; Lyu, W.; He, D.; Zhang, K.; Li, A.; Sun, C.; Chen, G. Phase Behavior and Compression Factors of Ultradeep Condensate and Dry Gas Reservoir under High Temperature and Pressure: Experiment and Calculation. J. Chem. Eng. Data 2024, 69, 4410–4419. [Google Scholar] [CrossRef] [Scilit]
  55. Elsharkawy, A.M. Predicting the dew point pressure for gas condensate reservoirs empirical models and equations of state. Fluid Phase Equilibria 2002, 193, 147–165. [Google Scholar] [CrossRef] [Scilit]
  56. Al-Dhamen, M.; Aramco, S.; Al-Marhoun, M. New correlations for dew-point pressure for gas condensate. In Proceedings of the SPE Saudi Arabia Section Young Professionals Technical Symposium, Dhahran, Saudi Arabia, 14–16 March 2011; p. 155410. [Google Scholar]
  57. Hinton, G.E.; Osindero, S.; Teh, Y.W. A fast learning algorithm for deep belief nets. Neural Comput. 2006, 18, 1527–1554. [Google Scholar] [CrossRef] [Scilit] [PubMed]
  58. Del Castillo, A.A.; Santoyo, E.; García-Valladares, O. A new void fraction correlation inferred from artificial neural networks for modeling two-phase flows in geothermal wells. Comput. Geosci. 2012, 41, 25–39. [Google Scholar] [CrossRef] [Scilit]
  59. Majidi, S.M.J.; Shokrollahi, A.; Arabloo, M.; Mahdikhani-Soleymanloo, R.; Masihi, M. Evolving an accurate model based on machine learning approach for prediction of dew-point pressure in gas condensate reservoirs. Chem. Eng. Res. Des. 2014, 92, 891–902. [Google Scholar] [CrossRef] [Scilit]
  60. Peng, D.Y.; Robinson, D.B. A new two-constant equation of state. Ind. Eng. Chem. Fundam. 1976, 15, 59–64. [Google Scholar] [CrossRef] [Scilit]
  61. Soave, G. Equilibrium constants from a modified Redkh-Kwong equation of state. Chem. Eng. Sci. 1972, 27, 1197–1203. [Google Scholar] [CrossRef] [Scilit]
  62. Gross, J.; Sadowski, G. Perturbed-chain SAFT: An equation of state based on a perturbation theory for chain molecules. Ind. Eng. Chem. Res. 2001, 40, 1244–1260. [Google Scholar] [CrossRef] [Scilit]
Figure 1. Schematic diagram of the dew point pressure measurement.
Processes 14 02956 g001
Figure 2. The structure of the ANN model in this study.
Processes 14 02956 g002
Figure 3. Phase behavior during the CCE experiment of condensate gas.
Processes 14 02956 g003
Figure 4. Sensitivity analysis result of target parameters to each input parameter. (a) Grey relational analysis; (b) Pearson correlation coefficient.
Processes 14 02956 g004
Figure 5. The cross plots of different datasets.
Processes 14 02956 g005
Figure 6. The APRE distribution plot of different datasets.
Processes 14 02956 g006
Figure 7. The cross plots of the ANN model and different EOSs.
Processes 14 02956 g007
Figure 8. The APRE distribution plot of the ANN model and different EOSs.
Processes 14 02956 g008
Table 1. Reservoir conditions of ultra-deep gas samples.
SampleDepth (m)Temperature (°C)Pressure (MPa)Oil Density (g/cm3)
S15235133.7048.830.7688
S25796145.8053.520.8197
S36346124.5090.000.7702
S46904125.90116.30.7863
S57375158.63146.070.8152
S67783156.7079.940.7805
S77956164.9992.520.7857
S87978161.1585.630.7838
S98254163.3689.410.7945
S108455167.8090.560.7827
Table 2. Ranges and corresponding statistical parameters of the dataset.
ParametersMinimumMaximumAverageStandard Deviation
Depth (m)2218.28630.05508.91705.9
Reservoir temperature (°C)68.10186.00138.8822.47
Reservoir pressure (MPa)22.58146.0769.8731.51
Non-hydrocarbon fractions (mol%)0.0842.544.855.10
Volatile hydrocarbon fractions
(mol%)
49.9898.2588.517.08
Intermediate hydrocarbon fractions
(mol%)
0.016.301.441.18
Heavy fraction (mol%)0.4615.915.203.61
Condensate oil density (g/cm3)0.740.850.790.02
Dew point pressure (MPa)21.9665.3643.408.66
Table 3. ANN model architecture and parameters.
ParameterValue
Number of layers4
Number of input layer neurons5
Number of hidden layers2
Number of neurons in each hidden layer8
Training algorithmConjugate Gradient Method
The activation function of the hidden layerSigmoid function
The activation function of the output layerLinear function
Table 4. The experimental data measured in this study.
ParametersS1S2S3S4S5S6S7S8S9S10
N24.556.641.700.372.601.511.852.651.293.97
CO25.060.350.270.300.049.736.967.015.451.62
CH476.5891.5886.4589.3691.3179.4680.0282.1377.6975.27
C2H61.400.585.595.771.482.663.572.644.453.86
C3H80.660.081.461.320.230.871.070.801.771.43
i-C4H100.250.020.370.260.200.280.390.300.610.50
n-C4H100.480.040.480.270.230.430.500.420.830.86
i-C5H120.320.020.020.100.140.300.330.260.540.54
n-C5H120.400.020.170.060.160.310.320.250.500.68
C6H141.010.030.240.100.850.380.340.250.661.17
C7+9.280.633.252.082.764.074.663.306.2010.10
Pd (MPa)38.2053.5248.1953.0753.7650.0843.8041.9040.5040.65
Table 5. The statistical error analysis of the developed models.
ParameterTrainValidationTestTotal
APRE (%)−1.2643−3.00970.1872−1.4245
AAPRE, %8.98774.65194.95898.0904
RMSE (MPa)4.82411.61821.86834.8372
SD0.11230.03840.04010.1134
R20.74450.81120.75540.7620
Number of Datasets921110113
Note: The “Total” values are computed from all 113 datasets combined, and are not an average of the three subsets.
Table 6. The statistics analysis for EOS models and the ANN model.
ParameterPRSRKPC-SAFTANN Model
APRE (%)23.065921.728921.60910.1872
AAPRE, %31.724828.135229.93004.9589
RMSE (MPa)10.921310.088910.09461.8683
SD0.22940.20950.21910.0401
Disclaimer/Publisher’s Note: The statements, opinions and data contained in all publications are solely those of the individual author(s) and contributor(s) and not of MDPI and/or the editor(s). MDPI and/or the editor(s) disclaim responsibility for any injury to people or property resulting from any ideas, methods, instructions or products referred to in the content.