Article

Single-Atom Solvent for Enhanced CO2 Capture: Process Modeling and Multi-Objective Optimization

1
School of Aeronautical Materials and New Energy, Xihang University, Xi’an 710077, China
2
Xi’an Thermal Power Research Institute Co., Ltd., Xi’an 710054, China
3
Beijing Petrochemical Engineering Co., Ltd., Xi’an Branch, Xi’an 710061, China
4
School of Physics, Xi’an Jiaotong University, Xi’an 710049, China
5
Guangzhou Municipal Housing Development and Transportation Bureau in Baiyun District, Guangzhou 510000, China
*
Author to whom correspondence should be addressed.
Processes 2026, 14(17), 2856; https://doi.org/10.3390/pr14172856
Submission received: 8 August 2026 / Revised: 31 August 2026 / Accepted: 2 September 2026 / Published: 7 September 2026
(This article belongs to the Section Process Control, Modeling and Optimization)

Abstract

This work addresses the post-combustion CO2 capture demand, employing a single-atom solvent as the absorbent to conduct systematic research on process modeling, energy consumption analysis, and multi-objective optimization. The energy consumption of the single-atom solvent-enhanced CO2 capture process was reduced to 2.864 GJ/t, representing a 26.9% reduction compared with that of the conventional solution. The effects of solvent flow rate, gas flow rate, rich solvent temperature, reflux ratio, and extraction ratio on the energy consumption, annual total utility consumption, CO2 equivalent emissions, and total annual cost were systematically investigated. The results indicate that rich solvent temperature and reflux ratio are the most sensitive parameters affecting system energy consumption variations; increasing solvent flow rate linearly elevates the reboiler duty, whereas gas flow rate variations exert negligible influence on system performance. The energy consumption was further reduced to 1.84 GJ/t CO2 after process parameter optimization. A multi-objective optimization approach coupling the NSGA-II with Aspen Plus process simulation was developed for economic–energy–environmental optimization. Annual total utility consumption was reduced by 12.75%, CO2 equivalent emissions per unit of product were reduced by 47.87%, and total annual cost was reduced by 13.09% after optimization. The optimal operating conditions under multi-objective optimization were determined simultaneously. This study provides an optimization strategy for the industrial application of CO2 capture technology.

1. Introduction

Global climate change has become one of the most severe challenges facing humanity in the 21st century. According to the 2023 CO2 Emissions Report released by the International Energy Agency (IEA) [1], global energy-related CO2 emissions increased by 1.1% in 2023 [1], reaching a historic high of 37.4 billion tons, with coal-fired power plants contributing over 65% of the emissions increase [2,3]. The concentration of CO2 in the flue gas of coal-fired power plants is usually 12–15%. Efficient capture and storage of CO2 in coal-fired power plants is a key path to achieving carbon neutrality goals. Among numerous carbon capture technologies, the chemical absorption method is widely recognized as the most promising post-combustion capture technology due to its high technological maturity, capture efficiency of over 90%, and strong adaptability. However, the core bottleneck of this technology lies in the high energy consumption of solvent regeneration. The specific reboiler duty of the traditional monoethanolamine (MEA) based process is as high as 3.5–4.5 GJ/t CO2 [4], resulting in a 23–29.5% decrease in net output power of the power plant [5], and an increase in operating costs of about 70%, which seriously restricts its large-scale commercial application [6].
To overcome the above bottlenecks, the development of solvents for chemical absorption methods has evolved from traditional single-component amines to high-performance mixed amines. Although MEA solvents, widely used in the early days, have the advantages of fast reaction rate and large absorption capacity, their high regeneration energy consumption (measured heat of CO2 desorption reaction about 80.2–85.6 kJ/mol CO2) [7,8], strong corrosiveness, and easy degradation have prompted researchers to develop various alternative solvents. Methyl diethanolamine (MDEA), as a representative tertiary amine, has a reaction enthalpy of only 61 kJ/mol CO2 [8], low corrosiveness, and good stability, but a slow absorption rate. Moreover, PZ accelerates CO2 absorption via rapid carbamate formation and shifts the liquid-phase speciation equilibrium as an activator, which lowers the apparent reaction heat per unit CO2 and allows operation at a reduced solvent circulation rate; the combined reduction in reaction, sensible, and latent heat duties directly decreases the specific reboiler duty and overall regeneration cost. Otitoju et al. [4] studied the capture of piperazine PZ based combustion in a 250 MW natural gas combined cycle power plant, and found that the energy consumption of the standard process reboiler was 3.56–5.34 GJ/t CO2. After adding PZ as an activator to the MDEA system, the reaction enthalpy of the PZ/MDEA mixed solvent decreased to about 70 kJ/mol CO2, a decrease of 26.3% compared to MEA. The specific reboiler duty can be reduced to 2.39–3.0 GJ/t CO2 [8,9].
Moreover, new solvents such as amino acid salts and ionic liquids have shown potential for low energy consumption and low volatility. The specific reboiler duty of ionic liquid-based solvents has been reduced to 2.5–2.8 GJ/t CO2 [10,11]. Zhou et al. [12] reviewed stimuli-responsive organic polymers and frameworks that enable non-thermal regeneration through light, redox, or pH switching, dramatically reducing energy penalties compared to conventional thermal methods. On the molecular-design front, Yang et al. [13] demonstrated that amino-functionalized porous organic polymers achieve superior CO2/N2 selectivity via synergistic carbamate formation and electrostatic interactions, as elucidated by DFT calculations. Complementing these strategies, Ravi et al. [14] showed that melamine post-functionalization of high-surface-area aromatic carbonyl polymers introduces dense nitrogen sites, yielding both high CO2 affinity and stable cyclic performance under ambient regeneration. However, relying solely on solvent modification is difficult to fundamentally solve the energy consumption problem, and it is necessary to combine solvent performance improvement with process system optimization [10].
In recent years, multi-objective optimization methods that combine intelligent optimization algorithms with process simulation have become an important research direction for energy conservation and consumption reduction in CO2 capture systems [15]. Eslick et al. [16] used the NSGA-II to conduct a multi-objective analysis on multiple amine solvents, optimizing operating conditions with net power output and capital cost as objective functions. Khaidzir et al. [17] coupled Aspen Plus process simulation with NSGA-II to achieve synergistic optimization of cost, emissions, and technical performance of a CO2 capture utilization integrated system. Wang et al. [18] systematically evaluated the impact of different desorber configurations on the energy consumption of the reboiler, providing a theoretical basis for process structure optimization. Existing research has shown that optimizing key operating parameters such as solvent flow rate, reflux ratio, extraction ratio, and rich solution temperature [19] can significantly reduce system energy consumption and environmental impact while ensuring CO2 capture rate. However, existing research has mostly focused on traditional amine solvent systems, and there is still a lack of process optimization research for new high-performance solvents, especially a systematic research framework that couples solvent characteristics, process parameters, and economic and environmental indicators.
Single-atom solvent (SAS), as an emerging functionalized absorbent, can significantly improve CO2 absorption capacity and selectivity by anchoring single metal atoms or active sites in porous carriers or ionic liquid frameworks, while reducing regeneration energy consumption. Single atoms are atomically dispersed and stabilized within the solvent matrix through coordination interactions. The single metal atom (Cu/Pt/Cr/Ni) is coordinated with functional groups from PANI (polyaniline) and TEMPO (2,2,6,6-tetramethylpiperidine-1-oxyl), forming a well-defined coordination environment that prevents metal aggregation. The concentration of the single-atom Cu species has been quantified and reported. The advantages of single-atom solvents for carbon capture processes are summarized in Table 1. Compared with traditional amine solvents, single-atom solvents have unique advantages such as high absorption capacity (up to 2–3 times that of traditional solvents) [20], low regeneration temperature (can be reduced by 20–30 °C) [21], and excellent thermal stability [22]. Single-atom species under the temperature swing of the absorption–desorption cycle generate a thermoelectric effect. This effect provides an additional driving force that reduces the apparent heat requirement for CO2 desorption, thereby lowering the reaction heat of the desorption process. Introducing single-atom solvents into the chemical absorption carbon capture process is expected to fundamentally break through the bottleneck of high energy consumption in traditional solvent regeneration. However, the application of single-atom solvents is still in the laboratory stage, and there have been no reports on the systematic optimization of their processes. How to translate the excellent intrinsic properties of single-atom solvents into economic and environmental benefits of actual processes is a key scientific problem that urgently needs to be solved.
Based on the above background, this work constructs a CO2 capture process for coal-fired power plants using a single-atom solvent as an absorbent. Aspen Plus is used for steady-state process simulation to systematically investigate the impact of key operating parameters such as solvent flow rate (FluxS), gas flow rate (FluxG), rich solution temperature (TR), reflux ratio (RRM), and extraction ratio (ERD) on energy consumption (Econ), annual total utility cost (ATU), CO2 emission intensity (CO2 e), and annual total cost (TAC). A multi-objective optimization method coupled with NSGA-II and process simulation is used to determine the optimal operating parameters of the system. The objective function is to minimize (ATU, CO2 e, and TAC), obtain the Pareto optimal solution set, and use the LINMAP (Linear Programming Technique for Multidimensional Analysis of Preference) method to determine the optimal point. This study aims to reveal the quantitative relationship between operating parameters and energy consumption and cost emission indicators in single-atom solvent carbon capture processes, and to establish a multi-objective optimization framework for single-atom solvent enhanced carbon capture processes based on NSGA-II, achieving global optimization of process parameters. This work provides theoretical guidance and technical support for the transition of single-atom solvents from laboratory to industrial applications, and promotes the update and development of chemical absorption carbon capture technology.

2. Process Modeling

2.1. Model Description

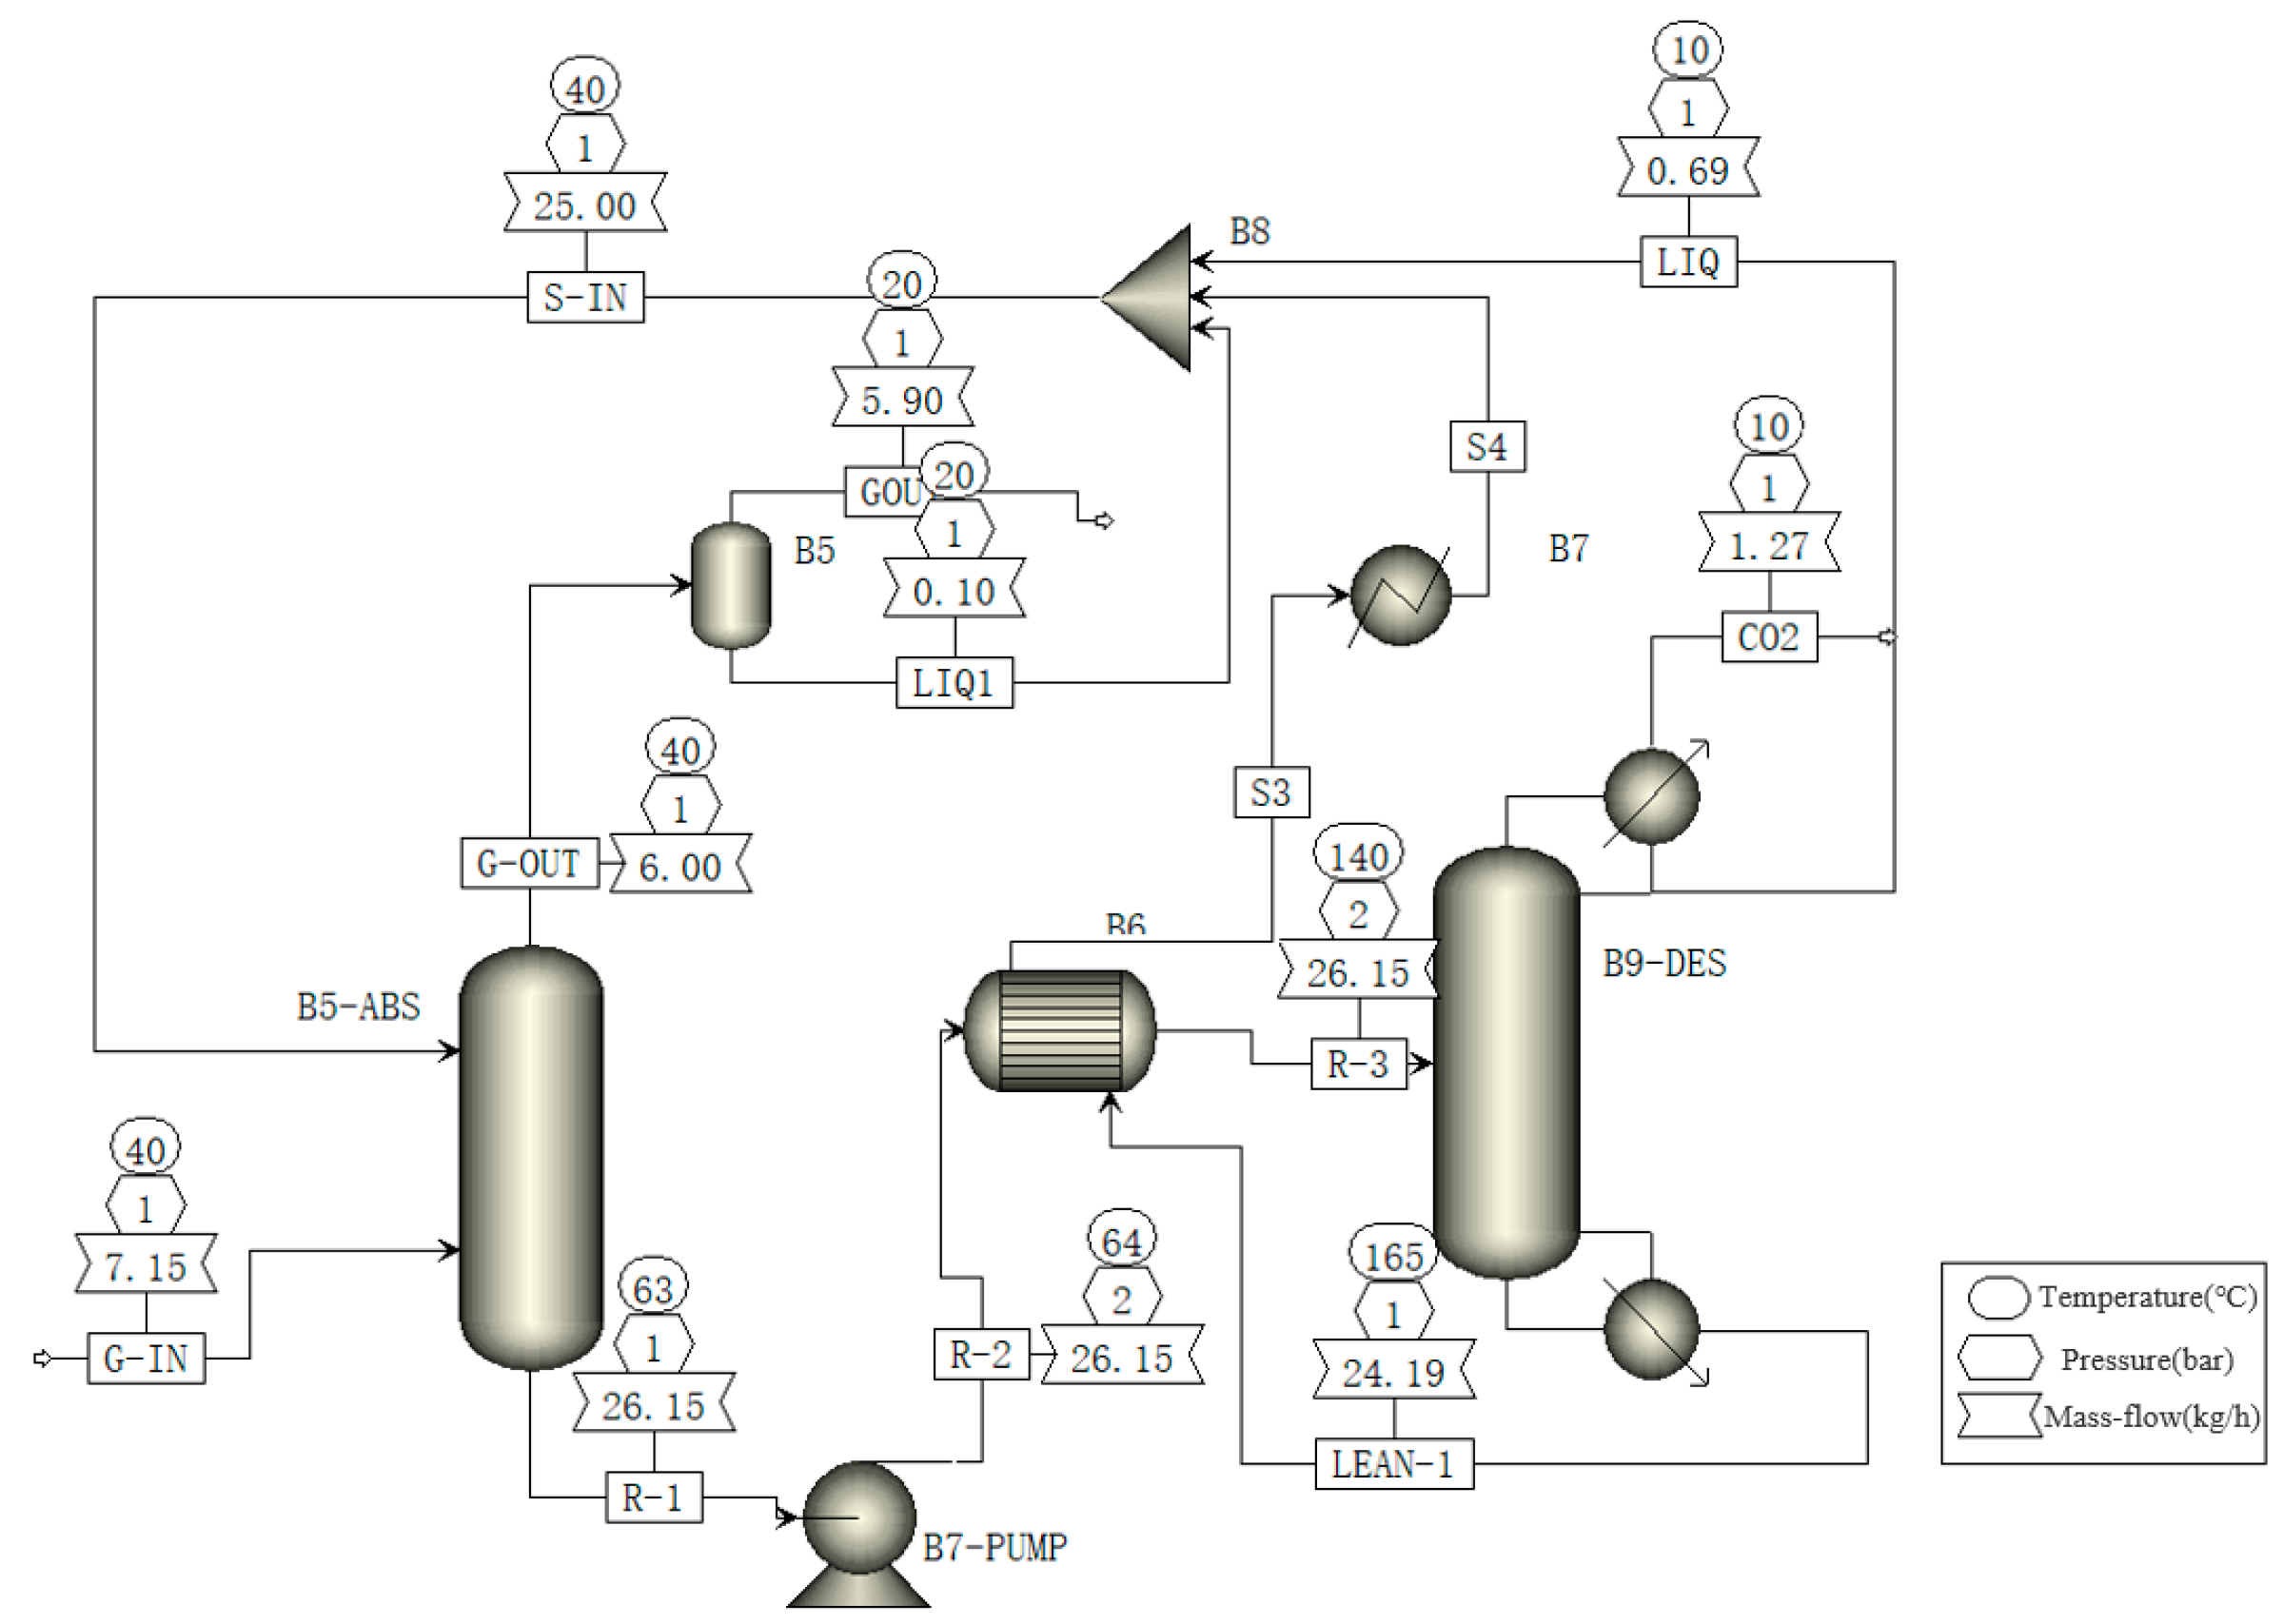
This work is modeled using Aspen Plus simulation software V11, and the simulation process of SAS-enhanced carbon dioxide capture technology is shown in Figure 1. The process description is as follows: After entering the bottom of the absorber, the flue gas comes into countercurrent contact with the fresh absorbent/regenerated lean solution flowing out from the top of the absorber, and then removes carbon dioxide. The solvent carried out by the flue gas is removed by the gas–liquid separator, and the decarbonized carbon tail gas in the gas phase of the gas–liquid separator is directly discharged. The rich solution that has absorbed CO2 is heated to a specified temperature by a power pump installed at the bottom outlet of the absorber and a lean-rich liquid heat exchanger, and then enters the upper part of the desorber. The rich solution enters the upper part of the desorber for desorption and regeneration. The rich liquid in the lower part of the desorber is heated to the specified temperature by the reboiler and desorbed for regeneration. The carbon dioxide gas desorbed from the top of the desorber is cooled by the condenser, and the separated condensate is returned to the system for reuse. The separated 99% high-purity carbon dioxide gas enters the downstream carbon dioxide utilization unit. The lean solution obtained from the desorber bottom is subjected to heat exchange with the rich solution through a heat exchanger to around 120 °C, and then cooled to around 30–40 °C through a lean solution cooler. Together with the liquid phase from the gas–liquid separation tank at the top of the absorber, it forms a circulating solvent and enters the system for reuse. The circulating solvent enters the top of the absorber again and comes into countercurrent contact with the flue gas to absorb carbon dioxide.
This work is aimed at the design of CO2 capture technology for experimental bench scale, with an annual CO2 capture capacity of about 10 tons. The detailed design parameters are shown in Table 2. The chemical absorption method technology with single-atom solvent as the absorbent is adopted, and the composition of the single-atom solvent is shown in Table 2. The preparation of single-atom solvent can be found in published works [26,27]. SAS is prepared from 65.5 g N, N-Dimethylformamide, 0.1 g Copper (I) hydride, 0.1 g polyaniline, 0.1 g 4-hydroxy-TEMPO, and 28.1 g MEA. The solvent is prepared by the electrochemical method [22].
The simulation of the absorber and desorber is based on equilibrium-stage modeling. The main chemical reactions considered in the model are water dissociation, the reaction between CO2 and MEA, and the equation for CO2 desorption. The desorption reaction in the desorber is independently set to kinetic mode. The kinetic parameters are based on experimentally determined SAS-CO2 desorption reaction heat-corrected kinetic parameters. Through previously published research [24], the heat of the SAS-CO2 desorption reaction was experimentally measured to be 55.5 kJ/mol, which is 30.8% lower than the MEA aqueous solution [7]. Table 3 displays the chemical reactions and kinetic parameters involved in the simulation.

2.2. Physical Property Method

This work uses the ENRTL-RK physical property method in Aspen Plus software for simulation calculations. The ENRTL-RK method can handle liquid-phase systems containing electrolytes. ENRTL-RK can effectively describe the interactions between ions. ENRTL-RK considers the non-ideality of electrolyte solutions and corrects the activity coefficient by introducing the concept of local composition. The fitted gas–liquid equilibrium data can be well matched with experimental values through calculation. The Redlich–Kwong equation of state calculation method is used for the gas phase. For common non-polar or weakly polar gases such as CO2, N2, and O2 in carbon capture systems, the RK equation can fully describe the PVT relationship of molecules. All binary interaction parameters for the relevant pairs—MEA–DMF, CO2–MEA–DMF, and those involving PANI, TEMPO, and CuH—were taken directly from the Aspen Plus built-in databank (specifically, the ELECNRTL and NRTL parameter libraries).

2.3. Thermodynamics Verification

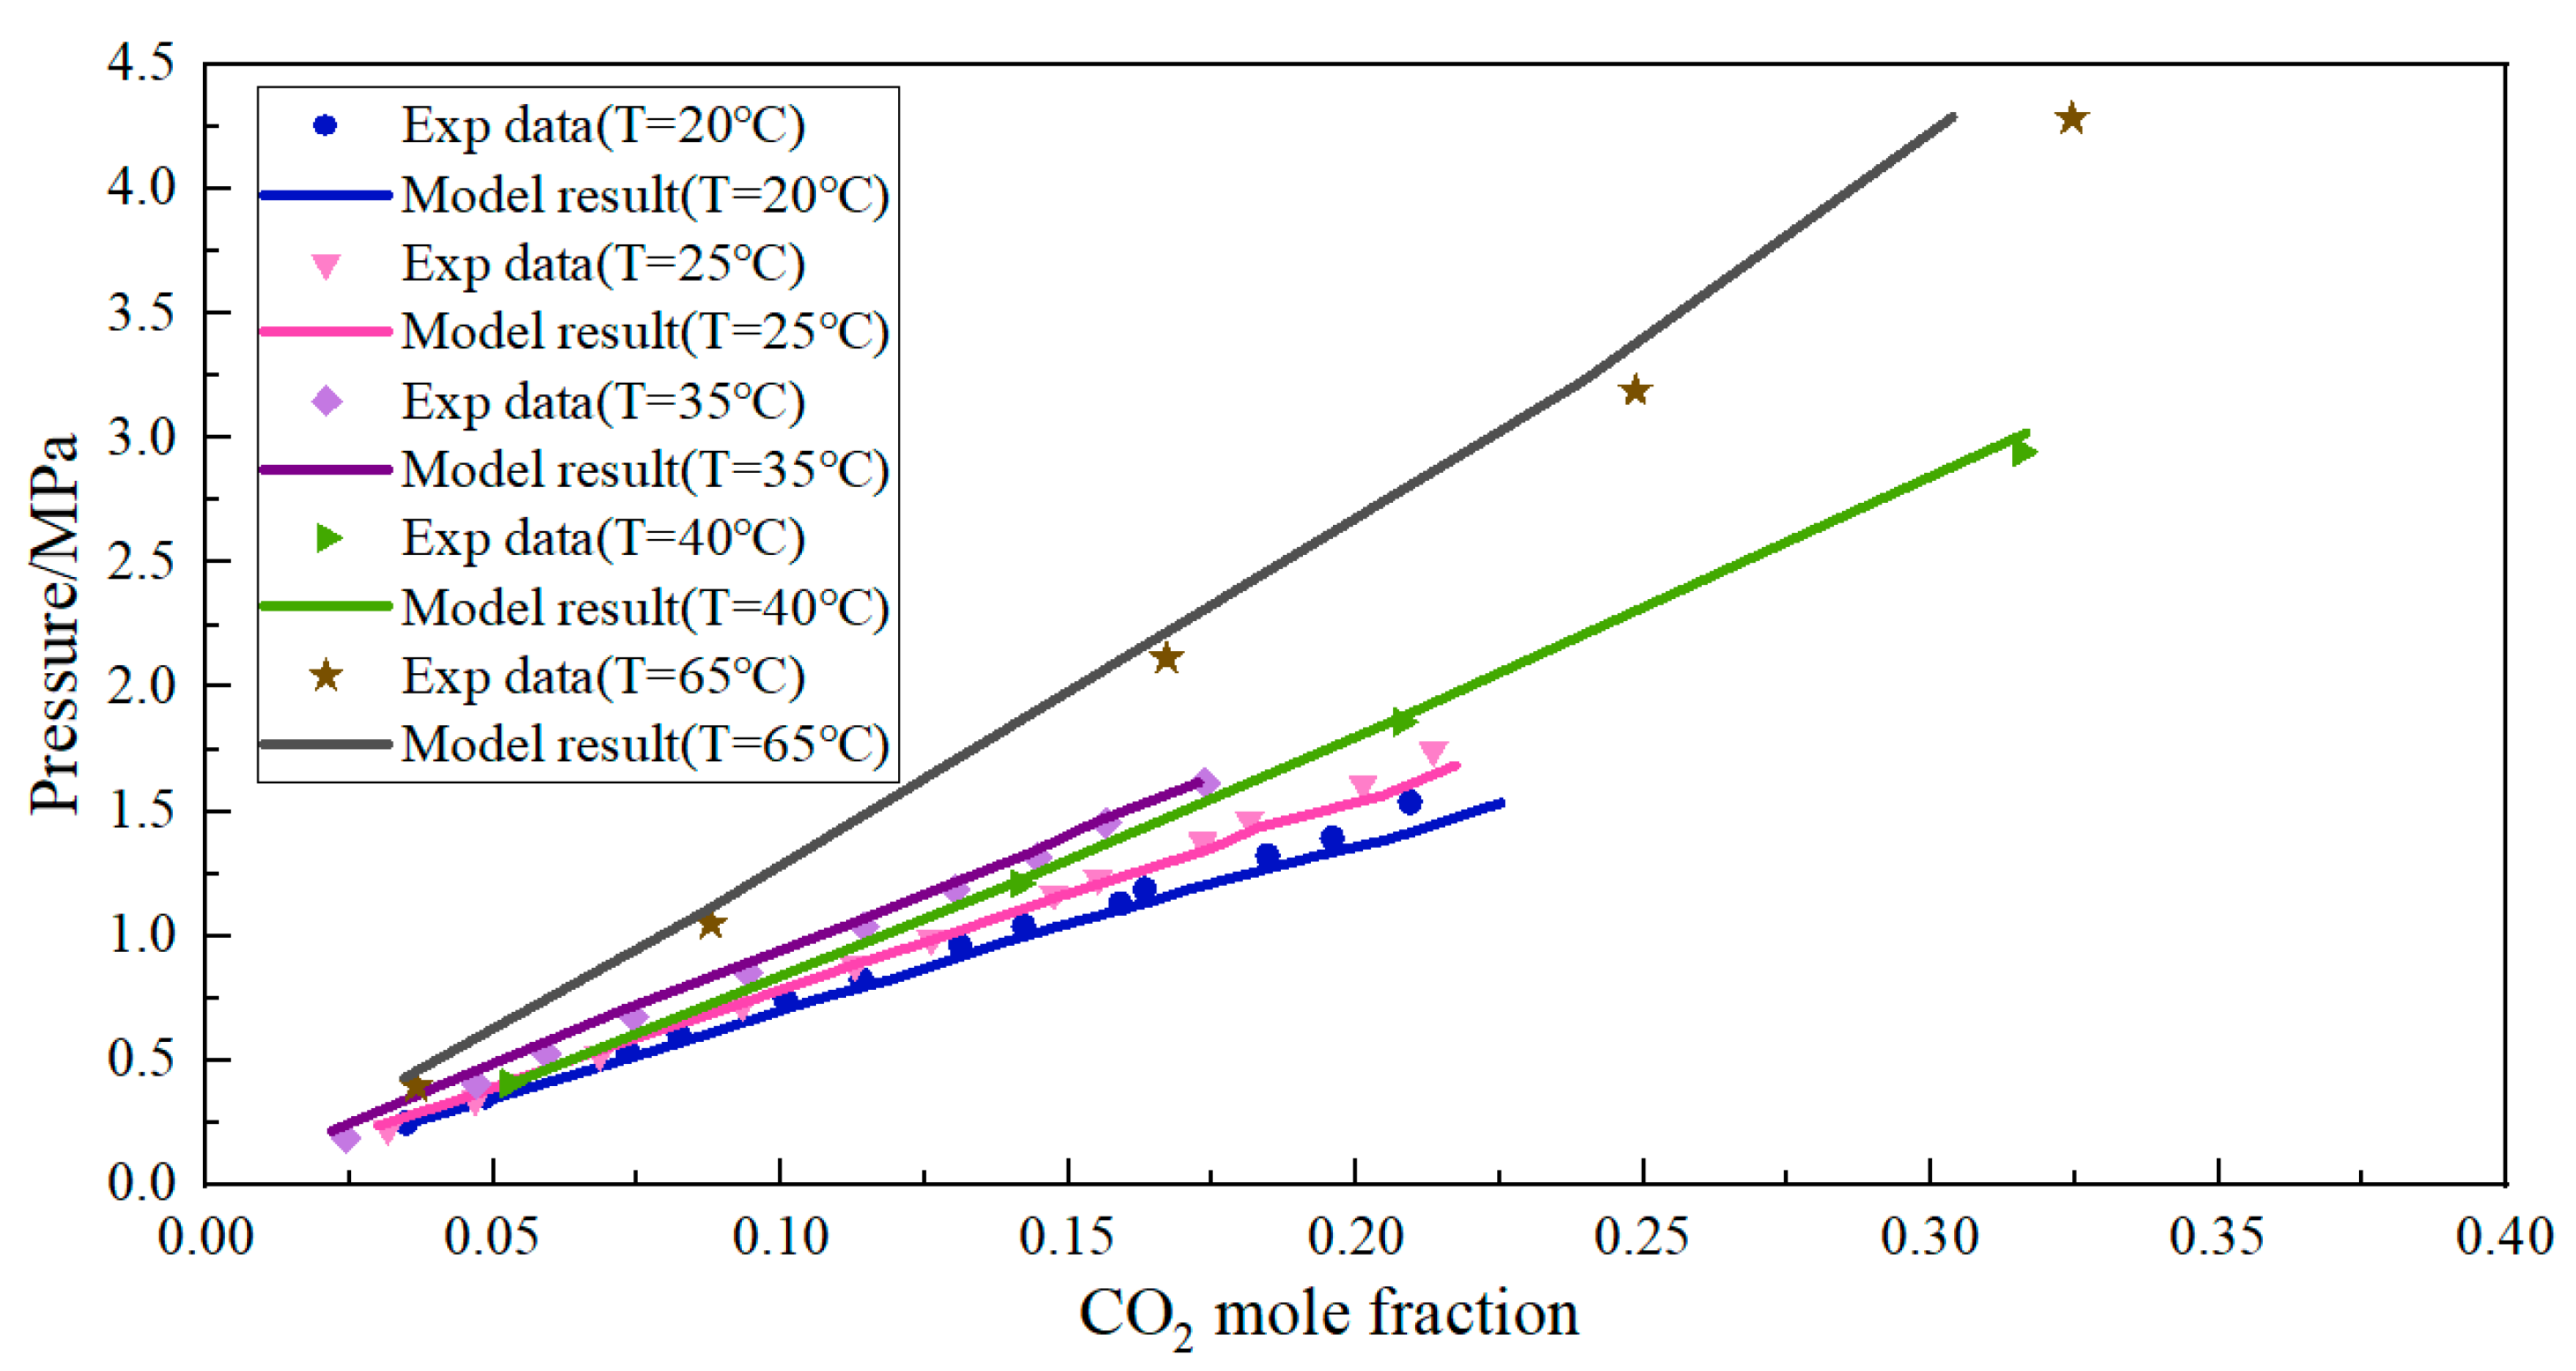
SAS uses DMF instead of traditional water as the solvent, which shows better solubility in the process of capturing CO2. The CO2–DMF binary data are used to regress the non-reactive VLE/Henry’s law parameters. DMF is the dominant solvent by mass; therefore, the physical solubility of CO2 is governed primarily by CO2–DMF interactions. This study compares the gas–liquid equilibrium data of CO2 in DMF with published experimental research data (20–65 °C and 0.2–4.5 MPa) [28,29] to demonstrate the reliability of the thermodynamic calculation results selected for simulation. The comparison between the CO2-SAS thermodynamic model calculation results of Aspen Plus software and experimental data is shown in Figure 2.
It can be seen from Figure 2 that as the temperature increases, the solubility of CO2 in SAS decreases, which is consistent with published research conclusions [24,28,29]. The model accuracy is high under low-temperature conditions, and the experimental points almost coincide with the model lines, indicating that thermodynamic models can be used to describe the process of single-atom solvent absorption of carbon dioxide.

3. Process Evaluation Indicators and Optimization

3.1. Process Performance

To evaluate the absorption performance of the SAS-enhanced CO2 capture process, the CO2 capture rate was used to quantify the absorption performance. Process energy consumption was calculated using the energy consumption index of the desorber reboiler per unit of carbon dioxide product. The specific calculation is shown in Equations (1) and (2).
CR CO 2 = G asIN CO 2 - GasOUT CO 2 G asIN CO 2
E con = Q r e b o i l e r Pro CO 2

3.2. System Energy Consumption

Energy consumption is an important indicator for evaluating the economic performance of industrial processes. The basis of energy analysis is the law of conservation of mass and energy, expressed as Equations (3) and (4):
m i = 0
Q + W + n i h i = 0
The energy consumption involved in the carbon capture process established in this article includes the power consumption of the pump, the cold utility consumption of the condenser, the hot utility consumption of the reboiler, and the cold and hot utility consumption of the heating or cooling heat exchanger. The annual total utility consumption (ATU) consists of total heating utility (THU), total cooling utility (TCU), and electricity consumption of equipment. ATU can be calculated by the following Equation (5).
A T U = T H U + T C U + W

3.3. Environmental Impact

Quantifying the environmental impact of this work was done using CO2 equivalent emissions, which include direct carbon emissions generated throughout the process and indirect carbon emissions caused by system utility consumption. The total annual CO2 equivalent emissions ( TOT CO 2 e ) of the process system are divided into two parts: carbon emissions caused by coal consumption used in the system’s utilities ( M utility-CO 2 ) and carbon emissions directly emitted into the atmosphere ( M stream-CO 2 ). The carbon dioxide equivalent emissions per unit product (CO2 e) is the ratio of annual carbon dioxide equivalent emissions to product output. The detailed calculation process of CO2 e is shown in Equations (6)–(9). Specifically, the utility emission factor depends on the type of utility (heating/cooling utility or electricity); the emission factor of electricity is taken as 0.6 kg CO2 e/kWh, and the emission factor of steam is 0.09 kg CO2 e/MJ. The efficiency factor is taken as 0.6, and the global warming potential factor of CO2 is taken as 1.
TOT CO 2 e = M utility-CO 2 + M stream-CO 2
M utility-CO 2 = φ CO 2 ξ CO 2 Q duty
M stream-CO 2 = m i θ CO 2
CO 2 e = TOT CO 2 e Pro CO 2

3.4. Economic Investment

The total annual cost (TAC) is introduced to evaluate the economic performance of the three processes. TAC is the sum of cash cost of production (CCOP) and annual cost of capital (ACC). Cash cost of production (CCOP) is the sum of the variable cost of production (VCOP) and fixed cost of production (FCOP). The annual capital charge ratio (ACCR) can be used to convert the total capital cost (TCC) into an annual capital cost (ACC). The detailed calculation process is shown in Equations (10)–(12). The total annual variable cost of production (VCOP) is estimated as Equation (13).
TAC = CCOP + ACC
CCOP = VCOP + FCOP
ACC = ACCR × TCC
VCOP = Cf + Cc
The total capital cost (TCC) is the capital cost of all equipment, including heat exchangers, towers, pumps, separators, etc. The cost correlations summary of the economic analysis is listed in Table 4. MEA and DMF are the main components of the solvent system, accounting for over 99% of the total solvent mass. Therefore, it is assumed that the solvent cost is approximately the cost of MEA and DMF in the economic analysis.
The total annual fixed cost of production (FCOP) can be approximated as TCC multiplied by the fixed cost of production coefficient ( ω ) ( ω = 25%) [34].

3.5. Multi-Objective Optimization

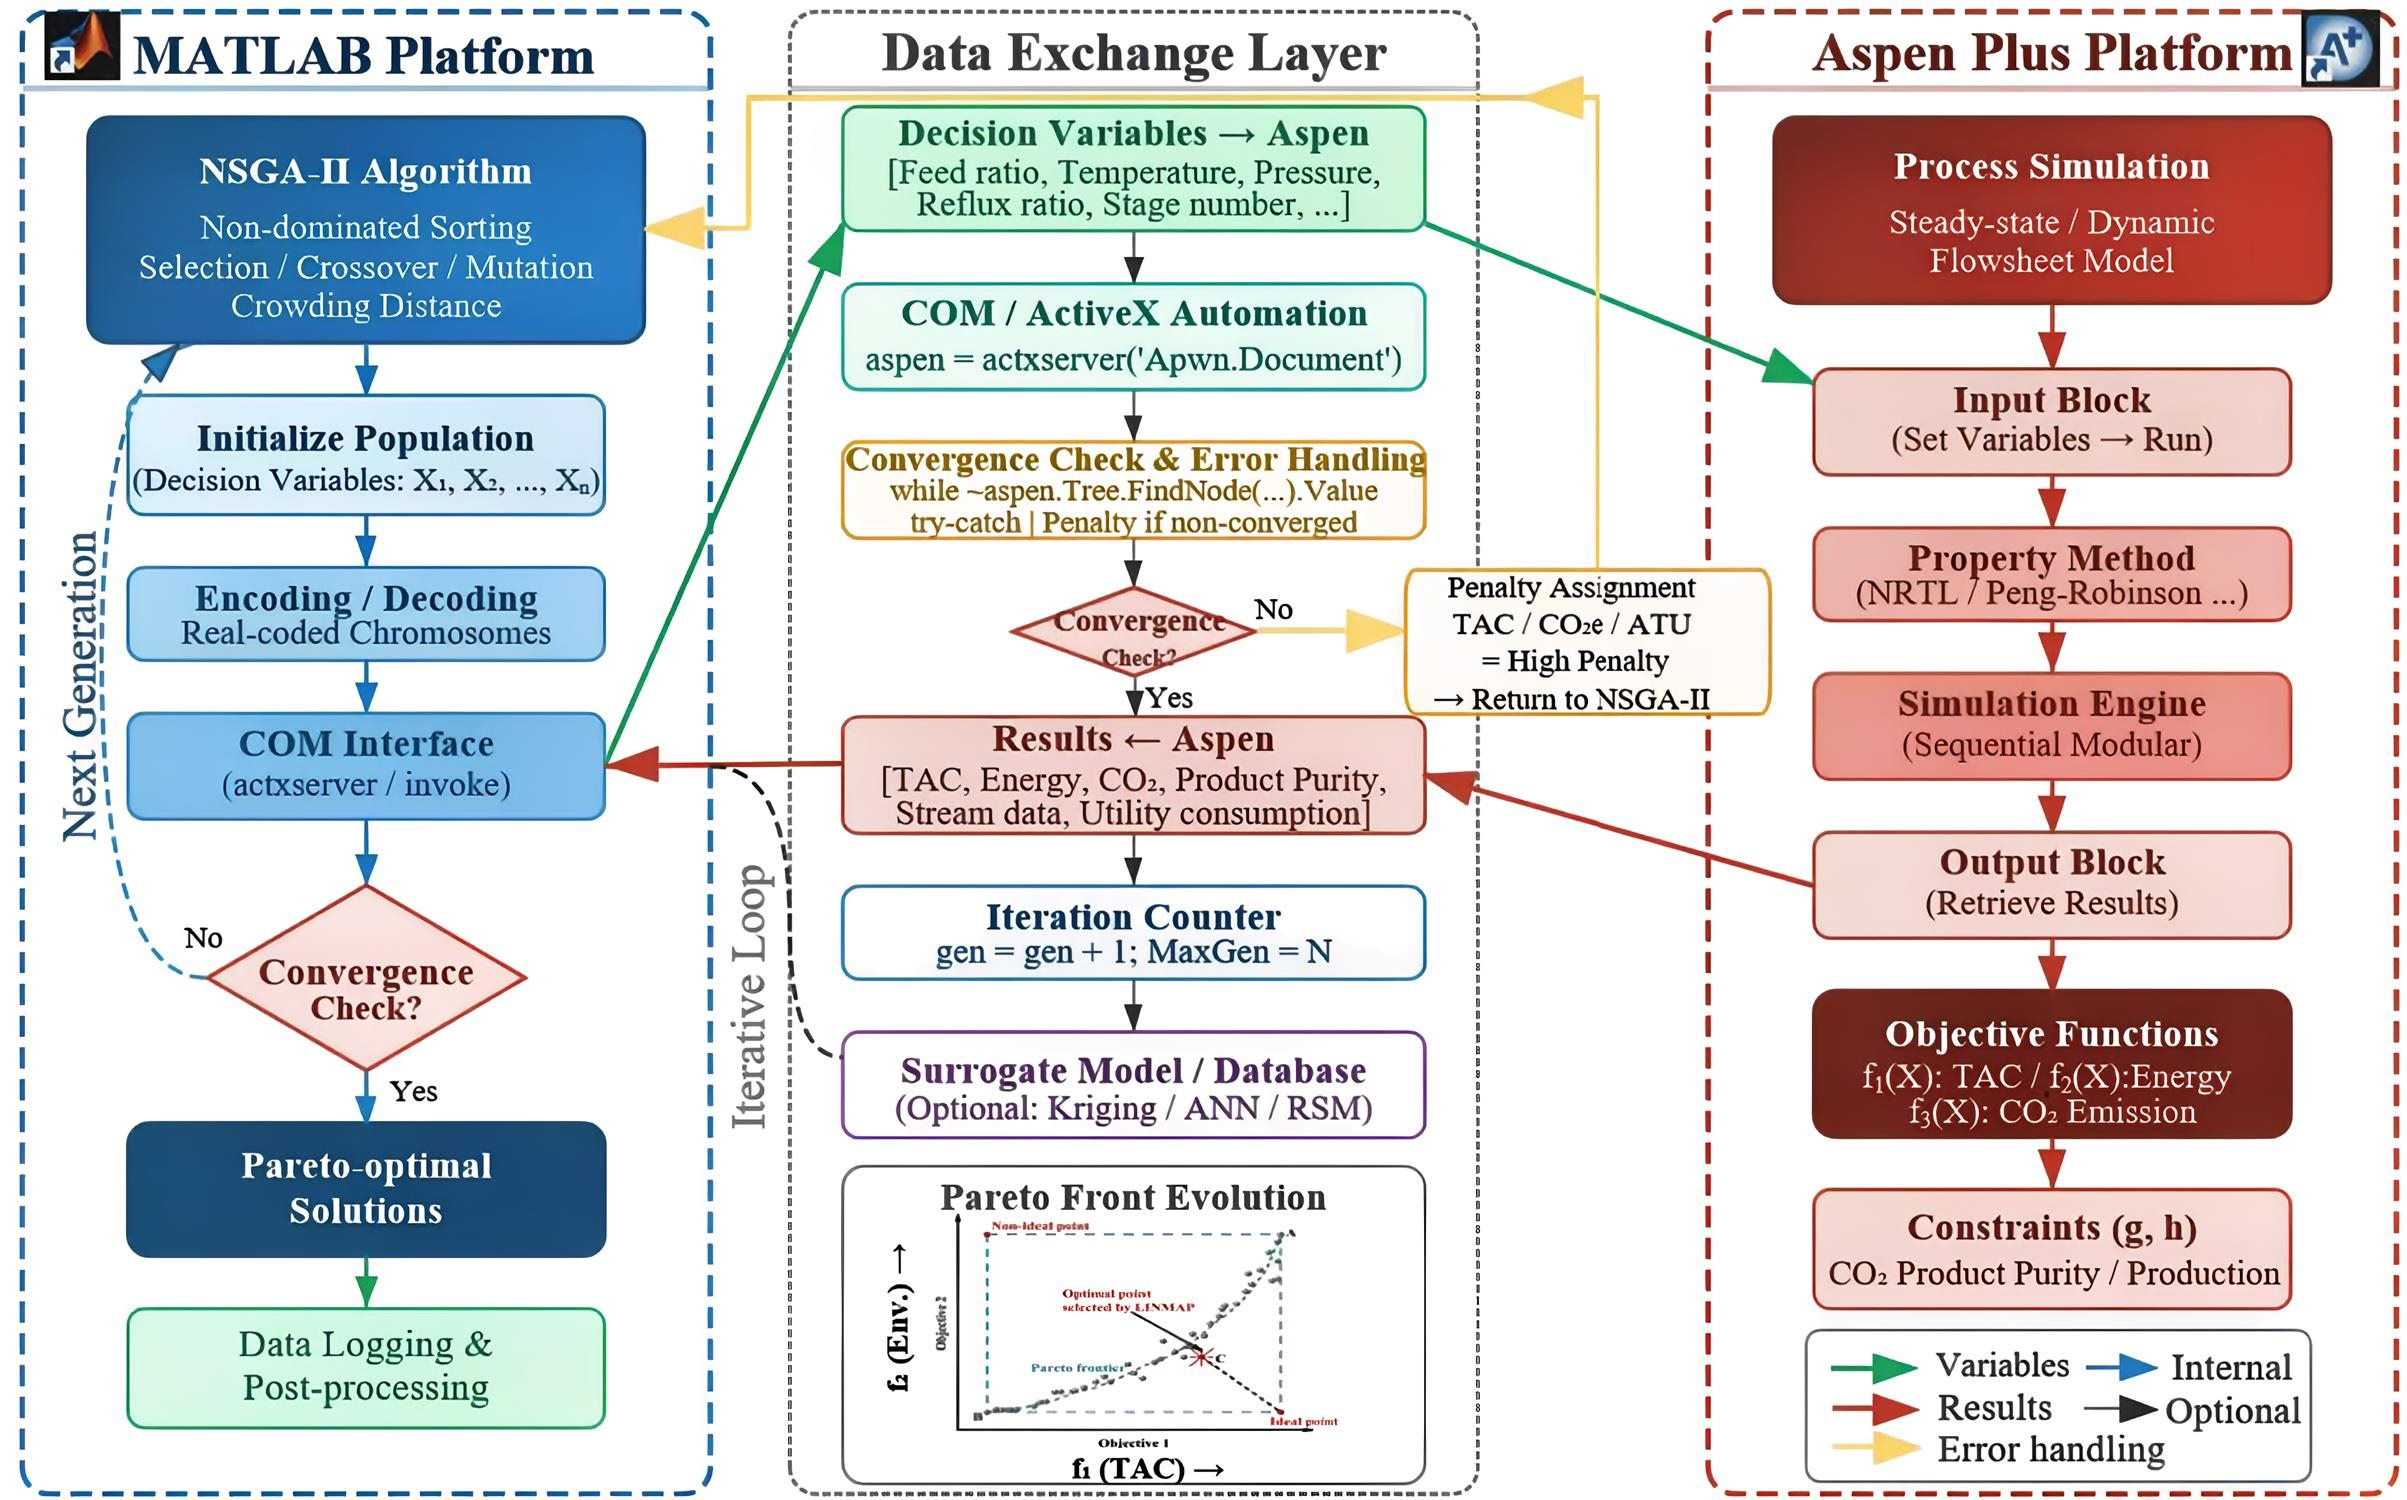
Figure 3 shows the multi-objective optimization framework coupled with MATLAB R2016a and Aspen Plus V11. The left MATLAB platform runs the NSGA-II (non-dominated sorting, selection/crossover/mutation, Euclidean distance calculation), which communicates bidirectionally with the intermediate data exchange layer through the COM/ActiveX interface. The decision variables (feed ratio, temperature, pressure, reflux ratio, etc.) are input into Aspen Plus for steady-state process simulation. Aspen completes the sequential module calculation and returns the results of TAC, energy consumption, CO2 emissions, product purity, etc., to MATLAB. After updating the iteration counter, it enters the next generation of evolution and finally outputs the Pareto optimal solution set. The NSGA-II initial parameters are set to a population size of 60 and 30 generations of evolution. The detailed information about NSGA-II used in multi-objective optimization is shown in Table A1 in the Appendix A.

3.5.1. Objective Functions

TAC, CO2 e, and ATU represent the quantitative indicators of economic investment, environmental impact, and energy consumption of the SAS-enhanced CO2 capture process established in this work. They are set as three objective functions for multi-objective optimization, as shown in Equations (14)–(16).
Obj.Func.I = TAC = Cf + Cc + 0.374 × TCC
Obj . Func . II = CO 2   e = TOT CO 2 e Pro CO 2
Obj.Func.III = ATU = THU + TCU + ∑W

3.5.2. Decision Variables

Five important parameters, including flue gas flow rate, solvent flow rate, mass reflux ratio of the top of the desorber, temperature of rich liquid entering the desorber, and extraction ratio of the bottom of the desorber, are taken as decision variables; the purity and yield of CO2 products are used as constraints for multi-objective optimization.

3.5.3. Determination of Optimal Solution

The Pareto front of multi-objective optimization can be obtained by Aspen Plus and MATLAB after multiple interactive operations. The famous LINMAP is used to find the optimal solution in the Pareto solution set. The ideal point is the extreme point of the objective function in the solution set. At the ideal point, each objective obtains an ideal optimal value. The LINMAP method computes the Euclidean distance ( ED i + ) between each point in the Pareto solution set and the ideal point to evaluate each solution. The solution corresponding to the minimum Euclidean distance value is considered the optimal point on the Pareto solution set [31,35]. The Euclidean distance is calculated as shown in Equations (17) and (18). Specifically, all objective functions were normalized using min–max normalization to eliminate scale differences. Equal weights were assigned to the three objectives.
f ij norm = f ij - min ( f ij ) max ( f ij ) - min ( f ij )
ED i + = j = 1 n ( f ij norm - f ij ideal ) 2

4. Results and Discussion

4.1. Model Validation

Table 5 shows the comparison results between this study and the reference values in the literature, verifying the reliability of the model. Specifically, key operating parameters such as CO2 volume fraction (12.5%), absorbent inlet temperature (40 °C), desorption pressure (0.12 MPa), and desorption temperature (120 °C) are almost consistent with the literature values, while the output parameters of CO2 capture rate and liquid-to-gas ratio deviate by 7.07% and 3.14%, respectively. It is worth noting that the CO2 capture rate in this study reached 99%, which is 7.07% higher than the reference value in the literature (92%). This indicates that while ensuring the accuracy of the model, the single-atom solvent used to enhance the CO2 absorption and desorption process has significant advantages in CO2 capture efficiency.
Moreover, the simulated lean loading ([0.22 mol CO2 mol−1 MEA]) is now explicitly compared with the calculated values reported in the literature [18] ([0.21 mol CO2 mol−1 MEA]). The relative deviations are within 5%, indicating the simulation’s satisfactory agreement with the calculation data. The predicted specific reboiler duty (2.864 GJ t−1 CO2) is compared with the literature [39] (2.98 GJ t−1 CO2), showing good agreement.

4.2. Summary of Process Simulation

The process flow data obtained from the Aspen Plus simulation are shown in Table 6. The operating results and parameters of key equipment are shown in Table 7. The process performance indicators are shown in Table 8.
From Table 6, it can be seen that the mass flow rate of the CO2 product corresponding to the CO2 stream is 1.28 kg/h, and the CO2 purity is 99.8%, which meets the design requirements in Table 2, indicating that the modeling results are usable. The energy consumption of carbon dioxide capture is 2.864 GJ/t CO2, which is 26.9% lower than that of 30 wt% MEA aqueous solution (3.92 GJ/t CO2) [18], indicating the significant advantages of using single-atom solvents for the CO2 absorption–desorption process. After process optimization, it can be further reduced.

4.3. Effect of Operating Parameters on Energy Consumption

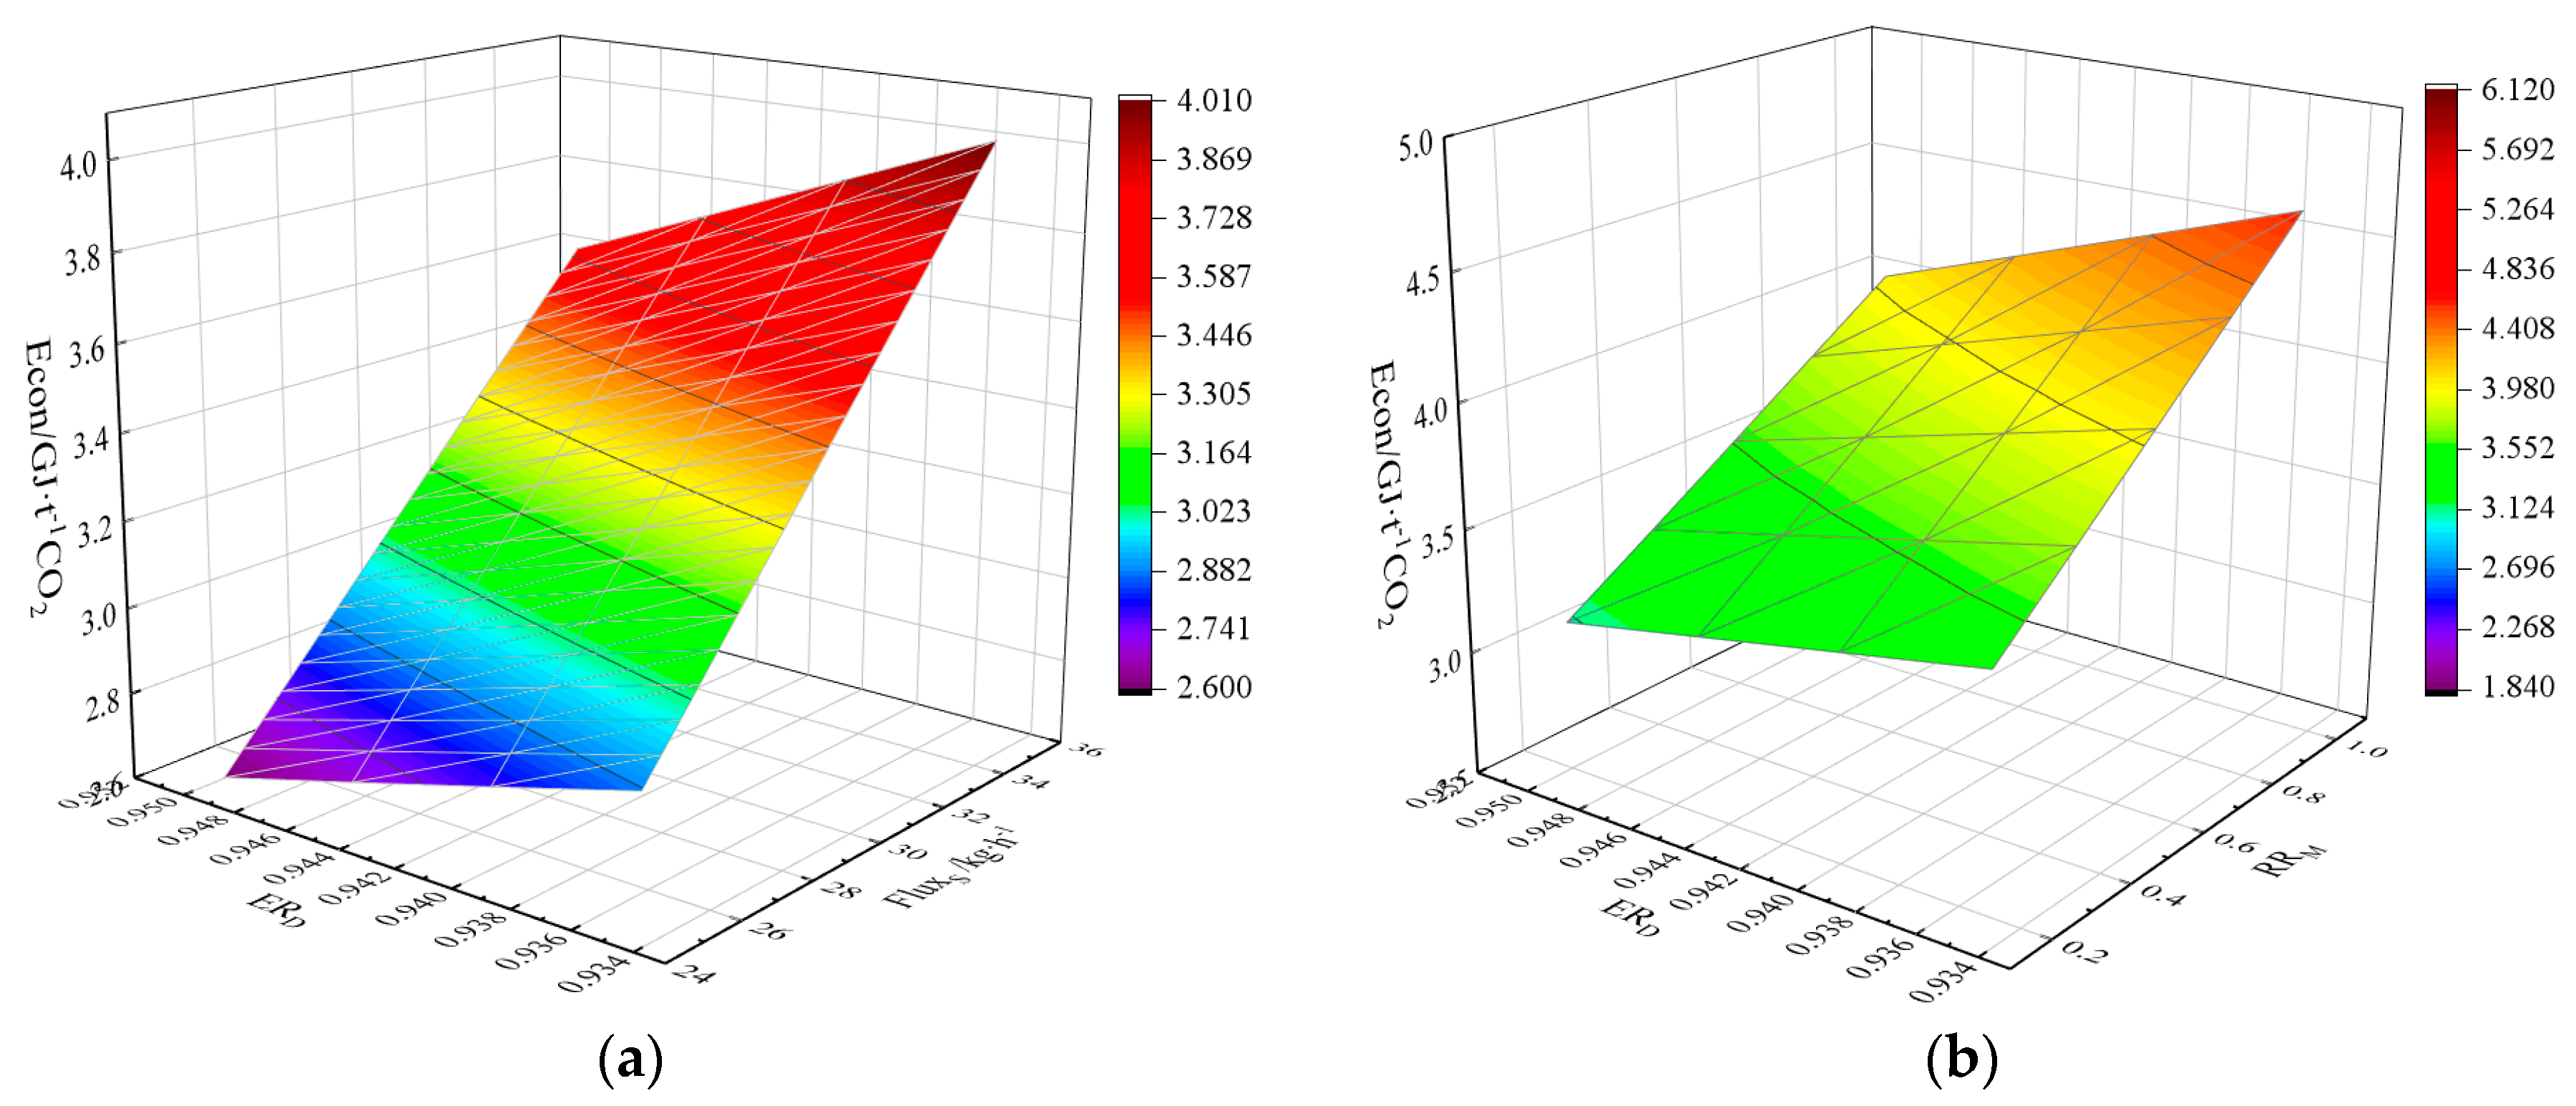
Figure 4 shows the response surface of the energy consumption with key operating parameters (ERD, FluxS, and RRM). From Figure 4a, it can be seen that as ERD increases from 0.935 to 0.95, the energy consumption decreases from about 4.0 to 2.6 GJ/t CO2. As FluxS increases from 25 to 35 kg/h, the overall energy consumption rises, and the surface tilts upward along the Y-axis direction. The lowest energy consumption is located in the lower left corner of the surface, at the maximum ERD (0.95) and the minimum FluxS (25 kg/h). This indicates that an increase in ERD and a decrease in FluxS are beneficial for reducing energy consumption. This is because when the extraction ratio increases, the decrease in liquid level at the bottom of the tower results in a decrease in the load of the reboiler [40,41]. An increase in the solvent feed flow rate to the absorber means an increase in the total amount of solvent entering the desorber. The reboiler must heat more solvent to complete CO2 desorption, resulting in an increase in the shared heat per unit product, which is consistent with the research findings in the literature [41,42].
Figure 4b shows that as ERD increases, energy consumption increases from approximately 3.0 to 5.0 GJ/t CO2. When the RRM increases, the energy consumption also increases significantly. At lower levels of ERD, the amplification effect of Econ by increasing RRM is more prominent. On the contrary, the lowest energy consumption zone is located in the lower left corner. Comparing the Z-axis range of Figure 4a, the increase in RRM has a greater impact on the increase in Econ than on the increase in FluxS, indicating that RRM has a more severe effect on energy consumption than FluxS.
Therefore, it can be concluded that, while meeting the requirements of CO2 capture rate and product purity, it is advisable to use higher ERD combined with lower FluxS and RRM, but the premise is to minimize the solvent flow rate and increase ERD to a limited extent while meeting the capture conditions.
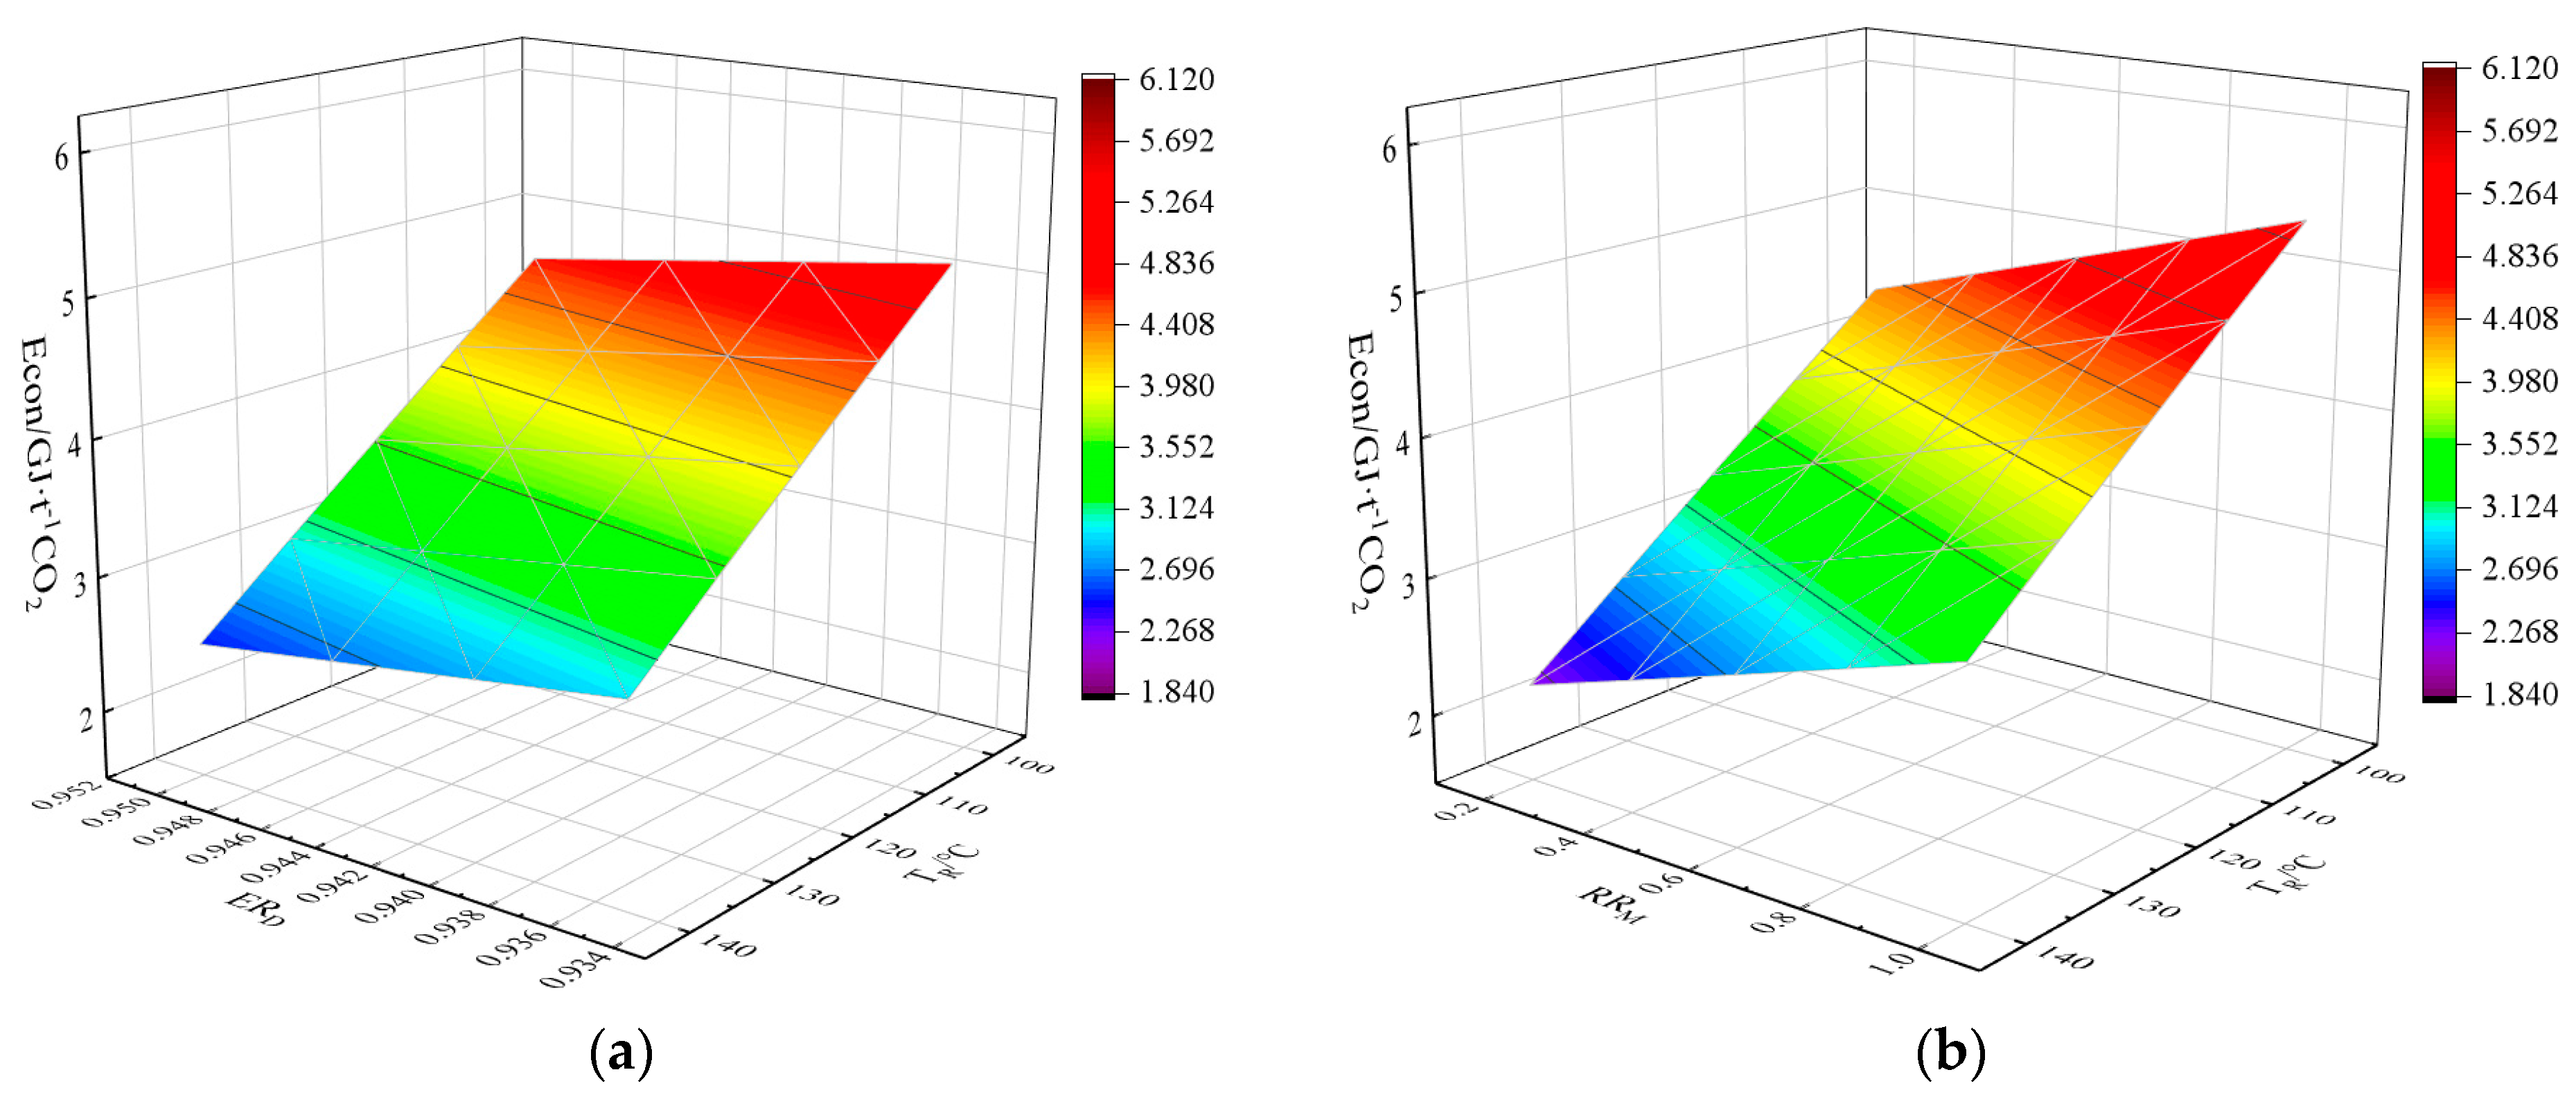
Figure 5 shows the response surface of the energy consumption per unit product of the desorber reboiler as a function of key operating parameters (ERD, RRM, and TR). From Figure 5a, it can be seen that as ERD increases, energy consumption increases from about 2.0 GJ/t CO2 to 5.5 GJ/t CO2, and as TR increases, energy consumption sharply decreases from about 6.0 GJ/t CO2 to about 2.0 GJ/t CO2. The slope of the surface along the TR direction (Y-axis) is much greater than the slope along the ERD direction (X-axis). When the TR decreases from 140 °C to 100 °C, the energy consumption increases by more than three times. When the TR is fixed, the ERD increases from 0.936 to 0.952, and the energy consumption increases by about 20–30%. Therefore, the impact of TR on Econ is greater than that of ERD. The lowest energy consumption can be as low as 1.84 GJ/t CO2.
From Figure 5b, when RRM increases from 0.2 to 1.0, the energy consumption increases by about 2–2.5 times, and the energy consumption amplification effect is more prominent at lower TR levels. Comparing Figure 5a, TR has the most significant pulling effect on energy consumption, followed by RRM, and ERD has the smallest impact on energy consumption. The higher the rich liquid temperature, the less additional heating heat gap the reboiler needs to provide, resulting in a decrease in the reboiler load [19]. However, when the reflux ratio decreases, the reboiler heat load significantly decreases because the liquid phase flow rate that needs to be vaporized and refluxed to maintain the separation accuracy inside the tower is significantly reduced, which is consistent with the research conclusions in the literature [43,44].
Therefore, it can be concluded that increasing ERD and TR while reducing RRM can reduce the unit product heat load of the reboiler, while meeting the requirements of CO2 capture rate and product purity.
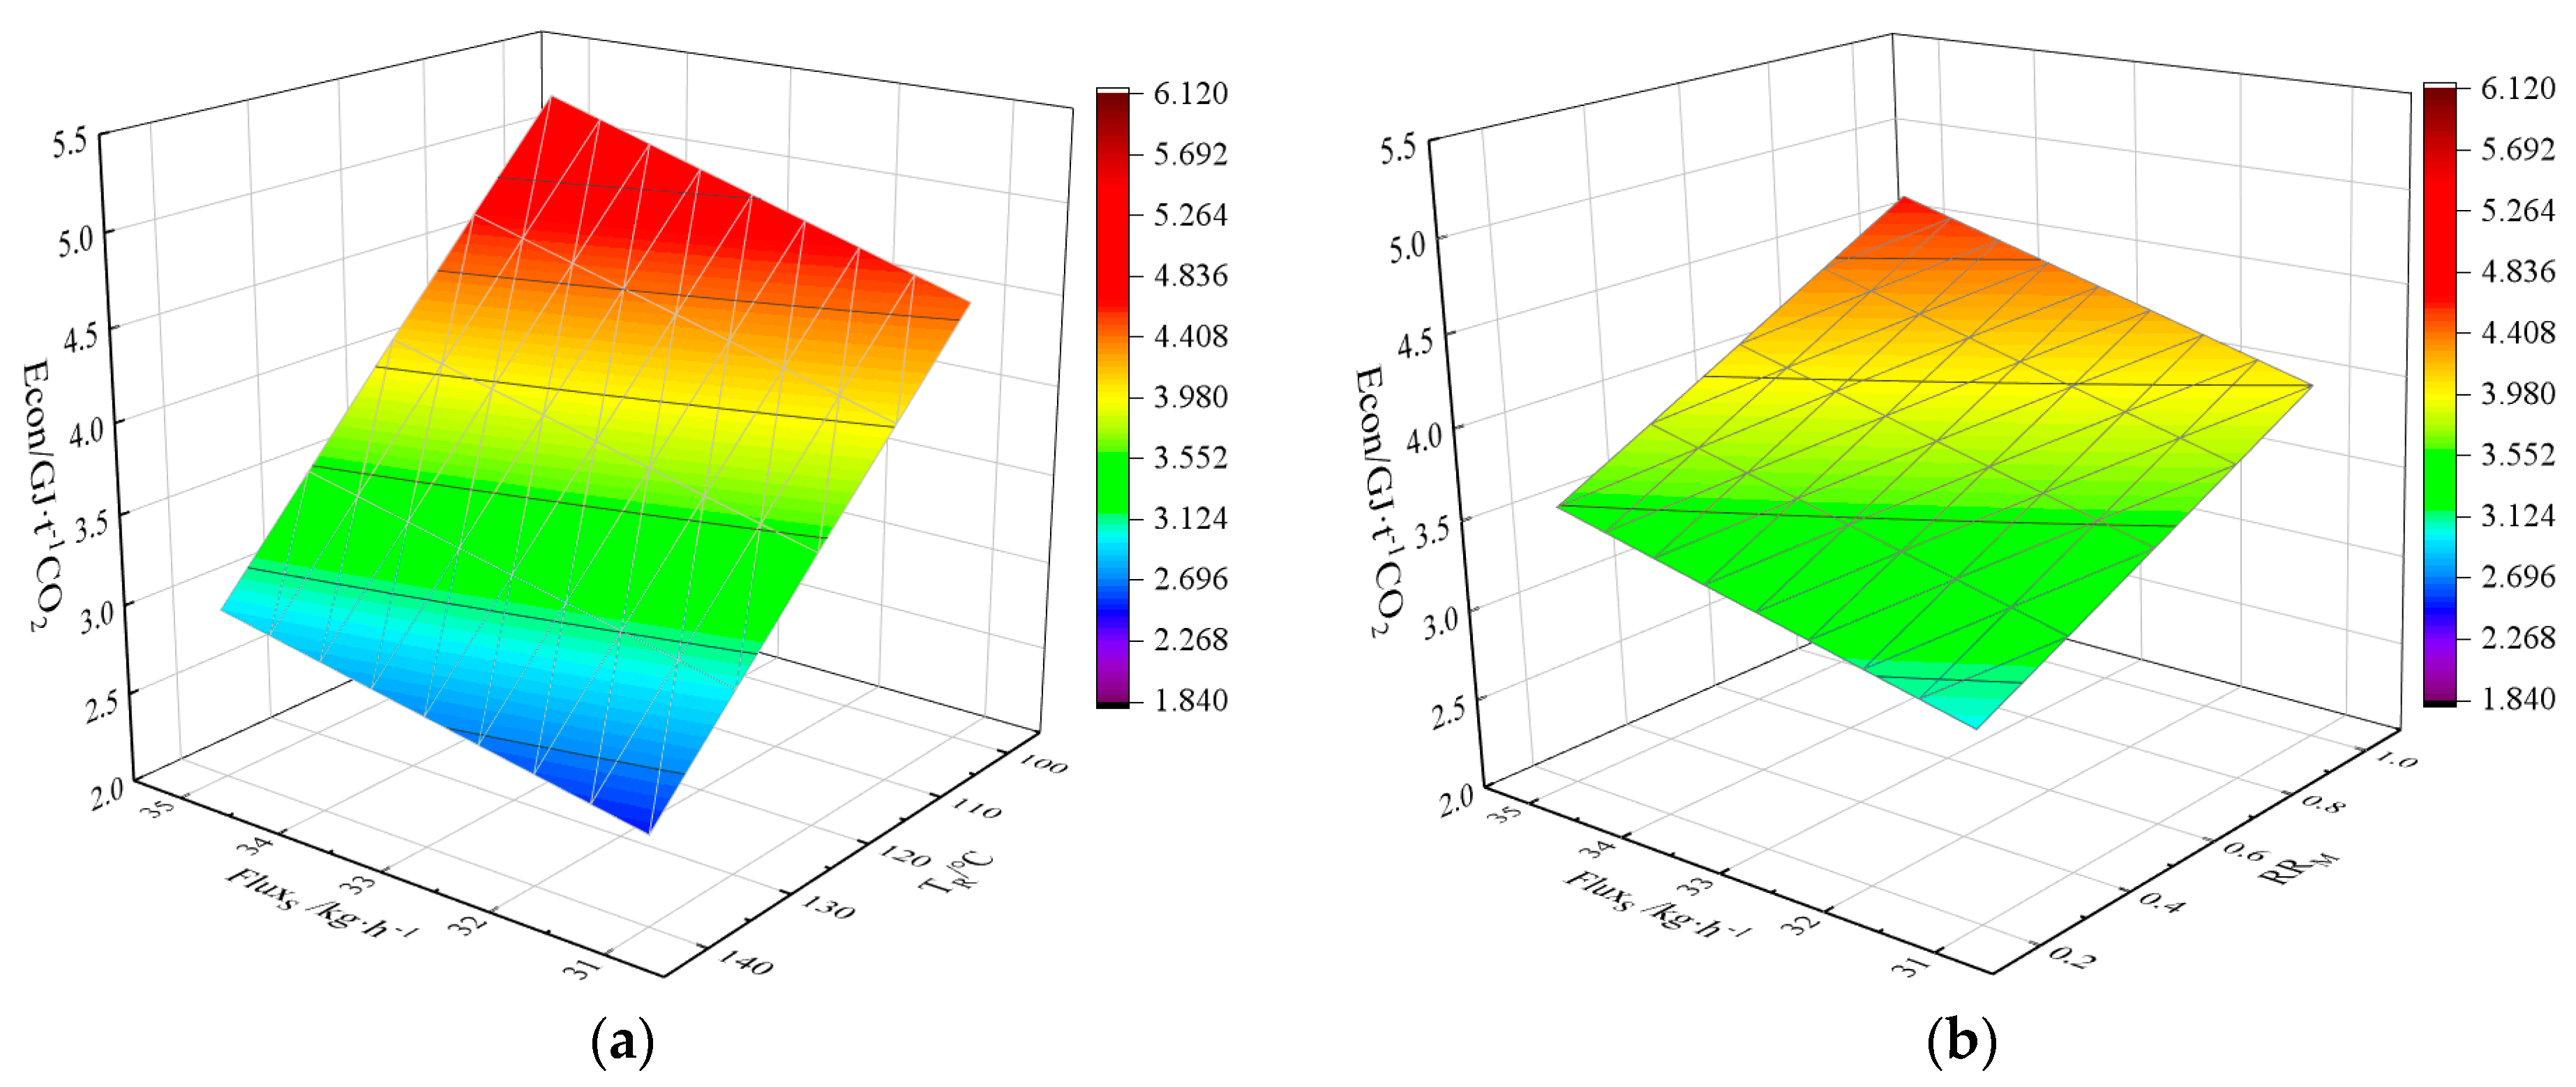
Figure 6 shows the response surface of the energy consumption per unit product of the desorber reboiler as a function of three key operating parameters (FluxS, TR, and RRM). From Figure 6a, it can be seen that when the solvent flow rate increases from 31 to 35 kg/h, the energy consumption increases from about 2.0 to about 5.5 GJ/t CO2. The slope of the surface along the TR direction (Y-axis) is much greater than the slope along the FluxS direction (X-axis). Under a fixed TR, FluxS increased from 31 to 35 kg/h, with an energy consumption increase of about 20–30%, indicating that TR has a greater impact on Econ than FluxS. The minimum energy consumption is 1.84 GJ/t-CO2, which is 35.8% lower than before optimization and 53.1% lower than 30 wt% MEA aqueous solution [18].
Similarly, from Figure 6b, it can be seen that when RRM increases from 0.2 to 1.0, the energy consumption increases by about 2–2.5 times. Comparing Figure 6a and Figure 6b, it can be clearly concluded that the increase in FluxS has a weaker effect on energy consumption than the decrease in TR and the increase in RRM. The increase in FluxS raises the reboiler duty because fresh solvent must be heated to the reboiler’s operating temperature. Although an increase in feed temperature is beneficial for reducing reboiler energy consumption, as the rich liquid temperature increases, it will cause more solvent thermal decomposition, thereby affecting the reabsorption effect of the rich liquid after desorbing CO2 and circulating it back to the absorber.
From Figure 4, Figure 5 and Figure 6, it can be concluded that there is a significant correlation between energy consumption and all investigated operating parameters. Among them, TR is the most sensitive to Econ, followed by the reflux ratio at the top of the desorber. The influence of ERD and FluxS is relatively weak. The ways to reduce the energy consumption of the regeneration tower while meeting the capture rate and CO2 product purity can be summarized as increasing TR and ERD, and reducing FluxS and RRM. From the optimization results of the response surface mentioned above, the energy consumption of the reboiler can be fully reduced to 1.84 GJ/t CO2. It is worth noting that in the actual engineering operation process, it is not enough to solely pursue the reduction in energy consumption of the regeneration tower reboiler. It is necessary to consider the energy consumption, economic performance, and environmental impact of the overall process. Therefore, the determination of the optimal operating parameters needs to be based on the results of multi-objective collaborative optimization.

4.4. Effect on 3E Performance

This section evaluates the impact of key parameters on the 3E (Energy–Economic–Environment) objective functions to analyze the optimization direction for improving the 3E objective functions.
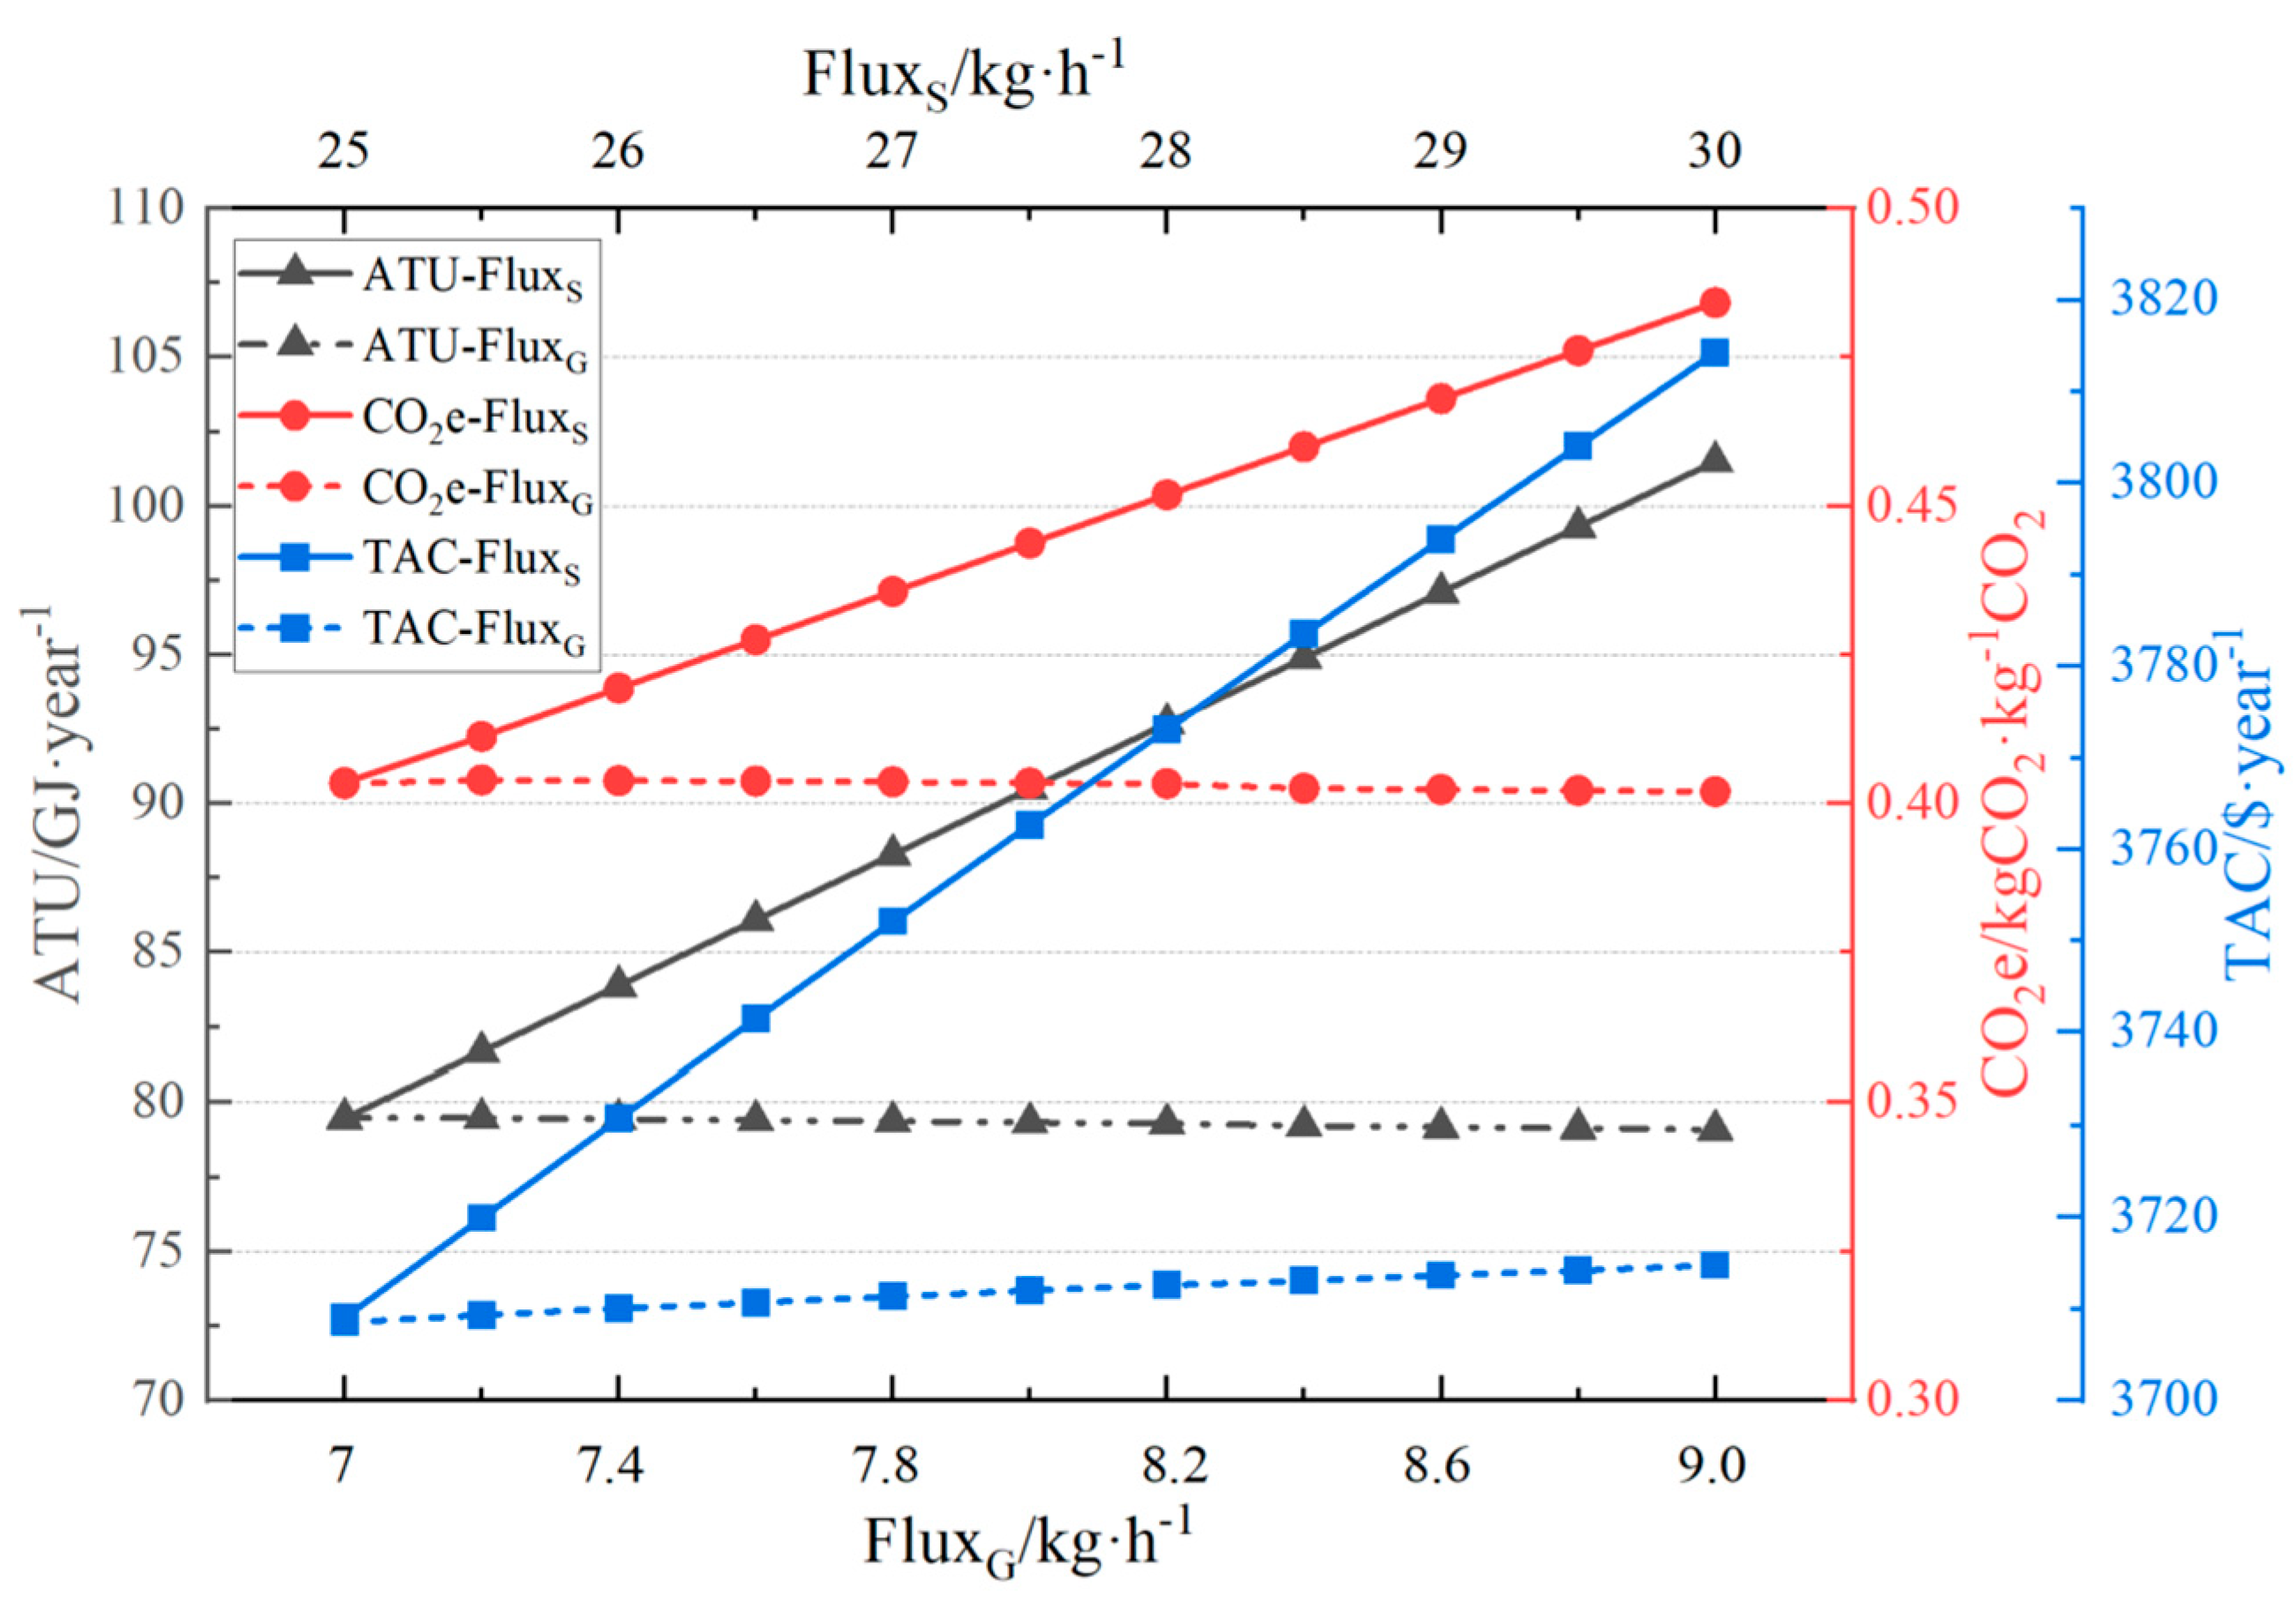
Figure 7 shows the influence of FluxS and FluxG on 3E objectives. ATU significantly increases with the increase in FluxS, from 2.75 to 3.5 kW. In contrast, with the increase in FluxG, ATU shows a slightly decreasing trend (reduced by about 0.5%) and remains almost unchanged. When FluxS increased from 25 to 30 kg/h, ATU increased linearly by about 27%. The increase in reboiler load is the main cause of the increase in ATU. When FluxG changes, ATU remains relatively constant, indicating that within the experimental range, the impact of gas flow rate changes on utility demand is offset by other factors.
CO2 e significantly increased with the increase in FluxS, from 0.40 to 0.48. In contrast, the carbon dioxide equivalent emissions slightly decreased and remained almost unchanged with the increase in FluxG. This is because although increasing the flow rate can improve the CO2 capture rate, increasing the solvent flow rate after the capture rate approaches 100% leads to an overall increase in reboiler heat load and the corresponding increase in heat utilities [19]. Therefore, CO2 e increases with the increase in FluxS. The change in gas flow rate has no significant impact on carbon emission intensity, indicating that the system has a certain robustness to gas load fluctuations.
TAC significantly increases with the increase in FluxS, with a slope of approximately 20 $/(kg·h−1). The increase in FluxG only leads to a slight increase in TAC, with a slope of approximately 2.5 $/(kg·h−1). As FluxS increases, the rise in system energy consumption leads to an increase in utility costs, resulting in an increase in TAC. Therefore, it can be concluded that FluxS is the most sensitive parameter for system economy and environmental performance [45]. FluxG has a weak impact on system performance within its range of variation, so it can be flexibly adjusted within a certain range in actual production to adapt to upstream flue gas flow fluctuations. As shown above, minimizing solvent circulation is the key to reducing system energy consumption and costs while meeting the CO2 capture rate.
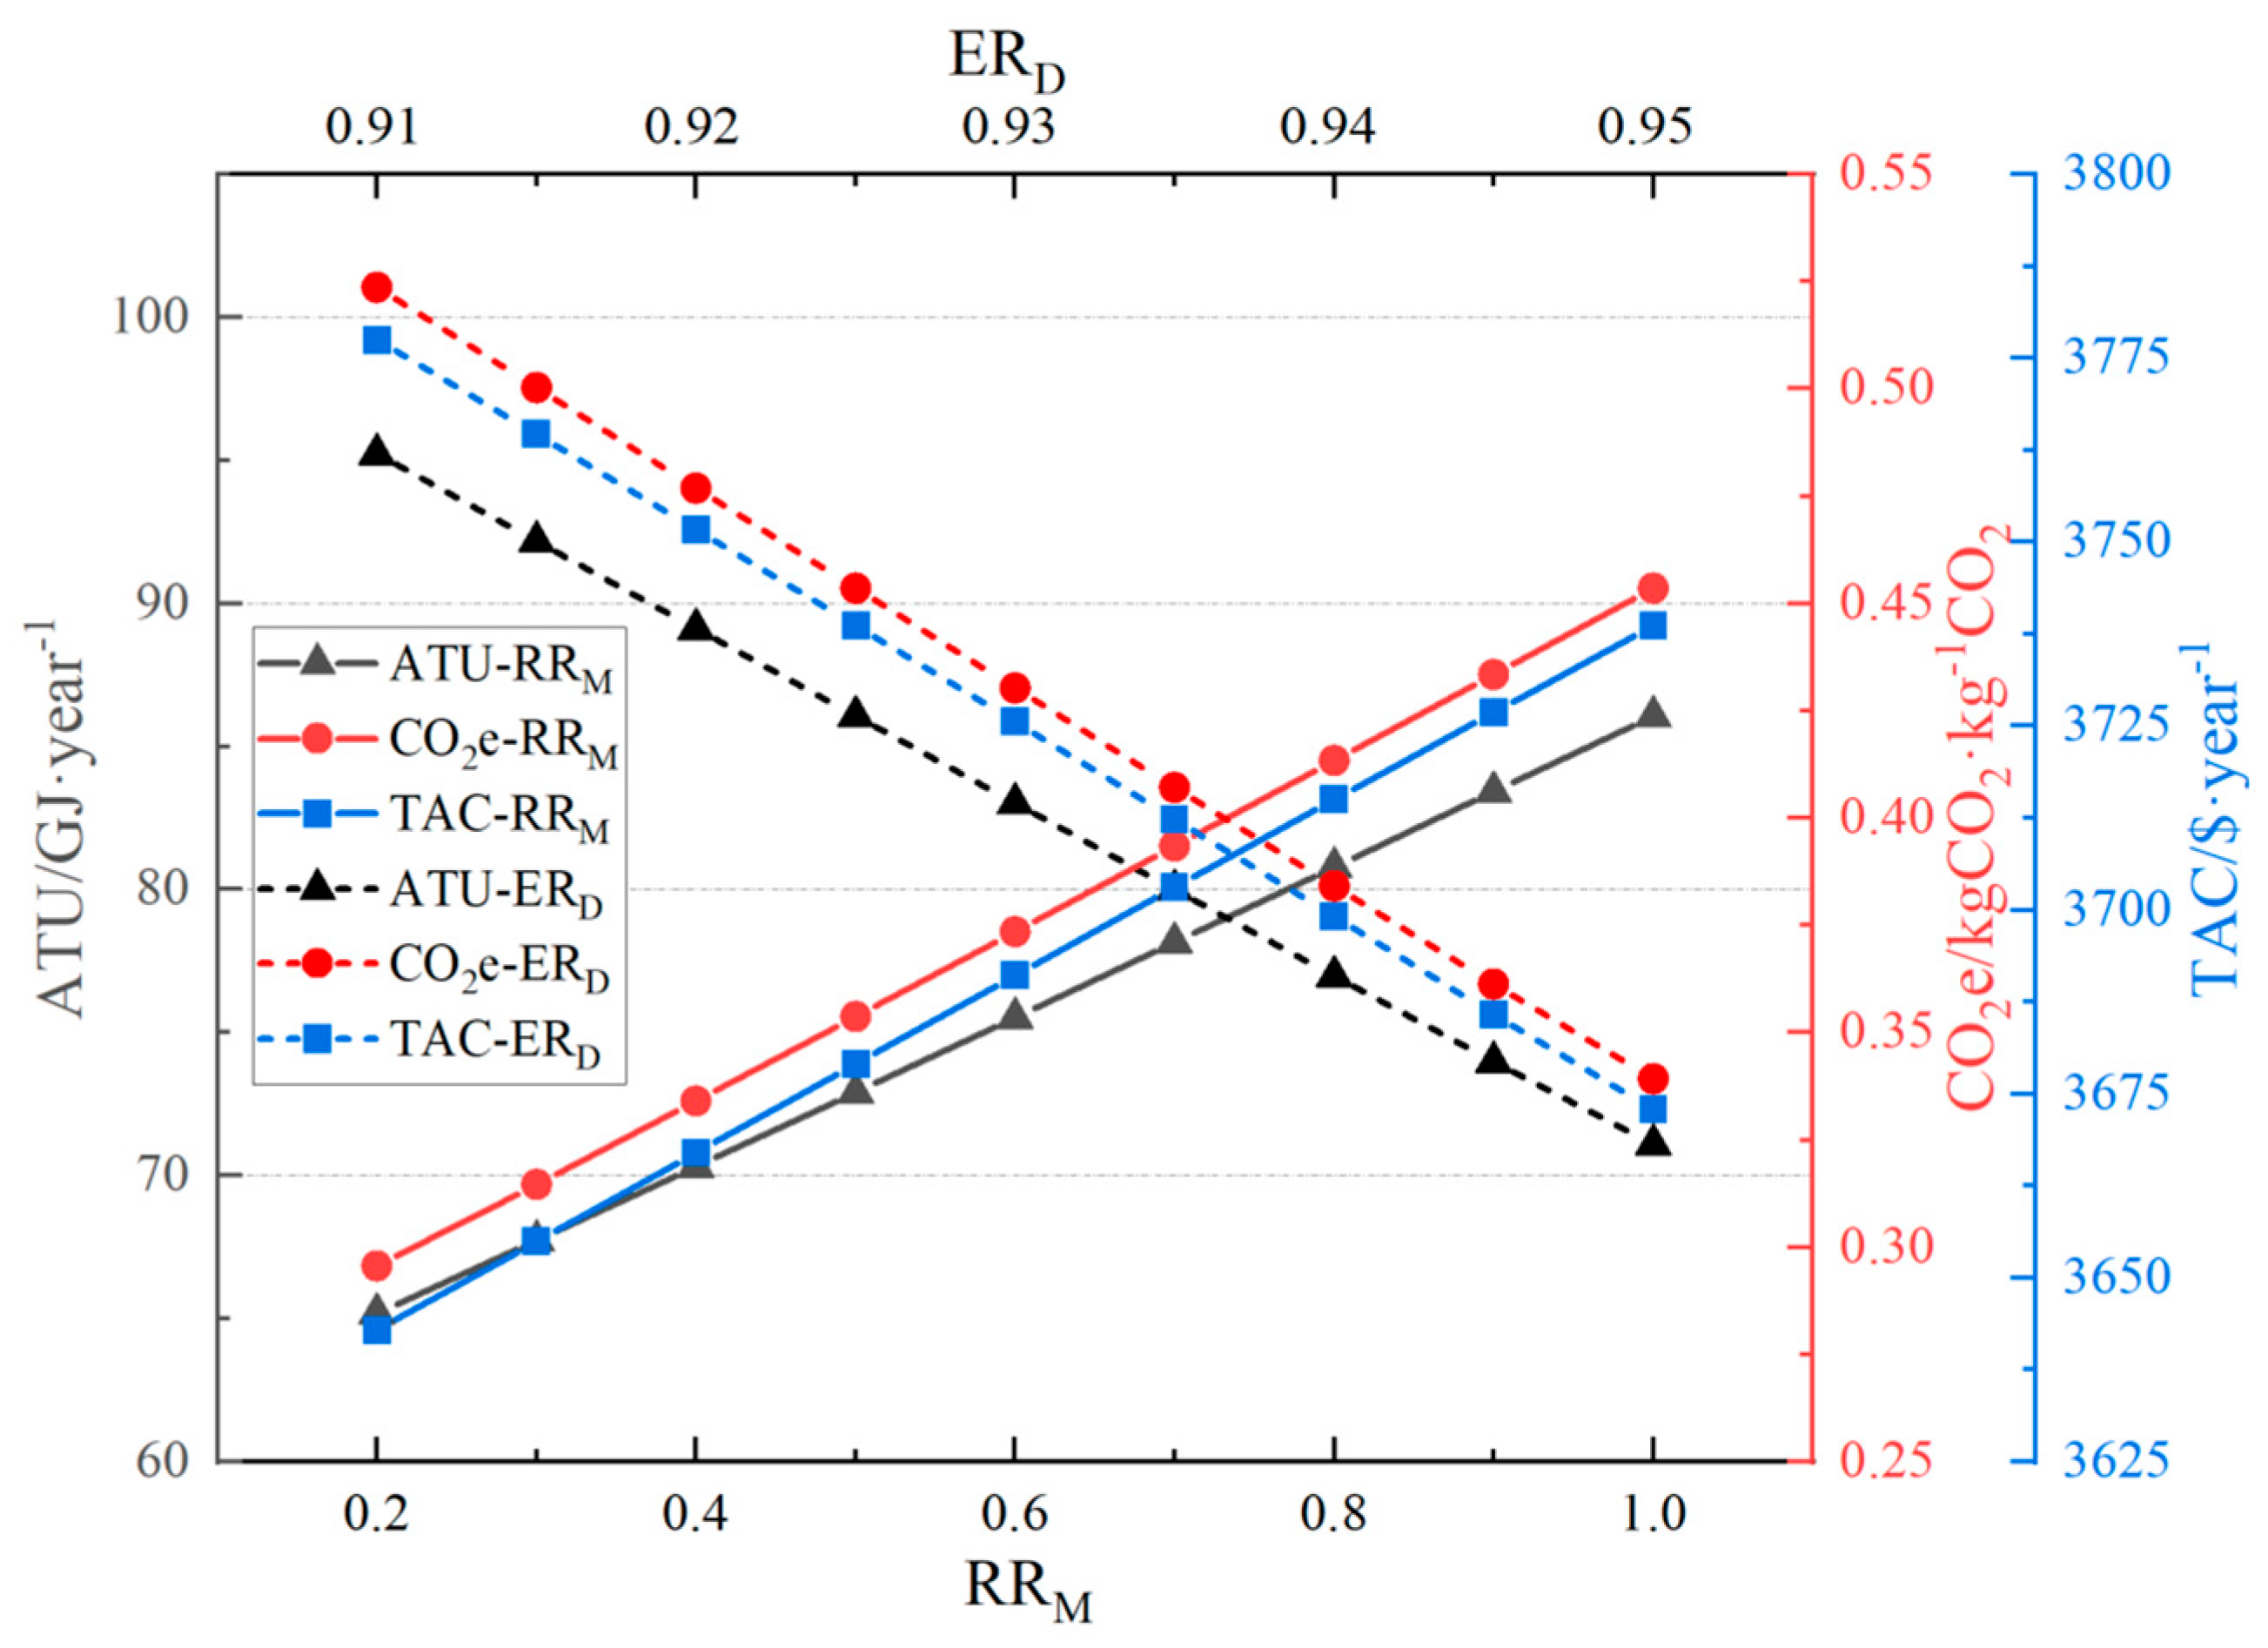
Figure 8 shows the influence of RRM and ERD on 3E objective functions. From the three solid lines in the figure, ATU, CO2 e, and TAC all significantly increase with the increase in RRM, with increases of about 33%, 61%, and 2.5%, respectively. Among them, CO2 e has the largest increase, indicating that the increase in reflux ratio directly converts the reboiler load into higher carbon emission intensity, which is consistent with published research conclusions [46]. Secondly, the ATU increased by 33%, which is consistent with the previous response surface graph in Section 4.3, where the increase in RRM led to a sharp increase in reboiler energy consumption.
From the three dashed lines in Figure 8, the increase in ERD, ATU, CO2 e, and TAC all show a decreasing trend, with reductions of 26%, 35%, and 2.6%, respectively. Among them, CO2 e is the most sensitive to ERD, indicating that increasing ERD can maximize system efficiency and effectively reduce CO2 e [19]. The reduction in ATU is 26%, which is consistent with the pattern in the response surface graph of Section 4.3, where an increase in ERD leads to a decrease in reboiler energy consumption. Therefore, an increase in ERD and a decrease in RRM can optimize the ATU, CO2 e, and TAC indicators.
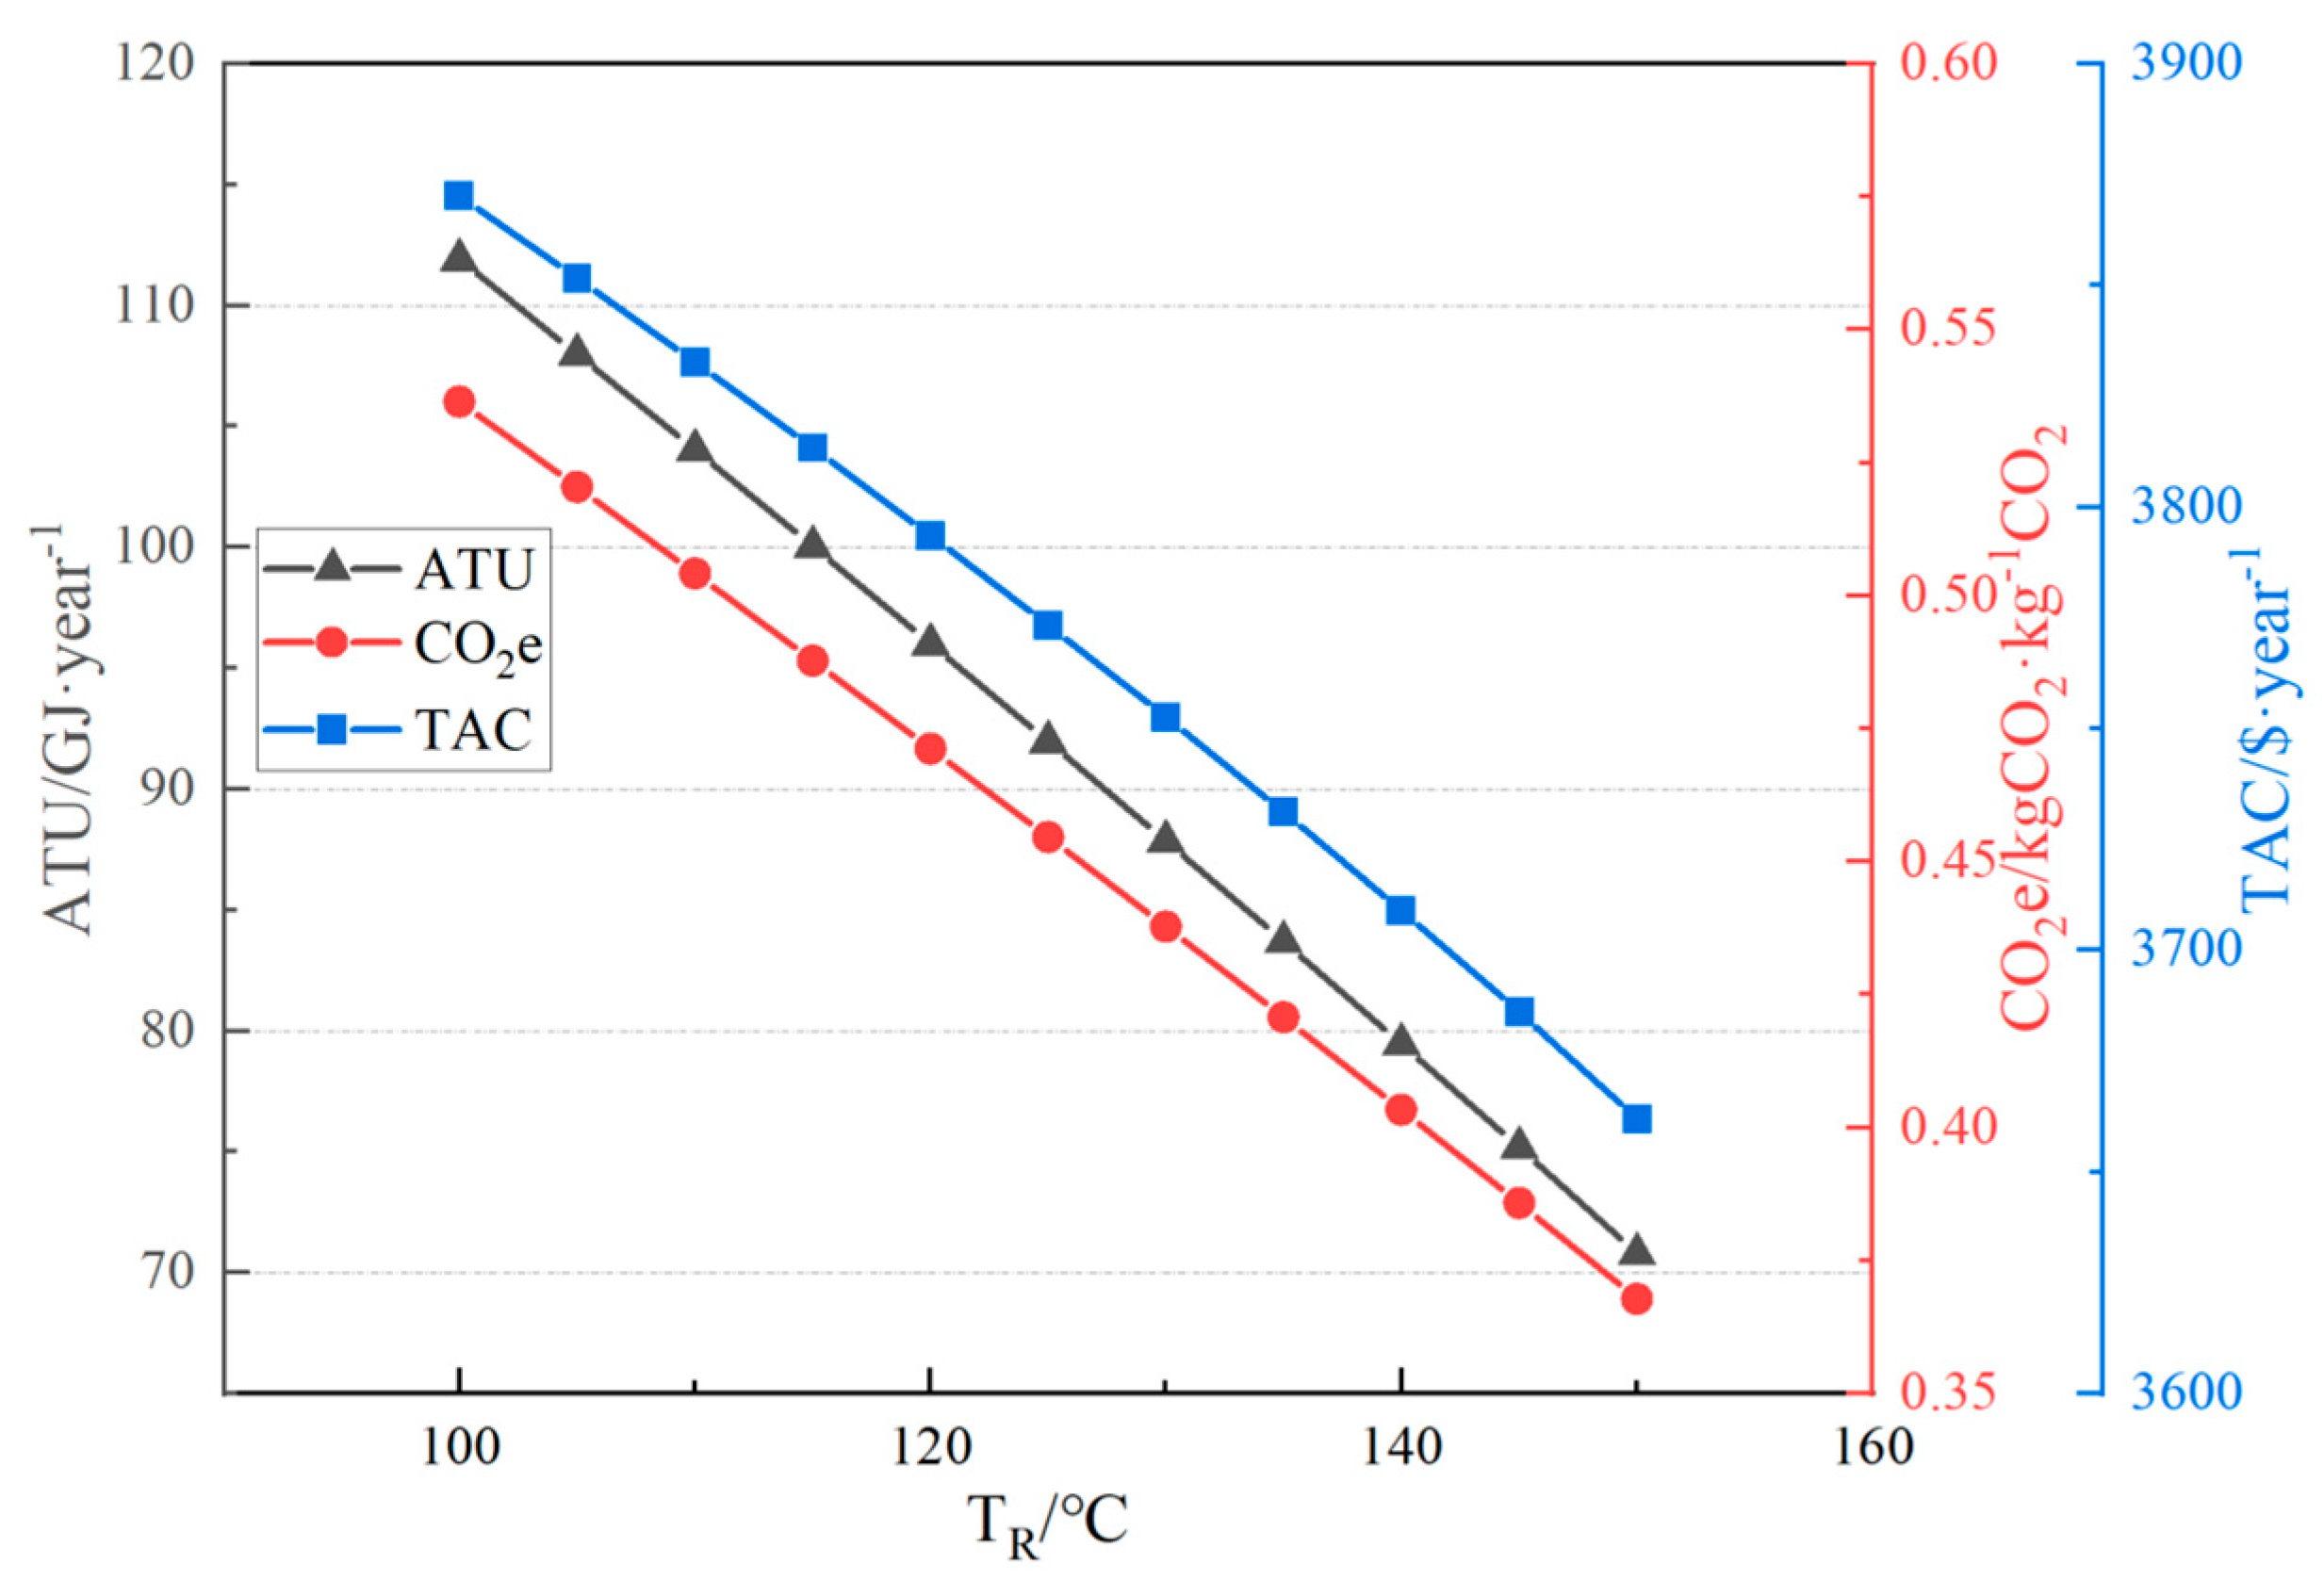
Figure 9 shows the influence of TR on 3E objective functions. From Figure 9, ATU, CO2 e, and TAC all show a decreasing trend with increasing TR, with decreases of 36%, 33%, and 4.9%, respectively. ATU is most sensitive to TR, with a decrease of 36%, indicating that the temperature of the rich solvent is a strongly correlated parameter for total energy consumption. CO2 e is highly sensitive to TR with a decrease of 33%, indicating that the reduction in energy consumption directly translates into a reduction in carbon emissions. The more complete the heat exchange is before the rich liquid enters the desorber, the less additional heat the reboiler needs to provide. At the same time, the amount of lean liquid cooling utility returning to the absorber decreases synchronously. It is worth noting that the high temperature of the rich liquid increases the risk of solvent pyrolysis. Therefore, while meeting the constraints of equipment corrosion and solvent degradation, increasing the temperature of the rich solution entering the desorber as much as possible is an effective strategy to reduce system energy consumption and costs.

4.5. Three Objective Functions Optimization

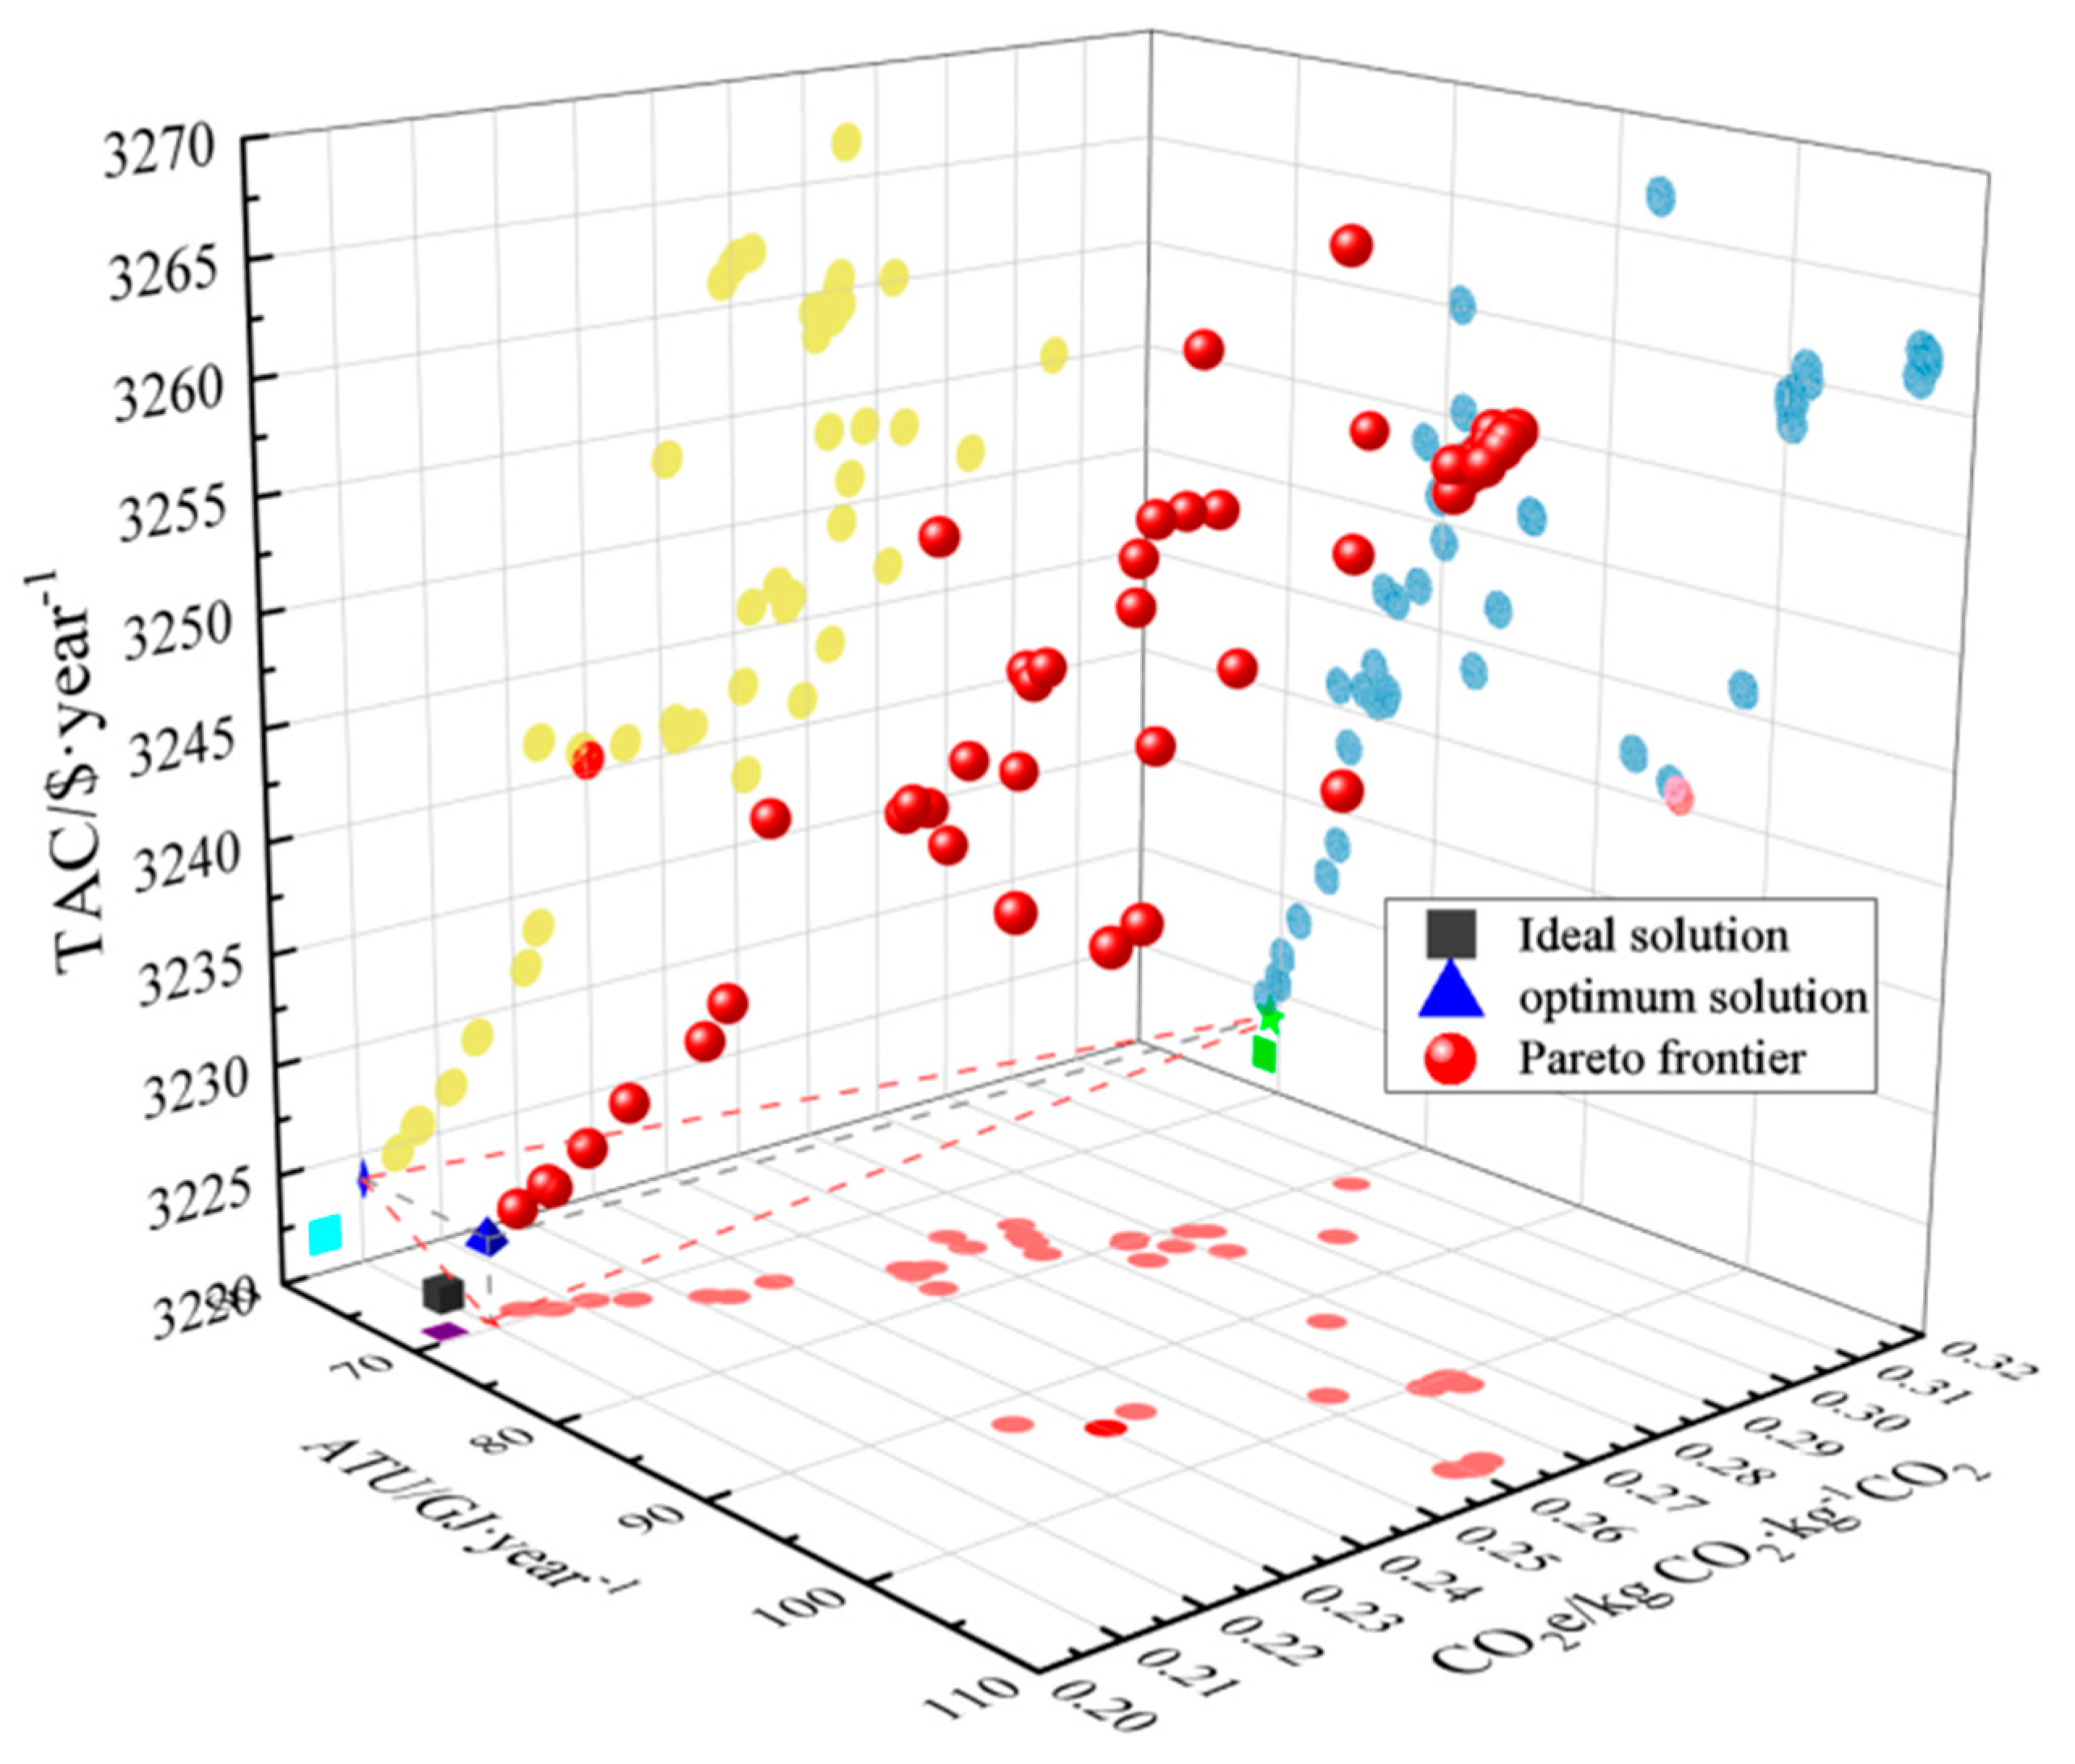
From Section 4.3 and Section 4.4, the influence trend of five parameters on the performance of Econ and 3E has been confirmed. To improve computational efficiency and convergence of NSGA-II, the range of using five operational parameters as decision variables for multi-objective optimization has been further improved. Table 9 lists the decision variables and constraints for the multi-objective optimization. The key operating parameters of the CO2 absorption–desorption system are optimized with the goal of minimizing ATU, CO2 e, and TAC. The Pareto front of the multi-objective optimization is obtained as shown in Figure 10. From Figure 10, the Pareto front exhibits a non-linear surface distribution, indicating a complex trade-off relationship among the three objectives. The front edge converges from the lower-left corner direction, which conforms to the typical characteristics of multi-objective optimization. The optimal solution is very close to the ideal solution, indicating that the NSGA-II optimization algorithm has found a high-quality compromise solution.
Table 10 shows the comparison between the manipulated variables and the objective function before and after multi-objective optimization. After calculation, the CO2 emission intensity after conversion is 0.210 kgCO2/kgCO2, which is 56.3–61.8% lower than the traditional MEA process (0.48–0.55) [4,47,48]. The decrease in CO2 e by 47.87% compared to before optimization indicates that the carbon footprint of the optimized system has almost halved, and the environmental benefits are most prominent. ATU and TAC have similar declines and are highly correlated, as utility costs are an important component of the annual total cost. By comparing the corresponding operating parameters, reducing the reflux ratio, moderately increasing the rich liquid temperature and extraction ratio, and flexibly adjusting the solvent and gas flow rates are the key paths to achieve economic–environmental synergistic optimization of the CO2 capture system, while meeting the requirements of CO2 capture rate and product purity.

5. Conclusions and Outlook

5.1. Conclusions

This work focuses on the single-atom solvent-enhanced CO2 capture process and conducts systematic research in three aspects: process modeling, energy consumption analysis, and multi-objective optimization. A steady-state process simulation model was established based on Aspen Plus, and the error between key parameters and the literature values was controlled within 3.5%. The CO2 capture rate reached 99%, verifying the reliability of the model. The influence of operating parameters was revealed through single-factor and response surface analysis. The study showed that the rich liquid temperature and reflux ratio were the most sensitive parameters for energy consumption, followed by solvent flow rate and gas flow rate. The method of coupling NSGA-II with process simulation was used for multi-objective Pareto optimization, and the optimal parameter set under economic–environment–energy optimal conditions was obtained. The optimal solution can reduce ATU by 12.75%, CO2 e by 47.87%, and TAC by 13.09%, achieving synergistic improvement in energy consumption, economic cost, and environmental impact. In summary, this study provides a systematic theoretical framework and optimization strategy for the scale-up application of single-atom solvent carbon capture technology.

5.2. Limitations of the Present Study

Although this study systematically modeled and multi-objective optimized the SAS-enhanced CO2 capture process, there are still the following limitations:
(1)
This study is based on the steady-state process simulation of an experimental platform with an annual capture capacity of about 10 tons, and has not yet conducted industrial-scale (such as coal-fired power plant level) scale-up research. The steady-state model is difficult to reflect the impact of load fluctuations, start-stop conditions, and dynamic disturbances on system performance in actual industrial operation.
(2)
The long-term stability and degradation mechanism of solvents have not been fully considered. The article points out that increasing the temperature of the rich solution (TR) can reduce system energy consumption, but at the same time, it will increase the risk of solvent thermal decomposition. However, this study has not yet quantitatively analyzed the thermal and oxidative degradation products of SAS during long-term cyclic operation, as well as their attenuation patterns on absorption performance.
(3)
The calculation of CO2 e in this study mainly focuses on indirect emissions related to system energy consumption and direct emissions from process streams and has not yet conducted a full life cycle assessment (LCA), which does not cover the implicit carbon emissions and environmental impacts during solvent production, transportation, waste treatment, and equipment manufacturing stages.

5.3. Future Research Directions

(1)
It is suggested to extend the existing steady-state model to industrial scale (such as the capture device for a 300 MW coal-fired unit) and establish a dynamic simulation model to investigate the effects of variable load operation, solvent circulation cumulative effects, and control strategies on system robustness, providing theoretical support for engineering scaling up.
(2)
Conduct degradation kinetics experiments of SAS under long-term thermal cycling conditions for solvent stability systems to clarify the types and generation rates of degradation products; develop anti-degradation additives or new carrier structures, establish solvent loss replenishment strategies, and ensure the long-term stable operation of industrial equipment.
(3)
Carry out a cradle-to-grave LCA study to comprehensively assess the environmental footprint of the entire process of solvent synthesis, plant construction, operation and maintenance, and decommissioning and disposal; introduce uncertainty analysis and sensitivity analysis to establish a more realistic economic evaluation model.

Author Contributions

Conceptualization, Y.L.; resources, Z.H. and L.X.; writing—original draft preparation, Y.L.; writing—review and editing, Y.L., Z.H., L.X., W.L., Y.J., Q.X., W.D. and T.L. All authors have read and agreed to the published version of the manuscript.

Funding

This work was supported by the Young Talent Fund of Xi’an Association for Science and Technology (Program No. 0959202513131) and Scientific Research Program Funded by Education Department of Shaanxi Provincial Government (Program No. 25JK0517).

Data Availability Statement

The data that support the findings of this study are available from the corresponding author upon reasonable request.

Conflicts of Interest

Author Lei Xue was employed by the company Xi’an Thermal Power Research Institute Co., Ltd. Author Qingwei Xue was employed by the company Beijing Petrochemical Engineering Co., Ltd. The remaining authors declare that the research was conducted in the absence of any commercial or financial relationships that could be construed as a potential conflict of interest.

Abbreviations

The following abbreviations are used in this manuscript:
30 wt% MEAMEA aqueous solvent with 30% mass fraction
ACCAnnual capital cost
ACCRAnnual capital charge ratio
ATUAnnual total utility consumption (GJ/year)
CCOPCash cost of production
CfPurchase cost of the feedstock
CcPurchase cost of the consumables
CO2 eCO2 equivalent emissions per unit of product (kg CO2/kg CO2)
CRCO2CO2 capture rate
CuHCopper hydride
Dcolumn diameter (m)
DMFN, N-Dimethylformamide
EaActivation energy of reaction (Cal/mol)
EconSpecific reboiler duty (GJ/t CO2)
ENRTL-RKElec-non-random two-liquid-Redlich–Kwong
ERDExtraction ratio of bottom of desorber
FCOPTotal annual fixed cost of production
FluxGFlue gas flow rate (kg/h)
FluxSSolvent flow rate (kg/h)
GASINCO2CO2 in flue gas (kg/h)
GASOUTCO2CO2 in tail gas emissions from absorber(kg/h)
hiSpecific enthalpy(kJ/mol)
kReaction rate constant
LINMAPLinear Programming Technique for Multidimensional Analysis of Preference
MDEAN-Methyldiethanolamine
MEAMonoethanolamine
miMass flow rate of stream i (kg/h)
niMolar flow rate (mol/s)
NSGA-IISecond-generation non-dominated sorting genetic algorithm
NTTheoretical number of trays.
PANIPolyaniline
PPPump power (kW)
ProCO2CO2 production (kg/h)
PZPiperazine
QHeat duty (kW)
QdutyHeat duty of utilities
QreboilerReboiler load of desorber (kW)
Q c The heat duty of the condenser (kW)
Q r The heat duty of the reboiler (kW)
Q H The heat duty of the heat exchanger (kW)
Q s e p The heat duty of the separator (kW)
RRMMass reflux ratio of top of desorber
SASSingle-atom solvent
TACTotal annual cost ($/year)
TCCTotal capital cost
TEMPO4-Hydroxy-TEMPO
TOTCO2 eAnnual total CO2 equivalent emissions (kg/year)
TRTemperature of the rich liquid ( °C)
VCOPTotal annual variable cost of production
WPower consumption (kW)
θCO2Global warming potential factor
ξCO2Emission factor of certain energy sources
φCO2Efficiency factor
ωFixed cost of production coefficient
T c Temperature differential of condenser
T r Temperature differential of reboiler
T H Temperature differential of heat exchanger

Appendix A

Table A1. The detailed information about NSGA-II used in multi-objective optimization.
Algorithmic ComponentDetail Provided
Population size60
Number of generations30
Crossover probability0.9
Mutation probability0.2
Crossover operatorSimulated Binary Crossover
Mutation operatorPolynomial Mutation
Distribution index for crossover20
Distribution index for mutation20
Initialization strategyRandom uniform sampling within variable bounds
Selection operatorBinary tournament selection
Constraint-handling procedureConstraint Dominance Principle
Stopping/convergence criterionMaximum number of generations
Random seedFixed to ensure reproducibility
Number of independent optimization runs10
Size of final non-dominated population60

References

  1. International Energy Agency. CO2 Emissions in 2023; IEA Publications: Paris, France, 2024. [Google Scholar]
  2. Bambi, P.D.R.; Pea-Assounga, J.B.B. Assessing the Influence of Land Use, Agricultural, Industrialization, CO2 Emissions, and Energy Intensity on Cereal Production. J. Environ. Manag. 2024, 370, 122612. [Google Scholar] [CrossRef] [Scilit]
  3. Dunyo, S.K.; Odei, S.A.; Chaiwet, W. Relationship between CO2 Emissions, Technological Innovation, and Energy Intensity: Moderating Effects of Economic and Political Uncertainty. J. Clean. Prod. 2024, 440, 140904. [Google Scholar] [CrossRef] [Scilit]
  4. Otitoju, O.; Oko, E.; Wang, , M. Technical and economic performance assessment of post-combustion carbon capture using piperazine for large scale natural gas combined cycle power plants through process simulation. Appl Energ 2021, 292, 116893. [Google Scholar] [CrossRef] [Scilit]
  5. Lv, Y.; Zhou, H.; Wang, J.; Wang, L.; Bi, J.; Zhao, W.; Zhang, H.; Ge, J. Techno-Economic and Environmental Feasibility Analysis of a Solar-Assisted Membrane Gas Absorption System for CO2 Capture from Power Plant Flue Gas with Flexible Operation. Appl. Therm. Eng. 2026, 288, 129637. [Google Scholar] [CrossRef] [Scilit]
  6. Du, J.; Liang, Q.; Xu, L.; Xu, H.; Li, C.; Liang, Y.; Wan, G.; Wang, G.; Sun, L. Technical Optimization and Energy Analysis of an Advanced Ammonia-Based CO2 Capture Process for Coal-Fired Power Plants. Energy 2026, 353, 141028. [Google Scholar] [CrossRef] [Scilit]
  7. Akachuku, A.; Osei, A.; Decardi-Nelson, B.; Srisang, W.; Pouryousefi, F.; Ibrahim, H.; Idem, R. Kinetics of the Catalytic Desorption of CO2 from Monoethanolamine (MEA) and Monoethanolamine and Methyldiethanolamine (MEA-MDEA). In Proceedings of the 13th International Conference on Greenhouse Gas Control Technologies, GHGT-13, Lausanne, Switzerland, 14–18 November 2016; Elsevier: Amsterdam, The Netherlands, 2017; pp. 1495–1505. [Google Scholar]
  8. Zhang, R.; Zhang, X.; Yang, Q.; Yu, H.; Luo, X. Analysis of the Reduction of Energy Cost by Using Mea-Mdea-Pz Solvent for Post-Combustion Carbon Dioxide Capture (PCC). Appl. Energy 2017, 205, 1002–1011. [Google Scholar] [CrossRef] [Scilit]
  9. Wu, Y.; Zhang, T.; Yu, Y.; Zhang, Z.; Wang, G. Nonaqueous Mixed Amine CO2 Capture Technology Based on N-Methylformamide. Energy Fuels 2024, 39, 559–570. [Google Scholar] [CrossRef] [Scilit]
  10. Afkhamipour, M.; Shamsi, M.; Mousavian, S.; Borhani, T.N. Intensified CO2 Absorption Process Using a Green Solvent: Rate-Based Modelling, Sensitivity Analysis, and Scale-Up. Processes 2025, 13, 3774. [Google Scholar] [CrossRef] [Scilit]
  11. Tian, Q.; Nie, W.; Niu, W.; Li, R.; Li, Y.; Akanyange, S.N. Phase-Change Ionic Liquid-Based CO2 Absorbents Incorporating Amino Acid-Coupled Solvents: Synergistic Effects and Capture Mechanisms. Chem. Eng. J. 2026, 529, 172794. [Google Scholar] [CrossRef] [Scilit]
  12. Zhou, J.; Deissenroth-Uhrig, M.; Gallei, M. Advances in stimuli-responsive organic materials and polymers toward intelligent CO2 capture. Adv. Funct. Mater. 2026, 36, 2520959. [Google Scholar] [CrossRef] [Scilit]
  13. Yang, X.; Yang, Z.; Wang, W.; Zhang, W.; Li, Z.; Liu, T. Synergistic Interaction-Regulated Selective Carbon Dioxide Adsorption of Amino-Functionalized Porous Organic Polymers. J. Environ. Chem. Eng. 2025, 13, 114452. [Google Scholar] [CrossRef] [Scilit]
  14. Ravi, S.; Choi, Y.; Bae, Y.-S. Melamine-Functionalized Aromatic Carbonyl-Based Polymer with High Surface Area for Efficient CO2 Capture. Sep. Purif. Technol. 2023, 317, 123828. [Google Scholar] [CrossRef] [Scilit]
  15. Bakırcıoğlu, V.; Jond, H.B.; Yilmaz, F. Multi-Objective Optimization and Thermodynamic Analysis of a Supercritical CO2 Brayton Cycle in a Solar-Powered Multigeneration Plant for Net-Zero Emission Goals. Energy Convers. Manag. 2025, 328, 119628. [Google Scholar] [CrossRef] [Scilit]
  16. Eslick, J.C.; Miller, D.C. Comparisons of Amine Solvents for Post-Combustion CO2 Capture: A Multi-Objective Analysis Approach. Energy Procedia 2013, 37, 2107–2116. [Google Scholar] [CrossRef] [Scilit]
  17. Khaidzir, M.A.M.; Ahmad, A.; Mohamed, N.H.; Mat, R. Integrated Optimization Framework for Carbon Dioxide Capture and Utilization. Chem. Eng. Res. Des. 2024, 200, 456–468. [Google Scholar] [CrossRef] [Scilit]
  18. Wang, D.; Liu, L.; Xie, J.; Yang, Y.; Zhou, H.; Fan, X. A Coupling Calculation Method of Desorption Energy Distribution Applied to CO2 Capture by Chemical Absorption. Processes 2024, 12, 187. [Google Scholar] [CrossRef] [Scilit]
  19. Dey, A.; Balchandani, S. Effect of Various Key Process Parameters on the Reboiler Heat Duty of CO2 Capture Unit Using Single and Blended Amine System. In Proceedings of the International Conference on Thermal Engineering: Theory and Applications, Gandhinagar, India, 23–26 February 2019. [Google Scholar]
  20. Li, Y.; Chen, Z.; Ren, M.; Dai, Y.; Jing, Q.; Xing, L.; Wang, L. Asymmetrically Coordinated Ni Single-Atom Catalysts for Accelerated Amine Regeneration in CO2 Capture. Sep. Purif. Technol. 2026, 404, 138812. [Google Scholar] [CrossRef] [Scilit]
  21. Wu, Y.; Zhou, C.; Li, Y.; Zhang, C.; Yu, Y.; Wang, G. Characterizing the 2D Single Atom Solutions to Capture CO2 by the Digital Twin Model. Chem. Eng. J. 2024, 493, 152584. [Google Scholar] [CrossRef] [Scilit]
  22. Zhou, C.; Yu, Y.; Zhang, C.; Zhang, J.; Zhang, Z.; Wang, G.G.X. CO2 Capture Intensified by Solvents with Metal Hydride. Fuel Process. Technol. 2021, 218, 106859. [Google Scholar] [CrossRef] [Scilit]
  23. Qinghua, L.; Sam, T.; Assiri, M.A.; Huaigang, C.; Russell, A.G.; Hertanto, A.; Radosz, M.; Fan, M. Catalyst-TiO(OH)2 Could Drastically Reduce the Energy Consumption of CO2 Capture. Nat. Commun. 2018, 9, 2672. [Google Scholar] [CrossRef] [Scilit]
  24. Li, Y.; Zhang, J.; Yu, Y.; Zhang, Z. Process Optimization Study on Single Atom Solutions for CO2 Capture and Methanation Based on Experiment and Simulation. Chem. Eng. J. 2025, 506, 160064. [Google Scholar] [CrossRef] [Scilit]
  25. Sheng, J.; Wu, Y.; Yu, Y.; Zhang, Z.; Wang, G. Numerical Simulation of CO2 Absorption Process by Mixture of MEA and Single Atom Solution in Hole Jet Reactor. Fuel 2025, 396, 135334. [Google Scholar] [CrossRef] [Scilit]
  26. Li, Y.; Zhang, C.; Zhang, T.; Ma, P.; Yu, Y.; Zhang, Z.; Wang, G.G.X. Experimental and DFT Study on Single Atom Solution for Carbon Dioxide Methanation. Fuel 2023, 351, 128911. [Google Scholar] [CrossRef] [Scilit]
  27. Zhang, C.; Zhou, C.; Li, Y.; Yu, Y.; Zhang, J.; Zhang, Z.; Wang, G. Single Atom Solutions for Carbon Dioxide Capture. J. Chem. Phys. 2023, 158, 084309. [Google Scholar] [CrossRef] [Scilit]
  28. Shen, J.; Li, J.; Bao, Q.; Cui, Z.; Gao, D. A Study on the Solubility of Carbon Dioxide in Dimethylformamide under Superatmospheric Pressures. Huagong Xuebao 1988, 39, 716–722. [Google Scholar]
  29. Duran-Valencia, C.; Valtz, A.; Galicia-Luna, L.A.; Richon, D. Isothermal Vapor-Liquid Equilibria of the Carbon Dioxide (CO2)-N, N-Dimethylformamide (Dmf) System at Temperatures from 293.95 K to 338.05 K and Pressures up to 12 MPa. J. Chem. Eng. Data 2001, 46, 1589–1592. [Google Scholar] [CrossRef] [Scilit]
  30. Wu, T.; Wang, C.; Liu, J.; Zhuang, Y.; Du, J. Design and 4E Analysis of Heat Pump-Assisted Extractive Distillation Processes with Preconcentration for Recovering Ethyl-Acetate and Ethanol from Wastewater. Chem. Eng. Res. Des. 2024, 201, 510–522. [Google Scholar] [CrossRef] [Scilit]
  31. Zhang, S.; Li, K.; Zhu, P.; Dai, M.; Liu, G. An Efficient Hydrogen Production Process Using Solar Thermo-Electrochemical Water-Splitting Cycle and Its Techno-Economic Analyses and Multi-Objective Optimization. Energy Convers. Manag. 2022, 266, 115859. [Google Scholar] [CrossRef] [Scilit]
  32. Meunier, N.; Chauvy, R.; Mouhoubi, S.; Thomas, D.; De Weireld, G. Alternative Production of Methanol from Industrial CO2. Renew. Energy 2020, 146, 1192–1203. [Google Scholar] [CrossRef] [Scilit]
  33. Xia, W.; Lau, S.K.; Yong, W.F. Comparative Life Cycle Assessment on Zeolitic Imidazolate Framework-8 (ZIF-8) Production for CO2 Capture. J. Clean. Prod. 2022, 370, 12. [Google Scholar] [CrossRef] [Scilit]
  34. Li, Q.; Machida, H.; Ren, X.; Feng, Z.; Norinaga, K. Design and Optimization of the Flexible Poly-Generation Process for Methanol and Formic Acid from CO2 Hydrogenation under Uncertain Product Prices. Int. J. Hydrog. Energy 2024, 54, 635–651. [Google Scholar] [CrossRef] [Scilit]
  35. Wang, H.; Zhu, P.; Dai, M.; Wu, X.; Yang, F.; Zhang, Z. A Novel Coal-Based Calcium Carbide-Acetylene System Process Based on Multistage Carbon Capture and Waste Slag Recycling Design: A Multiobjective Optimization Evaluation Perspective. Ind. Eng. Chem. Res. 2022, 62, 571–585. [Google Scholar] [CrossRef] [Scilit]
  36. Obi, D.; Onyekuru, S.; Orga, A. Minimizing Carbon Capture Costs in Power Plants: A Dimensional Analysis Framework for Optimizing Hybrid Post-Combustion Systems. Energy Sci. Eng. 2025, 13, 2247–2261. [Google Scholar] [CrossRef] [Scilit]
  37. Plakia, A.; Panagiotopoulou, C.; Grammelis, P. Thermodynamic and Process Modeling of CO2 Chemical Absorption Process Using Aqueous Monoethanolamine and Enzymatic Potassium Carbonate Solvents: Validation and Comparative Analysis. Energies 2025, 18, 2981. [Google Scholar] [CrossRef] [Scilit]
  38. Luo, X.; Wang, M. Improving Prediction Accuracy of a Rate-Based Model of an MEA-Based Carbon Capture Process for Large-Scale Commercial Deployment. Engineering 2017, 3, 232–243. [Google Scholar] [CrossRef] [Scilit]
  39. Sultan, H.; Bhatti, U.H.; Muhammad, H.A.; Nam, S.C.; Baek, I.H. Modification of Postcombustion CO2 Capture Process: A Techno-Economic Analysis. Greenh. Gases Sci. Technol. 2021, 11, 165–182. [Google Scholar] [CrossRef] [Scilit]
  40. Najib Meftah Almukhtar, O.; Abtesam, A.; Muhend, M.; Ruqaia Abuajil, S. Optimization of Energy Efficiency in Amine Regeneration Using a Novel Side Draw Flow Modification Method. Afr. J. Adv. Pure Appl. Sci. 2025, 4, 41–55. [Google Scholar] [CrossRef]
  41. Li, Y.; Wang, H.; Yu, Y.; Zhang, Z. 4e Evaluation and Multi-Objective Optimization of Low Concentration Flue Gas CO2 Capture and Multi-Product Conversion Process. Sep. Purif. Technol. 2025, 359, 130625. [Google Scholar] [CrossRef] [Scilit]
  42. Assaf, J.C.; Issa, C.; Flouty, T.; El Marji, L.; Nakad, M. Simulation and Optimization of Dry Ice Production Process Using Amine-Based CO2 Capture and External Ammonia Refrigeration. Processes 2025, 13, 3209. [Google Scholar] [CrossRef] [Scilit]
  43. Al-Hemaid, M. Energy Optimization of CO2-Removal Amine Process by Increasing Stripper Pressure. In Proceedings of the GPA Europe Technical Conference, GPA Europe, Athens, Greece, 21–23 September 2019. [Google Scholar]
  44. Kim, I.; Hoff, K.A.; Mejdell, T. Heat of Absorption of CO2 with Aqueous Solutions of MEA: New Experimental Data. Energy Procedia 2014, 63, 1446–1455. [Google Scholar] [CrossRef] [Scilit]
  45. Bellal, A.; Ben Moussa, F.; Bellal, S.E. Energy-Saving and Detailed Techno-Economic Assessment of the CO2 Avoided Cost for Emerging Designs of a Solvent-Based CO2 Capture Facility. Energies 2025, 18, 5608. [Google Scholar] [CrossRef] [Scilit]
  46. Le Moullec, Y.; Kanniche, M. Improved CO2 Capture Process: Rich Vapor Recompression with Split Flow. In Proceedings of the AIChE Annual Meeting, Atlanta, GA, USA, 16–21 November 2014. [Google Scholar]
  47. Kim, H. Recent Studies on CO2 Capture Energy Consumption. Energy 2017, 120, 669–680. [Google Scholar] [CrossRef] [Scilit]
  48. Leung, D.Y.C.; Caramanna, G.; Maroto-Valer, M.M. An Overview of Current Status of Carbon Dioxide Capture and Storage Technologies. Renew. Sustain. Energy Rev. 2014, 39, 426–443. [Google Scholar] [CrossRef] [Scilit]
Figure 1. Simulation of SAS-enhanced carbon dioxide capture process.
Processes 14 02856 g001
Figure 2. Thermodynamic model results vs. experimental data for the SAS-CO2 system.
Processes 14 02856 g002
Figure 3. Framework of NSGA-II coupled with Aspen Plus for multi-objective optimization.
Processes 14 02856 g003
Figure 4. Response surface of Econ as fuctions of (a) ERD−FluxS and (b) ERD−RRM pairs.
Processes 14 02856 g004
Figure 5. Response surface of Econ as functions of (a) ERD−TR and (b) RRM−TR.
Processes 14 02856 g005
Figure 6. Response surface of Econ as functions of (a) FluxS−TR and (b) FluxS−RRM.
Processes 14 02856 g006
Figure 7. The influence of FluxS and FluxG on 3E objective functions.
Processes 14 02856 g007
Figure 8. The influence of RRM and ERD on 3E objective functions.
Processes 14 02856 g008
Figure 9. The influence of TR on 3E objective functions.
Processes 14 02856 g009
Figure 10. Pareto front of the 3E-objective optimization.
Processes 14 02856 g010
Table 1. Summary of the advantages of single-atom solvents in carbon capture processes.
CharacteristicAdvantageNote
Absorption reactionFast absorption rate and large absorption capacity [20,23]It is suitable for low-concentration CO2 capture in coal-fired power plants
Desorption reactionThe heat of the desorption reaction is 55.5 kJ/mol [24]Compared with 30 wt% MEA aqueous solution, it decreased by 30.8%
Energy consumption for regeneration2.0–2.5 GJ/t CO2 [25]Energy consumption values verified through small-scale and pilot-scale experiments.
Table 2. Basic design parameters and design requirements.
ParametersUnitValue
Flue gas components
(Volume fraction)
/CO2: 0.125, O2: 0.068, N2: 0.807
Flow ratekg/h7.15
Temperature°C40
PressureMPa0.1
CO2 capture rate%99
Solvent components
(Mass fraction)
/MEA: 0.3, DMF: 0.6974, PANI: 0.001, TEMPO: 0.0001, CuH: 0.00159, H2O: 1 × 10⁻⁵
Annual operating hoursh8000
Annual CO2 capture capacityTon/year~10
CO2 products purity%>99
Table 3. Chemical reactions and kinetic parameters involved in this work.
ReactionTypekEa (Cal/mol)
MEA+ + H2O MEA + H3O+EQUIL//
H2O OH + H+EQUIL//
HCO3  CO32− + H+EQUIL//
CO2 + OH  HCO3KINETIC4.32 × 101313,249
HCO3  CO2 + OHKINETIC2.38 × 101729,451
MEA + CO2  MEACOO + H+KINETIC9.77 × 10109855.8
MEACOO + H+  MEA + CO2KINETIC4.99 × 10613,214
Table 4. Cost correlations summary of economic analysis.
Equipment/Utilities/MaterialsCost CorrelationReference
EquipmentColumn trays C tray = 568.94   ×   D 1.55   ×   h tray
h tray = 0.6096   ×   ( NT - 2 )
[30]
Column shells C shell = 22 , 930.82   ×   D 1.066   ×   h col 0.802
h col = 1.2 × 0.6096 × ( NT - 2 )
[30]
Condenser C con = 9414.568   ×   ( Q c 0.852 × T c ) 0.65 [30]
Reboiler C reb = 10 , 386.54   ×   ( Q r 0.568 × T r ) 0.65 [30]
Heat exchanger C Hex = 9414.568   ×   ( Q H 0.852 × T H ) 0.65 [30]
Pump C P = 3099   ×   ( PP 4 ) 0.55 [30]
Separator C sep = 149 , 100   ×   ( Q sep 0.15 ) 0.55 [30]
UtilitiesCW2.12 × 10−10, $/J
Tin: 20 °C, Tout: 25 °C
[31]
MP2.2 × 10−9, $/J
Tin: 175 °C, Tout: 174 °C
[31]
Refrigeration2.5 × 10−9, $/Cal
Tin: −25 °C, Tout: −24 °C
[31]
Electricity2.15 × 10−8, $/J[31]
MaterialsH2O0.412 $/ton[32]
MEA1400 $/ton[32]
DMF4500 $/ton[33]
Interest rate 12%[34]
Plant lifetime 30 years[34]
Table 5. Comparison between the results of this work and the literature.
Design/Output ParameterUnitThis WorkReferenceRelative Error
CO2 concentration
(Volume fraction)
%12.512.5% [36]0%
Inlet temperature of absorbent °C4039.4 °C [37]
Desorption temperature °C120120 °C [36]
Liquid-to-gas ratios (L/G)kg/kg3.53.66 [38]3.14%
Desorption pressureMPa0.120.122 [37]1.67%
CO2 capture rate%9992% [36]7.07%
Lean CO2 loadingsmol CO2 mol−1 MEA0.220.21 [18]4.55%
Reboiler dutyGJ/t CO22.8642.98 [39]3.89%
Table 6. Simulation results of mass balance.
StreamG-INGOULIQ1R-2CO2LIQLEAN-1S-IN
T/°C40202064.152651010164.730840
P/MPa0.100.120.120.20.120.120.120.1
Mass enthalpy
/KJ/kg
−1610.62−24.85−3350.05−3819.77−8955.18−3422.79−3275.39−3547.58
Mass density
kg/m3
1.211.75954.53935.382.39968.87811.16954.62
Average molecular weight30.2828.4572.13667.1844.0072.0169.0569.02
Mass flow
kg/hr
7.155.890.1126.151.280.02624.8425.00
Mass fraction
H2O09.82 × 10−71.99 × 10−59.26 × 10−61.37 × 10−50.0017167.23 × 10−68.93 × 10⁻⁶
CuH0000.0015000.00160.0016
PANI08.76 × 10−80.000180.000961.02 × 10−111.82 × 10−70.00100.001
MEA03.65 × 10−50.0670.222.01 × 10−70.00540.300.30
N20.7460.9068.19 × 10−54.76 × 10−50.0009711.09 × 10−700
O20.07180.08712.16 × 10−51.26 × 10−50.0002567.92 × 10−89.03 × 10−260
CO20.182004.99 × 10−90.9980.01333.04 × 10−120
MEA+007.64 × 10−70.00108000.001133.68 × 10−6
MEACOO0000.117457000.0019010
DMF00.007170.9330.6610.001160.9800.6950.697
H+0000.001120000
Table 7. Simulation results of the equipment.
NameModuleT/°CP/MPaHeat Load (kW)Notes
B7Heater400.1−0.901/
B7-PUMPPump640.20.00263/
B5Flash200.15−0.0533/
B6HeatX1200.21.0353Temperature of rich liquid entering desorber
B5-ABSRadFrac40 → 63
top → bottom
0.10Number of trays: 12
Feed stage: 1 and 12
B9-DESRadFrac111 → 165
top → bottom
0.12/From top to bottom
Number of trays: 13
Feed stage: 6
DES-CondenserHeater100.12−0.181Mass reflux ratio: 0.75
DES-ReboilerHeater164.7307610.121.017Reboiler ratio: 0.925
Table 8. Summary of process performance indicators.
IndicatorUnitValue
CRCO2%99.99
EconGJ/t CO22.864
ATUGJ/year79.49
CO2 ekg CO2/kg CO20.403
TAC$/year3709.07
Table 9. Decision variables and constraints for multi-objective optimization.
ParametersUnitValue
Decision variables:
FluxSkg/h25–30
FluxGkg/h7.0–8.5
TR°C100–140
RRM/0.5–1.5
ERD/0.91–0.95
Constraints:
CO2 product purity/0.90–1.0
CO2 productionkg/h≥1
Table 10. Comparison of operation variables and objective function before and after multi-objective optimization.
ParameterUnitInitial
Solution
Optimum SolutionComparison
Objective functions
ATUGJ/year79.4669.32↓ 12.75%
CO2 e/kg CO2/kg CO20.4030.210↓ 47.87%
TAC$/year3709.073223.73↓ 13.09%
Operation variables
FluxSkg/h25.0025.981/
FluxGkg/h7.157.497/
TR°C120123.158/
RRM/0.750.500/
ERD/0.9250.950/
CO2 capture rate%99.9999.99/
CO2 product purity/0.9980.999constraint satisfaction
CO2 productionkg/h1.281.29constraint satisfaction
EconGJ/t CO22.8642.15624.72%
Note: ↓ and ↑ indicate a decrease and an increase in the corresponding indicator after optimization, respectively.
Disclaimer/Publisher’s Note: The statements, opinions and data contained in all publications are solely those of the individual author(s) and contributor(s) and not of MDPI and/or the editor(s). MDPI and/or the editor(s) disclaim responsibility for any injury to people or property resulting from any ideas, methods, instructions or products referred to in the content.