Article

Hydrochemical Characteristics of the Suzhou Mining Area and Their Correlation with Drainage Water from Coalbed Methane Wells


1
School of Resources and Environmental Engineering, Suzhou University, Suzhou 234000, China
2
Key Laboratory of Coalbed Methane Resources and Reservoir Formation Process, Ministry of Education, China University of Mining and Technology, Xuzhou 221008, China
3
National Engineering Research Center of Coal Mine Water Hazard Controlling, Suzhou 234000, China
4
School of Mineral Resources and Geosciences, China University of Mining and Technology, Xuzhou 221008, China
5
School of Environment and Surveying Engineering, Suzhou University, Suzhou 234000, China
*
Authors to whom correspondence should be addressed.
Processes 2026, 14(17), 2851; https://doi.org/10.3390/pr14172851
Submission received: 11 June 2026 / Revised: 19 August 2026 / Accepted: 3 September 2026 / Published: 5 September 2026

Abstract

The Suzhou mining area contains abundant coalbed methane resources. Analyzing the hydrochemical characteristics of formation and drainage water from coalbed methane wells is of considerable importance for the efficient extraction of coalbed methane. Using hydrochemical test data from formation water, produced water, and the main coal seam of four coalbed methane wells, this study systematically investigated the relationship between hydrogeochemical characteristics and drainage water from coalbed methane wells. The results indicate that the trace elements in the main coal seam were similar to those in the water samples from the coal-bearing Permian sandstone aquifer (CPSA), both of which showed elevated levels of Ba. The water samples from the fourth aquifer of the Cenozoic Era (Q4 aquifer) primarily underwent ion exchange between Na+ and K+ in the water and Ca2+ and Mg2+ in the formation minerals. The water samples from coalbed methane wells, CPSA, Carboniferous Taiyuan Formation limestone aquifer (CTFLA), and Ordovician limestone aquifer (OLA) primarily underwent ion exchange between Ca2+ and Mg2+ in the water and Na+ and K+ in the formation minerals.

1. Introduction

Coalbed methane is a mixed gas stored within coal seams that is primarily made up of methane. It is a clean, unconventional natural gas resource that can effectively reduce the supply constraints on conventional energy sources. China possesses abundant coalbed methane, with development bases established in regions such as Jincheng and Ordos, where commercial-scale extraction is already underway. Expanding the development of coalbed methane resources can not only provide economic benefits, but it is also crucial for environmental protection [1,2,3,4].
In principle, coalbed methane extraction involves draining water from coal reservoirs to reduce pressure, thereby inducing the desorption of the adsorbed gas in the coal reservoir. Through diffusion and seepage, the gas ultimately migrates to the wellbore. The complexity of aquifer composition leads to varying degrees of hydraulic connectivity between different aquifers, influenced by faults, fractures, and coal mining operations [5,6,7,8]. The extraction principle indicates that hydrological conditions play a crucial role throughout the entire process of coalbed methane extraction. When water in coal reservoirs interacts with coal and surrounding rocks, various physicochemical reactions occur, providing valuable insights into its hydrochemical characteristics. In the coal-measure aquifers of typical mining areas, including Yushenfu and the northern Ordos Basin, water–rock interactions are dominated by three fundamental processes, namely silicate hydrolysis, carbonate mineral dissolution, and evaporite mineral dissolution, accompanied by cation exchange on clay mineral surfaces. Sulfate reduction reactions prevail in the closed reducing environment of CBM wells in eastern Yunnan, while sulfide mineral oxidation acts as the core mechanism for acid mine water generation under mining-disturbed conditions. Collectively, these geochemical processes govern the hydrogeochemical evolution patterns of groundwater across different coal mining areas [9,10,11,12]. Moreover, the drainage process of water from coal reservoirs is influenced by the water quality of other aquifers.
During the different production stages of coalbed methane wells, the water quality also changes [13,14]. In the initial stage, the water quality of the produced water is predominantly influenced by anthropogenic factors. In the intermediate stage, with the volume of the produced water gradually stabilizing, its quality approaches that of formation water. In the stable stage, the water quality tends to stabilize and is nearly identical to that of the formation water [15,16,17,18,19]. In the initial stage (approximately the first 3 months), the water production rate is greater than 10 m3/d. In the intermediate stage, which lasts for about 5 months, the gas production rate rises while the water production rate is roughly maintained at 7 m3/d. In the stable stage, the water production rate is relatively low, and the bottomhole flowing pressure is around 0.6 MPa [20,21,22]. By comparing the hydrochemical characteristics of formation water and produced water from coalbed methane wells, variations in water quality can be clearly identified. Previous studies have extensively explored the hydrochemical properties of both formation water and produced water; however, there remains no coupled analysis between them, particularly in the Suzhou mining area. Investigation of the hydrogeochemical characteristics of the Suzhou mining area can establish an academically complementary and mutually corroborative correlation with globally representative coalbed methane research cases [1,2,6]. Based on experimental data of conventional ions, trace elements, δD and δ18O, this study analyzed the hydrochemical characteristics of formation water and produced water from coalbed methane wells in the Suzhou mining area. The hydrochemical features of the Suzhou mining area and their relationship with produced water from coalbed methane wells were systematically examined, thereby providing theoretical recommendations for the efficient development of coalbed methane resources in the region.

2. Geological Background and Sample Collection

2.1. Geological Setting

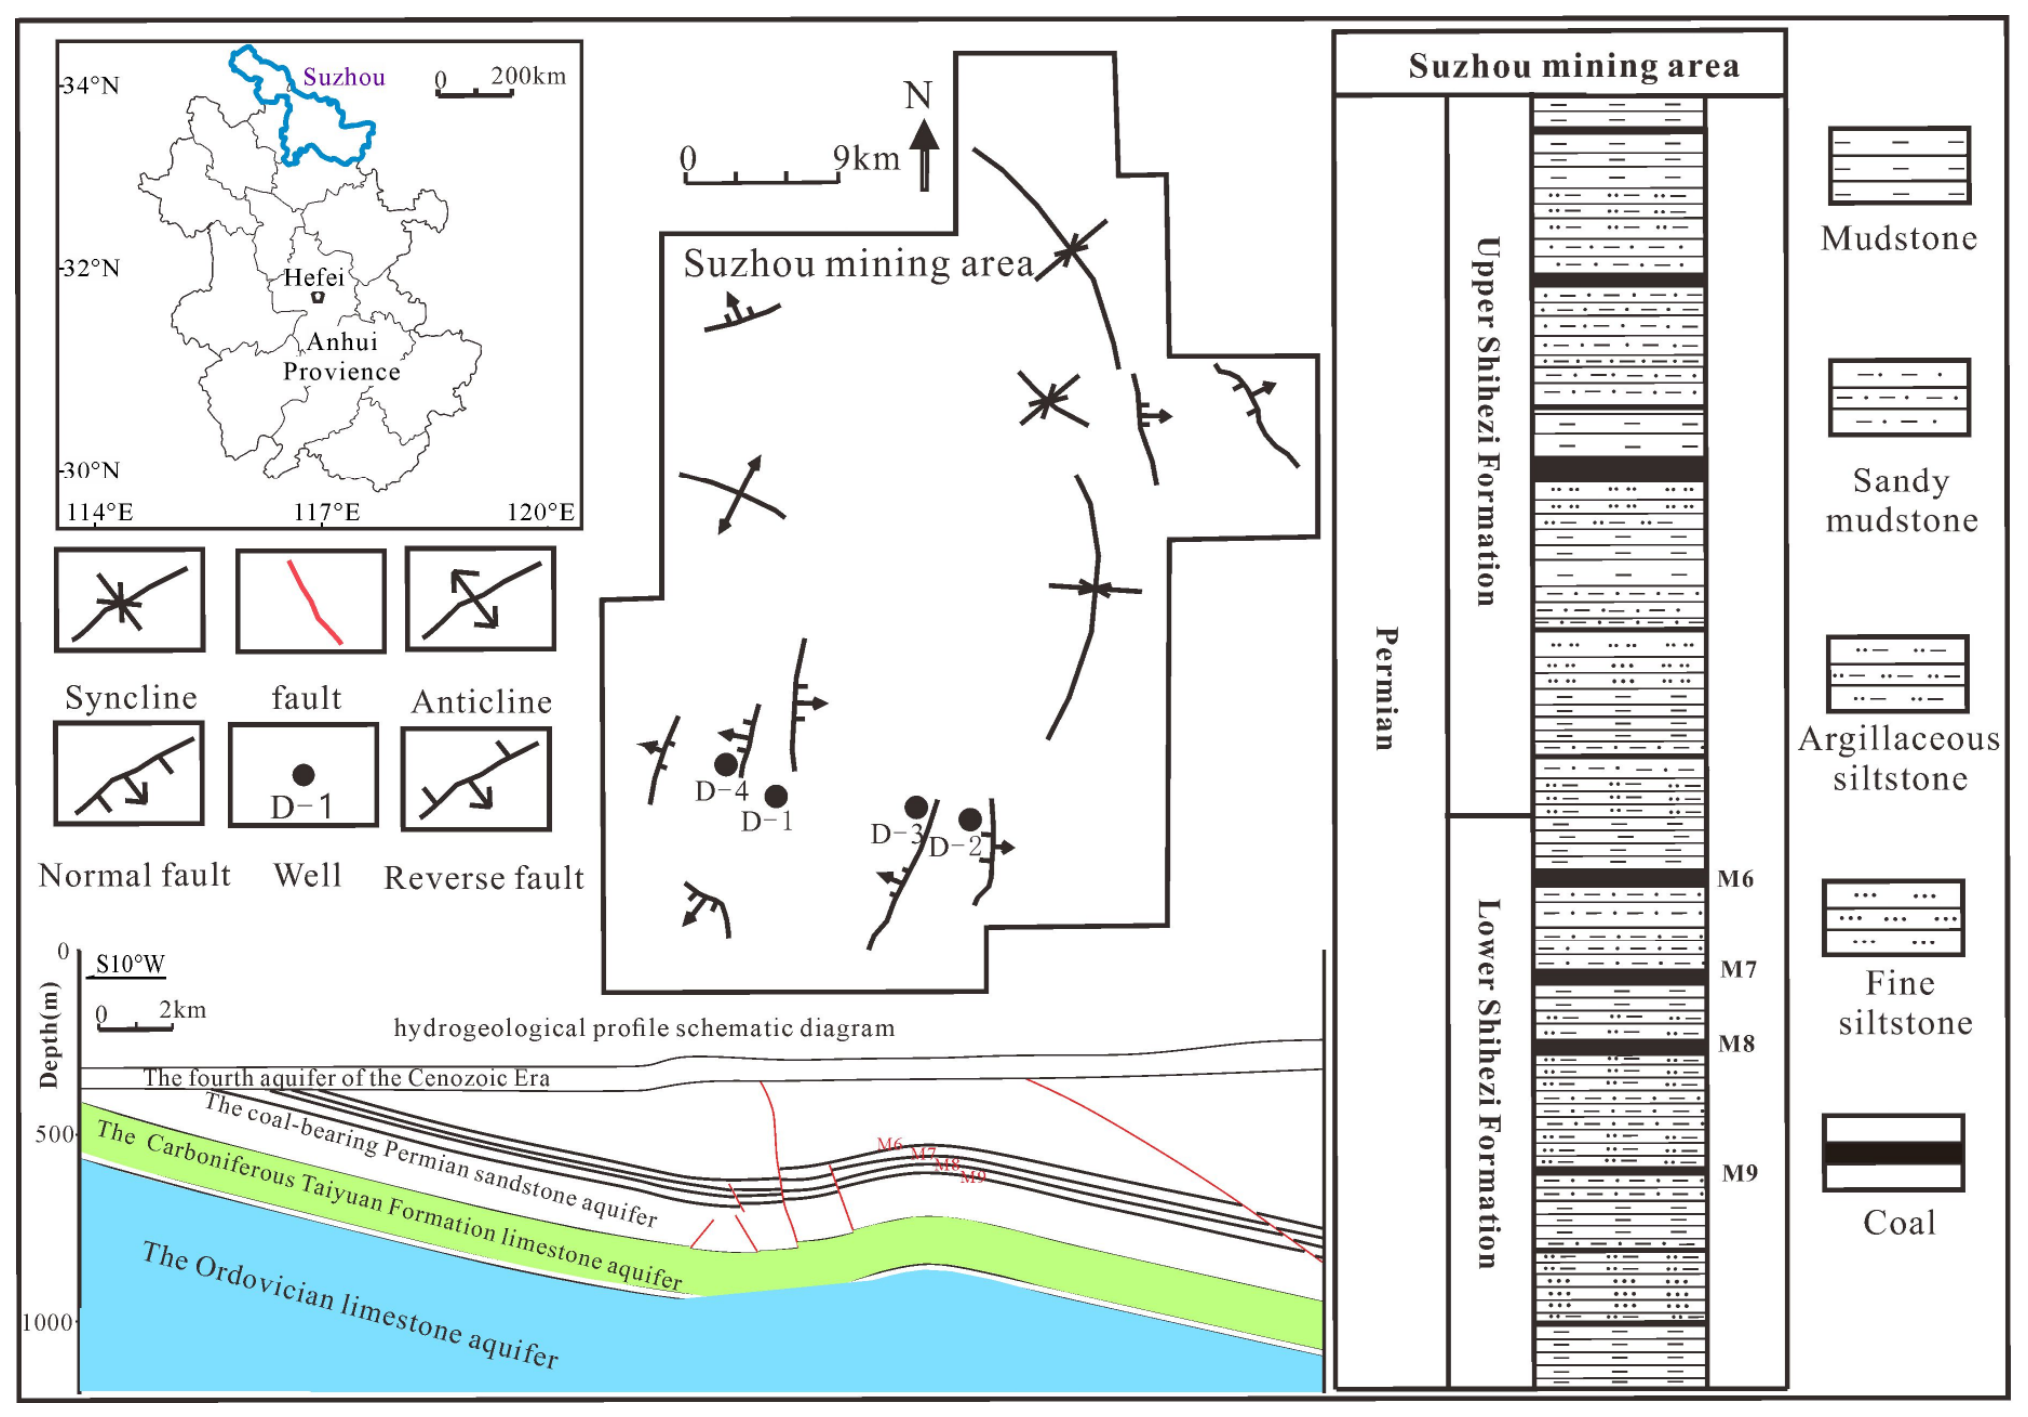
The Suzhou mining area is located in Yongqiao District, Suzhou City, Anhui Province. The regional tectonics are controlled by east–west, northeast, and Xuzhou–Suzhou arc structures, with the east–west and northeast structures forming dominant patterns. The coal-bearing strata chiefly comprise the Permian Shihexi Formation, and the economically recoverable coal seams include Nos. 6, 7, 8, and 9. The macroscopic coal maceral composition of each seam mainly contains bright and dull coal, with minor vitrinite bands. The macroscopic coal type is classified as semi-bright coal. In contrast, the microscopic coal maceral composition of each seam is predominantly organic matter, accounting for 80–97.41%. The area contains numerous rivers, most of which belong to the Huaihe River system. These rivers are small- to medium-sized seasonal streams, and their flow is mainly controlled by atmospheric precipitation.
The aquifers closely related to the mined coal seam in the mining area include the fourth aquifer of the Cenozoic Era (Q4 aquifer) (sample numbers: H-1, H-2, and H-3), the coal-bearing Permian sandstone aquifer (CPSA) (sample numbers: M-1 and M-2), the Carboniferous Taiyuan Formation limestone aquifer (CTFLA) (sample numbers: N-1, N-2, N-3, N-4, and N-5), and the Ordovician limestone aquifer (OLA) (sample numbers: P-1, P-2, P-3, P-4, and P-5). Four coalbed methane development wells were selected in the study area, namely D-1, D-2, D-3, and D-4. All four wells involved multi-coal seam co-mining. D-1 mined the No. 6, 7, and 8 coal seams, while D-2, D-3, and D-4 extracted from the No. 7, 8, and 9 coal seams (Figure 1).

2.2. Materials and Methods

The water samples were collected from four coalbed methane development wells in the Suzhou mining area in four stages: April 2024, June 2024, October 2024, and February 2025. Water sample collection was conducted at the outlet of the development wells using a 0.5 L polyethylene bottle, which had been rinsed with produced water at least three times prior to final collection. Water sampling details for the study area are shown in Table 1. The water samples from the Q4 aquifer, CPSA, CTFLA, and OLA, as well as the coal samples, were all obtained from active coal mines in the study area. The experimental testing project for coalbed methane well–produced water involved determining the mass concentrations of conventional anions and cations. The testing items for the aquifer water samples comprised conventional cation and anion mass concentration analysis, determination of stable hydrogen and oxygen isotopes, and measurement of trace element mass concentrations. The testing item for the coal samples was the determination of trace element concentrations. Coal samples and water samples were respectively dispatched to the Sichuan Keyuan Engineering Technology Testing Center Co., Ltd (Chengdu, China). and the Jiangsu Geological and Mineral Design & Research Institute (Xuzhou, China) for systematic experimental analysis and testing. The test results are presented in Table 2, Table 3, Table 4, Table 5 and Table 6.
The trace element analysis of coal samples was carried out in strict accordance with the Chinese national standard GB/T 14506.30-2010 [23], Methods for chemical analysis of silicate rocks-Part 30: Determination of 44 elements. The analysis was performed on an ICAP RQ Inductively Coupled Plasma Mass Spectrometer (ICP-MS) from Thermo Fisher Scientific (Waltham, MA, USA). This instrument offers typical instrumental detection limits of <0.5 ppt for low-mass elements and <0.1 ppt for medium- and high-mass elements, with a short-term stability of relative standard deviation (RSD) < 2% and a long-term stability of RSD < 3%. For quality assurance and quality control, one coal trace element certified reference material was inserted per 10 samples for calibration and verification. In each analytical batch, 10% of the samples were prepared as parallel duplicates, and the RSD of all parallel measurements was controlled below 5%. All procedural blank values were lower than the established method detection limit, and the entire analytical procedure fully complied with the technical specifications stipulated in the aforementioned national standard.
The determination of major cations in water samples was performed using Inductively Coupled Plasma Optical Emission Spectrometry (ICP-OES) (Thermo Elemental, Waltham, MA, USA; Models: ICP-OES/ICP-MS), with method detection limits ranging from 0.01 to 0.1 mg/L. Major anions were quantified by Ion Chromatography (IC) (DIONEX, USA; Model ICS-90) equipped with an AS-series anion analytical column and a KOH eluent gradient elution system, resulting in a method detection limit of 0.003–0.02 mg/L. The charge balance error between the two sets of measurements was rigorously maintained within ±5%. Analyses of stable hydrogen and oxygen isotopes were conducted strictly following the industry standard DZ/T 0184.36-2024 [24], Determination of hydrogen and oxygen isotopic compositions in water by laser spectroscopy. The long-term analytical precision was better than ±0.2‰ for δD and ±0.05‰ for δ18O, and three laboratory standard samples covering different isotopic ranges were employed for full-process calibration throughout each analytical batch. Prior to trace element measurement, all water samples were pre-filtered through 0.45 μm membranes and acidified to pH < 2 using high-purity HNO3, followed by analysis via Inductively Coupled Plasma Mass Spectrometry (ICP-MS) (Thermo Elemental, USA; Models: ICP-OES/ICP-MS) with a method detection limit as low as 0.001 μg/L. As part of the quality control protocol, one certified water reference material was introduced for analytical validation per 10 samples. All procedural blank measurements were lower than the corresponding method detection limits, confirming no exogenous contamination was introduced during the entire analytical procedure.

3. Results and Discussion

3.1. Analysis of Test Results

3.1.1. Characteristics of Conventional Ions

The test results of the coalbed methane well drainage and aquifer water samples in the Suzhou mining area (Table 2 and Table 3) reveal that the minimum pH value of coalbed methane well drainage water was 7.46, the maximum pH value was 8.31, and the average pH value was 7.83. The minimum pH value of the aquifer water samples was 7.30, the maximum pH value was 10.50, and the average pH value was 8.75, all of which represent alkaline environments with pH >7. The alkaline environment of the aquifer water samples was slightly stronger than that of drainage water. The water discharged from coalbed methane wells primarily comprised Na+, followed by Cl and HCO3. Among these, the minimum value of Na+ in well D-1 was 1740.62 mg/L, the maximum value was 3195 mg/L, the average value was 2142.12 mg/L, and the coefficient of variation (CV) was 28.42%. The minimum value of Cl was 1710.17 mg/L, the maximum value was 2025.45 mg/L, the average value was 1869.26 mg/L, and the CV was 6.36%. The minimum value of HCO3 was 1440.52 mg/L, the maximum value was 1553.67 mg/L, the average value was 1484.11 mg/L, and the CV was 2.86%. The minimum value of Na+ in well D-2 was 2108.82 mg/L, the maximum value was 3970 mg/L, the average value was 2641.72 mg/L, and the CV was 29.10%. The minimum value of Cl was 2835.68 mg/L, the maximum value was 2846.70 mg/L, the average value was 2839.07 mg/L, and the CV was 0.16%. The minimum value of HCO3 was 928.85 mg/L, the maximum value was 1086.34 mg/L, the average value was 1042.02 mg/L, and the CV was 6.31%. The minimum value of Na+ in well D-3 was 2934.32 mg/L, the maximum value was 4802.50 mg/L, the average value was 3474.44 mg/L, and the CV was 22.21%. The minimum value of Cl was 3469.75 mg/L, the maximum value was 3771.85 mg/L, the average value was 3631.10 mg/L, and the CV was 3.88%. The minimum value of HCO3 was 2019.36 mg/L, the maximum value was 2246.33 mg/L, the average value was 2079.48 mg/L, and the CV was 4.63%. The minimum value of Na+ in well D-4 was 1891.92 mg/L, the maximum value was 4105 mg/L, the average value was 2508.45 mg/L, and the CV was 36.84%. The minimum value of Cl was 2169.94 mg/L, the maximum value was 2457.63 mg/L, the average value was 2323.99 mg/L, and the CV was 5.77%. The minimum value of HCO3 was 1381.73 mg/L, the maximum value was 1547.96 mg/L, the average value was 1498.92 mg/L, and the CV was 4.59%.
In the aquifer water samples, Na+ + K+ was the main component, followed by SO42− and HCO3. Among these, the minimum value of Na+ + K+ in the water sample of the Q4 aquifer was 103.98 mg/L, the maximum value was 148.23 mg/L, the average value was 120.60 mg/L, and the CV was 16.31%. The minimum value of SO42− was 2.47 mg/L, the maximum value was 609.99 mg/L, the average value was 205.66 mg/L, and the CV was 139.02%. The minimum value of HCO3 was 150.13 mg/L, the maximum value was 399.49 mg/L, the average value was 233.65 mg/L, and the CV was 50.19%. The minimum value of Na+ + K+ in the water sample of the CPSA was 449.26 mg/L, the maximum value was 592.99 mg/L, the average value was 521.13 mg/L, and the CV was 13.79%. The minimum value of SO42− was 40.34 mg/L, the maximum value was 182.34 mg/L, the average value was 111.34 mg/L, and the CV was 63.77%. The minimum value of HCO3 was 749.33 mg/L, the maximum value was 1185.75 mg/L, the average value was 967.54 mg/L, and the CV was 22.55%. The minimum value of Na+ + K+ in the water sample of the CTFLA was 28.06 mg/L, the maximum value was 413.73 mg/L, the average value was 172.24 mg/L, and the CV was 79.79%. The minimum value of SO42− was 4.53 mg/L, the maximum value was 680.99 mg/L, the average value was 381.92 mg/L, and the CV was 81.46%. The minimum value of HCO3 was 49.36 mg/L, the maximum value was 451.55 mg/L, the average value was 254.38 mg/L, and the CV was 62.07%. The minimum value of Na+ + K+ in the water sample of the OLA was 62.78 mg/L, the maximum value was 190.39 mg/L, the average value was 114.05 mg/L, and the CV was 40.81%. The minimum value of SO42− was 2.47 mg/L, the maximum value was 562.45 mg/L, the average value was 149.66 mg/L, and the CV was 141.70%. The minimum value of HCO3 was 20.36 mg/L, the maximum value was 207.63 mg/L, the average value was 100.87 mg/L, and the CV was 66.04%.

3.1.2. Characteristics of Hydrogen and Oxygen Isotopes

Table 4 shows the hydrogen and oxygen isotope values of the formation water samples. Surface water exhibited the heaviest δ18O, with a value of −1.99‰, while δD was only lower than that of the OLA water samples, with a value of −53.99‰. The minimum value of δ18O in the water sample of the Q4 aquifer was −8.59‰, the maximum value was −7.64‰, and the average value was −8.20‰. The minimum value of δD was −63.42‰, the maximum value was −57.77‰, and the average value was −60.92‰. The minimum value of δ18O in the CPSA water sample was −8.48‰, the maximum value was −8.28‰, and the average value was −8.38‰. The minimum value of δD was −64.48‰, the maximum value was −63.57‰, and the average value was −64.03‰. The minimum value of δ18O in the water sample of CTFLA was −10.15‰, the maximum value was −7.49‰, and the average value was −8.54‰. The minimum value of δD was −71.83‰, the maximum value was −54.45‰, and the average value was −63.09‰. The minimum value of δ18O in the OLA water sample was −8.07‰, the maximum value was −5.40‰, and the average value was −6.84‰. The minimum value of δD was −60.23‰, the maximum value was −42.76‰, and the average value was −51.41‰.

3.1.3. Characteristics of Trace Elements

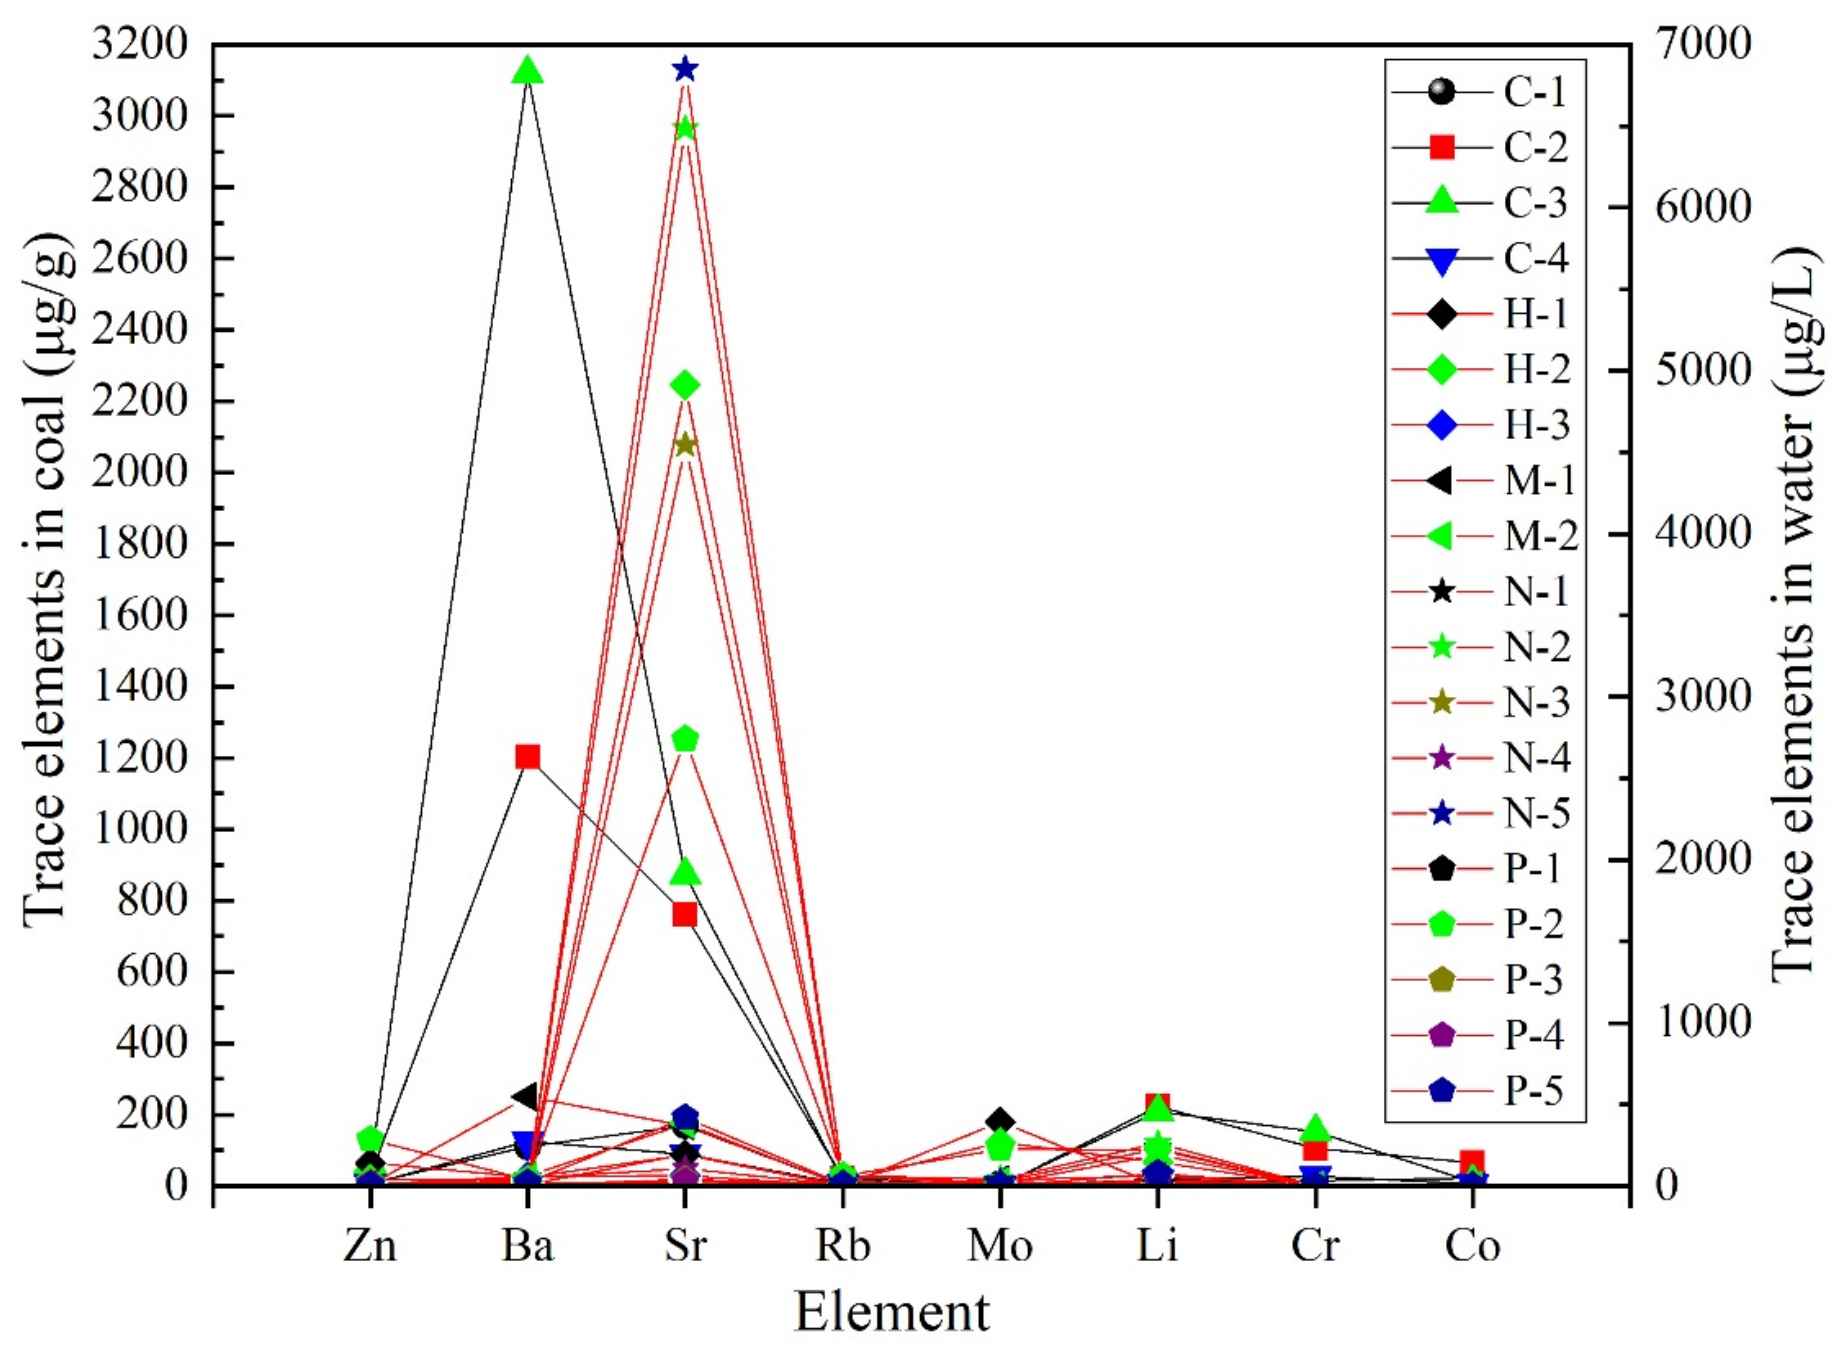
According to the trace element data tables (Table 5 and Table 6), the order of the average concentration of trace elements in the water sample of the Q4 aquifer was as follows: Sr > Mo > Zn > Li > Ba > Rb > Cr > Co. The order of average concentrations of trace elements in the water samples of CPSA was Sr > Ba > Li > Mo > Zn > Rb > Cr > Co. The order of the average concentration of trace elements in the water samples of CTFLA was Sr > Li > Rb > Ba > Mo > Zn > Cr > Co. The order of average concentrations of trace elements in the water samples from OLA was as follows: Sr > Li > Zn > Mo > Rb > Ba > Cr > Co. The order of the average concentration of trace elements in the coal samples was Ba > Sr > Li > Cr > Zn > Co > Rb > Mo.

3.2. Discussion

Prior research has indicated that conventional ion concentrations can, to a certain extent, reflect the occurrence of groundwater, namely open and closed types. Ca2+ and Mg2+ concentrations are elevated in the occurrence environment of open groundwater, while Na+, Cl, and HCO3 concentrations are elevated in the occurrence environment of closed groundwater. Among them, the occurrence environment of enclosed groundwater is affected by the concentration of HCO3, and the pH is typically alkaline. In contrast, HCO3 is primarily derived through the reduction action of sulfate [25,26,27].
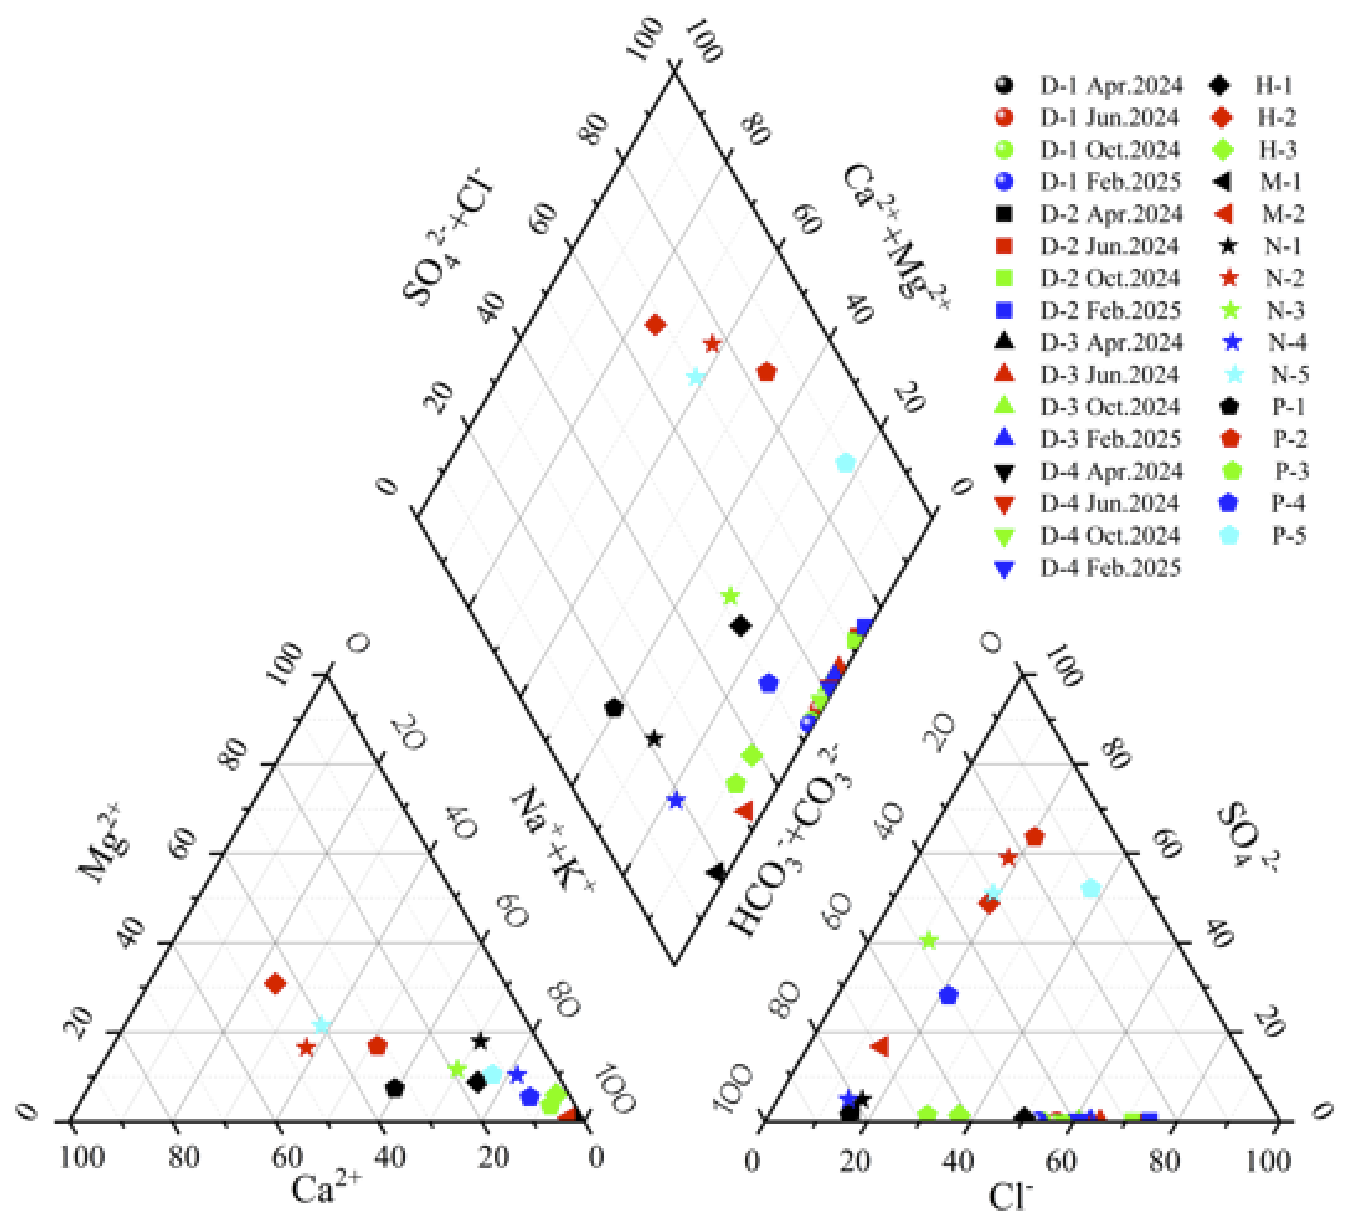
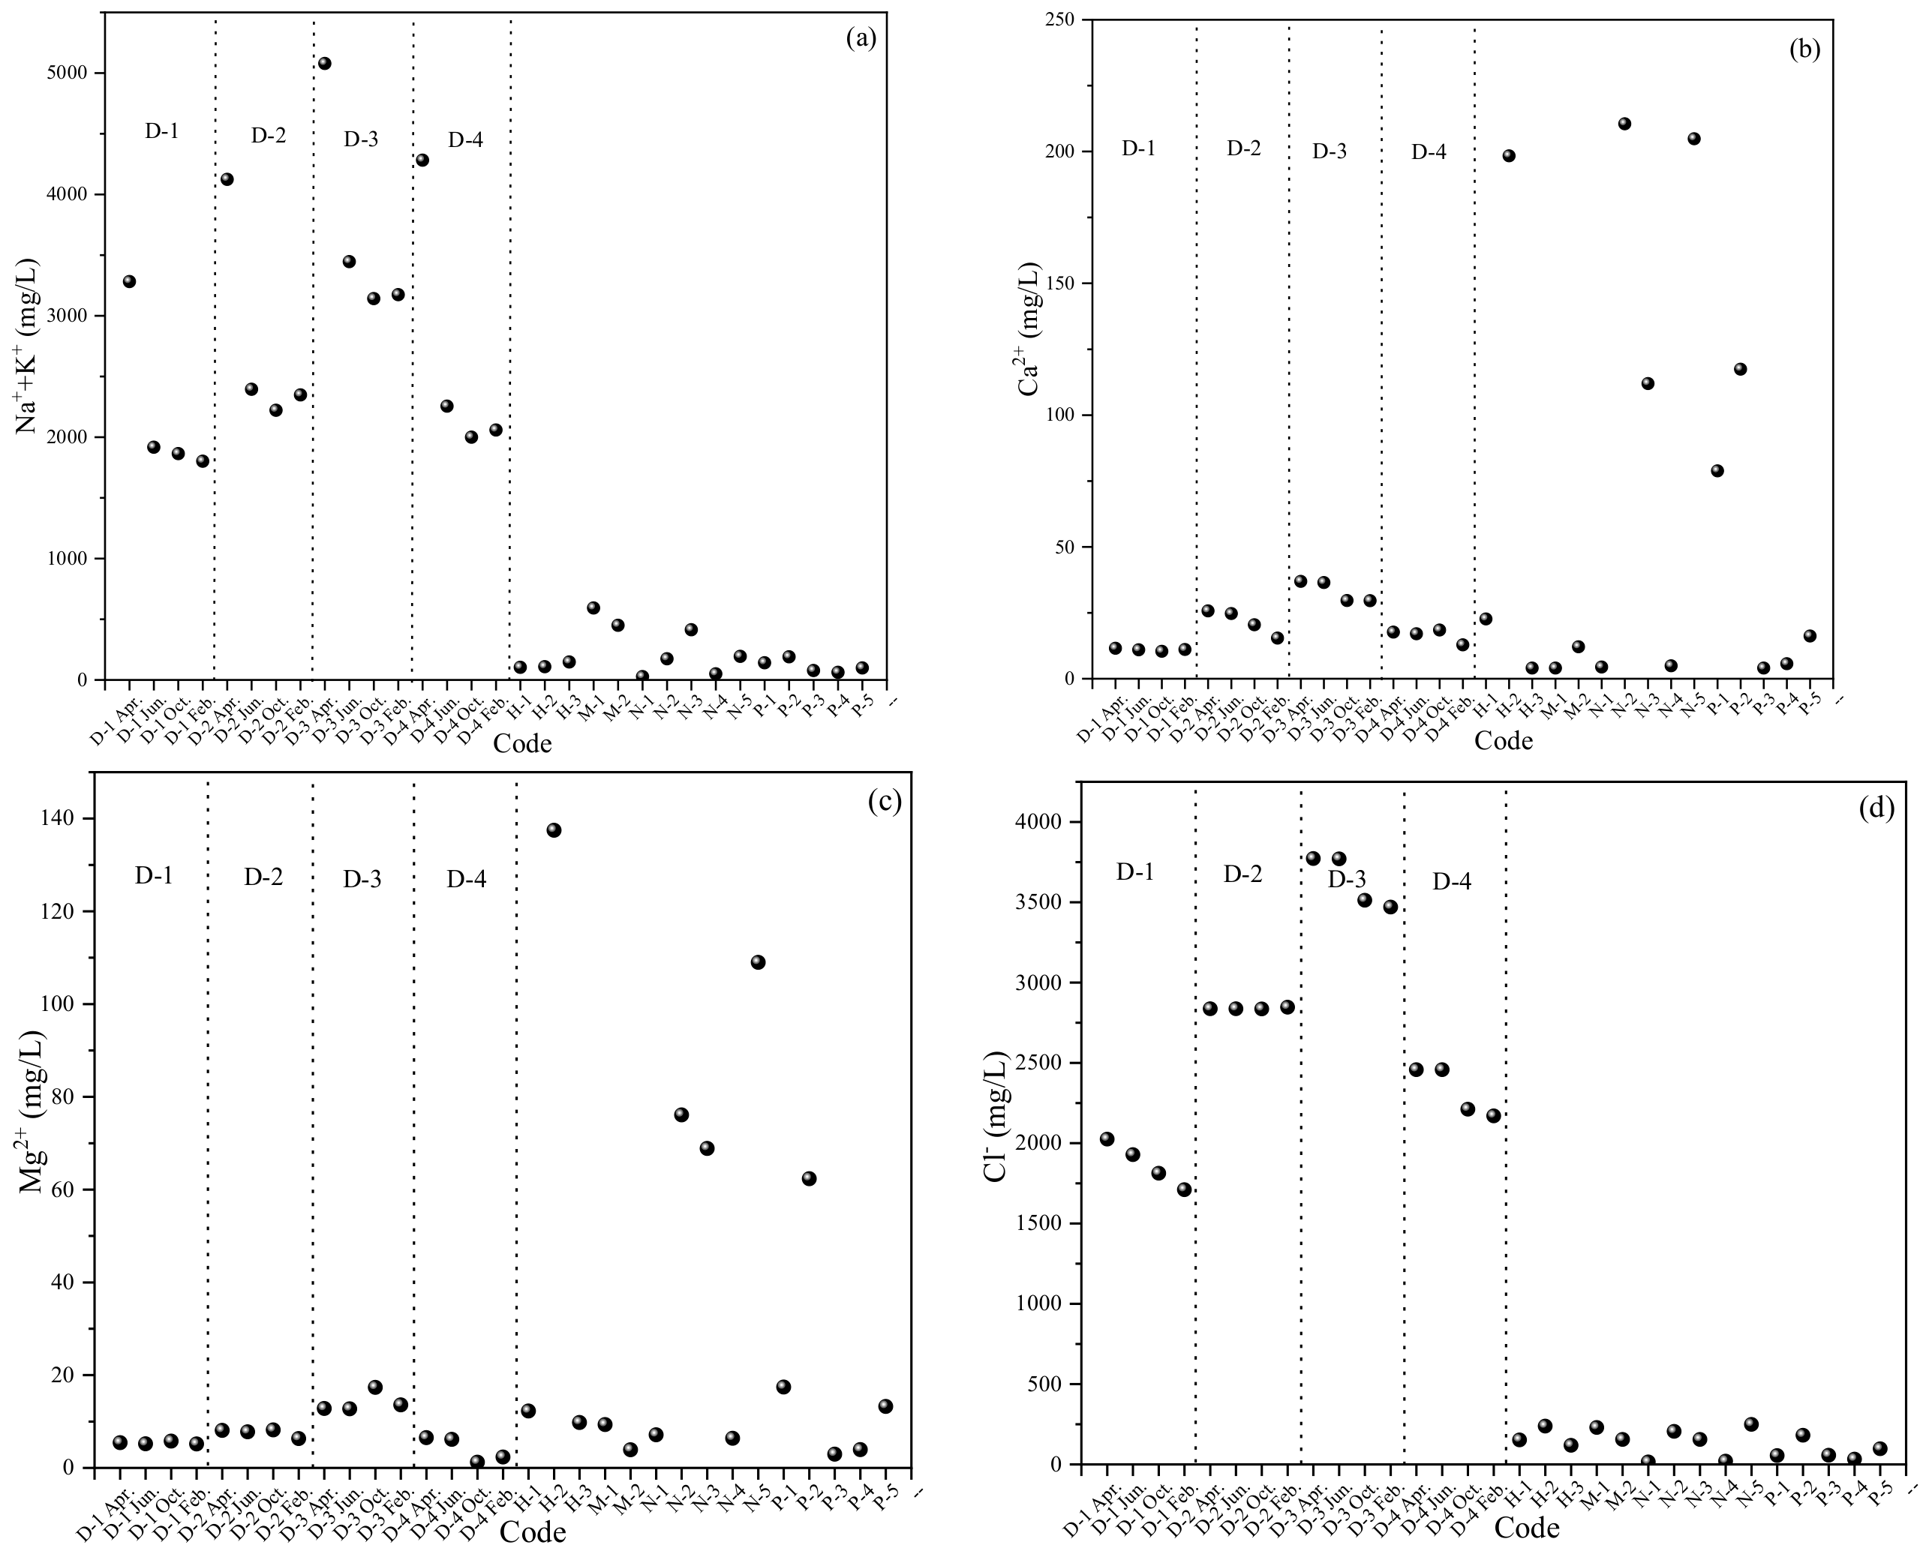
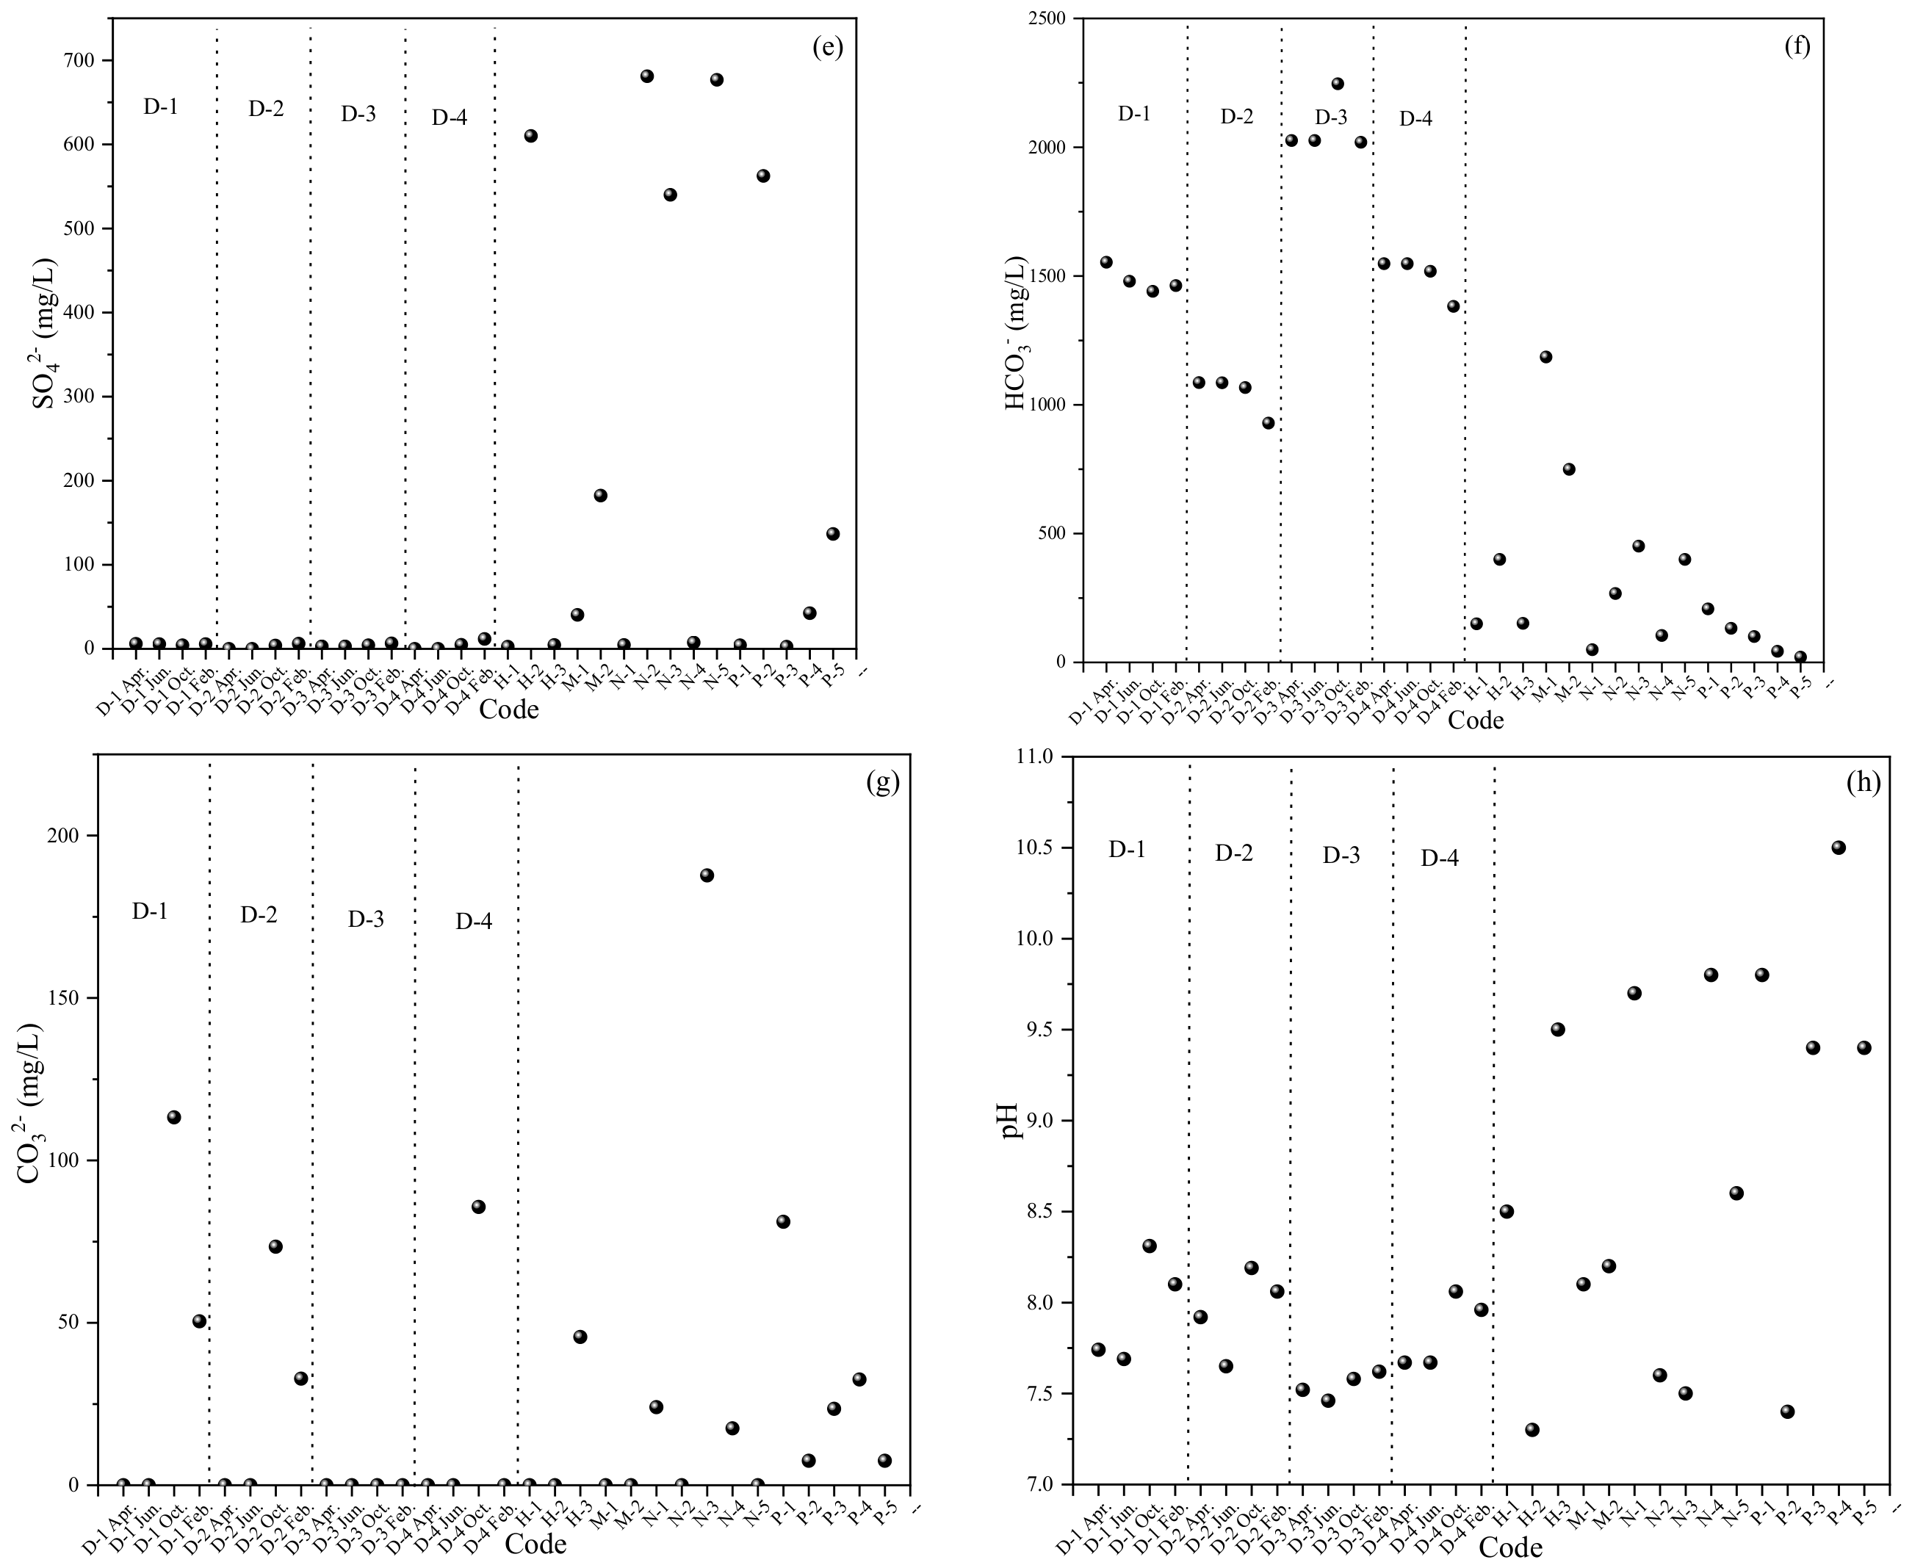
The Piper diagram of the water samples from the study area (Figure 2) illustrates that the water quality type of coalbed methane well drainage water was primarily Na–Cl–HCO3, while that of the aquifer was predominantly Na–HCO3. The ion concentration and pH variation diagram of the water samples from the study area (Figure 3h) shows that the pH of coalbed methane well drainage water ranged from 7.46 to 8.31, while that of the aquifer water samples ranged from 7.30 to 10.50, both exhibiting alkalinity. The ion concentration analysis revealed that the storage environments of both the coalbed methane well drainage and aquifer water samples were closed-type systems (Figure 3a–g), with HCO3 primarily derived from bicarbonates produced through sulfate reactions involving organic matter. During coalbed methane well construction, fracturing fluids containing Na+ and Cl were discharged during production, leading to a decrease in Na+ and Cl concentrations (Figure 3a,d). The declining trends in Ca2+ and Mg2+ concentrations indicated weakened water–rock interactions, while the rainy season in October intensified water–rock interactions, resulting in increased concentrations of Ca2+ and Mg2+ (Figure 3b,c).
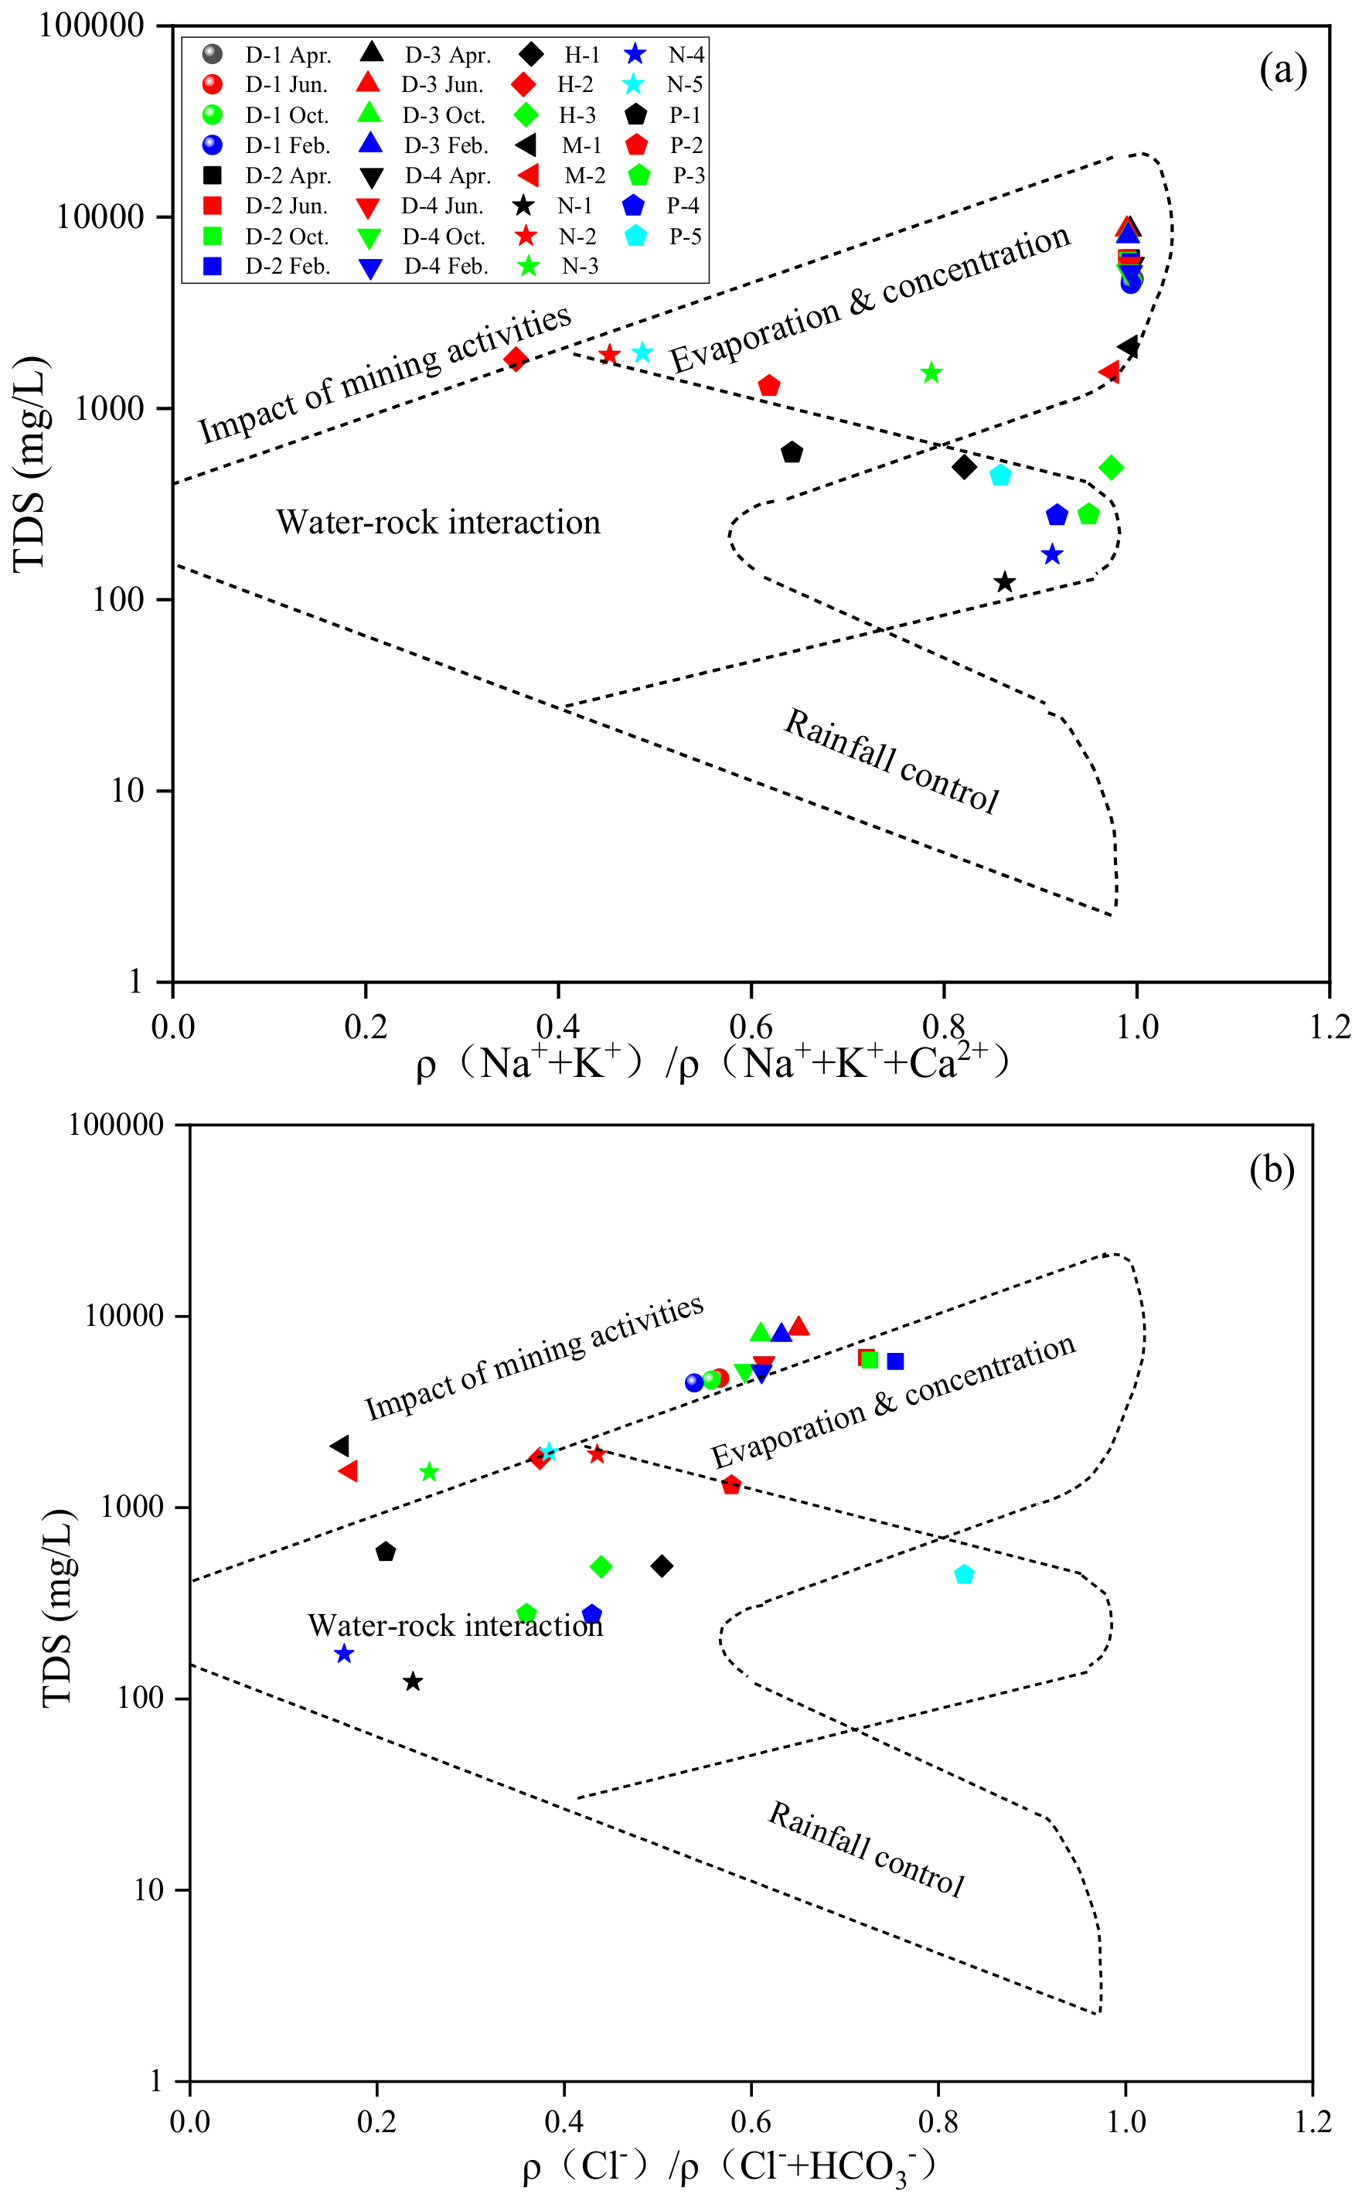
Gibbs diagrams can be used to determine the controlled types of hydrochemical characteristics, including “water–rock interaction” and “evaporation concentration” [12,28,29]. Figure 4a shows that most of the data points fell into the areas of “evaporation and concentration” and “water diagenesis.” Among them, the drainage and production water samples of coalbed gas wells, Q4 aquifer, CPSA, and CTFLA were significantly influenced by evaporation and concentration, while the OLA samples were primarily affected by water diagenesis. As shown in Figure 4b, the CPSA samples were also influenced by mining activities.
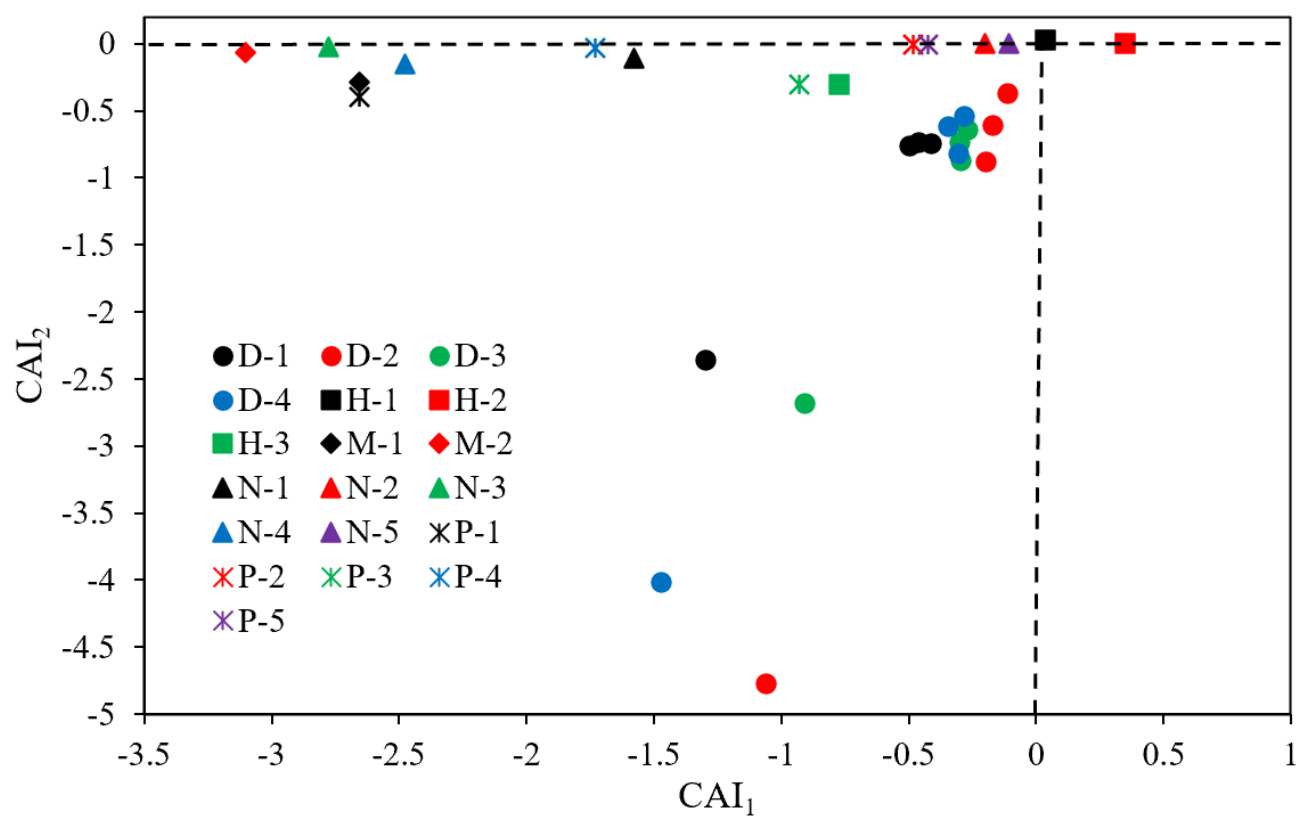
The chlor-alkali indices of CAI1 and CAI2 can be used to reflect the direction of ion exchange. When the data points fall in the first quadrant, it indicates that Na+ and K+ in the water exchange with Ca2+ and Mg2+ in the formation minerals, leading to an increase in Ca2+ and Mg2+ concentrations in the water. When the data point falls in the third quadrant, it indicates that Ca2+ and Mg2+ in the water exchange with Na+ and K+ in the formation minerals, causing an increase in Na+ and K+ concentrations in groundwater [30,31]. The calculation formula is as follows (Equations (1) and (2)):
CAI1 = (Cl − [Na+ + K+])/Cl
CAI2 = (Cl − [Na+ + K+])/(HCO3 + SO42− + CO32− + NO3)
No NO3 was detected; therefore, NO3 was not included in the calculation.
As is shown in Figure 5, the water samples from the Q4 aquifer primarily underwent ion exchange between Na+ and K+ in the water and Ca2+ and Mg2+ in the formation minerals. The water samples from coalbed methane wells, CPSA, CTFLA, and OLA primarily underwent ion exchange between Ca2+ and Mg2+ in the water and Na+ and K+ in the formation minerals.
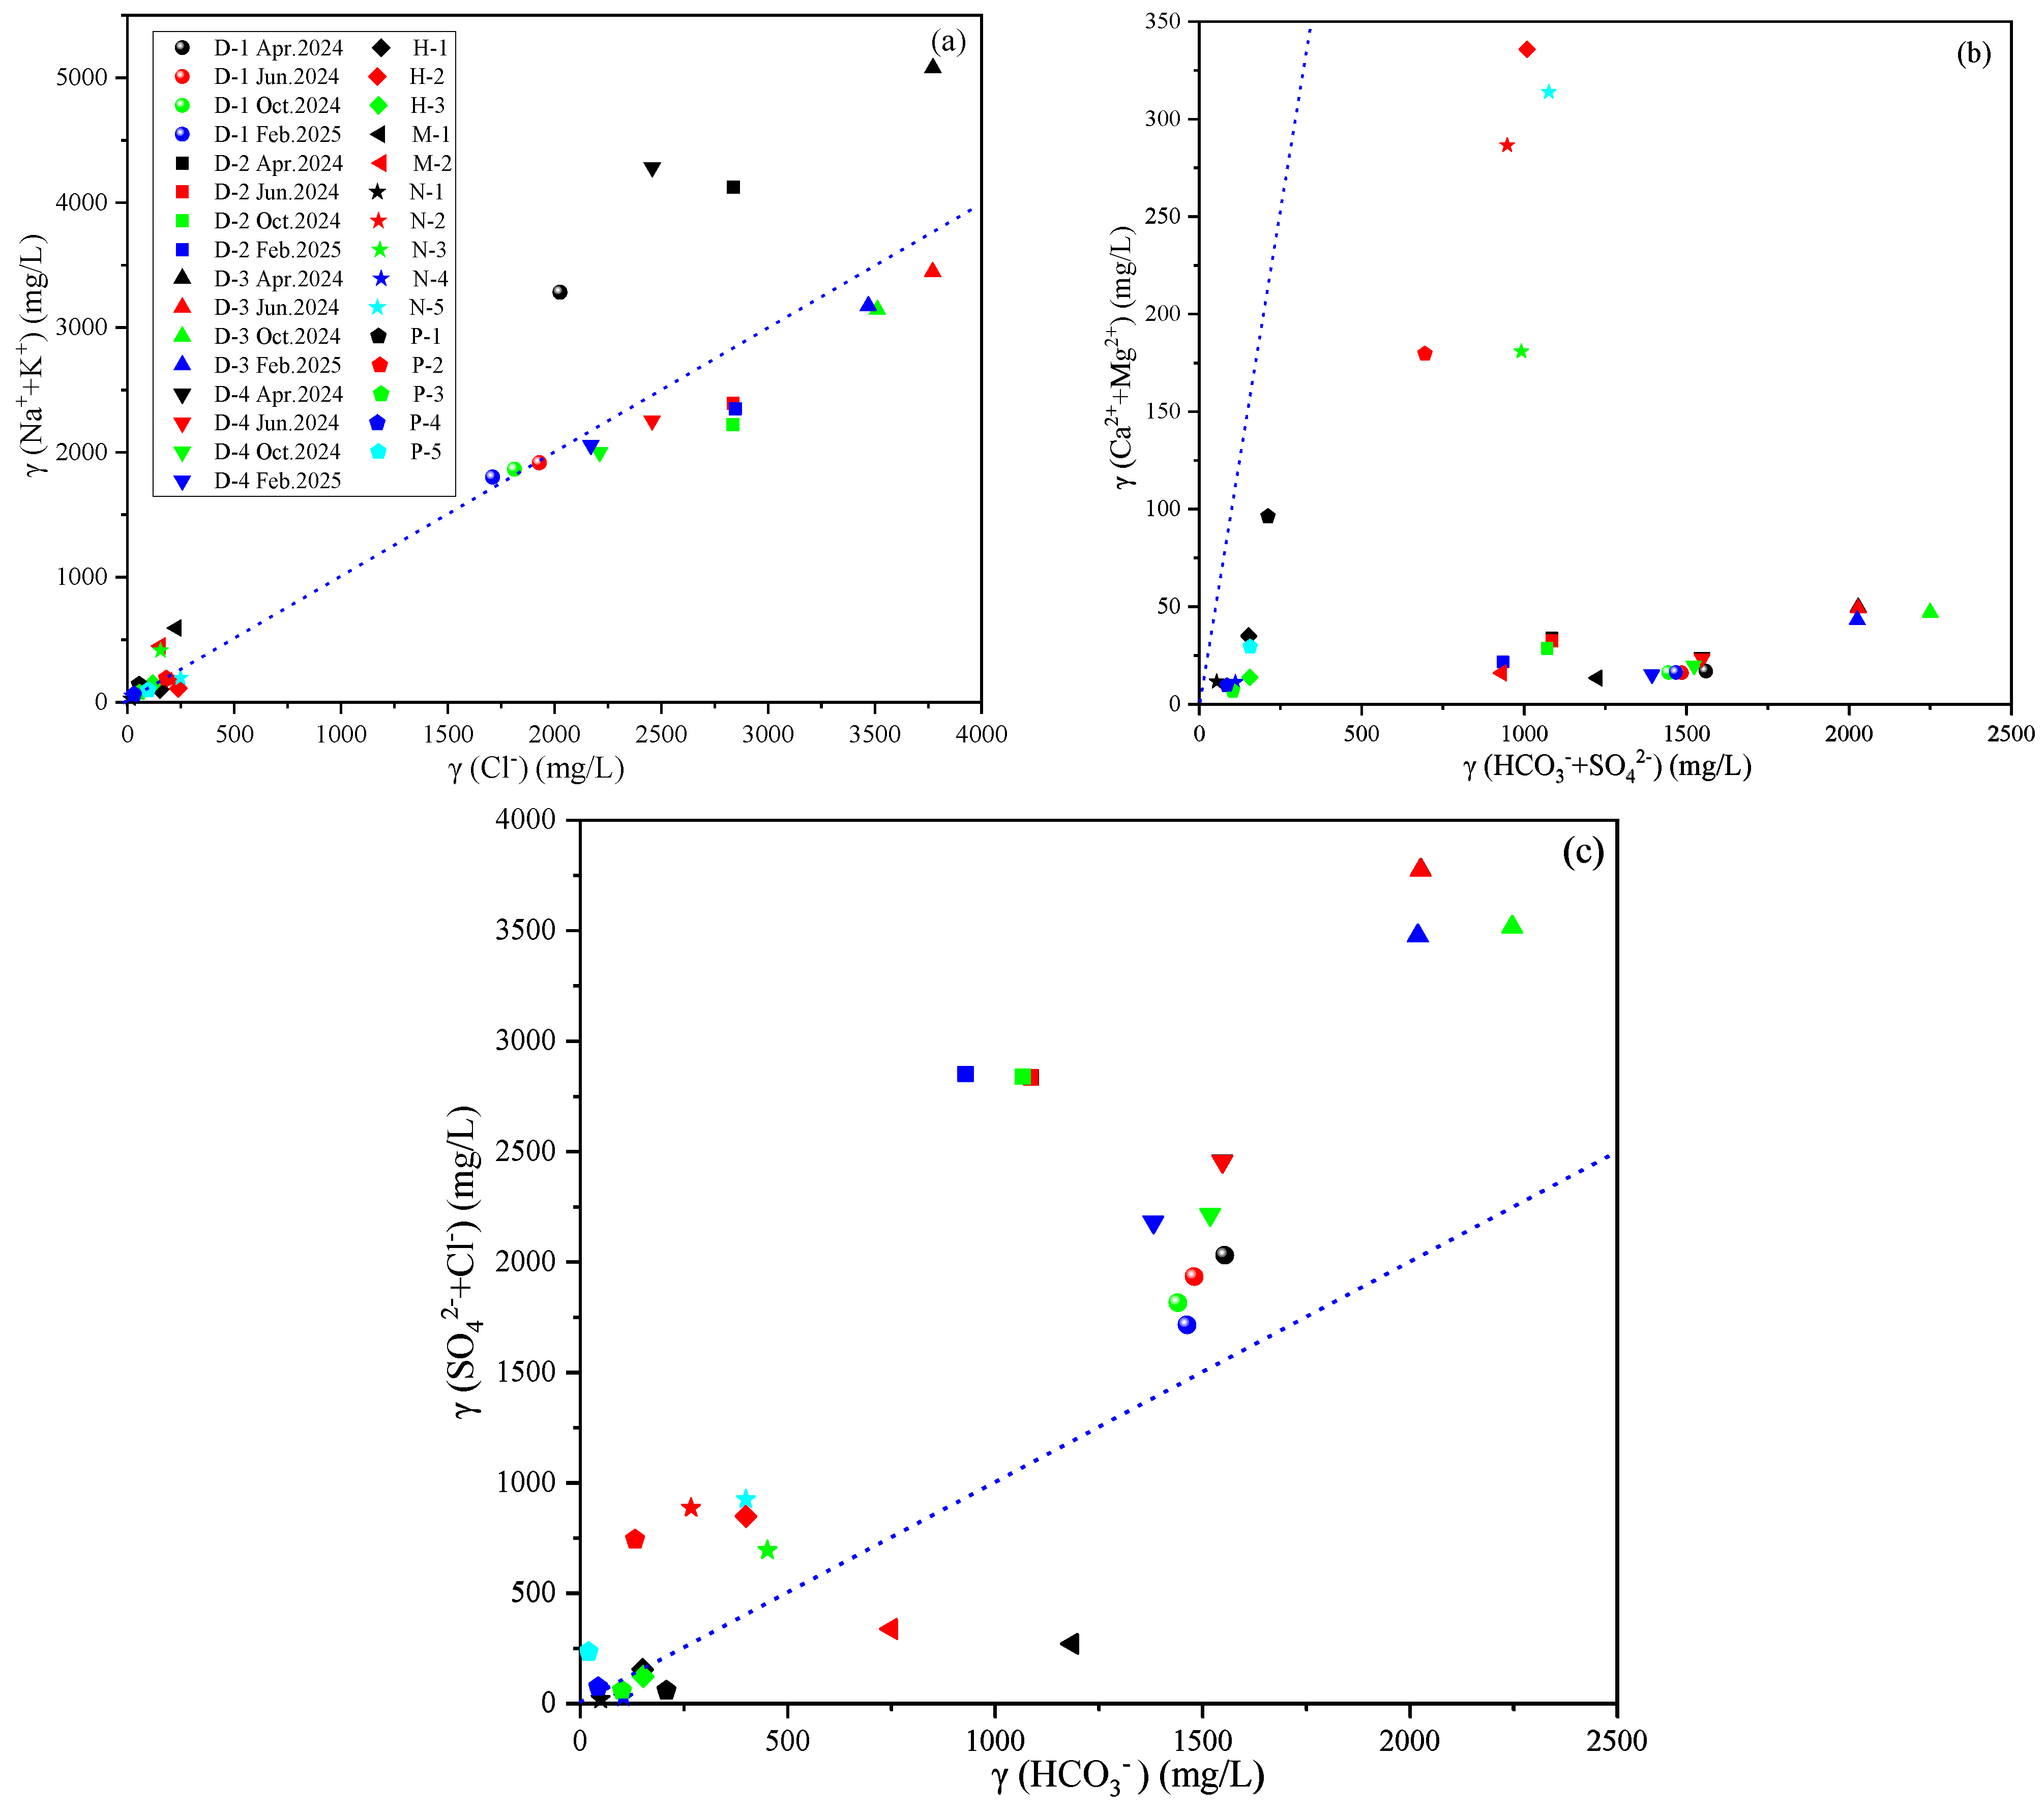
The ion ratio relationship can be used to analyze the source of ions [32,33]. For example, γ (Na+ + K+)/γ (Cl) can be used to analyze the sources of Na+ and K+. If γ (Na+ + K+)/γ (Cl) = 1, it is attributed to salt rock dissolution. If γ (Na+ + K+)/γ (Cl) > 1, the ion source is silicate rock weathering. γ (Ca2+ + Mg2+)/γ (HCO3 + SO42−) can be used to analyze the sources of Ca2+, Mg2+, HCO3, and SO42−. If the data points are distributed around γ (Ca2+ + Mg2+)/γ (HCO3 + SO42−) = 1, then Ca2+, Mg2+, HCO3, and SO42− originate from the weathering of carbonate rocks. γ (SO42− + Cl)/γ (HCO3) can be used to determine whether the chemical composition of water is the result of evaporite rock dissolution or carbonate dissolution. If the data points are distributed below γ (SO42− + Cl)/γ (HCO3) = 1, then the chemical composition of water is attributed to the dissolution of carbonates; otherwise, it is from evaporite rock dissolution.
Figure 6a shows how the water sample data points were located near the 1:1 line, indicating that Na+ and K+ were primarily influenced by the dissolution of salt rocks. In Figure 6b, all data points are located below the 1:1 line, indicating that Ca2+, Mg2+, HCO3, and SO42− were not primarily derived from the weathering of carbonate rocks. Figure 6c clarifies that most of the data points fell above the 1:1 line. Thus, SO42−, Cl, and HCO3 in the water sample were primarily affected by the dissolution of evaporite rocks, while the CPSA water sample was influenced more strongly by the dissolution of carbonates.
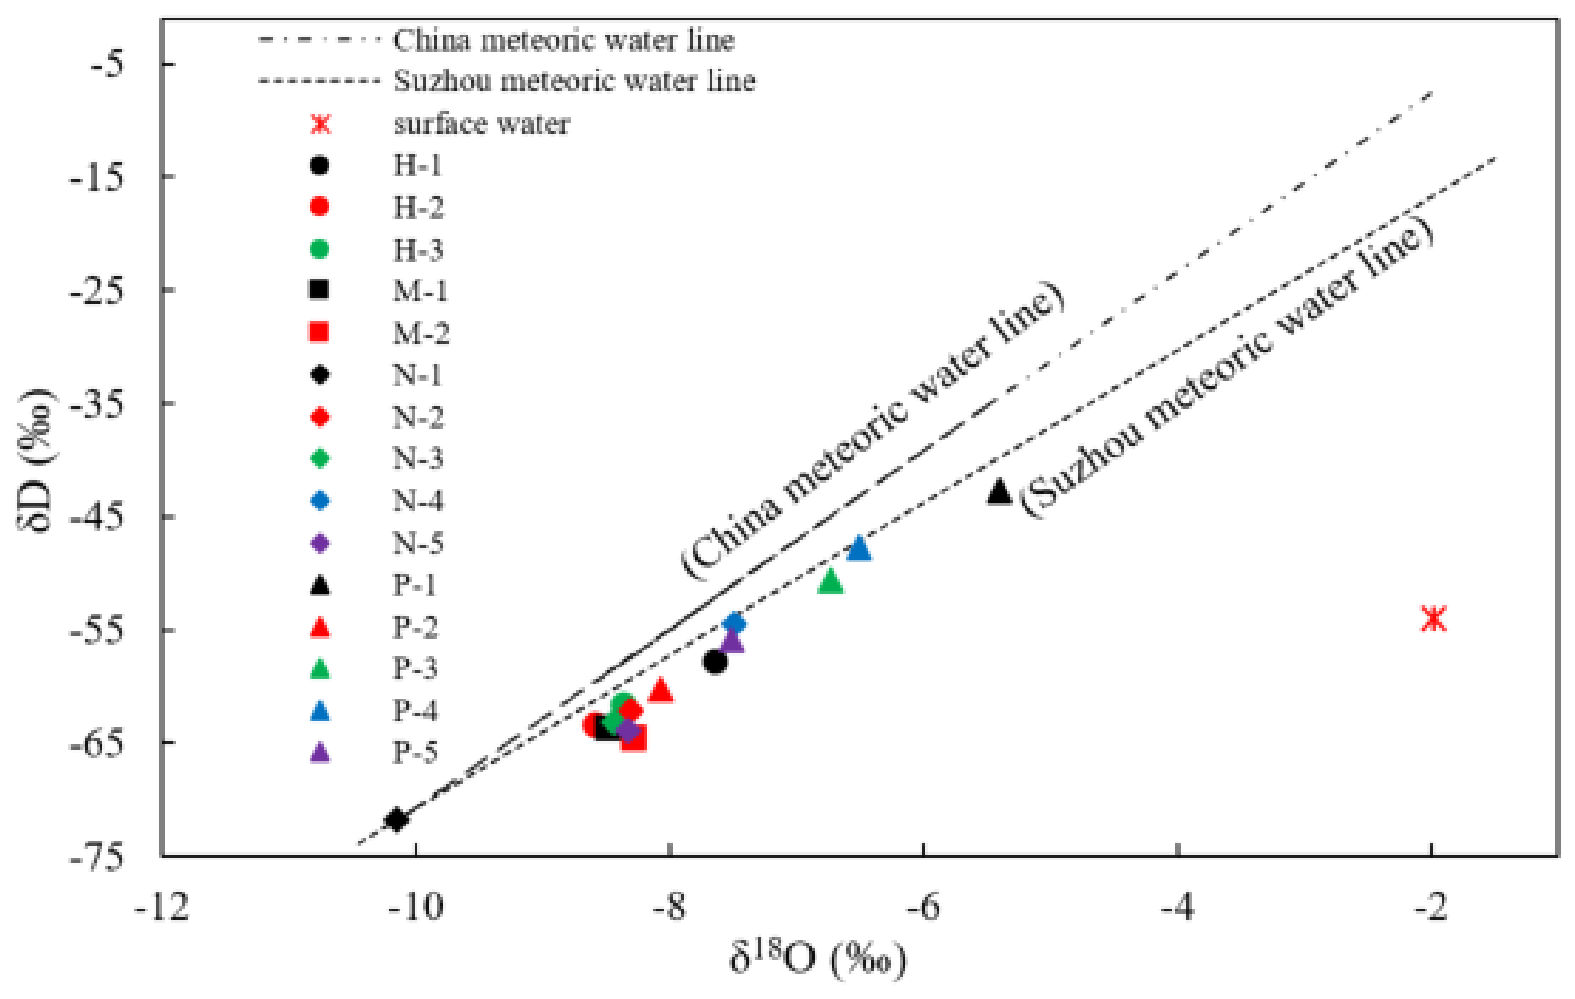
Prior research has found that formation water interacts with surrounding rocks and organic matter, causing isotopes therein to exhibit drift characteristics. The Suzhou atmospheric precipitation line equation used in this study is expressed as δD = 6.74 δ18O − 3.33 [34]. Figure 7 shows that almost all data points fell near the atmospheric precipitation line and were in the lower section, indicating that the water samples in the study area were primarily recharged by atmospheric precipitation. Among them, the water samples of CPSA moved in a direction approximately perpendicular to the atmospheric downwater line, exhibiting D drift characteristics. The water samples from the Q4 aquifer, CTFLA, and OLA moved approximately parallel to the atmospheric precipitation line, exhibiting 18O drift characteristics.
Previous studies have found that trace elements enter water bodies through water–rock interactions and exhibit varying degrees of enrichment in the water [31,35]. By assessing the trace elements in the main coal seam and water samples from different aquifers of coalbed methane wells, the specific contents of eight trace elements (Zn, Ba, Sr, Rb, Mo, Li, Cr, and Co) were determined. Based on these results, the mutual influence of trace elements in the coal seam and water samples from different aquifers was assessed. Figure 8 shows that trace elements in the water samples from different aquifers exhibited similar characteristics. Sr concentration was the highest and Cr and Co the lowest. The contents of Ba and Sr in coal seams were relatively high, while the content of Mo was the lowest. By comparing trace element concentrations in the main coal seam and aquifer water samples, it was observed that the trace elements in the main coal seam were similar to those in the CPSA, with both showing elevated Ba concentrations.

4. Conclusions

By analyzing the characteristics of formation water and coalbed methane well drainage water in the research area, the following conclusions were obtained:
  • The water quality type of coalbed methane well drainage in the research area was predominantly Na–Cl–HCO3, and the water quality type of the aquifer was primarily Na–HCO3. The occurrence environment of the coalbed methane well drainage and aquifer water samples was characterized as enclosed, and HCO3 was mainly derived from bicarbonate produced through the sulfate action of organic matter.
  • The drainage water from coalbed methane wells, as well as the water samples from the Q4 aquifer, CPSA, and CTFLA, were significantly influenced by evaporation and concentration, while the samples from the OLA were primarily affected by water–rock interactions.
  • The water samples from the Q4 aquifer primarily underwent ion exchange between Na+ and K+ in the water and Ca2+ and Mg2+ in the formation minerals. The water samples from coalbed methane wells, CPSA, CTFLA, and OLA primarily underwent ion exchange between Ca2+ and Mg2+ in the water and Na+ and K+ in the formation minerals.
  • The water samples in the study area were uniformly supplied by atmospheric precipitation. The CPSA sample exhibited D drift characteristics. The samples from Q4 aquifer, CTFLA, and OLA displayed 18O drift characteristics. The trace elements in the main coal seam were similar to those in the CPSA water sample, with both exhibiting high Ba content.

Author Contributions

Software, M.D. and X.W.; formal analysis, Y.W. and M.D.; data curation, X.W. and Y.W.; writing—original draft, M.D.; writing—review and editing, C.W. and M.D. All authors have read and agreed to the published version of the manuscript.

Funding

This work was supported by the Key Laboratory of Coalbed Methane Resources and Reservoir Formation Process of the Ministry of Education (China University of Mining and Technology) (2025-002), the Postdoctoral Scientific Research Foundation of Suzhou University (2023BSH004), the Start-up Fund for Doctoral Research of Suzhou University (2020BS024), the Anhui Provincial Research Project on Social Science Innovation and Development (2025CXQ048), and the Anhui Provincial Education Department Scientific Research Project (2025AHGXZK40438).

Data Availability Statement

The original contributions of this study are presented in the article. For further inquiries, please contact the corresponding author.

Conflicts of Interest

The authors declare no conflicts of interest.

References

  1. Karacan, C.; Goodman, G. Analyses of geological and hydrodynamic controls on methane emissions experienced in a Lower Kittanning coal mine. Int. J. Coal Geol. 2012, 98, 110–127. [Google Scholar] [CrossRef] [Scilit] [PubMed]
  2. Moore, T. Coalbed methane: A review. Int. J. Coal Geol. 2012, 101, 36–81. [Google Scholar] [CrossRef] [Scilit]
  3. Qin, S.; Tang, X.; Song, Y.; Wang, H. Distribution and fractionation mechanism of stable carbon isotope of coalbed methane. Sci. China Ser. D-Earth Sci. 2006, 49, 1252–1258. [Google Scholar] [CrossRef] [Scilit]
  4. Wang, B.; Sun, F.; Tang, D.; Zhao, Y.; Song, Z.; Tao, Y. Hydrological control rule on coalbed methane enrichment and high yield in FZ Block of Qinshui Basin. Fuel 2015, 140, 568–577. [Google Scholar] [CrossRef] [Scilit]
  5. Xu, D. Studies on the Characteristic and the Controlling Factors of Hydrochemical Evolution in Suxian Mining Area. Master’s Thesis, Hefei University of Technology, Hefei, China, 2017; pp. 1–5. Available online: https://kns.cnki.net/kcms2/article/abstract?v=4Kwr3-EHKF6f564iELZfoxz5Y0BqN9O8ryxtrE_uSuLyJM-VMG5wofdsO9HFpzFSzX2We5FxvwXDfM89a2R6ZEE0fzr9bU58fbDCf0MQ_9bSquBsWr6VkaDLeuEvbiAvBckr2NJe4YdhzD8VONYbWVLr8nHRMPyMNg4vx7ZwQTUcEWW1iX7dbg==&uniplatform=NZKPT&language=CHS (accessed on 5 September 2025).
  6. Pashin, J.; McIntyre-Redden, M.; Mann, S.; Kopaska-Merkel, D.; Varonka, M.; Orem, W. Relationships between water and gas chemistry in mature coalbed methane reservoirs of the Black Warrior Basin. Int. J. Coal Geol. 2014, 126, 92–105. [Google Scholar] [CrossRef] [Scilit]
  7. Qin, Y.; Shen, J.; Shi, R. Strategic Value and Choice on Construction of CMG Industry in China. J. China Coal Soc. 2022, 47, 371–387. [Google Scholar]
  8. Ye, J.; Wu, Q.; Wang, Z. Controlled characteristics of hydrogeological conditions on the coalbed methane migration and accumulation. J. China Coal Soc. 2001, 26, 459–462. [Google Scholar] [CrossRef]
  9. Fan, L.; Ma, W.; Chang, B.; Sun, K.; Miao, Y.; Lu, B.; Tian, S.; Yang, L. Hydrochemical characteristics and formation mechanism of groundwater in Yushenfu Mining Area. Coal Sci. Technol. 2023, 51, 383–394. [Google Scholar]
  10. Sun, K.; Fan, L.; Ma, W.; Chen, J.; Peng, J.; Zhang, P.; Gao, S.; Li, C.; Miao, Y.; Wang, H. Geochemical characteristics of groundwater about Zhiluo Formation in the northern Ordos Basin and its indicative significance. J. China Coal Soc. 2024, 49, 2004–2020. [Google Scholar]
  11. Chen, L.; Wu, M.; Hou, X.; Hu, Y.; Zhao, M.; Cai, X.; Yin, X.; Shi, X. Spatiotemporal evolutionary patterns of the hydrochemistry of Jurassic conglomerate aquifers under the influence of curtain walls. Coal Geol. Explor. 2025, 53, 174–183. [Google Scholar]
  12. Sun, Y.; Guo, J.; Xu, Z.; Zhang, L.; Chen, G.; Xiong, X.; Hua, J.; Mu, L.; Wu, W. Spatial distribution characteristics of mine water quality in coal mining areas of China and technological approaches for mine water treatment. J. China Coal Soc. 2025, 50, 584–599. [Google Scholar]
  13. Singh, A.; Gupta, S.; Mendhe, V.; Mishra, S. Variations in hydro-chemical properties and source insights of coalbed methane produced water of Raniganj Coalfield, Jharkhand, India. J. Nat. Gas Sci. Eng. 2018, 51, 233–250. [Google Scholar] [CrossRef] [Scilit]
  14. Zhang, X.; Wu, C.; Liu, S. Characteristic analysis and fractal model of the gas-water relative permeability of coal under different confining pressures. J. Pet. Sci. Eng. 2017, 159, 488–496. [Google Scholar] [CrossRef] [Scilit]
  15. Abu Bakar, H.; Zarrouk, S. Geochemical multiaquifer assessment of the Huntly coalfield, New Zealand, using a novel chloride-bicarbonate-boron ternary diagram. Int. J. Coal Geo. 2016, 167, 136–147. [Google Scholar] [CrossRef] [Scilit]
  16. Alley, B.; Beebe, A.; Rodgers, J.; Castle, J. Chemical and physical characterization of produced waters from conventional and unconventional fossil fuel resources. Chemosphere 2011, 85, 74–82. [Google Scholar] [CrossRef] [Scilit] [PubMed]
  17. Hamawand, I.; Yusaf, T.; Hamawand, S. Coal seam gas and associated water: A review paper. Renew. Sustain. Energy Rev. 2013, 22, 550–560. [Google Scholar] [CrossRef] [Scilit]
  18. Wei, M.; Ju, Y. Chemical characteristics and origin of produced waters from coalbed gas field in the southern of Qinshui Basin. J. China Coal Soc. 2015, 40, 629–635. [Google Scholar] [CrossRef]
  19. Zhu, Y.; Sun, B.; Zeng, F.; Xia, P.; Zhang, P.; You, Y. Hydrogeological characteristics of CBM reservoirs and their controlling effects in Gujiao Mining Area, Xishan Coalfield. J. China Coal Soc. 2018, 43, 759–769. [Google Scholar]
  20. Liu, Y.; Fang, M.; Liao, X. Production stages division and drainage production system development of coalbed methane. Clean Coal Technol. 2015, 21, 121–124. [Google Scholar] [CrossRef]
  21. Peng, X.; Xie, X.; Liu, X.; Yang, S. Study on combined coalbed methane drainage system of multi seams in Zhijin Block, Guizhou. Coal Sci. Technol. 2016, 44, 39–44. [Google Scholar] [CrossRef]
  22. Yang, J.; Zhao, Y.; Wang, M.; Wang, B.; Wang, J.; Zhang, J.; Liu, K. Study of key technologies on coalbed methane fracturing and drainage in the southern Qinshui basin. J. China Uni. Min. Technol. 2017, 46, 131–138. [Google Scholar] [CrossRef]
  23. GB/T 14506.30-2010; Methods for chemical analysis of silicate rocks—Part 30: Determination of 44 elements. Standards Press of China: Beijing, China, 2010.
  24. DZ/T 0184.36-2024; Isotopic analysis methods for geological samples—Part 36: Determination of hydrogen and oxygen isotopic compositions of water—Laser spectrometry. Geological Publishing House: Beijing, China, 2024.
  25. Taulis, M.; Milke, M. Chemical variability of groundwater samples collected from a coal seam gas exploration well, Maramarua, New Zealand. Water Res. 2013, 47, 1021–1034. [Google Scholar] [CrossRef] [Scilit] [PubMed]
  26. Van Voast, W. Geochemical signature of formation waters as-sociated with coalbed methane. AAPG Bull. 2003, 87, 667–676. [Google Scholar] [CrossRef] [Scilit]
  27. Huang, H.; Sang, S.; Miao, Y.; Dong, Z.; Zhang, H. Trends of ionic concentration variations in water coproduced with coalbed methane in the Tiefa Basin. Int. J. Coal Geol. 2017, 182, 32–41. [Google Scholar] [CrossRef] [Scilit]
  28. Zong, W.; Zhao, B. Groundwater chemical characteristics and forming reasons of Yuanyanghu Mining Area. Saf. Coal Mines 2023, 54, 161–167. [Google Scholar]
  29. Chen, T.; Xu, Z.; Zhang, X.; Chen, G.; Xiong, X. Zonation characteristics of karst development in Taiyuan formation limestone and its implications for water-conserving mining: A case study of Zhangshuanglou coal mine, North China. Carbonates Evaporites 2025, 40, 65. [Google Scholar] [CrossRef] [Scilit]
  30. Gao, W.; Luo, J.; He, Y.; Wang, X.; Li, X.; Chen, Y.; Wang, L.; Li, X.; He, C.; Yang, Z.; et al. Water Environmental Characteristics and Eutrophication Evaluation of Alpine Karst Mountains in Huanglong, Sichuan, China. ACS Earth Space Chem. 2023, 7, 1083–1096. [Google Scholar] [CrossRef] [Scilit]
  31. Du, M.; Chen, S.; Wu, C. Geochemical Characteristics and Productivity Evaluation of Water Produced from Coalbed Methane Wells in the Laochang Block, Eastern Yunnan. ACS Omega 2023, 8, 47585–47594. [Google Scholar] [CrossRef] [Scilit] [PubMed]
  32. Ma, R.; Wang, Y.; Sun, Z.; Zheng, C.; Ma, T.; Prommer, H. Geochemical evolution of groundwater in carbonate aquifers in Taiyuan, northern China. Appl. Geochem. 2011, 26, 884–897. [Google Scholar] [CrossRef] [Scilit]
  33. Zhang, G.; Deng, W.; He, Y. Hydrochemical characteristics and evolution laws of groundwater in Songnen Plain, Northeast China. Adv. Water Sci. 2006, 17, 20–28. [Google Scholar]
  34. Gui, H.; Chen, L.; Song, X. Drift features of oxygen and hydrogen stable isotopes in deep groundwater in mining area of northern Anhui. J. Harbin Inst. Technol. 2005, 37, 111–114. [Google Scholar]
  35. Wang, W.; Chen, B.; Ding, D.; Peng, S.; Liu, G. Content of Barium, Manganese and Nickel in Coal and Their Hosting State in Panji No.3 Coalmine, Huainan Coalfield. Coal Geol. China 2018, 30, 5–7. [Google Scholar] [CrossRef]
Figure 1. Sampling points and geological map of the study area.
Processes 14 02851 g001
Figure 2. Piper diagram of the water samples in the study area.
Processes 14 02851 g002
Figure 3. Changes in ion concentration and pH of the water samples in the study area. (a) Na++K+; (b) Ca2+; (c) Mg2+; (d) Cl; (e) SO42−; (f) HCO3; (g) CO32−; (h) pH.
Processes 14 02851 g003aProcesses 14 02851 g003b
Figure 4. Gibbs diagram of the study area. (a) Plot of TDS versus ρ(Na++K+)/ρ(Na++K++Ca2+); (b) Plot of TDS versus ρ(Cl)/ρ(Cl+HCO3).
Processes 14 02851 g004
Figure 5. Relationship between CAI1 and CAI2 in the study area.
Processes 14 02851 g005
Figure 6. Ion ratio of the water samples in the study area. (a) Plot of γ(Na+ + K+) versus γ(Cl); (b) Plot of γ(Ca2+ + Mg2+) versus γ(HCO3 + SO42−); (c) Plot of γ(SO42− + Cl) versus γ(HCO3).
Processes 14 02851 g006
Figure 7. Relationship between hydrogen and oxygen isotopes in the water samples from the study area.
Processes 14 02851 g007
Figure 8. Variations in trace elements in the coal seam and aquifer water samples.
Processes 14 02851 g008
Table 1. Water Sampling Details of the Study Area.
Sample CodeDateLocationQuantity (Bottles)
D-1Apr.2024CBM Well2
Jun.2024CBM Well2
Oct.2024CBM Well2
Feb.2025CBM Well2
D-2Apr.2024CBM Well2
Jun.2024CBM Well2
Oct.2024CBM Well2
Feb.2025CBM Well2
D-3Apr.2024CBM Well2
Jun.2024CBM Well2
Oct.2024CBM Well2
Feb.2025CBM Well2
D-4Apr.2024CBM Well2
Jun.2024CBM Well2
Oct.2024CBM Well2
Feb.2025CBM Well2
H-1~H-3Jul.2024Q4 aquifer3
M-1~M-2Jul.2024CPSA2
N-1~N-5Jul.2024CTFLA5
P-1~P-5Jul.2024OLA5
Table 2. Conventional ion data for the produced water samples.
CBM WellsDateNa+K+Ca2+Mg2+ClSO42−HCO3CO32−pH
mg/Lmg/Lmg/Lmg/Lmg/Lmg/Lmg/Lmg/L
D-1Apr.20243195.00 87.55 11.53 5.45 2025.45 5.92 1553.67 0.00 7.74
Jun.20241833.90 83.38 10.98 5.19 1929.00 5.64 1479.69 0.00 7.69
Oct.20241798.97 65.91 10.42 5.79 1812.41 4.32 1440.52 113.23 8.31
Feb.20251740.62 61.56 11.10 5.16 1710.17 5.60 1462.56 50.48 8.10
D-2Apr.20243970.00 153.64 25.73 8.10 2837.14 0.00 1086.34 0.00 7.92
Jun.20242241.13 153.35 24.69 7.79 2836.77 0.00 1085.73 0.00 7.65
Oct.20242108.82 113.43 20.44 8.20 2835.68 3.84 1067.16 73.45 8.19
Feb.20252246.94 101.81 15.38 6.33 2846.70 6.07 928.85 32.81 8.06
D-3Apr.20244802.50 275.93 36.91 12.81 3771.85 2.87 2026.15 0.00 7.52
Jun.20243170.85 275.42 36.45 12.74 3770.72 2.82 2026.08 0.00 7.46
Oct.20242934.32 207.87 29.66 17.37 3512.08 4.32 2246.33 0.00 7.58
Feb.20252990.09 183.72 29.61 13.60 3469.75 6.54 2019.36 0.00 7.62
D-4Apr.20244105.00 177.52 17.68 6.52 2457.63 0.00 1547.96 0.00 7.67
Jun.20242078.49 177.12 17.06 6.14 2457.08 0.00 1547.70 0.00 7.67
Oct.20241891.92 108.36 18.44 1.21 2211.31 4.80 1518.29 85.69 8.06
Feb.20251958.40 99.93 12.86 2.35 2169.94 11.67 1381.73 0.00 7.96
Table 3. Conventional ion data for the aquifer water samples.
Sample CodeNa+ + K+Ca2+Mg2+ClSO42−HCO3CO32−pH
mg/Lmg/Lmg/Lmg/Lmg/Lmg/Lmg/L
H-1103.98 22.67 12.27 152.72 2.47 150.13 0.00 8.50
H-2109.59 198.35 137.46 238.51 609.99 399.49 0.00 7.30
H-3148.23 4.03 9.77 118.67 4.53 151.33 45.62 9.50
M-1592.99 4.05 9.33 229.93 40.34 1185.75 0.00 8.10
M-2449.26 12.08 3.91 155.24 182.34 749.33 0.00 8.20
N-128.06 4.45 7.12 15.44 4.53 49.36 24.03 9.70
N-2174.36 210.50 76.10 205.91 680.99 267.18 0.00 7.60
N-3413.73 111.98 68.88 155.24 540.02 451.55 187.71 7.50
N-450.49 4.86 6.38 20.59 7.41 104.33 17.52 9.80
N-5194.58 204.83 108.99 248.81 676.67 399.49 0.00 8.60
P-1141.61 78.84 17.43 54.91 4.32 207.63 81.09 9.80
P-2190.39 117.39 62.35 181.89 562.45 132.32 7.51 7.40
P-377.07 4.05 2.95 56.65 2.47 100.76 23.53 9.40
P-462.78 5.67 3.93 32.60 42.39 43.26 32.54 10.50
P-598.38 16.19 13.26 97.81 136.65 20.36 7.51 9.40
Table 4. Hydrogen and oxygen isotope data for the aquifer water samples.
Sample Codeδ18O/‰Sample CodeSample CodeδD/‰Sample Code
H-1−7.64 −8.48 M-1H-1−57.77 −63.57 M-1
H-2−8.59 −8.28 M-2H-2−63.42 −64.48 M-2
H-3−8.36 −10.15 N-1H-3−61.58 −71.83 N-1
P-1−5.40 −8.31 N-2P-1−42.76 −62.10 N-2
P-2−8.07 −8.44 N-3P-2−60.23 −63.15 N-3
P-3−6.73 −7.49 N-4P-3−50.57 −54.45 N-4
P-4−6.50 −8.33 N-5P-4−47.69 −63.91 N-5
P-5−7.51 −1.99 surface waterP-5−55.80 −53.99 surface water
Table 5. Trace element data for the aquifer water samples.
Sample CodeZnBaSrRbMoLiCrCo
μg/Lμg/Lμg/Lμg/Lμg/Lμg/Lμg/Lμg/L
H-1140.30 55.46 189.27 2.14 392.83 5.18 2.46 0.32
H-241.43 32.08 4913.17 25.99 267.67 146.07 2.77 0.76
H-39.97 55.95 63.85 2.35 2.51 18.09 1.85 0.03
M-17.07 548.26 370.00 6.97 35.49 62.70 2.19 0.08
M-22.75 63.37 383.44 2.28 25.10 7.32 2.82 0.14
N-12.80 7.63 194.26 6.41 0.66 31.55 0.87 0.07
N-26.52 21.69 6483.94 63.18 41.68 260.75 2.81 0.42
N-35.12 18.92 4543.91 19.29 12.50 189.42 2.26 0.22
N-43.46 51.92 106.56 5.79 0.57 7.72 0.91 0.02
N-55.51 21.98 6849.92 52.88 27.66 229.71 2.84 0.54
P-112.47 13.39 22.99 15.34 3.01 29.21 3.18 0.11
P-2285.25 40.50 2741.69 63.55 225.38 223.60 2.34 0.49
P-317.78 6.16 38.89 7.20 1.80 34.73 1.50 0.04
P-410.99 3.34 26.85 7.94 2.03 26.48 0.86 0.07
P-52.18 20.33 419.37 12.29 1.02 76.42 1.39 0.05
Table 6. Trace element data for the coal samples.
Sample CodeZnBaSrRbMoLiCrCo
μg/gμg/gμg/gμg/gμg/gμg/gμg/gμg/g
C-17.58 109.99 169.62 1.52 5.46 13.07 15.38 22.75
C-231.03 1204.50 761.13 21.61 1.23 223.29 105.59 65.52
C-361.52 3120.09 872.99 13.33 2.50 209.08 151.60 10.80
C-46.33 125.53 89.56 5.66 0.70 18.09 28.10 5.17
Note: C-1, C-2, C-3, and C-4 correspond to Coal Seams 6, 7, 8, and 9, respectively.
Disclaimer/Publisher’s Note: The statements, opinions and data contained in all publications are solely those of the individual author(s) and contributor(s) and not of MDPI and/or the editor(s). MDPI and/or the editor(s) disclaim responsibility for any injury to people or property resulting from any ideas, methods, instructions or products referred to in the content.