1. Introduction
In recent years, with the rapid development of pulsed power technology, the controllability and reliability of liquid pulsed discharge have been significantly improved. As a liquid dielectric medium, the dielectric characteristic of water relies on the high-density uniformity of its physical properties. Bubbles generated during the discharge process form “air gap defects” in water, which destroy the uniformity of the water medium [
1,
2,
3,
4]. Due to the low insulation strength of gases, bubbles become the weak link in the entire insulation system. Even at post-breakdown, residual bubbles remain in water for a long time, thereby impeding the complete dielectric recovery.
Research on underwater discharge has been conducted on several key aspects, including the pre-discharge, breakdown, shock-wave propagation, bubble pulsation, and dielectric recovery processes [
5,
6,
7,
8,
9]. Among these physical processes, bubble pulsation acts as the dominant factor governing the post-breakdown dielectric recovery of water, since the low-density vapor inside the bubble significantly reduces the breakdown strength of the gap. Dielectric recovery characteristics—including dielectric recovery voltage and recovery time—are critical parameters for evaluating the self-recovery performance of the medium and exert a significant influence on repetitive-frequency underwater discharge [
10]. Studies have shown that the duration of bubbles (or density variations) typically spans several milliseconds, whereas the lifetime of discharge plasma is merely a few microseconds.
The theoretical system of bubble dynamics has been developed for over a century. As summarized In the classic review by Plesset and Prosperetti [
11], the evolution from the Rayleigh incompressible model to the Rayleigh–Plesset (R-P) equation with surface tension and viscosity corrections has established the fundamental framework for spherical bubble pulsation analysis. To solve the nonphysical divergence of bubble wall velocity in the collapse stage, Keller and Miksis proposed the Keller–Miksis (K-M) equation accounting for liquid compressibility [
12], which greatly improves the prediction accuracy of large-amplitude bubble oscillation and collapse behavior.
Extensive studies have been carried out on the dynamic characteristics of cavitation bubbles from both experimental and numerical perspectives, laying a solid theoretical foundation for this work. Ma et al. [
13] studied how different boundaries affect spark bubble dynamics, revealing the effects of shape and distance on bubble behavior. Li et al. [
14] linked bubble pulsation periods to their maximum size, noting the influence of electrode structure. In terms of liquid physical property effects, Luo et al. [
15] generated cavitation bubbles via spark discharge combined with high-speed photography and pressure measurement and found that elevated viscosity prolongs the collapse period of cavitation bubbles, increases the rebound radius, and alters the energy distribution of bubbles. Based on the Gilmore equation and VOF model, Sami et al. [
16] conducted numerical simulations of cavitation bubble growth and collapse near a rigid wall, finding that surface tension has no significant effect on bubble collapse. Zhang et al. [
17] established a unified bubble dynamics theory considering multiple physical factors, which improved the prediction accuracy of bubble migration and collapse pressure pulses compared with previous models. Recent studies further coupled interfacial non-equilibrium phase-change mass transfer into compressible bubble dynamics models. Chen et al. [
18] confirmed through cryogenic cavitation experiments that interfacial condensation dominates the energy dissipation during the first bubble collapse and accelerates the attenuation of subsequent pulsations. These studies have established the effects of boundary conditions, electrode geometry, and liquid properties on cavitation bubble dynamics; however, most were not coupled with dielectric recovery analysis for underwater discharge gaps.
As a core component of pulsed power modulators, liquid dielectric switches directly determine the operational stability. The systematic investigation into water post-breakdown phenomena was pioneered by Xiao et al. [
19], who first characterized the plasma afterglow, shock-wave emission, and millisecond-scale vapor-bubble evolution in micro-gap water switches using Schlieren imaging and pulse-probe techniques. Experimental studies concerning density variation and dielectric recovery in high-pressure CO
2 have been previously reported by Yang et al. [
20]. They clarified that two distinct recovery mechanisms dominated by bubble pulsation and density relaxation, respectively, and confirmed that the supercritical phase has a shorter recovery time and higher steady-state recovery rate. For water media, they obtained the three-stage law of dielectric recovery through the dual-pulse method, and divided the recovery process into complete recovery, second-pulsation bubble effect, and first-pulsation bubble effect, directly confirming that bubble pulsation is the core factor determining the dielectric recovery process of water. Yang et al. [
21] have previously conducted experimental studies on the bubble pulsation and dielectric recovery characteristics of underwater discharge. Using the dual-pulse method, we obtained the variation law of the second breakdown voltage with bubble pulsation. Furthermore, we simulated and analyzed the bubble pulsation process using a modified Rayleigh–Plesset (R-P) model and investigated the influence of internal bubble pressure on the second breakdown voltage under isothermal conditions [
22]. However, the simplified R-P model has limited accuracy in describing the liquid compressibility effect, especially in the collapse stage where the bubble wall velocity approaches the sound speed, and the isothermal assumption also deviates from the actual situation of dramatic temperature rise inside the bubble during collapse. For the water vapor breakdown mechanism, Hasegawa et al. [
23] systematically measured electron swarm parameters such as ionization coefficient, drift velocity, and secondary electron emission coefficient of water vapor in a wide range of reduced electric fields, providing fundamental data for gas-phase insulation analysis of bubble gaps. Nevertheless, most existing calculations of bubble gap breakdown voltage adopt the classical isothermal Paschen’s law, which fails to capture the significant effect of sharp temperature rise during bubble collapse on the breakdown threshold, further restricting the prediction accuracy of dielectric recovery characteristics in the collapse stage.
Currently, a more sophisticated model is required to analyze the key influencing factors of bubble pulsation and dielectric recovery. Specifically, it is necessary to simulate and calculate the second breakdown voltage during the bubble collapse stage while considering the temperature change inside the bubble. To address the above research gaps, we established the Keller–Miksis equation coupled with interfacial mass transfer to describe bubble pulsation, which can more accurately characterize the coupled heat transfer and phase change mass transfer processes in bubble pulsation. On this basis, we analyzed the evolution of internal bubble pressure and temperature from the maximum-radius stage to the initial collapse stage and calculated the second breakdown voltage in the initial collapse stage by introducing a temperature-corrected Paschen’s law. Additionally, the effects of the phase change mass transfer coefficient on the dielectric recovery process are further investigated. This study proposes a dielectric recovery characteristic model for underwater discharge, providing a simulation basis for investigating the influencing factors of repetitive-frequency underwater discharge.
It should be emphasized that the “secondary breakdown” in underwater discharge is a fluid-bubble dynamics-governed phenomenon: the presence of the cavitation bubble transforms the gap medium from homogeneous liquid water into a heterogeneous gas–liquid system. The breakdown voltage is no longer a property of liquid water alone but is dictated by the instantaneous thermodynamic state of the vapor bubble, which evolves continuously under the coupled effects of liquid inertia, surface tension, viscosity, and interfacial phase-change mass transfer.
2. Brief Description of Experiment
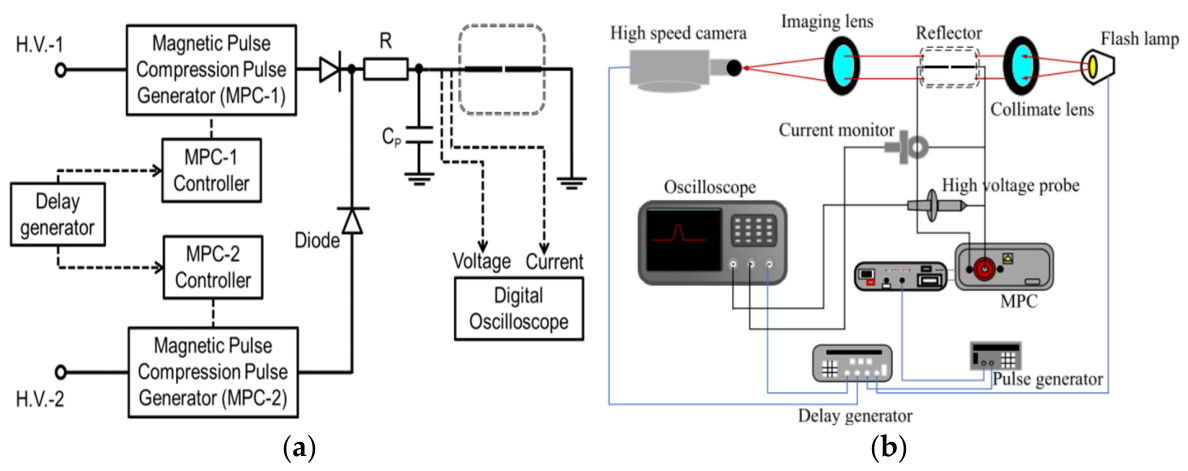
This study follows the previous work based on the bubble evolution simulation perspective and describes related experimental investigations. To validate the model, the experimental data are obtained from pulsed power discharges in water implemented by a magnetic pulse compression (MPC) circuit.
The experimental setup employs stainless steel rod-to-rod electrodes with a fixed gap of 0.05 mm. To measure the water recovery characteristics, two consecutive pulses were applied to the water gap at a temperature of 20 °C, each triggered by a delay generator.
Figure 1 shows a schematic diagram of the experimental apparatus: (a) dual-pulse measurement setup and (b) bubble observation device. The water quality parameters include the following: density of water P
∞ = 1000 kg/m
3, surface tension coefficient σ = 0.0728 N/m, viscosity μ is 0.001 Pa·s, temperature of water is 293 K, ambient pressure P
∞ = 0.1 MPa. More technical details can be found in references [
21,
22].
The second breakdown voltage is measured by the dual-pulse method. The magnetic pulse compression circuit generates two consecutive high-voltage pulses with precisely adjustable time intervals. The first pulse triggers the initial breakdown of the water gap and forms the cavitation bubble. A delay generator is used to accurately control the time interval between the two pulses, and the second pulse is applied to the gap at the preset delay moment. A high-voltage probe is adopted to collect the instantaneous voltage across the electrodes, and the voltage waveform is synchronously recorded by a digital oscilloscope. The peak value of the second pulse when the gap breaks down again is taken as the second breakdown voltage at the corresponding delay time.
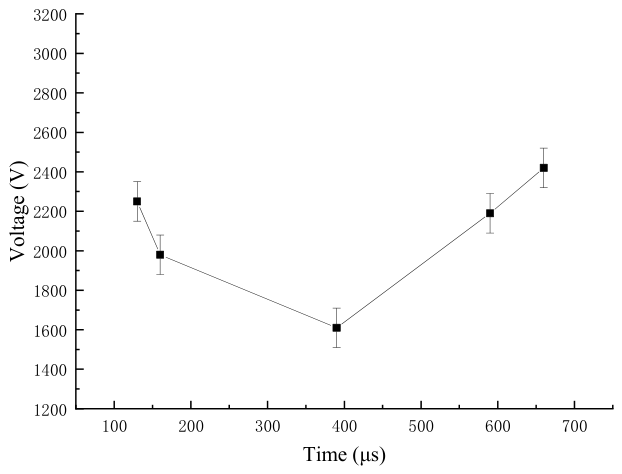
Figure 2 shows the variation curve of the secondary breakdown voltage measured by an oscilloscope, with each data point obtained from ten repeated measurements; the plotted values represent the averages of these measurements. All data points are distributed between two amplitude curves corresponding to trigger times of 130 μs, 160 μs, 390 μs, 590 μs, and 660 μs.
The “secondary breakdown” in this study refers to the re-establishment of discharge through the electrode gap when a cavitation bubble (generated by the first pulse) still resides within the gap. Unlike the primary breakdown, which occurs in pure liquid water, the secondary breakdown takes place in a gas–liquid two-phase medium, where the breakdown path preferentially traverses the low-density vapor region inside the bubble. The physical state of the gap medium at the moment of breakdown is characterized by the following:
- (1)
Inside the bubble: vapor at pressure Pv and temperature Tv;
- (2)
Outside the bubble: liquid water at ambient pressure P∞ and temperature T∞;
- (3)
The breakdown voltage is governed by the Townsend criterion applied to the vapor phase, as the electron avalanche initiates and propagates within the bubble interior where the insulation strength is orders of magnitude lower than that of liquid water.
As shown in
Figure 2, the five measurement points (130 μs, 160 μs, 390 μs, 590 μs, 660 μs) correspond to distinct stages of the first bubble pulsation (see
Figure 3):
- (1)
At 130 μs and 160 μs, the bubble is in the gradual expansion stage; internal pressure Pv begins to drop below saturated vapor pressure, leading to a decrease in breakdown voltage;
- (2)
At 390 μs, the bubble reaches its maximum radius Rmax; internal pressure is at its minimum, corresponding to the valley of the U-shaped curve;
- (3)
At 590 μs, the bubble is in the gradual contraction stage; internal pressure recovers as R decreases, causing a slight increase in breakdown voltage;
- (4)
At 660 μs, the bubble enters the initial collapse stage; rapid compression causes P
v and T
v to surge (as shown in
Section 3.4), dramatically enhancing electron-molecule collision losses and requiring substantially higher breakdown voltage.
As shown in
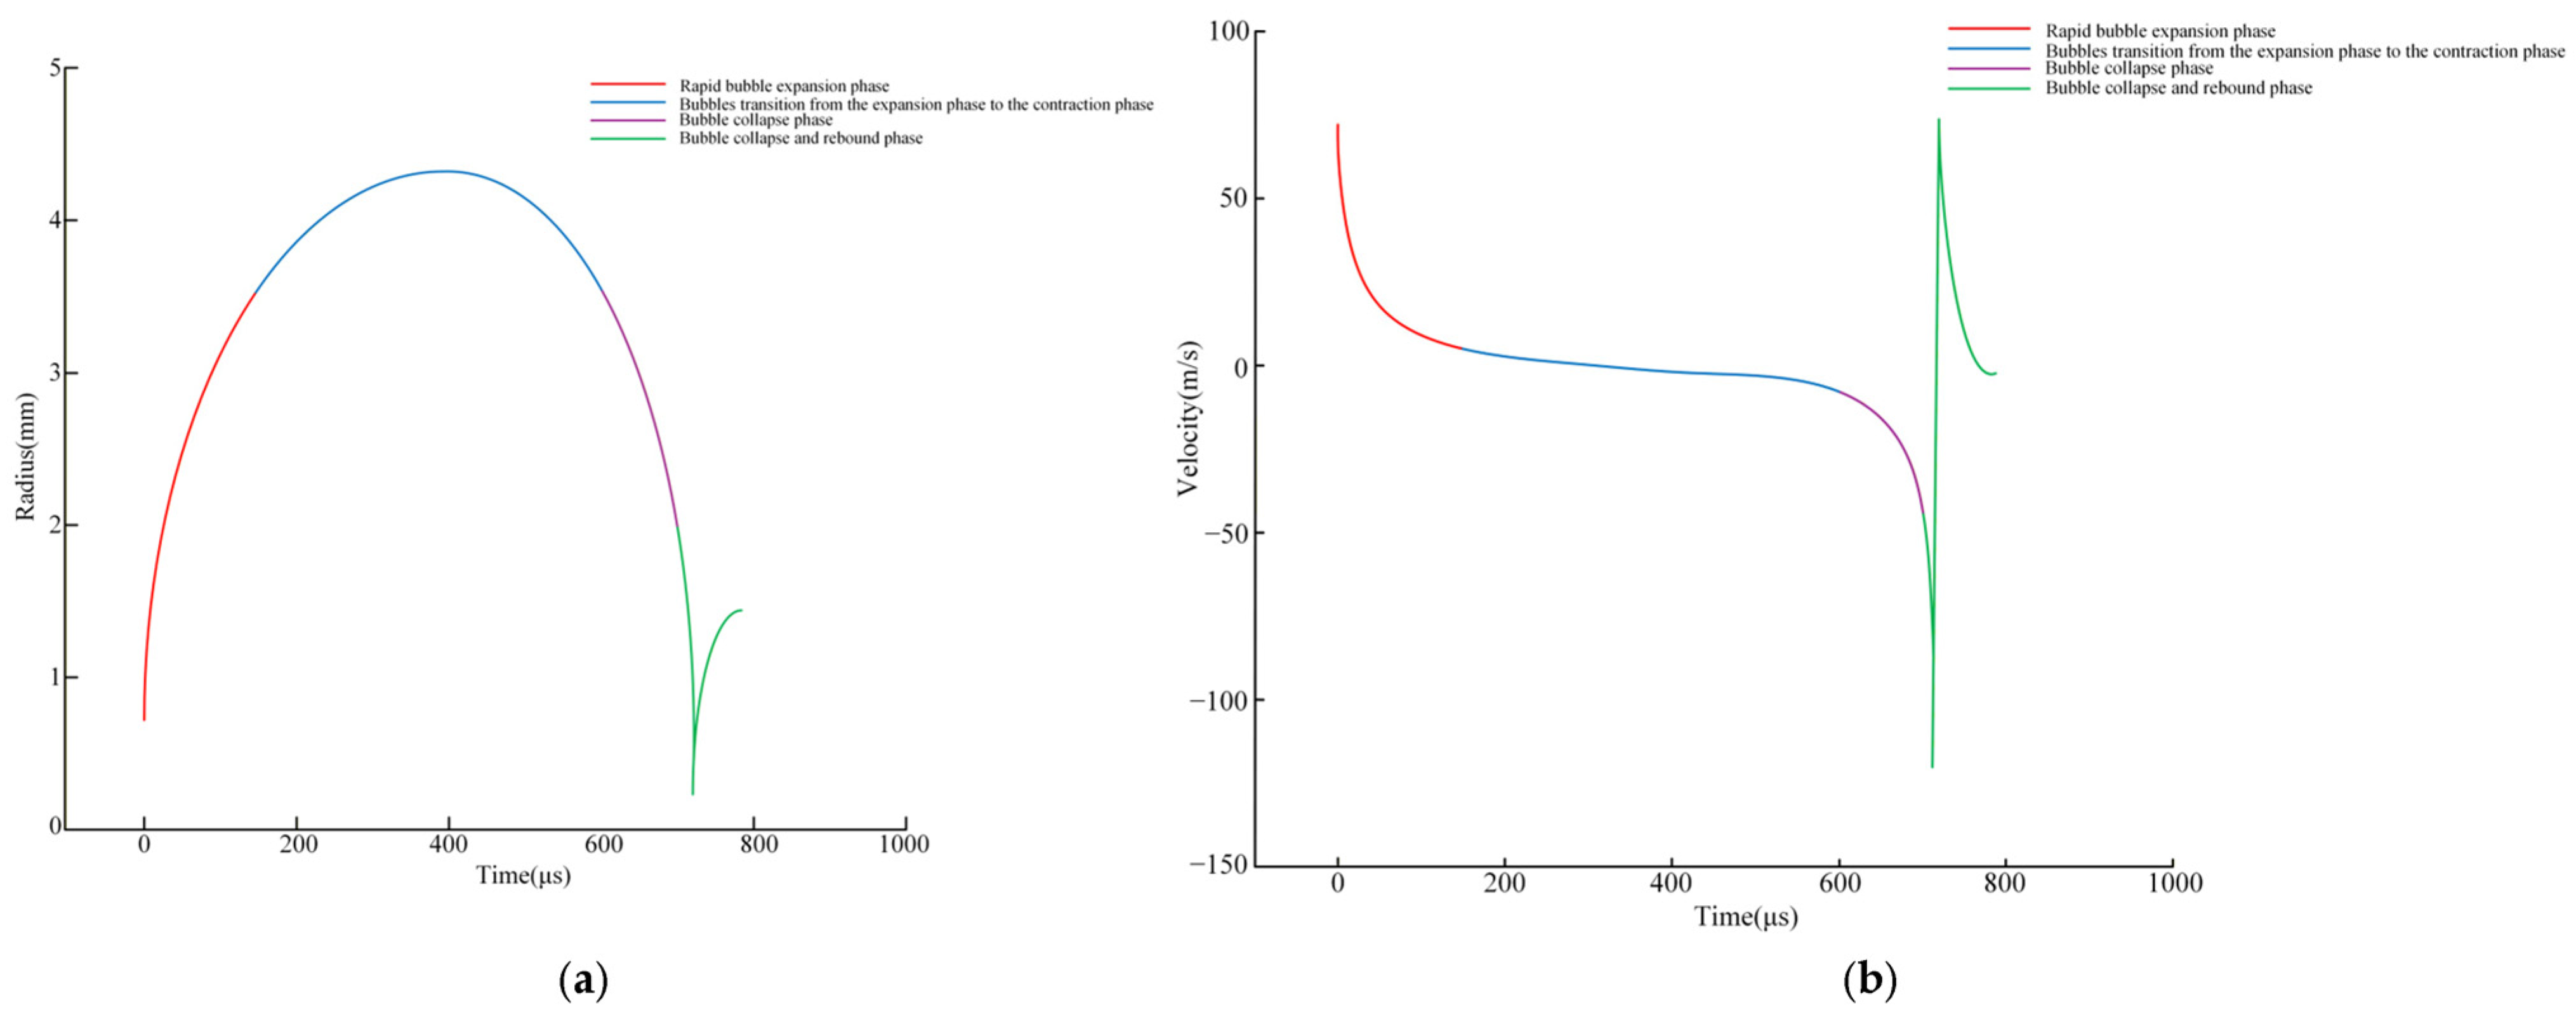
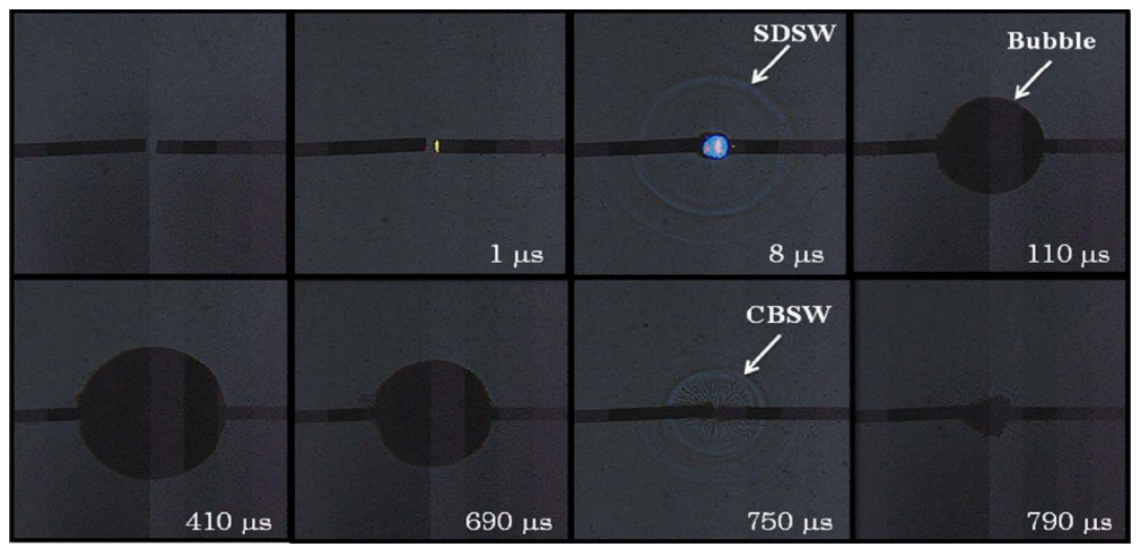
Figure 4, high-speed shadowgraphy was employed to observe the evolution of the first bubble pulsation of underwater pulsed discharge; a bubble rapidly forms at the electrode gap and expands continuously, reaching its first maximum radius at approximately 410 μs. The bubble then transitions from expansion to contraction, completing its first collapse around 750 μs. After this initial collapse, the bubble rebounds and enters subsequent pulsation cycles, with the maximum radius decreasing progressively in each cycle—exhibiting characteristic damped pulsation behavior. The measured results of the bubble shape are presented in
Figure 3. The whole process of the first bubble pulsation lasted approximately 770 μs. As can be seen in
Figure 3, from initiation to 145 μs, the bubble underwent rapid expansion, as indicated by the red line; and from 145 μs to 600 μs, the bubble changed gradually from expansion to contraction, as indicated by the blue line; while in the collapse stage, from 600 μs to 770 μs, the bubble exhibited drastic changes in radius and velocity. During the collapse stage, compared with the last collapse-rebound stage (from 700 μs to 770 μs), the changes in bubble radius and velocity are much slower in the initial collapse stage (from 600 μs to 700 μs). The initial collapse stage is indicated by the purple line, and the last collapse-rebound stage is indicated by the green line, as shown in
Figure 3.
3. Model Construction and Validation
3.1. Model Assumptions
In order to focus on bubble pulsation and dielectric recovery, the theoretical model is based on the following assumptions: (1) the bubble is a symmetric sphere; (2) the effects of gravity are negligible; (3) the vapor inside the bubble is an ideal gas, and dissolved air is neglected; and (4) the water is regarded as a compressible medium, and the model is established under the weakly compressible medium assumption.
For the spark-generated bubble in this study, the internal gas is assumed to consist solely of water vapor. This simplification is justified by: (i) the discharge channel temperature exceeds 10
4 K, causing massive water vaporization that dominates the gas composition [
5,
24]; (ii) the diffusion timescale of dissolved air (~ms) is much longer than the first pulsation period (~770 μs).
3.2. Model of Cavitation Bubble
For a spherically pulsating bubble in an infinite liquid domain, the velocity potential
satisfies the linear wave equation in spherical coordinates [
25]:
The fundamental solution of the above equation is a retarded point-source potential:
where f is the source strength function, and
denotes the retarded time accounting for the finite propagation speed of pressure waves.
The kinematic boundary condition at the bubble wall (r = R) requires that the radial fluid velocity equals the bubble wall velocity:
For the dynamic boundary condition, the unsteady Bernoulli equation is applied at the bubble interface:
where
is defined as the enthalpy difference across the bubble wall, i.e.,
Here,
is the liquid pressure at the bubble surface and
is the ambient pressure of liquid at infinity. Under the weakly compressible assumption, the liquid density
is approximately constant
, so the leading-order approximation of H is
According to the normal stress balance at the gas–liquid interface, the liquid-side pressure
is related to the internal vapor pressure
by
where the terms on the right-hand side represent the internal vapor pressure, the capillary pressure due to surface tension, and the viscous stress, respectively. In the classical Keller–Miksis framework, the internal pressure P
g comprises non-condensable gas pressure and saturated vapor pressure. In this work, following Model Assumption (3) that dissolved air is neglected, the non-condensable gas pressure is set to zero. Consequently, P
v in Equation (7) represents both the internal vapor pressure and the total internal pressure P
g.
Substituting the above expression into Equation (6) yields the explicit form of the enthalpy difference:
By substituting Equations (1)–(8) into the Bernoulli equation and performing the retarded-time derivative operation, the time derivative of is naturally incorporated into the equation. After algebraic simplification, the Keller–Miksis equation for compressible bubble pulsation is obtained as follows.
In this paper, the Keller–Miksis equation is used to establish a bubble model for describing bubble pulsation in a compressible medium. The equation is expressed as follows [
24],
where μ is the viscosity of water, σ is the surface tension; both the two parameters vary the internal pressure, maintain bubble expansion, and affect the bubble radius.
This paper uses a theoretical model that accounts for the bubble internal temperature T distribution. The bubble internal pressure and temperature are expressed as [
18,
26]
The symbols in the equations are defined as follows:
is the vapor pressure inside the bubble,
is the rate of change in the vapor pressure inside the bubble with respect to time,
is the vapor temperature inside the bubble,
is the rate of change in the vapor temperature inside the bubble with respect to time,
(461.89 J/(kg·K)) is the specific gas constant of water vapor, and
is the net condensation rate per unit area per unit time.
(γ
v = 1.3265) is the adiabatic index of the vapor,
is the non-equilibrium interphase mass transfer efficiency coefficient,
is the ambient temperature of the liquid in the far field, and P
s (2340 Pa) is the saturated vapor pressure at ambient liquid temperature [
27].
It should be noted that while the internal vapor is treated as a perfect ideal gas, the non-equilibrium phase transition is dynamically compensated via the mass transfer term
. Following the experimental and theoretical findings of Geng et al. [
24] on spark-generated bubbles in water, the coefficient
is set from 0.02 to 0.08, which is an empirical coefficient. This value reflects the condensation effect during the bubble’s first collapse stage and the second-pulsation stage. Although the temperature inside the bubble rises dramatically during the collapse stage, the characteristic relaxation time of phase equilibrium (~ns) is orders of magnitude shorter than the bubble dynamic timescale (~μs) [
27]. Therefore, the ideal gas assumption, corrected by
, is deemed valid for capturing the thermodynamic evolution of the bubble under the present experimental conditions.
3.3. Solution Method
The computational model employed in this study to characterize the bubble pulsation process is centered on the K-M equation. Combined with the governing formulas for the variations in internal pressure and temperature inside the bubble as well as gas–liquid mass transfer, it constitutes a set of strongly nonlinear and multi-physics coupled equations.
On account of the rapid motion of the bubble wall and the interactive effects of mass transfer involved in the equations, no analytical solution can be acquired via direct derivation. Thus, numerical calculation is adopted to resolve the temporal evolution of the bubble radius, motion velocity, internal pressure, and internal temperature.
The fourth-order Runge–Kutta algorithm is selected in this paper to solve the above coupled equations. This algorithm features high computational accuracy and stability for solving transient dynamic problems such as bubble evolution and can precisely reproduce the variation patterns throughout the whole process of bubble expansion and contraction. In the calculation process, the mass transfer of water is directly introduced into the K-M equation for computation, with its effects fully incorporated into the solution of bubble motion.
The numerical simulation starts from the moment when the bubble reaches its gradual expansion stage (145 μs). The initial conditions are set as R
0 = 3.51 mm, V
0 = 1.89 m/s (measured from high-speed shadowgraphy,
Figure 4), T
v0 = T
∞ = 293 K, P
v0 = P
s = 2340 Pa. This initialization method assumes the internal state of the bubble during the gradual expansion stage to reach thermal equilibrium with the ambient liquid.
3.4. Bubble Model Validation
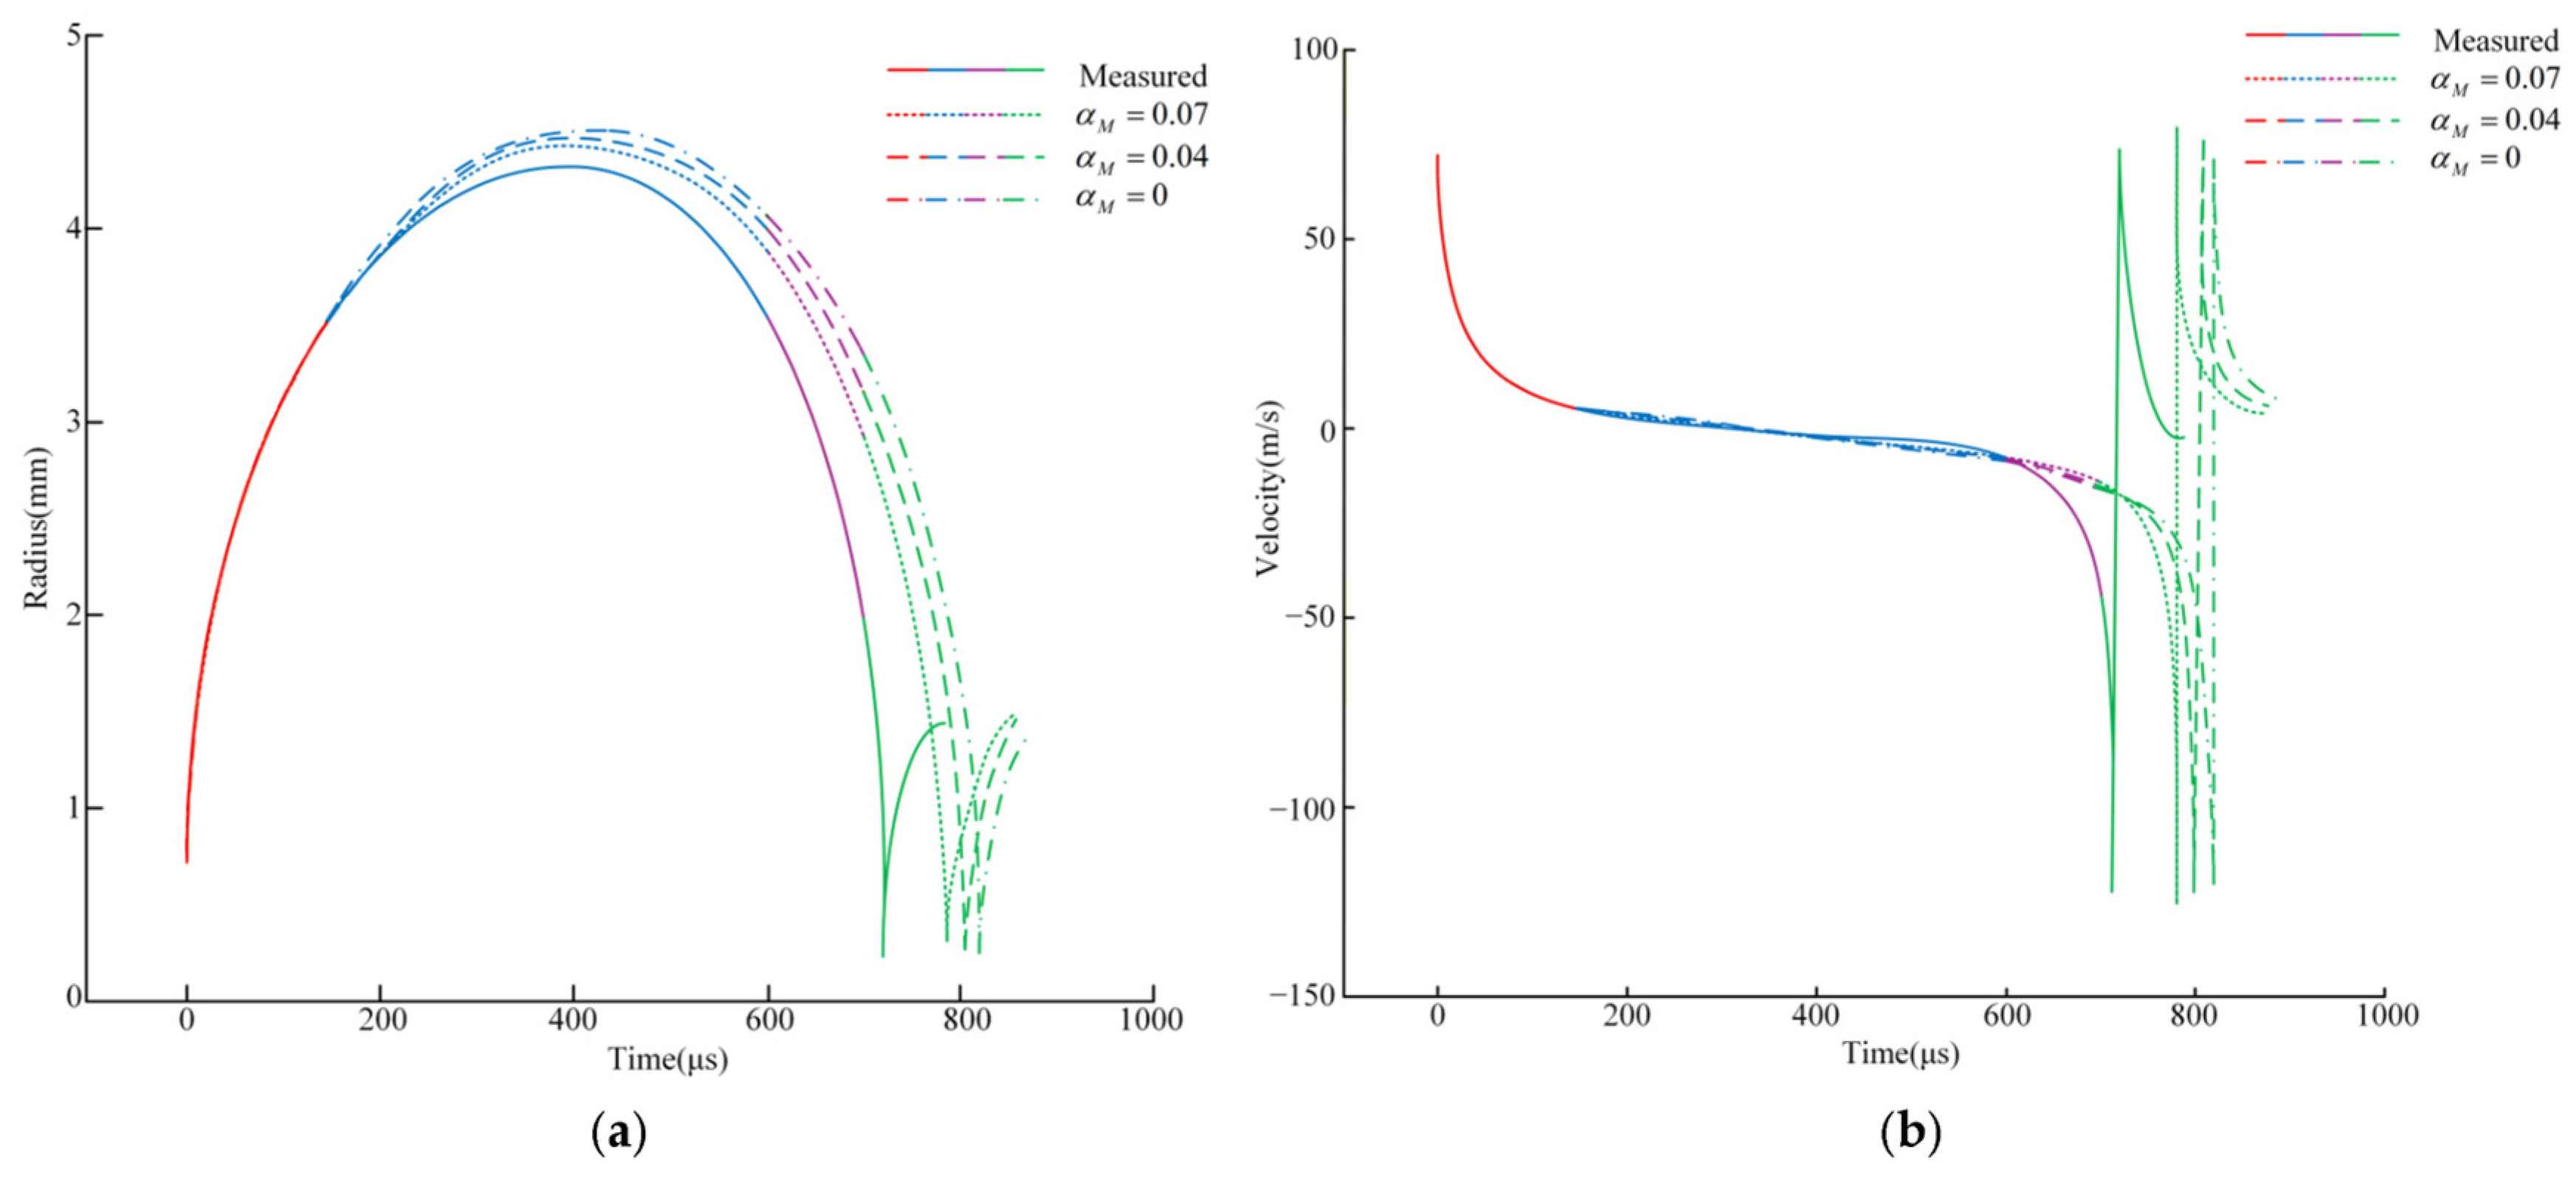
Based on the established numerical model of a cavitation bubble, we traced the evolution of the first bubble pulsation and plotted the bubble radius and bubble velocity in
Figure 5. The model takes into account phase change, and the value of
is set to 0.04 and 0.07. Zhang’s model [
17] is also studied and compared with the current bubble model, due to no phase transition in Zhang’s model, that is,
equals zero. Compared with the three data sets, as shown in
Figure 5, the calculated bubble radii have the same tendencies as experimental data. The relative errors of the maximum bubble radius (Rmax) and the pulsation period (T) at the end of the first pulsation cycle are evaluated. For the optimal case (
= 0.07), the relative error of Rmax is controlled within 4.8%, and the error of T is approximately 3.2%, indicating a high fidelity of the proposed model in capturing the dynamic characteristics of bubble pulsation.
Table 1 shows three sets of control experiments, with all initial conditions being exactly the same.
To isolate the contributions of model mechanism improvement and parameter optimization, we conducted a controlled comparison with unified initial conditions. The relative error in pulsation period T prediction is
- (1)
Case A (Zhang, no phase change): 6.3%;
- (2)
Case B (present model, = 0.04): 5.1%;
- (3)
Case C (present model, = 0.07): 3.2%.
The improvement from the model mechanism (Case A → Case B) contributes 3.1% of error reduction, while parameter optimization (: 0.04 → 0.07, Case B → Case C) contributes 1.9%. This decomposition confirms that the phase-change coupling is the dominant factor, with parameter tuning playing a secondary role.
The observed discrepancies arise from multiple sources: (i) the spherical symmetry assumption neglects micro-jet effects during late collapse; (ii) the selection of initial conditions—particularly the assumption Pv0 = Ps ignores the possible presence of residual plasma pressure. The observed discrepancies confirm the model’s robustness within acceptable limits.
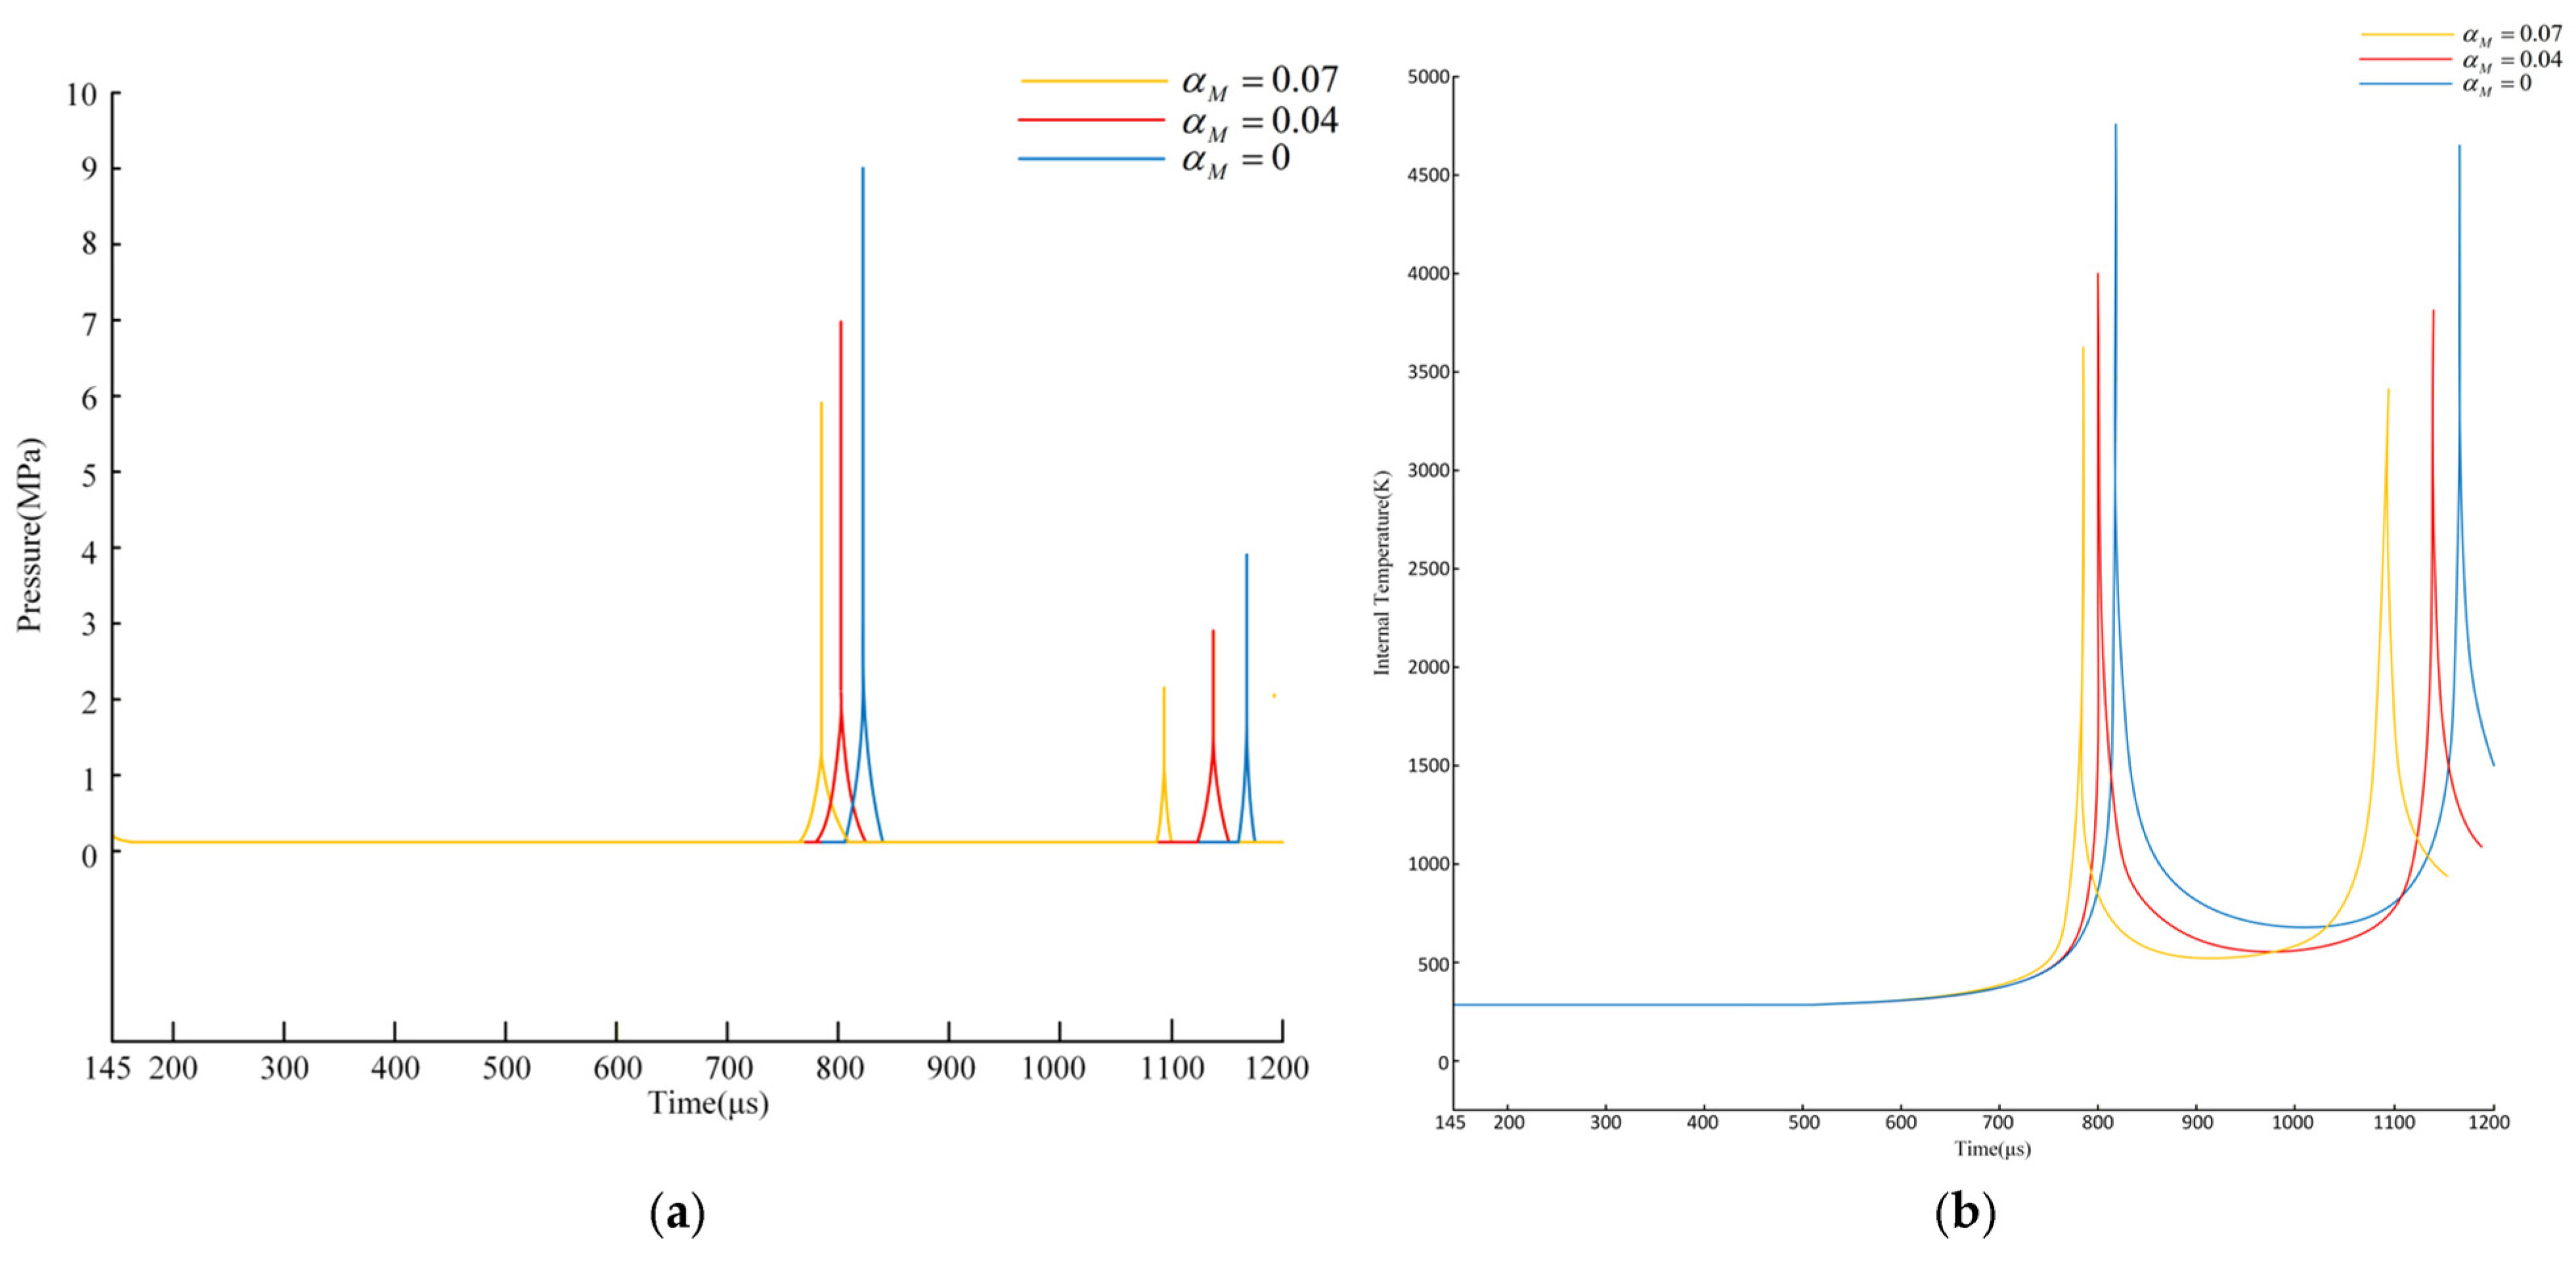
Figure 6 shows the temporal evolution of internal pressure (
Figure 6a) and temperature (
Figure 6b) inside the bubble with different phase-change mass transfer coefficients. During the gradual expansion–contraction stage (145 μs–600 μs), the internal pressure and temperature vary slightly, and the bubble temperature remains close to the ambient water temperature of 293 K. The curves under different
almost coincide in this stage, indicating that phase-change mass transfer has little effect on the bubble thermodynamic state, which is consistent with the conclusion that the first pulsation is dominated by liquid inertia. When the bubble enters the initial collapse stage, the rapid volume compression leads to a sharp rise in internal pressure and temperature. As
increases, the peak values of pressure and temperature decrease significantly, since stronger interfacial condensation removes more vapor mass and latent heat and weakens the adiabatic compression effect. These evolution laws of the internal thermodynamic state provide a core basis for the calculation of the second breakdown voltage.
3.5. Calculation of Second Breakdown Voltage and Validation
In the context of fluid-bubble dynamics, the secondary breakdown voltage Vb is the minimum voltage that must be applied across the electrode gap to initiate a self-sustaining electron avalanche within the vapor bubble. The breakdown occurs when the reduced electric field E/N inside the bubble reaches the critical value for Townsend ionization. Since the bubble interior is a low-density vapor region, its dielectric strength is 1–2 orders of magnitude lower than that of the surrounding liquid water. Therefore, the breakdown path invariably selects the bubble interior as the preferential channel, and Vb is fundamentally determined by the thermodynamic state (Pv, Tv) of the vapor at the instant of pulse arrival.
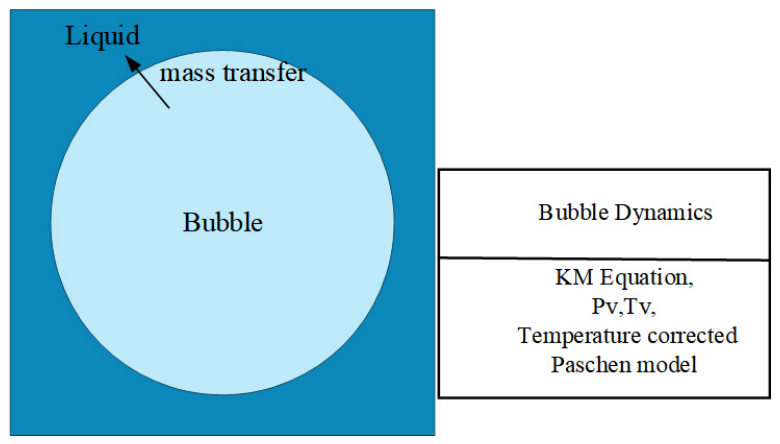
Figure 7 depicts the coupling framework for calculating the dielectric recovery characteristics of the discharge gap. In this framework, the Keller–Miksis equation coupled with interfacial phase-change mass transfer is first solved to obtain the transient bubble radius, internal pressure, and internal temperature. The time-varying thermodynamic parameters inside the bubble are then imported into the temperature-corrected Paschen model to calculate the transient second breakdown voltage. This framework breaks through the limitation of the traditional isothermal assumption and realizes the quantitative association between bubble pulsation behavior and gap dielectric recovery performance in the initial collapse stage.
In our previous paper [
22], an isothermal assumption was employed, where the bubble internal temperature was fixed at the ambient water temperature (293 K). While this simplified correlation captured the general trend during the gradual expansion–contraction stage, it failed to account for the significant temperature rise during collapse. To address this limitation, we derive a temperature-corrected breakdown voltage formula based on Townsend discharge theory [
28], correlating the breakdown voltage with both internal pressure and temperature.
The first Townsend ionization coefficient α satisfies
where E is the electric field strength, and the temperature-corrected coefficients are defined as
Substituting
into the Townsend breakdown criterion
and replacing
with
, the final breakdown voltage formula is obtained:
Compared with the isothermal model, this formula dynamically updates coefficients with real-time bubble temperature and considers the joint effect of pressure and temperature, maintaining high accuracy in the initial collapse stage.
The gas number density correction formula (adapted for sealed bubble):
where d is the interelectrode distance (fixed at 0.05 mm), γ is the secondary emission coefficient (the yield of electrons from positive ion impact on the cathode, which is normally on the order of 10
−4 − 10
−2),
represents the Boltzmann constant, with a value of 1.380649 × 10
−23 J⋅K
−1, ε
i is the ionization potential (12.62 eV), σ is the ionization cross section (3.5 × 10
−21 m
2 [
29]).
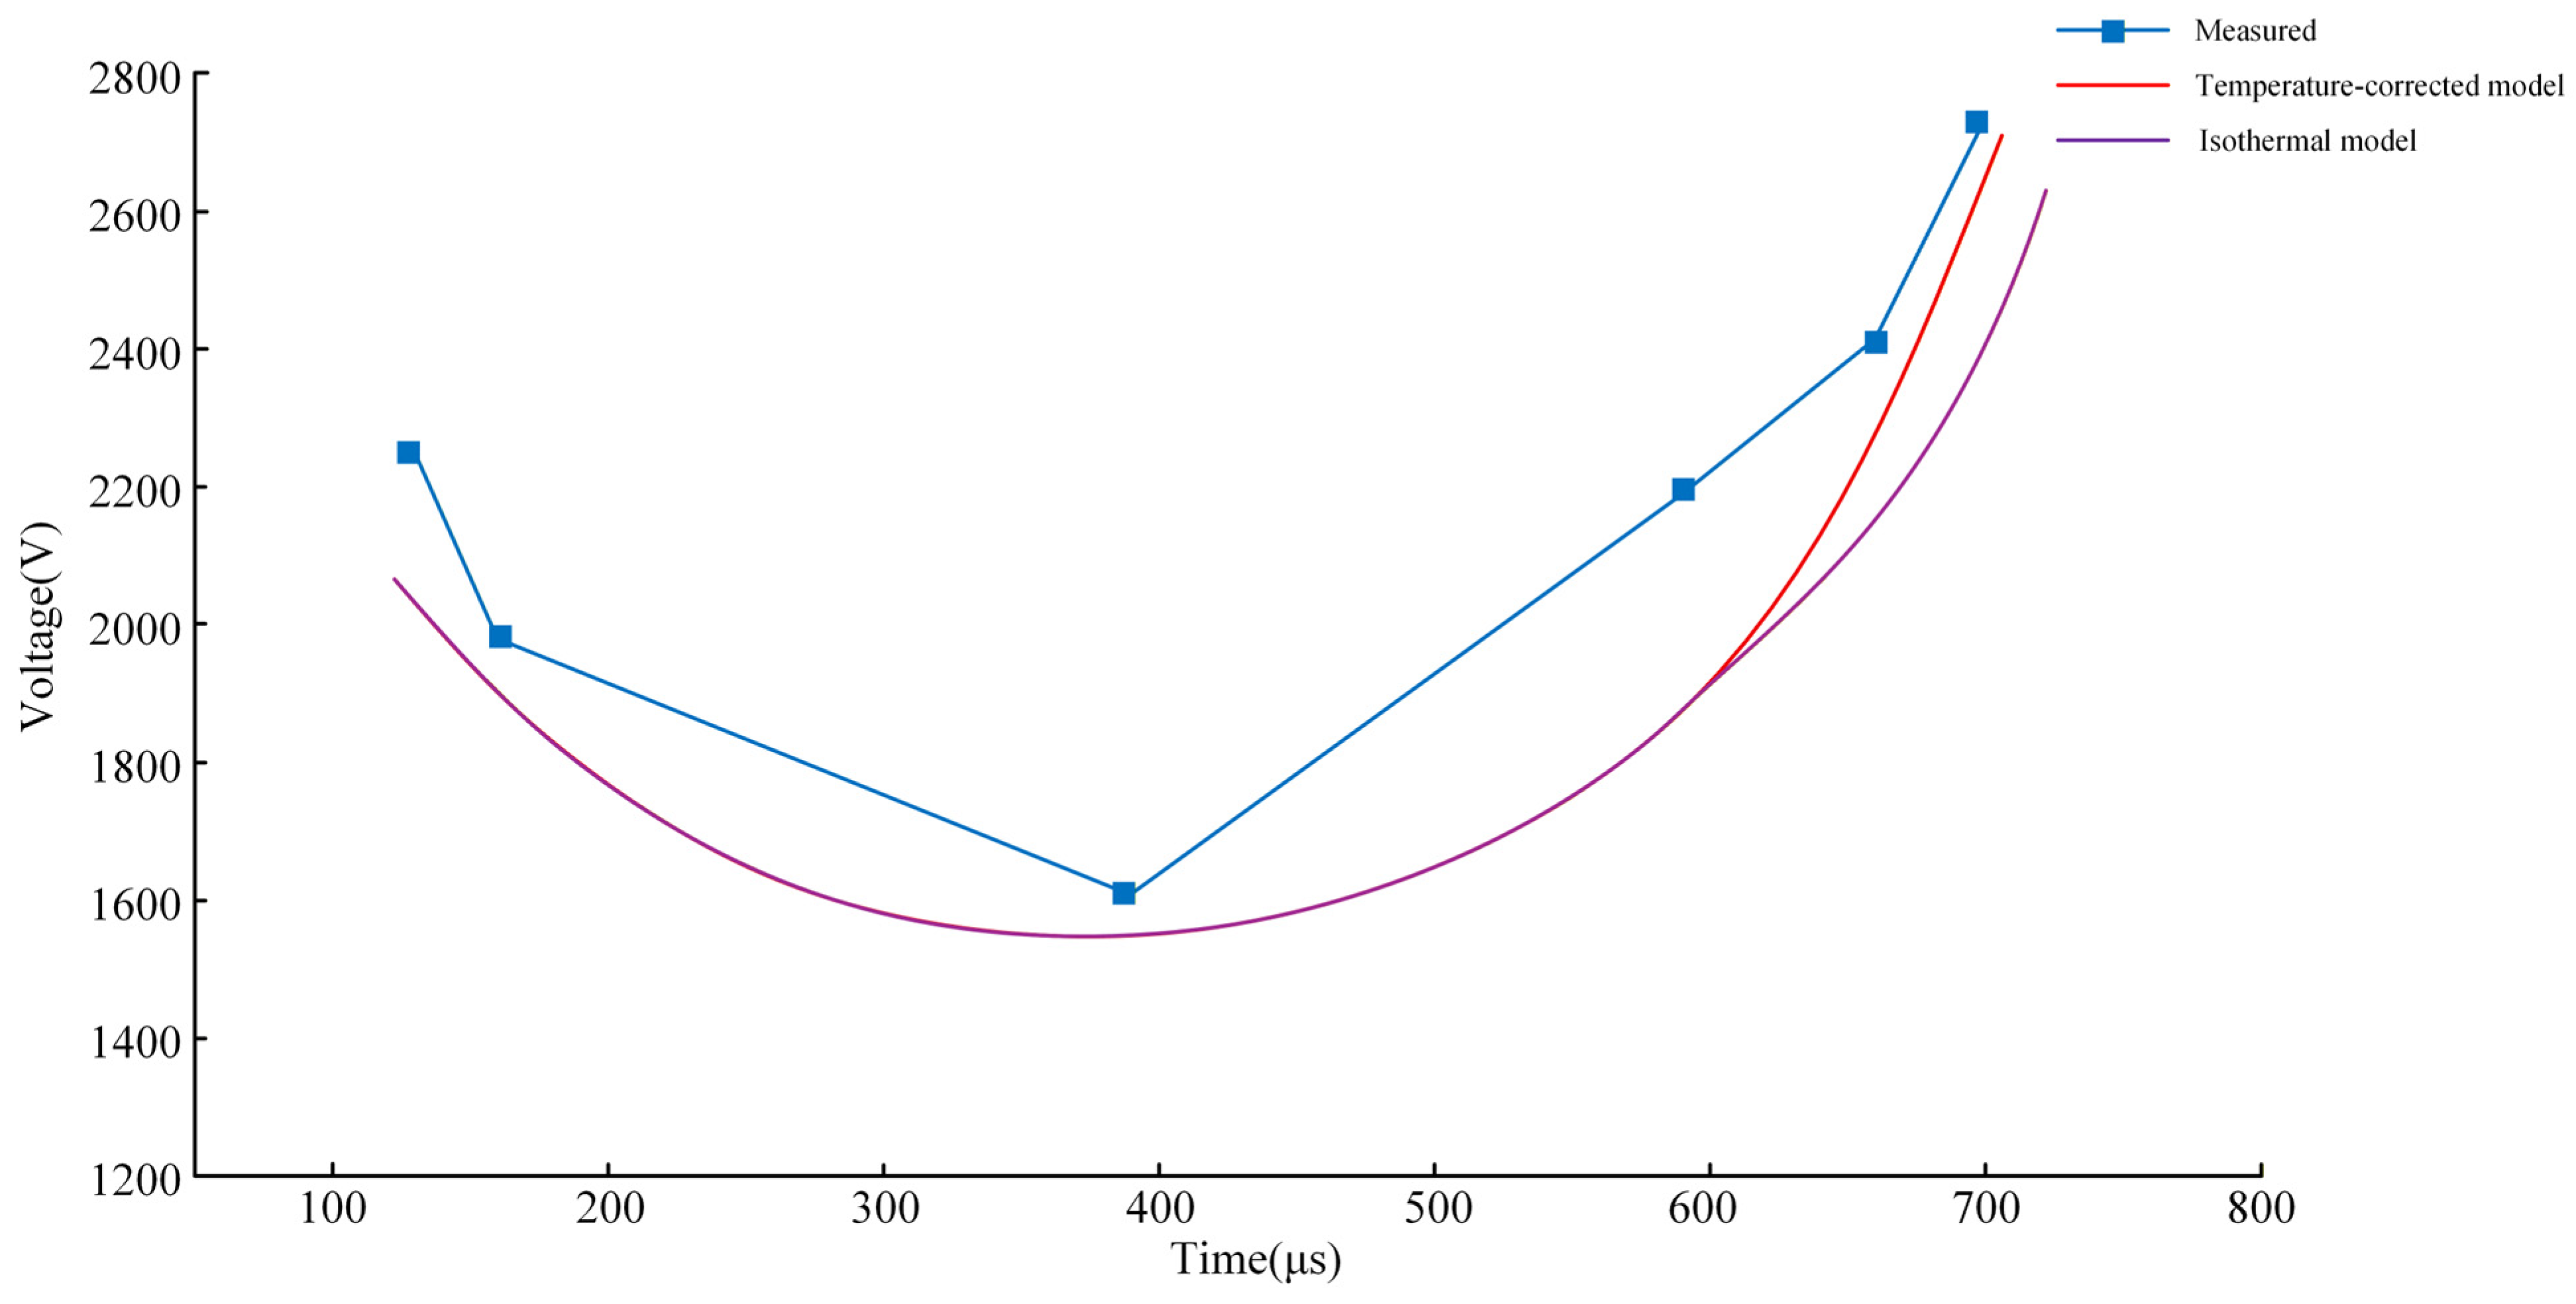
Figure 8 compares the measured breakdown voltage with the calculation from different theoretical models. The measured experimental data (blue line) exhibit a U-shaped profile. In the gradual expansion stage (145–390 μs), a slight reduction in pressure leads to a decrease in the breakdown voltage; when the bubble reaches the maximum radius, the bubble enters the gradual contraction stage (390–600 μs), and the breakdown voltage increases slightly as the bubble pressure rises.
As shown in
Figure 8, the temperature-corrected model (red line) captures this U-shaped profile reasonably well. While the calculated voltage in the isothermal model (purple line) is much lower than that in the temperature variation in the initial collapse stage (600–700 μs), the bubble temperature changes from 322.5 K to 389.4 K.
These differences between the two models can be explained as follows: as the temperature rises for a sealed bubble, the thermal motion of vapor molecules becomes intense, and the frequency of electron-molecule collisions increases significantly. The energy of electrons is frequently consumed during these collisions; the density of high-energy electrons (energy ≥ gas ionization energy) is insufficient to trigger a sustained avalanche. Therefore, a higher voltage needs to be applied to increase the electric field strength, forcing electrons to accelerate to the ionization threshold. As a result, the breakdown voltage increases as bubble temperature rises.
It is noteworthy that the calculation focuses on the first pulsation cycle. The final collapse-rebound stage involves complex interactions with the electrode structure, including shockwave reflections and micro-jet impacts [
25,
30], which significantly perturb the internal thermodynamics and are thus excluded from the current model scope.
4. The Effect of Mass Transfer on Bubble Pulsation
After breakdown, the recovery time is mainly determined by the first and second bubble pulsations, with the consideration that the bubble sufficiently moves out from the electrode [
21]. The evolution of bubble dynamics is intrinsically governed by the thermodynamic coupling between the vapor interior and the surrounding liquid medium. To quantitatively elucidate the sensitivity of this process, three representative values of the phase-change mass transfer coefficient
are examined.
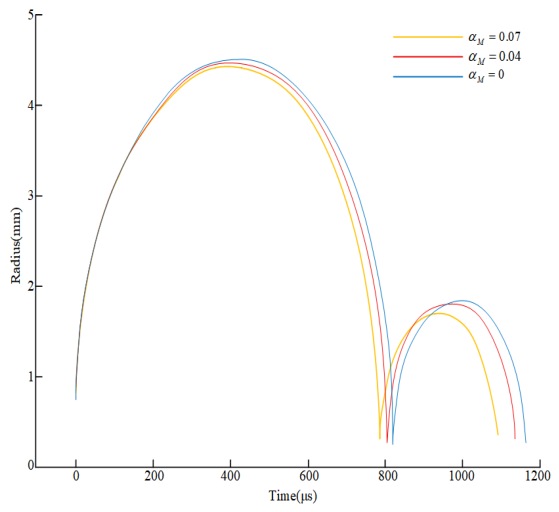
Figure 9 illustrates the temporal evolution of the bubble radius under varying
. It is evident that
exerts a distinct differential effect on the pulsation cycles. During the first pulsation, the bubble evolution is primarily dominated by liquid inertia, resulting in a maximum radius that remains nearly invariant with changes in
. However, a marked divergence emerges in the subsequent cycles. As
increases, the rebound amplitude of the second pulsation decreases progressively, and the overall oscillation attenuates more rapidly.
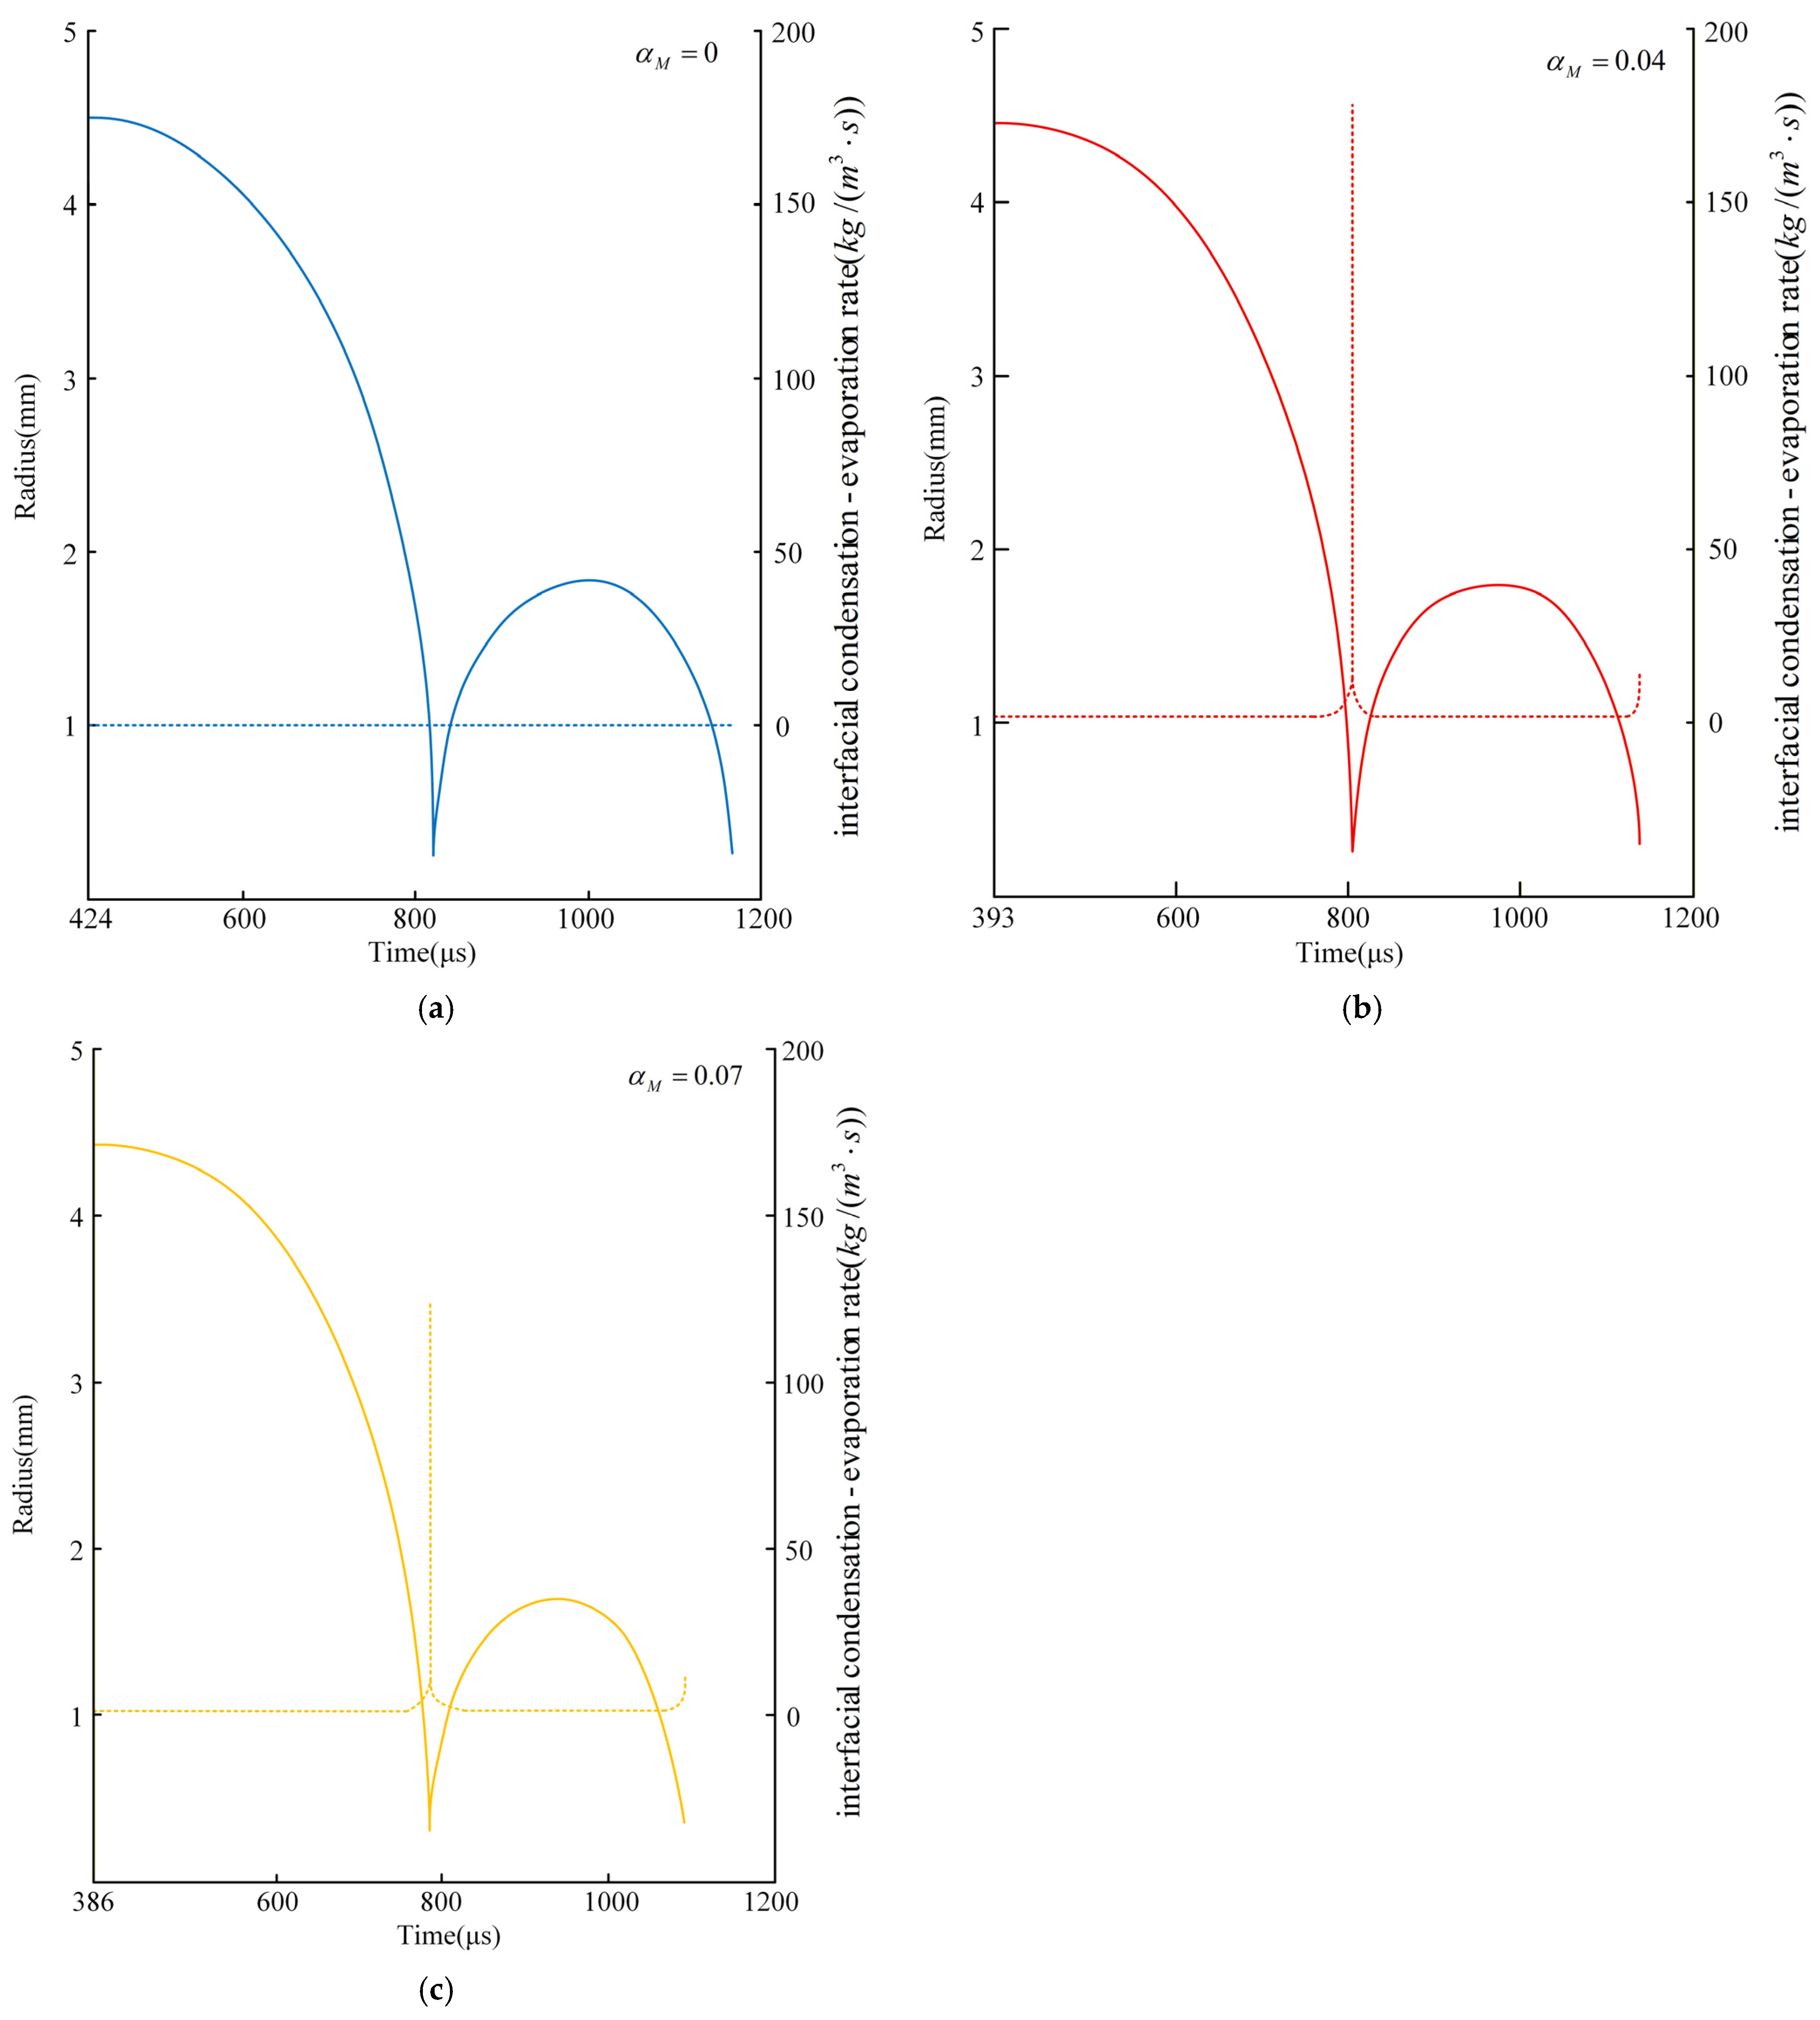
To uncover the underlying mechanism,
Figure 10 presents the paired curves of bubble radius and interfacial condensation-evaporation rates. The results reveal that the condensation rate peaks precisely at the instant of bubble collapse. Notably, the peak value exhibits a non-monotonic trend with respect to
: it initially increases and then decreases. This behavior corresponds to the energy loss characteristics during the collapse process. While the first pulsation is insensitive to
, the coefficient plays a decisive role in energy dissipation during the first collapse.
Specifically, a higher intensifies interfacial condensation, extracting more vapor mass and latent heat from the bubble interior. This enhanced energy dissipation significantly depletes the residual energy available for the second pulsation. Consequently, the maximum radius of the second-pulsation drops sharply with increasing . This cumulative energy attenuation effect explains why governs the long-term bubble pulsation behavior.