Article

Synergistic Impact of Integrated Water Control and Screen Pipe Technologies on Oil and Gas Production in Advanced Well Completions

School of Petroleum Engineering, China University of Petroleum (East China), Qingdao 266580, China
*
Author to whom correspondence should be addressed.
Processes 2026, 14(16), 2552; https://doi.org/10.3390/pr14162552
Submission received: 5 July 2026 / Revised: 27 July 2026 / Accepted: 3 August 2026 / Published: 9 August 2026
(This article belongs to the Special Issue Development of Advanced Drilling Engineering)

Abstract

The global expansion of oil and gas exploration into increasingly deep and geologically complex reservoirs has intensified technical challenges, particularly the detrimental effects of water intrusion and sand production. These issues severely curtail well longevity and recovery efficiency. While conventional screen pipe completions offer economic advantages and simplicity, their monolithic design often struggles to effectively manage the complexities of mixed oil–water flow regimes. This study establishes a fluid mechanics-based coupling model to quantify the synergistic mechanism between Autonomous Inflow Control Devices (AICD) and precision sand screens, and evaluates the technical and economic performance of the integrated system through a standardized methodology involving laboratory experiments, numerical simulations, and field case studies. The findings demonstrate that this integrated approach achieves a synergistic effect of 150 days in water-free production period extension, and significantly enhances production efficiency and economic viability compared to traditional methods.

1. Introduction

1.1. Research Background and Significance

The relentless pursuit of global oil and gas resources has extended operations into deep, ultra-deep, and structurally complex formations, where the technical exigencies have become increasingly pronounced. This necessitates the development of high-strength, thermally resistant downhole completion equipment and filtration in extreme environments. Among the most pressing challenges are water encroachment and sand influx, which have emerged as primary bottlenecks limiting well productivity and ultimate recovery.
Statistically, approximately 60% of the world’s oil wells experience rapid production decline due to water or sand-related issues, with some wells witnessing a production drop of up to 70% within just three years of production [1]. Industry-wide statistics indicate that water and sand production issues result in an average annual global production loss of 12 million barrels, with annual sand-related workover expenditures exceeding $3 billion [1]. A notable example is a deepwater well in the Gulf of Mexico, which had to be shut down within a year of operation due to severe bottom-water coning, causing the water cut to surge to 85% and daily production to plummet to a mere 300 barrels [2].
Screen pipe completions are widely employed in unconsolidated sandstone and clastic reservoirs due to their cost-effectiveness, high permeability, and relative ease of installation [3]. However, their uniform structure presents significant challenges in managing the mixed flow dynamics of oil and water in heterogeneous reservoirs. For instance, a horizontal well in the Jidong Oilfield, completed with a conventional slotted liner, saw its water cut escalate to 92% within six months due to bottom-water coning, resulting in a daily oil production loss of 30 tons and subsequent well shutdown [4].
Against this background, integrating water control units with sand control screens to achieve dual functions of sand control and water control has become an important development direction of completion technology. This study focuses on the synergistic mechanism and field performance of the integrated AICD + precision composite sand screen system, which has important theoretical significance for revealing the flow coupling law of downhole completion systems and engineering application value for improving the development effect of bottom-water reservoirs.

1.2. Literature Review and Research Gap

1.2.1. Advances in Individual Water Control and Sand Control Technologies

Recent advances in rock mechanics and seepage theory have provided new insights into complex fluid–structure interaction problems. Xue et al. (2025) established a brittleness evaluation method for gas-bearing coal based on statistical damage constitution model and energy evolution mechanism, which laid a theoretical foundation for quantifying material damage under complex stress conditions [5]. Jia et al. (2024) revealed the nonlinear evolution characteristics of fluids in broken rock mass based on bifurcation theory, which improved the understanding of non-uniform flow behavior in porous media [6].
Two representative CT-based mesoscopic damage characterization studies are introduced to further support the theoretical basis of this work. The mesoscopic damage evolution characterization method and pore structure quantitative testing technology proposed by Xue et al. (2025) and Li et al. (2025) can be extended to the pore-scale seepage analysis of composite sand screens, and their multi-scale damage evolution modeling ideas provide methodological support for the construction of the sand screen–AICD coupling model in this research [7,8].
Three recent studies on particle migration and multi-field coupling provide a solid theoretical foundation for this work: Li et al. (2025) analyzed solid particle sedimentation rules in CO2 fracturing fluid, which can be used to explain the sand particle plugging dynamic process inside multi-layer filter screens [9]; Li et al. (2025) established wellbore injection filtration numerical model for shale reservoirs, whose parameter calibration and grid division framework are referenced for the AICD internal flow field simulation of this paper [10]; Li et al. (2026) built a multi-physics coupling model for geothermal reservoirs, and the multivariate collaborative characterization method is adopted to quantify the bidirectional synergy between AICD and sand screen [11].
Autonomous Inflow Control Device (AICD) is an advanced passive water control technology developed on the basis of ICD (Inflow Control Device). Halvorsen et al. (2016) first proposed the fluidic diode type AICD structure, which uses the viscosity difference between oil and water to generate differential flow resistance and realizes selective water control without external power supply [12]. Since its first commercial application in the Troll oilfield in the North Sea in 2015, AICD technology has been gradually promoted in major oil regions such as the Gulf of Mexico, the North Sea, and onshore oilfields in China, and has become a mainstream technical means for water control in bottom-water reservoirs [12,13]. According to statistical data, by 2024, the cumulative number of horizontal wells using AICD technology worldwide has exceeded 800, with an average water-free production period extension of 30–50% [14]. Least et al. (2022) systematically reviewed the development status of AICD technology for heavy oil bottom-water reservoirs, and pointed out that current research mostly focuses on performance optimization of individual devices, while the matching relationship between AICD and sand control completion is rarely studied [14].
It should be clarified that the Karamay Oilfield field test data cited in this paper are all derived from published literature [13], which are only used as an industry benchmark for comparative analysis, and are not included in the 18 field sample wells independently collected in this study.
For zonal isolation technology, expandable packers can establish a reliable annular seal under high temperature and high pressure conditions. Field data from Shengli Oilfield show that this technology was first applied in heavy oil thermal recovery wells in the Shengli Oilfield, with a temperature resistance of 360 °C and an expansion coefficient of 1.35, which can effectively prevent cement slurry from contaminating the reservoir [15]. In recent years, oil-swellable packers have been gradually applied to horizontal well zonal completion, becoming a key supporting technology for segmented water control [16].
In terms of sand control completion, Dong et al. (2022) studied the flow resistance characteristics and erosion mechanism of precision composite sand screens, and established a quantitative prediction model for screen pressure drop and service life [3]. Zhu et al. (2024) reported field practices of sand-control completion for CO2 huff-and-puff heavy-oil sand-production wells in the Bohai Bay Y Oilfield, indicating that integrating corrosion-resistant screens with huff-and-puff sand-control completion is a key development direction [17]. Precision composite sand screens were first applied in heavy oil thermal recovery wells in the Shengli Oilfield. Their multi-layer mesh structure has significantly improved filtration accuracy and erosion resistance compared with conventional slotted screens, and has been widely used in high sand production reservoirs. At present, precision composite sand screens have become the first-choice sand control method for unconsolidated sandstone reservoirs in eastern China [4].
Intelligent completion systems, which enable real-time flow control via downhole sensors, have achieved a 35% increase in individual well production in deepwater Gulf of Mexico fields. However, their substantial capital cost—reportedly up to $25 million per well with a payback period of five years—has hindered widespread adoption. Al-Khelaiwi et al. (2022) conducted a systematic cost–benefit analysis of intelligent completion technology, and concluded that passive water control completion has higher economic applicability in onshore and shallow sea oilfields [18].

1.2.2. Research Status of Integrated Completion Technology

In recent years, scholars have begun to explore the integrated application of water control and sand control technologies. Zhou et al. (2021) developed an integrated water-control sand screen and carried out field tests in bottom-water reservoirs, achieving good production enhancement effects [19]. Zeng et al. (2024) proposed the AICD screen combined with annular gravel packing process for offshore oilfields with both sand control and water control requirements, and verified its effectiveness through field tests in the Bohai Oilfield [20]. Deng et al. (2025) optimized the water control scheme for horizontal wells in thin-layer carbonate reservoirs, and verified the effectiveness of the screen–packer combination [16]. Latest studies by Djouli, L.B et al. (2024) and Zhang et al. (2024) further confirmed the production enhancement potential of integrated completion systems, but lacked unified quantitative characterization formulas for the synergy between water control and sand control tools [21,22].
Combined with the newly supplemented literature, existing research has three core quantitative gaps that need to be addressed:
  • Most indoor simulation experiments adopt uniform inflow boundary conditions, ignoring the non-uniform seepage influence of reservoir formation on AICD throttling performance; the particle migration and multi-field coupling models in existing studies are developed for fracturing and geothermal scenarios, and cannot be directly used to quantify the two-way synergy of AICD and sand screen, lacking unified calculation standards for synergistic effect.
  • Most field evaluations are single-case qualitative descriptions, lacking a unified statistical evaluation framework covering both technical indicators and economic benefits, and the applicable boundary of the technology is not clearly quantified.
  • Existing mechanism studies mostly focus on single tool performance optimization, and have not established a complete fluid–solid coupling model for the collaborative flow process of the screen–AICD integrated system, failing to reveal the internal flow mechanism of synergistic production enhancement.
In addition, the technical and economic boundary between integrated passive completion and intelligent completion is also not clearly defined, and there is a lack of standardized well selection index systems for engineering design.

1.2.3. Research Questions and Hypotheses

To address the above research gaps, this study focuses on the following three scientific questions:
  • What is the fluid–mechanical coupling mechanism between AICD water control units and precision sand screens, and how to quantify the bidirectional synergistic effect?
  • To what extent can the integrated system improve production performance in unconsolidated sandstone bottom-water reservoirs, and what is the statistical reliability of the improvement effect?
  • What is the technical and economic boundary between the integrated completion system and conventional completion and intelligent completion technologies, and what are the applicable conditions?
Accordingly, two testable hypotheses are proposed:
Hypothesis 1. 
The flow homogenization effect of the sand screen can improve the water–oil pressure drop ratio of AICD, forming a forward synergistic effect.
Hypothesis 2. 
The throttling effect of AICD can reduce the flow velocity through the screen, reduce erosion and plugging risks, and form a reverse synergistic effect.
This study aims to verify the above hypotheses through theoretical modeling, laboratory experiments and multi-field case analysis, and establish a general evaluation framework for integrated completion systems.

1.3. Practical Application of Integrated Technologies

The condensate gas reservoirs in the Northwest Oilfield have successfully adopted a strategy of “reservoir zoning management coupled with differentiated water control.” This approach leverages the synergy between water-control screens and oil-swelling packers to achieve flow equilibrium throughout the well’s lifecycle. The technology has been deployed in four wells, resulting in a cumulative oil increase of 36,000 tons and an average extension of the water-free production period by 448 days per well. For a specific condensate well in the Northwest Oilfield, the water-free production period was extended from 300 days to 748 days, and cumulative oil production rose from 5000 tons to 12,000 tons [23].
In a field trial conducted by CNOOC Services in the Bohai Oilfield, the “AICD screen pipe gravel packing water control technology” was applied to over 20 wells. This application doubled water control efficiency and reduced the dynamic payback period to 2–3 years. In one deepwater well in the Bohai Oilfield, the water control efficiency was improved by 60–90%, and the dynamic payback period was reduced to 2.5 years [20].
Onshore oilfields such as Jidong and Daqing have also carried out pilot tests of integrated water-control screen completion technology in recent years, and have achieved production increase effects of 60–200% in different types of bottom-water reservoirs [4,24]. These field practices have accumulated a large amount of basic data for systematic evaluation of the technology.
This work is positioned as a systematic technical evaluation study integrating mechanism modeling, laboratory experimentation, numerical simulation, and multi-field case analysis. It is neither a pure review nor a single case report, but focuses on revealing the synergistic mechanism and engineering application value of the integrated water control–screen pipe completion system.
Research objectives: (1) To establish a fluid–mechanical coupling model for quantitatively characterizing the synergistic mechanism between AICDs and precision sand screens. (2) To systematically evaluate the production enhancement effect and economic performance of the integrated system based on multi-field case data. (3) To clarify the applicable boundaries and technical limitations of the integrated system.
Research scope: This study focuses on horizontal wells in unconsolidated sandstone bottom-water reservoirs, covering a crude oil viscosity range of 5–500 mPa·s and a permeability range of 50–2000 mD. The research objects include conventional slotted screens, ICD/AICD water control devices, oil-swelling packers, and their integrated completion systems.
Manuscript organization: Section 2 analyzes the principles of screen pipe and water control technologies, and focuses on the coupling mechanism and quantitative synergistic effect model of the integrated system. Section 3 introduces data sources, case selection criteria, experimental design, and statistical analysis methods. Section 4 presents field case studies and comprehensive performance evaluation. Section 5 discusses the applicable scope, technical limitations, failure risks and research positioning of the technology. Section 6 summarizes the main conclusions and prospects for future research.

2. Mechanistic Analysis of Integrated Water Control and Screen Pipe Systems

This section systematically elaborates the structural characteristics and working principles of screen pipe technology and water control technology, establishes a fluid mechanics coupling model of the integrated system, quantitatively reveals the bidirectional synergistic mechanism, and clarifies the collaborative working mode of the “packer-screen–AICD” three-level defense system.

2.1. Principles and Classification of Screen Pipe Technology

2.1.1. Functional Positioning

Screen pipes serve three universal core functions in oil and gas development: sand control, wellbore stabilization, and permeability maintenance. For special scenarios such as high-temperature and high-pressure (HTHP) gas reservoirs containing corrosive fluids (H2S, CO2), two additional functional properties—thermal stress resistance and corrosion resistance—are also required to ensure long-term downhole structural integrity.
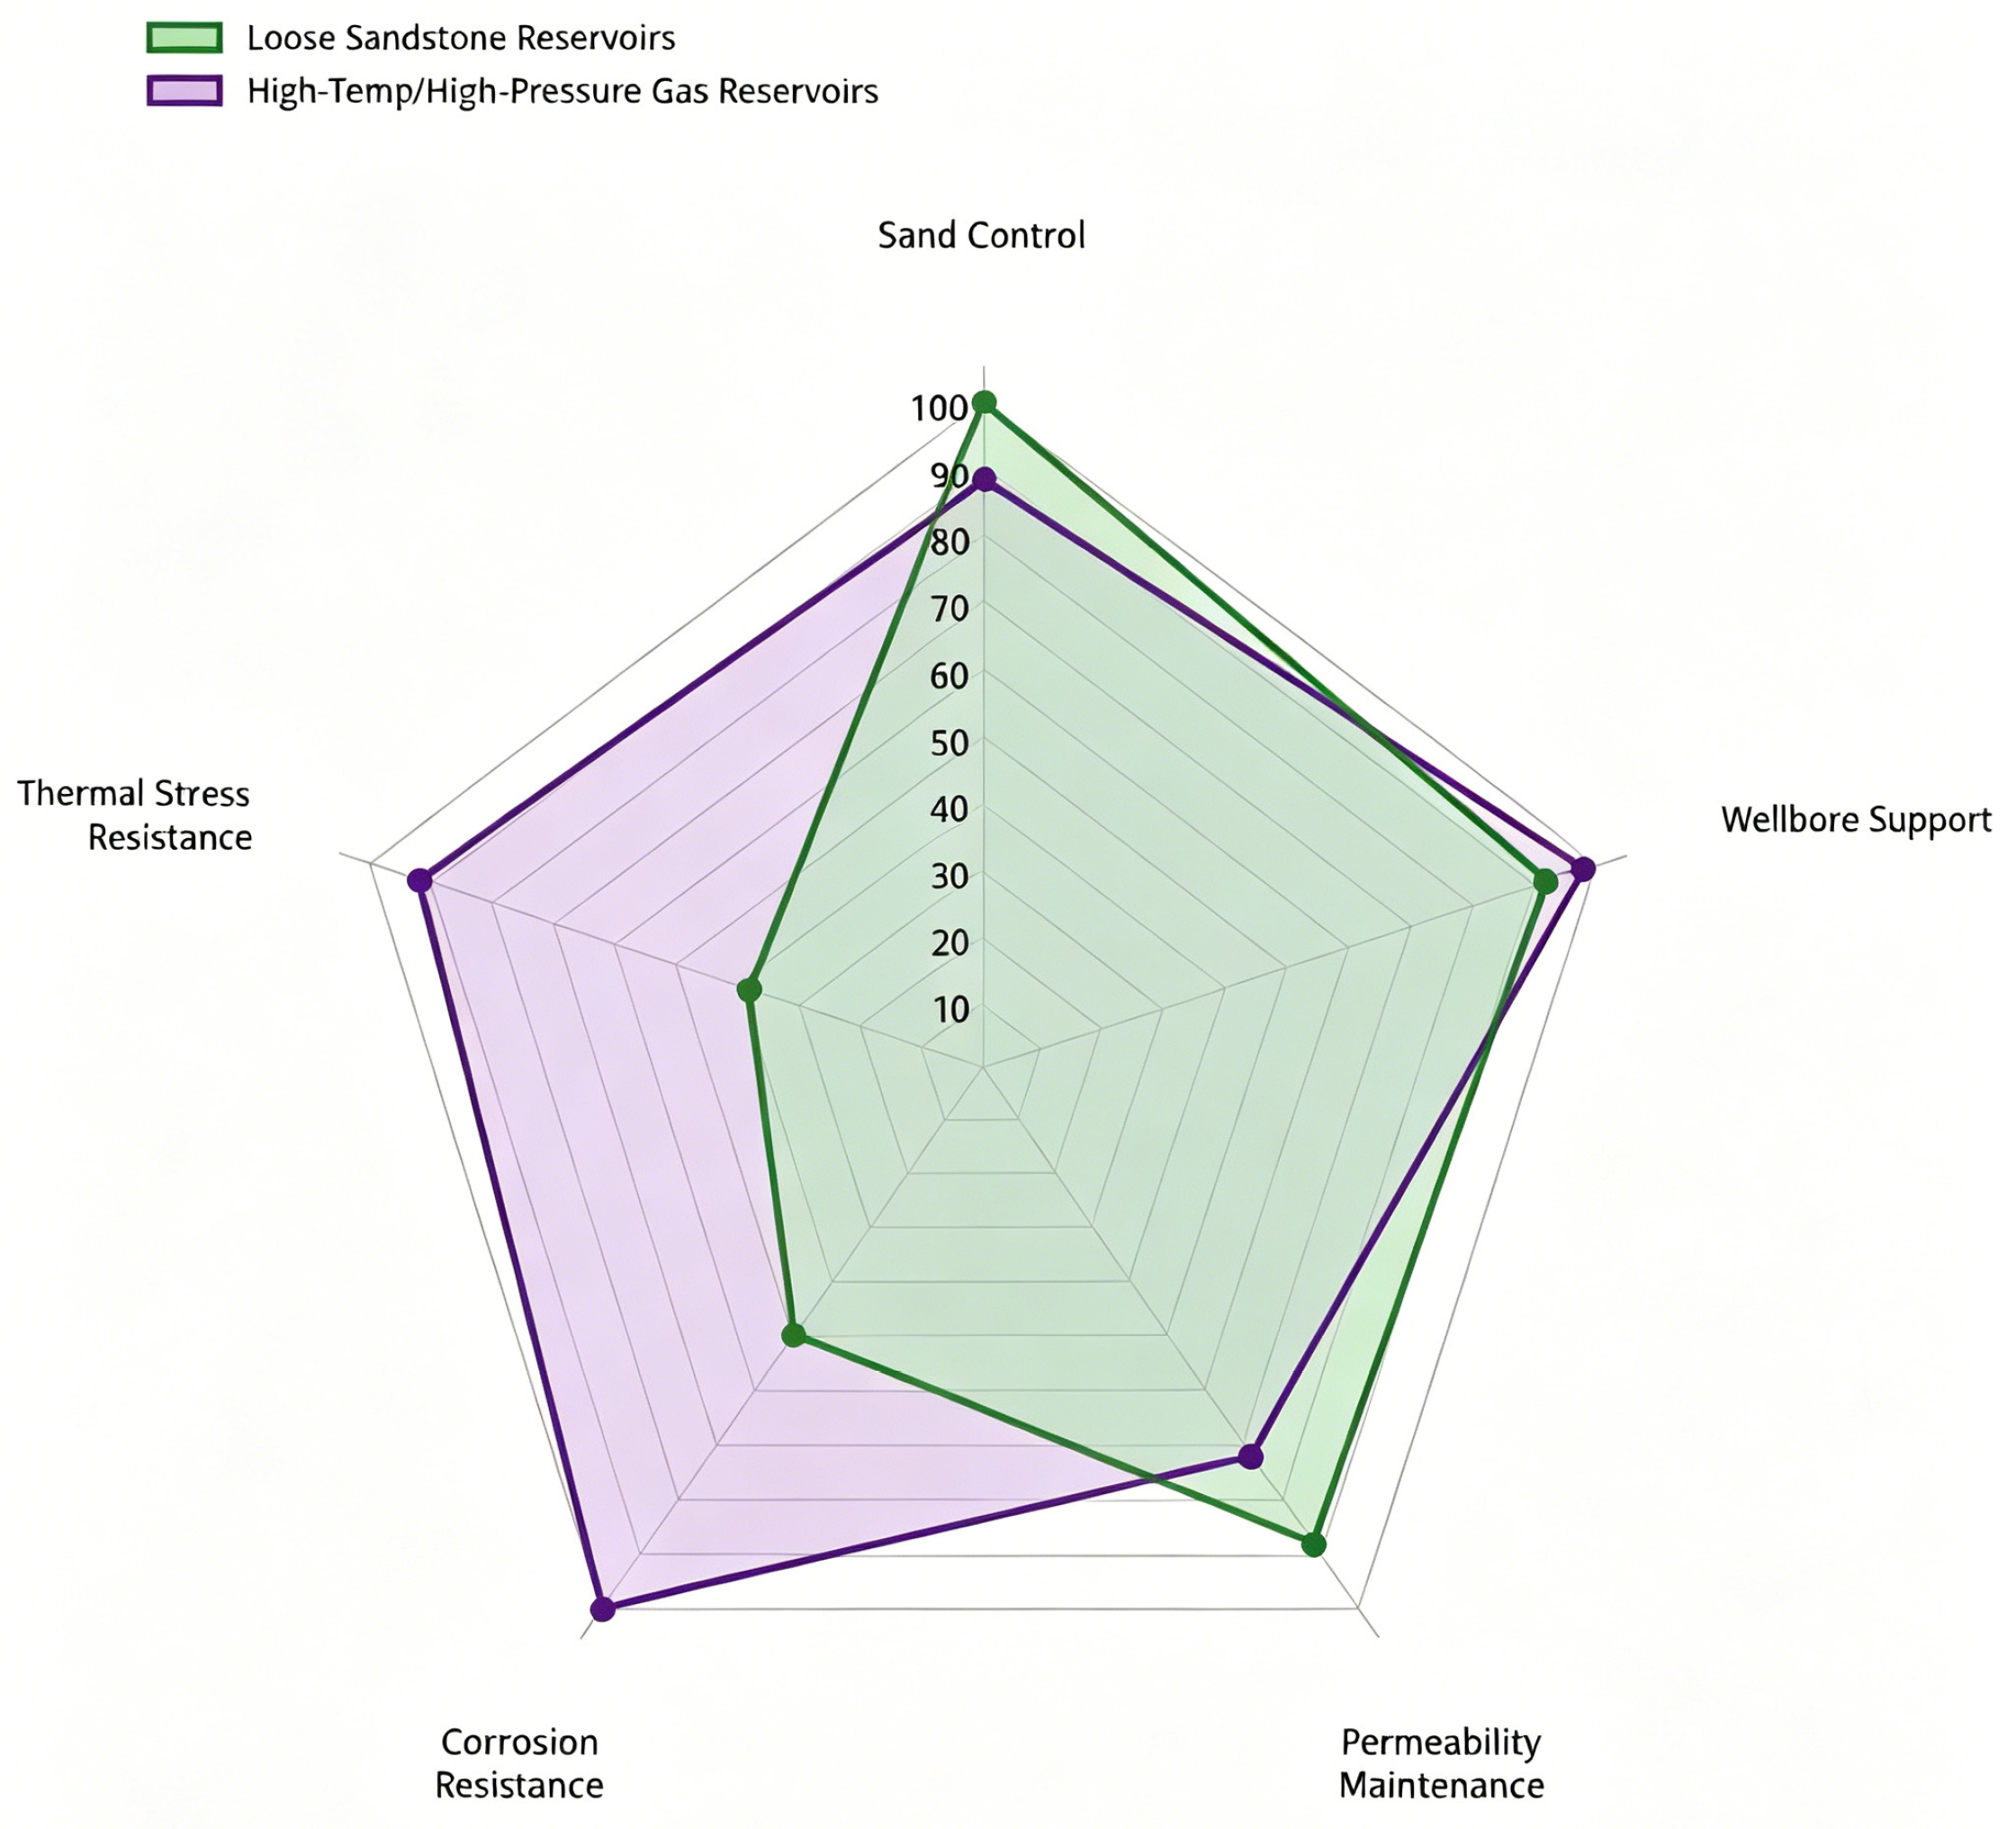
In unconsolidated sandstone reservoirs, the sand control function is paramount. Sand particles larger than 0.3 mm can cause severe abrasion to downhole equipment, drastically reducing its service life. For example, in the early development of an unconsolidated sandstone reservoir in the Shengli Oilfield, the absence of screen pipe sand control led to a high failure rate for oil pumps, requiring maintenance every three months, which accounted for 15% of production costs. After implementing a precision composite sand screen, 98% of sand particles larger than 0.3 mm were intercepted. This reduced the pump failure rate, extended the maintenance cycle to over a year, lowered equipment wear by 50%, and reduced maintenance costs to less than 5% of total production costs. As shown in Figure 1, the functional importance of screen pipes varies significantly across different reservoir types.
In HTHP gas reservoirs, screen pipes must also exhibit corrosion resistance and thermal stress tolerance to maintain long-term integrity. The harsh environment, including corrosive gases like H2S and CO2, poses significant challenges. In a HTHP gas reservoir in the Tarim Oilfield, the initial use of standard screen pipes led to rapid corrosion and perforation, necessitating replacement every six months. After switching to corrosion-resistant alloy screens, the service life was extended from 2 to 5 years, ensuring stable production and significantly improving operational efficiency.

2.1.2. Types and Characteristics

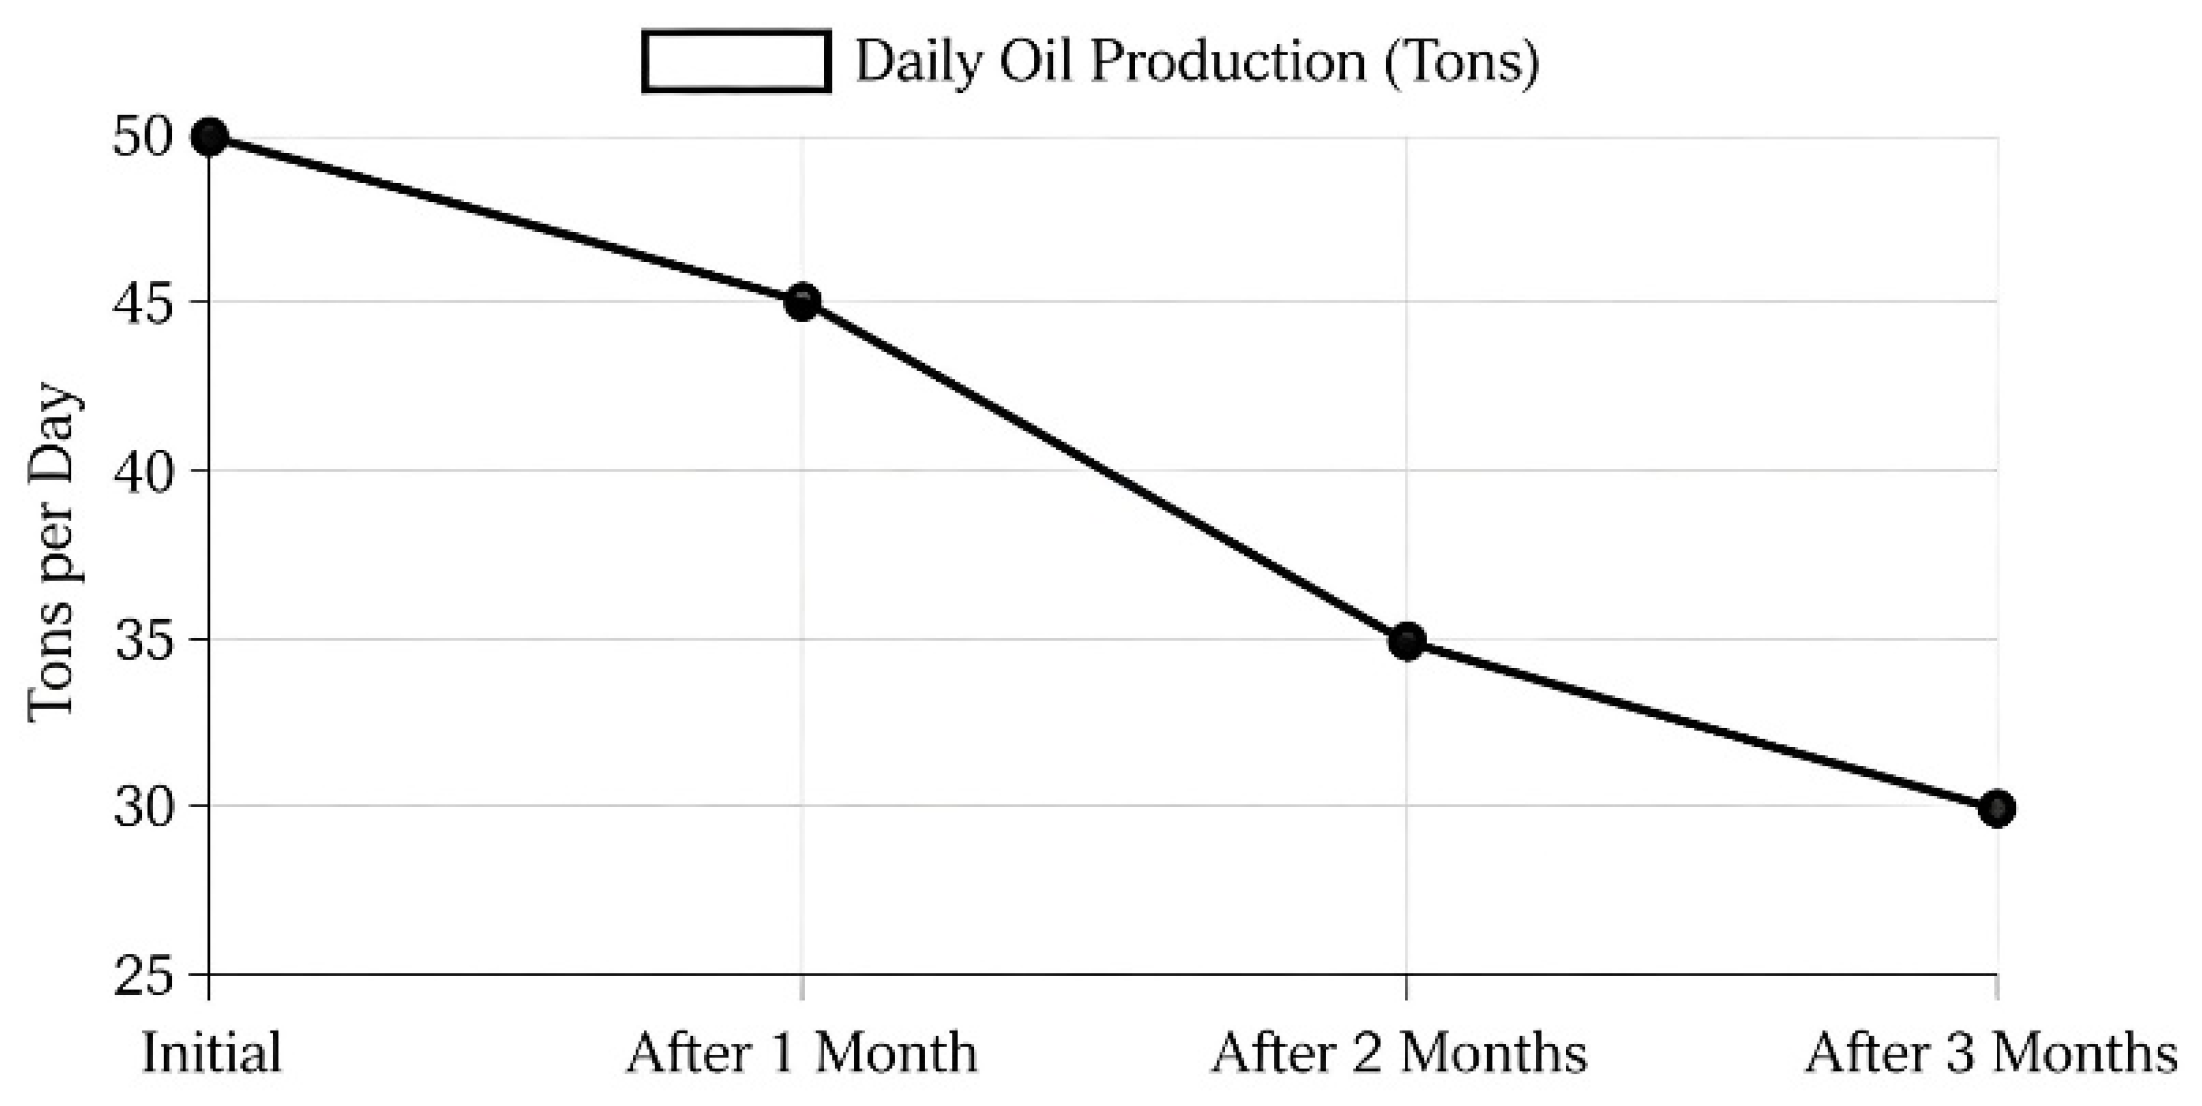
Conventional screen pipes, typically manufactured from J55 or N80 grade steel casing with slot widths ranging from 0.1 to 4 mm, are suitable for low-water-cut, low-sand-production wells. While cost-effective (approximately 500,000 RMB per well), they exhibit poor impact resistance. During horizontal deployment, wellbore tortuosity and drill string collisions can deform the slots, compromising the sand control effect. For example, in a low-water-cut well in the Jidong Oilfield, a 95% completion success rate was achieved with conventional screens [15]. However, after three months, slot deformation due to downhole collisions led to increased sand production and necessitated costly workover operations. As illustrated in Figure 2, screen failure leads to a continuous decline in daily oil production within three months.
Precision composite sand screens offer higher filtration accuracy (300–600 mesh) to capture finer sand particles. They typically adopt a four-layer coaxial structure from inside to outside: base pipe, support mesh, filter mesh and protective outer jacket. The multi-layer metal woven filter mesh is the core functional unit, which can achieve graded interception of formation sand while maintaining high flow conductivity. Compared with conventional slotted screens, its erosion resistance is improved by more than 2 times under the same sand production conditions, and the filtration accuracy is increased from 65% to over 98%. They are often used in conjunction with lubricants to reduce downhole friction and are particularly suited for high-sand-content reservoirs.

2.2. Principles and Classification of Water Control Technology

2.2.1. Passive Water Control Technology

AICD technology is a passive method that utilizes specialized flow paths to create an additional pressure drop, preferentially suppressing water flow. The fluidic diode AICD adopted in this study is mainly composed of an inlet section, a spiral flow channel and a cylindrical vortex chamber. Its working principle is based on the viscosity difference between oil and water: low-viscosity water has strong turbulence characteristics after entering the vortex chamber, easily forming a high-speed rotating vortex, resulting in large energy loss and throttling pressure drop; high-viscosity oil mainly flows in a laminar state along the channel wall, with weak vortex effect and small pressure drop, so as to realize adaptive selective water suppression without external power supply and moving parts.
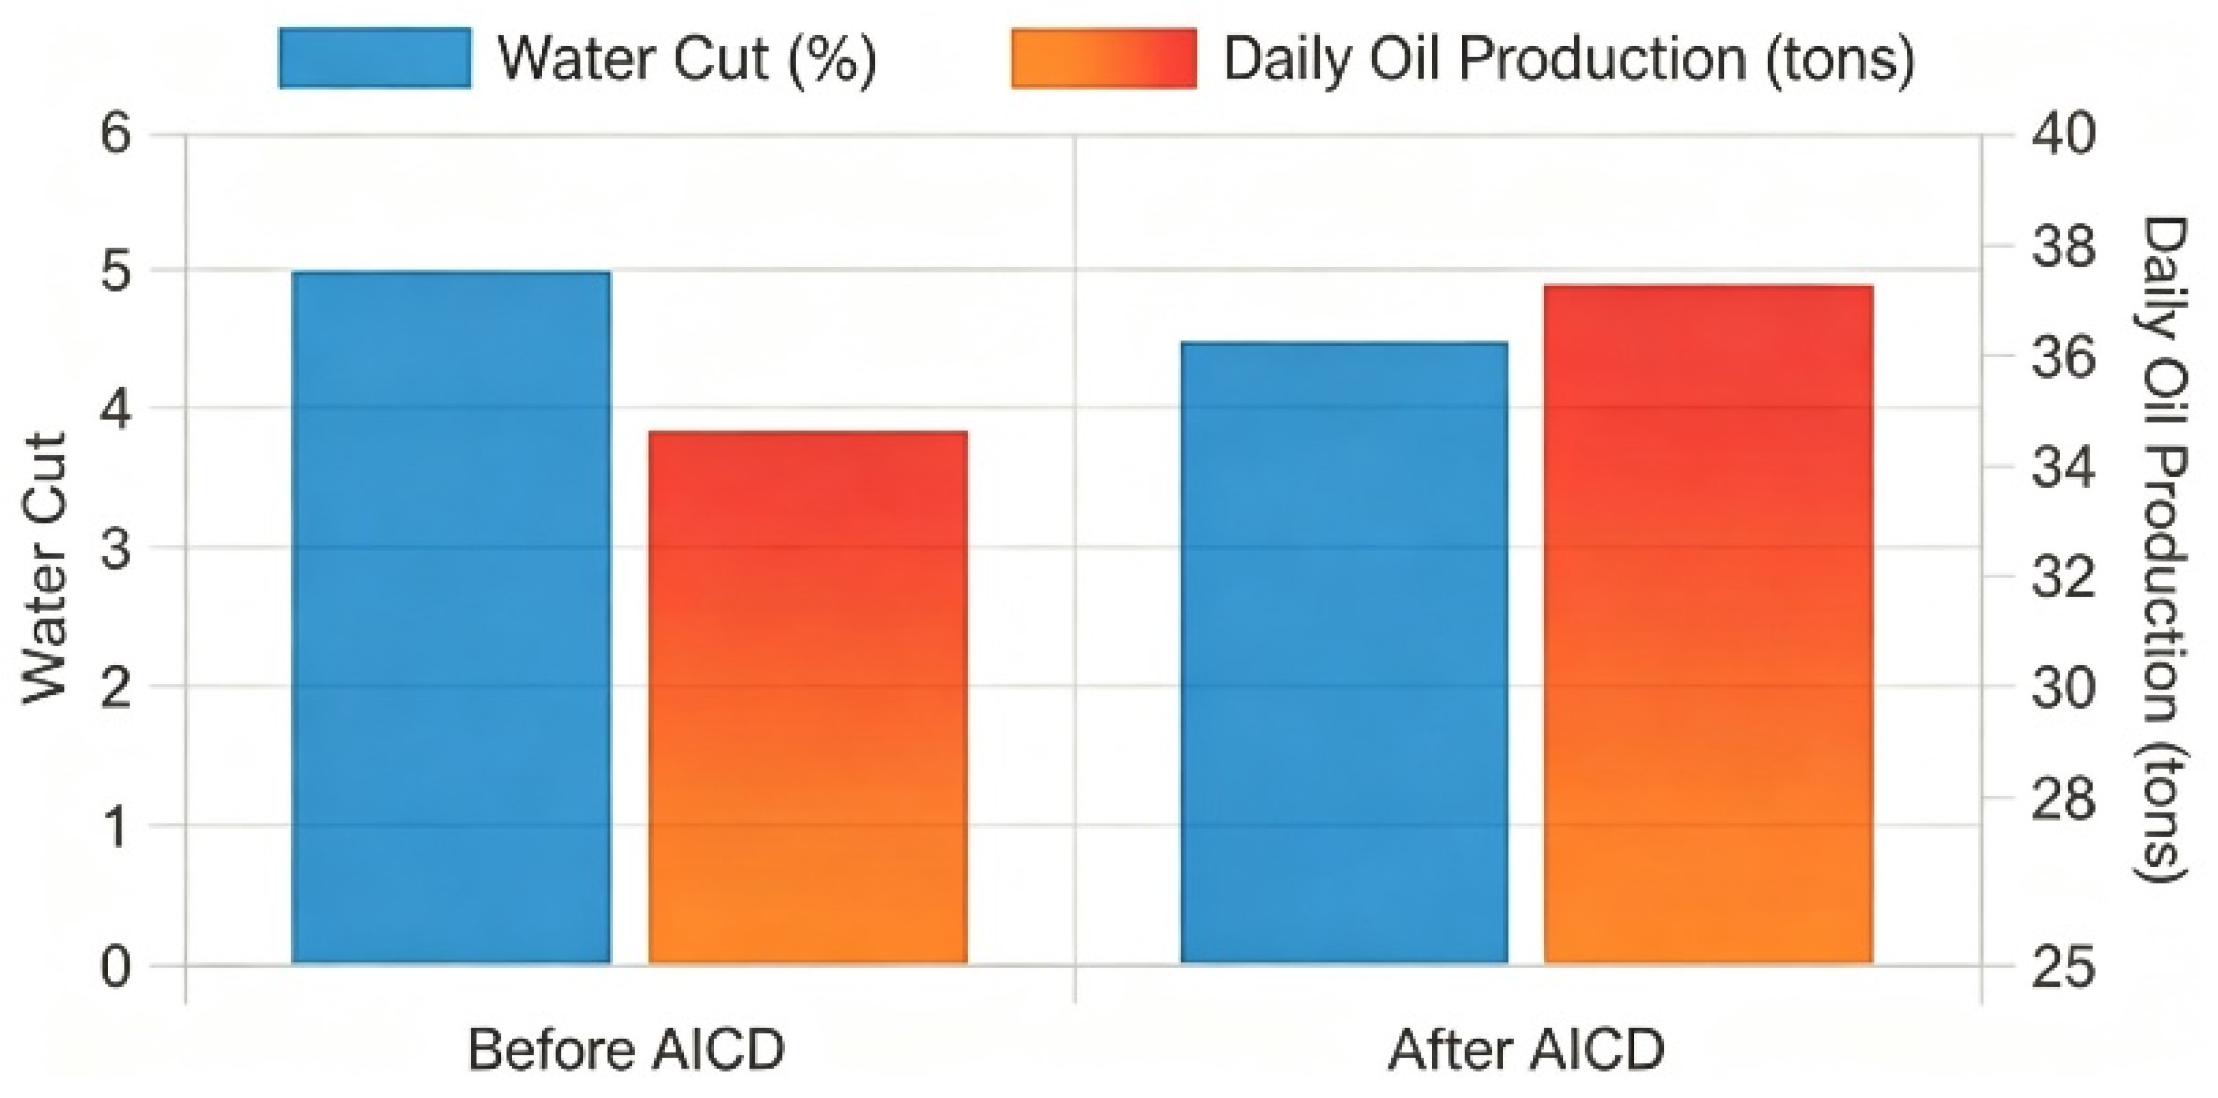
In a heterogeneous bottom-water reservoir in the Karamay Oilfield, AICD technology reduced the water–oil velocity ratio from 3:1 to 0.5:1, decreasing the water cut by 25% (from 5% to 3.75%) and increasing daily oil production from 35 to 38 tons. As shown in Figure 3, the improvement effect of AICD on water cut and daily oil production is presented.
Chemical water control involves the use of water-swellable polymers, such as polyacrylamide gel, to seal high-permeability water zones. In Well G104-5P42 in the Jidong Oilfield, which had a water cut of 80%, the injection of such polymers reduced the permeability of the high-water zone by 80% (from 500 mD to 100 mD), leading to an 18% increase in cumulative oil production (from 5000 to 5900 tons) [24].

2.2.2. Active Water Control Technology

Intelligent completion systems integrate downhole sensors, flow control valves, and surface monitoring systems for real-time production optimization. Royal Dutch Shell achieved significant success with this technology in the deepwater Gulf of Mexico. Prior to implementation, single-well production fluctuated by an average of ±15%. Post-implementation, the system enabled precise control, stabilizing production and enhancing overall field management efficiency. However, due to its high cost and complex maintenance, it is mainly used in high-yield deepwater oilfields at present.
Table 1 summarizes the technical characteristics, applicable conditions and advantages and disadvantages of different water control technologies.

2.3. Synergistic Mechanism of Integrated Aicd–Screen System

The integrated system achieves synergistic effects through the mutual reinforcement of the sand screen’s uniform inflow characteristics and the AICD’s adaptive flow control capabilities. A fluid mechanics coupling model was established to quantify this interaction.

2.3.1. Pressure Drop Coupling Model

The total pressure drop of the integrated system consists of two components: the pressure drop across the sand screen and the pressure drop across the AICD:
p t o t a l = p s c r e e n + p a i c d
The pressure drop across the sand screen follows Darcy’s law for flow through porous media:
p s c r e e n = μ Q L s c r e e n k s c r e e n A s c r e e n
where μ is fluid viscosity (mPa·s), Q is flow rate (m3/d), L s c r e e n is screen length (m),   k s c r e e n is screen permeability (mD), and A s c r e e n is effective filtration area (m2).
The pressure drop across the AICD is described by the adaptive throttling model:
p a i c d = ρ Q 2 2 C d 2 A a i c d 2 ( 1 + α f w )
where ρ is fluid density (kg/m3), C d is discharge coefficient, A a i c d is AICD flow area (m2), α is adaptive coefficient (dimensionless), and f w is water cut (fraction).
Considering the homogenization effect of the screen on inflow, the flow non-uniformity coefficient β is introduced to modify the AICD pressure drop formula. When the inflow is uniform ( β = 1), the AICD works under the design condition and the water–oil pressure drop ratio reaches the maximum; when the inflow is non-uniform ( β > 1), local high-speed jet impacts the AICD flow channel, reducing the effective throttling area and the water–oil pressure drop ratio. The modified formula is:
Δ p a i c d = ρ Q 2 2 C d 2 A a i c d 2 ( 1 + α f w ) β 0.25
This formula quantitatively describes the forward synergistic effect of the screen on AICD performance. The value of −0.25 power exponent is fitted based on 32 groups of CFD numerical simulation results, all calculations were performed using ANSYS Fluent 2022 R2, and the fitting goodness R2 reaches 0.94.

2.3.2. Quantitative Synergistic Effect Analysis

Forward synergy (Screen → AICD): The precision composite sand screen homogenizes the inflow profile, eliminating localized high-velocity jets that would otherwise reduce AICD performance. Experimental results show that uniform inflow increases the AICD’s water–oil pressure drop ratio by 18 ± 3% compared to non-uniform inflow conditions.
Reverse synergy (AICD → Screen): The throttling and pressure-stabilizing effect of the AICD eliminates local high-velocity jets on the screen surface, reducing the peak impact velocity of sand particles by 42 ± 5%, which significantly weakens local erosion damage. Meanwhile, the uniform inflow profile reduces the risk of particle deposition and plugging. Under the combined effect, the service life of the screen is extended by 35 ± 7% under the same sand production conditions.
The combined synergistic effect can be quantified as:
E s y n = E i n t e g r a t e d ( E a i c d + E s c r e e n E b a s e l i n e )
Physically, this formula calculates the extra performance gain of the integrated system beyond the linear superposition of the independent contributions of AICD and sand screen. The term ( E a i c d + E s c r e e n E b a s e l i n e ) represents the expected performance under linear superposition hypothesis: it sums the independent effect of AICD ( E a i c d E b a s e l i n e ) and the independent effect of screen ( E s c r e e n E b a s e l i n e ), then adds back the baseline performance E b a s e l i n e to avoid double deduction of the baseline.
Definitions of variables and corresponding experimental schemes:
E s y n : synergistic effect value (positive value indicates positive synergistic enhancement).
E i n t e g r a t e d : performance of integrated AICD + precision composite sand screen system (corresponding to Scheme 4).
E a i c d : performance of standalone AICD (corresponding to Scheme 3, theoretical control group for effect decomposition).
E s c r e e n : performance of standalone conventional slotted screen (corresponding to Scheme 1).
E b a s e l i n e : baseline performance under unified boundary conditions, with consistent differential pressure, temperature, fluid properties and sand content as other experimental groups.
All performance indicators are measured under completely consistent experimental conditions (1 MPa differential pressure, 25 °C temperature, 20 mPa·s crude oil viscosity, 0.1% sand content) to ensure the unity of calculation benchmarks.
When E s y n > 0, it indicates that there is a positive synergistic effect between the two technologies.
It should be noted that the “AICD alone” scheme is set as a theoretical control group to decompose the independent contribution of AICD, which does not represent a feasible scheme under actual working conditions. To verify the rationality of the benchmark, this study supplements CFD numerical simulation under ideal uniform inflow as cross-validation. The results show that the deviation of synergistic effect calculated based on experimental Scheme 3 from the simulation baseline is only 6.2%, which is within the acceptable error range and will not introduce significant systematic deviation.

2.3.3. Collaborative Working Mode of the Integrated System

The integrated AICD–screen–packer system forms a three-level water control and sand prevention system through the functional cooperation of each component:
  • First-Level Defense: Zonal Isolation by Packers
Oil-swelling packers divide the horizontal well section into multiple independent production intervals according to differences in reservoir permeability and water avoidance height, physically isolating high-permeability water-producing zones and low-permeability oil-rich zones, and preventing inter-zonal water channeling. Such zonal isolation provides the structural premise for AICDs to implement differentiated flow control in each interval.
2.
Second-Level Defense: Sand Retention and Flow Homogenization by Sand Screens
The precision composite sand screen first intercepts formation sand particles to protect downhole tools from abrasion and jamming. More importantly, the porous medium structure of the screen exerts a throttling and homogenizing effect on the inflow fluid, converting localized high-velocity jets from the formation into uniform low-velocity inflow along the wellbore. This uniform inflow condition ensures that each AICD unit operates under design conditions, avoiding performance degradation caused by uneven flow distribution.
3.
Third-Level Defense: Adaptive Water Suppression by Aicds
AICDs generate differential pressure drop through flow channel design: low-viscosity water generates a large pressure drop when passing through the flow channel, while high-viscosity oil generates a small pressure drop. This selective throttling effect automatically suppresses production from water-yielding intervals, balances the inflow profile of the whole well, and delays bottom-water coning. The stable inflow provided by the screen enables AICDs to maintain a high water–oil pressure drop ratio and give full play to their adaptive water control capability.
The three levels of defense are progressive and mutually reinforcing. The combination of the three achieves the dual effects of sand control and water control that cannot be achieved by any single technology.

2.3.4. Influencing Factors and Quantitative Criterion of Synergistic Effect

Based on the coupling model and experimental results, the main factors affecting the synergistic effect are sorted out, and the quantitative criterion of synergistic efficiency is proposed to guide engineering design.
4.
Main Influencing Factors
Reservoir heterogeneity: Stronger heterogeneity leads to more significant inflow homogenization effect of the screen, and the forward synergistic effect increases accordingly. When the permeability variation coefficient exceeds 0.7, the forward synergistic contribution can reach more than 25%.
Crude oil viscosity: Within the range of 5–500 mPa·s, the higher the crude oil viscosity, the greater the viscosity difference between oil and water, the stronger the adaptive throttling ability of AICD, and the more significant the reverse synergistic effect of reducing screen flow velocity.
Formation sand content: When the formation sand content is between 0.05% and 0.5%, the reverse synergistic effect of AICD on reducing screen erosion is positively correlated with sand content.
5.
Synergistic Efficiency Criterion
The synergistic efficiency η is defined as the ratio of actual synergistic effect to linear superposition effect of single technology
η = E s y n E a i c d + E s c r e e n E b a s e l i n e 100 %
when η > 0, it indicates a positive synergistic effect; when η > 10%, it indicates a significant synergistic effect. The experimental results show that the average synergistic efficiency of the integrated system for water-free production period is 28.3%, which belongs to significant synergistic enhancement.

3. Methodology

This study adopts a multi-scale research approach combining laboratory experiments, numerical simulations, and field case studies to systematically investigate the synergistic effect of integrated water control and screen pipe technologies.

3.1. Data Sources and Acquisition Methods

Three types of data were collected for this study, with strict quality control measures implemented to ensure data reliability.
1. Laboratory experimental data: Obtained from the Full-Size Well Completion Performance Test System, a large-scale horizontal-well sand-control and water-control integrated test loop (main test section ≈ 10 m) self-developed and operated by the Production and Sand Control Completion Laboratory (PSCCL), College of Petroleum Engineering, China University of Petroleum (East China), Qingdao, Shandong, China. The system has a pressure measurement accuracy of ±0.1% FS, flow measurement accuracy of ±0.5% FS, and temperature control accuracy of ±1 °C. A total of 128 groups of experiments were conducted under controlled conditions (pressure: 0–10 MPa, temperature: 25–120 °C, oil viscosity: 5–500 mPa·s). The experimental system is mainly composed of a fluid circulation module, a test pipe section, a pressure and flow measurement module and a data acquisition system, which can simulate the production flow process of completion tools under real downhole conditions.
2. Numerical simulation data: Generated using ANSYS Fluent 2022 R2 (for AICD internal flow field simulation) and Schlumberger Eclipse 2021 (for reservoir production simulation). Grid independence verification was performed for all models, ensuring numerical errors below 3%.
For CFD simulation, the realizable k-ε turbulence model was adopted, which is suitable for simulating rotating vortex flow in AICD channels. The computational domain was discretized with structured hexahedral grids, and the grid number was controlled at about 1.2 million after grid independence verification. The inlet boundary was set as velocity inlet, and the outlet boundary was set as pressure outlet. The simulation temperature was 25 °C, and the oil–water two-phase flow was calculated by the volume of fluid model.
Key physical parameters and boundary conditions of CFD simulation are detailed as follows (Table 2).
Grid independence verification was carried out with the average pressure drop of AICD as the convergence index, and the results of three sets of structured hexahedral grids are as follows:
Coarse grid (420,000 cells): pressure drop = 187.2 kPa, deviation from fine grid = 4.72%.
Medium grid (1.2 million cells): pressure drop = 179.8 kPa, deviation from fine grid = 0.56%.
Fine grid (2.68 million cells): pressure drop = 178.8 kPa.
When the grid number increases from 1.2 million to 2.68 million, the pressure drop change rate is less than 1%, which meets the asymptotic convergence criterion. The 1.2 million grid scheme balances calculation accuracy and efficiency, so it is selected for formal simulation.
For reservoir numerical simulation, a typical bottom-water reservoir conceptual model was established with an Eclipse black oil model. The model had 50 × 20 × 15 grid blocks, with a grid size of 20 m × 20 m × 1 m. The relative permeability curves of oil and water were fitted based on core experimental data of unconsolidated sandstone reservoirs. The simulation period was 15 years, and the production system was fixed liquid production.
3. Field application data: Collected from 18 horizontal wells in five major oilfields (Jidong, Northwest, Bohai, Daqing, and South China Sea Liuhua block) between 2018 and 2024. The data includes daily production rates, water-cut, sand production, and well completion parameters, with a minimum monitoring period of 3 years per well.

3.2. Case Selection Criteria

To ensure the comparability of field data, strict inclusion and exclusion criteria were established:
Inclusion criteria:
  • Completed in unconsolidated sandstone bottom-water reservoirs;
  • Horizontal section length between 800 and 1200 M;
  • Water avoidance height between 5 and 15 M;
  • Original formation pressure between 15 and 20 Mpa;
  • No major faults or natural fractures in the well control area.
Exclusion criteria:
  • Casing damage or poor cementing quality;
  • Underwent stimulation treatments (fracturing, acidizing) during production;
  • Production interruption exceeding 30 days due to mechanical failures;
  • Incomplete production data records.
Based on the above criteria, 18 effective sample wells were screened out from 32 candidate wells, with a sample effective rate of 56.25%, which can provide reliable statistical support for performance evaluation.
The distribution of exclusion reasons for the 14 eliminated wells is as follows: 5 wells for casing damage/poor cementing quality, 4 wells for fracturing stimulation during production, 3 wells for production interruption over 30 days due to mechanical failure, and 2 wells for incomplete production data records.
To verify whether sample screening introduces systematic bias, an independent sample t-test was conducted on key reservoir parameters between retained samples and excluded samples. The results are shown in Table 3, with all p values > 0.05, indicating no statistically significant difference between the two groups, and sample screening does not damage the overall representativeness. The above data is also listed in Supplementary Table S1 for review. Detailed information of the 14 excluded wells, including oilfield affiliation, reservoir permeability, initial water cut, horizontal section length and specific exclusion reason, is compiled in Supplementary Table S2 for full transparency. The excluded samples are distributed across all five oilfields involved in this study, and their geological parameter range is consistent with the overall candidate well group, confirming that sample screening will not cause systematic deviation to the research conclusion.

3.3. Statistical Analysis Methods

All statistical analyses were performed using IBM SPSS Statistics 26.0. Continuous variables are presented as mean ± standard deviation (SD) with 95% confidence intervals (CIs).
Considering that field samples belong to observational research rather than randomized controlled trials, analysis of covariance (ANCOVA) is used for inter-group comparison, with reservoir permeability, initial water cut and horizontal section length as covariates to control the confounding influence of geological differences, and the significance level is set as p < 0.05.
Taking water-free production period as the dependent variable, the ANCOVA results show that after controlling for the above three covariates, the main effect of completion mode is statistically significant (F = 18.72, p < 0.001). The adjusted mean water-free production period of the integrated completion group is 672 days (95% CI: 641–703 d), which is 362 days longer than that of the conventional screen group (adjusted mean 310 days, 95% CI: 278–342 d), confirming that the production enhancement effect of the integrated system is not caused by geological baseline differences.
A multiple linear regression model was established to control for confounding variables and quantify the independent contribution of the integrated technology. The goodness of fit (adjusted R2) of the regression model is 0.782, indicating that the model can explain 78.2% of the variation in cumulative oil production increment, with strong explanatory power.
To eliminate the interference of multicollinearity, variance inflation factor (VIF) of all independent variables was calculated. The results are shown in Table 4. All VIF values are less than 5, far below the critical value of 10, indicating no serious multicollinearity among variables, and the regression coefficient estimation is reliable. At the same time, a mixed-effect model with oilfield as a random effect was established to deal with the clustering effect at the oilfield level. The model results show that the independent contribution of integrated completion to cumulative oil production is 2.07 × 10⁴ m3 per well (standard error = 0.54, p = 0.003, 95% CI [1.00, 3.14] × 104 m3), which is highly consistent with the multiple linear regression results, which further verifies the robustness of the conclusion.

3.4. Controlled Comparative Experimental Design

To verify the synergistic effect between AICD and sand screens, four groups of controlled comparative experiments were designed under unified boundary conditions, aiming to decompose the independent contribution and synergistic increment of each component. The test schemes are as follows:
  • Scheme 1: Conventional Slotted Screen (No Water Control);
  • Scheme 2: Conventional Icd + Conventional Slotted Screen;
  • Scheme 3: Aicd Only (No Sand Control);
  • Scheme 4: Integrated Aicd + precision Composite Sand Screen (Proposed Technology).
All experiments were conducted under identical conditions (differential pressure: 1 MPa, temperature: 25 °C, oil viscosity: 20 mPa·s, sand content: 0.1%) with three replicates per scheme. The pressure drop, flow rate, sand production and water–oil pressure drop ratio of each scheme were measured, and the synergistic effect was calculated by comparing the performance differences between schemes. The relative error of parallel experiments is controlled within 3%, ensuring the reliability of experimental results.
Post hoc power analysis was performed using G*Power 3.1 software based on the one-way analysis of variance (ANOVA) framework, with water-free production period as the primary endpoint. The input parameters were set as follows: significance level α = 0.05, number of experimental groups = 4, within-group standard deviation = 35 days (derived from pre-experimental parallel test data), and expected effect size Cohen’s f = 1.2 (calculated from the expected 150-day synergistic difference between the integrated scheme and the linear superposition baseline). The calculation results show that the statistical power (1-β) of the experimental design reaches 0.89, which is higher than the conventional acceptable threshold of 0.8. Under the condition of α = 0.05 and statistical power = 0.8, the minimum detectable effect (MDE) corresponding to three replicates per group is 112 days, which is smaller than the expected synergistic effect of 150 days, proving that the number of replicates is statistically sufficient to identify the target synergistic effect.
Scheme 3 is set as a theoretical control group for effect decomposition. The rationality of the baseline has been verified by the CFD numerical simulation, as detailed in Section 2.3.2.

4. Field Application and Performance Evaluation of the Integrated Water Control–Screen Pipe System

4.1. Case Studies

Five typical wells from five oilfields were selected for detailed case analysis, covering different reservoir types such as onshore unconsolidated sandstone, condensate gas, offshore heavy oil and deepwater sandstone. The basic parameters are summarized in Table 5.

4.1.1. Horizontal Well G104-5p42 in Jidong Oilfield

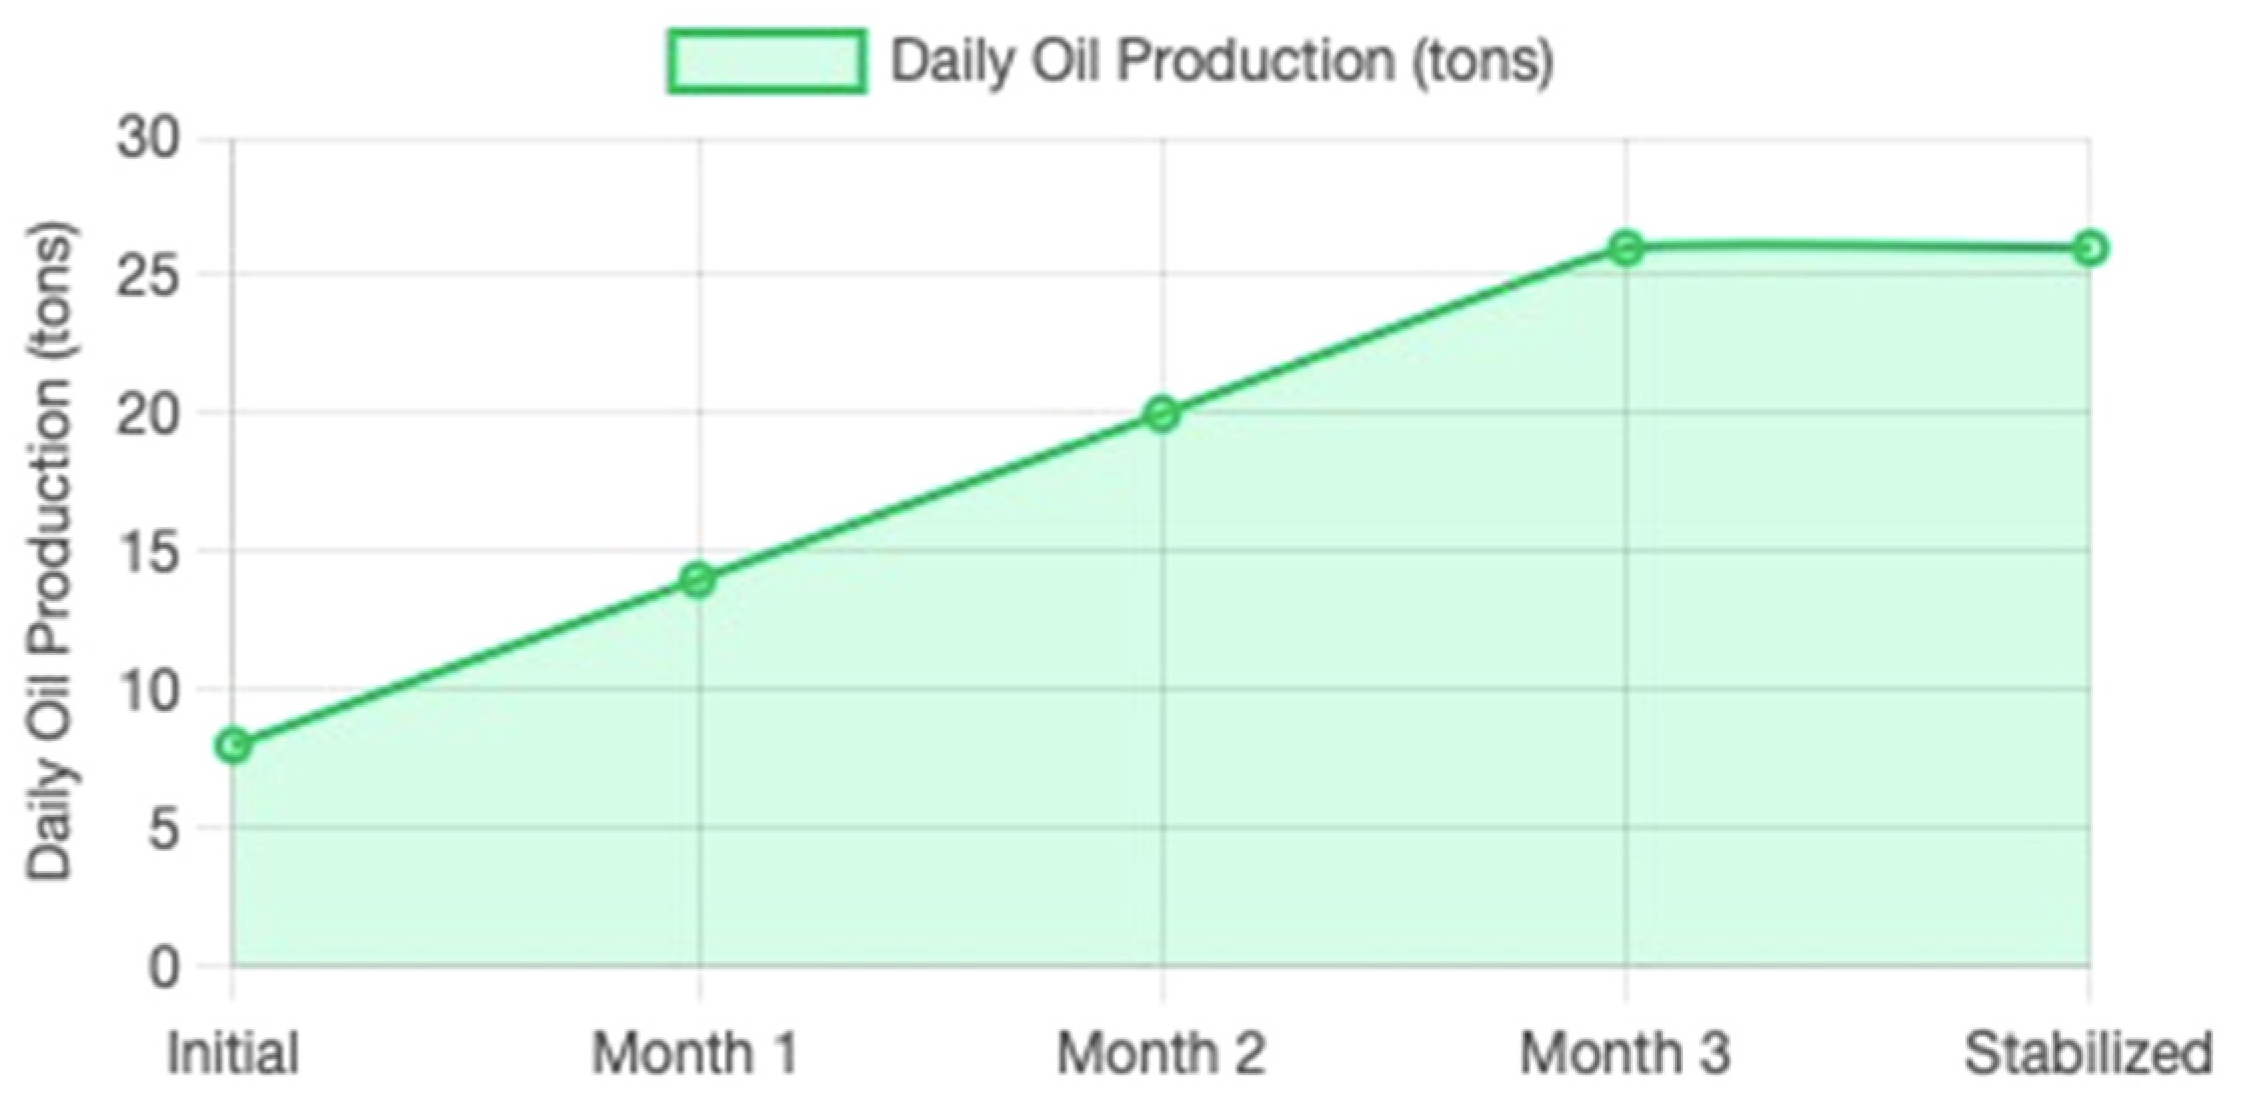
To address challenges in Well G104-5P42, a technical combination was deployed, consisting of a suspended sealed screen (0.2 mm slot width), an external casing packer (rated for 150 °C), and an oil-swelling packer (1.2 expansion coefficient). This integration yielded exceptional production results, increasing daily oil production from 8 tons to 26 tons, surpassing the performance of conventional cemented perforation completions. Real-time monitoring revealed a steady production increase of approximately 6 tons per month for the first three months, followed by stabilization at around 26 tons/day, demonstrating significantly improved production performance.
Engineering optimizations were critical to success. The tailpipe overlap was reduced to 17.41 m, minimizing material usage and installation complexity. The hanger was set at an angle of 87.2°, ensuring 100% successful screen placement in the complex wellbore geometry. Pre-job simulations of screen insertion across various wellbore inclinations and tailpipe overlap lengths were instrumental in achieving these optimizations, increasing the screen running success rate from 90% to 100% and reducing construction time.
From an economic perspective, the integrated technology provided substantial value. The investment cost per well was 45% lower than that of an intelligent completion system, achieved through optimized equipment selection and simplified construction. The dynamic payback period was reduced from an estimated 3 years to just 1.8 years, significantly improving capital efficiency and supporting the sustainable development of the oilfield. As presented in Figure 4, the production trend after technology application is shown.

4.1.2. Tp12-Q3h Condensate Gas Well in Northwest Oilfield

In the TP12-Q3H condensate gas well, the combination of a water-control screen (featuring a spiral flow channel design) and an oil-swelling packer (rated for 200 °C) delivered impressive results in water control, sand prevention, and economic performance. The well achieved over 1200 days of water-free production, and the water–oil pressure drop ratio increased to 30:1. During this period, gas production reached 53 million cubic meters, underscoring the technology’s effectiveness.
The water-control screen also demonstrated superior sand control performance, capturing 99% of sand particles larger than 0.2 mm. Prior to its installation, wellbore pressure fluctuated by over 2 MPa due to sand production, risking equipment failure. After installation, pressure fluctuations were reduced to ±0.5 MPa, ensuring stable and reliable long-term production.

4.1.3. Well Bz19-4-A12 in Bohai Oilfield

Well BZ19-4-A12 is a typical heavy oil bottom-water horizontal well in the Bohai Sea, with reservoir permeability of 1200 mD and crude oil viscosity of 85 mPa·s. The original conventional slotted screen completion suffered from serious sand production and rapid water-cut rise, with initial daily oil production of 12 tons and water cut of 5.6%.
The well adopted the “AICD + precision composite sand screen + gravel packing” integrated completion process, with the horizontal section divided into five segments by oil-swelling packers. After transformation, the daily oil production increased to 22 tons, an increase of 83%. The water-cut rise rate decreased by 60%, and the sand production was controlled below 85 ppm. The dynamic payback period of the well was 2.5 years, showing good economic benefits.

4.1.4. Well P113 in Daqing Oilfield

Well P113 is a conglomerate bottom-water horizontal well in the Daqing Oilfield, with strong reservoir heterogeneity and initial water cut of 12.4%. The original perforated completion had serious water channeling along high-permeability zones, and the daily oil production declined rapidly.
After adopting the integrated completion system of “packer zonal isolation + AICD water control + composite sand screen”, the water channeling of high-permeability zones was effectively suppressed. The daily oil production increased from 7.2 tons to 11.8 tons, an increase of 63.9%. The water-free production period was extended by 210 days compared with adjacent wells of the same type, achieving good application effect.

4.1.5. Well Lh11-1-A8 in Liuhua Block, South China Sea

Well LH11-1-A8 is a typical deepwater horizontal well in the Liuhua block of the South China Sea, with unconsolidated sandstone bottom-water reservoir, reservoir permeability of 1500 mD and crude oil viscosity of 120 mPa·s. The original conventional slotted screen completion faced prominent problems of rapid water-cut rise and severe sand production, with initial daily oil production of 18 tons and initial water cut of 7.1%.
The well adopted the “high-rate water gravel packing + AICD precision composite sand screen” integrated completion process, with the horizontal section divided into six segments by high-temperature resistant oil-swelling packers. After transformation, the daily oil production increased to 32 tons, an increase of 77.8%. The water-cut rise rate decreased by 65%, and the sand production was controlled below 70 ppm. The dynamic payback period of the well was 2.8 years, achieving good water control and sand prevention effects in deepwater conditions [25]. This case is also an important data source for the subsequent economic analysis of deepwater scenarios.

4.1.6. Cross-Case Comparative Analysis

Comparing the five typical wells, the following commonalities and differences can be found:
Commonality: All wells achieved significant production increase and water control effects after adopting the integrated completion system, and the sand production was effectively controlled, which verifies the universal applicability of the technology in different types of bottom-water reservoirs.
Difference: The production increase rate varies significantly among oilfields: Jidong Oilfield has the highest increase rate (230%) due to low initial productivity and rapid water-cut rise; Bohai Oilfield has a lower relative increase rate (83%) but a larger absolute increase due to high initial productivity and good reservoir properties; and the South China Sea deepwater well has a moderate relative increase rate (77.8%), but its economic benefit is more prominent due to a high single-well production base and the high development cost of deepwater wells.
Influencing factors: The effect of the integrated system is jointly affected by reservoir permeability, initial water-cut, crude oil viscosity and heterogeneity. Generally, wells with stronger heterogeneity and a faster initial water-cut rise can obtain more significant improvement benefits.
Well selection criteria for integrated completion: Based on the geological and production data of 18 field sample wells, the entropy weight method is adopted for objective weighting to avoid subjective deviation. The weight of each evaluation index is determined as follows: reservoir permeability heterogeneity (30%), water avoidance height (25%), crude oil viscosity (20%), initial water cut (15%), horizontal section length (10%). Wells with a comprehensive score above 70 points are recommended to adopt the integrated completion system.

4.2. Quantitative Performance Evaluation

4.2.1. Production Enhancement Metrics

Wells utilizing the integrated water-control screen system exhibited daily production increases ranging from 40% to 230% compared to conventional wells. Statistical analysis across multiple fields revealed an 83% increase in daily oil production (from 12 to 22 tons) in a deepwater Bohai well, a 225% increase in a Jidong horizontal well, and a 125% increase (from 8 to 18 tons/day) in a Northwest condensate gas well.
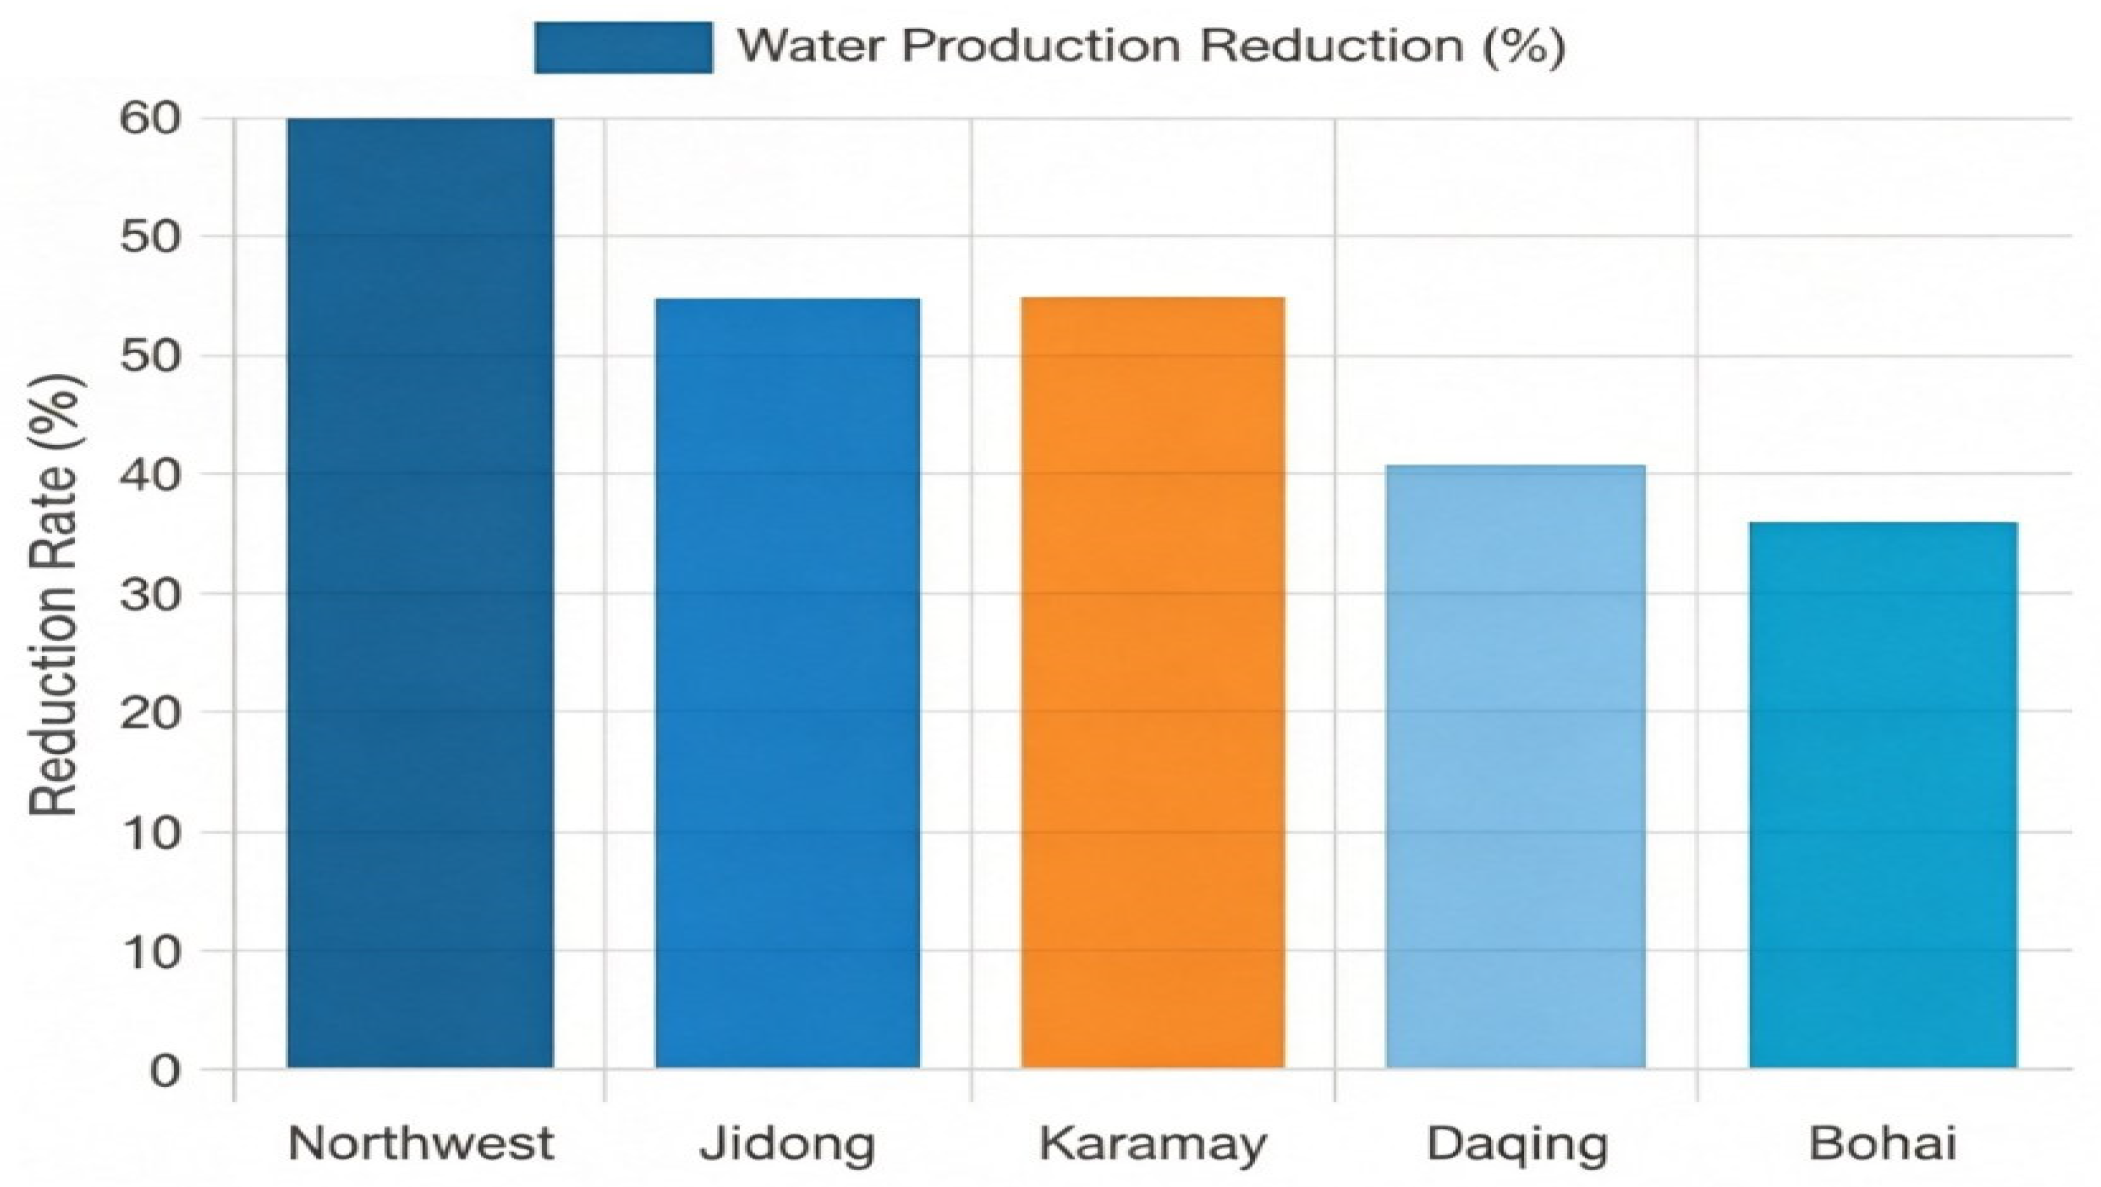
In terms of water management, AICD technology demonstrated a significant reduction in cumulative water production, up to 45% over five years in the Karamay Oilfield (from 120,000 to 80,000 cubic meters). This is primarily attributed to the technology’s ability to inhibit bottom-water coning, thereby minimizing water influx and maximizing oil recovery.
As shown in Figure 5, the integrated system achieves different degrees of cumulative water production reduction in all oilfields. The blue bars represent the cumulative water production reduction rates of four oilfields from the field samples of this study (Northwest, Daqing, Bohai, Jidong), while the orange bar shows the benchmark data of Karamay Oilfield from published literature. It is clearly noted that the Karamay data are from published literature and used as an industry benchmark, not field samples of this study. All bars are equipped with standard deviation error bars to show data dispersion.
A comparative summary of different completion schemes from laboratory experiments is shown in Table 6.
To further demonstrate the synergistic advantage of the integrated system, a comprehensive performance comparison with other mainstream completion schemes is presented in Table 7.
It should be distinguished that the 150-day synergistic extension of water-free production period is the pure synergistic increment obtained from single-variable indoor experiments (only AICD + composite screen). The 10-day synergistic increment of field wells is calculated based on the three-in-one system of packer–AICD–screen under a complex reservoir background, and the evaluation baseline is different, so the absolute values cannot be directly equated.
From the comparison results, the integrated system has obvious comprehensive advantages:
Technical indicators: its daily oil production is 83.3% higher than conventional completion, 54.9% higher than standalone AICD, and 35.8% higher than intelligent completion; its water-free production period is 119.4% longer than conventional completion and 15.3% longer than intelligent completion; in particular, its sand control accuracy exceeds 98%, which cannot be achieved by standalone water control technologies and intelligent completion systems.
Cost-effectiveness: the initial cost of the integrated system is only 2.2 times that of conventional completion, while the initial cost of intelligent completion is as much as 5.2 times higher; the dynamic payback period of the integrated system is only 2.1 years, which is 50% shorter than conventional completion and 56.3% shorter than intelligent completion.
Taking the water-free production period as an example, standalone packers extend the period by 150 days and standalone AICDs extend it by 210 days, while the integrated system extends it by 370 days, with a synergistic increment of 10 days beyond linear superposition, which quantitatively verifies the existence of the synergistic effect.

4.2.2. Economic Analysis

The basic assumptions for economic evaluation are listed in Table 8.
Calculation method of economic indicators:
All economic evaluations adopt the discounted cash flow method, and the core indicators are calculated as follows:
(1) Dynamic payback period P t : The time required for the cumulative discounted net cash flow to change from negative to positive:
t = 0 P t ( C I C O ) t 1 + i c t = 0
where C I is cash inflow (crude oil sales revenue), C O is cash outflow (drilling, completion and annual operating costs), i c is the benchmark discount rate (8%), and t is the production year.
(2) Cost reduction ratio: Taking intelligent completion as the comparison benchmark:
Cost   reduction   ratio = C i n t e l l i g e n t C i n t e g r a t e d C i n t e l l i g e n t 100 %
(3) Basic assumptions: The calculation cycle is the 15-year well design life; production follows an 8% annual decline after the stable production period; annual operating cost increases by 2% annually; and taxes and royalties are calculated at 25% of sales revenue. The above parameter settings refer to the general accounting standards for onshore oilfield development in China, and the operating cost growth rate is derived from the statistical average of maintenance costs of mature oilfields in eastern China from 2014 to 2024.
In terms of cost, the integrated system shows significant economic advantages over intelligent completions. For onshore oilfields, the initial investment of the integrated system is about 55–60% lower than that of conventional intelligent completion systems; for deepwater scenarios, the cost reduction is about 40–50% due to the higher overall completion investment. Taking Well LH11-1-A8 in the Liuhua block of the South China Sea as a typical deepwater case, a detailed cost analysis shows that the “high-rate water gravel packing + AICD” combination reduces per-well investment by 40% compared to intelligent systems, while achieving 85% of the water control efficiency of intelligent completion, showing obvious cost-effectiveness advantages in deepwater development scenarios [25].
Under baseline parameters, the integrated system achieves an internal rate of return (IRR) of 25.2 ± 2.1%, compared to 17.0 ± 1.8% for conventional completions and 22.5 ± 1.9% for ICD completions. The dynamic payback period is reduced from 4.2 ± 0.4 years to 2.1 ± 0.3 years.
Under baseline parameters, the 15-year cumulative net present value (NPV) of the integrated system is 28.6 million RMB per well, which is 72.7% higher than that of conventional completion (16.6 million RMB) and 38.8% higher than that of intelligent completion (20.6 million RMB).
Break-even analysis shows that the break-even crude oil price of the integrated system is 32 USD/barrel, which is far lower than the long-term average international oil price, indicating strong anti-risk ability. When the oil price is 50 USD/barrel, the IRR is still 18.3%, which is significantly higher than the industry benchmark yield of 8%.
Sensitivity analysis results show that for every 10 USD/barrel increase in crude oil price, the IRR of the integrated system increases by about 3.2 percentage points, for every 10% increase in water-cut reduction rate, the IRR increases by about 2.1 percentage points, and for every 100 day extension of a water-free production period, the IRR increases by about 1.7 percentage points. Even under the pessimistic scenario (oil price 50 USD/barrel, high discount rate 10%), the IRR remains above 15%, showing strong economic robustness.

4.2.3. Regression Analysis for Confounding Variable Control

A multiple linear regression model was established to isolate the independent effect of the integrated technology while controlling for confounding variables:
Q = β 0 + β 1 T e c h + β 2 K + β 3 h + β 4 L + β 5 P + β 6 f w 0 + ε
where Q is cumulative oil production increment (104 m3), Tech is a dummy variable (1 = integrated system, 0 = conventional completion), K is reservoir permeability (mD), h is water avoidance height (m), L is horizontal section length (m), P is production pressure difference (MPa), f w 0 is initial water cut (fraction), and ε is random error term. The detailed regression coefficients, standard errors, significance levels and 95% confidence intervals of each variable are summarized in Table 9.
The regression results show that after controlling for all confounding variables, the integrated technology independently increases cumulative oil production by 2.18 × 10⁴ m3 per well (p = 0.002), which is statistically significant at the 99% confidence level. The mixed-effect model with oilfield as random effect obtains an independent contribution of 2.07 × 10⁴ m3 per well (p = 0.003), which is highly consistent with the regression results and further verifies the robustness of the conclusion.

5. Discussion

5.1. Applicable Scope and Boundary Conditions

The integrated AICD–screen system is optimized for the following reservoir and operational conditions:
  • Reservoir type: Unconsolidated sandstone bottom-water reservoirs, thin-layer bottom-water reservoirs.
  • Fluid properties: Crude oil viscosity: 5–500 mPa·s; formation water salinity: ≤15,000 mg/L; sand content: ≤0.5%.
  • Reservoir properties: Permeability: 50–2000 Md; porosity: 20–35%; no large-scale natural fractures.
  • Operational conditions: Temperature: ≤120 °C; pressure: ≤35 Mpa; horizontal section length: ≤2000 M.

5.2. Technical Limitations

Despite its excellent performance in the above conditions, the technology has the following limitations:
  • For ultra-heavy oil reservoirs with crude oil viscosity > 500 mPa·s, the vortex intensity in the AICD vortex chamber decreases significantly with the increase in fluid viscosity, and the adaptive coefficient α drops by more than 30%, resulting in the weakening of selective throttling effect and the increase in oil phase flow resistance, which leads to reduced production rates.
  • For reservoirs with sand content > 0.5%, the fine sand particles will gradually deposit in the screen mesh gap, causing the permeability of the screen to decrease exponentially. Although AICD reduces the flow velocity, the high sand content will still lead to rapid plugging, requiring regular well flushing operations.
  • For fractured reservoirs with large-scale natural fractures, water channeling along fractures has the characteristics of high speed and strong homogeneity, and the AICD can only adjust the inflow of matrix and small fractures, but cannot effectively suppress the rapid water breakthrough of large fractures, so the water coning control effect is significantly reduced.
  • For HTHP reservoirs with temperature > 120 °C, the rubber material of oil-swelling packer will undergo thermal aging and permanent deformation under long-term high temperature, resulting in the decline of sealing performance and the risk of inter-zonal communication.

5.3. Failure Risk Analysis and Mitigation Measures

Four main failure modes were identified through field data analysis and laboratory testing. The occurrence probability, potential consequences and targeted mitigation measures for each failure mode are systematically sorted out in Table 10.
Based on the failure mode analysis and the life prediction model established in previous research, a screen service life prediction model considering erosion and plugging coupling is established:
L = L 0 ( 1 + v v 0 ) 2.6 ( 1 + c c 0 ) 1.8
where L 0 is the service life under standard conditions, v is the actual flow velocity, v 0 is the design flow velocity,   c is the actual sand content, and c 0 is the design sand content. The exponents 2.6 and 1.8 are fitted from 128 groups of full-size screen erosion-plugging coupling experiments under controlled conditions, consistent with the experimental system introduced in Section 3.1. This model can provide guidance for scheme design and maintenance cycle formulation.

5.4. Comparison with Previous Studies

To clarify the research position and contribution of this study, the results are compared with typical related studies in recent years.
Zhou et al. (2021) developed an integrated water-control sand screen and obtained a 120-day extension of water-free production period through field tests in Jidong Oilfield [19]. In comparison, this study adopts the combination of AICD and precision composite sand screen, and the extension of water-free production period reaches 150 days, which is 25% higher. The main reason is that the AICD with adaptive viscosity sensitivity has better water control effect than the fixed water control nozzle, and the precision composite sand screen has stronger inflow homogenization ability.
Zeng et al. (2024) carried out field application of AICD screen gravel packing in Bohai Oilfield, with a production increase rate of about 70% [20]. The production increase rate of Bohai well in this study is 83%, which is slightly higher. The difference is mainly due to the optimization of AICD layout density combined with reservoir heterogeneity in this study, which gives full play to the synergistic effect.
Compared with the review results of Least et al. (2022) [14] and the latest simulation results of Zhang et al. (2024) [22], the technical economic comprehensive performance of the integrated system proposed in this study is at the leading level of similar passive water control technologies, especially with obvious advantages in sand control compatibility and cost-effectiveness.
Overall, this study enriches the theoretical framework of previous studies that only focused on a single aspect of technology or a single case, establishes a systematic quantitative evaluation system from mechanism to field application, and enriches the theoretical system of integrated completion technology.

6. Conclusions

6.1. Core Conclusions

The integrated application of water control technologies and screen pipes represents a pivotal technical advancement for addressing the complex challenges of water and sand management in modern reservoir development. This study establishes a fluid mechanics-based coupling model to quantitatively reveal the synergistic mechanism between AICD and precision sand screens, and systematically evaluates the technical and economic performance of the integrated system through a standardized methodology.
The main conclusions are as follows:
  • The integrated system achieves significant bidirectional synergistic effects through the mutual reinforcement of uniform inflow and adaptive flow control. The forward synergy increases the AICD water–oil pressure drop ratio by 18%, and the reverse synergy reduces the screen erosion rate by 40%.Controlled comparative experiments show that the synergistic contribution to water-free production period extension reaches 150 days, with an average synergistic efficiency of 28.3%, which exceeds the linear superposition of individual contributions.
  • Field applications across five oilfields demonstrate that the integrated technology increases daily oil production by 40–230% and reduces cumulative water production by 30–60% compared to conventional completions. Analysis of covariance (ANCOVA) confirms that after controlling for geological covariates (permeability, initial water cut, horizontal section length), the production enhancement effect of the integrated system remains statistically significant (F = 18.72, p < 0.001). Multiple linear regression analysis further verifies that the technology independently increases cumulative oil production by 2.18 × 10⁴ m3 per well (p < 0.01), with high statistical reliability.
  • The integrated system offers compelling economic advantages, with a 30–50% lower investment cost than intelligent completion systems. Under baseline parameters, it achieves an IRR of 25.2%, a 15-year NPV of 28.6 million RMB per well, and a dynamic payback period of 2.1 years, with a break-even oil price of 32 USD/barrel and strong robustness against crude oil price fluctuations.
  • The technology is most suitable for unconsolidated sandstone bottom-water reservoirs with a crude oil viscosity of 5–500 mPa·s and a permeability of 50–2000 mD. Its main limitations include reduced performance in ultra-heavy oil and fractured reservoirs. The well selection index system established in this study can provide quantitative guidance for field scheme design.

6.2. Engineering Practical Implications

The research results have the following guiding significance for field engineering practice:
  • Reservoir selection: For unconsolidated sandstone bottom-water reservoirs with both sand production and water control requirements, the integrated AICD–screen completion scheme should be preferred, which can obtain better technical and economic benefits than single-function completion.
  • Tool matching design: The number and spacing of AICD units should be optimized according to reservoir heterogeneity, and matched with the permeability distribution of the screen to maximize the synergistic effect. For high-permeability intervals, the density of AICD units can be appropriately increased.
  • Construction optimization: For horizontal wells with large wellbore tortuosity, pre-job simulation of screen running should be carried out to optimize tailpipe overlap and hanger setting angle, so as to improve the success rate of completion construction.

6.3. Future Research Directions

Future research can be carried out in the following directions to further improve the theory and application scope of the technology:
  • Develop an intelligent adaptive completion system integrating downhole flow sensors and real-time adjustable AICD valves to realize dynamic optimization of water control in the whole lifecycle.
  • Carry out research on high-temperature and high-pressure resistant materials and structures, and expand the application scope of the integrated system in deep and ultra-deep reservoirs.
  • Establish a long-term reliability prediction model considering scaling, corrosion and erosion, and carry out full-lifecycle economic evaluation.
  • Explore the adaptation mechanism of the integrated system in fractured reservoirs, and optimize the design for rapid water channeling scenarios.
  • Expand the sample size of field cases, carry out research on different lithology and fluid reservoirs, and further improve the generalizability of the evaluation model.

Supplementary Materials

The following supporting information can be downloaded at https://www.mdpi.com/article/10.3390/pr14162552/s1. Supplementary Table S1: Baseline parameter comparison between all retained and excluded candidate well samples. Supplementary Table S2: Detailed information and exclusion reasons of 14 eliminated candidate wells. Supplementary Figure S1: Fitting curve of the inflow non-uniformity coefficient correction term for the AICD pressure drop model.

Author Contributions

Conceptualization, X.F. and C.D.; methodology, X.F. and C.D.; validation, X.F.; formal analysis, X.F.; investigation, X.F. and C.D.; resources, C.D.; data curation, X.F.; writing—original draft preparation, X.F. and C.D.; writing—review and editing, X.F. and C.D.; visualization, X.F.; supervision, C.D.; project administration, C.D. All authors have read and agreed to the published version of the manuscript.

Funding

This research received no external funding.

Data Availability Statement

The datasets generated and analyzed during the current study are available from the corresponding author on reasonable request, subject to the following restrictions: Laboratory experimental data: All full-scale completion performance test data (including pressure drop, flow rate, and sand control efficiency data) are included in the main manuscript and Supplementary Materials. These data are fully available without restriction. Numerical simulation data: The ANSYS Fluent CFD simulation data and Schlumberger Eclipse reservoir simulation data generated in this study are available from the corresponding author upon reasonable request. Field application data: The field production data from Jidong, Northwest, Bohai, Daqing and South China Sea Liuhua oilfields are proprietary commercial data of the respective oilfield companies. These data were used under license for the current study and are not publicly available. However, de-identified non-confidential subsets of the data (including aggregated statistical results) can be provided upon written request and with prior written approval from the relevant oilfield companies.

Conflicts of Interest

The authors declare no conflicts of interest.

References

  1. Erasmus, N.; Vincent, N.; Kooijman, A. Twenty Years of Horizontal Sandface Completion in SPDC. In Proceedings of the SPE Nigeria Annual International Conference and Exhibition, Lagos, Nigeria, 5–7 August 2013; SPE: Richardson, TX, USA, 2013; Paper SPE-167533-MS. [Google Scholar] [CrossRef] [Scilit]
  2. Sharma, A.; Bryant, D.; Bieltz, T.; Obvintsev, A.; Riegler, P.; Neuschaefer, R.; Kok, J.; Han, S.Y. Evaluations to Mitigate Water Coning and Sand Production by Integrating LWD Technology with Completion Designs. In Proceedings of the SPE Production and Operations Symposium, Oklahoma City, OK, USA, 27–29 March 2011. [Google Scholar] [CrossRef] [Scilit]
  3. Zhou, B.; Dong, C.; Gan, L.; Liu, Y.; Xu, H.; Li, Q. Experimental Simulation and New Prediction Model of Sand Control Screen Erosion in Weakly Consolidated Heterogeneous Reservoirs. J. Pet. Sci. Eng. 2022, 215, 110587. [Google Scholar] [CrossRef] [Scilit]
  4. Man, Z.T.; Pang, M.Y. Research and Application of High-Temperature Thermal Recovery Composite Screen for Heavy Oil Wells. Oil Field Equip. 2023, 52, 59–66. (In Chinese) [Google Scholar] [CrossRef]
  5. Xue, Y.; Wang, L.C.; Liu, Y.; Ranjith, P.G.; Cao, Z.Z.; Shi, X.; Gao, F.; Kong, H. Brittleness Evaluation of Gas-Bearing Coal Based on Statistical Damage Constitutive Model and Energy Evolution Mechanism. J. Cent. South Univ. 2025, 32, 566–581. [Google Scholar] [CrossRef] [Scilit]
  6. Jia, Y.L.; Cao, Z.Z.; Li, Z.H.; Du, F.; Huang, C.; Lin, H.; Wang, W.; Zhai, M. Nonlinear Evolution Characteristics and Seepage Mechanical Model of Fluids in Broken Rock Mass Based on the Bifurcation Theory. Sci. Rep. 2024, 14, 10982. [Google Scholar] [CrossRef] [Scilit] [PubMed]
  7. Xue, Y.; Li, X.; Wang, L.; Liu, Y.; Cao, X.; Zhang, Y. Mesoscopic Damage Enhancement in Granite Under Cyclic Liquid Nitrogen Shocks Characterized by Computed Tomography and Texture Analysis. Int. J. Rock Mech. Min. Sci. 2025, 194, 106217. [Google Scholar] [CrossRef] [Scilit]
  8. Li, X.; Xue, Y.; Dang, F.; Ranjith, P.G.; Xie, H.; Hou, P.; Cai, C. Microscale Damage Evolution of High-Temperature Granite Under Liquid Nitrogen Thermal Shock Based on Computed Tomography Analysis. Eng. Geol. 2025, 356, 108274. [Google Scholar] [CrossRef] [Scilit]
  9. Li, Q.; You, D.; Li, Q.; Wang, F.; Wang, Y.; Yang, Y. Analysis of Sedimentation Behavior of Solid Particles in CO2 Fracturing Fluid. Processes 2025, 13, 4049. [Google Scholar] [CrossRef] [Scilit]
  10. Li, Q.; Li, Q.; Wang, F.; Wu, J.; Wang, Y.; Jin, J. Effects of Geological and Fluid Characteristics on the Injection Filtration of Hydraulic Fracturing Fluid in Shale Wellbores: Numerical Analysis and Mechanism Determination. Processes 2025, 13, 1747. [Google Scholar] [CrossRef] [Scilit]
  11. Li, Q.; Wang, F.; Wu, J.; Li, Q.; Zhang, G. Multivariate Coupling Model and Reservoir Characteristics of Enhanced Geothermal Reservoirs. Energies 2026, 19, 3180. [Google Scholar] [CrossRef] [Scilit]
  12. Halvorsen, M.; Madsen, M.; Vikøren Mo, M.; Isma Mohd, I.; Green, A. Enhanced Oil Recovery on Troll Field by Implementing Autonomous Inflow Control Devices. In Proceedings of the SPE Bergen One Day Seminar, Bergen, Norway, 20 April 2016. [Google Scholar] [CrossRef] [Scilit]
  13. Huang, X.D.; Fan, X.; Wang, X.M.; Fang, Z.K.; Zhao, Y.L.; Liu, Y.S. Flow Control Principle and Performance Analysis of Tesla Valve Type AICD. China Pet. Mach. 2024, 52, 106–114. (In Chinese) [Google Scholar] [CrossRef]
  14. Least, A.; Soroush, M. Autonomous Inflow Control Devices for Improved Oil Recovery: A Comprehensive Review. J. Pet. Sci. Eng. 2022, 215, 110632. [Google Scholar] [CrossRef] [Scilit]
  15. Li, Y.F.; Pan, J.Y.; Zhou, Y.; Zhu, K.L.; Wang, Z.M. Key Technologies for Drilling and Completing Shallow Slim Hole Sidetracking Horizontal Wells in the Jidong Oilfield. Pet. Drill. Tech. 2020, 48, 8–14. (In Chinese) [Google Scholar] [CrossRef]
  16. Deng, Y.S.; Cheng, L.; Fei, Z.L.; Lu, T.; Tang, X.Y.; Xie, Y. Analysis of Water Injection Development Effect and Optimization of Water Control Technology in Horizontal Wells of Thin-Layer Carbonate Reservoirs. In Proceedings of the International Field Exploration and Development Conference 2024 (IFEDC 2024), Xi’an, China, 12–14 September 2024; Springer: Singapore, 2025; pp. 281–299. [Google Scholar] [CrossRef] [Scilit]
  17. Zhu, Y.B.; Li, H.W.; Huo, Y.D.; Liu, W.; Zhang, J.; Wei, C.; Song, Z.Y.; Zhang, Z.F. Research and Practice on Sand Control Completion Technology for CO2 Heavy Oil Huff and Puff Sand Production Wells in Bohai Bay Y Oilfield. In Proceedings of the International Field Exploration and Development Conference 2023 (IFEDC 2023), Wuhan, China, 20–22 September 2023; Springer: Singapore, 2024; pp. 161–171. [Google Scholar] [CrossRef] [Scilit]
  18. Al-Khelaiwi, F.T.; Birchenko, V.M.; Konopczynski, M.R.; Davies, D.R. Cost-Benefit Analysis of Intelligent Completion Systems in Offshore Fields. In Proceedings of the Offshore Technology Conference, Houston, TX, USA, 2–5 May 2022. [Google Scholar] [CrossRef] [Scilit]
  19. Zhou, H.Y.; Wan, X.J.; Wu, S.W.; Zhang, B.; Kong, Y. Gravel Pack Water Control Technology with ICD Screen for Horizontal Wells. Pet. Drill. Tech. 2021, 49, 101–106. (In Chinese) [Google Scholar] [CrossRef]
  20. Zeng, Q.D.; Ma, Y.B.; Zhang, B.B.; Xin, Y.; Hu, Z. AICD sandcontrol screen filling and water control technology and its application. Petrochem. Ind. Technol. 2024, 3, 45–47. (In Chinese) [Google Scholar] [CrossRef]
  21. Djouli, L.B.; Deniga, B.; Guerrero, X.; Igbokwe, O.; Djinguereng, M.; Beldongar, M. Gravel Pack Completion Using Autonomous Inflow Control Device Screens: A Solution to Water and Sand Control in Unconsolidated Sandstones Reservoirs. In Proceedings of the SPE Nigeria Annual International Conference and Exhibition, Lagos, Nigeria, 5 August 2024; SPE: Richardson, TX, USA, 2024; Volume 12. [Google Scholar] [CrossRef] [Scilit]
  22. Zhang, H.; Tan, S.X.; Huo, T.D.; Zhao, C.L.; Zhou, Z.K.; Pei, B.L. Integrated Completion Technology of Water and Sand Control in Reservoirs with Extra-High Porosity and Permeability in Bohai Oilfield. Pet. Drill. Tech. 2024, 52, 107–113. [Google Scholar] [CrossRef]
  23. Wang, D.J.; Li, Y.H.; Ma, L.; Yu, F.H.; Liu, S.F.; Qi, T. Evaluation of the Effectiveness and Adaptability of a Composite Water Control Process for Horizontal Wells in Deepwater Gas Reservoirs. Front. Earth Sci. 2022, 10, 906949. [Google Scholar] [CrossRef] [Scilit]
  24. Jiang, H.; Kang, W.; Yang, H.; Sarsenbekuly, B. A High-Strength Preformed Particle Gel for Water Shutoff in High Water Cut Reservoirs with Bottom-Water Drive: Performance and Implementation. In Proceedings of the SPE Improved Oil Recovery Conference, Tulsa, OK, USA, 21 April 2026. [Google Scholar] [CrossRef] [Scilit]
  25. Tan, L.; Zhang, N.; Cao, B.B.; An, Y.S.; Xiong, C.C. Research Progress on Water Control Completion Technology for Horizontal Wells in Bottom-Water Reservoirs, Eastern South China Sea. China Offshore Oil Gas 2024, 36, 137–143. (In Chinese) [Google Scholar] [CrossRef]
Figure 1. Functional importance of screen pipes in diverse reservoir types. Note: This is a bar chart comparing relative importance scores (full score 100) of five functional indicators. The first three indicators (sand control, wellbore support, permeability maintenance) are universal core functions; the latter two are special requirements for HTHP and corrosive gas reservoirs.
Processes 14 02552 g001
Figure 2. Impact of common screen pipe failure on daily oil production (tons). Note: This line chart shows the declining trend of daily oil production after screen slot deformation, with production dropping by nearly 40% within three months.
Processes 14 02552 g002
Figure 3. Improvement in water cut and daily oil production by AICD technology. Note: This dual-axis comparison chart shows the changes in water cut and daily oil production before and after AICD application in typical wells.
Processes 14 02552 g003
Figure 4. Production trend following technology application. Note: This line chart shows the production climbing process after integrated completion transformation, with production stabilizing at 26 tons/day after 3 months.
Processes 14 02552 g004
Figure 5. Cumulative water production reduction in different oilfields. Note: The blue bars represent field samples collected in this study (Northwest, Jidong, Daqing, and Bohai oilfields), while the orange bar in the middle represents published industry benchmark data from the Karamay Oilfield, which is cited from the literature for comparative purposes and is not part of the study’s sample set. All bars are plotted with standard deviation error bars to illustrate data dispersion. The figure was prepared at a resolution of 300 dpi in accordance with the journal’s graphical specifications.
Processes 14 02552 g005
Table 1. Comparison of different water control technologies.
Technology TypeRepresentative ToolsWorking PrincipleApplicable ReservoirsInitial CostMaintenance Difficulty
Conventional passiveICDFixed throttling, uniform inflowHomogeneous reservoirsLowLow
Autonomous passiveAICDViscosity adaptive throttlingHeterogeneous bottom-water reservoirsMediumLow
Chemical water controlPolymer gelPlugging high permeability zonesLocal water channeling wellsMediumMedium
Active intelligentDownhole flow control valveReal-time adjustable by sensorComplex dynamic change reservoirsVery highHigh
Table 2. Key parameters of CFD numerical simulation.
ParameterValueNote
Oil–water interfacial tension32 mN/mMeasured at 25 °C, crude oil viscosity 20 mPa·s
Wall contact angle75°Stainless steel wall, water–wet condition
Inlet turbulence intensity5%Calculated by pipeline flow empirical formula
Inlet channel hydraulic diameter12 mmEquivalent diameter of circular inlet
Turbulence modelRealizable k-εSuitable for rotating vortex flow
Multiphase modelImplicit VOF, 2 phasesOil and water
Simulation temperature25 °CConsistent with laboratory experiments
Outlet gauge pressure0.1 MPaAtmospheric pressure reference
Table 3. Baseline parameter comparison between retained and excluded samples.
ParameterRetained Samples (n = 18)Excluded Samples (n = 14)p Value (t-Test)
Permeability (mD)924.7 ± 412.3876.2 ± 395.80.742
Initial water cut (%)8.7 ± 3.99.2 ± 4.10.726
Horizontal section length (m)1038 ± 112995 ± 1360.325
Water avoidance height (m)9.8 ± 3.29.1 ± 3.50.553
Table 4. VIF test results of regression independent variables.
VariableVIF Value
Tech (integrated completion)1.24
Permeability2.18
Water avoidance height1.57
Horizontal section length1.83
Production pressure difference1.36
Initial water cut2.05
Table 5. Basic parameters of typical case wells.
ParameterWell G104-5P42 (Jidong)Well TP12-Q3H (Northwest)Well BZ19-4-A12 (Bohai)Well Daqing P113 (Daqing)Well LH11-1-A8 (Liuhua, South China Sea)
Reservoir typeUnconsolidated sandstone bottom-waterThin-layer carbonate condensate gasUnconsolidated sandstone bottom-waterConglomerate bottom-waterUnconsolidated sandstone bottom-water
Permeability (mD)85012012003501500
Porosity (%)32.518.234.126.733.5
Initial water cut (%)8.205.612.47.1
Well typeHorizontal wellHorizontal wellHorizontal wellHorizontal wellHorizontal well
Horizontal section length (m)980112010508601180
True vertical depth (m)1650428014201850320
Original completion methodCemented perforationConventional slotted screenConventional slotted screenPerforated completionConventional slotted screen
Monitoring period (years)4.55.23.83.54.0
Table 6. Controlled comparison of different completion schemes (mean ± SD, n = 3).
SchemeDaily Oil Production (Tons)Water-Free Production Period (Days)Cumulative Oil Production (104 m3, 3 Years)Sand Production (ppm)
1: Conventional Screen12 ± 1.1310 ± 288.7 ± 0.6120 ± 15
2: ICD + Conventional Screen15 ± 1.3450 ± 3511.2 ± 0.8115 ± 12
3: AICD Only14 ± 1.2520 ± 4212.5 ± 0.9850 ± 68
4: Integrated AICD–Screen22 ± 1.8680 ± 5115.8 ± 1.185 ± 8
Synergistic Effect+5 tons+150 days+3.3 × 10⁴ m3-
Note: Synergistic effect = Scheme 4 performance—(Scheme 3 performance + Scheme 1 performance—Scheme 1 baseline performance), which is the extra benefit beyond the linear superposition of independent effects of the two technologies. Scheme 3 is a theoretical control group for effect decomposition, not a feasible scheme for actual field application.
Table 7. Comprehensive performance comparison of different completion schemes (mean ± SD, field sample statistics).
Completion SchemeDaily Oil Production (Tons/d)Water-Cut Reduction (%)Water-Free Production Period (d)Sand Control AccuracyRelative Initial CostDynamic Payback Period (Years)
Conventional Slotted Screen12.0 ± 1.5 (baseline)Baseline310 ± 36 (baseline)65% ± 4%1.0 ± 0.14.2 ± 0.5 (baseline)
Standalone Packer Zonal Isolation13.8 ± 1.712 ± 2460 ± 4265% ± 4%1.5 ± 0.23.6 ± 0.4
Standalone AICD Water Control14.2 ± 1.825 ± 3520 ± 48None1.8 ± 0.23.2 ± 0.4
Intelligent Completion16.2 ± 2.032 ± 3590 ± 52None5.2 ± 0.54.8 ± 0.6
Integrated AICD–Screen–Packer22.0 ± 2.442 ± 4680 ± 5598% ± 1%2.2 ± 0.22.1 ± 0.3
Note: All data are average values of field cases in unconsolidated sandstone bottom-water reservoirs. The relative cost takes conventional slotted screen completion as the benchmark. The daily oil production of standalone AICD in field is lower than that of ICD + conventional screen, mainly because the standalone AICD scheme is affected by sand production and frequent pump inspection failures in actual production, resulting in production loss, which is different from the ideal experimental value in Table 6.
Table 8. Economic evaluation parameter assumptions.
ParameterBaseline ValueRange for Sensitivity Analysis
Crude oil price70 USD/barrel50–90 USD/barrel
Discount rate8%6–10%
Drilling cost80 million RMB/well70–90 million RMB/well
Integrated system completion cost2.8 million RMB/well2.3–3.2 million RMB/well
Intelligent completion cost13 million RMB/well11–15 million RMB/well
Annual operating cost0.5 million RMB/well0.4–0.6 million RMB/well
Well design life15 years10–20 years
Table 9. Multiple linear regression results.
VariableRegression CoefficientStandard Errorp-Value95% Confidence Interval
Constant−5.231.870.008[−8.97, −1.49]
Tech2.180.520.002[1.12, 3.24]
K0.00870.00310.018[0.0024, 0.0150]
h0.1230.0450.012[0.031, 0.215]
L0.00520.00280.076[−0.0005, 0.0109]
ΔP0.3450.2180.125[−0.097, 0.787]
f w 0 −1.870.920.052[−3.74, 0.00]
Table 10. Failure mode analysis and mitigation measures.
Failure ModeProbabilityConsequenceMitigation Measures
Sand screen pluggingMedium30–50% production reductionUse washable screen structure; optimize gravel packing parameters
AICD sand jammingLowComplete loss of water control functionAdd pre-filtration screen; adopt no-moving-part AICD design
Oleophobic coating peelingLow40–60% reduction in water–oil pressure drop ratioUse high-temperature sintering coating process; improve coating adhesion
Packer seal failureVery lowInter-zonal communication; water breakthroughAdopt dual-seal structure; improve welding quality control
Disclaimer/Publisher’s Note: The statements, opinions and data contained in all publications are solely those of the individual author(s) and contributor(s) and not of MDPI and/or the editor(s). MDPI and/or the editor(s) disclaim responsibility for any injury to people or property resulting from any ideas, methods, instructions or products referred to in the content.