Article

A Novel Three-Component Logging Volumetric Model for Coal-Rock Gas: Dual-Variable Framework Calibration and Porosity Evaluation


1
National Engineering Laboratory for Exploration and Development of Low-Permeability Oil & Gas Fields, Xi’an 710018, China
2
Exploration Department, PetroChina Changqing Oilfield Company, Xi’an 710018, China
3
Exploration and Development Research Institute, PetroChina Changqing Oilfield Company, Xi’an 710018, China
4
Natural Gas Evaluation Project Department of Petro China Changqing Oil field Company, Qingyang 745000, China
*
Author to whom correspondence should be addressed.
Processes 2026, 14(15), 2456; https://doi.org/10.3390/pr14152456
Submission received: 1 July 2026 / Revised: 22 July 2026 / Accepted: 28 July 2026 / Published: 30 July 2026

Abstract

With the gradual decline in conventional oil and gas production growth, unconventional natural gas has become a strategic alternative for hydrocarbon supply. Coal-rock gas (CRG) represents a deep unconventional gas resource with huge potential. Major exploration breakthroughs of CRG have been achieved in China, while systematic research targeting CRG as an independent gas reservoir is still lacking internationally. After effective commercial development, CRG serves as an important supplementary energy source for the domestic natural gas supply. Existing logging evaluation methods exhibit notable deficiencies, as porosity is typically estimated by fitting well logging data or proximate analysis data, resulting in limited accuracy. To address the lack of a dedicated logging volumetric model, ambiguous coal-matrix framework parameters, and substantial porosity calculation errors in deep CRG reservoirs, this study investigates the medium–high rank No. 8 coal seam of the Benxi Formation in the central-eastern Ordos Basin. From an oil and gas reservoir logging evaluation perspective, multi-scale experiments were conducted to systematically characterize the material composition and microscopic characteristics of the coal rock. From the perspective of oil and gas reservoir logging evaluation, a three-component logging volumetric model, consisting of a coal matrix, inorganic minerals, and pore fluids, was constructed, and the corresponding coal-matrix framework parameters were calibrated. The results demonstrate that coal rock is an organic–inorganic composite system, with organic macerals dominated by vitrinite (averaging 59.1%) and inertinite (27.1%). The sum of fixed carbon and volatiles exhibits strong correlations with total organic carbon (TOC) and micro-CT-derived coal-matrix content, yielding determination coefficients of 0.99 and 0.95, respectively, which validates the reliability of the multi-scale quantitative composition characterization. The coal-matrix framework parameters are non-constant: density ranges from 1.08 to 1.56 g·cm−3, acoustic slowness from 281 to 425 μs·m−1, and compensated neutron from 39% to 79%. Borehole enlargement severely affects compensated density and neutron logs but has negligible interference with acoustic slowness. Notably, inertinite content shows a significant negative correlation with the acoustic-slowness framework response (R2 = 0.80), indicating that structurally dense inertinite is a key intrinsic factor controlling the elastic response of the coal matrix. For porosity evaluation, a dual-variable framework model is proposed. The core novelty of this method is that it simultaneously incorporates variations in inorganic mineral content and differences in inertinite proportion within organic components as dynamic framework constraints, breaking through the limitation of the conventional constant-matrix assumption. The acoustic-slowness-based model achieves an average relative error of merely 7.1%, effectively resolving the large errors inherent in conventional fitting methods. The dedicated coal-rock logging evaluation system established in this study overcomes the limitations of fixed framework models, offers a scientific basis for fine-scale interpretation and resource assessment of deep CRG reservoirs, and provides a valuable reference for evaluating analogous reservoirs.

1. Introduction

Against the backdrop of the accelerating depletion of conventional petroleum reserves, unconventional oil and gas exploration and development has emerged as a dominant global research frontier [1]. Natural gas, a comparatively clean-burning fossil fuel, has established itself as an indispensable pillar underpinning global energy security and driving the worldwide transition toward low-carbon energy systems [2]. Early shallow coalbed methane (CBM) exploration and exploitation initiatives were predominantly motivated by the imperative to mitigate underground gas hazards and ensure coal mining safety [3,4]. As exploration frontiers have progressively extended to greater depths, deep coal-rock gas (CRG)—an unconventional natural gas resource with enormous untapped geological potential—has transitioned from being merely a by-product of coal mine safety management to a standalone strategic target for hydrocarbon exploration and production [5,6]. Since 2020, China has made remarkable breakthroughs in deep CRG exploration and development within major sedimentary basins, most notably the Ordos and Junggar basins [7,8]. Internationally, most existing studies focus on shallow coalbed methane associated with coal mining safety. Systematic studies treating deep CRG as an independent exploration target from an oil and gas development perspective are relatively scarce. As CRG enters effective commercial development in China, it has become an important supplementary natural gas resource, yet a mature logging evaluation system dedicated to deep CRG reservoirs is still lacking. Preliminary geological resource assessments reveal that China’s deep CRG resources (burial depth > 2000 m) exceed 30 × 1012 m3, establishing a solid resource base for the discovery of supergiant gas fields and serving as a strategic successor domain for future natural gas reserve additions and production expansion [9,10,11].
As exploration penetrates deeper into the subsurface, deep CRG can no longer be conceptualized as merely shallow CBM displaced to greater burial depths [12]. Rather, it is characterized by fundamentally distinct geological settings and fluid occurrence mechanisms that deviate significantly from those of shallow CBM [13]. Relative to shallow CBM reservoirs, deep CRG reservoirs experience substantially higher in situ stress, formation pressure, and temperature, and exhibit elevated coalification degrees, with vitrinite reflectance (Ro) values typically exceeding 1.0% [14,15]. Under intense deep tectonic stress regimes, coal rocks develop intricate interconnected networks of micropores, cleats, and microfractures, forming a complex dual-medium storage and transport system [16,17,18,19]. Natural gas in these reservoirs exists in an “oversaturated” state, where adsorbed and free gas phases coexist, with free gas accounting for a substantially larger proportion than in shallow CBM reservoirs [6,20]. Collectively, these features define deep CRG reservoirs as organic–inorganic composite systems with dual-pore media and multiphase gas occurrence [21]. These inherent geological complexities impose significantly more stringent requirements on well-log evaluation methodologies. On one hand, a specialized volumetric model that accounts for the unique lithological composition of CRG reservoirs is essential to accurately constrain the coal-matrix framework parameters [22]. On the other hand, quantitative characterization of coal-matrix content and organic maceral composition is indispensable for establishing a robust foundation for calculating critical reservoir parameters, particularly porosity [23,24].
Nevertheless, prevailing well-log evaluation methodologies for CRG reservoirs are predominantly adapted from shallow CBM evaluation paradigms and fail to adequately accommodate the distinctive geological complexities inherent to deep CRG systems [25,26]. Early well-log datasets were almost exclusively utilized as indirect proxies for gas content quantification. For instance, proximate analysis constituents were empirically derived from logging responses, and the fixed carbon-to-volatile matter ratio was employed to calibrate coefficients in isothermal adsorption models for gas content prediction [27]. With the exponential advancement of data-driven methodologies and high-performance computing capabilities, contemporary CBM logging evaluation has expanded its scope to encompass coal-seam identification, gas content prediction, proximate component characterization, coal structure discrimination, and macroscopic coal lithotype classification [28]. These established evaluation workflows typically integrate well-log responses with core experimental measurements to construct statistical regression or machine learning classification models. For gas content and proximate component prediction, core measurements are conventionally used as labelled training data to analyze statistical correlations between logging responses and target reservoir parameters [29,30]. Logging curves exhibiting statistically significant correlations with target parameters are subsequently selected as input features to develop linear or nonlinear predictive models. Notably, proximate analysis parameters are the most widely used bridging indicators in these evaluation workflows, even though their characterization precision for organic components is inferior to TOC testing and micro-CT scanning. This situation is mainly driven by practical engineering constraints: proximate analysis features low cost, simple operation, low sample demand, and abundant historical data accumulation across the coal industry, making it the most accessible basic data for field-scale evaluation. In contrast, high-precision characterization methods are limited by high cost and long testing cycles, and have not been widely popularized in production practice. For coal structure or macroscopic coal lithotype discrimination, logging curves with superior discriminatory power are identified using type-labelled core datasets [31]. Novel evaluation parameters are formulated based on the characteristic response signatures of different coal types to amplify logging response differences, or the selected logging curves are directly employed as feature vectors for classification algorithms [32]. Back-propagation neural networks, support vector machines, classification and regression trees, and ensemble learning models have been extensively deployed in these applications, providing invaluable support for CBM sweet-spot delineation and development plan optimization [28]. Notwithstanding, while these data-driven approaches can yield reasonably reliable evaluation results under specific geological conditions, they are fundamentally limited by an incomplete mechanistic understanding of the underlying petrophysical logging response mechanisms. A critical and pervasive limitation is that nearly identical combinations of logging curves are frequently utilized to predict disparate reservoir parameters. The relative contributions of individual curves are determined primarily by algorithmic weighting, rather than a rigorous theoretical framework grounded in fundamental petrophysical principles.
Direct application of the aforementioned shallow CBM evaluation framework to deep CRG reservoirs presents several notable technical challenges. First, there is a fundamental mismatch between existing evaluation frameworks and the geological characteristics of deep CRG reservoirs. While modern evaluation approaches have become increasingly multidimensional, they remain rooted in the shallow CBM paradigm and lack a specialized volumetric model tailored to the unique properties of CRG reservoirs. This creates a disconnect from the binary “solid framework–pore fluid” (solid framework, i.e., the combined response of coal matrix and inorganic minerals) evaluation system universally used for conventional clastic and carbonate hydrocarbon reservoirs. Second, comprehensive quantitative characterization of reservoir components remains a major challenge. While existing techniques can effectively quantify the relative abundance of inorganic minerals, no universally accepted standard exists for the identification and quantitative characterization of the coal matrix. Furthermore, the quantitative relationship between coal-matrix content and conventional coal petrological indicators remains poorly constrained, which hinders the integration of laboratory core analyses with downhole logging data and limits the generalizability of evaluation results. Third, coal-matrix framework parameters remain poorly calibrated. The petrophysical logging responses of the coal matrix framework—including bulk density, compensated neutron, and acoustic slowness—lack reliable site-specific calibration methods. This introduces significant errors in the calculation of critical reservoir parameters, most notably porosity, and reduces the reliability of subsequent water saturation evaluations.
To address these critical technical challenges, this study focuses on the medium–high rank No. 8 coal seam of the Benxi Formation in the central-eastern Ordos Basin. A comprehensive suite of multi-scale laboratory experiments, including whole-rock X-ray diffraction, proximate analysis, total organic carbon (TOC) measurement, maceral analysis, vitrinite reflectance measurement, core porosity testing, and high-resolution micro-computed tomography (micro-CT), was systematically performed to establish a high-quality experimental dataset for the coal-rock reservoirs in the study area. The primary objectives of this study are twofold: (1) to optimize and refine micro-CT image segmentation results using complementary X-ray diffraction (XRD) data; accurately quantify coal-matrix content, inorganic mineral types, and absolute mineral abundances in CRG reservoirs; and establish preliminary quantitative relationships between coal-matrix content and conventional coal petrological indicators; and (2) to calibrate the coal-matrix framework logging response values for CRG reservoirs by integrating the actual logging response characteristics of the study area; develop a dual-variable framework porosity logging volumetric model for CRG reservoirs; validate the model using core-measured porosity data; and systematically interpret and corroborate the experimental and modelling results using conventional coal petrological indicators. The core innovation of this study is the development of a specialized three-component logging volumetric model tailored to the unique geological characteristics of CRG reservoirs. This model enables accurate porosity quantification for CRG reservoirs and effectively overcomes the key limitations of existing evaluation systems, namely the lack of a dedicated volumetric model and large errors in porosity estimation. The proposed methodology provides a novel technical framework and robust data support for the refined well-log evaluation of deep CRG reservoirs, and offers valuable insights for the evaluation of analogous unconventional gas reservoirs worldwide.

2. Geological Setting

The study area lies in the central-eastern part of the Ordos Basin, where the primary target interval is the No. 8 coal seam, hosted within the Upper Palaeozoic Carboniferous–Permian Shanxi–Benxi coal measures. These coal-bearing strata were deposited in a transitional marine-continental setting and comprise ten vertically stacked coal-bearing intervals. Among these, the No. 8 seam is the most regionally significant and can be further divided into six distinct peat-forming mire types. Throughout the sedimentary evolution, multiple peat mire facies underwent extensive vertical stacking and persistent lateral development across the basin, creating a favourable paleogeographic framework for thick peat accumulation. The predominant depositional environments were raised mires and flooded forest swamps, which, together with rapid peat accretion, prolonged peat-forming intervals, and stable sedimentary regimes, gave rise to a remarkably thick and laterally continuous No. 8 coal seam [7,20,33]. This seam constitutes a widespread, laterally extensive coal unit and serves as the principal source rock for the large-scale Upper Palaeozoic coal-derived gas systems in the Ordos Basin. Moreover, the roof and floor strata of the No. 8 seam consist of compact fine-grained lithologies (mainly limestone and mudstone) that provide effective caprock conditions. Consequently, the reservoir system exhibits source–reservoir integration, sustained hydrocarbon generation, and a “box-type” sealing architecture, collectively delivering a robust source-caprock assemblage that facilitates large-scale CRG accumulation and enrichment [34].
The No. 8 coal seam ranges in thickness from 3.0 to 16.0 m, with a mean value of 7.8 m, and is primarily buried at depths of 2200–3200 m. In terms of macrolithotype, the seam is dominated by bright and semi-bright coal. It is structurally intact, with either no prominent partings or only thin interbedded dirt partings, and predominantly develops a homogeneous primary massive structure. Previous studies have demonstrated that the maceral assemblage of the seam is dominated by vitrinite, with subordinate inertinite. This composition indicates an abundance of hydrocarbon-generating precursors and favourable gas-generation potential. Ro values fall within 1.2–2.6%, corresponding to medium- to high-rank coal that has entered the high-maturity gas-generation window [35]. At this maturity stage, kerogen cracking and secondary cracking of liquid hydrocarbons proceed concurrently, yielding substantial gaseous hydrocarbons and providing a robust gas source for CRG accumulation.

3. Sample Sources and Methods

This section consists of two parts. The first part describes the sample sources, the series of experiments conducted, and the corresponding experimental results. The second part presents the construction of the well-log volumetric model for CRG reservoirs, calibration of logging framework responses, and the principles of porosity calculation.

3.1. Sample Sources

The study samples were collected from the No. 8 principal coal seam of the Benxi Formation in the central-eastern Ordos Basin. A total of 32 intact coal-rock core samples from burial depths of 2300–2800 m were selected for a series of laboratory experiments (Figure 1).

3.1.1. Microscopic Morphology and Mineral Distribution Characteristics of Coal Rocks

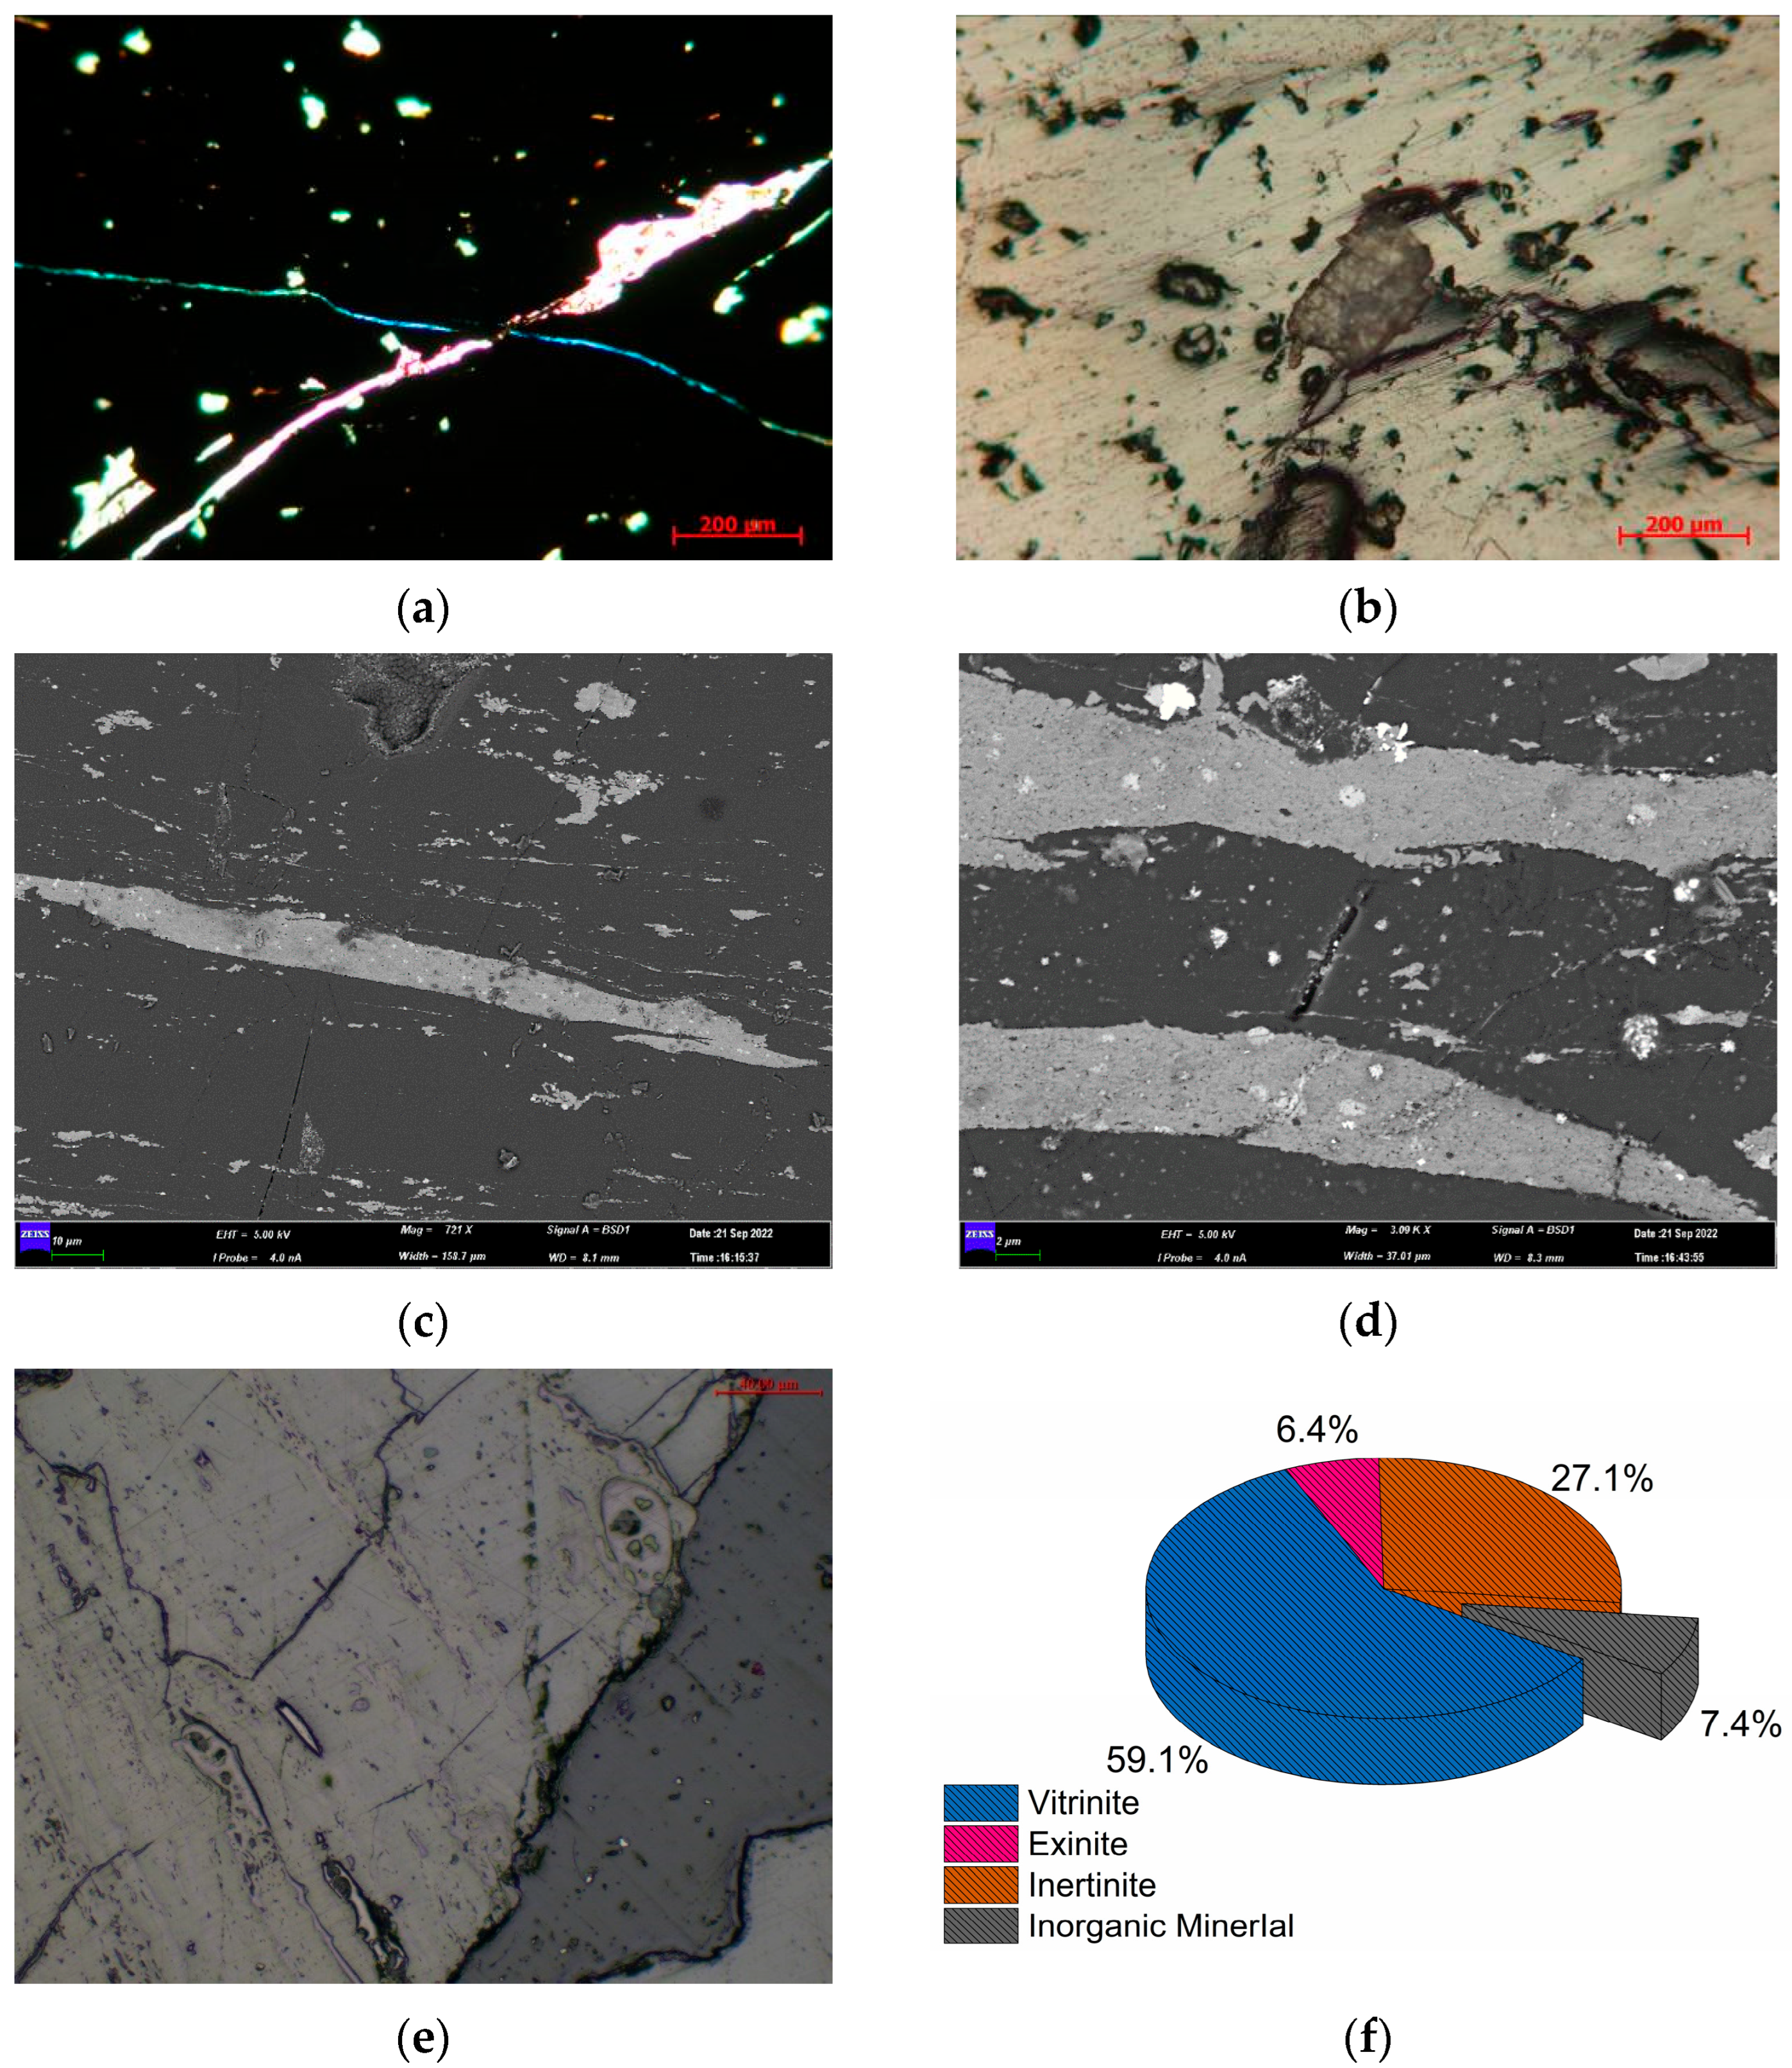
To directly reveal the microscopic material composition and mineral occurrence characteristics of the coal rocks, cast thin-section, scanning electron microscopy (SEM), and maceral observations were integrated for the same sample, M172-3 (Figure 2). Figure 2a shows the plane-polarized cast thin section of M172-3, indicating that the sample belongs to semi-dull to semi-bright coal. The vitrain is opaque, with well-developed intersecting internal fractures. Early-stage fractures are filled with clay minerals, and a small amount of terrigenous detritus is also present. Figure 2b shows the corresponding reflected-light image, in which irregular vitrain tissues appear bright grey and distinct spotted inorganic minerals can be observed. Figure 2c,d show two SEM fields of view from the same sample. These images further indicate that fractures are well-developed within the coal rock, minerals occur in banded distributions, pyrite aggregates are locally present, and the organic matter exhibits good continuity. Figure 2e presents a microscopic image showing banded matrix vitrinite containing clay minerals; fractures are well-developed and filled with exsudatinite. Figure 2f shows the maceral point-counting results for multiple samples from the study area. Overall, the No. 8 coal seam is dominated by vitrinite, with contents ranging from 32.0% to 85.2% and an average of 59.1%. Inertinite has an average content of 27.1%, whereas clay minerals account for an average of 7.4%.
Collectively, the thin-section, SEM, and maceral observations demonstrate that the coal rocks in the study area are not a single organic-matter system. Instead, they are composite rocks composed of organic macerals and dispersed or fracture-filling inorganic minerals, with pronounced coexistence between the two components. This microscopic evidence provides the basis for establishing the subsequent three-component volumetric model for coal rocks.

3.1.2. Quantitative Characterization of Mineral Contents in Coal Rocks

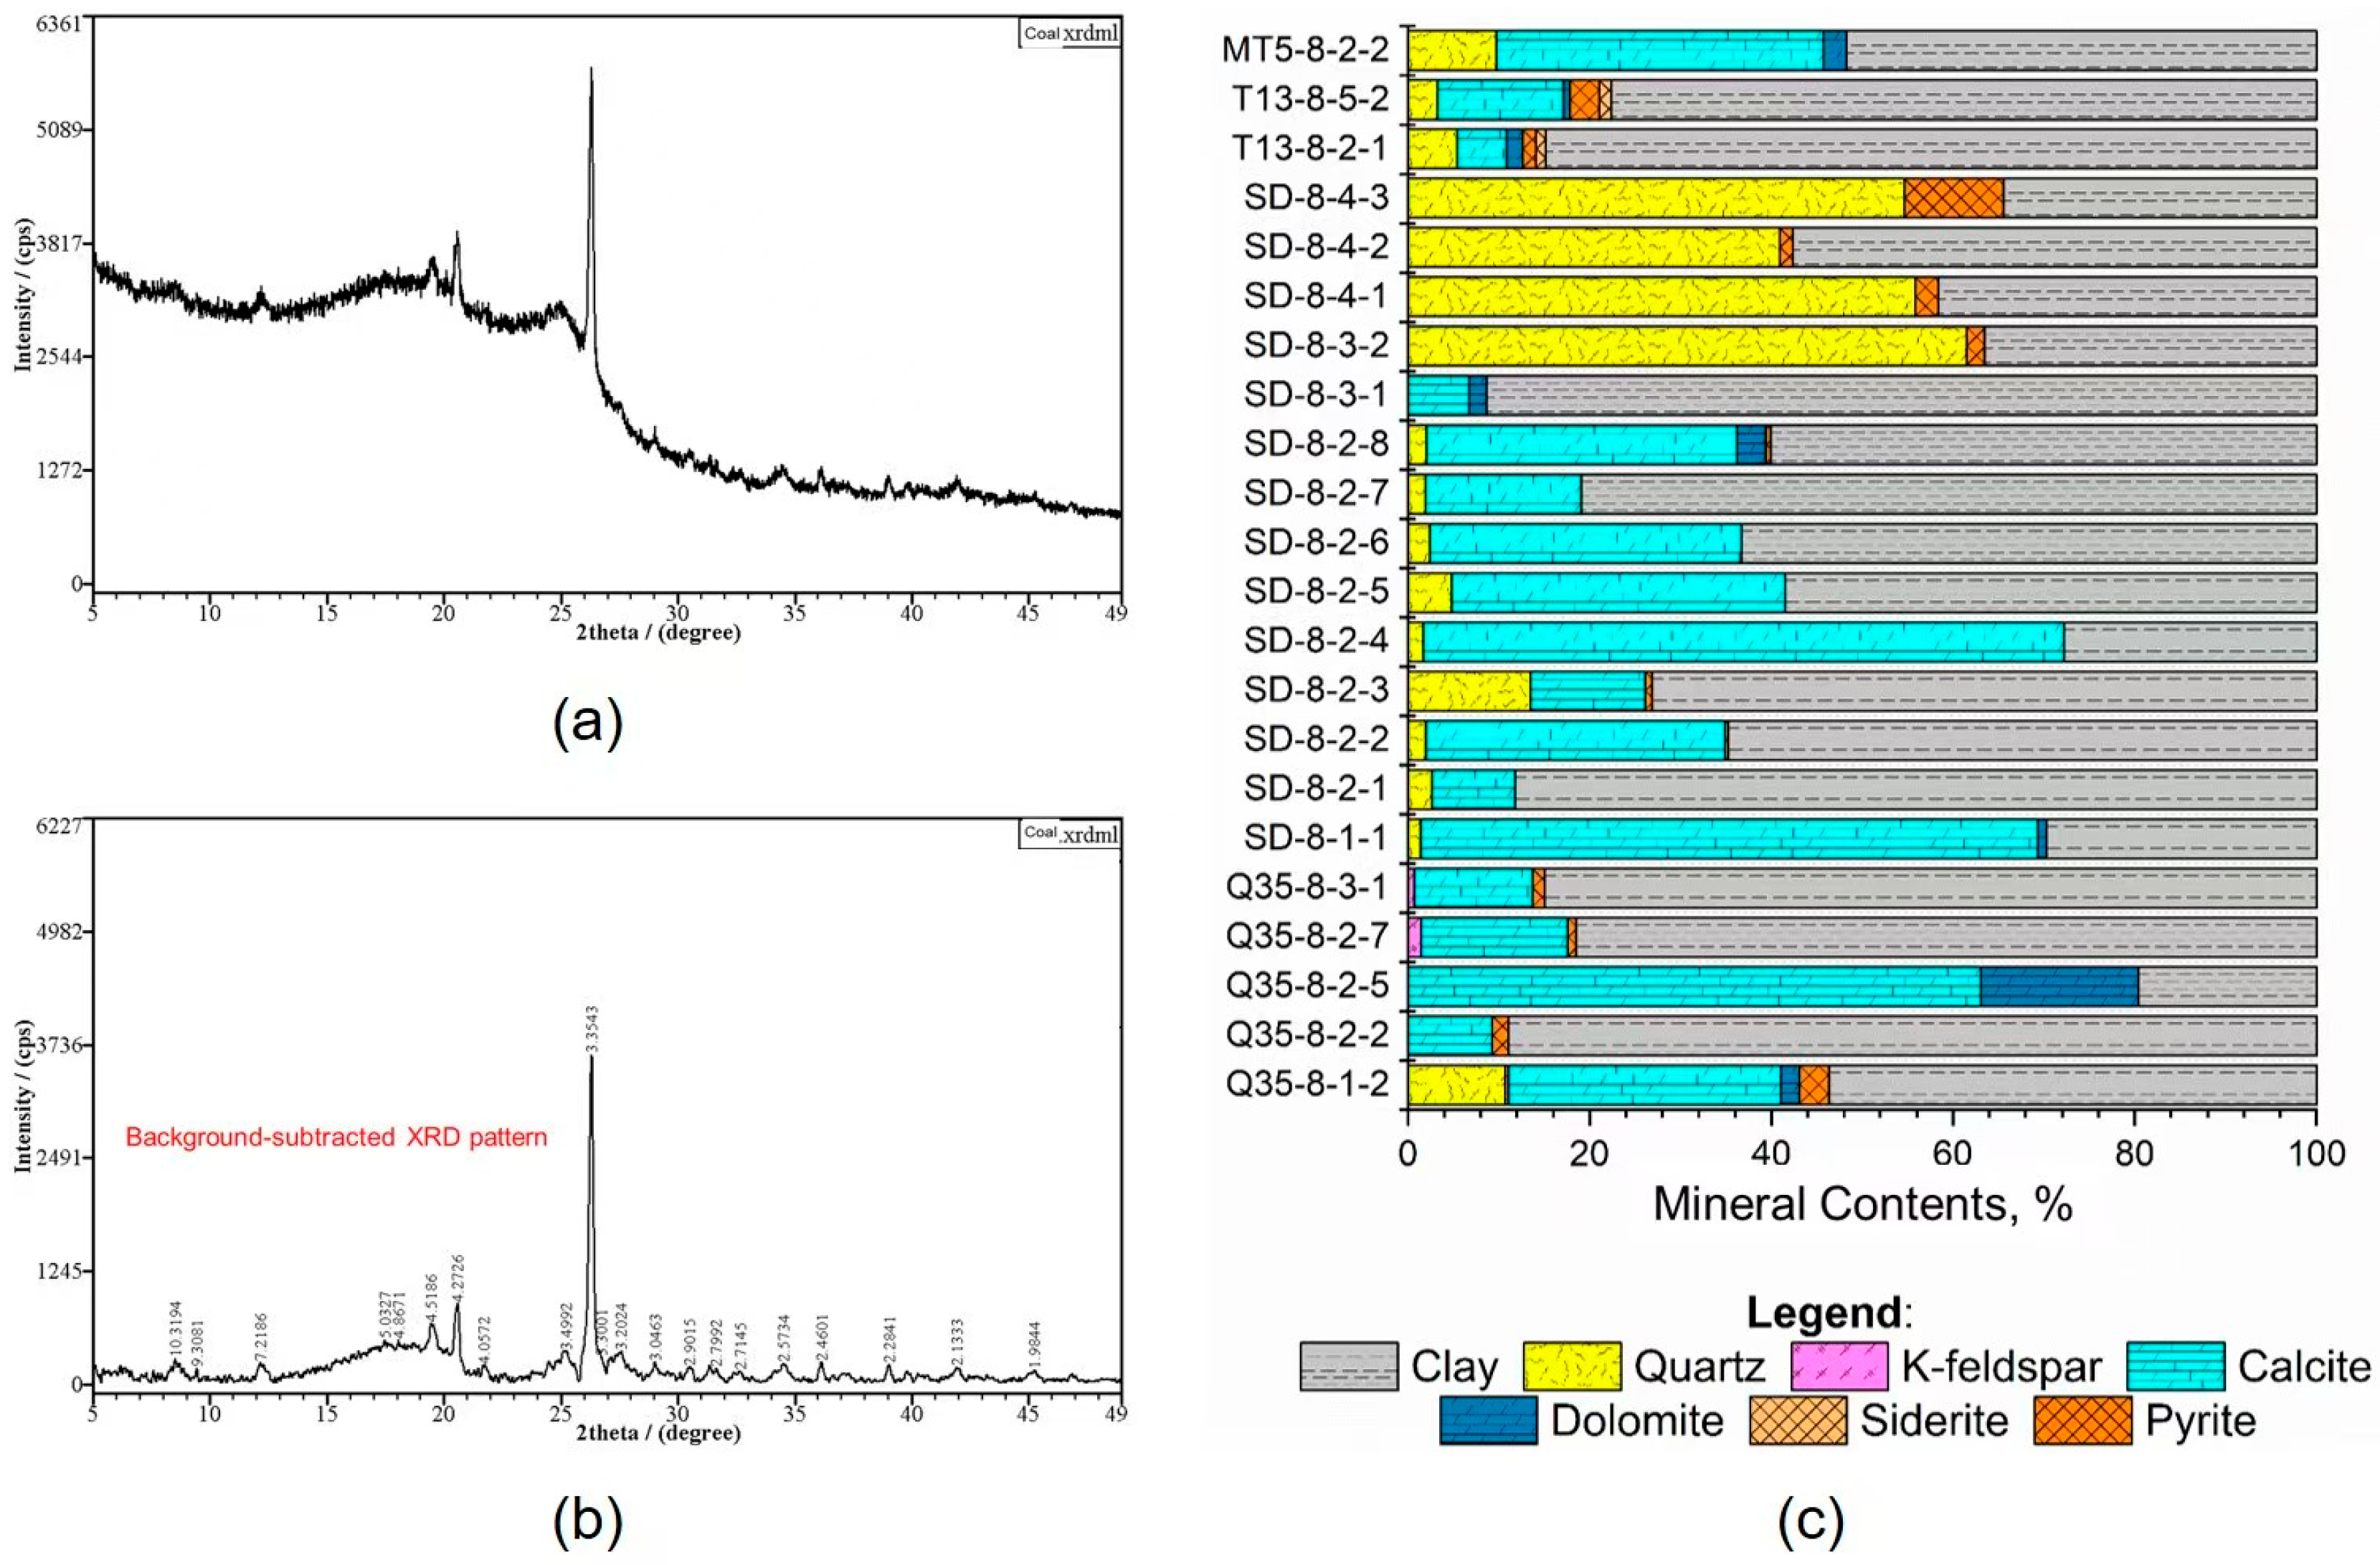
Whole-rock XRD is a widely used method for quantifying the relative abundance of inorganic minerals in reservoir rocks. Unlike conventional sandstones and carbonates, coal rocks contain abundant amorphous organic matter, which commonly causes pronounced baseline elevation and background-noise interference during XRD analysis (Figure 3a). These effects directly compromise mineral identification and quantitative accuracy. To minimize such interference, systematic background subtraction and baseline correction were applied to the original diffraction patterns, yielding effective corrected diffraction curves (Figure 3b). The corrected quantitative results indicate that the inorganic mineral assemblage of the No. 8 coal seam in the study area is compositionally complex (Figure 3c), consisting mainly of clay minerals, with an average content of 16.1%, carbonate minerals, with an average content of 31.4%, and felsic and minor heavy minerals. The clay-mineral fraction is dominated by illite and kaolinite. Carbonate minerals are dominated by calcite, with an average content of 28.7%, accompanied by minor dolomite. The felsic-mineral fraction mainly comprises quartz, with an average content of 14.1%, and minor K-feldspar. Trace heavy minerals, including pyrite and siderite, are also present.
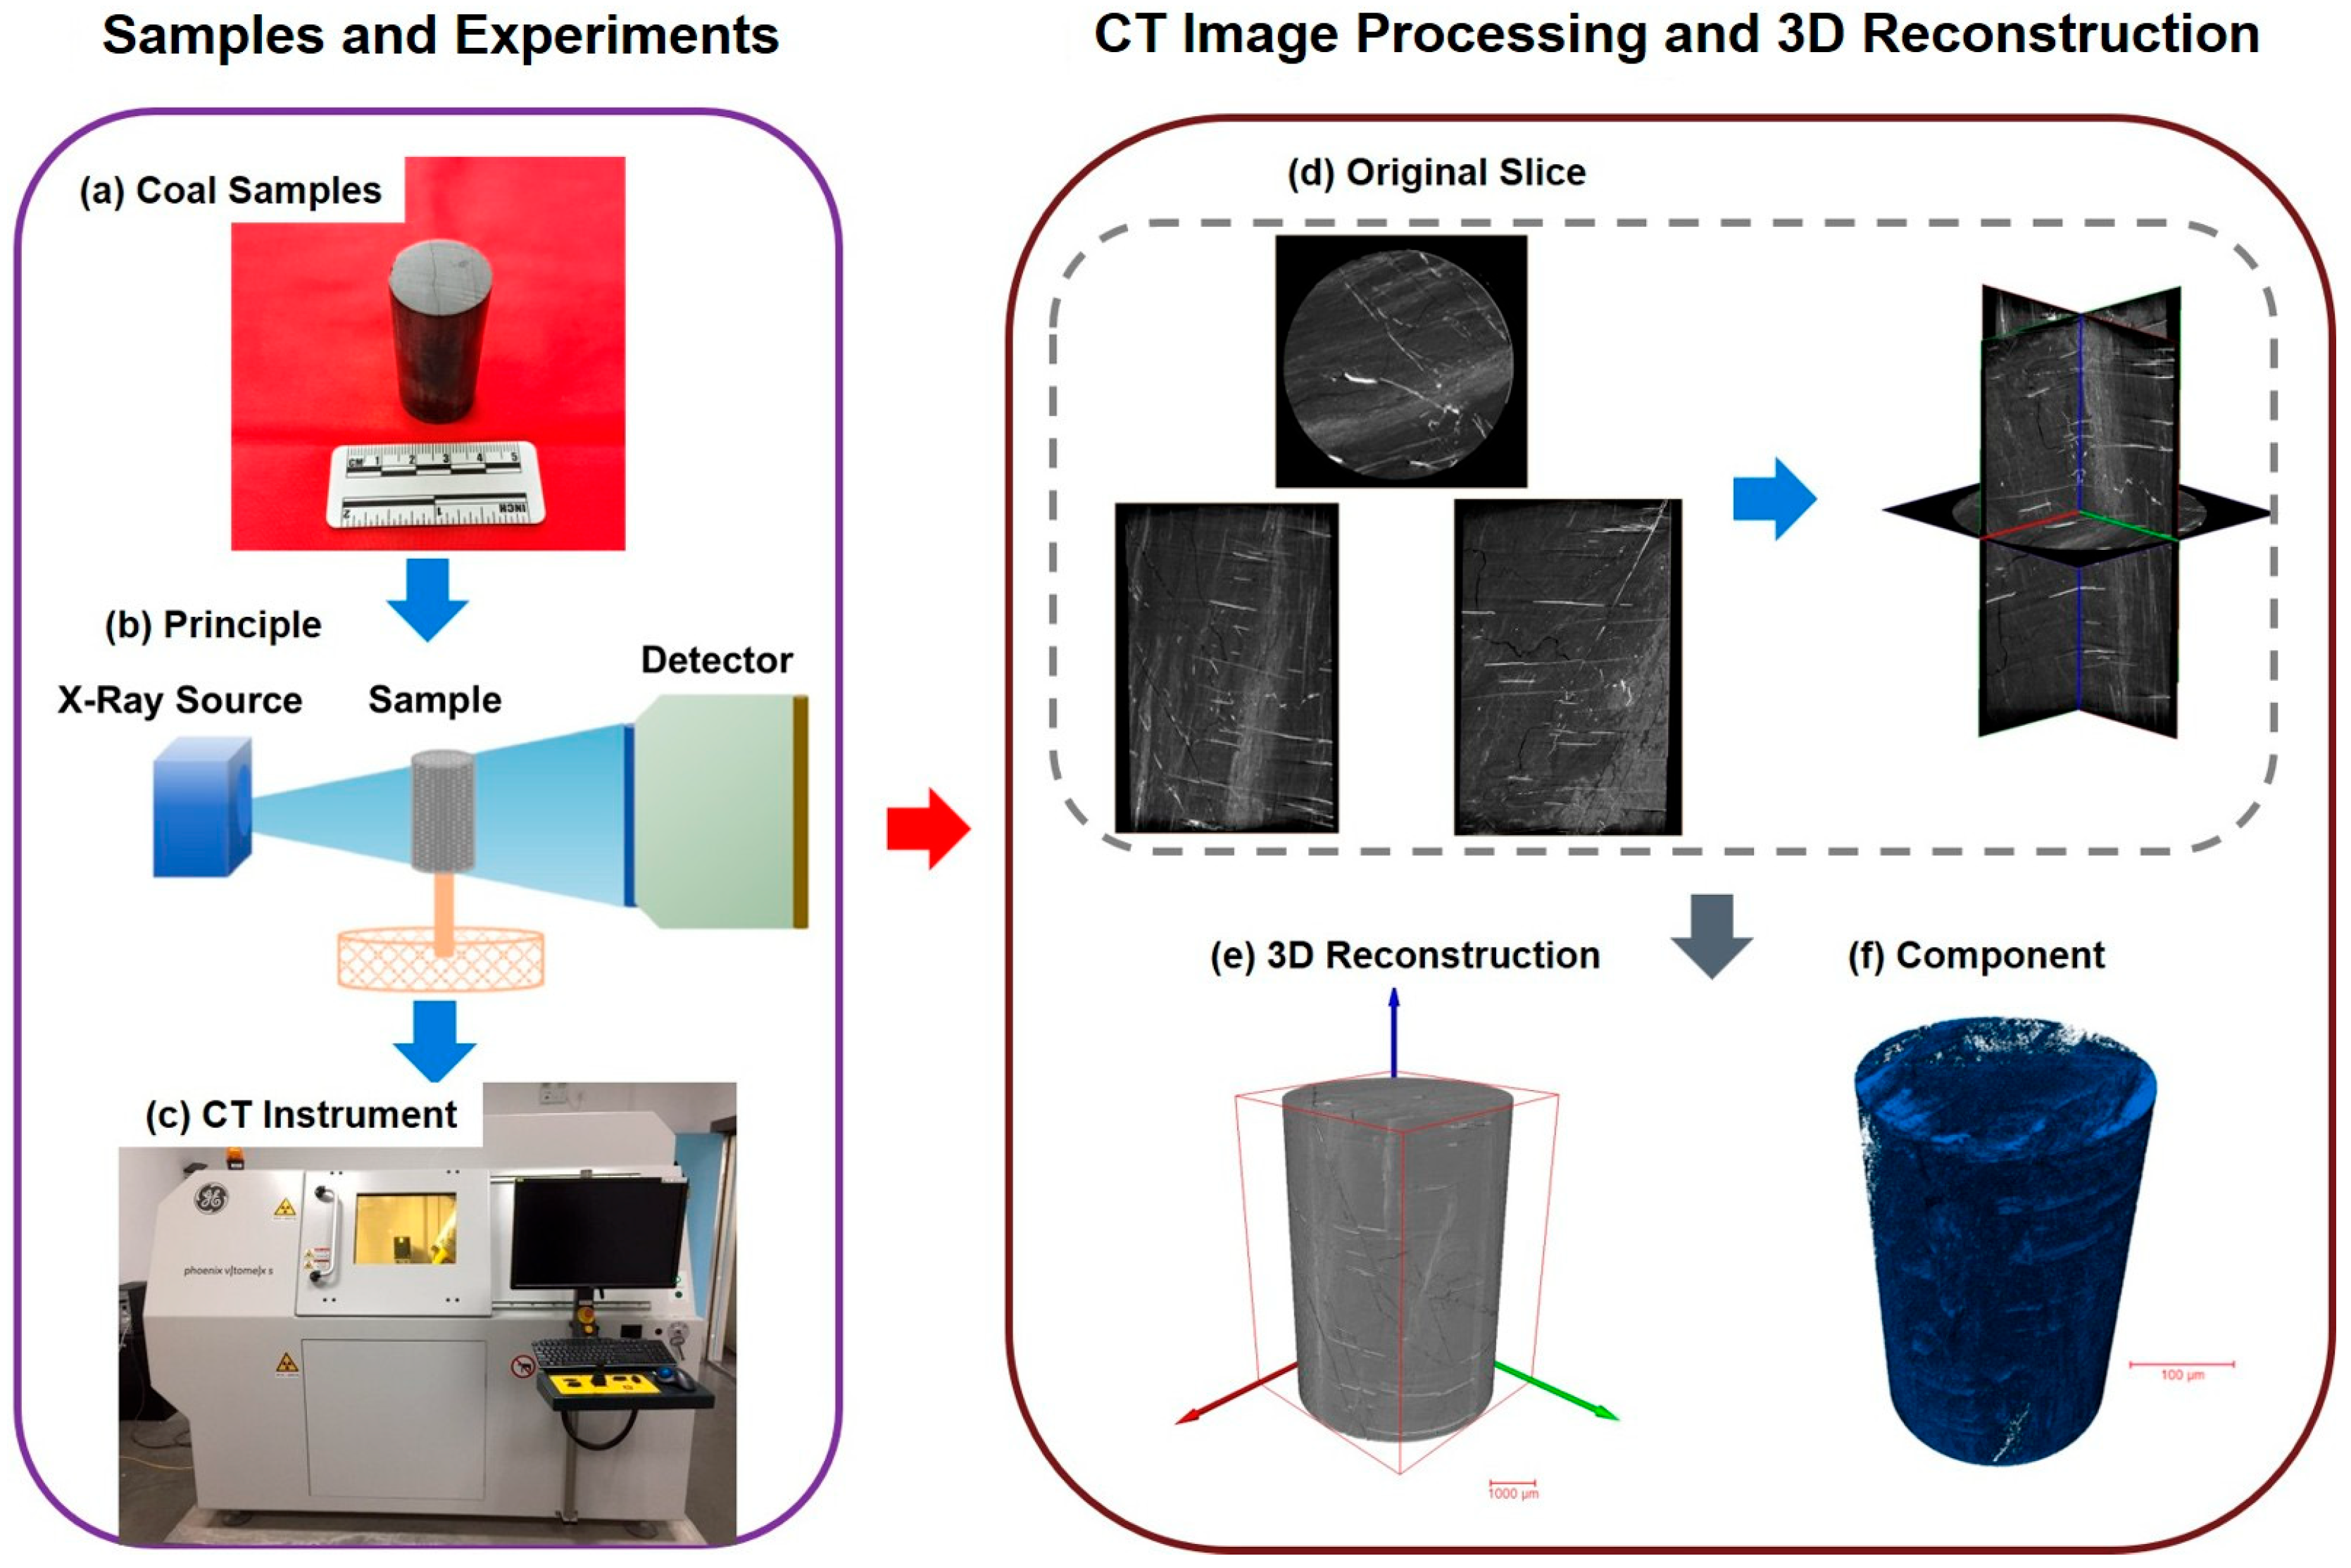
To further characterize the actual composition of the coal rocks, and considering that coal-rock pores span the micrometre-to-nanometre scale and that mineral assemblages have complex compositions, representative samples were analyzed using digital rock techniques based on micro-CT (Figure 4). This approach was used to identify micrometre-scale pore structures and reconstruct the spatial distribution of mineral components within the coal rocks. The scanning voxel resolution was approximately 20 μm. Projection signals were acquired through X-ray attenuation during continuous sample rotation, and a total of 2024 two-dimensional grayscale slices were obtained for each sample. These slices were then stacked to construct a three-dimensional digital core volume. To ensure the accuracy of subsequent pore identification and component segmentation, the raw images were first preprocessed and denoised using median filtering. Because micro-CT datasets are large and require substantial computational and storage resources, the processing workflow must be optimized while preserving petrophysical representativeness. It is therefore necessary to determine an appropriate representative elementary volume (REV). In this study, the REV was selected based on the convergence behaviour of porosity with increasing image scale, and the image size at which the porosity became stable was taken as the REV. Given that the samples were cylindrical plugs, direct extraction of cubic subvolumes would result in loss of valid longitudinal information. Accordingly, peripheral invalid regions were first removed, and the maximum inscribed cuboid was extracted as the region of interest (ROI) for component segmentation. This strategy satisfies the REV criterion while preserving the original structure to the greatest possible extent, thereby allowing a realistic representation of coal-rock heterogeneity and mineral spatial distribution [36].
In CT grayscale images, different components exhibit distinguishable grayscale signatures as a result of density contrasts. Pores, with the lowest density, appear as dark black regions; the coal matrix, of intermediate density, presents a dark grey tone; and inorganic minerals, characterized by higher density, range from light grey to bright white. Leveraging these grayscale distinctions, an interactive threshold segmentation method was adopted to achieve precise phase discrimination. Following pore and fracture extraction, the porosity derived from three-dimensional CT reconstruction is 3.3%, marginally lower than the helium-measured porosity of 4.08%. This ~0.78% discrepancy is primarily attributed to the widespread nanopores within the coal rock. Limited by the 20 μm scanning resolution, these nanopores cannot be resolved individually and are instead homogenized into the grayscale range of the coal matrix. Accordingly, micro-CT predominantly captures fractures and pore networks at the micrometre scale and above, while sub-resolution nanopores are incorporated into the coal matrix grayscale interval. This distinction also explains why the subsequent logging-derived porosity, which reflects total porosity, must be differentiated from CT-derived porosity, which only characterizes pores larger than the micrometre scale.
Using the XRD quantitative results as independent constraints, the segmentation thresholds were iteratively adjusted according to grayscale characteristics, so that the relative abundances of inorganic minerals obtained from CT segmentation became statistically consistent with the XRD measurements. Given that whole-rock XRD analysis provides relative mass fractions of individual minerals within the total inorganic fraction rather than their absolute volumetric fractions in the bulk coal-rock system, the segmentation calibration was performed by matching the relative proportion of each inorganic mineral to the sum of all inorganic minerals with corresponding XRD results. Using the XRD quantitative results as independent constraints, the segmentation thresholds were iteratively adjusted according to grayscale characteristics until the relative mineral proportions from CT segmentation converged to the XRD-derived values. Quantitative validation shows that the average relative error of relative individual mineral proportions between CT segmentation and XRD measurement is less than 8%. This accuracy level fully satisfies the input requirements of the three-component volumetric model. This iterative calibration procedure effectively improves the reliability of mineral identification in digital core segmentation. All samples were scanned using the same micro-CT instrument under fully consistent scanning parameters (tube voltage, tube current, and voxel resolution). Uniform system calibration was performed before batch scanning, and no sample-specific threshold adjustment or individual grayscale normalization was applied. Therefore, the grayscale ranges listed in Table 1 are standardized across all samples in this study, ensuring the comparability of segmentation results. Grayscale statistics indicate partial overlap among the grayscale intervals of different components. Pores exhibit the lowest grayscale values, ranging from 0 to 30, followed by the coal matrix, with grayscale values of 31–55. The grayscale interval of clay minerals, 50–129, partially overlaps with that of the dense coal matrix. Calcite, with grayscale values of 146–243, overlaps with pyrite in the high-grayscale range of 219–255, although pyrite generally exhibits higher brightness and is therefore more readily distinguishable. Feldspar, with grayscale values of 154–190, and quartz, with grayscale values of 154–200, show substantial grayscale overlap and cannot be reliably separated using grayscale information alone. For minerals with mixed grayscale responses, the thresholds were iteratively optimized by integrating their occurrence characteristics, enabling the reconstructed mineral contents to match the XRD quantitative results and thereby improving the segmentation accuracy of the digital core. Representative images, segmentation results, final threshold ranges, and reconstructed spatial distributions of the digital core components are summarized in Table 1.
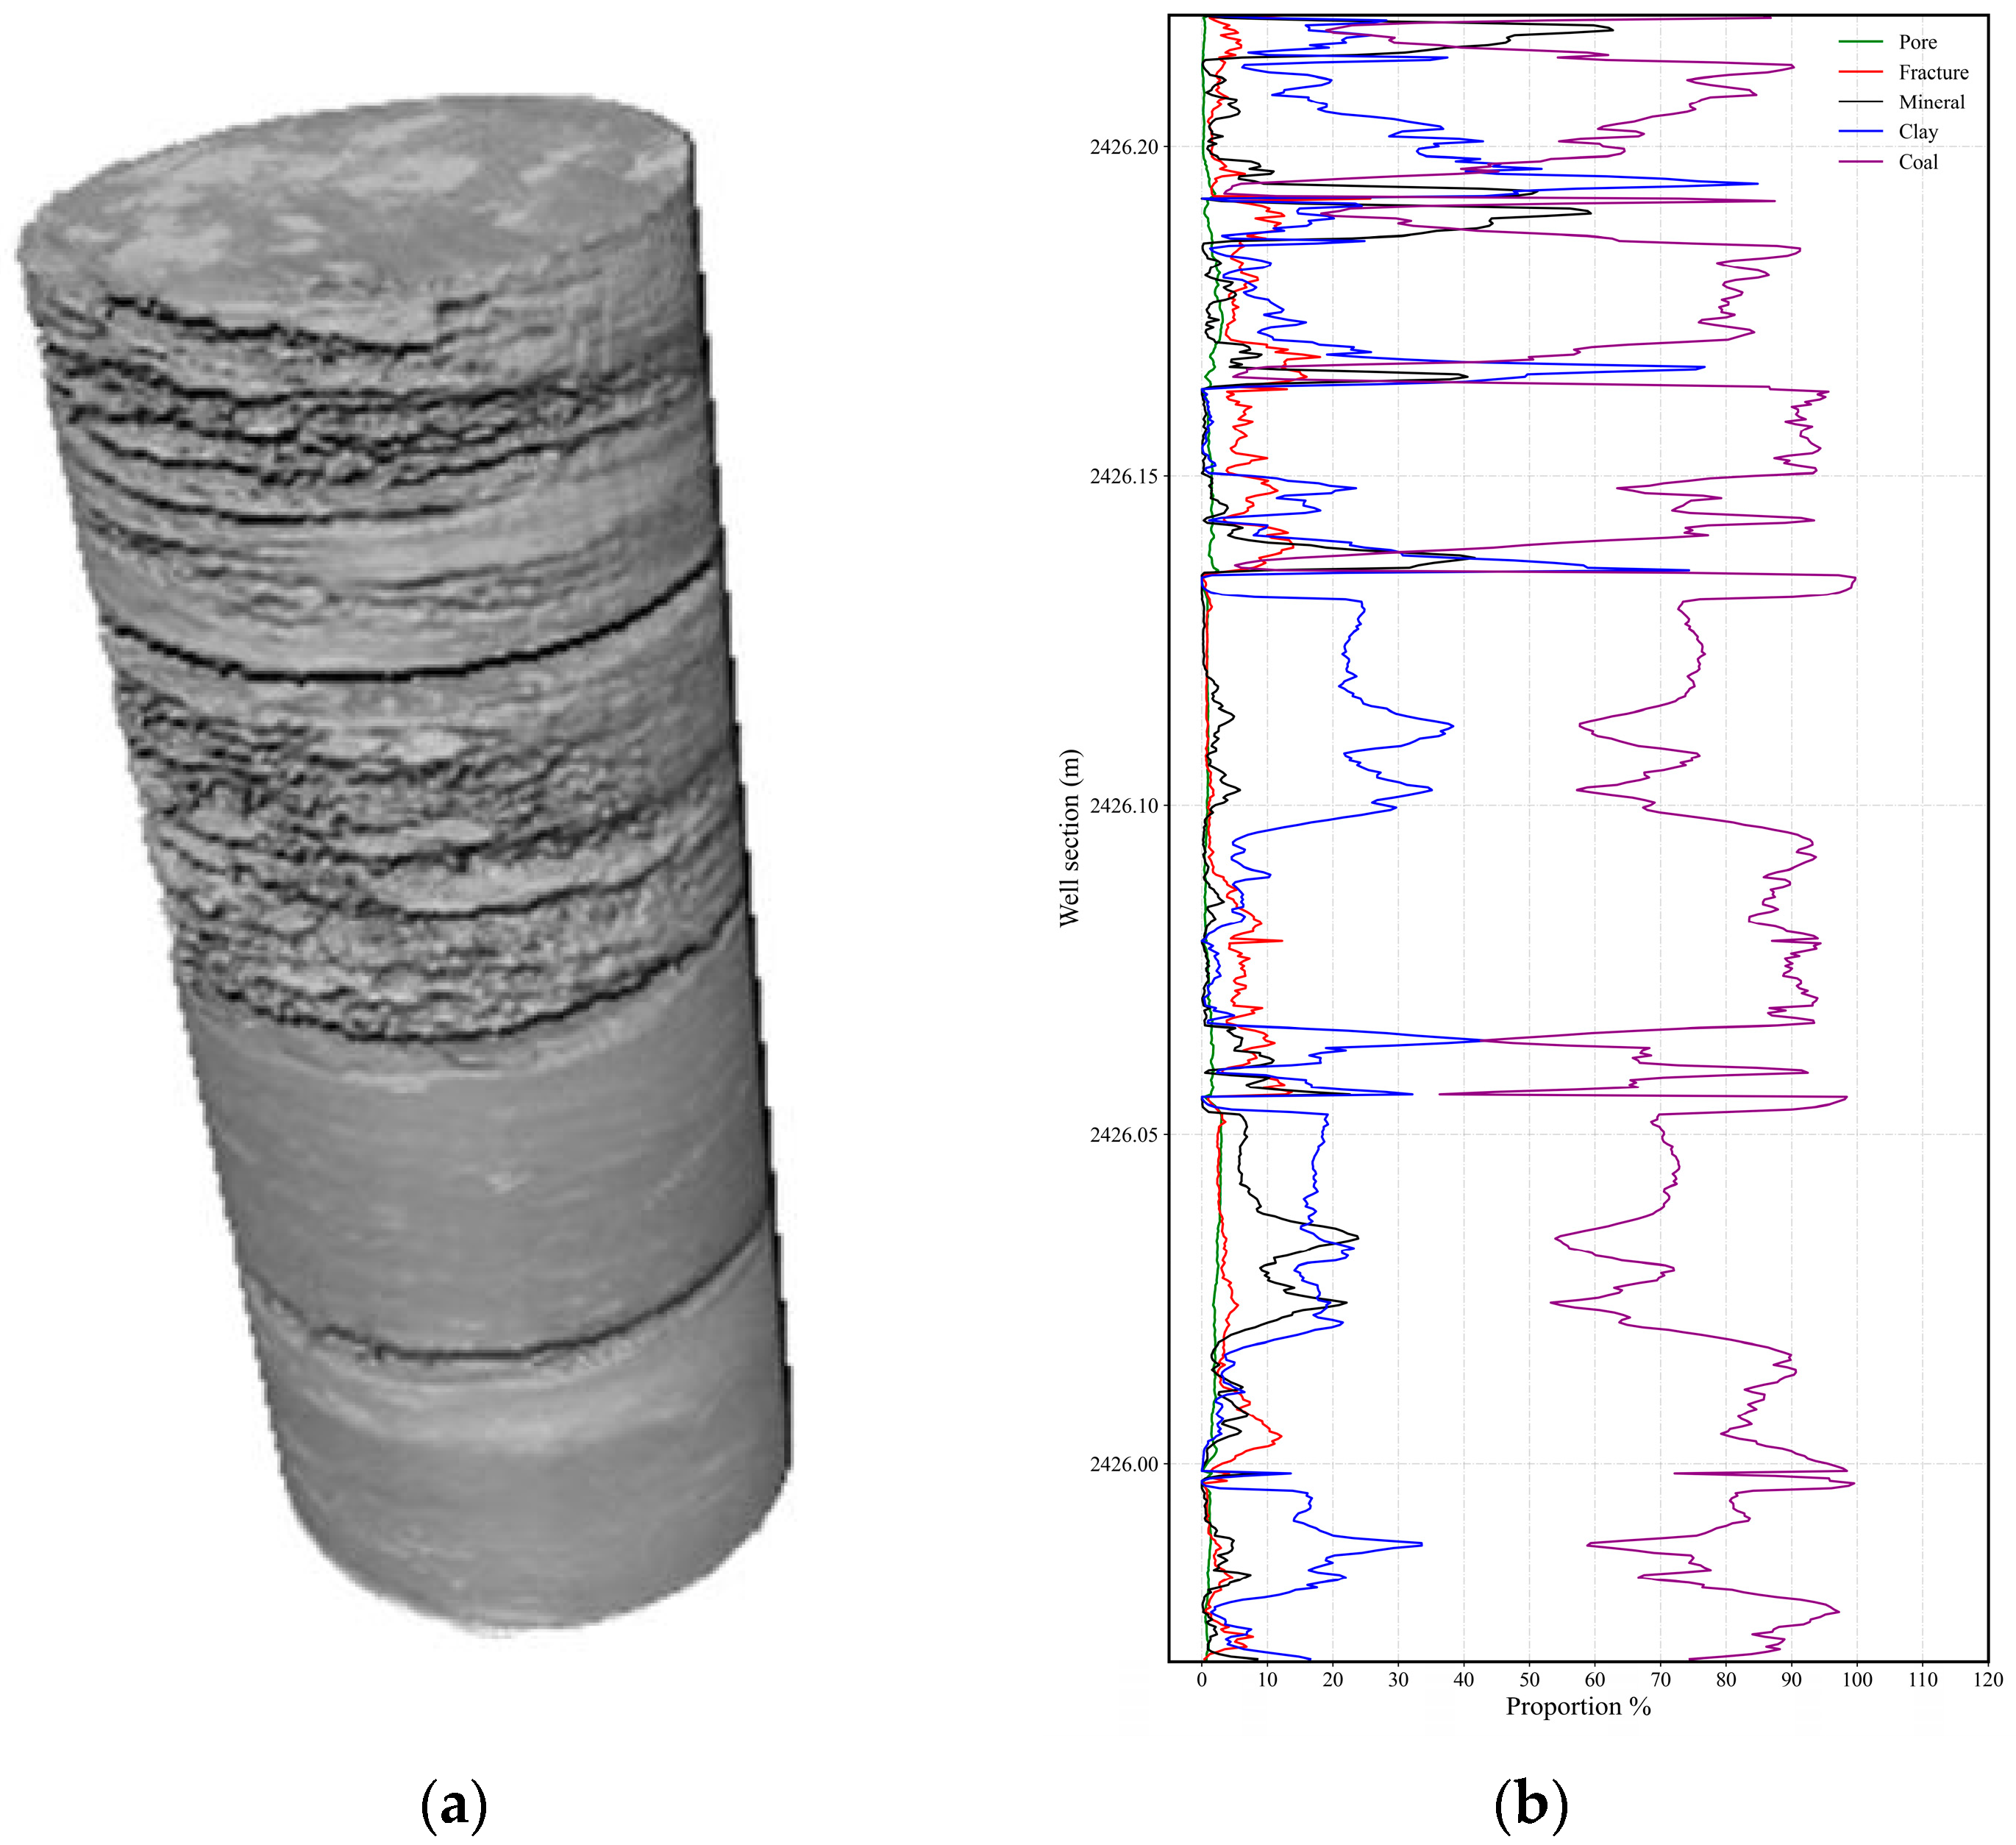
Building on the understanding obtained from the reconstructed three-dimensional digital cores of plug samples, micro-CT scanning was further conducted on full-diameter samples (Figure 5a). The volumetric fractions of pores and fractures, the coal matrix, clay minerals, and other inorganic minerals were subsequently segmented and quantified (Figure 5b), providing fundamental validation data for the subsequent analysis.

3.1.3. Other Basic Experiments

In addition to mineralogical characterization, porosity, proximate composition, and TOC content were measured for the coal-rock samples. The coal-seam porosity ranges from 3.0% to 9.0%, with a median value of 6.3% and an average of 6.2%. In the proximate analysis, fixed carbon content ranges from 59.7% to 90.6%, with an average of 75.4%, whereas ash yield ranges from 2.2% to 28.2%, with an average of 13.0%. These results indicate that No. 8 coal is characterized by medium–high fixed carbon content and low ash yield. Notably, the total inorganic mineral content from whole-rock XRD analysis is numerically higher than the proximate ash yield. This discrepancy stems from fundamental differences in analytical basis and test mechanism. Whole-rock XRD quantifies all inorganic mineral phases in the bulk coal-rock sample on a mass basis, including clay, carbonate, and silicate minerals distributed in both the coal matrix and fracture fillings. By contrast, proximate ash yield represents the mass fraction of combustion residues from air-dried coal samples; during high-temperature combustion, carbonate minerals decompose and sulfide minerals oxidize, leading to measurable mass loss relative to the original mineral content. The two indicators therefore have distinct statistical bases and are not directly comparable in numerical value. The measured TOC content ranges from 41.1% to 85.7%, with an average of 71.7%.

3.2. Well-Log Volumetric Model and Calculation Method for CRG Reservoirs

The multi-scale experiments described above confirm that the coal rocks in the study area constitute a three-phase system composed of organic matter, inorganic minerals, and pore fluids. The occurrence patterns, grayscale characteristics, and basic petrophysical parameters of each component were also clarified. On this basis, this section presents the construction of the well-log volumetric model, calibration of framework parameters, and development of the porosity calculation method.
Compared with clastic hydrocarbon reservoirs, for which well-log evaluation systems are relatively mature, CRG reservoirs still lack a dedicated well-log volumetric model. Integrating the experimental results, this study establishes a three-component model comprising inorganic minerals, the coal matrix, and pore fluids, calibrates the framework parameters of the coal matrix, and derives a porosity evaluation method applicable to CRG reservoirs.

3.2.1. Three-Component Volumetric Model for CRG Reservoirs

To ensure the rationality and applicability of the model, three assumptions are proposed based on the geological characteristics of CRG reservoirs and experimental conditions. First, the CRG reservoir is treated as a homogeneous and isotropic porous medium. The total reservoir volume consists of three non-overlapping and exhaustive components: inorganic minerals, the coal matrix, and pores. This component division is consistent with the three-phase coal-rock structure revealed by thin-section observations and micro-CT analysis. Second, the pore space is assumed to contain only natural gas and bound water. The influence of movable water on reservoir volume is neglected, and the pore volume is assumed not to undergo significant deformation with pressure or temperature variations. Third, both inorganic minerals and the coal matrix are regarded as dense solids. Their mixture constitutes the solid framework of the reservoir, and its physical properties, including density and acoustic velocity, are assumed to follow mixing laws. This linear volumetric mixing assumption is widely accepted in petrophysical logging evaluation, consistent with the theoretical basis of the Wyllie time-average equation and conventional multi-mineral volumetric models [37,38]. The fundamental physical properties of each mineral and the coal matrix are constrained by XRD analysis, core experiments, and framework-parameter calibration.
Compared with the conventional binary “solid framework–pore fluid” volumetric model universally adopted in clastic and carbonate reservoirs, the proposed model treats the coal matrix as an independent organic framework component, which is more compatible with the organic–inorganic composite characteristics of CRG reservoirs. This model is applicable to primary structure coal reservoirs with undeveloped fractures. For strongly tectonically deformed coal or highly fractured intervals, additional fracture correction terms should be introduced on the basis of this model.
Based on these assumptions, the three components of a CRG reservoir comprise the coal matrix, inorganic minerals, and pore fluids. To facilitate coupling with well-log data, the model is expressed in terms of volume fractions:
V T o t a l = V M i n e r a l + V C o a l + ϕ P o r e = 1 .
In Equation (1), V T o t a l is the total volume of the CRG reservoir and is dimensionless; V M i n e r a l is the volume fraction of inorganic minerals and is dimensionless; V C o a l is the volume fraction of the coal-matrix component and is dimensionless; and ϕ P o r e is the pore-volume fraction, that is, porosity, and is dimensionless.

3.2.2. Calibration of Coal-Matrix Logging Framework Parameters and Porosity Calculation

Building on micro-CT component segmentation results and XRD quantitative mineralogical data, the actual volume fractions of the coal matrix and individual inorganic minerals were derived. It should be noted that XRD measurements provide mass fractions of inorganic minerals on a whole-rock basis. To align with the volumetric model framework, all mineral mass fractions were converted to volume fractions using published standard framework densities for typical sedimentary minerals. The coal matrix volume fraction is directly derived from micro-CT segmentation, which is inherently a volume-based quantification. These volume-normalized component fractions were subsequently applied to the inversion and calibration of coal-matrix framework logging response parameters.
The proposed coal-rock volumetric model addresses a key limitation of elemental logging and XRD analysis—their capacity to characterize only inorganic mineral fractions—by integrating the coal matrix as an independent framework component into the petrophysical modelling system. This approach enables quantitative, component-wise characterization of reservoir components. The logging response of the coal matrix framework exerts a primary control on the accuracy of log-derived property calculations. However, most prior studies have generally adopted empirical values from CBM evaluations, without accounting for the compositional characteristics of coal rocks in the study area.
In conventional volumetric models (e.g., those applied to carbonate reservoirs), elemental logging data are routinely used to quantify relative mineral contents. The conversion between elemental dry weight and mineral content is formulated in Equation (2), following Herron et al. [39], where [T] denotes the elemental dry-weight matrix, [V] the mineral dry-weight matrix, and [R] the conversion coefficient matrix:
T = V × R .
When the dry weights of m elements are resolved and used to invert the contents of n minerals, an m × n linear system can be constructed for the solution. Accordingly, a set of conversion equations can be established based on this relationship, as expressed in Equation (3):
T 1 = i = 1 n V i × R 1 i T 2 = i = 1 n V i × R 2 i T m = i = 1 n V i × R m i ,
where Tj is the dry weight of element j obtained from the conversion calculation; Vi is the content of the corresponding mineral I; Rji is the conversion coefficient relating element j to mineral I; and n is the total number of selected mineral types.
This approach has become a relatively mature technique for multi-mineral inversion. However, it should be noted that the method cannot be directly applied to coal-rock reservoirs because it does not account for the organic matrix, namely, the coal matrix. The mineral contents obtained from XRD and elemental dry-weight calculations represent the relative proportions of individual minerals within the total inorganic mineral fraction. Based on the assumptions of the volumetric model, the equations for the three conventional porosity logs are modified by incorporating the coal-matrix component, as expressed in Equation (4):
ρ b = V M i n e r a l × i = 1 n V i × ρ i + V C o a l × ρ C o a l + ϕ × ρ f Δ t p = V M i n e r a l × i = 1 n V i × Δ t p i + V C o a l × Δ t p C o a l + ϕ × Δ t p f Φ C N L = V M i n e r a l × i = 1 n V i × Φ C N L i + V C o a l × Φ C N L C o a l + ϕ × Φ C N L f V M i n e r a l + V C o a l + ϕ = 1 .
In Equation (4), the inverted components include the selected mineral types and the coal matrix; therefore, the total number of components is n + 1. ρ b denotes the compensated density response, ρ i is the density of each component, and ρ C o a l is the density framework response of the coal matrix. Δ t p denotes the acoustic slowness response, Δ t p i is the acoustic slowness of each component, and Δ t p C o a l is the acoustic-slowness framework response of the coal matrix. Φ C N L denotes the compensated-neutron log response, Φ C N L i is the compensated neutron response of each component, and Φ C N L C o a l is the neutron framework response of the coal matrix.
Digital rock techniques enable calibration of the true contents of the coal matrix and inorganic minerals. By integrating these component fractions with the known porosity-log response values of individual minerals, the properties of mud filtrate, core-measured porosity, and actual logging responses, the logging framework response of the coal matrix can be calibrated. Taking the acoustic slowness curve as an example, Equation (4) can be rewritten as:
Δ t p C o a l = Δ t p ϕ × Δ t p f V M i n e r a l × i = 1 n V i × Δ t p i V C o a l .
In Equation (5), Δ t p f refers to the acoustic wave time difference response of the fluid within the pores. Equation (5) can then be used to calculate the acoustic-slowness framework response of the coal matrix. Within the three-component volumetric model for CRG reservoirs, the acoustic-slowness logging response allows the variable framework acoustic slowness, Δ t p m a , var , to be defined as:
Δ t p m a , var = i n ( V M i n e r a l × Δ t p i ) + V C o a l × Δ t p C o a l .
The porosity calculation equation can then be expressed as:
ϕ = Δ t p i n ( V M i n e r a l × Δ t p i ) + V C o a l × Δ t p C o a l Δ t p f i n ( V M i n e r a l × Δ t p i ) + V C o a l × Δ t p C o a l .
By quantifying the actual volume fractions of the coal matrix and inorganic minerals in CRG reservoirs, combined with core-measured porosity data, this approach enables reliable characterization of the coal-matrix framework logging response. The calibrated framework parameters can subsequently be applied to establish a quantitative porosity evaluation model.
In this study, a systematic suite of core laboratory experiments and digital core reconstruction analyses was performed. Cast thin-section observation, SEM, XRD, and micro-CT were first deployed to characterize the microscopic morphology, mineral assemblages, and pore attributes of coal rocks, as well as to quantify the volume fractions of the coal matrix and inorganic mineral components. Building on these experimental constraints, a three-component volumetric model consisting of the coal matrix, inorganic minerals, and pore fluids was developed for CRG reservoirs. The framework logging response parameters of the coal matrix were then calibrated, and the corresponding porosity calculation equations were derived, yielding an integrated well-logging methodology for porosity evaluation in CRG reservoirs.

4. Results and Discussion

4.1. Results

Based on the multi-source laboratory experimental data, the established three-component volumetric model, and the variable framework calculation method described above, this section first analyzes the intrinsic relationships among experimental parameters, including coal-matrix content, proximate composition, and TOC. The logging framework parameters of the coal matrix are then calibrated, followed by porosity model calculation and accuracy validation. These analyses systematically demonstrate both the experimental relationships and the application performance of the proposed model.

4.1.1. Relationships Between Coal-Matrix Content and Other Parameters

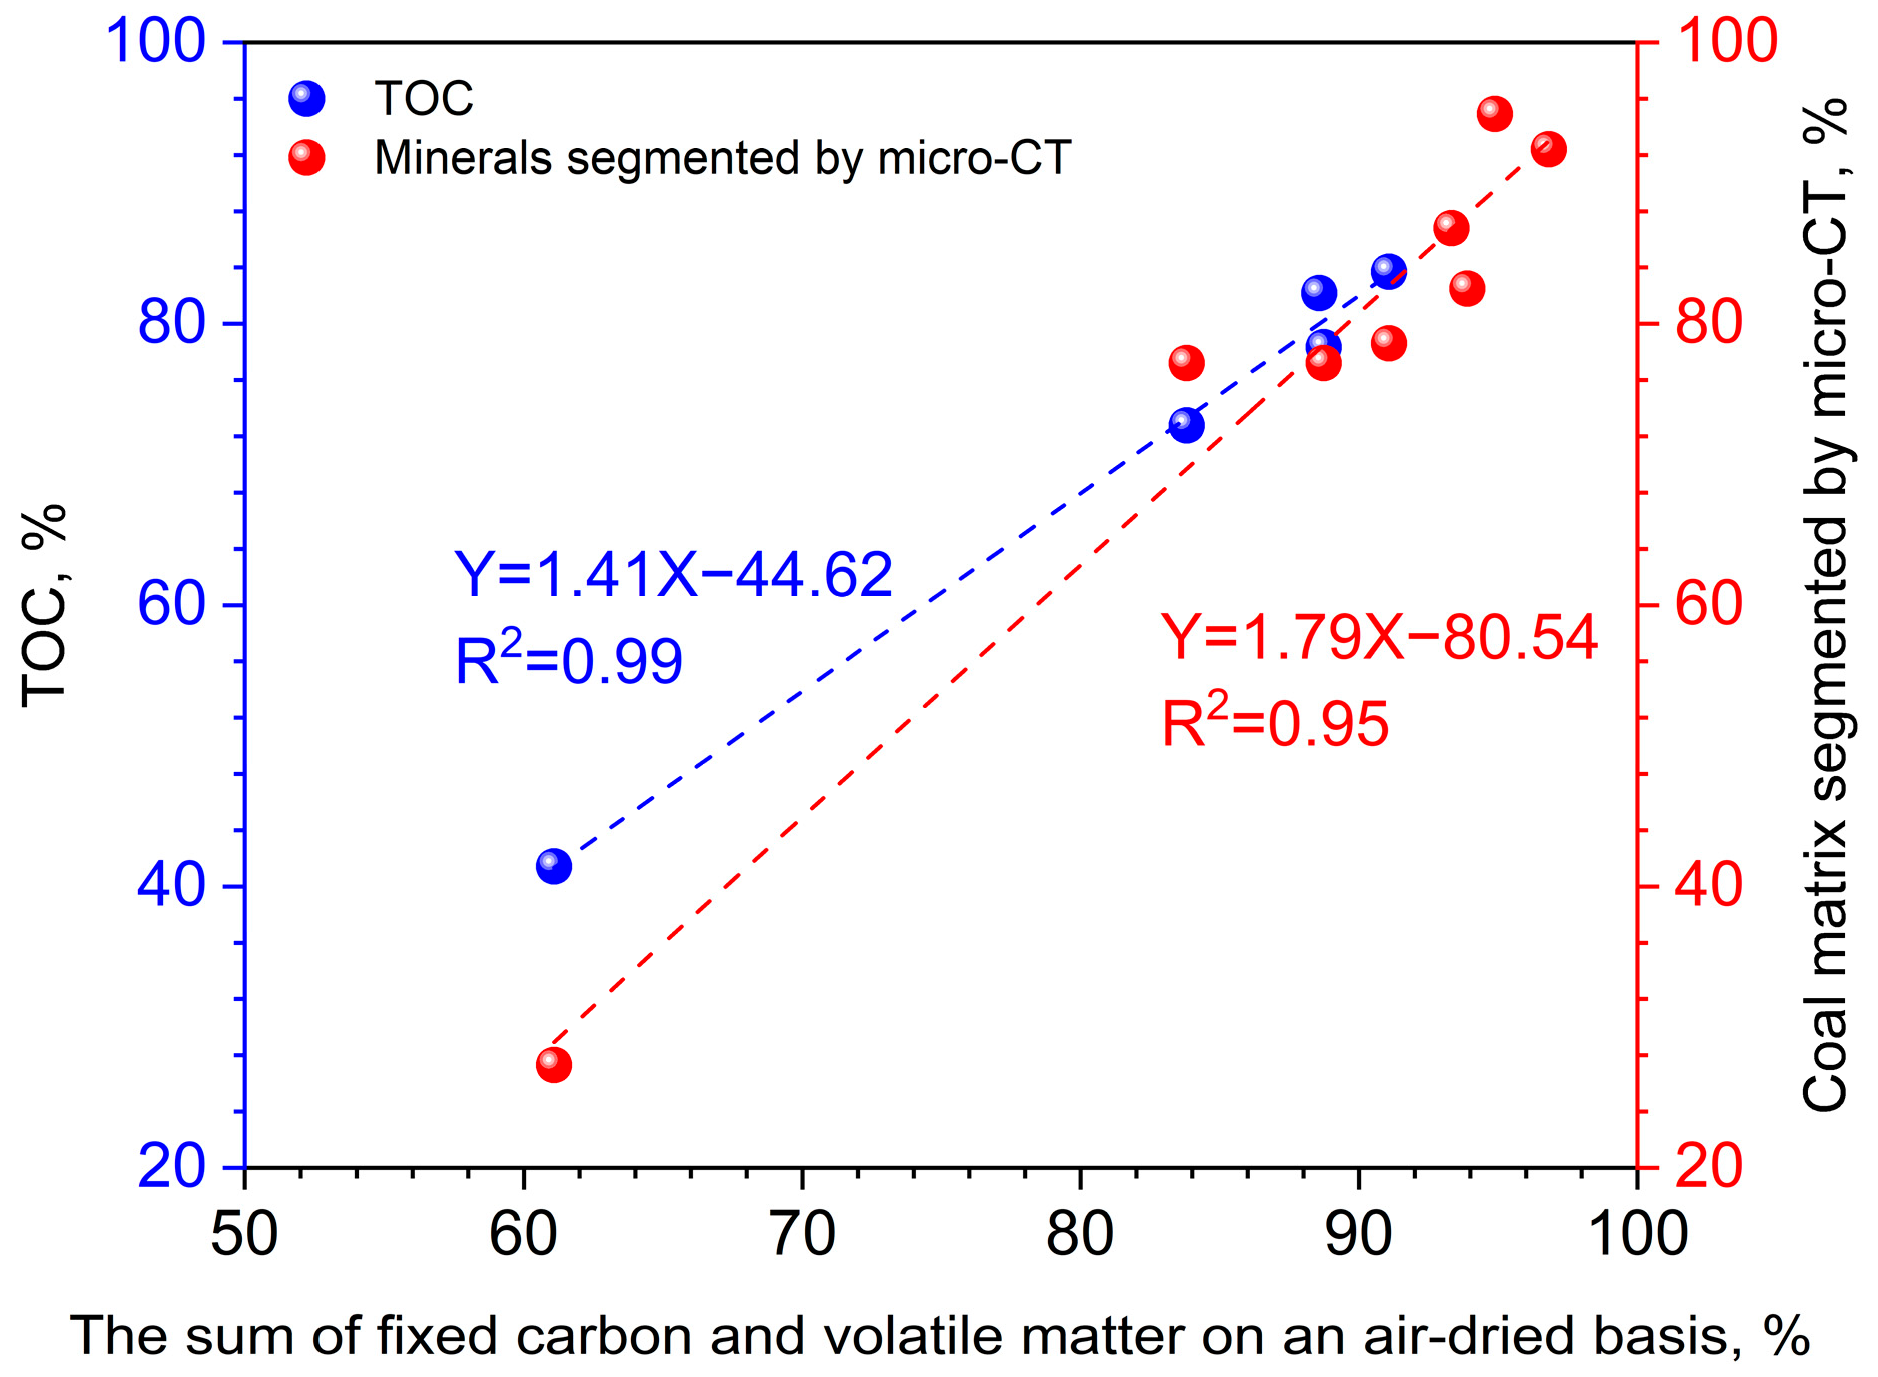
In prior studies, the sum of fixed carbon and volatile matter on an air-dried basis has been widely adopted as a proxy for the organic fraction of coal, while ash yield is taken to represent the inorganic mineral fraction. This study systematically validates this empirical convention using coal-rock core samples. Figure 6 illustrates the linear correlations between air-dried fixed carbon plus volatile matter content and two independent organic matter indicators: TOC and coal-matrix content derived from micro-CT image segmentation. The corresponding coefficients of determination (R2) reach 0.99 and 0.95, respectively. These findings align with established coal petrology principles, confirming that TOC serves as a reliable proxy for total organic matter content in coal rocks, and also validates the accuracy of micro-CT segmentation for quantifying the coal matrix, i.e., the organic framework. The above quantitative comparison further confirms that TOC and micro-CT can provide more accurate organic component characterization than proximate analysis. However, from the perspective of field engineering applications, proximate analysis still has irreplaceable practical value. Benefiting from its low testing cost, simple operational procedure, minimal sample requirement, and abundant accumulated historical data, proximate analysis remains the routine method for large-scale coal-quality evaluation in production wells. TOC testing and micro-CT scanning are more suitable for targeted scientific research and key interval calibration due to their higher cost and longer testing cycles. This practical context also determines that proximate analysis parameters will continue to serve as important bridging indicators for coal reservoir logging evaluation for a long time.
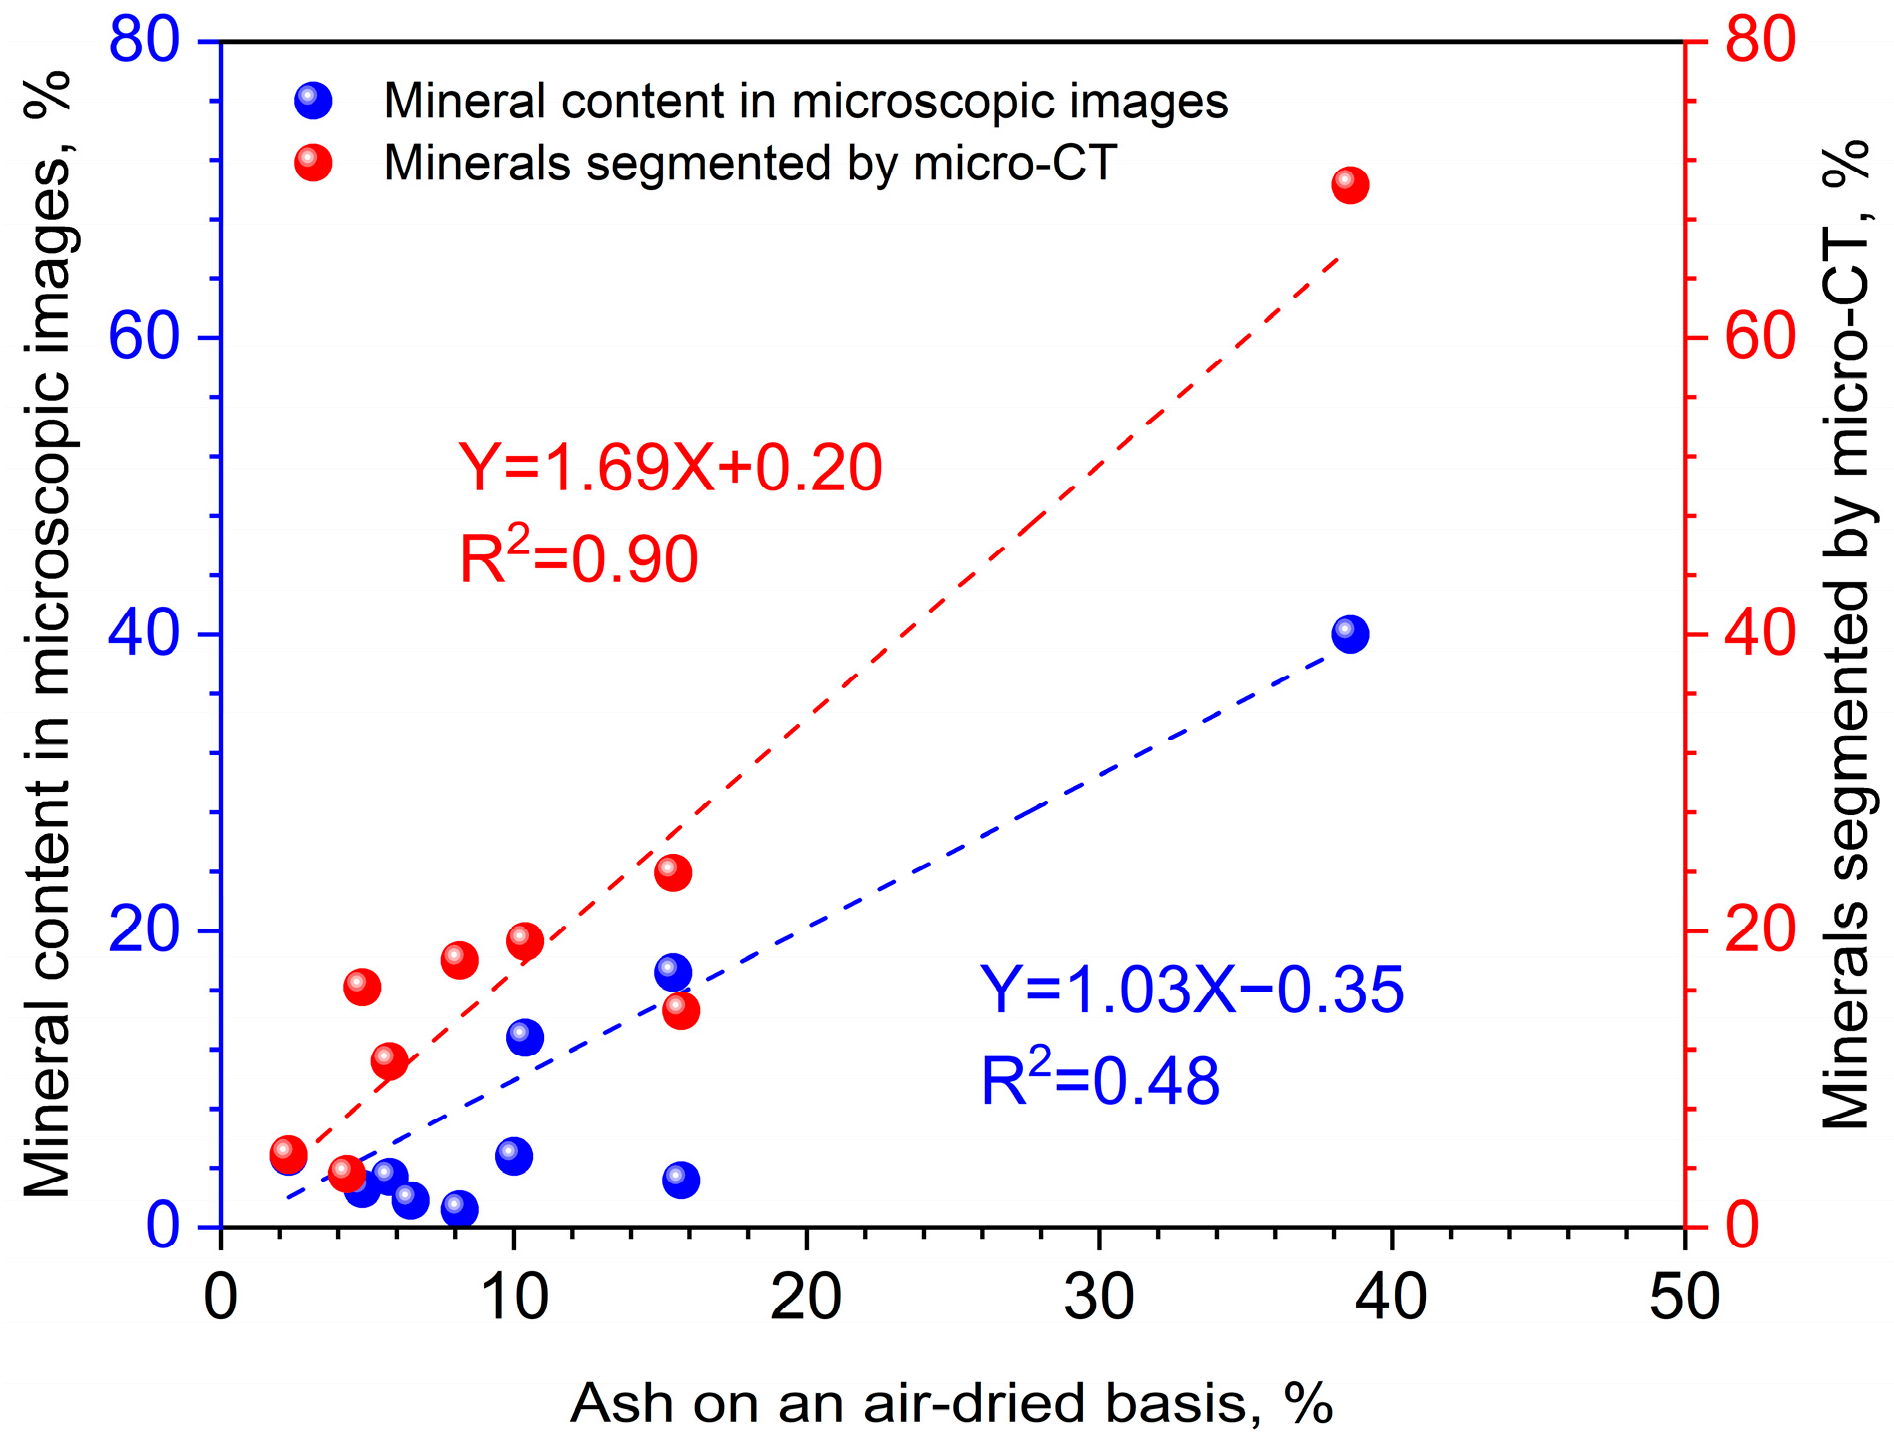
With respect to inorganic mineral quantification, Figure 7 compares the correlation between ash yield and mineral content obtained from two distinct analytical methods. The coefficient of determination between ash yield and micro-CT-segmented mineral content reaches 0.90, markedly higher than the value of 0.48 derived from microscopic image counting. This discrepancy arises because microscopic image counting is limited by its observation scale and relies exclusively on two-dimensional imagery, resulting in weaker representativeness of the bulk rock sample. These results further corroborate a strong quantitative relationship between ash yield and total inorganic mineral content.
It should also be noted that full numerical consistency among different experimental datasets cannot be achieved, as multiple experimental methods inevitably involve measurement uncertainties. In addition, the number of samples analyzed by TOC and micro-CT is limited. Therefore, proximate analysis parameters can be corrected and subsequently used to calibrate coal-matrix content.

4.1.2. Calibration Results of Coal-Matrix Porosity-Log Framework Response Parameters

Once the calculation method for coal-matrix content was established, calibration of coal-matrix framework responses was performed using 21 samples from the No. 8 coal seam in the study area, constrained by lithological experimental data and Equation (5). Given that dolomite and siderite are present only in trace amounts in the rock samples, these two mineral phases were assigned to broader mineral categories: carbonate minerals and pyrite-group minerals, respectively.
Furthermore, variations in instrument calibration across compensated-density logging systems mean that mineral-density framework responses cannot be readily standardized across disparate datasets. Accordingly, independent calculations were carried out for individual logging tools and boreholes. Table 2 summarizes the framework response parameters for acoustic slowness and compensated density of the major inorganic minerals.
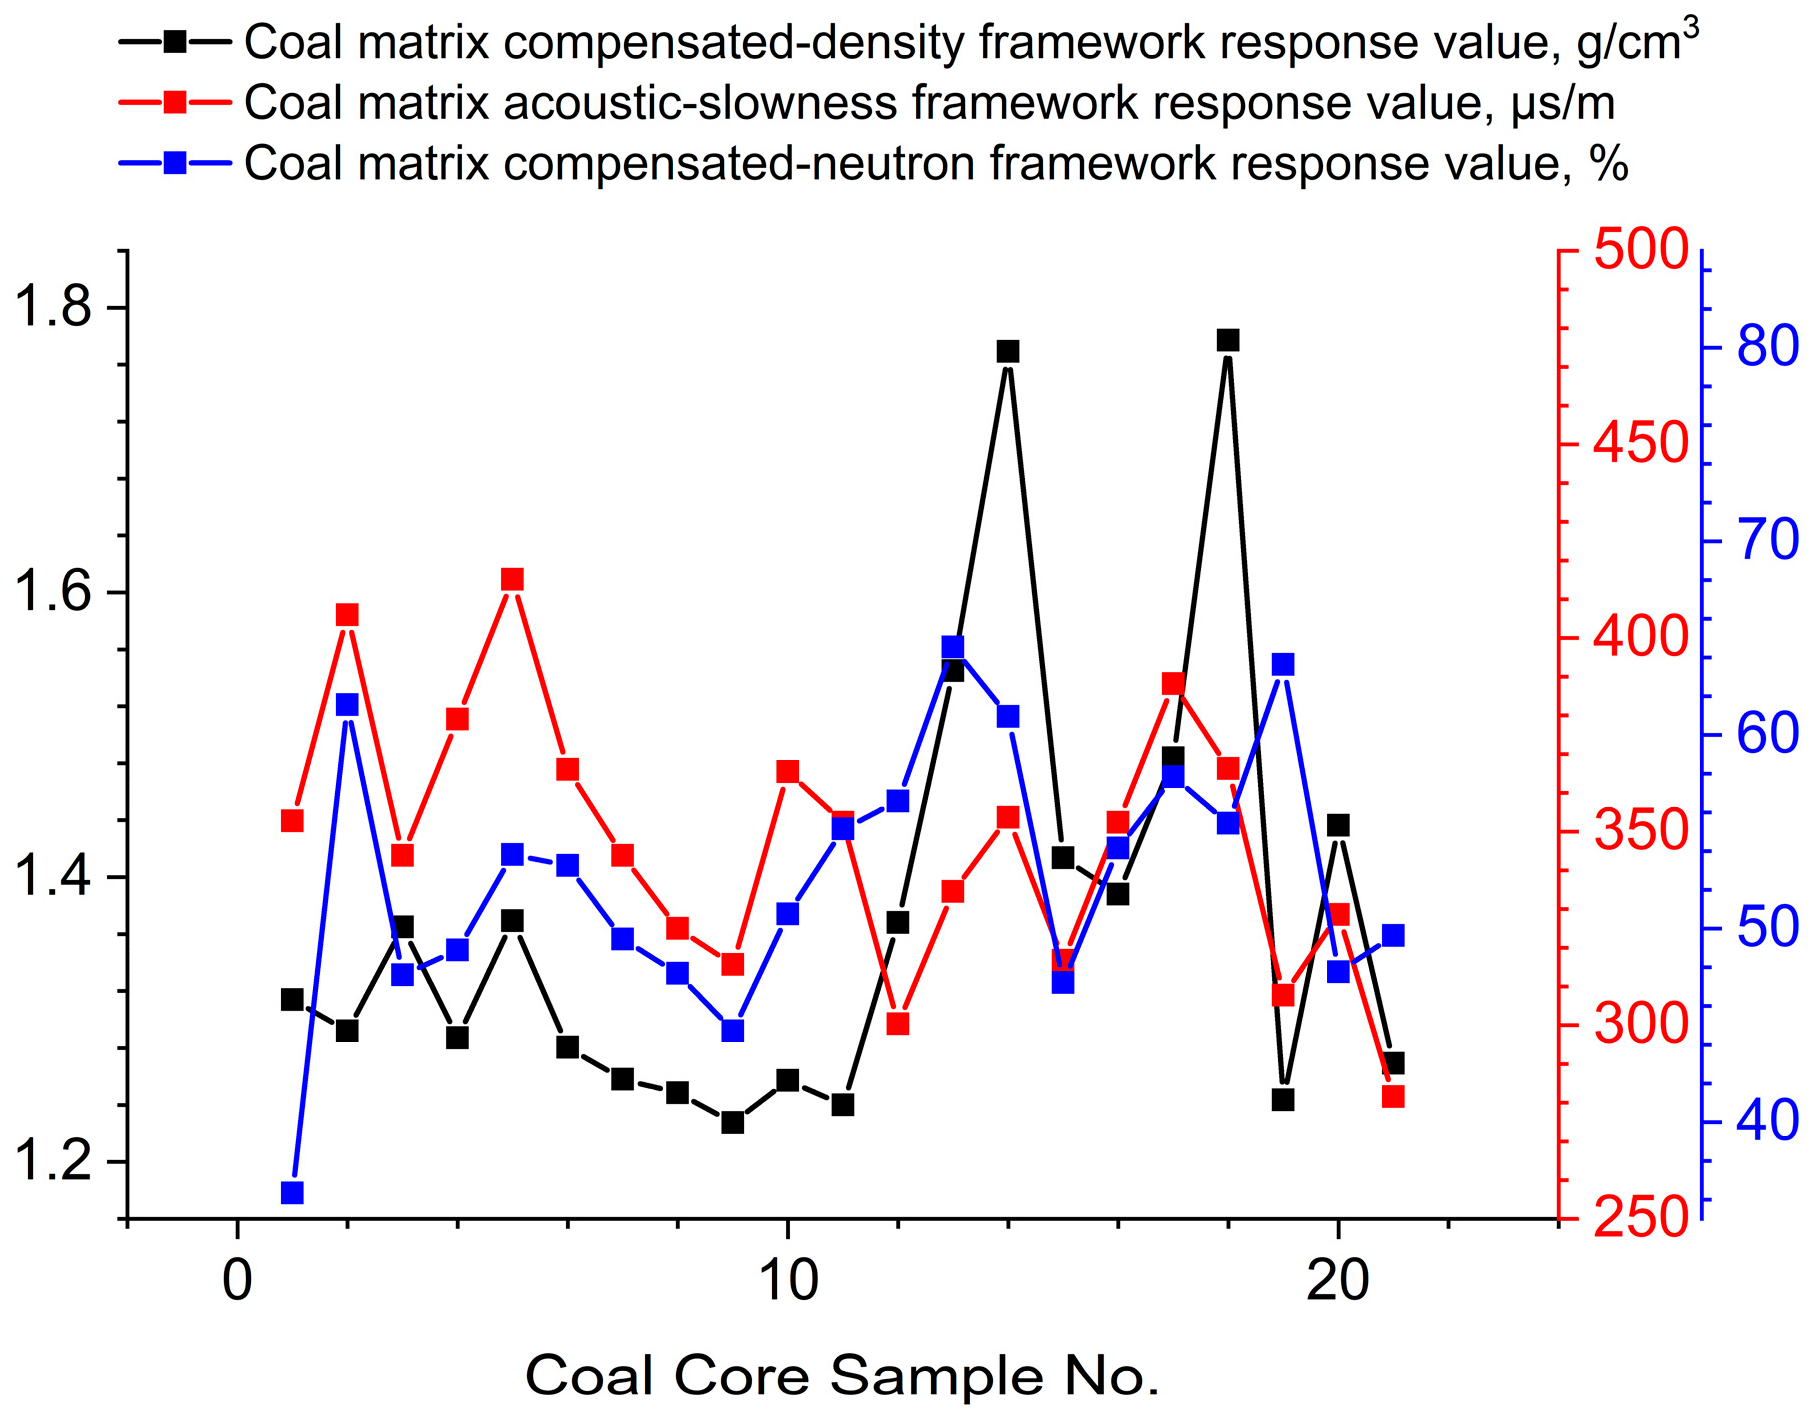
The calibration results (Figure 8) show that the compensated-density framework response of the coal matrix ranges from 1.08 to 1.56 g cm−3, with an average of 1.26 g cm−3. The acoustic-slowness framework response ranges from 281 to 425 μs m−1, with an average of 359 μs m−1. The compensated-neutron framework response ranges from 39% to 79%, with an average of 57%. These results indicate that the porosity-log framework responses of the coal matrix in coal rocks are not constant, representing a fundamental distinction from conventional hydrocarbon reservoirs.

4.1.3. Porosity Calculation Results for CRG Reservoirs

After determining the framework responses of the coal matrix, porosity can be calculated using the variable framework model. In conventional variable framework models, the framework response is obtained by weighted averaging according to variations in reservoir mineral content. However, the framework response of the coal matrix itself varies; using a single averaged coal-matrix framework value may reduce the reliability of the calculated porosity. Taking the compensated-density log as an example, coal rocks generally have low mechanical strength and are prone to borehole enlargement during drilling, which is a widely observed phenomenon in coal-bearing intervals [29,31]. Statistics based on calliper logs from multiple study wells show that the average borehole enlargement rate in the No. 8 coal-seam intervals ranges from 5% to 39% (as shown in Figure 14). This enlargement significantly distorts density and neutron log responses, and commonly causes the calculated porosity to deviate from true values or even produce negative values. As a result, porosity calculated using Equation (7) may yield negative values. Similar issues occur with porosity calculated from the compensated-neutron log, both of which are inconsistent with geological reality. The acoustic-slowness log produces only a small number of negative porosity values, but the overall error remains large. Therefore, porosity calculation in this study primarily relies on the acoustic-slowness log, which is less affected by borehole enlargement. Variable coal-matrix framework responses calibrated from core experiments and the derived equations were used to obtain preliminary porosity calculation results. Given that direct acoustic-derived porosity generally exhibits systematic deviation from core-measured porosity under the strong compaction of deep coal reservoirs, a core-calibrated linear correction was applied instead of the conventional empirical compaction coefficient method. The correction formula was established via linear regression between the preliminary calculated porosity (x) and the core-measured helium porosity (y):
y = 0.48 x 0.05 .
This correction method assumes that the overall compaction degree of the No. 8 coal seam in the study area is relatively uniform, and the systematic deviation between log-calculated and core-measured porosity remains stable within the target interval. After linear correction, the overall deviation between calculated porosity and core-measured values is effectively reduced.
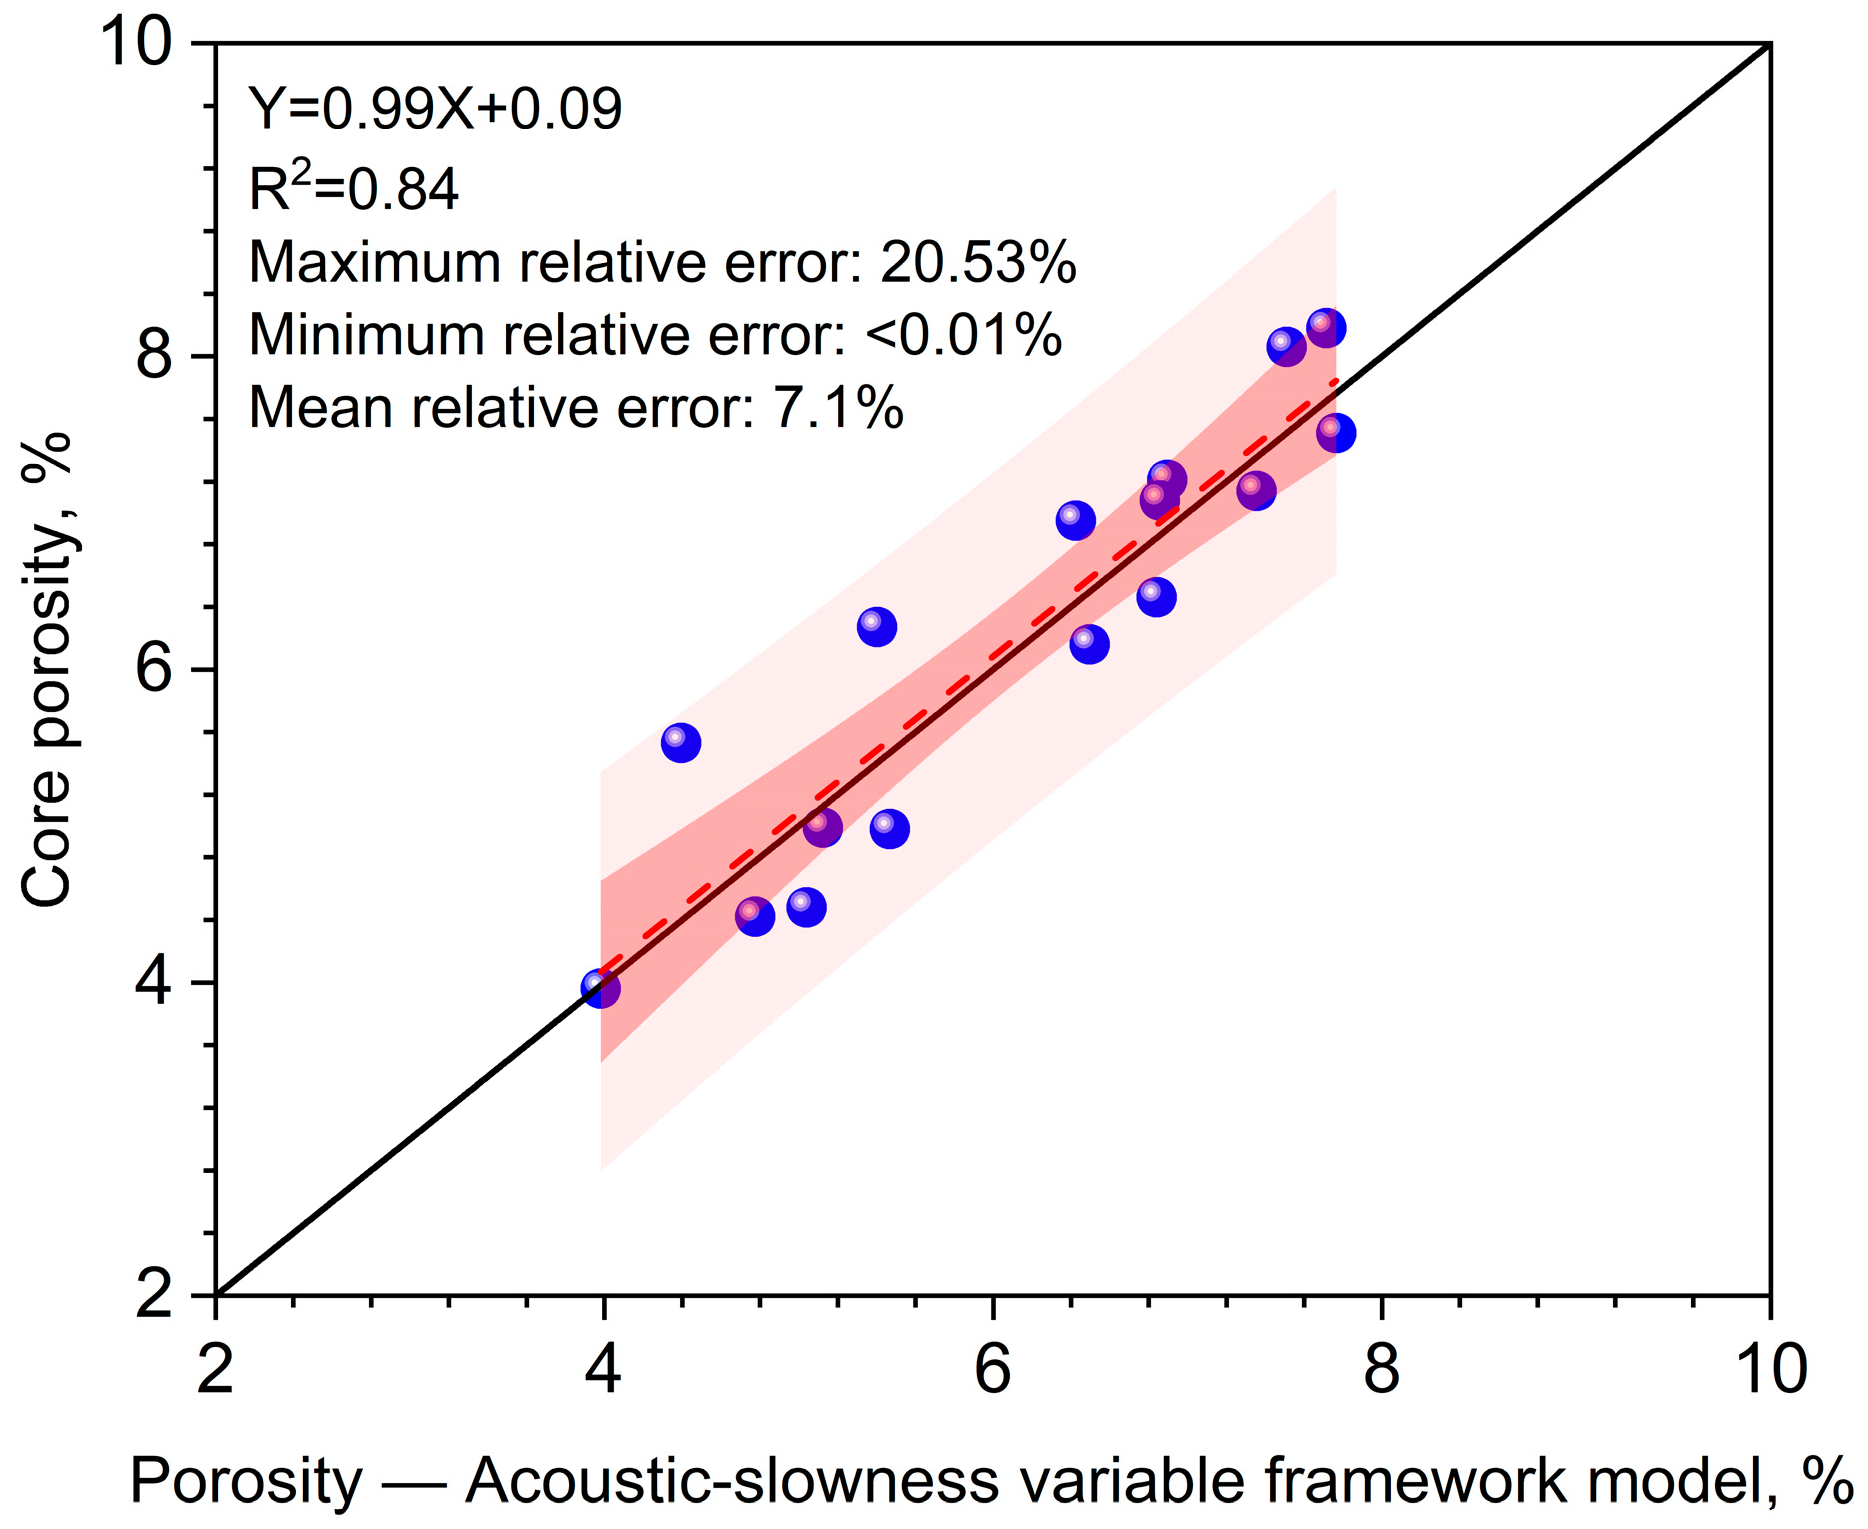
Figure 9 shows the linear regression between core-measured porosity and porosity calculated using the acoustic-slowness-based variable framework model. The red shaded area in Figure 9 represents the 95% confidence band of the regression mean; its width varies with the independent variable and reflects prediction uncertainty. Statistical error analysis shows that the average relative error (ARE) of the model is 7.1%, the mean absolute error (MAE) is approximately 0.44%, and the root mean square error (RMSE) is approximately 0.42%. The minimum relative error is less than 0.01%, and the maximum relative error is 20.53%. The 95% confidence band shown in Figure 9 is calculated based on the standard deviation of regression residuals, which reflects the prediction uncertainty of the model at different porosity levels. These results demonstrate good agreement between model-calculated porosity and core-measured porosity, validating the effectiveness of the proposed method.
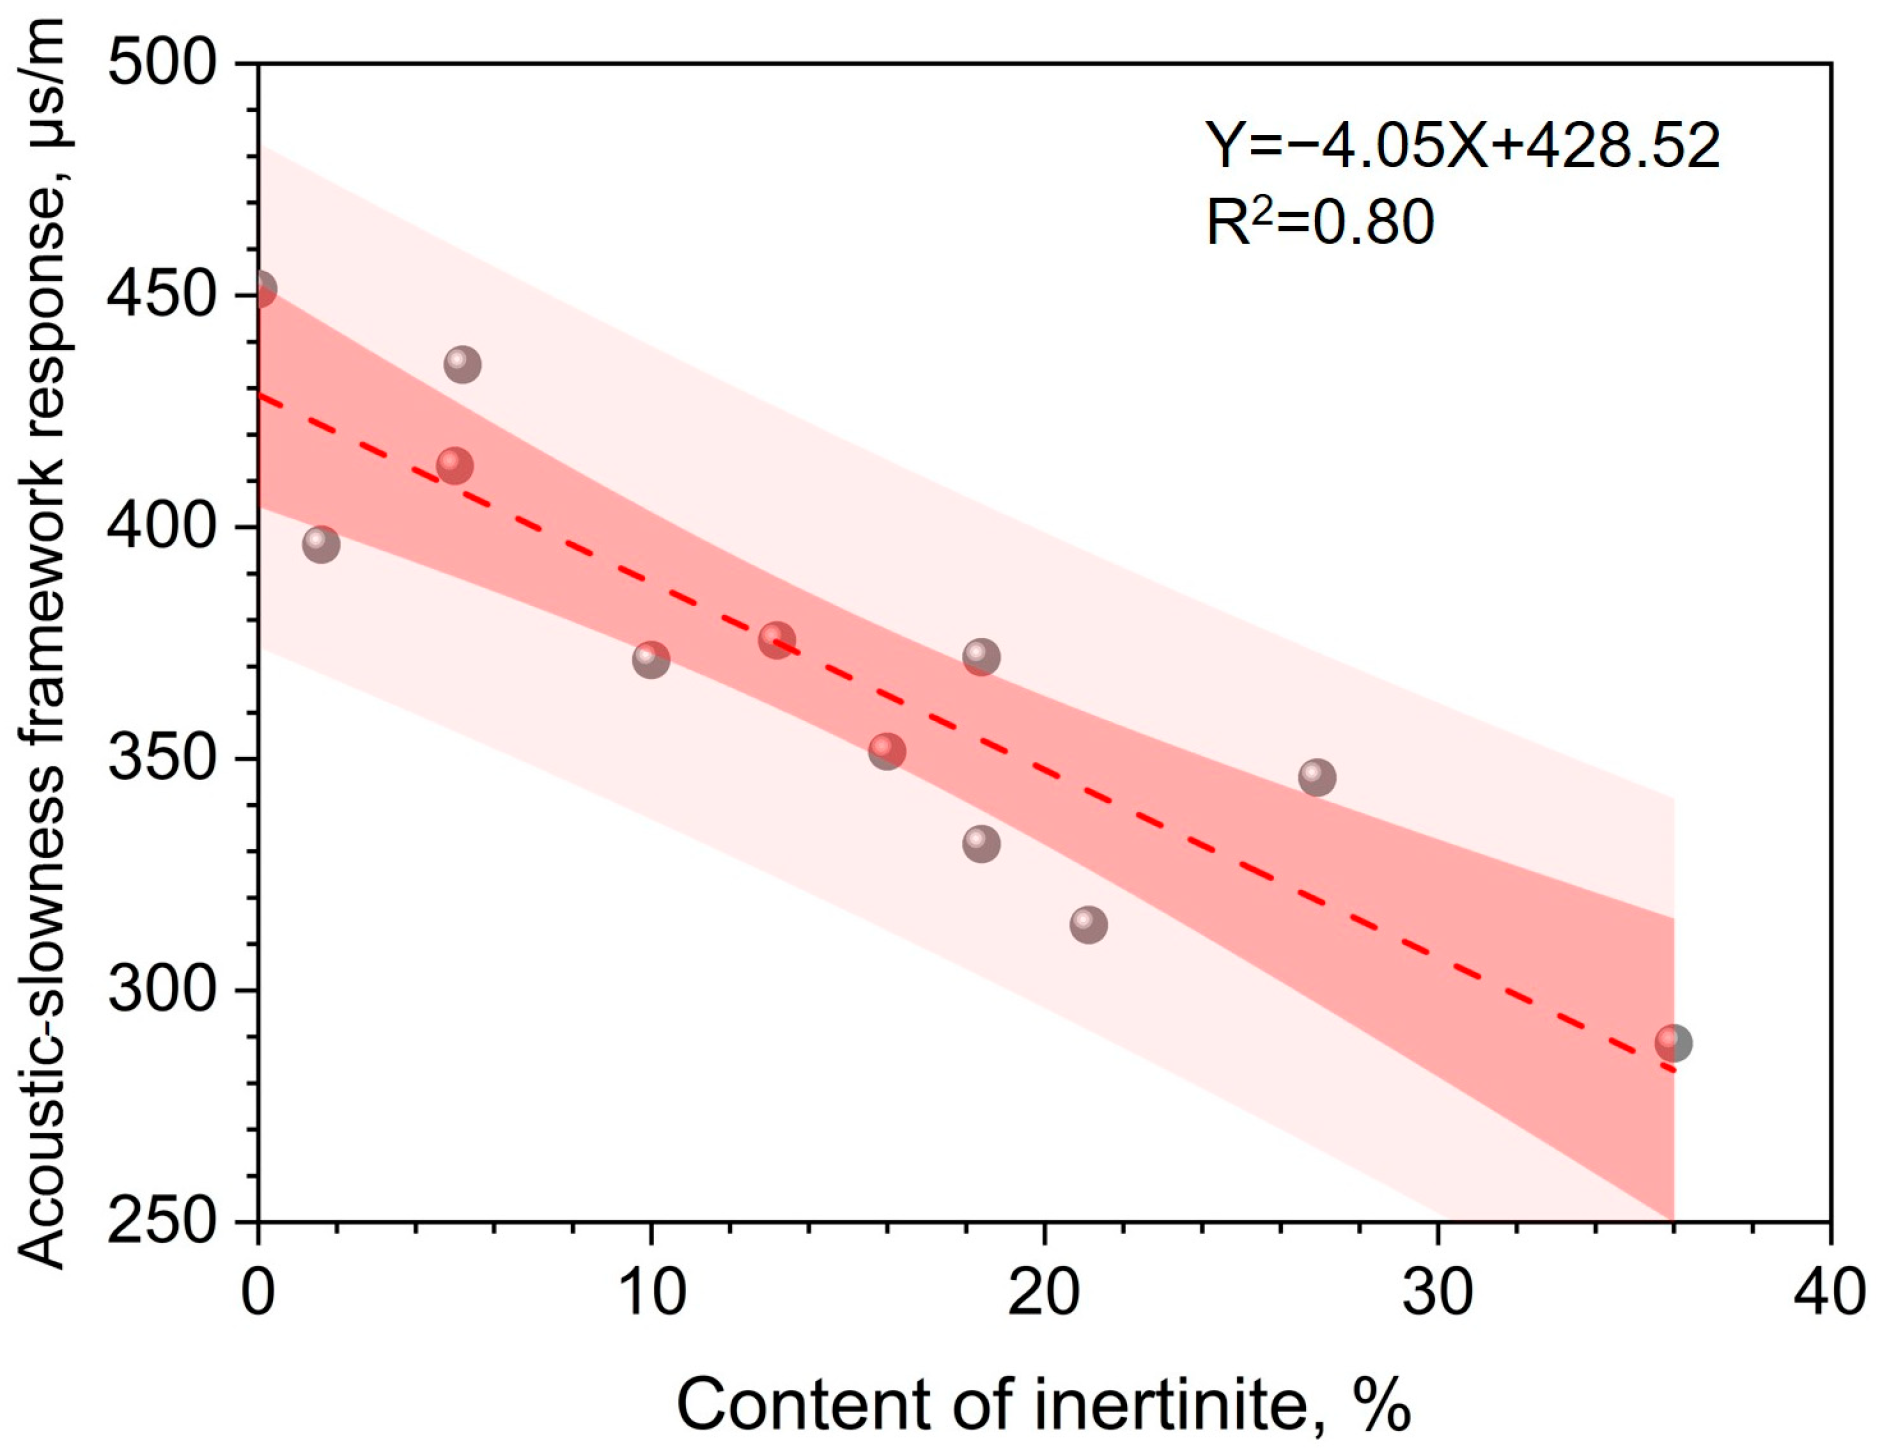
Furthermore, this study explores the mechanism governing variations in the acoustic-slowness framework response of the coal matrix. As shown in Figure 10, correlation analysis based on 12 samples with complete maceral test data yields a linear relationship with a coefficient of determination of R2 = 0.80 between inertinite content and the acoustic-slowness framework response. These 12 samples are a subset of the 21 core samples used for coal-matrix framework-parameter calibration. For the coking coal in the study area, increasing inertinite content corresponds to a systematic reduction in the acoustic-slowness framework value. Notably, this quantitative relationship is underpinned by clear petrophysical mechanisms rather than pure statistical fitting, so the sample subset does not introduce overfitting or circular validation bias. Inertinite content was measured via the standard coal maceral point-counting method by a professional petrology laboratory in accordance with industry specifications, and the test reliability fully meets the requirements of quantitative analysis in this work. The 95% confidence band presented in Figure 10 confirms that the negative correlation is statistically significant at the 95% confidence level, further verifying that inertinite content exerts first-order control on the coal matrix acoustic-slowness framework response.
This relationship is attributable to inherent differences in maceral structure and their distinct evolutionary responses during coalification. Inertinite macerals (e.g., fusinite and semifusinite) form via intense oxidation or carbonization throughout peat accumulation and coalification, developing rigid, highly aromatized structures with dense molecular packing and poorly developed pore networks. Such structures exhibit high framework density and elevated elastic modulus, enabling faster acoustic-wave propagation and correspondingly lower intrinsic acoustic slowness.
By contrast, vitrinite features a gelified texture and relatively high acoustic slowness at low coal ranks. Once coalification proceeds to the second coalification jump stage, however, intensive dehydration, devolatilization, and aromatization progressively densify its macromolecular framework and markedly increase its petrophysical rigidity. At this maturity level, higher inertinite content elevates the proportion of rigid, high-modulus, low-slowness components within the coal rock, manifesting macroscopically as a systematic decrease in the bulk acoustic-slowness framework value.

4.2. Discussion

4.2.1. Innovations of This Study

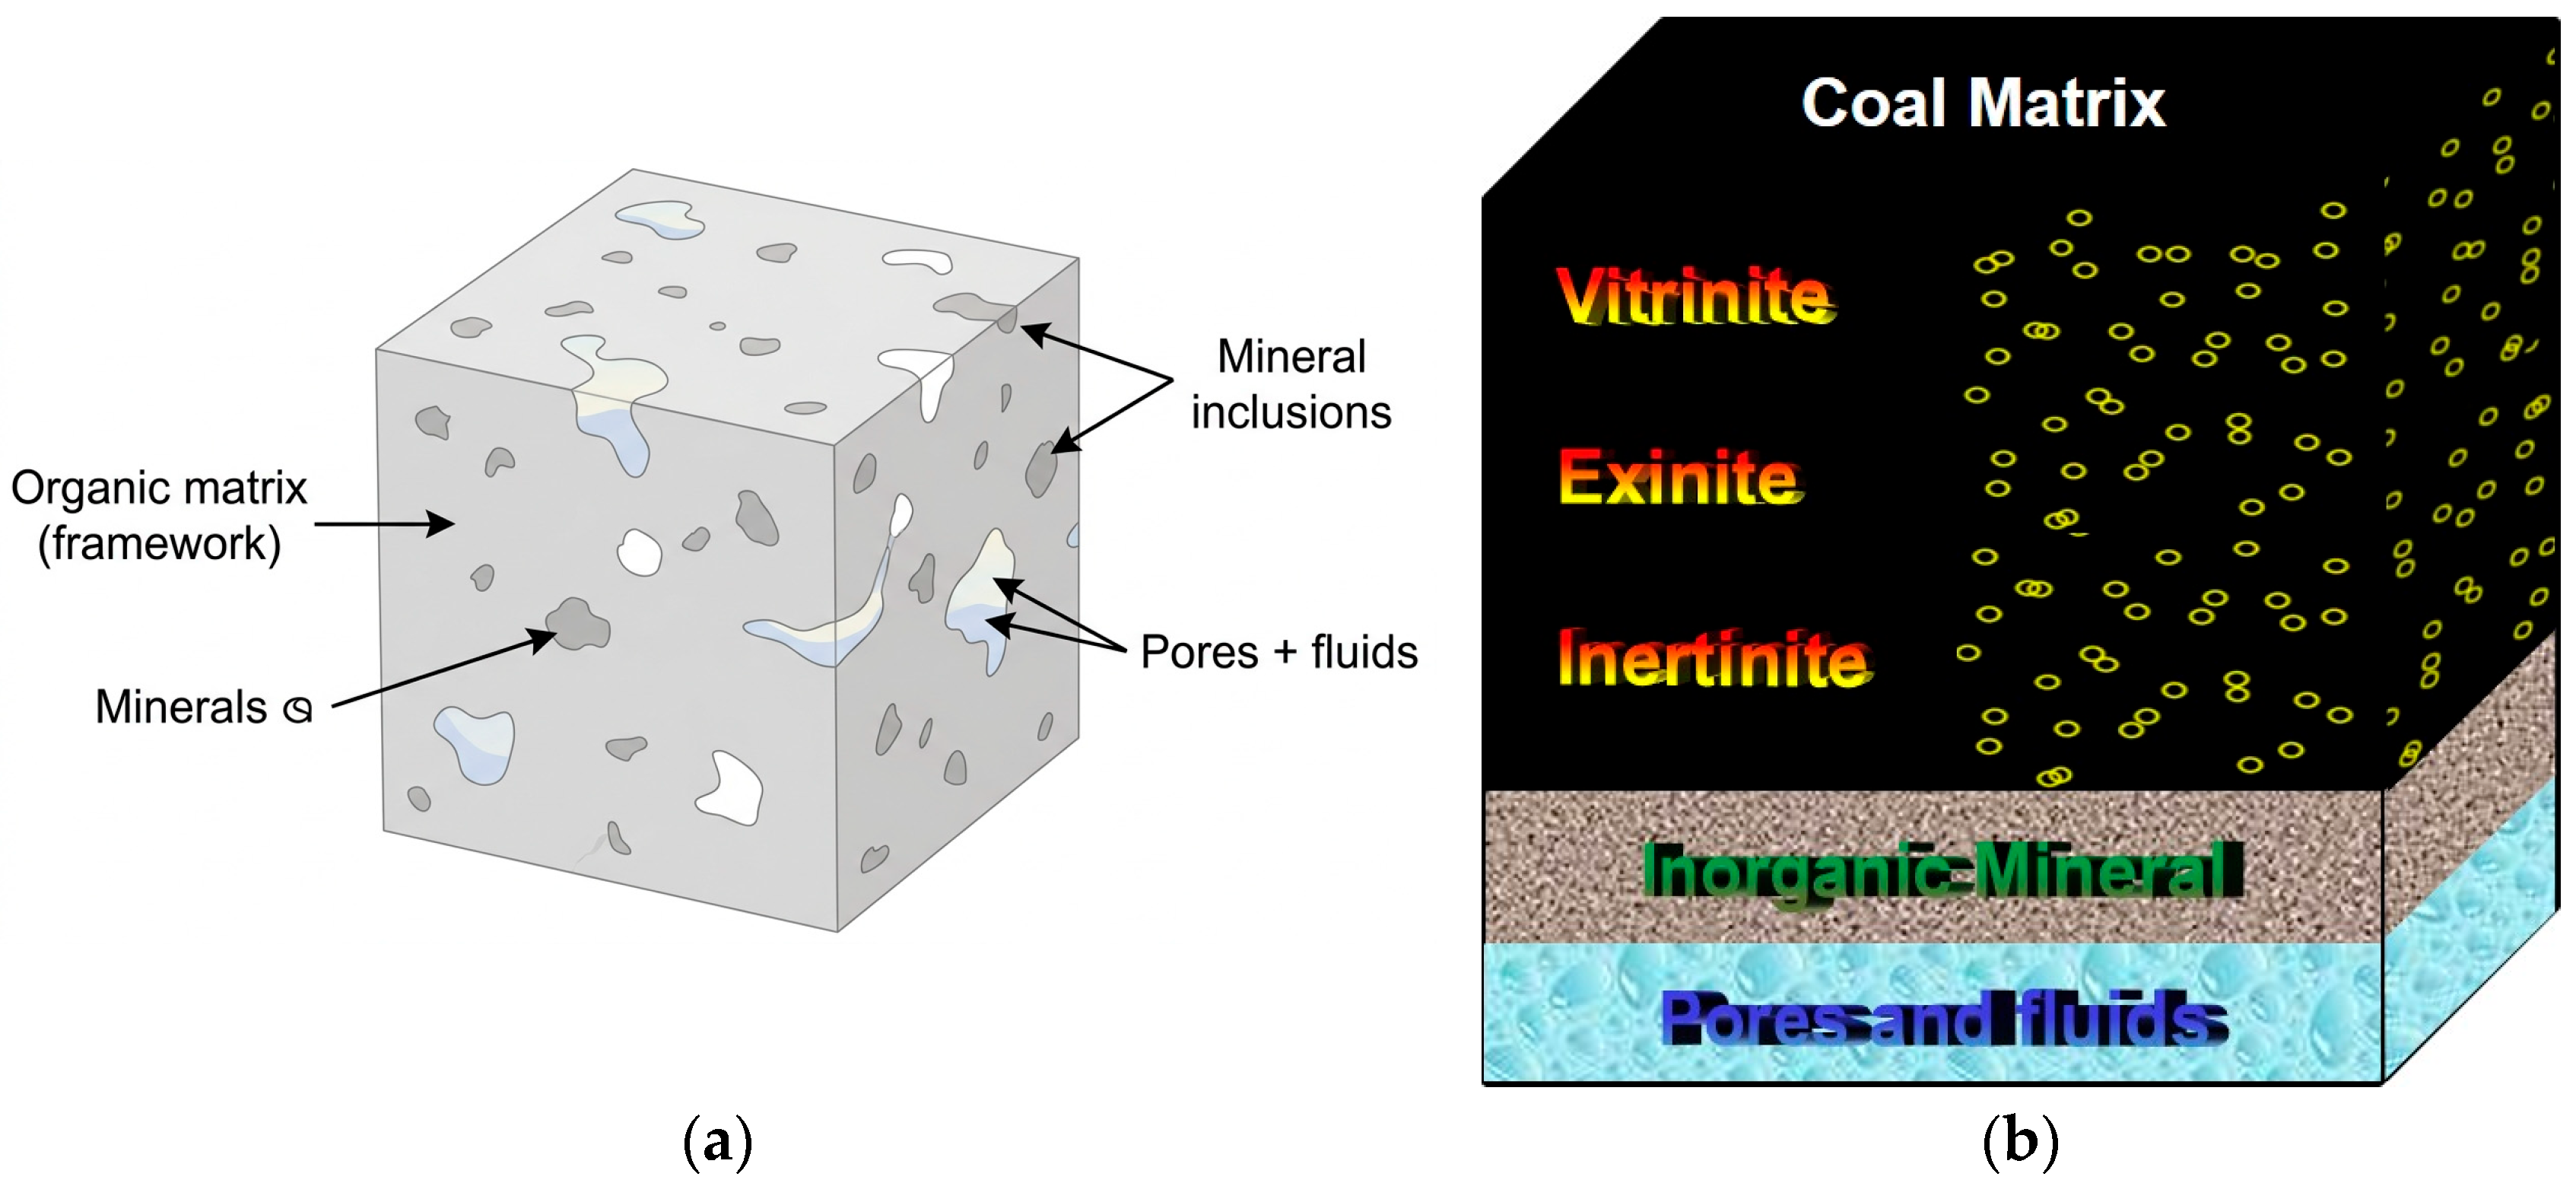
Drawing on the petrophysical framework established for conventional hydrocarbon reservoirs, this study integrates multi-scale macroscopic and microscopic characterization methods, including thin-section identification, microscopic image observation, proximate analysis, XRD analysis, and micro-CT. Based on the fundamental concept of the petrophysical volumetric model, a dedicated volumetric model is proposed for CRG reservoirs. Figure 11a shows a schematic representation of the coal-rock volumetric model from the microscopic perspective of the digital core, which can be generalized into the model shown in Figure 11b. This model explicitly defines coal rock as a three-component structural system composed of a coal-matrix organic phase, an inorganic mineral phase, and a pore-fluid phase. It reconstructs the material composition of coal rock from a petrophysical perspective and provides a theoretical framework for CRG reservoir well-log evaluation that is more consistent with geological reality.
This study proposes and implements a dual-variable framework well-log evaluation framework for coal rocks, as expressed in Equation (9). The first level of matrix variability arises from changes in inorganic mineral composition, whereby variations in the contents of clay minerals, quartz, carbonates, and pyrite modify the framework response. The second level arises from internal variations within the organic component, whereby differences in vitrinite and inertinite contents, macromolecular structure, and degree of compaction cause the framework response of the coal matrix itself to be non-constant. By incorporating both types of variability into porosity calculation, this study substantially improves the physical rationality and predictive accuracy of the model. For the No. 8 coal seam of the Benxi Formation in the study area, the results demonstrate that increasing inertinite content enhances the rigidity of the coal-rock framework and reduces acoustic slowness [40]. This finding refines the understanding of petrophysical response mechanisms in highly evolved coal rocks from the perspective of maceral structural evolution and provides both experimental evidence and theoretical support for selecting variable framework parameters [41].
ϕ = Δ t p i n ( V M i n e r a l × Δ t p i ) + V C o a l × Δ t p C o a l Δ t p f i n ( V M i n e r a l × Δ t p i ) + V C o a l × Δ t p C o a l = Δ t p i n ( V M i n e r a l × Δ t p i ) + V C o a l × f ( I n e r t i n i t e ) Δ t p f i n ( V M i n e r a l × Δ t p i ) + V C o a l × f ( I n e r t i n i t e ) .
In Equation (9), f ( I n e r t i n i t e ) denotes the coal-matrix acoustic-slowness framework value calculated as a function of inertinite content.

4.2.2. Implications for Well-Log Evaluation of Coal Rocks

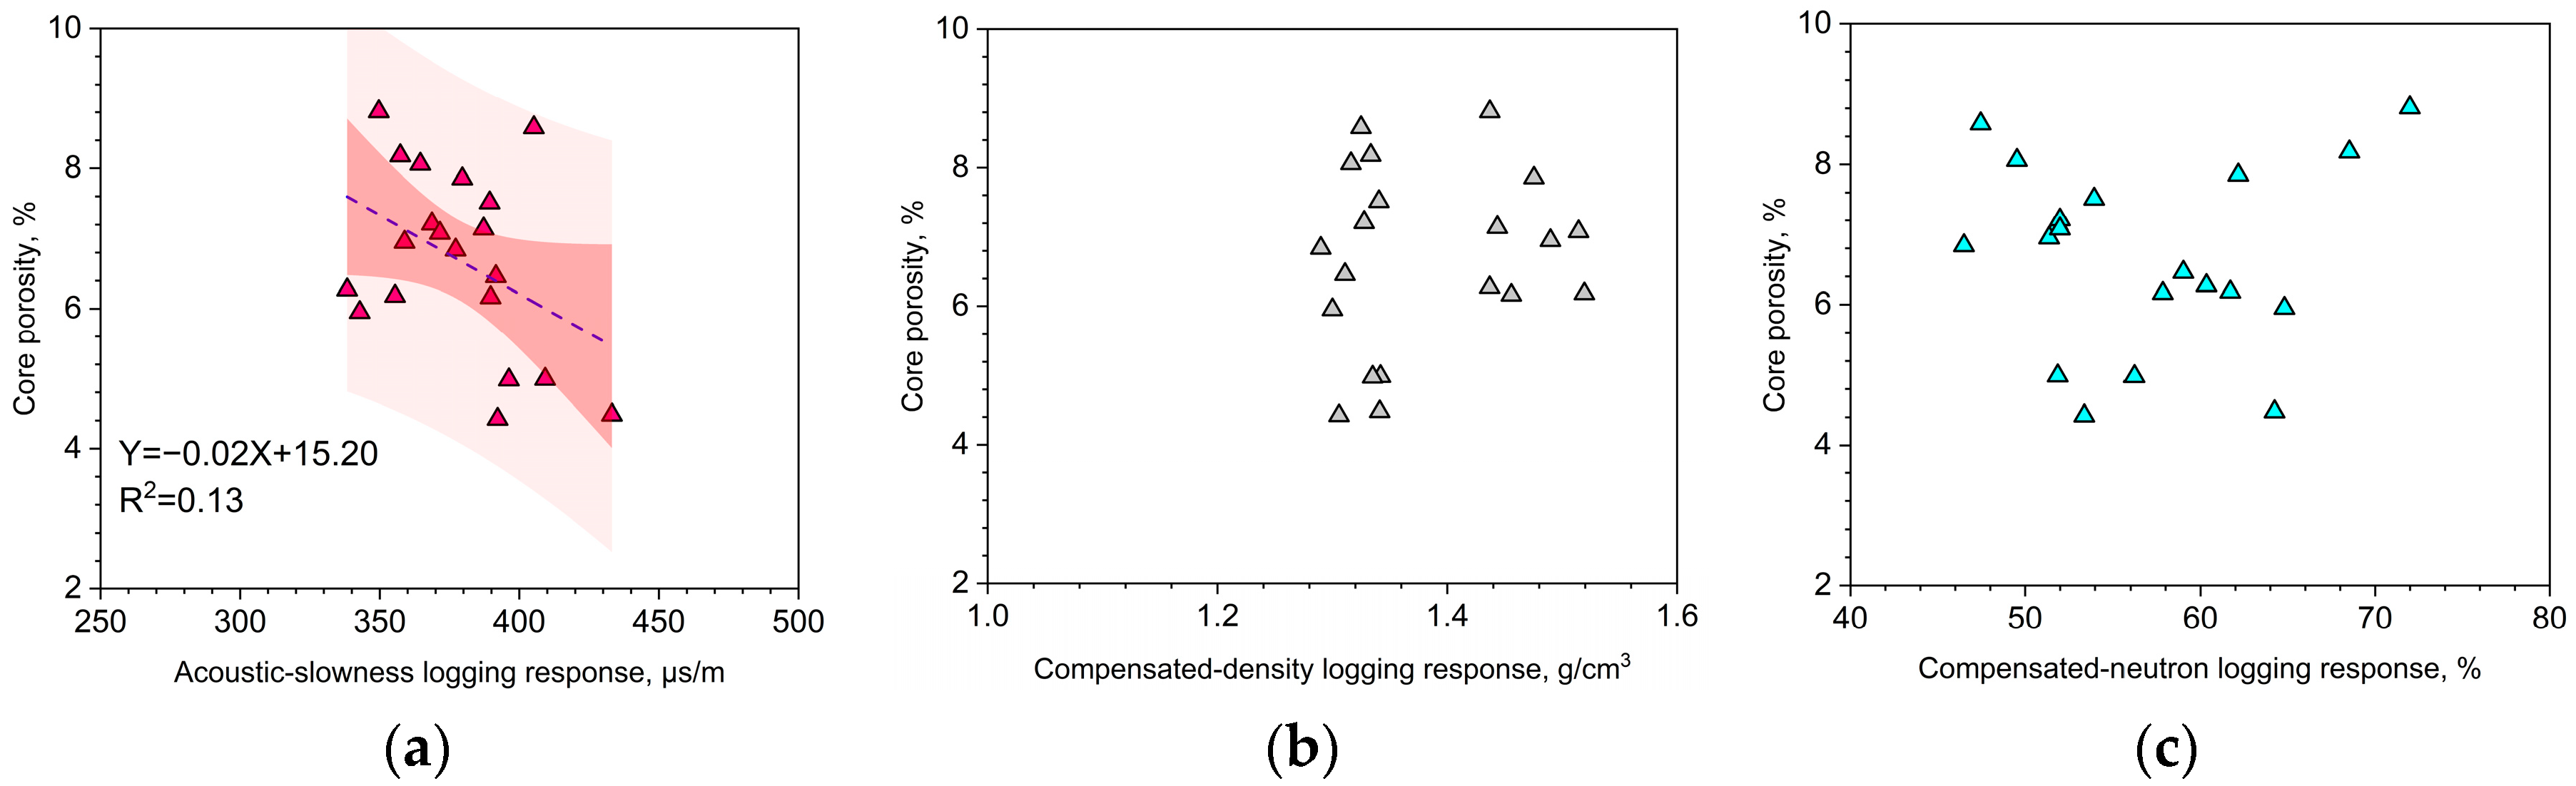
The framework response of the coal matrix varies substantially with maceral composition and coalification degree. Use of a fixed framework value can therefore distort porosity estimates and may even yield negative porosity values. Adopting a variable framework approach is thus essential for improving the reliability of log interpretation. Conventional evaluation methods mainly consider variations in inorganic mineral composition. In contrast, this study demonstrates that internal structural and compositional variations within the organic component also exert a significant control on logging responses and should therefore be incorporated as a necessary component of coal-rock logging models. Taking porosity evaluation as an example, conventional regression between logging curves and core-measured porosity gives unsatisfactory results. The poor performance of conventional empirical-fitting methods is essentially attributed to the constant framework-parameter assumption. These methods ignore the strong heterogeneity of the coal-matrix composition and cannot distinguish the different volumetric contributions of organic and inorganic components, thus leading to significantly increased calculation errors in intervals with large variations in ash yield and coal quality. Figure 12 shows cross-plots between the three porosity logs and coal-rock core porosity. Compared with the compensated density and compensated neutron logs (Figure 12b,c), the acoustic-slowness log (Figure 12a) shows a stronger correlation with core porosity, although the coefficient of determination remains low. Therefore, in porosity evaluation from well logs, further work should focus on how logging curves can be used to accurately evaluate proximate-composition and TOC parameters, which can then be used to calibrate the true proportions of the coal matrix and inorganic minerals. In addition, predicting maceral contents, such as inertinite content, and developing high-precision characterization models represent important directions for future research.
Consistent with this pattern, in coal-bearing intervals with severe borehole enlargement, density and neutron logging responses are highly susceptible to distortion, whereas acoustic slowness exhibits superior measurement stability, making it a more reliable primary curve for coal-rock porosity calculation. Accordingly, the effective correction of distorted logging curves and rigorous validation of associated correction methodologies remain key priorities for future investigation.
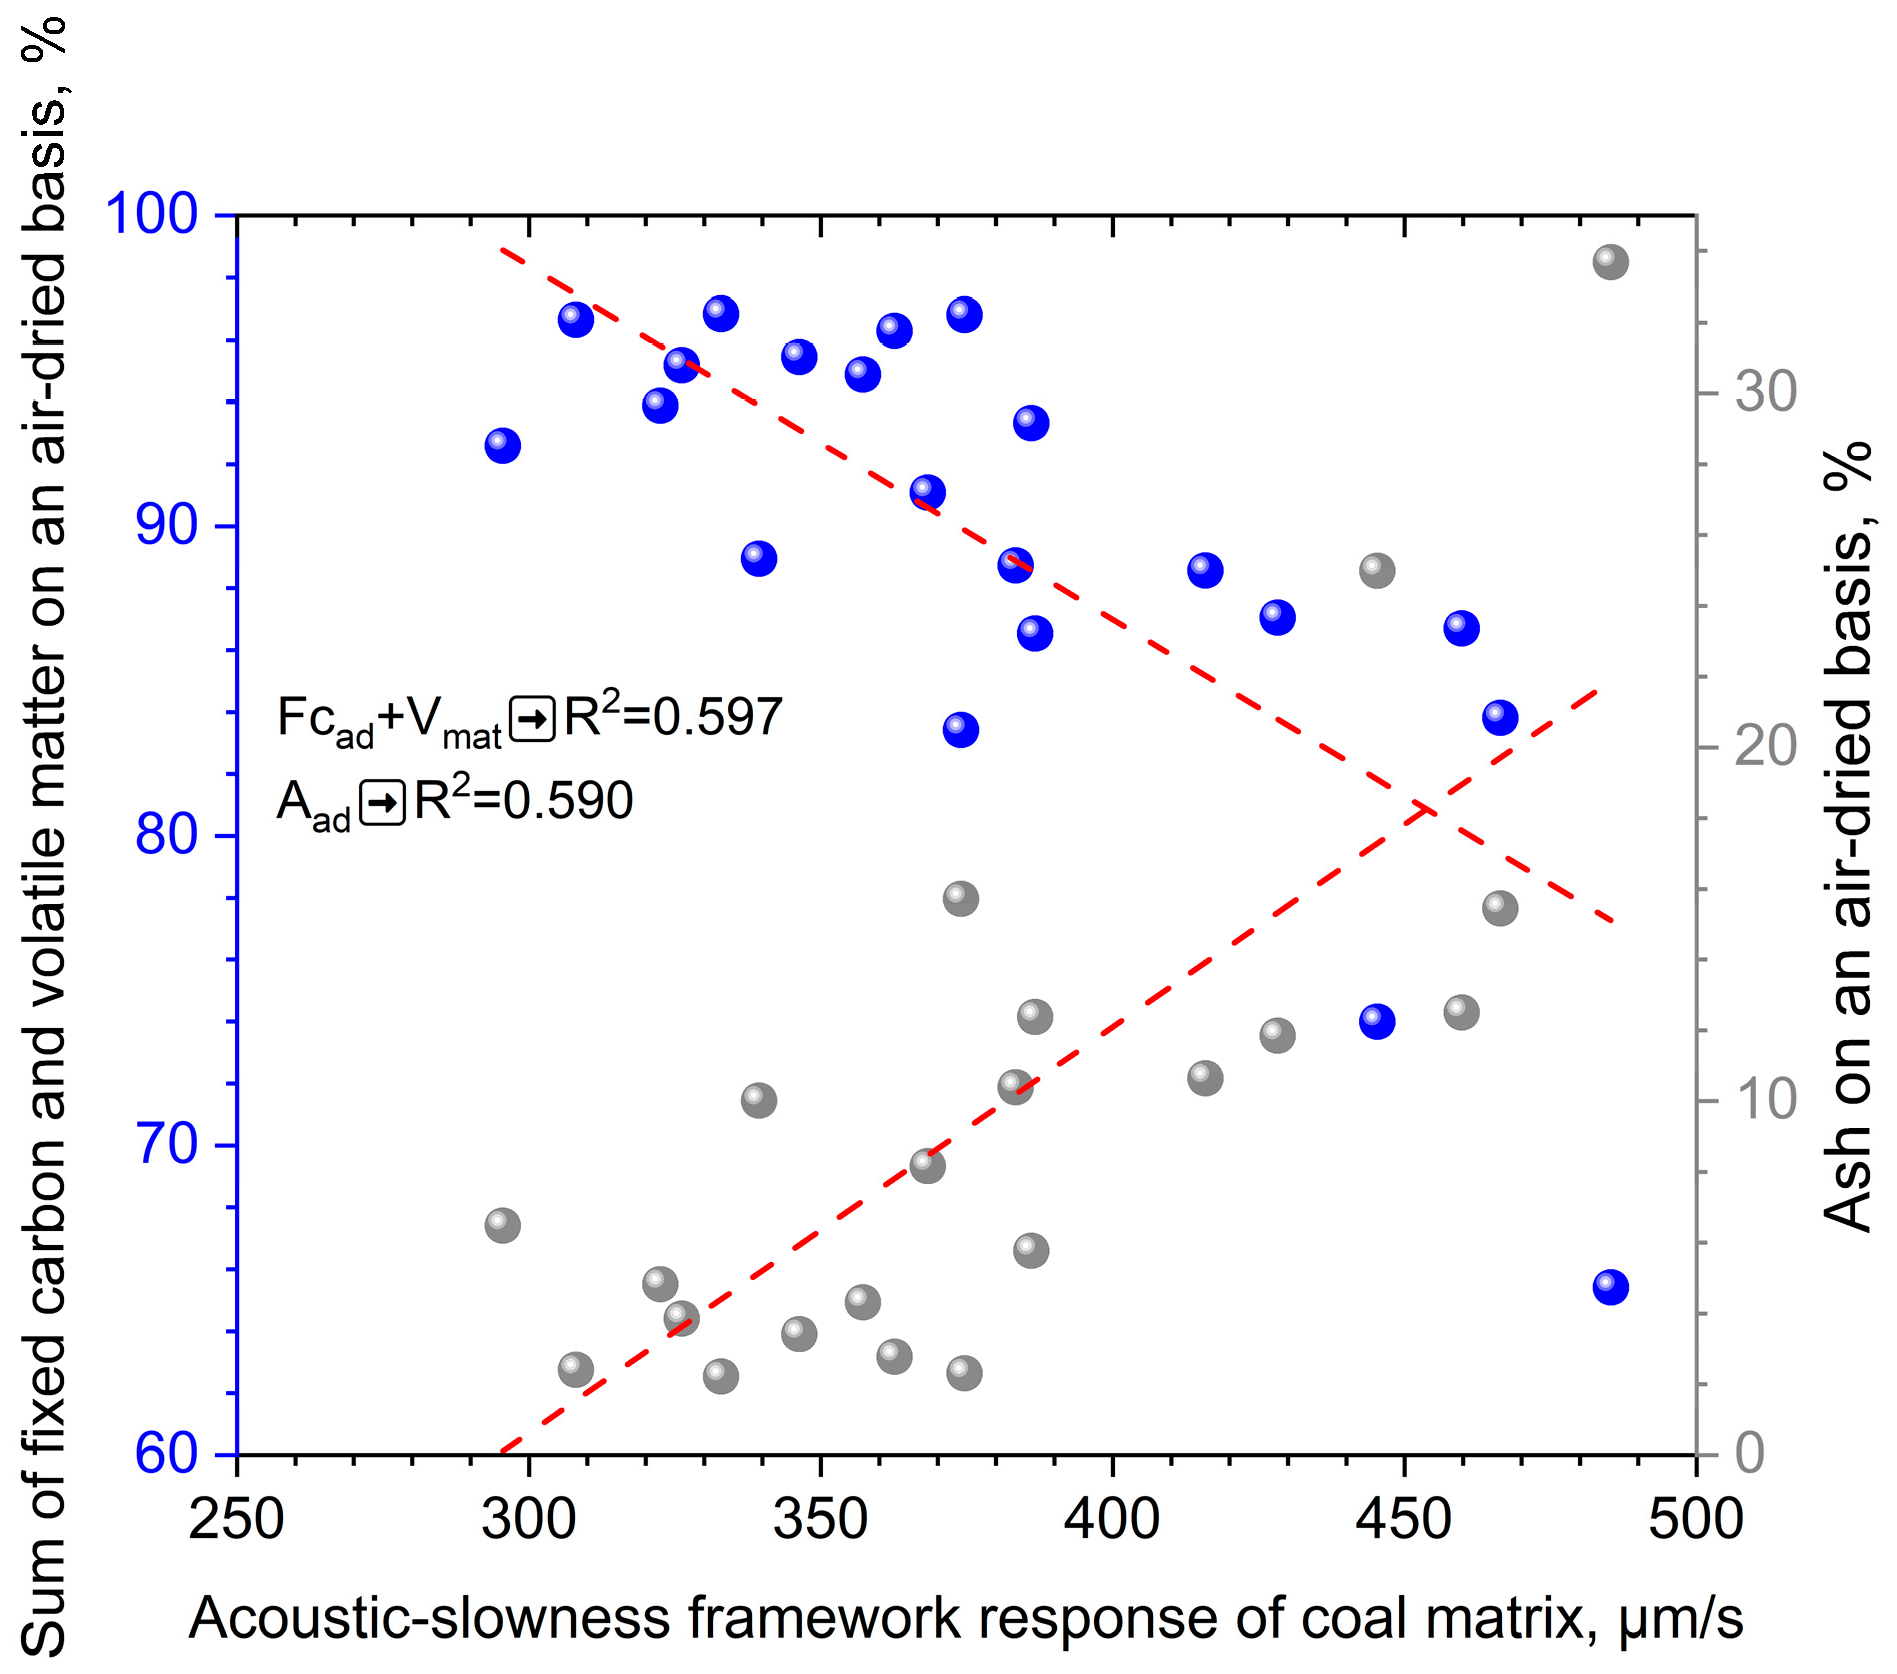
The acoustic-slowness framework response of the coal matrix is not constant. It shows a significant positive correlation with ash yield on an air-dried basis and a significant negative correlation with the sum of fixed carbon and volatile matter on an air-dried basis. This pattern directly reflects the intrinsic heterogeneity of the coal matrix and results from the combined effects of mineral-inversion compensation and physical hardening of the coal matrix.
From the perspective of the inversion mechanism, inorganic minerals such as quartz and calcite have much lower acoustic slowness than the coal matrix. As ash yield increases, the higher proportion of rigid minerals substantially reduces the bulk acoustic response of the coal rock. During framework-parameter inversion, to match the volumetric-model calculation with the measured logging response, the algorithm correspondingly increases the assigned acoustic-slowness framework value of the coal matrix to compensate for the reduction in acoustic response caused by inorganic minerals. Consequently, a higher ash yield leads to a larger inverted acoustic-slowness framework response of the coal matrix.
From the perspective of geological evolution, fixed carbon content is closely associated with the thermal maturity of coal rocks. With increasing coal rank, volatile components are progressively expelled, aromatic ring structures within the organic matter undergo continued condensation, and molecular arrangements become more compact and ordered. These changes markedly enhance the overall rigidity of the coal matrix, increase acoustic-wave velocity, and thereby reduce the corresponding acoustic-slowness framework response.
Notably, the positive correlation between ash yield and inverted-framework acoustic slowness is dominated by the inversion compensation effect (a mathematical mechanism). Since inorganic minerals have far lower intrinsic acoustic slowness than the coal matrix, the increase in mineral content will inevitably reduce the bulk acoustic response of the whole rock. To satisfy the volumetric balance equation, the inversion algorithm has to elevate the inverted slowness of the coal matrix to fit the actual logging response, which is an inherent mathematical attribute of the volumetric model inversion. A weak physical effect also exists: dispersed minerals embedded in the coal matrix slightly increase the overall elastic modulus of the organic framework, but its contribution to the framework response is far smaller than the inversion compensation effect due to the low content and highly dispersed occurrence of minerals within the coal matrix.
This dual-control mechanism is quantitatively supported by the experimental data (Figure 13). The linear coefficients of determination between the acoustic-slowness framework response of the coal matrix and ash yield, and between this response and the sum of fixed carbon and volatile matter, are 0.590 and 0.597, respectively, indicating stable quantitative relationships. It should be noted that the above rules and parameter ranges are mainly derived from medium–high rank coal samples of the Benxi Formation in the study area. For low-rank coal reservoirs or reservoirs with other coal ranks, more core samples are required for further verification.
To quantitatively disentangle the relative contributions of these two mechanisms, a stepwise demineralization control experiment can be designed in follow-up research. For the same homogeneous coal sample, a step-by-step mild demineralization treatment is performed to obtain a series of samples with gradient ash yields, and the intrinsic acoustic slowness of the coal matrix under each ash yield condition is directly measured via laboratory ultrasonic testing. This approach can completely eliminate the interference of the inversion process and obtain the pure physical elastic response of the coal matrix. The difference between the physically measured matrix slowness and the inverted matrix slowness under the same ash yield condition corresponds to the contribution of the mathematical compensation effect. This experimental scheme remains at the theoretical design stage and will be implemented in subsequent studies.
These results indicate that the conventional assumption of using a uniform and constant framework parameter in coal-rock well-log interpretation introduces substantial systematic errors and cannot accommodate the widespread heterogeneity of the coal matrix. Future well-log evaluation of CRG reservoirs should therefore establish a classification-based evaluation system grounded in coal-rock compositional characteristics. However, the specific classification criteria and parameter calibration methods that are compatible with logging responses require further investigation.
It should be emphasized that the porosity obtained from well logs in this study represents a macroscopic effective reservoir parameter at the formation scale and differs in both scale and methodology from microscopic pore-structure characterization using micro-CT and SEM. Microscopic methods focus on the morphology, distribution, and connectivity of nano- to micrometre-scale pores, whereas well-log evaluation reflects the volume-averaged effective porosity within a region extending tens of centimetres around the borehole. Although microscopic methods provide higher resolution, log-derived evaluation results are directly linked to engineering requirements such as reserve estimation, productivity prediction, and development-plan design, and therefore have irreplaceable field applicability. These two approaches are complementary and can jointly support an integrated understanding from microscopic mechanisms to macroscopic responses, thereby providing more comprehensive technical support for CRG reservoir evaluation.

4.2.3. Engineering Application Prospects

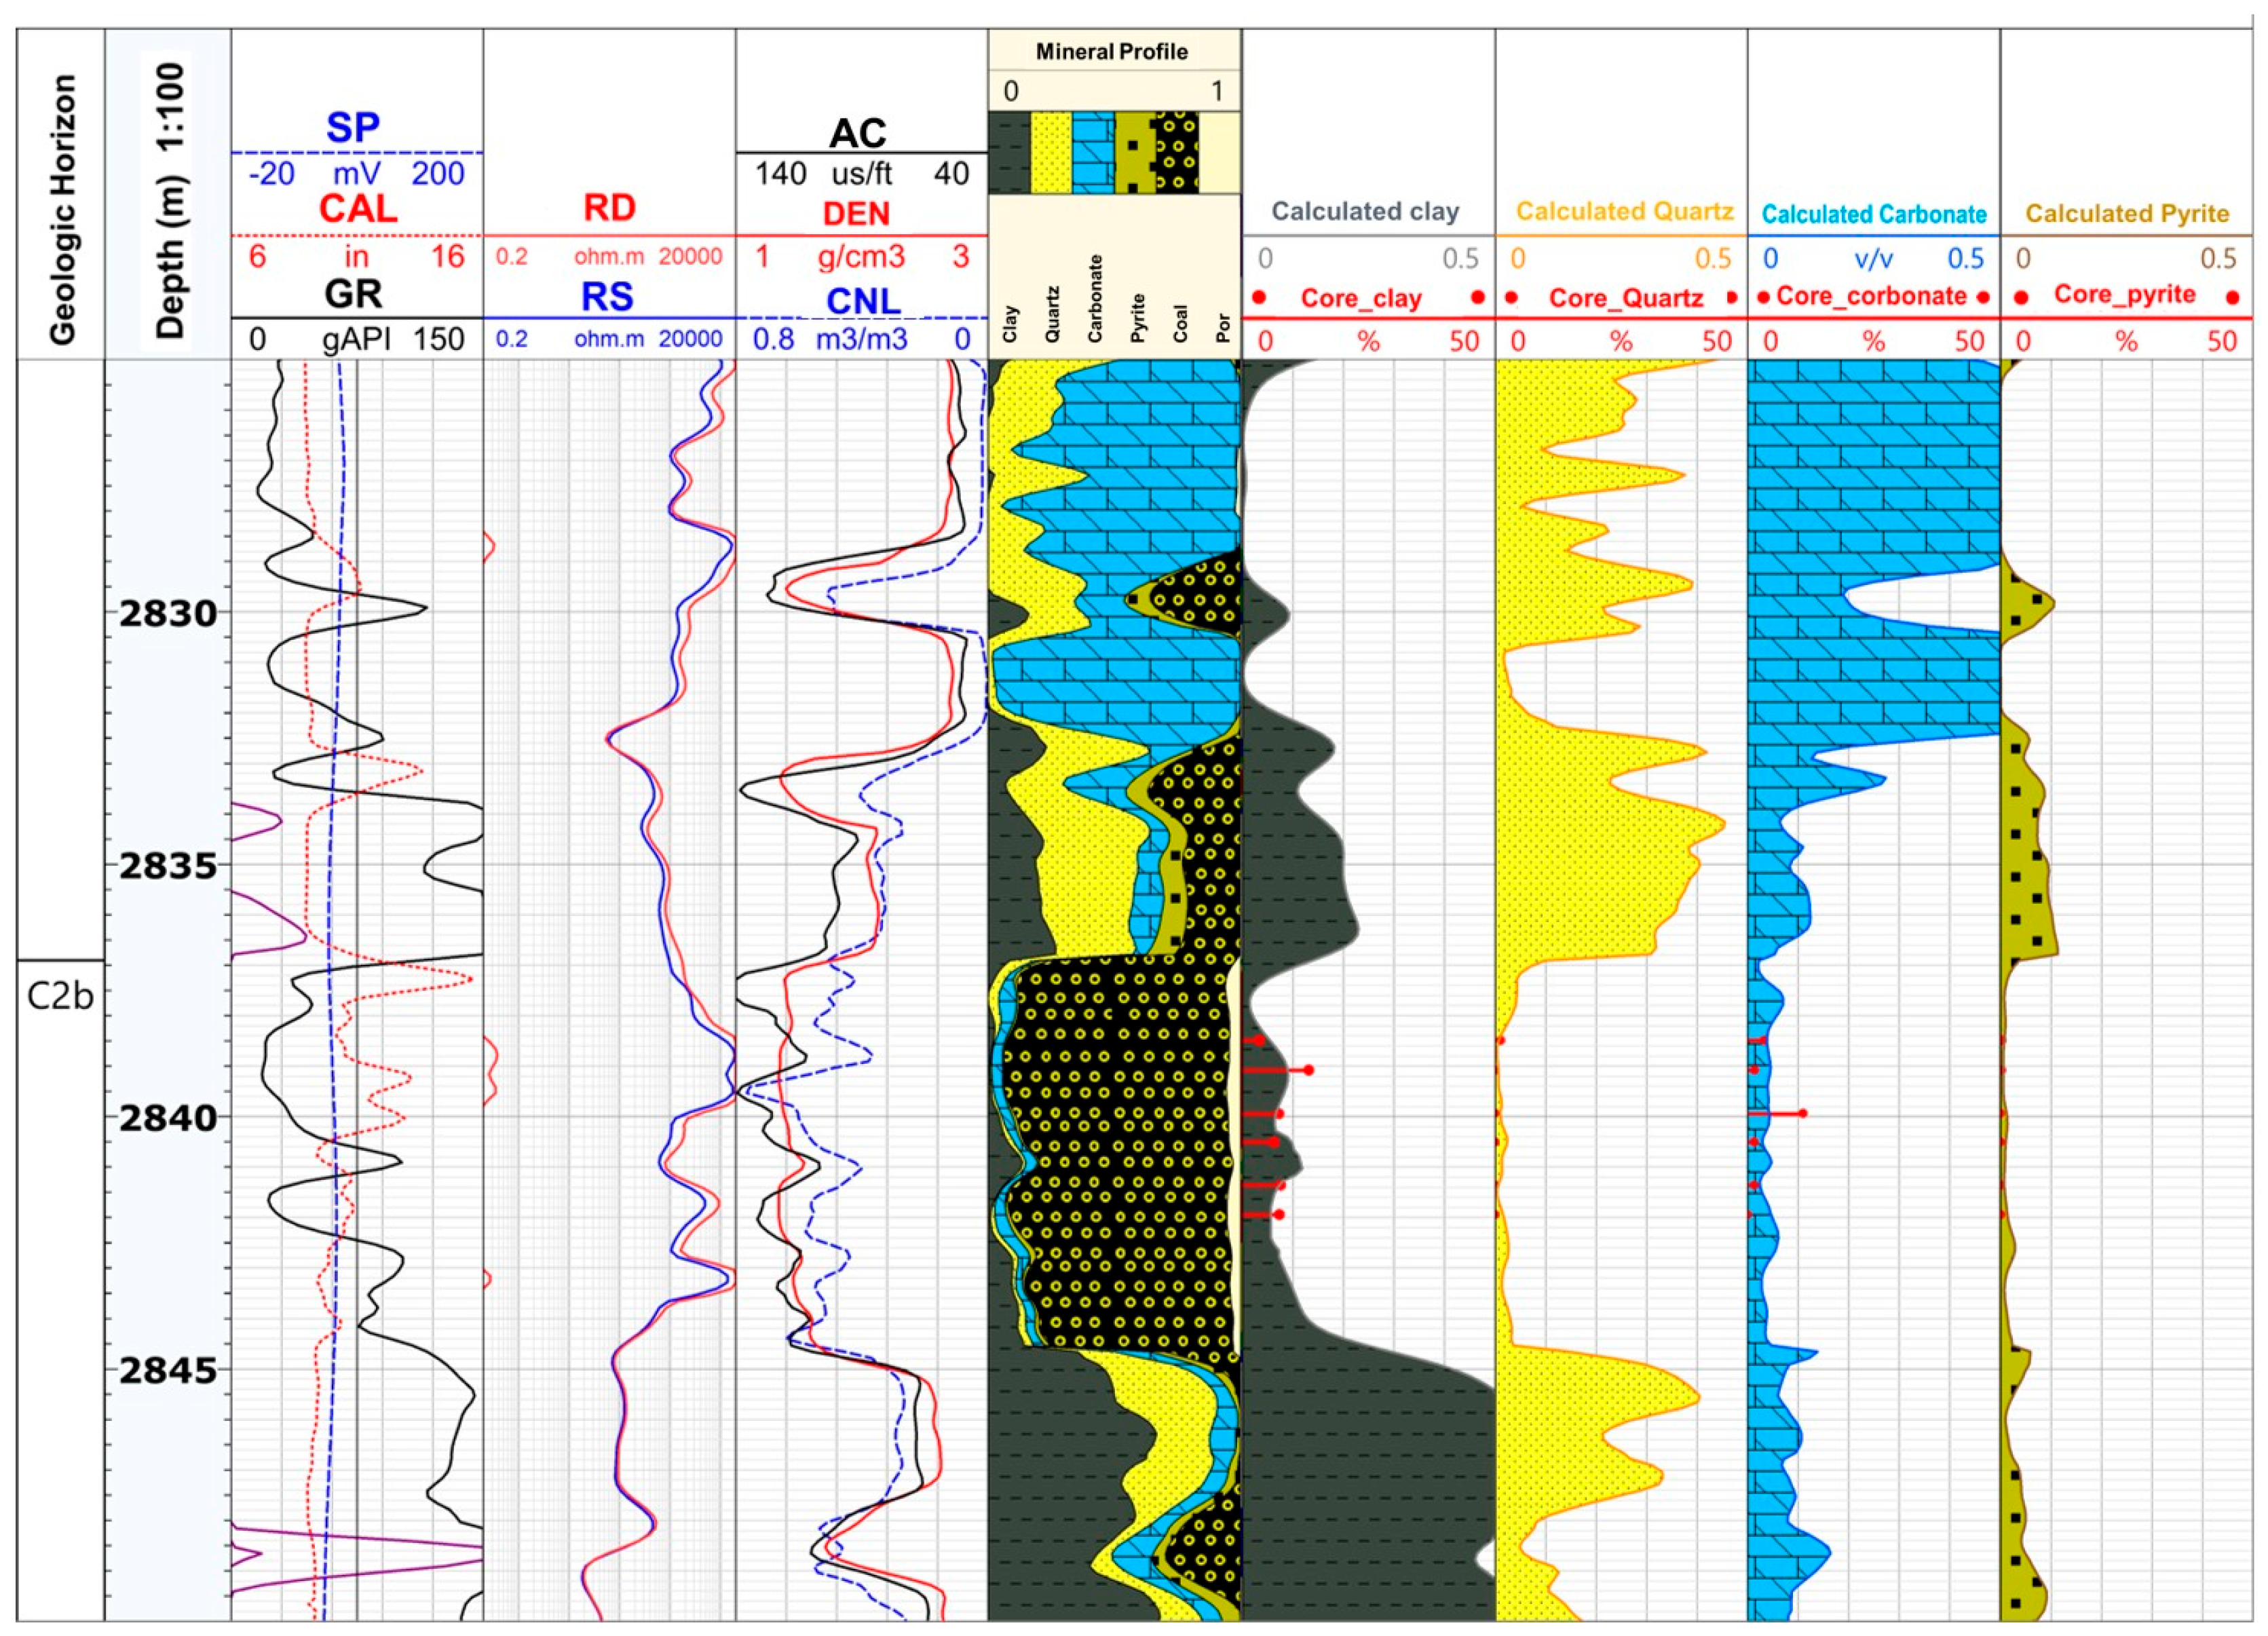
Based on the three-component volumetric model and dual-variable framework-parameter calibration method established in this study, an integrated quantitative interpretation of well-log data from CRG reservoirs can be achieved. Integration with elemental logging can be implemented following this workflow: first, the contents of major minerals (clay, quartz, carbonate, pyrite) are obtained via elemental logging spectral decomposition; then, these mineral contents are taken as constraint conditions to optimize the inversion of coal-matrix framework parameters in the three-component volumetric model, so as to further improve the calculation accuracy of mineral composition and porosity. Figure 14 shows the interpretation results for the Benxi Formation CRG reservoir in Well Q35 in the study area. The proposed method can simultaneously generate continuous profiles of inorganic mineral contents, including clay minerals, quartz, carbonates, and pyrite, as well as coal-matrix content and porosity. The interpretation results show good agreement with core-measured data.
For wells without elemental logging data, ash yield estimated from conventional logging curves can be used to dynamically assign coal-matrix framework parameters for simplified porosity calculation. This scheme has slightly lower accuracy but is generalizable within a uniform geological setting; framework parameters require re-calibration for regions with distinct mineral assemblages.
Conventional well-log interpretation for coal rocks generally follows a modular workflow, in which mineral content evaluation and porosity calculation are implemented as independent, decoupled procedures. The coal matrix is also typically treated as a single homogeneous component. Such simplifications constrain interpretation accuracy and render existing approaches insufficient to meet the demands of deep CRG exploration and development. By coupling multi-scale laboratory experimental data with logging response characteristics, the method proposed in this work incorporates the coal matrix as an independent component into the volumetric model, enabling the simultaneous quantitative evaluation of inorganic minerals, organic matrix, and pore fluids.
Future work will focus on establishing a classification-based logging evaluation system for CRG reservoirs, with coal rank, ash yield, and maceral composition as core potential classification dimensions. The specific classification criteria and supporting parameter calibration system require further systematic research based on samples across diverse geological settings. On this basis, multi-source logging data such as elemental and image logs can be further integrated to improve the log-based identification accuracy of coal-matrix macerals and proximate composition parameters, so as to build a fully integrated well-log evaluation framework linking mineral composition, coal quality attributes, pore structure, and gas-bearing properties, and provide more robust technical support for refined evaluation and efficient development of deep CRG reservoirs.

4.2.4. Limitations of This Study

The findings of this study exhibit pronounced regional specificity. From a methodological perspective, the three-component logging volumetric framework of “coal matrix–inorganic minerals–pore fluids” proposed in this study is universally applicable in principle, and its core logic can be extended to coal-rock gas reservoirs with different geological backgrounds. However, limited by the sample coverage, the compositional quantitative relationships, coal-matrix framework response parameters, and variable framework variation patterns calibrated in this work are region-specific. They are primarily applicable to the medium–high rank No. 8 coal seam of the Benxi Formation in the study area (corresponding to Ro values above 1.4%).
For reservoirs with different geological settings, targeted parameter calibration can be carried out under the three-component model framework: (1) For reservoirs with different coal ranks, the aromatization degree and molecular compaction degree of the coal matrix differ fundamentally. The baseline value and variation range of coal-matrix framework parameters need to be recalibrated based on local core samples. (2) For reservoirs with significantly different maceral compositions, the contribution weights of inertinite and vitrinite to the framework acoustic response will change accordingly, and the quantitative relationship between maceral content and framework parameters needs to be re-established. (3) For reservoirs with different burial histories and diagenetic evolution histories, the compaction degree and pore evolution law of coal rocks are different, and the compaction correction coefficient and empirical formula of porosity evolution should be adjusted correspondingly. The regional applicability of the above parameters still needs further validation with more core and logging data from diverse geological settings.
Regarding methodological applicability, the inorganic mineral contents in this study are calibrated predominantly using XRD and micro-CT datasets, which cannot be directly obtained in exploration and development wells in the absence of core samples. For practical field applications, integration of elemental logging data is recommended to enable continuous quantification of inorganic mineral contents and further improve the cross-well transferability of the model.
The proposed model is built on static experimental results and logging responses, and does not systematically incorporate controlling factors such as coal-rock stress sensitivity, fracture development, and bedding anisotropy. Accordingly, further model optimization is necessary prior to its application in structurally complex areas, steep structural belts, and highly heterogeneous reservoirs.

5. Conclusions

(1)
The No. 8 coal seam of the Benxi Formation in the study area is a medium- to high-rank coking coal. Its maceral composition is dominated by vitrinite, with an average content of 59.1%, followed by inertinite, with an average content of 27.1%. The inorganic minerals are mainly clay minerals, calcite, and quartz, which occur within the organic-matter matrix and fractures, forming a typical organic–inorganic composite rock system. The coal-matrix and mineral contents segmented by micro-CT show good agreement with proximate-composition, TOC, and XRD results, confirming the reliability of digital rock technology for accurate quantitative characterization of coal-rock components.
(2)
The density, acoustic-slowness, and compensated-neutron framework responses of the coal matrix all exhibit pronounced non-constant behaviour, mainly controlled by maceral composition and coalification degree. Owing to its highly aromatized, structurally compact nature and high elastic modulus, inertinite shows a significant negative correlation with the acoustic-slowness framework response, with R2 = 0.80. This relationship reveals the key control exerted by internal heterogeneity within the organic component on the petrophysical response of coal rocks.
(3)
The proposed three-component well-log volumetric model and dual-variable framework evaluation method for CRG reservoirs simultaneously account for changes in inorganic mineral composition and internal structural variations within the organic component. This approach effectively overcomes the limitations of traditional fixed-matrix models, which may produce negative porosity values and insufficient accuracy in coal-rock porosity calculation. The acoustic-slowness-based variable framework porosity model achieves good calculation accuracy, with an average relative error of 7.1%. In addition, the acoustic-slowness log is less affected by borehole enlargement, making it more suitable for well-log evaluation in coal-bearing strata.
(4)
The findings of this study are mainly applicable to medium- to high-rank No. 8 coal reservoirs of the Benxi Formation in the central-eastern Ordos Basin and therefore have clear regional specificity. For practical application and broader deployment, elemental logging is recommended to achieve continuous quantification of inorganic mineral contents in uncored intervals, thereby improving the lateral transferability of the model. The technical workflow developed in this study, comprising experimental characterization, component quantification, framework calibration, and porosity calculation, provides a reference framework for petrophysical modelling and refined well-log evaluation of deep CRG reservoirs.

Author Contributions

Conceptualization, Y.H. and J.G.; methodology, Y.H., J.G., D.L., and C.W.; software, J.G., D.L., J.Z., and L.T.; validation, C.W., J.G., and J.Z.; formal analysis, J.G., D.L., and K.M.; investigation, L.T. and K.M.; resources, Y.H. and J.Z.; data curation, J.Z.; writing—original draft preparation, Y.H. and J.G.; writing—review and editing, J.G.; visualization, K.M.; supervision, L.T. and C.W.; project administration, D.L.; funding acquisition, J.G. All authors have read and agreed to the published version of the manuscript.

Funding

This work was financially sponsored by the Oil & Gas Major Project (No. 2025ZD1400202), the Major Project of PetroChina Changqing Oilfield Company (No. 2026D3JS02), and the Open Fund of the Key Laboratory of Exploration, Technologies for Oil and Gas Resources, Ministry of Education (No. K2023-02).

Data Availability Statement

The original contributions presented in this study are included in the article. Further inquiries can be directed to the corresponding author.

Acknowledgments

The authors express their most sincere gratitude to the field workers.

Conflicts of Interest

Authors Yuting Hou, Jianhong Guo, Jinyu Zhou, Die Liu, Changsheng Wang, Lili Tian, and Kun Meng were employed by the company PetroChina Changqing Oilfield Company. The remaining authors declare that the research was conducted in the absence of any commercial or financial relationships that could be construed as potential conflicts of interest. The authors declare that this study received funding from PetroChina Changqing Oilfield Company. The funder was not involved in the study design, collection, analysis, interpretation of data, the writing of this article, or the decision to submit it for publication.

Abbreviations

The following abbreviations are used in this manuscript:
TOCTotal Organic Carbon
CBMCoalbed Methane
CRGCoal-Rock Gas
RoVitrinite Reflectance
CTComputed Tomography
XRDX-Ray Diffraction
REVRepresentative Elementary Volume
ROIRegion of Interest
SEMScanning Electron Microscopy
R2Coefficient of Determination
AREAverage Relative Error
MAEMean Absolute Error
RMSERoot Mean Square Error

References

  1. Moore, T.A. Coalbed methane: A review. Int. J. Coal Geol. 2012, 101, 36–81. [Google Scholar] [CrossRef] [Scilit]
  2. Vedachalam, N.; Srinivasalu, S.; Rajendran, G.; Ramadass, G.A.; Atmanand, M.A. Review of unconventional hydrocarbon resources in major energy consuming countries and efforts in realizing natural gas hydrates as a future source of energy. J. Nat. Gas. Sci. Eng. 2015, 26, 163–175. [Google Scholar] [CrossRef] [Scilit]
  3. Palmer, I. Coalbed methane completions: A world view. Int. J. Coal Geol. 2010, 82, 184–195. [Google Scholar] [CrossRef] [Scilit]
  4. Karacan, C.Ö.; Ruiz, F.A.; Cotè, M.; Phipps, S. Coal mine methane: A review of capture and utilization practices with benefits to mining safety and to greenhouse gas reduction. Int. J. Coal Geol. 2011, 86, 121–156. [Google Scholar] [CrossRef] [Scilit]
  5. Li, G.X.; Jia, C.Z.; Zhao, Q.; Zhou, T.Q.; Gao, J.L. Coal-rock gas accumulation mechanism and the whole petroleum system of coal measures. Pet. Explor. Dev. 2025, 52, 33–49. [Google Scholar] [CrossRef] [Scilit]
  6. Li, G.X.; Zhang, S.C.; He, H.Q.; He, X.X.; Zhao, Z.; Niu, X.B.; Xiong, X.Y.; Zhao, Q.; Guo, X.J.; Hou, Y.T.; et al. Coal-rock gas: Concept, connotation and classification criteria. Pet. Explor. Dev. 2024, 51, 897–911. [Google Scholar] [CrossRef] [Scilit]
  7. Zhou, L.H.; Li, Y.; Ding, R.; Xiong, X.Y.; Hou, W.; Li, Y.Z.; Ma, H.; Fu, H.J.; Du, Y.; Zhang, W.Q.; et al. Differential accumulation characteristics and production of coalbed methane/coal-rock gas: A case study of the No. 8 coal seam of the Carboniferous Benxi Formation in the Daji block, Ordos Basin, NW China. Pet. Explor. Dev. 2025, 52, 872–882. [Google Scholar] [CrossRef] [Scilit]
  8. Li, Y.; Tang, D.Z.; Wu, P.; Niu, X.L.; Wang, K.; Qiao, P.; Wang, Z.S. Continuous unconventional natural gas accumulations of Carboniferous-Permian coal-bearing strata in the Linxing area, northeastern Ordos basin, China. J. Nat. Gas. Sci. Eng. 2016, 36, 314–327. [Google Scholar] [CrossRef] [Scilit]
  9. Wen, S.M.; Zhou, K.; Lu, Q. A discussion on CBM development strategies in China: A case study of PetroChina Coalbed Methane Co., Ltd. Nat. Gas. Ind. B 2019, 6, 610–618. [Google Scholar] [CrossRef] [Scilit]
  10. Zhao, Z.; Liu, D.M.; Cai, Y.D.; Sun, F.R.; Zhou, Y.F. Pathways and challenges of the application of geophysical techniques to multifaceted coalbed methane reservoir characterization. Gondwana Res. 2025, 147, 164–183. [Google Scholar] [CrossRef] [Scilit]
  11. Li, S.; Qin, Y.; Tang, D.Z.; Shen, J.; Wang, J.J.; Chen, S.D. A comprehensive review of deep coalbed methane and recent developments in China. Int. J. Coal Geol. 2023, 279, 104369. [Google Scholar] [CrossRef] [Scilit]
  12. Yang, X.X.; Tang, S.H.; Xi, Z.D.; Zhang, S.H.; Zhang, Q.; Zhang, K.; Lin, D.L.; Wang, J. Dynamic evolution and differential enrichment of deep coalbed methane: A case study in Qinshui Basin. Int. J. Coal Geol. 2025, 299, 104696. [Google Scholar] [CrossRef] [Scilit]
  13. Jiang, W.P.; Zhang, P.H.; Li, D.D.; Li, Z.C.; Wang, J.; Duan, Y.N.; Wu, J.; Liu, N.N. Reservoir characteristics and gas production potential of deep coalbed methane: Insights from the no. 15 coal seam in shouyang block, Qinshui Basin, China. Unconv. Resour. 2022, 2, 12–20. [Google Scholar] [CrossRef] [Scilit]
  14. Chattaraj, S.; Mohanty, D.; Kumar, T.; Halder, G.; Mishra, K. Comparative study on sorption characteristics of coal seams from Barakar and Raniganj formations of Damodar Valley Basin, India. Int. J. Coal Geol. 2019, 212, 103202. [Google Scholar] [CrossRef] [Scilit]
  15. Li, H.Q.; Chen, S.D.; Tang, D.Z.; Tang, S.L.; Yang, J.S. Gas content evaluation in deep coal seam with an improved method and its geological controls. Front. Earth Sci. 2024, 18, 623–636. [Google Scholar] [CrossRef] [Scilit]
  16. Clarkson, C.R.; Bustin, R.M. The effect of pore structure and gas pressure upon the transport properties of coal: A laboratory and modeling study. 1. Isotherms and pore volume distributions. Fuel 1999, 78, 1333–1344. [Google Scholar] [CrossRef] [Scilit]
  17. Pan, Z.J.; Connell, L.D. A theoretical model for gas adsorption-induced coal swelling. Int. J. Coal Geol. 2007, 69, 243–252. [Google Scholar] [CrossRef] [Scilit]
  18. Hou, X.W.; Zhu, Y.M.; Wang, Y.; Liu, Y. Experimental study of the interplay between pore system and permeability using pore compressibility for high rank coal reservoirs. Fuel 2019, 254, 115712. [Google Scholar] [CrossRef] [Scilit]
  19. Lu, F.C.; Gao, J.L.; Liu, J.J.; Zhang, X.B.; Wang, C.X.; Liu, Y.P. Characterization of the coal pore system by resistivity and NMR methods. Energy Sources Part A 2022, 44, 2604–2617. [Google Scholar]
  20. Zhao, Z.; Xu, W.L.; Zhao, Z.Y.; Yi, S.W.; Yang, W.; Zhang, Y.Q.; Sun, Y.S.; Zhao, W.B.; Shi, Y.H.; Zhang, C.L.; et al. Geological characteristics and exploration breakthroughs of coal rock gas in Carboniferous Benxi Formation, Ordos Basin, NW China. Pet. Explor. Dev. 2024, 51, 262–278. [Google Scholar] [CrossRef] [Scilit]
  21. Han, W.L.; Li, Y.; Wang, Y.B.; Ni, X.M.; Wang, L.; Zhou, Y.F. Characterization of Coal Fines and their Production Controlling Factors: A Case Study from Southern Qinshui Basin, China. Nat. Resour. Res. 2023, 32, 1777–1794. [Google Scholar] [CrossRef]
  22. Liu, S.M.; Liu, R.; Tang, S.H.; Zhao, C.L.; Liu, B.J.; Diao, J.W.; Xi, Z.D. Quantitative measurement on coal components through the interpretation model of geophysical log: A case study from the Qaidam Basin, NW China. Energy Explor. Exploit. 2021, 39, 2027–2044. [Google Scholar] [CrossRef] [Scilit]
  23. Ji, Y.S.; Li, S.; Hou, W.; Li, Y.Z.; Feng, P.; Yang, S.Z.; Zhou, H.M. Quantitative Evaluation of Deep Coalbed Methane Content: A Logging Data-Driven Approach. Geol. J. 2025, 61, 2072–2086. [Google Scholar] [CrossRef] [Scilit]
  24. Gong, F.; Zou, G.G.; Zhang, Z.J.; Peng, S.P.; Wang, G.W.; Chen, H. An anisotropic rock physics modeling for the coalbed methane reservoirs and its applications in anisotropy parameter prediction. J. Appl. Geophys. 2024, 225, 105381. [Google Scholar] [CrossRef] [Scilit]
  25. Wang, X.Y.; Shen, W.J.; Yang, X.; Li, N.; Chen, H.C.; Zhang, Z.R. Review and Outlook of Pore Structure Characteristics and Flow Mechanisms in Deep Coalbed Methane Reservoirs: Advances and Perspectives. Energy Fuels 2026, 40, 7197–7213. [Google Scholar] [CrossRef] [Scilit]
  26. Jia, Q.F.; Liu, D.M.; Cai, Y.D.; Fang, X.L.; Li, L.J. Petrophysics characteristics of coalbed methane reservoir: A comprehensive review. Front. Earth Sci. 2021, 15, 202–223. [Google Scholar] [CrossRef] [Scilit]
  27. Ghosh, S.; Chatterjee, R.; Paul, S.; Shanker, P. Designing of plug-in for estimation of coal proximate parameters using statistical analysis and coal seam correlation. Fuel 2014, 134, 63–73. [Google Scholar] [CrossRef] [Scilit]
  28. Wang, Z.H.; Cai, Y.D.; Liu, D.M.; Lu, J.; Qiu, F.; Hu, J.H.; Li, Z.T.; Gamage, R.P. A review of machine learning applications to geophysical logging inversion of unconventional gas reservoir parameters. Earth-Sci. Rev. 2024, 258, 104969. [Google Scholar] [CrossRef] [Scilit]
  29. Guo, J.H.; Zhang, Z.S.; Guo, G.S.; Xiao, H.; Zhao, Q.; Zhang, C.M.; Lv, H.Y.; Zhu, Z.M.; Wang, C. Optimized random forest method for 3D evaluation of coalbed methane content using geophysical logging data. ACS Omega 2024, 9, 35769–35788. [Google Scholar] [CrossRef] [Scilit] [PubMed]
  30. Guo, J.H.; Zhang, Z.S.; Xiao, H.; Zhang, C.M.; Zhu, L.Q.; Wang, C. Quantitative interpretation of coal industrial components using a gray system and geophysical logging data: A case study from the Qinshui Basin, China. Front. Earth Sci. 2023, 10, 1031218. [Google Scholar] [CrossRef] [Scilit]
  31. Shi, J.X.; Zeng, L.B.; Dong, S.Q.; Wang, J.P.; Zhang, Y.Z. Identification of coal structures using geophysical logging data in Qinshui Basin, China: Investigation by kernel Fisher discriminant analysis. Int. J. Coal Geol. 2020, 217, 103314. [Google Scholar] [CrossRef] [Scilit]
  32. Zhong, R.Z.; Johnso, R.L.; Chen, Z.W. Using machine learning methods to identify coal pay zones from drilling and logging-while-drilling (LWD) data. SPE J. 2020, 25, 1241–1258. [Google Scholar] [CrossRef] [Scilit]
  33. Zhou, K.Y.; Sun, F.R.; Yang, C.; Qiu, F.; Wang, Z.H.; Xu, S.B.; Chen, J.M. Evaluation of Deep Coalbed Methane Potential and Prediction of Favorable Areas within the Yulin Area, Ordos Basin, Based on a Multi-Level Fuzzy Comprehensive Evaluation Method. Processes 2024, 12, 820. [Google Scholar] [CrossRef] [Scilit]
  34. Wei, X.S.; Chen, H.D.; Zhang, D.F.; Dai, R.; Guo, Y.R.; Chen, J.P.; Ren, J.F.; Liu, N.; Luo, S.S.; Zhao, J.X. Gas exploration potential of tight carbonate reservoirs: A case study of Ordovician Majiagou Formation in the eastern Yi-Shan slope, Ordos Basin, NW China. Pet. Explor. Dev. 2017, 44, 347–357. [Google Scholar] [CrossRef] [Scilit]
  35. Su, W.; Yao, Y.B.; Li, P.J.; Liu, D.M.; Ma, L.M.; Sun, X.X.; Zheng, J.J. Genesis and distribution of deep bauxite within coal-bearing strata: Insights from the Shenmu–Jiaxian Block, Ordos Basin. Int. J. Coal Geol. 2026, 321, 105022. [Google Scholar] [CrossRef] [Scilit]
  36. Zhou, Y.; Chang, D.S.; Zheng, J.X.; Zhu, D.X.; Nie, X. A fast workflow for automatically extracting the apparent attitude of fractures in 3-D digital core images. Processes 2023, 11, 2517. [Google Scholar] [CrossRef] [Scilit]
  37. Wyllie, M.R.J.; Gregory, A.R.; Gardner, G.H.F. An experimental investigation of factors affecting elastic wave velocities in porous media. Geophysics 1958, 23, 459–493. [Google Scholar] [CrossRef] [Scilit]
  38. Kamel, M.H.; Mabrouk, W.M.; Bayoumi, A.I. Porosity estimation using a combination of Wyllie–Clemenceau equations in clean sand formation from acoustic logs. J. Pet. Sci. Eng. 2002, 33, 241–251. [Google Scholar] [CrossRef] [Scilit]
  39. Herron, M.M. Mineralogy from geochemical well logging. Clays Clay Miner. 1986, 34, 204–213. [Google Scholar] [CrossRef] [Scilit]
  40. Guo, J.H.; Wang, C.S.; Wang, Y.M.; Zhang, W.J.; Zhao, Q.; Wei, H.Y.; Nie, X. A shale-oil reservoir multi-mineral inversion method based on well-logging data using an improved Random-Forest approach: Methodology and application. Appl. Comput. Geosci. 2026, 29, 100334. [Google Scholar] [CrossRef] [Scilit]
  41. Yang, X.M.; Zeng, J.B.; Liu, D.; Shi, Y.H.; Gao, H.T.; Tian, L.L.; He, Y.F.; Zhang, F.S.; Su, J.T. Characteristics of Deep Coal Reservoirs Based on Logging Parameter Responses and Laboratory Data: A Case Study of the Logging Response Analysis of Reservoir Parameters Is Carried Out in Ordos Basin, China. Processes 2025, 13, 2062. [Google Scholar] [CrossRef] [Scilit]
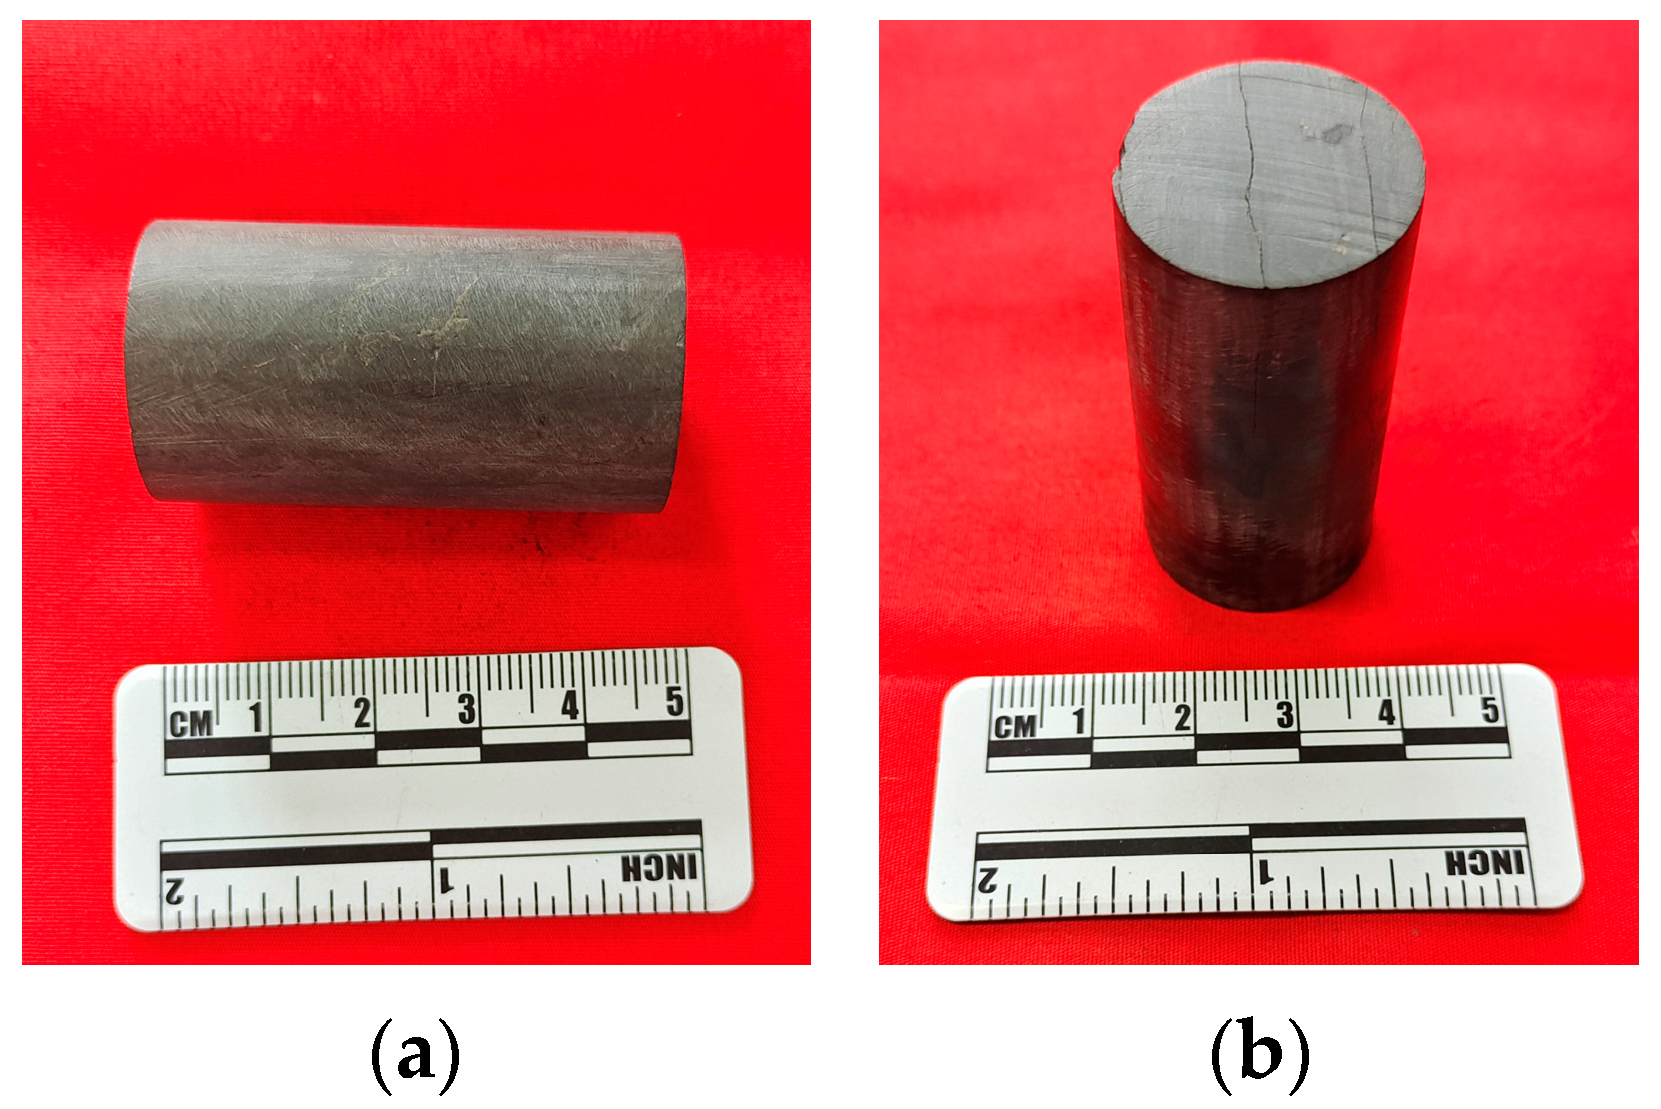
Figure 1. Coal-rock core samples from the study area. (a) Radial section of sample M172-16; (b) longitudinal section of sample M172-16.
Processes 14 02456 g001
Figure 2. Integrated thin-section, SEM, and maceral characteristics of a representative coal-rock sample. (a) Plane-polarized cast thin-section characteristics. (b) Reflected-light characteristics of the cast thin section. (c) SEM microscopic characteristics, field of view 1. (d) SEM microscopic characteristics, field of view 2. (e) Microscopic image of sample M172-3. (f) Pie chart showing the maceral composition of the No. 8 coal seam.
Processes 14 02456 g002
Figure 3. XRD preprocessing results and quantitative characteristics of inorganic mineral composition in coal-rock samples from the study area. (a) Original XRD pattern showing high background and strong interference. (b) Corrected XRD pattern after background subtraction. (c) Bar chart showing the distribution of inorganic mineral contents among different samples.
Processes 14 02456 g003
Figure 4. Schematic illustration of three-dimensional digital core reconstruction and component segmentation for coal-rock samples from the study area.
Processes 14 02456 g004
Figure 5. Three-dimensional digital core reconstruction and multi-component segmentation results for full-diameter samples from the study area. (a) Three-dimensional CT-reconstructed structure of a full-diameter sample. (b) Component segmentation results based on the three-dimensional CT reconstruction of the full-diameter sample.
Processes 14 02456 g005
Figure 6. Cross-plots of fixed carbon plus volatile matter in proximate composition versus TOC and coal-matrix content segmented by micro-CT.
Processes 14 02456 g006
Figure 7. Cross-plots of ash yield in proximate composition versus mineral contents obtained from microscopic image counting and micro-CT segmentation.
Processes 14 02456 g007
Figure 8. Calibration results of porosity-log framework responses of the coal matrix in CRG reservoirs from the study area.
Processes 14 02456 g008
Figure 9. Cross-plot of porosity calculated using the acoustic-slowness-based variable framework model versus core-measured porosity.
Processes 14 02456 g009
Figure 10. Cross-plot of acoustic-slowness framework response versus inertinite content.
Processes 14 02456 g010
Figure 11. Schematic diagram of the volumetric model for CRG reservoirs. (a) Coal-rock composition from the microscopic perspective of the digital core. (b) CRG volumetric model from the perspective of conventional hydrocarbon reservoirs.
Processes 14 02456 g011
Figure 12. Cross-plots between the three porosity logs and coal-rock core porosity. (a) Acoustic-slowness log. (b) Compensated-density log. (c) Compensated-neutron log.
Processes 14 02456 g012
Figure 13. Correlation analysis between the acoustic-slowness framework response of the coal matrix and proximate-composition parameters.
Processes 14 02456 g013
Figure 14. Integrated well-log interpretation results for the Benxi Formation CRG reservoir in Well Q35, Ordos Basin. (From left to right, the tracks show geological horizon, depth, natural gamma ray–spontaneous potential–calliper curves, deep and shallow resistivity curves, acoustic slowness–compensated density–compensated neutron curves, mineral and coal-matrix profiles based on the three-component volumetric model, interpreted clay-mineral content, interpreted quartz content, interpreted carbonate-mineral content, and interpreted pyrite content. Red points indicate core-measured values).
Processes 14 02456 g014
Table 1. Summary of representative images, segmentation results, final threshold ranges, and reconstructed spatial distributions of different components from a three-dimensional digital core perspective.
Segmentation TypeCoal MatrixClayQuartzFeldsparCalcitePyritePore Fracture
Typical ImageProcesses 14 02456 i001Processes 14 02456 i002Processes 14 02456 i003Processes 14 02456 i004Processes 14 02456 i005Processes 14 02456 i006Processes 14 02456 i007
Segmentation ResultsProcesses 14 02456 i008Processes 14 02456 i009Processes 14 02456 i010Processes 14 02456 i011Processes 14 02456 i012Processes 14 02456 i013Processes 14 02456 i014
Threshold Range31~5550~129154~200154~190146~243219~2550~30
Digital Core Segmentation ResultsProcesses 14 02456 i015Processes 14 02456 i016Processes 14 02456 i017Processes 14 02456 i018Processes 14 02456 i019Processes 14 02456 i020Processes 14 02456 i021
Table 2. Compensated-density and acoustic-slowness framework responses of different inorganic minerals.
Component TypeFramework Value
Compensated Density
g·cm−3
Acoustic Slowness
μs·m−1
Clay2.43284
Quartz2.65182
Feldspar2.62164
Carbonate2.73148
Pyrite4.99128
Disclaimer/Publisher’s Note: The statements, opinions and data contained in all publications are solely those of the individual author(s) and contributor(s) and not of MDPI and/or the editor(s). MDPI and/or the editor(s) disclaim responsibility for any injury to people or property resulting from any ideas, methods, instructions or products referred to in the content.