Article

Manufacturing Service Composition Optimization for Coating Equipment Wallboards Using an Improved NSGA-III Algorithm


1
School of Engineering, Changchun Normal University, Changchun 130032, China
2
Faculty of Printing, Packaging Engineering and Digital Media Technology, Xi’an University of Technology, Xi’an 710054, China
*
Authors to whom correspondence should be addressed.
Processes 2026, 14(15), 2425; https://doi.org/10.3390/pr14152425
Submission received: 16 June 2026 / Revised: 20 July 2026 / Accepted: 24 July 2026 / Published: 27 July 2026

Abstract

To address the low production efficiency and insufficient cross-enterprise collaboration in wallboard outsourcing for coating equipment manufacturing, this study proposes a wallboard manufacturing service composition optimization method based on an improved NSGA-III algorithm. First, the service composition optimization problem in wallboard manufacturing is analyzed, and a mathematical model for wallboard outsourcing service composition optimization is established. Next, an improved NSGA-III method integrating Latin hypercube sampling, greedy local search, and Lévy flight-based global search strategies is proposed, alongside a similarity measurement method for the objective-space structure based on statistical features and distribution differences, which is used to select benchmark functions that closely match the characteristics of actual business data. Finally, comparative experiments using benchmark functions and real-world business data are conducted to verify the effectiveness and superiority of the proposed method in solving service composition optimization problems. The experimental results demonstrate that the proposed method achieves excellent performance in both solution quality and computational efficiency, significantly improving the utilization of wallboard outsourcing manufacturing resources across enterprises and facilitating efficient business process flows.

1. Introduction

Wallboards are the core components of coating equipment, serving as the key foundation to ensure the stable transport of substrates and the consistency of coating quality [1]. Under the networked collaborative manufacturing paradigm, subcontracted tasks are typically divided into multiple sequentially constrained subtasks according to the processing procedures. Each subtask requires matching with heterogeneous manufacturing service resources, which significantly increases the complexity of service selection and collaborative scheduling. In this context, identifying the optimal service composition from a large pool of candidate manufacturing services while satisfying multiple constraints through service composition optimization methods has become a critical issue for enabling cross-enterprise collaborative utilization of wall-board subcontracted manufacturing resources and improving the efficiency of business workflows.
Service composition optimization has become an important research direction in the manufacturing field, attracting extensive attention from both domestic and international scholars and being applied to a variety of manufacturing tasks. Yang et al. [2] proposed a service composition optimization model based on an improved particle swarm optimization combined with the VIKOR method, providing a green manufacturing-oriented optimization solution for the electric drive systems of new energy vehicles. Tang et al. [3] integrated particle swarm optimization with a genetic algorithm to optimize the allocation of critical and ordinary manufacturing subtasks, enhancing the completion of complex aerospace component production tasks. Sun et al. [4] introduced a multi-objective service composition decision model considering sustainability, and employed a multi-objective artificial hummingbird algorithm on the Alibaba Cloud Manufacturing platform to optimize complex robotic manufacturing tasks, demonstrating advantages in solution quality, efficiency, and stability. Xu et al. [5] developed a scheduling optimization model based on an improved non-dominated sorting genetic algorithm III, showing strong convergence and solution diversity in the apparel and textile industry. Pu et al. [6] proposed an improved orangutan optimization algorithm, verifying its rapid solution capability in complex machine tool workshops. In this research context, the composition optimization of wallboards—the core components of coating equipment—naturally emerges as a critical focus in studies on manufacturing service composition.
From the perspective of algorithm classification, existing service composition optimization methods can be mainly categorized into approaches based on evolutionary algorithms [7], swarm intelligence [8], and deep learning [9]. Liao et al. [10] addressed the issues of local optima entrapment and limited convergence efficiency in service composition by proposing an improved polar bear optimization algorithm, enhancing multi-objective search performance through the introduction of dynamic vision and mutation strategies. Yuan et al. [11] integrated neighborhood search and simulated annealing mechanisms within the NSGA-II framework to improve solution diversity and accelerate convergence. Liu et al. [12] combined fuzzy sets with an enhanced NSGA-III algorithm to handle uncertain demands, thereby improving optimization robustness in complex scenarios. In the domain of swarm intelligence algorithms, Zhou et al. [13] proposed an improved sparrow search algorithm that effectively strengthens global search capability and convergence stability. Zhang et al. [14] developed an improved Harris hawk optimization algorithm, introducing a one-dimensional Logistic chaotic system and multi-neighborhood search strategies to enhance solution quality and robustness. Regarding deep learning-based methods, Wang He et al. [15] introduced a convolutional neural network to construct a dynamic satisfaction model and combined it with an improved genetic algorithm to optimize service composition. Zhao et al. [16] proposed a graph-structured neural network algorithm, transforming the composition optimization problem into a continuous optimization task and mapping it back to discrete solutions, suitable for four-dimensional multi-objective problems. Cai et al. [17] combined ant colony optimization with a backpropagation neural network to optimize cloud manufacturing knowledge service composition, achieving accelerated search and improved composition accuracy.
In summary, existing studies reveal that the continuous growth of service scale and the accumulation of constraints have driven service composition problems toward increasingly complex optimization scenarios, involving high-dimensional objectives and strongly coupled constraints. Existing methods exhibit limitations in addressing such problems: evolutionary and swarm intelligence algorithms are prone to local optima and yield solution sets of limited quality, while deep learning-based approaches are insufficient in constraint modeling and search efficiency. Therefore, this study adopts the NSGA-III algorithm as the base method, given its ability to maintain a uniformly distributed solution set in high-dimensional multi-objective problems and its strong potential for constraint handling. An improved NSGA-III method for wallboard manufacturing service composition optimization is proposed: first, the composition optimization problem in wallboard manufacturing is analyzed and formulated mathematically; next, an improved NSGA-III algorithm integrating Latin hypercube sampling, greedy local search, and Lévy flight-based global search strategies is developed; finally, comparative experiments using benchmark functions and real-world business data are conducted to validate the efficiency and superiority of the proposed method in solving service composition optimization problems.

2. Materials and Methods

2.1. Analysis of Wallboard Composition Optimization Problem

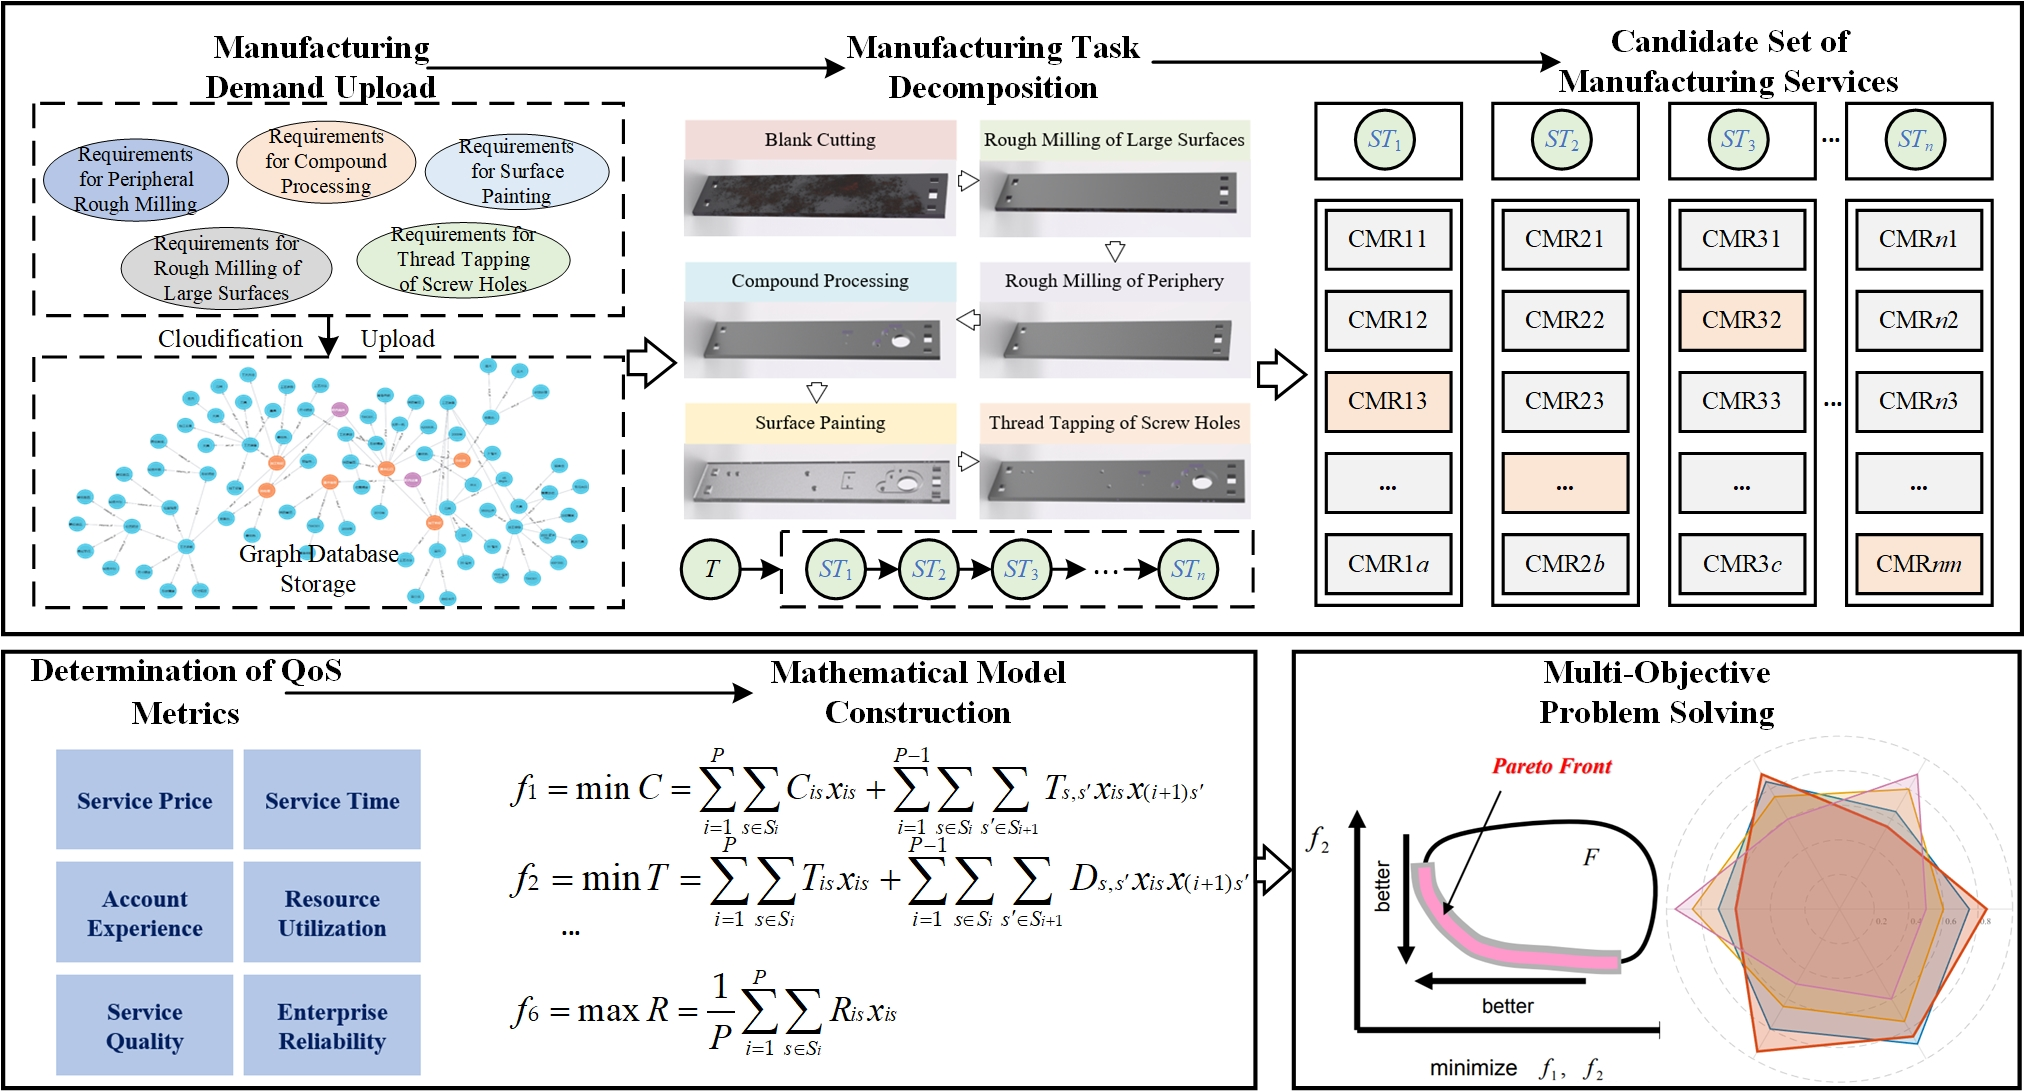
Under the networked collaborative manufacturing paradigm, leading enterprises often rely on collaborative partners with the necessary manufacturing capabilities to complete wallboard production, due to limitations in their own production capacity or specialized equipment. Consequently, enterprises upload their manufacturing demands to the collaborative platform, which converts them into specific manufacturing tasks. The platform decomposes each manufacturing task into multiple process-level subtasks according to the processing procedures, with each subtask corresponding to a candidate set of manufacturing services [18], containing all services capable of meeting the process requirements. By selecting appropriate services from each candidate set and considering the optimization objectives, the platform ultimately determines the overall optimal manufacturing service composition. The workflow of wallboard subcontracted manufacturing service composition optimization is illustrated in Figure 1.
(1)
Wallboard manufacturing service upload and task decomposition
Leading enterprises upload manufacturing demands to the collaborative platform, which are converted into a manufacturing task T, and then decomposed into n subtasks (ST1, ST2, …, STn) based on the wallboard processing procedures. Each subtask corresponds to m manufacturing services (CMRn1, CMRn2, …, CMRnm) that satisfy the processing requirements.
(2)
Construction of the mathematical model for manufacturing service composition optimization
QoS indicators such as service cost, time, quality, and enterprise reliability are investigated and selected to quantify the matching relationships between subtasks and candidate services. A comprehensive objective function and associated constraints are then established, providing a rigorous mathematical formulation for multi-objective optimization.
(3)
Multi-Objective solution of manufacturing service composition optimization
For the established mathematical model, a multi-objective solution method is designed to obtain the Pareto-optimal solution set. By iteratively optimizing the objective functions of each service composition, the approach achieves coordinated optimization of cost, time, reliability, and other indicators, providing the optimal service composition scheme for wallboard manufacturing.

2.2. Construction of the Mathematical Model for Wallboard Manufacturing Service Composition Optimization

The wallboard processing workflow sequentially consists of six major operations: blank cutting, rough face milling, rough edge milling, composite processing, screw hole tapping, and surface painting, exhibiting the typical characteristics of sequential discrete manufacturing. Based on existing studies on discrete manufacturing service composition optimization and an investigation of wallboard subcontracting practices in the coating equipment manufacturing industry, six evaluation indicators, including service time, service cost, service quality, experience with key clients, resource utilization, and service reliability, are selected to establish the wallboard subcontracted manufacturing service composition optimization model. The objective function is formulated as follows:
(1)
Service Cost
This attribute reflects the overall economic expenditure incurred during the execution of manufacturing services, with the minimization of total service cost set as the optimization objective.
f 1 = min C = i = 1 P s S i C i s x i s + i = 1 P 1 s S i s S i + 1 T s , s x i s x ( i + 1 ) s
In the equation, f1 represents the objective function for minimizing the total cost; C denotes the total production cost; P is the total number of tasks; i refers to the i-th production task; Si represents the set of process steps available for task i; s and s′ denote the specific process steps selected for the current task and the subsequent task, respectively; xis is a binary decision variable, taking the value 1 if task i is assigned to process step s, and 0 otherwise; Cis denotes the direct production cost of task i at process step s; Ts,s′ represents the material transportation cost from process step s to s′; xisx(i+1)s indicates the process step linkage between consecutive tasks, where the corresponding transportation cost is incurred only when the two successive tasks are assigned to process steps s and s′, respectively.
(2)
Service Time
This attribute measures the overall time required for manufacturing services to complete all tasks, with the minimization of total service time set as the optimization objective.
f 2 = min T = i = 1 P s S i T i s x i s + i = 1 P 1 s S i s S i + 1 D s , s x i s x ( i + 1 ) s
In the equation, f2 represents the objective function for minimizing the total processing time; T denotes the total time required to complete all manufacturing tasks; Tis represents the processing time of task i at process step s (i.e., the production duration); and Ds,s denotes the transportation time from process step s to process step s′.
(3)
Service Quality
This attribute reflects the execution quality of each manufacturing subtask, with the maximization of overall service quality set as the optimization objective.
f 3 = max Q = 1 P i = 1 P s S i Q i s x i s
In the equation, f3 represents the objective function for maximizing processing quality; Q denotes the average quality of all production tasks (i.e., the overall quality level); and Qis represents the processing quality of task i at process step s.
(4)
Key Client Experience
This attribute reflects the experience accumulated by the manufacturing service provider in serving key clients during historical operations, with the maximization of overall key client experience set as the optimization objective.
f 4 = max E = 1 P i = 1 P s S i E i s x i s
In the equation, f4 represents the objective function for maximizing key client experience; E denotes the overall key client experience level across all production tasks; and Eis represents the key client service experience indicator of the account manager for task i at process step s.
(5)
Resource Utilization
This attribute characterizes the efficiency of equipment and related resource usage during the execution of manufacturing services, with the maximization of resource utilization set as the optimization objective.
f 5 = max U = 1 P i = 1 P s S i U i s x i s
In the equation, f5 represents the objective function for maximizing resource utilization; U denotes the average resource utilization across all production tasks (i.e., the overall level of resource utilization); and Uis represents the resource utilization during the execution of task i at process step s.
(6)
Service Reliability
This attribute measures the ability of manufacturing services to consistently complete tasks according to the agreed conditions during execution, with the maximization of service reliability set as the optimization objective.
f 6 = max R = 1 P i = 1 P s S i R i s x i s
In the equation, f6 represents the objective function for maximizing service reliability; R denotes the average reliability of services used across all production tasks (i.e., the overall service reliability level); and Ris represents the service reliability during the execution of task i at process step s.
Based on the above objective functions, the following constraints are established:
(1) Each subtask i must be assigned to exactly one enterprise selected from its candidate enterprise set Si.
s S i x i s = 1 , i = 1 , 2 , , P
(2) Service cost must not exceed the predetermined budget, service time must not exceed the delivery schedule, and service quality must meet or exceed the client’s requirements. In addition, the service provider is required to possess relevant key client experience, resource utilization must not fall below a reasonable threshold, and service reliability must satisfy the specified requirements.
C C max T T max Q Q min E E min U U min R R min

2.3. Service Composition Optimization Solving Based on an Improved NSGA-III

2.3.1. NSGA-III Algorithm and Improvement Strategies

The NSGA-III algorithm, which introduces a reference point-based guidance strategy, has been widely applied in multi-objective optimization, particularly for high-dimensional problems [19]. However, in the context of multi-objective and multi-constraint wallboard manufacturing service composition optimization, there is still room for improvement in the quality of population initialization and the subsequent fine-grained search capability. To address this issue, this paper proposes an improved NSGA-III solution method for wallboard manufacturing service composition optimization by enhancing both the population initialization quality and the search capability.
(1)
Diversity enhancement strategy based on Latin hypercube sampling
In the context of wallboard manufacturing service composition optimization, the conventional random initialization strategy of NSGA-III may lead to insufficient diversity and uneven distribution of the initial population, especially under complex service selection constraints. To address this issue, a Latin Hypercube Sampling (LHS)-based initialization strategy is introduced to improve the diversity and representativeness of the initial population. Specifically, the initial population is generated as follows:
x i , d = x d min + π d ( i ) u i , d N ( x d max x d min )
In the equation, π d ( i ) represents a random permutation sequence in the d-th dimension; u i , d is a random perturbation term following a uniform distribution over the interval [0, 1]; and N denotes the population size. In this study, the population size is set to N = 200. The LHS strategy is performed only during the initialization stage to generate a more uniformly distributed initial population and enhance the global search capability of the algorithm.
(2)
Local search enhancement strategy based on greedy search mechanism
Although NSGA-III exhibits strong global exploration capability, its local exploitation ability is relatively limited when solving wallboard manufacturing service composition optimization problems. To further enhance the search efficiency in promising regions of the solution space, a greedy local search mechanism is incorporated into the evolutionary process. After crossover and mutation, the greedy local search is probabilistically applied to the offspring population. The local search process is expressed as:
x i = x i ( t ) + Δ x i
In the equation, x i ( t ) denotes the current individual at generation t, x i represents the generated neighboring solution, and Δ x i denotes the neighborhood perturbation vector. Specifically, Δ x i is generated by randomly selecting one subtask from the current service composition solution and replacing its assigned manufacturing service with another feasible candidate service. Since the perturbation is performed only within the feasible candidate service set, the generated neighboring solution always satisfies the service composition constraints, ensuring that each subtask is assigned to exactly one manufacturing service.
To realize the greedy search mechanism, the neighboring solution is evaluated according to the Pareto dominance criterion. The neighboring solution replaces the current solution only if it dominates the original individual, that is, it improves at least one objective without deteriorating any other objective; otherwise, the current solution is retained. This strategy effectively enhances the local exploitation capability while maintaining the convergence performance of the algorithm. To balance computational efficiency and local search capability, the greedy local search is applied with an execution probability of p g = 0.3.
(3)
Global search enhancement strategy based on Lévy flight
To further enhance the global exploration capability of NSGA-III and reduce the probability of premature convergence, a Lévy flight strategy is incorporated into the evolutionary process. Owing to its heavy-tailed distribution, Lévy flight enables occasional long-distance exploration, thereby improving the algorithm’s ability to escape local optima and maintain population diversity. The Lévy flight process is expressed as:
Let x i ( t ) be an individual in the t-th generation population. A new candidate solution is generated based on the Lévy flight mechanism, and its update is defined as follows:
S = α L ( β )
In the equation, S denotes the perturbation step generated by the Lévy flight, and L(β) represents a random variable following the Lévy distribution; α is the step-size scaling factor, and β is the Lévy flight exponent. In this study, the Lévy flight exponent is set to β = 1.5, and the step-size scaling factor is set to α = 0.01.
It should be noted that the generated Lévy step is used to determine the perturbation magnitude during neighborhood search rather than directly updating the binary decision variables. According to the generated perturbation step, one or more subtasks are randomly selected, and their assigned manufacturing services are replaced with other feasible candidate services. Since the perturbation is always performed within the feasible candidate service set, the generated solutions naturally satisfy the service composition constraints, ensuring that each subtask is assigned to exactly one manufacturing service. To balance global exploration capability and computational efficiency, the Lévy flight strategy is activated only when the population diversity falls below a predefined threshold. In this study, the diversity threshold is set to θ = 0.2.

2.3.2. Improved NSGA-III Algorithm Framework

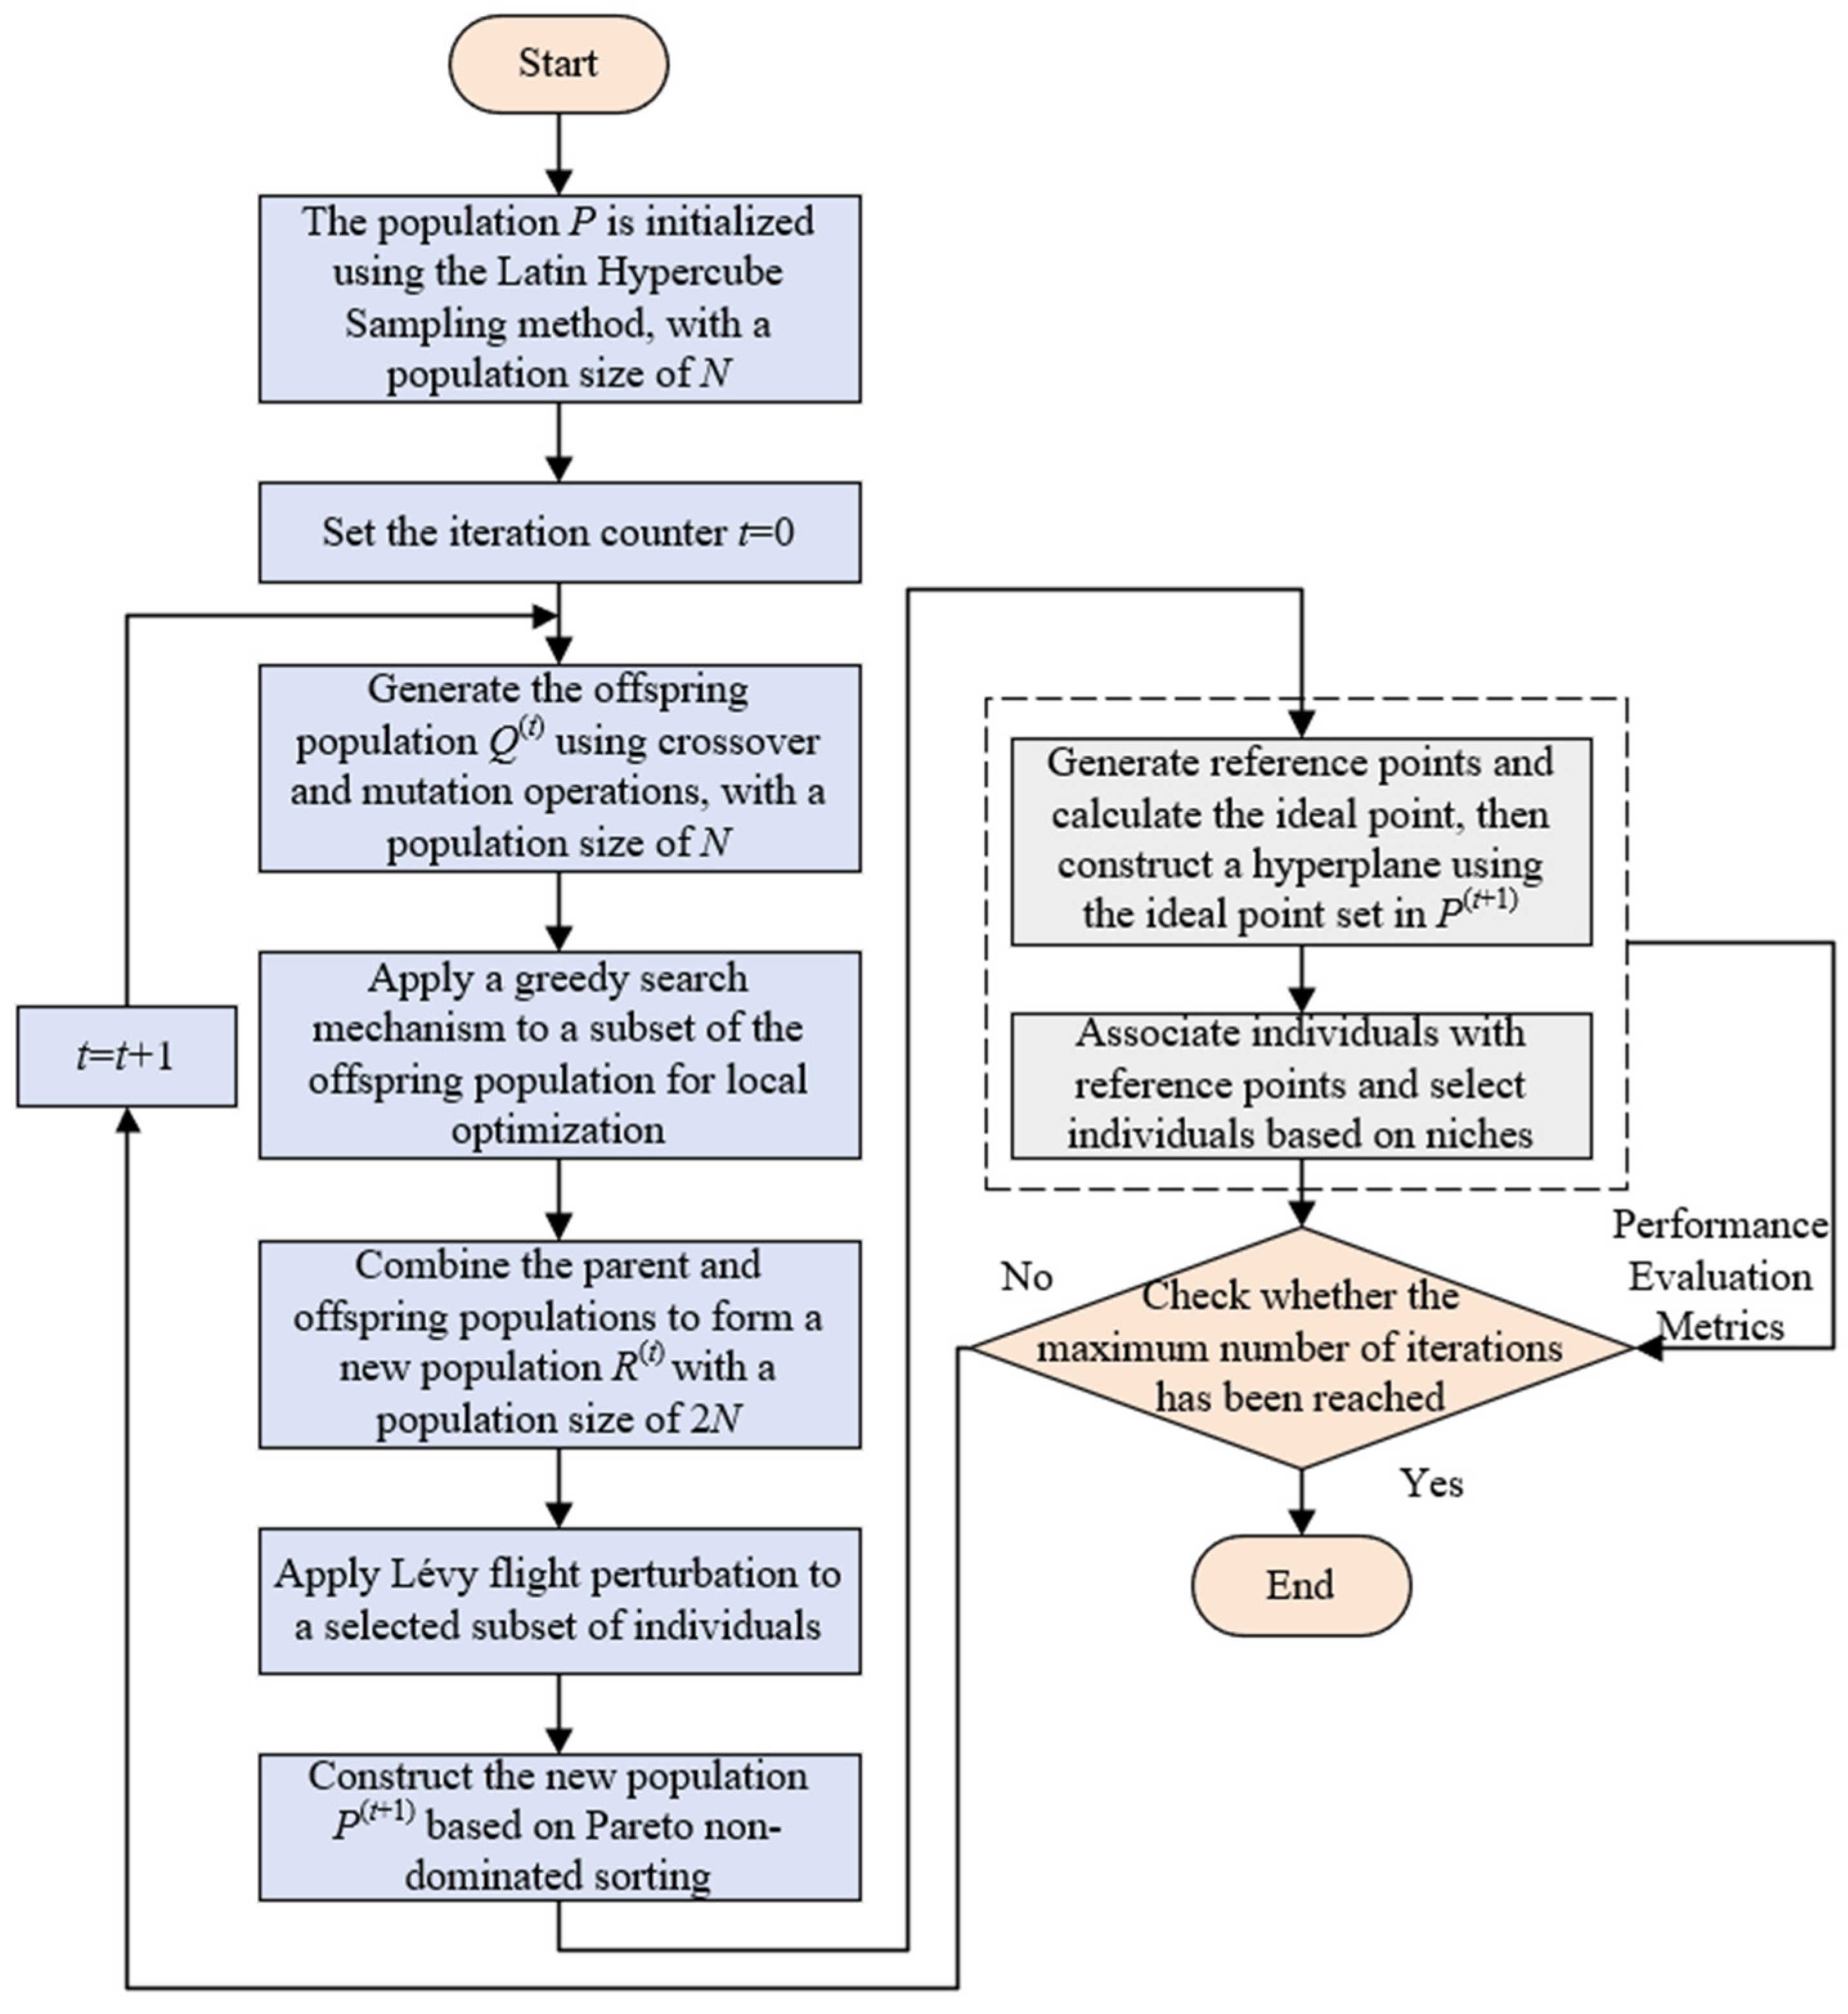
The improved NSGA-III solving method, which integrates the above three improvement strategies, is shown in Figure 2.
(1) Initialization: Set the population size N and the maximum number of generations Tmax. The initial population P(0) is generated using the Latin hypercube sampling method to enhance the uniformity of the initial solution distribution in the decision space.
(2) Offspring Generation: During the t-th generation, crossover and mutation operators are applied to the current population P(t) to produce the offspring population Q(t), thereby expanding the search directions and maintaining population diversity.
(3) Population Merging: The parent population P(t) and the offspring population Q(t) are merged to form the combined population R(t) = P(t)Q(t), which serves as the candidate solution set for subsequent selection.
(4) Non-dominated Sorting and Local Search Enhancement: Non-dominated sorting is performed on the combined population R(t), and a local search strategy based on a greedy search mechanism is applied to a subset of individuals to improve the local quality of solutions.
(5) Global Search Enhancement: For the selected individuals, a global search enhancement strategy based on Lévy flight is introduced. By generating multi-scale random step sizes, this strategy enables cross-region search and enhances the algorithm’s ability to escape from local optima.
(6) Population Update and Termination Check: Generate the next-generation population P(t+1) based on NSGA-III’s reference point association and environmental selection mechanism. If t < Tmax, increment the generation counter t = t + 1 and return to Step 2; otherwise, terminate the algorithm and output the final Pareto solution set.

2.4. Benchmark Function Selection Method

In the performance evaluation of multi-objective optimization algorithms, relying solely on real-world business datasets for comparative analysis often fails to produce sufficiently convincing experimental conclusions. Therefore, introducing standard benchmark functions with well-defined mathematical formulations and analytically tractable theoretical properties for control experiments has become a common practice in multi-objective optimization research. However, existing studies typically adopt a simplified principle of “matching only the number of objectives” when selecting benchmark functions, or rely on domain expertise for subjective specification. Few studies systematically analyze the consistency between practical business problems and benchmark functions in terms of the geometric structure of the objective space and the characteristics of objective conflicts. Consequently, this limits the relevance and interpretability of the conclusions drawn from comparative experiments.
The real-world business dataset, referred to as Business Data in this study, was collected from manufacturing service information provided by Shaanxi Beiren Printing Machinery Co., Ltd., a long-term industrial partner of our research group, together with data accumulated through long-term industrial investigations. The Business Data dataset consists of 25 manufacturing tasks and 173 manufacturing service providers, covering representative manufacturing service resources involved in the wallboard collaborative manufacturing process. Each manufacturing service provider is characterized by six QoS attributes, which are used to describe the comprehensive performance of manufacturing services. Since these QoS attributes have different units and value ranges, all attributes were normalized to the [0, 1] interval using the Min-Max normalization method before being used as inputs to the optimization model and for subsequent objective-space structural similarity analysis and algorithm performance evaluation.
To address the aforementioned limitations, this study proposes a target space structural similarity measurement method based on statistical features and distributional differences. The method provides a comprehensive characterization of the objective space from four aspects: location, scale, correlation structure, and overall distribution shape. Considering that the ZDT suite is only applicable to bi-objective problems and the UF suite mainly targets two- or three-dimensional optimization scenarios, this work focuses on the DTLZ and WFG benchmark function suites as candidate sets. A multidimensional structural similarity assessment is conducted between the wallboard outsourcing business objective functions and DTLZ1–DTLZ7 and WFG1–WFG9 in terms of geometric morphology of the objective space and Pareto front distributions. This approach objectively identifies benchmark functions whose objective space characteristics most closely resemble those of the business problem, thereby providing a scientifically grounded basis for subsequent algorithm performance comparisons and enhancing the credibility of experimental conclusions.
Let the sampled data of the wallboard outsourcing business objective space be denoted as F ( b ) , and the objective space data of the candidate benchmark functions as F ( r ) , where N represents the number of sampling points and M = 6 denotes the number of objectives.
F ( b ) = { f i ( b ) } i = 1 N R N × M
F ( r ) = { f i ( r ) } i = 1 N R N × M
In the equation, N denotes the number of sampling points in the objective space, M represents the number of objectives, and f i corresponds to the objective vector of the i-th sampling point.
To eliminate the effects of differing objective scales and reduce the influence of outliers on structural analysis, a robust normalization method based on the median and median absolute deviation is applied to preprocess the objective data. For any objective dimension j, the normalized objective value is defined as:
f ¯ i j = f i j median ( f j ) MAD ( f j )
MAD ( f j ) = median | f i j median ( f j ) |
In the equation, f i denotes the value of the i-th sample on the j-th objective; median ( f j ) is the median of the j-th objective dimension; and MAD ( f j ) is the corresponding median absolute deviation. After normalization, the resulting values are denoted as F ~ ( b ) ,   F ~ ( r ) .
On this basis, a four-dimensional structural difference metric is defined:
(1) Mean Shift Difference: used to measure the global positional offset between the objective data and the benchmark data.
d m e a n = E ( F ~ ( b ) ) E ( F ~ ( r ) ) 2
In the equation, E ( ) denotes the mean operation over all samples in each objective dimension, and 2 represents the Euclidean norm.
(2) Scale Dispersion Difference: used to measure the fluctuation differences between the objective data and the benchmark data, assessing whether their dispersion in each dimension is consistent.
d s t d = Std ( F ~ ( b ) ) Std ( F ~ ( r ) ) 2
In the equation, Std ( ) represents the vector of standard deviations of the samples in each objective dimension.
(3) Linear Dependence Structure Difference: used to measure the differences between the objective data and the benchmark data in terms of functional relationships, specifically by calculating the differences between their covariance matrices.
d c o r r = Corr ( F ~ ( b ) ) Corr ( F ~ ( r ) ) F
In the equation, Corr ( ) denotes the Pearson correlation coefficient matrix of the objective space samples, and F represents the Euclidean norm.
(4) Overall Distribution Shape Difference: measured using Maximum Mean Discrepancy (MMD) to quantify the differences between the objective data and the benchmark data in terms of overall distribution, particularly suitable for capturing nonlinear and multimodal discrepancies.
d MMD = E x , x [ k ( x , x ) ] + E y , y [ k ( y , y ) ] 2 E x , y [ k ( x , y ) ]
k ( x , y ) = exp x y 2 2 2 σ 2
In the equation, E x , x denotes the expectation operation over all possible values of the two variables, and k ( , ) represents the Gaussian radial basis function (RBF) kernel, with the kernel width parameter σ adaptively determined using the median heuristic.
Since the numerical scales of the different structural difference components vary, each difference component is first adaptively normalized in this study:
d ^ i = d i 1 4 j = 1 4 d j + ε
In the equation, d i { d m e a n , d s t d , d c o r r , d M M D } , and ε is a small positive constant (set to 10−8) introduced to prevent numerical instability.
Integrated similarity. The overall similarity measure Dsim is obtained by aggregating the similarity metrics of the above four dimensions through a weighted average.
D sim = i = 1 4 w i d ^ i = w 1 d ^ mean + w 2 d ^ std + w 3 d ^ corr + w 4 d ^ MMD
In the equation, w 1 ,   w 2 ,   w 3 ,   w 4 are all 0.25.
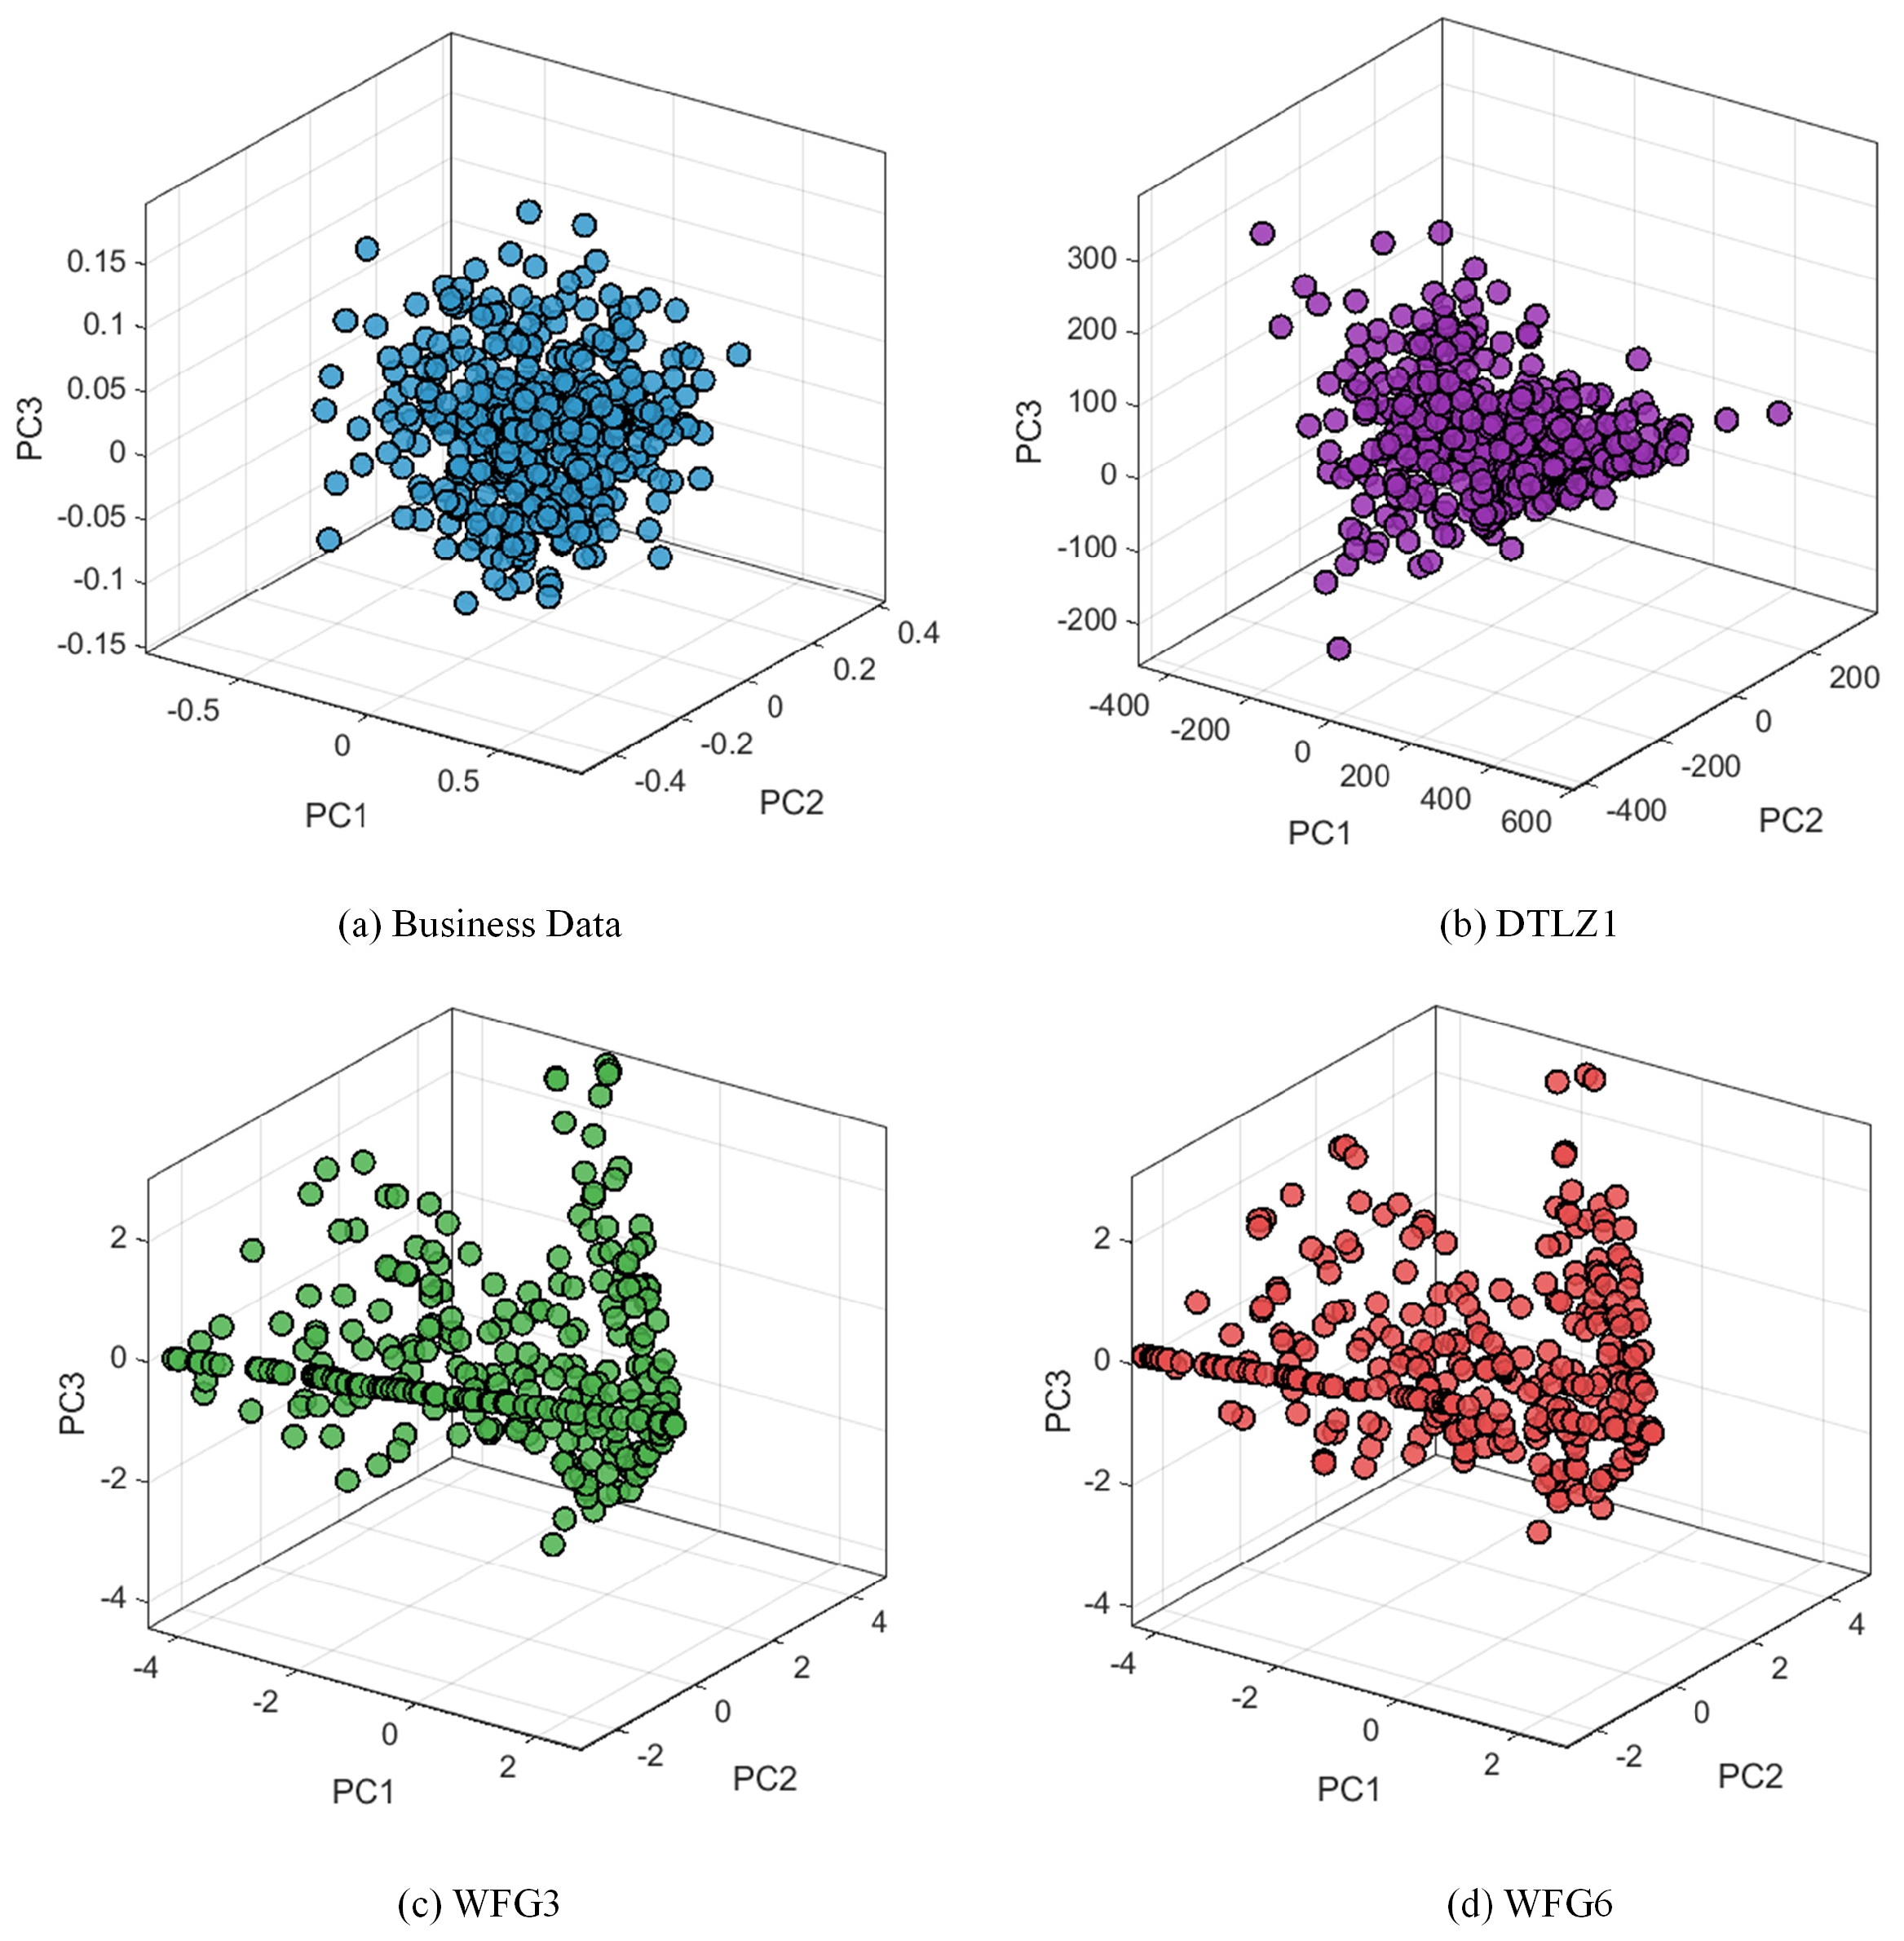
Using the above method, the three most similar benchmark functions—DTLZ1, WFG3, and WFG6—were identified. The PCA projections of the business objective space and the structures of these similar benchmark functions are shown in Figure 3. The following experiments are conducted on these datasets.

3. Results

To comprehensively evaluate the performance of the improved NSGA-III algorithm on multi-objective optimization problems, this study introduces a combined weighting method based on the Analytic Hierarchy Process (AHP) and the Entropy Weight Method [5] to quantitatively characterize the relative importance of each objective, thereby enabling a comprehensive multi-criteria evaluation. On this basis, Generational Distance (GD, measuring convergence to the true Pareto front), Inverted Generational Distance (IGD, assessing both convergence and diversity), and Hypervolume (HV, quantifying the dominated solution space volume) are selected as performance metrics [20]. These indicators are used to systematically analyze and compare the improved algorithm with other benchmark algorithms in terms of convergence, distribution, and coverage. The specific formulas are as follows:
G D ( P , R ) = x P min r R r f ( x ) | P |
I G D ( P , R ) = r R min x P f ( x ) r | R |
H V ( P ) = vol p P f ( p ) , z
In the formulas, P denotes the non-dominated solution set obtained by the algorithm, and |P| represents the size of this set; R denotes the set of reference points on the Pareto front, and |R| represents the number of reference points; f(x) is the objective function vector of a solution x in the objective space; r denotes a reference point on the Pareto front; and Z* is a predefined reference point, usually chosen as the worst-case boundary for each objective.
The comparative study selects the NSGA-III, Q-NSGA-III [21], LCSSA_DE [22], EMOGWO [23], MDQN [9], and the proposed improved NSGA-III algorithms. The parameter settings for the tested algorithms are listed in Table 1:
All algorithms in this study were implemented on the MATLAB R2024a platform. The experimental environment consisted of Windows 10 Professional, a 12th Gen Intel(R) Core (TM) i5-12400F processor (2.50 GHz), and an NVIDIA GeForce GTX 1050 Ti graphics card. Under this environment, to ensure a fair comparison, the population size and the maximum number of iterations were uniformly set to 200. Furthermore, to reduce the influence of randomness on the experimental results, each algorithm was independently executed 20 times under the same parameter settings. The statistical analyses of the HV, GD, and IGD metrics, including the mean and standard deviation, are presented in Table 2, Table 3, and Table 4, respectively. Here, M denotes the number of objective functions, and n denotes the dimension of the decision vector for each test problem.
Subsequently, a Friedman non-parametric statistical test was conducted based on the 20 independent runs on the business dataset to further compare the overall performance of the competing algorithms in terms of the IGD and HV indicators. The Friedman test is a non-parametric statistical method used to determine whether significant performance differences exist among multiple algorithms under the same experimental conditions. Table 5 presents the Friedman test results for both the HV and IGD indicators. The p-values for the IGD and HV indicators are 1.31 × 10⁻⁶ and 2.85 × 10⁻⁷, respectively, both of which are substantially lower than 0.05, indicating statistically significant performance differences among the compared algorithms. According to the mean rank results, the Improved NSGA-III achieves the highest ranking for both the IGD and HV indicators, demonstrating its superior overall performance in terms of convergence and solution diversity. MDQN ranks second for both indicators, benefiting from its deep reinforcement learning mechanism that provides strong convergence capability. LCSSA-DE ranks third, indicating that its local search strategy effectively enhances optimization performance. Q-NSGA-III, NSGA-III, and EMOGWO rank fourth, fifth, and sixth, respectively. Overall, the Friedman ranking results obtained from both evaluation indicators are consistent, further confirming the superiority and stability of the proposed Improved NSGA-III algorithm in solving the practical wallboard collaborative manufacturing service composition optimization problem.
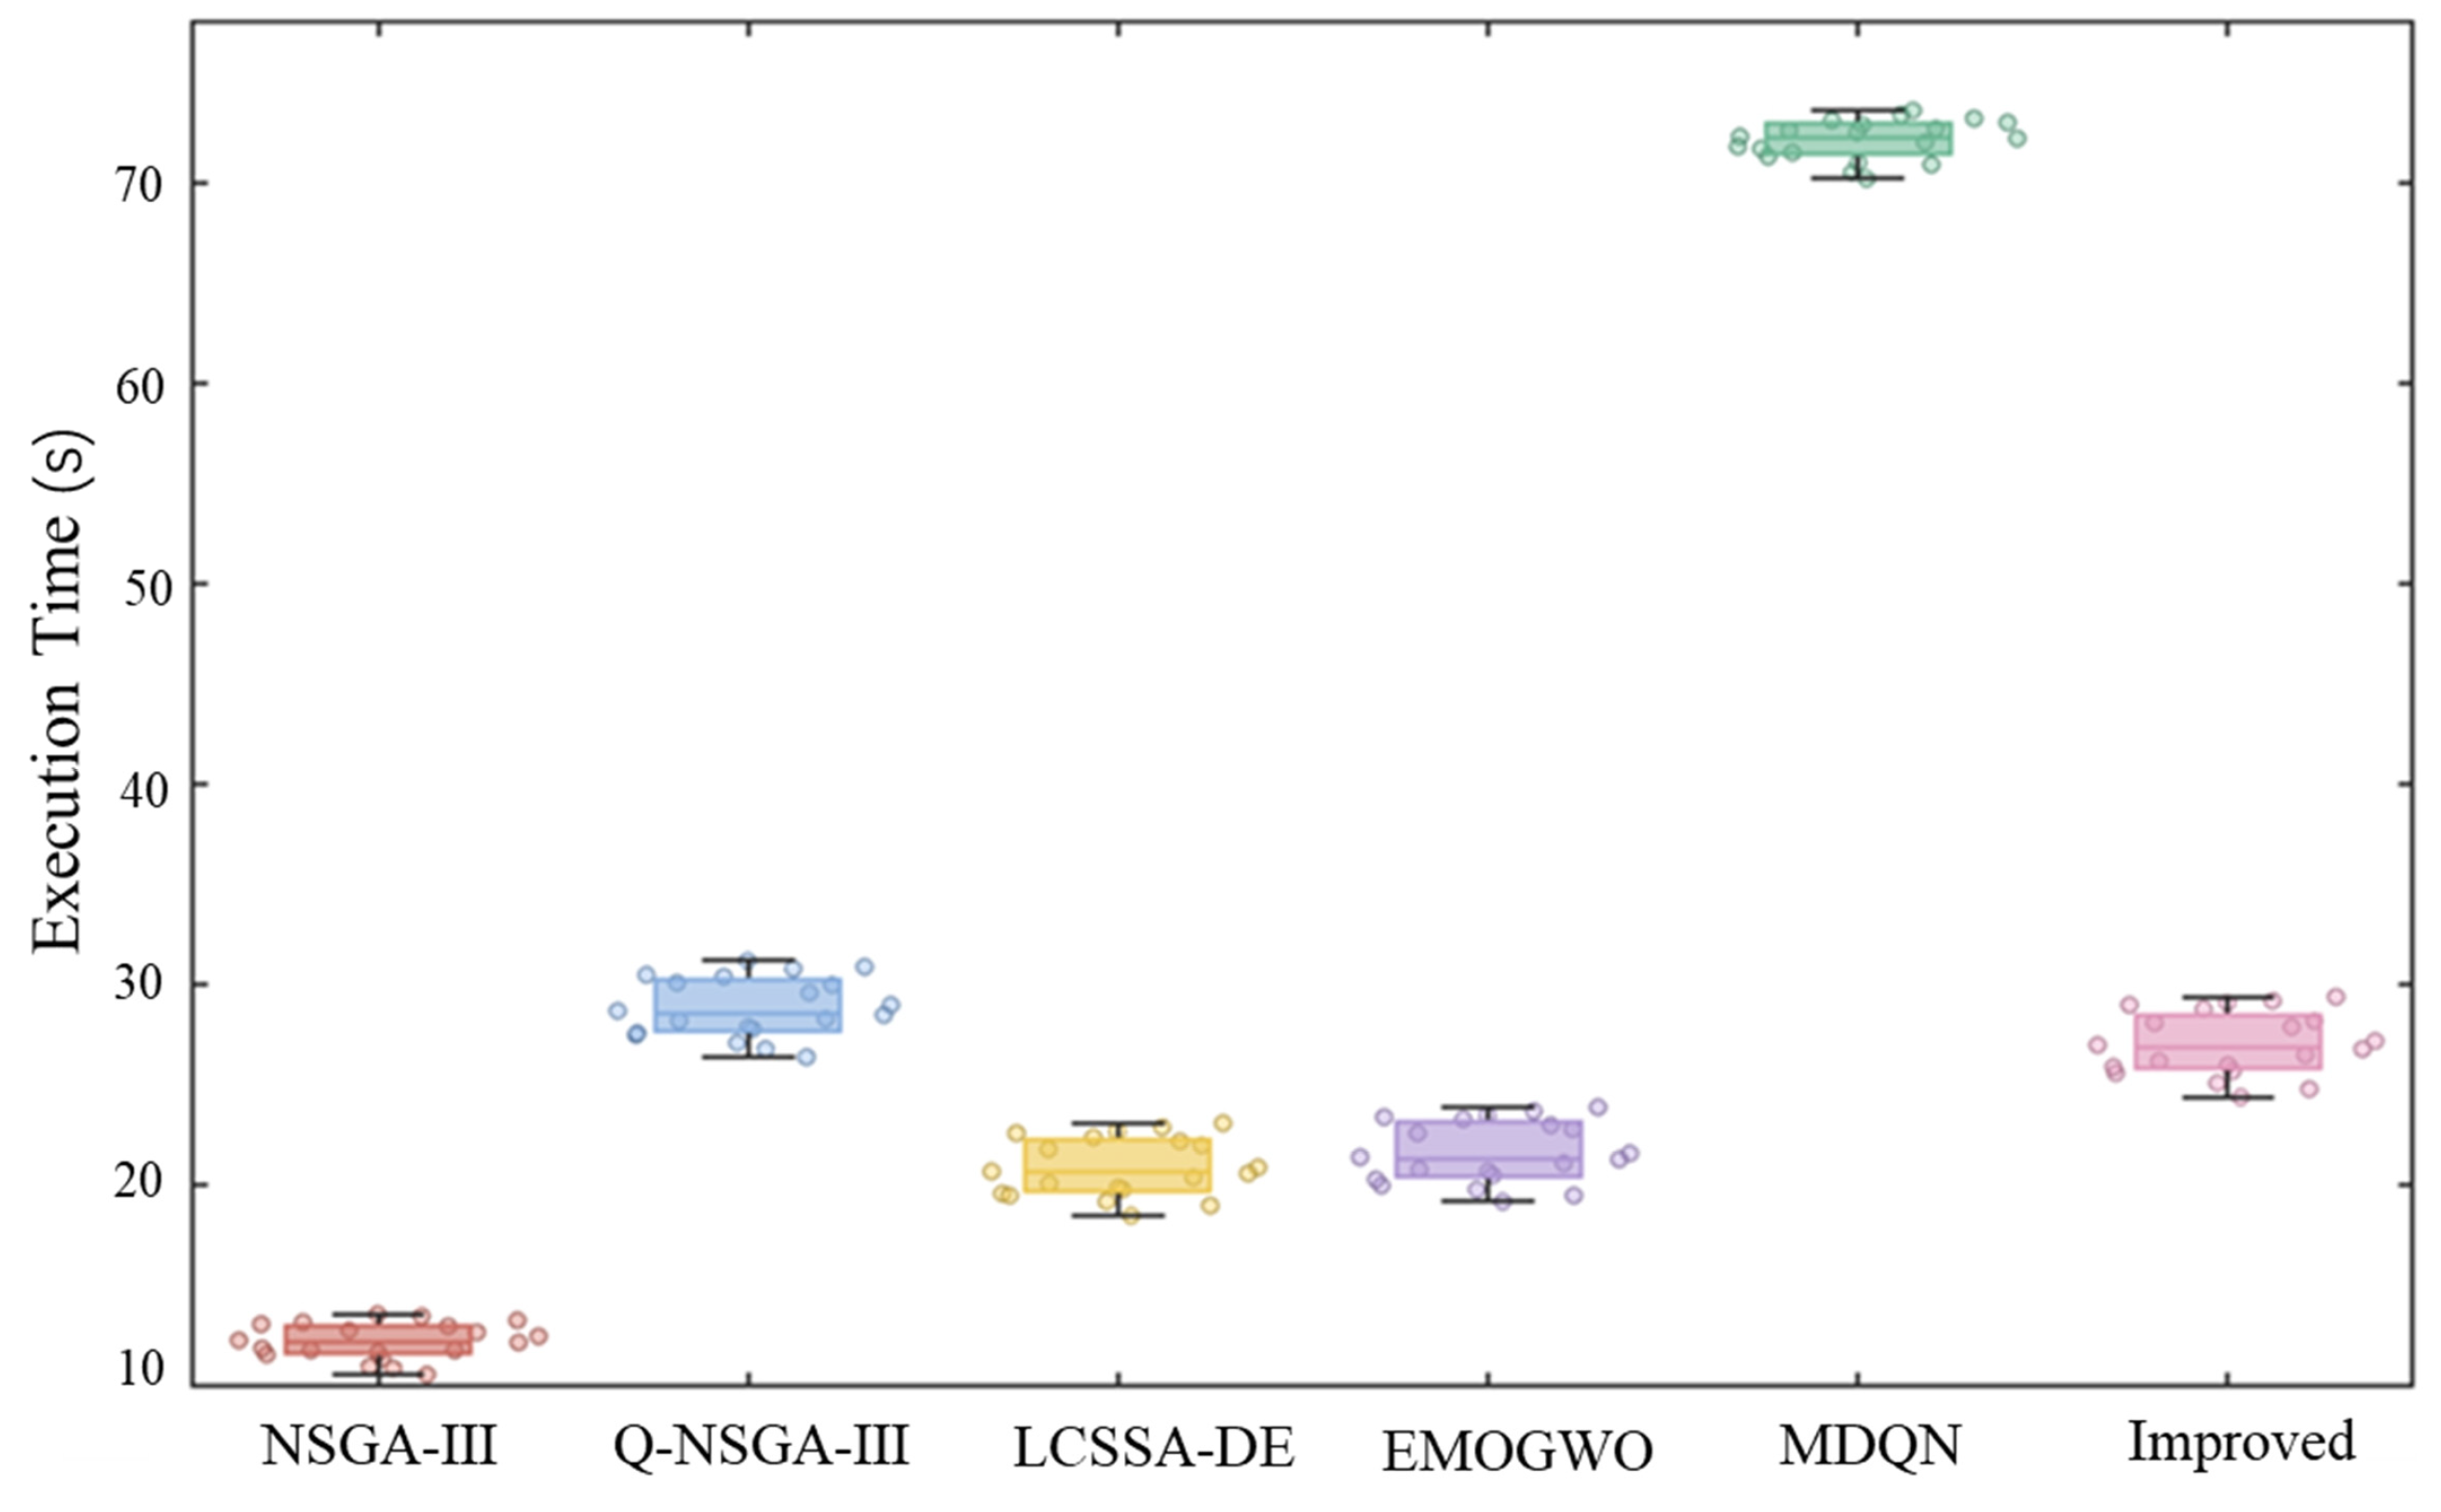
In multi-objective optimization problems, while convergence performance and solution quality are of primary importance, computational efficiency is also a critical factor in practical applications. Figure 4 presents the boxplots of the execution times obtained from 20 independent runs under identical experimental conditions. It can be observed that the median execution times of the six algorithms differ considerably, indicating clear differences in computational efficiency among the compared algorithms. The boxplots of all algorithms are relatively compact, with short whiskers and no obvious outliers, suggesting that the execution times remain stable across repeated runs. Among the compared algorithms, the standard NSGA-III exhibits the lowest median execution time. LCSSA-DE and EMOGWO require moderately longer execution times due to the introduction of additional population cooperation and local search strategies. The proposed Improved NSGA-III shows a further increase in execution time because of the incorporation of Latin hypercube initialization, greedy local search, and Lévy flight perturbation. Q-NSGA-III requires higher computational cost owing to the additional Q-learning update process, whereas MDQN exhibits the highest median execution time because of repeated deep Q-network training and policy optimization during evolution. In addition, the box widths of NSGA-III, LCSSA-DE, EMOGWO, and the proposed Improved NSGA-III are relatively similar, indicating that their execution times fluctuate within a comparatively narrow range. The boxplot of MDQN is positioned significantly higher than those of the other algorithms, reflecting a consistently larger computational burden rather than occasional extreme runs. The limited overlap among the boxplots further demonstrates that the differences in execution time between the compared algorithms are systematic and reproducible under repeated experiments. Furthermore, the absence of pronounced long whiskers suggests that none of the algorithms exhibits severe runtime instability or unexpected computational spikes. Overall, the execution time distributions of all algorithms remain relatively concentrated, indicating good computational stability across repeated runs.
To validate the effectiveness and rationality of the proposed improvement strategies in the wallboard manufacturing service composition optimization problem, a comparative analysis was conducted based on the IGD metric for the standard NSGA-III algorithm and three variants, each incorporating a different improvement strategy. Specifically, NSGA-III-A integrates a diversity enhancement strategy based on Latin hypercube sampling, NSGA-III-B introduces a local search enhancement strategy based on a greedy search mechanism, and NSGA-III-C combines a global search enhancement strategy based on Lévy flight. The IGD results of all algorithms under the same experimental conditions are presented in Table 6.

4. Discussion

This study empirically validates the effectiveness of the proposed improved NSGA-III algorithm in the context of wallboard coating equipment outsourcing. Experimental results indicate that in terms of the HV metric, the improved NSGA-III outperforms the original NSGA-III, EMOGWO, and Q-NSGA-III across the DTLZ1, WFG3, WFG6, and practical business datasets, and slightly surpasses MDQN and LCSSA-DE on certain problems, demonstrating its stability in maintaining solution diversity and Pareto front coverage. Regarding the GD and IGD metrics, MDQN exhibits a slight advantage in convergence due to the incorporation of deep Q-networks, but its solution set distribution is less balanced than that of the improved NSGA-III. Q-NSGA-III and LCSSA-DE show relatively stable performance but are slightly inferior overall, indicating limitations in balancing convergence and diversity. In contrast, EMOGWO performs the weakest on high-dimensional problems and business datasets, with slower convergence and uneven solution distributions, reflecting insufficient global search capability in complex high-dimensional spaces.
In terms of computational time, clear differences among the algorithms are observed. Overall, the standard NSGA-III, due to its relatively simple structure and absence of additional learning or perturbation mechanisms, exhibits the shortest average running time and high computational efficiency. LCSSA-DE and EMOGWO incur increased computational overhead after introducing population cooperation and local enhancement strategies, but remain within acceptable limits. The improved NSGA-III, integrating Latin hypercube initialization, greedy local search, and Lévy flight perturbation, has higher per-iteration computational complexity, resulting in slightly longer running times than the original NSGA-III, yet it remains significantly faster than reinforcement learning-based algorithms, reflecting a reasonable trade-off between performance improvement and time cost. In comparison, MDQN and Q-NSGA-III, due to the inclusion of Q-learning/deep Q-network updates requiring frequent state evaluation and policy iteration, exhibit substantially longer running times, with MDQN being the most time-consuming. Overall, the improved NSGA-III achieves superior convergence and diversity without imposing excessive computational burden, demonstrating strong practical applicability and engineering feasibility. Since the proposed algorithm is intended for wallboard collaborative manufacturing service composition optimization at the production planning stage, rather than real-time process control, the additional computational overhead is acceptable in practical industrial applications. In return, the proposed method provides significantly improved convergence accuracy, solution diversity, and optimization quality, making the trade-off between computational cost and optimization performance worthwhile.
Finally, the ablation study shows that all three variants of the NSGA-III algorithm with introduced improvement strategies outperform the original NSGA-III across all tested problem scales. For example, on the DTLZ1 problem (M = 6; n = 15), the original NSGA-III achieves an IGD value of 1.33 × 10⁻² (2.00 × 10⁻³), whereas NSGA-III-A, NSGA-III-B, and NSGA-III-C attain 1.14 × 10⁻² (1.75 × 10⁻³), 1.20 × 10⁻² (1.85 × 10⁻³), and 1.08 × 10⁻² (1.72 × 10⁻³), respectively, showing a progressive improvement trend. Similar reductions in IGD values are observed for the WFG3, WFG6, and business datasets. These results indicate that the introduction of the three improvement strategies significantly enhances algorithm performance, and each strategy independently contributes positively to the optimization effectiveness.
Furthermore, the experimental findings are generally consistent with the development trends of recent service composition optimization research summarized in the Introduction. Existing studies [10,11,12,13,14] have mainly improved optimization performance by enhancing population diversity, strengthening global exploration, or improving local exploitation through swarm intelligence algorithms and evolutionary optimization strategies. Similarly, the proposed method enhances the search capability of NSGA-III by integrating Latin hypercube sampling for population initialization, greedy local search for local exploitation, and Lévy flight perturbation for global exploration, thereby achieving a better balance between convergence and diversity. Meanwhile, deep learning-based approaches [15,16,17] focus on improving service composition quality through latent feature learning or graph representation learning. Although the proposed method does not employ deep neural networks, it shares the same objective of improving service composition decision quality. Different from these approaches, this study formulates the wallboard manufacturing service composition problem as a six-objective optimization problem and explicitly optimizes six QoS attributes simultaneously. Therefore, the proposed method is more suitable for many-objective manufacturing service composition optimization, where multiple conflicting QoS objectives must be balanced while maintaining solution diversity and convergence performance.

5. Conclusions

With the development of networked collaborative manufacturing for coating equipment, service composition optimization has become a key technology for achieving efficient resource allocation and production coordination. This study systematically analyzes the service composition optimization problem in wallboard manufacturing and makes three main contributions. First, a six-objective mathematical model for wallboard manufacturing service composition is established by simultaneously considering six QoS attributes, providing a more comprehensive optimization framework for collaborative manufacturing. Second, an improved NSGA-III algorithm integrating Latin hypercube sampling, greedy local search, and Lévy flight strategies is proposed to improve convergence performance and solution diversity for complex service composition optimization problems. Third, a target-space structural similarity analysis method is introduced to objectively identify benchmark functions that better match the characteristics of practical business problems, thereby improving the credibility and engineering relevance of algorithm performance evaluation. The experimental results based on standard benchmark functions (DTLZ1, WFG3, and WFG6) and the Business Data dataset demonstrate that the proposed algorithm achieves superior performance in convergence, solution diversity, and Pareto front coverage while maintaining reasonable computational efficiency. Collectively, these contributions enrich the existing research on manufacturing service composition optimization and further demonstrate the applicability of evolutionary multi-objective optimization methods to practical networked collaborative manufacturing problems.
Based on these findings, future research may proceed in two directions. First, the proposed algorithm can be extended to dynamic and real-time production environments by incorporating online manufacturing information, including dynamic task arrivals, equipment condition variations, manufacturing resource availability, and unexpected production disturbances, enabling adaptive service composition and real-time decision-making. Second, customized service composition strategies can be designed for different functional components of coating equipment, thereby further improving optimization efficiency and enhancing the practical applicability of networked collaborative manufacturing platforms.

Author Contributions

Conceptualization, F.R. and J.X.; methodology, M.Z.; software, J.X. and H.Y.; validation, M.Z. and H.Y.; formal analysis, H.Y.; investigation, F.R. and J.X.; resources, H.Y. and M.Z.; data curation, J.X.; writing—original draft preparation, H.Y.; writing—review and editing, S.L. and H.Y.; visualization, Z.Z.; supervision, F.R.; project administration, J.X. and Z.Z.; funding acquisition, S.L. All authors have read and agreed to the published version of the manuscript.

Funding

This research was funded by the National Key Research and Development Program of China, grant number 2023YFB3308800, and the Weinan Key Research and Development Program, grant number 202525ZDYFGY-03.

Data Availability Statement

The original contributions presented in this study are included in the article. Further inquiries can be directed to the corresponding author.

Conflicts of Interest

The authors declare no conflict of interest.

References

  1. Gao, Z.; Liu, S.; Qian, S.; Zhu, L.; Shi, G.; Zhao, J. A Resource Composition Optimization Algorithm Based on Improved Polar Bear Optimization Algorithm for Manufacturing Wallboard for Coating Machine. Coatings 2025, 15, 418. [Google Scholar] [CrossRef]
  2. Yang, T.; Jiang, F.; Fan, J.; Su, J.; Chen, W. An efficient service composition optimization method for Cloud manufacturing based on an IPSO-VIKOR hybrid method. Comput. Ind. Eng. 2026, 214, 111831. [Google Scholar] [CrossRef]
  3. Tang, C.; Goh, M.; Zhao, S.; Zhang, Q. Priority-based two-phase method for hierarchical service composition allocation in cloud manufacturing. Comput. Ind. Eng. 2024, 196, 110517. [Google Scholar] [CrossRef]
  4. Sun, L.; Yu, C.; Chen, M.; Li, C.C. Research on cloud manufacturing service composition optimization considering sustainability. Control Decis. 2026, 41, 1477–1488. [Google Scholar] [CrossRef]
  5. Xu, H.; Chen, S. Research on network collaborative manufacturing service subcontracting method based on improved NSGA-III. Comput. Meas. Control 2026, 34, 134–141+149. [Google Scholar] [CrossRef]
  6. Pu, R.; Li, S.; Zhou, P.; Yang, G. Improved chimp optimization algorithm for matching combinations of machine tool supply and demand in cloud manufacturing. Appl. Sci. 2023, 13, 12106. [Google Scholar] [CrossRef]
  7. Zhang, X.; Yan, J.; Sun, J. Interval multi-objective optimization method for cloud manufacturing service composition under dynamic disturbances. Control Decis. 2026, 41, 19–30. [Google Scholar] [CrossRef]
  8. Yin, Z.; Xu, H. Robust service composition method for cloud manufacturing based on improved multi-objective whale optimization algorithm. Comput. Appl. Res. 2025, 42, 1698–1705. [Google Scholar] [CrossRef]
  9. Fazeli, M.M.; Farjami, Y.; Bidgoly, A.J. An efficient cloud manufacturing service composition approach using deep reinforcement learning. Comput. Ind. Eng. 2024, 195, 110446. [Google Scholar] [CrossRef]
  10. Liao, W.; Wei, L.; Wang, Y. Cloud manufacturing service composition optimization based on improved polar bear algorithm. Comput. Appl. Res. 2022, 39, 1099–1104. [Google Scholar] [CrossRef]
  11. Yuan, D.; Feng, F. Multi-objective cloud manufacturing service composition optimization based on improved NSGA-II algorithm. Manuf. Technol. Mach. Tools 2023, 10, 61–66. [Google Scholar] [CrossRef]
  12. Liu, X.; Yang, R.; Li, X.; Wang, X.V. A cloud manufacturing service composition optimization method for fuzzy demands based on improved NSGA-III algorithm. Robot. Comput.-Integr. Manuf. 2026, 97, 103106. [Google Scholar] [CrossRef]
  13. Zhou, L.; Li, B.; Yu, Q.; Dai, G.; Zhou, G. Multi-strategy improvement of Sparrow Search Algorithm for Cloud Manufacturing service composition. Wuhan Univ. J. Nat. Sci. 2024, 29, 323–337. [Google Scholar] [CrossRef]
  14. Zhang, S.; Tang, D.; Zhang, Y.; Zhou, S.H.; Wang, W.Q. Research on cloud manufacturing service composition optimization method based on improved Harris hawk optimization algorithm. Mech. Manuf. Autom. 2024, 53, 127–131. [Google Scholar] [CrossRef]
  15. Wang, H.; Zhou, J.; Fan, Q. Cloud manufacturing service composition optimization algorithm based on CNN satisfaction model. Intell. Comput. Appl. 2024, 14, 25–32. [Google Scholar] [CrossRef]
  16. Zhao, S.; Gu, S. A neural network algorithm framework based on graph structure for general combinatorial optimization. Neurocomputing 2024, 587, 127670. [Google Scholar] [CrossRef]
  17. Cai, A.; Wang, Y.; Guo, S.; Pan, W. Application of ant colony BP network in composition optimization of cloud manufacturing knowledge service. J. Meas. Sci. Instrum. 2023, 14, 74–84. [Google Scholar] [CrossRef]
  18. Zhu, L.; Liu, S.; Cao, Y.; Yang, H.; Wang, Y. Optimization method for guide roller manufacturing service composition in cloud manufacturing environment. China Pulp Pap. 2025, 44, 152–160. [Google Scholar] [CrossRef]
  19. Tao, J.; Xu, Y.; Chen, Y.; Cheng, P.; Zhang, H.; Wang, J.; Zhou, H. Multi-Objective Structural Parameter Optimization for Stewart Platform via NSGA-III and Kolmogorov–Arnold Network. Machines 2025, 13, 887. [Google Scholar] [CrossRef]
  20. Zhong, M.; Zeng, Z. Study on Distributed Flexible Flow Shop Scheduling Problem with Loading Efficiency and Load Balancing Constraints. China Pulp Pap. 2025, 40, 169–178. [Google Scholar] [CrossRef]
  21. Qin, B.; Song, J.; Wang, C.; Chen, J.; Chen, R. Study on Low-Carbon Optimization Method for High-Dimensional Multi-Objective Flexible Job Shop Scheduling Integrating Reinforcement Learning and NSGA-III. Mach. Tool Hydraul. 2026, 54, 115–126. [Google Scholar] [CrossRef]
  22. Li, Z.; Zhu, L.; Feng, L.; Liu, S.H. Study on Cloud Manufacturing Service Composition Optimization Method for Coating Machine Ovens. Packag. Eng. 2025, 46, 185–194. [Google Scholar] [CrossRef]
  23. Yang, Y.; Yang, B.; Wang, S.; Jin, T.; Li, S. An enhanced multi-objective grey wolf optimizer for service composition in cloud manufacturing. Appl. Soft Comput. 2020, 87, 106003. [Google Scholar] [CrossRef]
Figure 1. Wallboard manufacturing service portfolio optimization process.
Processes 14 02425 g001
Figure 2. Improved NSGA-III algorithm procedure.
Processes 14 02425 g002
Figure 3. Objective vs. similar benchmark function space structures (PCA Projection).
Processes 14 02425 g003
Figure 4. Boxplot of algorithm running times.
Processes 14 02425 g004
Table 1. Parameter settings of six algorithms.
AlgorithmParameter Settings
NSGA-IIICrossover probability: Pc = 0.9; Mutation probability: Pm = 1/D; Crossover distribution index: ηc = 20; Mutation distribution index: ηm = 20; Reference point division parameter: p = 4
Q-NSGA-IIILearning rate: α = 0.1; Discount factor:γ = 0.9; Initial ε = 1.0; Minimum ε = 0.05; ε decay rate: 0.99; Q-table size: 20 × 20
LCSSA DEProportion of discoverers: PD = 0.2; Proportion of followers: SD = 0.6; Alert threshold: ST = 0.8; Differential scaling factor: F = 0.5; Crossover rate: CR = 0.9; Lévy flight exponent: β = 1.5
EMOGWOLinear decrease in α∈ [2,0]; Nonlinear adjustment factor: k = 2; Backward learning probability: 0.3; Proportions of: α/β/δ = 1:2:3
MDONLearning rate: lr = 0.001; Discount factor:γ = 0.95; Initial ε = 1.0; Minimum ε = 0.01; ε decay rate: 0.995; Batch size: 64; Experience replays buffer capacity: 5000; Target network update period: 20
Improved NSGA-IIILatin hypercube initialization: population size N; Greedy probability: Pg = 0.3; Lévy flight exponent: β = 1.5; Diversity threshold: θ = 0.2; Reference point update period: 10
Table 2. HV indicator test results.
Algorithm TypeDTLZ1
(M = 6; n = 15)
WFG3
(M = 6; n = 30)
WFG6
(M = 6; n = 30)
Business Data
(M = 6; n = 19)
NSGA-III9.81 × 10−1 (4.28 × 10⁻³)9.17 × 10−1 (6.06 × 10−3)8.71 × 10⁻¹ (1.11 × 10⁻²)8.48 × 10⁻¹ (1.26 × 10−2)
Q-NSGA-III9.84 × 10−1 (3.67 × 10−3)9.31 × 10⁻¹ (5.43 × 10⁻³)8.89 × 10⁻¹ (9.71 × 10⁻³)8.73 × 10−1 (1.02 × 10−2)
EMOGWO9.75 × 10−1 (5.34 × 10−3)8.96 × 10⁻¹ (8.71 × 10⁻³)8.34 × 10⁻¹ (1.47 × 10⁻²)8.16 × 10−1 (1.78 × 10−2)
MDQN9.87 × 10−1 (3.41 × 10⁻³)9.39 × 10−1 (4.92 × 10−3)9.12 × 10−1 (8.63 × 10−3)8.91 × 10⁻¹ (9.12 × 10⁻³)
LCSSA-DE9.85 × 10−1 (3.58 × 10−3)9.33 × 10⁻¹ (5.19 × 10⁻³)9.14 × 10⁻¹ (8.74 × 10⁻³)8.75 × 10⁻¹ (9.87 × 10⁻³)
Improved NSGA-III9.89 × 10−1 (3.06 × 10−3)9.52 × 10⁻¹ (4.55 × 10−3)9.13 × 10−1 (8.48 × 10⁻³)9.04 × 10⁻¹ (8.44 × 10⁻³)
Table 3. GD indicator test results.
Algorithm TypeDTLZ1
(M = 6; n = 15)
WFG3
(M = 6; n = 30)
WFG6
(M = 6; n = 30)
Business Data
(M = 6; n = 19)
NSGA-III1.61 × 10−2 (3.18 × 10⁻³)3.78 × 10⁻² (4.63 × 10⁻³)6.18 × 10−2 (8.22 × 10⁻³)7.05 × 10⁻² (9.37 × 10⁻³)
Q-NSGA-III1.39 × 10−2 (2.51 × 10⁻³)3.14 × 10⁻² (3.97 × 10⁻³)5.33 × 10⁻² (7.08 × 10⁻³)6.04 × 10⁻² (8.06 × 10⁻³)
EMOGWO1.88 × 10−2 (4.12 × 10⁻³)4.63 × 10⁻² (6.47 × 10−3)7.52 × 10−2 (9.86 × 10−3)8.33 × 10⁻² (1.14 × 10⁻²)
MDQN1.31 × 10−2 (2.33 × 10⁻³)2.91 × 10⁻² (3.54 × 10⁻³)4.97 × 10⁻² (6.52 × 10⁻³)5.78 × 10⁻² (7.55 × 10⁻³)
LCSSA-DE1.37 × 10−2 (2.44 × 10⁻³)3.09 × 10⁻² (3.81 × 10⁻³)5.25 × 10⁻² (6.94 × 10⁻³)5.96 × 10⁻² (7.92 × 10⁻³)
Improved NSGA-III1.26 × 10−2 (2.21 × 10⁻³)2.76 × 10⁻² (3.38 × 10⁻³)4.71 × 10−2 (6.23 × 10−3)6.01 × 10−2 (7.88 × 10−3)
Table 4. IGD indicator test results.
Algorithm TypeDTLZ1
(M = 6; n = 15)
WFG3
(M = 6; n = 30)
WFG6
(M = 6; n = 30)
Business Data
(M = 6; n = 19)
NSGA-III1.31 × 10−2 (2.12 × 10−3)3.16 × 10−2 (3.98 × 10−3)5.54 × 10−2 (7.33 × 10−3)6.39 × 10−2 (8.55 × 10−3)
Q-NSGA-III1.15 × 10−2 (1.83 × 10−3)2.71 × 10−2 (3.41 × 10−3)4.79 × 10−2 (6.21 × 10−3)5.66 × 10−2 (7.31 × 10−3)
EMOGWO1.50 × 10−2 (3.04 × 10−3)3.96 × 10−2 (5.55 × 10−3)6.97 × 10−2 (9.74 × 10−3)8.02 × 10−2 (1.11 × 10−2)
MDQN1.09 × 10−2 (1.71 × 10−3)2.51 × 10−2 (3.02 × 10−3)4.48 × 10−2 (5.84 × 10−3)5.29 × 10−2 (6.82 × 10−3)
LCSSA-DE1.13 × 10−2 (1.78 × 10−3)2.66 × 10−2 (3.27 × 10−3)4.73 × 10−2 (6.12 × 10−3)5.58 × 10−2 (7.14 × 10−3)
Improved NSGA-III1.06 × 10−2 (1.64 × 10−3)2.38 × 10−2 (2.88 × 10−3)4.56 × 10−2 (5.96 × 10−3)5.24 × 10−2 (6.77 × 10−3)
Table 5. Friedman ranking results based on the IGD and HV indicators on the business dataset.
MetricAlgorithmsMean RankOverall RankNdfChi-Squarep-Value
IGDImproved NSGA-III1.5612053.53 × 1011.31 × 10−6
MDQN1.882
LCSSA-DE3.173
Q-NSGA-III3.944
NSGA-III5.025
EMOGWO5.536
HVImproved NSGA-III1.4212053.87 × 1012.85 × 10−7
MDQN2.082
LCSSA-DE3.053
Q-NSGA-III3.874
NSGA-III5.115
EMOGWO5.576
Table 6. IGD test results of three strategies.
Algorithm TypeDTLZ1
(M = 6; n = 15)
WFG3
(M = 6; n = 30)
WFG6
(M = 6; n = 30)
Business Data
(M = 6; n = 19)
NSGA-III1.33 × 10−2 (2.00 × 10−3)3.21 × 10−2 (3.87 × 10−3)5.58 × 10−2 (7.16 × 10−3)6.48 × 10−2 (8.56 × 10−3)
NSGA-III-A1.14 × 10−2 (1.75 × 10−3)2.70 × 10−2 (3.12 × 10−3)4.70 × 10−2 (6.14 × 10−3)5.45 × 10−2 (7.00 × 10−3)
NSGA-III-B1.20 × 10−2 (1.85 × 10−3)2.95 × 10−2 (3.40 × 10−3)5.06 × 10−2 (6.59 × 10−3)5.92 × 10−2 (7.63 × 10−3)
NSGA-III-C1.08 × 10−2 (1.72 × 10−3)2.45 × 10−2 (3.02 × 10−3)4.35 × 10−2 (5.80 × 10−3)5.10 × 10−2 (6.61 × 10−3)
Disclaimer/Publisher’s Note: The statements, opinions and data contained in all publications are solely those of the individual author(s) and contributor(s) and not of MDPI and/or the editor(s). MDPI and/or the editor(s) disclaim responsibility for any injury to people or property resulting from any ideas, methods, instructions or products referred to in the content.