1. Introduction
In recent years, tight oil and gas reservoirs have become important targets for hydrocarbon exploration and development [
1,
2]. The Junggar Basin contains abundant tight oil and gas resources and has considerable potential for further exploration and production [
3,
4]. However, tight sandstone reservoirs are generally characterized by small pore throats and complex pore–fracture systems. Under increasing confining pressure or decreasing pore pressure, the resulting increase in effective stress can induce pore and fracture closure, leading to rapid permeability decline [
5]. In addition to reversible elastic compression, irreversible structural evolution, including cementation failure and plastic deformation, may occur during loading. These processes cause permeability to exhibit stage-dependent decay characteristics [
6,
7].
Extensive studies have investigated rock permeability evolution and stress sensitivity. Brace et al. [
8,
9] revealed, through high-confining-pressure, high-pore-pressure, and cyclic loading–unloading tests, that fracture opening and closure, grain rearrangement, and flow-path reconstruction play important roles in irreversible permeability reduction. With further development of permeability evolution models, Wang et al. [
10,
11,
12] coupled effective stress with matrix deformation and introduced internal strain parameters to describe permeability evolution. Peng et al. [
13] demonstrated, through shale gas flow experiments and model analysis, that internal strain and structural evolution can significantly alter the shape of permeability evolution curves, and that simple compaction models are insufficient for accurately characterizing permeability changes under complex stress conditions. Zhang et al. [
14,
15,
16] investigated permeability evolution from the perspectives of complex stress paths and pore–fracture geometry; however, their models did not account for the effects of plastic deformation and damage accumulation.
Existing studies indicate that once rocks enter the plastic flow stage, the permeability response to stress changes becomes more nonlinear and irreversible, suggesting that plastic deformation and damage accumulation are key factors controlling permeability evolution [
17,
18,
19]. In addition, Sheng et al. [
20,
21] pointed out that the stress sensitivity of rock permeability is jointly controlled by mineral composition and pore structure. Variations in the contents of non-rigid minerals, such as clay minerals, can affect the plastic response of rocks and the compressive deformation of pore structures, thereby influencing permeability stress sensitivity.
Previous studies have clarified several aspects of stress-sensitive permeability evolution, including fracture closure, effective-stress effects, and deformation-coupled modeling. However, most existing models primarily focus on compaction. Plastic deformation, damage accumulation, and the associated nonlinear evolution of pore structure remain insufficiently considered. In addition, the influence of mineral composition on the plastic response of tight sandstone has generally been discussed only qualitatively. Quantitative studies combining mineralogical classification with permeability-evolution modeling remain limited.
Therefore, this study constructs a plastic mineral index, PM, based on X-ray diffraction analysis of mineral composition and uses it to classify tight sandstone samples into different plasticity groups. It then establishes a coupled compaction–plastic-damage permeability evolution model based on permeability responses under staged effective-stress loading. Model–data comparisons and parameter sensitivity analysis are conducted to examine the dominant controls on permeability decline in samples with different plasticity types. The proposed model provides a preliminary framework for characterizing permeability evolution in the tested tight sandstone samples under the investigated laboratory conditions.
2. Mineral Composition and Permeability Response
2.1. Mineral Composition Characteristics
Core samples were collected from lithic-rich tight sandstone intervals of the Baijiantan Formation in the Junggar Basin at depths of 4300–4500 m. Petrographic thin-section records indicate that the detrital grain sizes of the tested sandstone samples predominantly range from 0.063 to 0.25 mm; therefore, the sandstone is described here as very fine- to fine-grained. The sampled intervals are lithologically heterogeneous and consist mainly of lithic-rich tight sandstone with locally developed argillaceous siltstone. The samples show pronounced mineralogical heterogeneity, particularly in the contents of plasticity-related minerals, which may influence rock deformation and the inferred pore-structure response under effective stress.
X-ray diffraction (XRD) analysis was used to quantify the whole-rock mineral composition and the relative contents of clay minerals. The whole-rock analysis determined the contents of quartz, feldspar, carbonate minerals, and clay minerals, whereas the clay-mineral analysis further identified the relative proportions of mixed-layer illite/smectite, illite, kaolinite, and chlorite.
Table 1 summarizes the results, which provide a mineralogical basis for subsequent plasticity classification and permeability evolution modeling.
Based on the XRD results, the samples differ markedly in the contents of framework minerals, mainly quartz and feldspar, and in clay mineral contents. Overall, however, they are characterized by abundant clay minerals. Framework minerals largely determine rock stiffness and brittleness and commonly respond to external loading through elastic compression or brittle failure [
22]. In contrast, clay minerals, particularly mixed-layer illite/smectite and illite, are more compressible and more prone to structural rearrangement. Higher clay mineral contents are therefore associated with greater plastic deformation potential and more pronounced irreversible pore-structure adjustment [
23].
From a hydromechanical perspective, pore-structure responses to increasing effective stress can be divided into two main modes. The first is framework-controlled elastic pore contraction, which produces a relatively gradual, near-exponential decrease in permeability. The second is plasticity- and damage-controlled evolution, where progressive plastic strain and damage accumulation reduce the equivalent elastic modulus and increase fracture compressibility, resulting in stronger nonlinear and stage-dependent permeability decline [
24]. Thus, the clay mineral content can serve as an important mineralogical indicator for distinguishing the plastic response of tight sandstone samples.
2.2. Plastic Mineral Index and Sample Classification
In permeability stress-sensitivity analysis, irreversible pore-structure evolution is controlled not only by clay minerals but also by the pressure-solution, slip, and particle-rearrangement behavior of certain non-silicate minerals under stress. Compared with quartz and feldspar, calcite is more susceptible to pressure solution and intergranular slip. Under coupled stress–fluid conditions, it can exhibit plastic-like compaction and is therefore often treated as a non-rigid mineral in low-permeability reservoir studies [
25]. Siderite, an iron carbonate mineral, generally has lower mechanical strength and elastic modulus than silicate framework minerals. In clay-rich matrices, siderite may act as a mechanically weak phase during structural adjustment and may contribute to pore-structure evolution [
26]. When pyrite occurs as finely dispersed particles, it is prone to particle breakage and weak cementation with clay minerals or carbonates; at the engineering scale, it may also behave as a non-rigid component [
27].
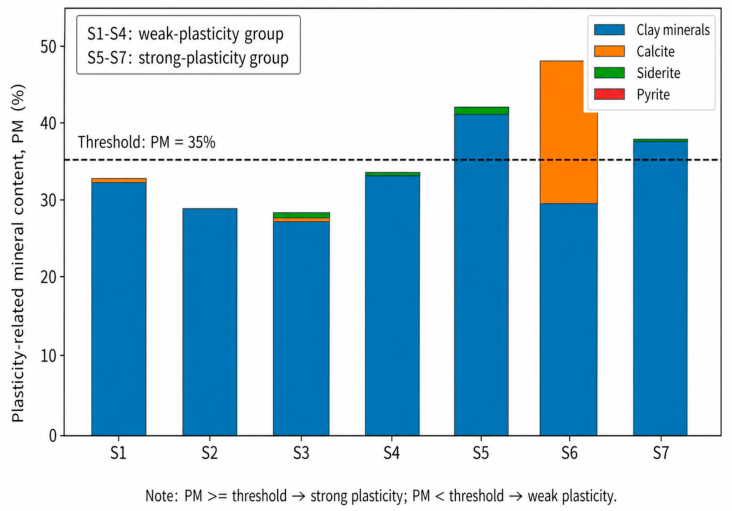
In this study, mineral phases that are more likely to induce irreversible deformation during compaction, slip, and particle rearrangement were selected as plasticity-related minerals. The plastic mineral index was defined as
, where each term denotes the corresponding whole-rock mineral content (
Figure 1). The calculated PM values are listed in
Table 1. The PM values of S1–S4 range from 28.2% to 33.5%, whereas those of S5–S7 range from 37.9% to 48.3%. The threshold of 35% lies within the observed interval between the maximum PM value of the weakly plastic group and the minimum PM value of the strongly plastic group. It was therefore adopted as a dataset-specific engineering criterion for the seven samples investigated in this study, rather than as a universal mineralogical threshold. Accordingly, samples S1–S4 with PM < 35% were classified as weakly plastic, whereas samples S5–S7 with PM ≥ 35% were classified as strongly plastic.
2.3. Permeability Stress-Sensitivity Experiments
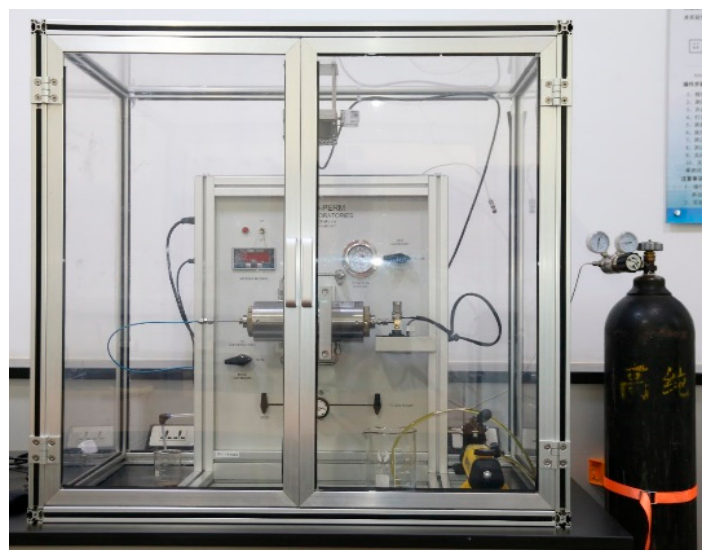
Experiments were conducted using a CoreLab steady-state gas permeability apparatus (PERM Inc. Instruments, Calgary, AB, Canada). The system consisted of a horizontally mounted sealed core holder enclosed in a transparent protective chamber, a nitrogen supply cylinder equipped with a pressure regulator, a confining-pressure loading and control unit, upstream and downstream gas-flow lines, inlet and outlet pressure measurement units, and a steady-state gas-flow measurement unit. The cylindrical core samples were 46.68–59.21 mm in length and 24.38–24.85 mm in diameter. All the tests were conducted at 25 °C using nitrogen as the test gas, with confining pressures ranging from 10 to 32 MPa.
For each loading stage, the core plug was installed in the sealed core holder, and confining pressure was applied to prevent gas bypass along the sample boundary. Nitrogen was introduced through the upstream line at a controlled pressure, producing a stable pressure difference across the core. The inlet pressure, outlet pressure, and volumetric flow rate were continuously monitored. After steady-state flow was achieved, the measured parameters were recorded and used to calculate gas permeability according to Darcy’s law for compressible gas flow [
28]:
where
is the reference pressure,
is the gas viscosity,
is the core length,
is the cross-sectional area,
is the steady-state volumetric flow rate, and
and
are the inlet and outlet pressures, respectively (see
Figure 2).
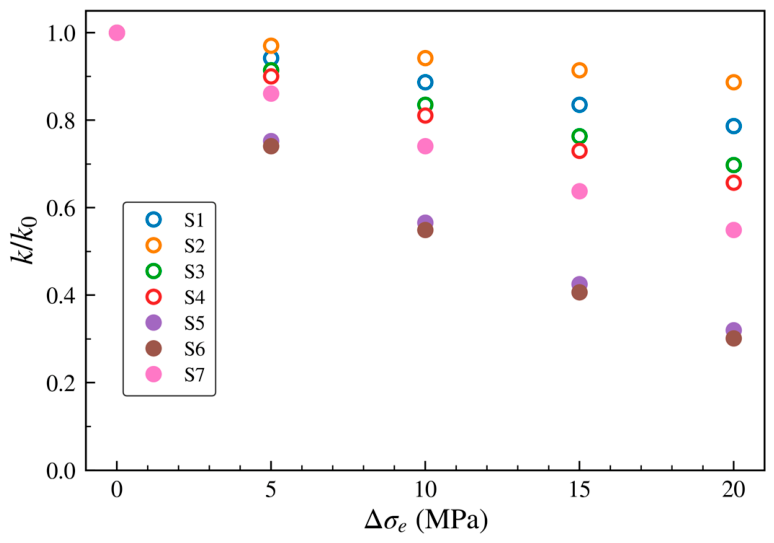
Permeability measurements were conducted at effective-stress increments of 0, 5, 10, 15, and 20 MPa. Permeability was normalized by the initial value k0 measured at zero effective-stress increment, yielding k/k0 = 1 at Δ = 0. In this study, effective-stress increments below 10 MPa were defined as the low-effective-stress-increment range, whereas increments of 10–20 MPa were defined as the moderate- to high-effective-stress-increment range.
The measured gas-permeability values of samples S1–S7 at effective-stress increments of 0, 5, 10, 15, and 20 MPa are summarized in
Table 2. The corresponding normalized permeability responses,
k/
k0, are presented as experimental points in
Figure 3.
As shown in
Figure 3, all the samples exhibited permeability decline with increasing effective-stress increment, although the magnitude and evolution pattern varied among the samples. At an effective-stress increment of 20 MPa, the permeability losses of S1–S4 ranged from 11.7% to 31.4%, whereas those of S5–S7 ranged from 46.4% to 72.9%. These differences suggest variations in the stress-dependent pore-structure response and may reflect the combined effects of elastic compaction and possible irreversible structural rearrangement. The normalized permeability responses provide the experimental basis for the subsequent model–data comparisons and mechanistic interpretation [
29].
3. Elastoplastic Permeability Stress-Sensitivity Model
To characterize permeability evolution under effective stress in the samples with different plasticity types, this study formulates the model within the framework of the classical cubic law. Permeability variation is attributed to the coupled response of pore structure to effective-stress compaction and plastic damage. Weakly plastic samples mainly exhibit gradual permeability decline dominated by compaction, whereas strongly plastic samples show more pronounced nonlinear decline at effective-stress increments of 10–20 MPa. Therefore, both effective-stress compaction and plastic damage are incorporated into the permeability-evolution model.
3.1. Model Development
Pore–fracture contraction induced by the effective-stress increment Δ
is described as a compaction process controlled by the fracture compressibility coefficient
. According to the elastic volumetric compression relationship,
is related to the elastic modulus and Poisson’s ratio
[
30]. To account for progressive stiffness degradation during plastic deformation, a damage variable
is introduced, and the elastic modulus is expressed as
where
is the initial elastic modulus in the undamaged state, and
is the damage-degraded elastic modulus. The fracture compressibility coefficient can then be written as
where the initial fracture compressibility coefficient is
These relationships indicate that damage accumulation reduces the elastic modulus and increases the sensitivity of the pore–fracture system to effective-stress changes [
31]. To establish a quantitative link between plastic deformation and damage evolution, the normalized plastic strain
is defined as an internal variable [
32]:
where
is the characteristic plastic strain. Because damage develops progressively during plastic deformation and eventually approaches saturation, an exponential damage function is adopted:
where
is the damage evolution rate parameter. The coefficients
and
are determined by
and satisfy the boundary conditions
and
. They are given by
This formulation ensures that the damage variable evolves continuously from 0 to 1 and links plastic strain accumulation to mechanical property degradation. By treating
as constant or piecewise constant within each loading step, the compaction process can be integrated and combined with the cubic law [
33], yielding the normalized permeability evolution equation:
Substituting the damage function gives
This equation indicates that permeability decline is controlled not only by effective-stress compaction but also by plastic damage, which amplifies fracture compression through elastic modulus degradation. Strongly plastic samples can therefore exhibit more pronounced nonlinear permeability decline as loading progresses, especially under effective-stress increments of 10–20 MPa.
3.2. Equivalent Correction
Equation (10) describes the structural form of permeability evolution. However, the initial fracture compressibility coefficient
in Equation (4) is derived from the bulk modulus of an ideal homogeneous continuum. In actual rock samples, pore–fracture network heterogeneity, variations in fracture geometry, and representative elementary volume (REV) effects can lead to deviations between theoretical stiffness and macroscopic compressibility at the engineering scale [
34]. To improve the engineering applicability of the model and characterize the equivalent compressibility sensitivity of the macroscopic permeability response, a dimensionless correction coefficient
β is introduced as follows:
Then, the engineering form of the model can be written as
where
is the equivalent initial fracture compressibility coefficient. The correction factor
β accounts for the effects of microstructure, scale, and structural heterogeneity on macroscopic compressibility, and its value is determined by fitting the experimental data.
The dimensionless coefficient β accounts for the discrepancy between the ideal continuum-based fracture compressibility and the macroscopic permeability response caused by pore–fracture heterogeneity, geometric complexity, and scale effects. In this study, β = 176 was obtained by fitting the normalized permeability response of representative sample S5 and was used as the baseline value in the sensitivity analysis. Therefore, β should be regarded as a sample-specific calibration parameter rather than a universal empirical constant.
When plastic damage is weak, that is,
≈ 0, the complete model reduces to the conventional compaction-dominated exponential form:
where
= 3
is the equivalent stress-sensitivity coefficient. This reduced form is suitable for weakly plastic samples. For strongly plastic samples, the complete compaction–plastic damage coupling model is required to capture the accelerated permeability decline and curvature changes under effective-stress increments of 10–20 MPa.
3.3. Model–Data Comparison
To evaluate the applicability of the proposed permeability evolution model to the samples with different plasticity characteristics, the normalized permeability responses,
k/k0, of seven samples were used for model–data comparison. Based on the plastic mineral index, PM, and the permeability decline behavior described in
Section 2, S1–S4 were classified as weakly plastic samples, whereas S5–S7 were classified as strongly plastic samples. The weakly plastic samples generally show smaller permeability loss and nearly monotonic exponential decay; therefore, they were fitted using the traditional exponential model. In contrast, the strongly plastic samples exhibit larger permeability loss and accelerated decline under effective-stress increments of 10–20 MPa; therefore, they were fitted using the complete coupled model. Model predictions were compared with experimental data at effective-stress increments of Δ
= 0, 5, 10, 15, and 20 MPa. The sum of squared errors (SSE) between the measured and predicted normalized permeability values was used to evaluate goodness of fit; lower SSE values indicate better agreement [
35].
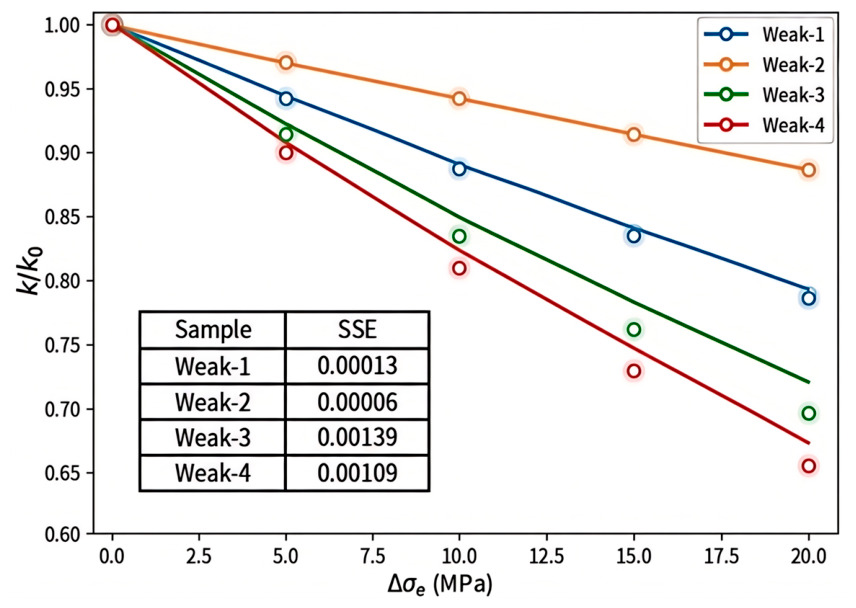
For the weakly plastic samples, permeability declines gradually and approximately exponentially with increasing effective stress. Under weak plasticity or low damage, the complete model reduces to a compaction-dominated exponential form. Thus, the traditional exponential model was used to fit the permeability data of the weakly plastic samples (
Figure 4).
The model yields good fits for samples S1–S4, with SSE values ranging from 6.0 × 10⁻⁵ to 1.39 × 10⁻³. Residuals are relatively uniform across the entire stress range and do not increase systematically with effective stress. This indicates that the traditional exponential model captures both the initial decline at low effective stress and the subsequent gradual decline at effective-stress increments of 10–20 MPa.
Permeability evolution in the weakly plastic samples is mainly governed by effective-stress compaction. Because the contents of plasticity-related minerals are low, plastic deformation and damage-induced structural evolution have only a limited effect on the curve shape. The traditional exponential model is therefore sufficient to describe permeability evolution in the weakly plastic samples for the tested data.
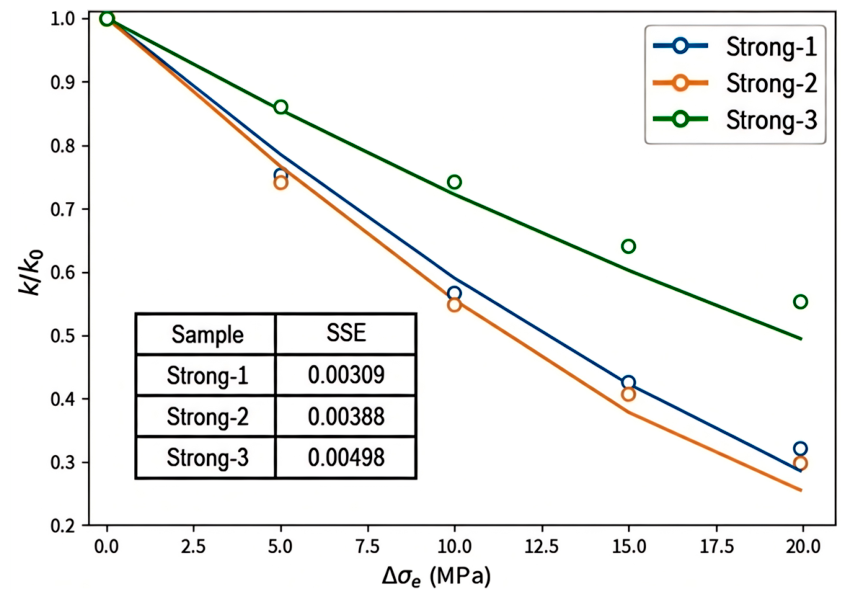
For the strongly plastic samples, the experimental data show more pronounced stress sensitivity. As effective stress increases, permeability declines more rapidly, and the decline rate varies more strongly across stress stages, suggesting that irreversible structural adjustment contributes to permeability loss in addition to compaction. Therefore, the complete coupled model incorporating elastic-modulus degradation and plastic damage was used to fit the permeability data of the strongly plastic samples (
Figure 5).
The complete model yields good fits for the strongly plastic samples S5–S7, with SSE values ranging from 0.00309 to 0.00498. Although these samples exhibit stronger nonlinear permeability decline during loading, the residuals remain relatively stable over the entire stress range and do not increase systematically with effective stress. This suggests that the coupling between plastic damage and elastic modulus degradation effectively compensates for the underestimation of permeability decline when only stress-induced compaction is considered.
The comparison between predicted curves and experimental data further shows that the complete model captures both the initial permeability decline and the subsequent curvature variation at effective-stress increments of 10–20 MPa. This behavior is consistent with the inferred contribution of irreversible structural adjustment, including plastic deformation, during loading. Within the tested samples and laboratory conditions, the complete coupled model provides a better description of the strongly plastic samples than the traditional exponential model.
3.4. Comparison with the Traditional Exponential Model
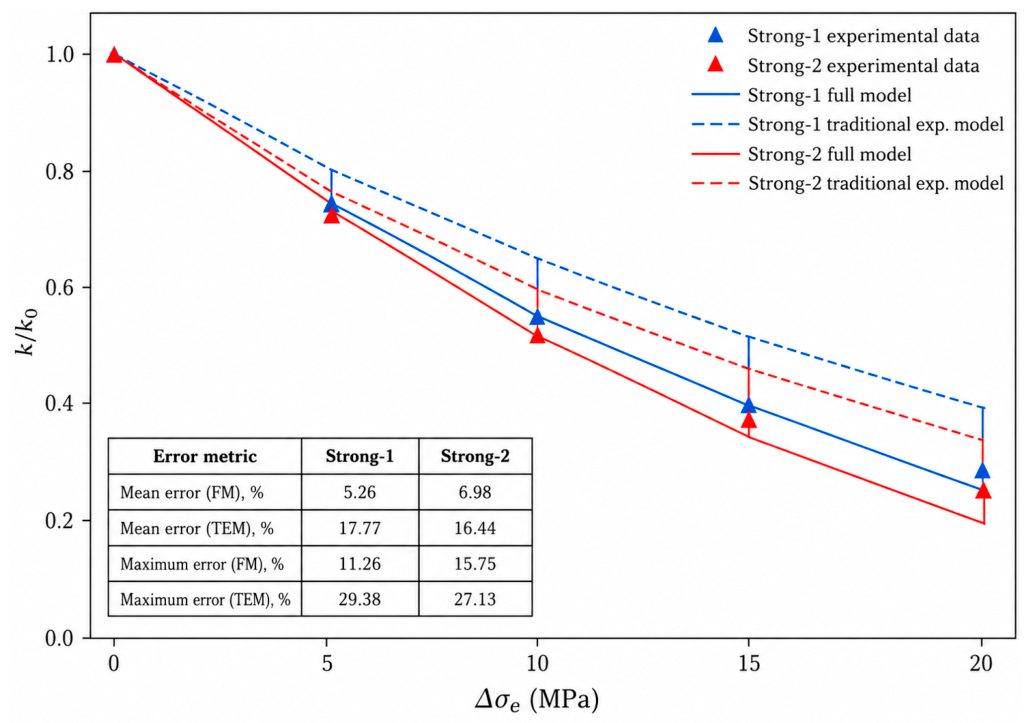
To further evaluate the role of plastic damage in the model, two representative strongly plastic samples were selected for comparison. Under the same input conditions, permeability was predicted using both the complete coupled model and the traditional exponential model, and the prediction accuracy was evaluated using relative deviation (
Figure 6).
The complete coupled model produced lower errors than the traditional exponential model for both strongly plastic samples. For Strong-1, the average and maximum relative deviations of the complete model were 5.26% and 11.26%, respectively, compared with 17.77% and 29.38% for the traditional exponential model. For Strong-2, the corresponding values were 6.98% and 15.75% for the complete model, compared with 16.44% and 27.13% for the traditional exponential model.
For the two strongly plastic samples examined in
Figure 6, the complete coupled model shows closer agreement with the experimental data than the traditional exponential model. It captures both the permeability response at low effective-stress increments and the accelerated decline at effective-stress increments of 10–20 MPa. Under the investigated laboratory conditions, incorporating plastic damage and elastic-modulus degradation therefore improves the description of permeability evolution in these samples.
4. Sensitivity Analysis and Discussion
To identify the dominant parameters controlling permeability evolution, a single-factor perturbation method was used for sensitivity analysis. Each selected parameter was varied by factors of 0.5, 1, and 2 while the other parameters were kept at their baseline values. The resulting normalized permeability curves,
, were then obtained as functions of the effective-stress increment Δ
. To provide a consistent evaluation criterion, parameter sensitivities were calculated over both the full stress range,
, and the moderate- to high-effective-stress-increment interval (10–20 MPa),
. Considering the different roles and response characteristics of the parameters in the model,
and
were grouped as overall decline control parameters, whereas
and
were grouped as nonlinear evolution parameters. The sensitivities of these parameters were then ranked to identify the dominant controls on permeability decline (see
Table 3).
4.1. Overall Decline Control Parameters
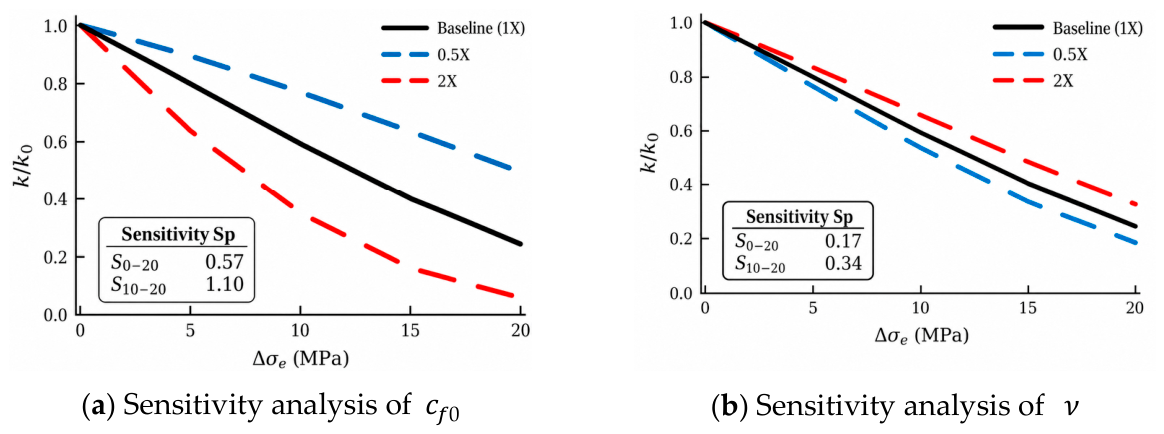
As shown in
Figure 7,
and
mainly affect the overall level, initial slope, and decline rate of the permeability curve, with
exerting the strongest control. Reducing
to half its baseline value increases
at Δ
= 20 MPa from 0.24 to 0.49, whereas doubling
decreases
to 0.06. The corresponding
and
values are 0.57 and 1.10, respectively, which are the highest among the four parameters. Thus,
controls not only the overall magnitude of permeability decline over the full stress range but also the additional decline at effective-stress increments of 10–20 MPa.
In contrast, has a weaker influence than , although it still shifts the curve and affects the compressive response. Setting to half and twice its baseline value yields = 0.18 and 0.32 at 20 MPa, corresponding to relative changes of −24.6% and +32.7% from the baseline case. The corresponding and values are 0.17 and 0.34, respectively. These results indicate that Poisson’s ratio acts mainly as a secondary regulating parameter: it continuously affects the overall decline trend but does not dominate the nonlinear decline behavior. Overall, among the parameters controlling the overall decline, governs the magnitude of permeability decline, whereas primarily modulates the elastic-compression response.
4.2. Nonlinear Evolution Parameters
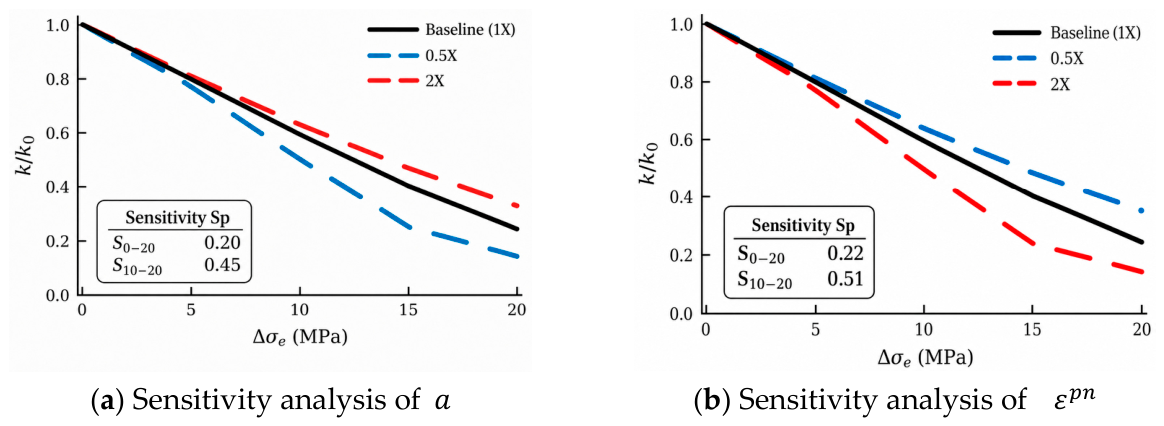
As shown in
Figure 8,
and
have limited effects at low effective stress, but their influence becomes more pronounced at effective-stress increments of 10–20 MPa, where they mainly control curve curvature and additional permeability decline. For
, when Δ
= 5 MPa, the
values under 0.5- and 2-times perturbations are 0.77 and 0.81, respectively, showing only minor deviations from the baseline curve. At Δ
= 20 MPa, however, the corresponding values are 0.14 and 0.33, indicating much stronger parameter sensitivity. The
and
values for
are 0.20 and 0.45, respectively, showing that
has a stronger effect on nonlinear permeability decline in the moderate- to high-effective-stress-increment interval (10–20 MPa) than over the full stress range.
The effect of follows a similar pattern but is more pronounced. When is set to half its baseline value, at 20 MPa increases to 0.35; when is doubled, decreases to 0.14. This indicates that increasing plastic strain accelerates permeability decline at effective-stress increments of 10–20 MPa. The corresponding and values are 0.22 and 0.51, respectively, both higher than those for . Thus, among the nonlinear evolution parameters, has the stronger control on the later-stage curve shape and additional permeability decline. Overall, and primarily regulate the onset and evolution of nonlinear permeability decline under effective-stress increments of 10–20 MPa.
4.3. Parameter Sensitivity Ranking
To avoid uncertainty from single-point evaluation, parameter sensitivity was quantified using the discrete integral area of the permeability curve [
36]. Sensitivity rankings were determined separately for the full stress range (0–20 MPa) and the moderate- to high-effective-stress-increment interval (10–20 MPa). The curve area was calculated by trapezoidal integration:
where
=
, and the normalized area sensitivity is defined as
where
,
, and
denote the lower, baseline, and upper perturbation levels, respectively. Parameters were ranked in descending order of
to identify the dominant controls on permeability evolution.
Based on the full-range sensitivity results (
Table 4), the parameter sensitivity follows the order
>
>
>
. This ranking indicates that
has the strongest control over the overall permeability decline, whereas
and
mainly regulate the additional nonlinear decline. In contrast,
shows the lowest overall sensitivity.
To further examine parameter effects under effective-stress increments of 10–20 MPa, sensitivity calculations were performed for the 10–20 MPa range (
Table 5). The sensitivity ranking remains
>
>
>
, but all the parameters show higher sensitivity than over the full stress range. This indicates that parameter effects are amplified mainly at effective-stress increments of 10–20 MPa.
Overall, the sensitivity results for the two stress intervals show that has the highest sensitivity under both evaluation criteria. It is therefore the dominant parameter controlling both the overall permeability decline and the additional decline at effective-stress increments of 10–20 MPa. The sensitivities of and increase more markedly in the 10–20 MPa range, indicating that these parameters mainly control the nonlinear decline behavior by regulating elastoplastic deformation. In contrast, shows relatively low sensitivity and mainly acts as a secondary parameter in the elastic-compression response.
4.4. Limitations and Applicability
The permeability experiments were conducted at 25 °C, whereas the cores were obtained from depths of 4300–4500 m. Therefore, the present results primarily characterize the effective-stress-dependent permeability response under the investigated room-temperature laboratory conditions. The possible influence of in situ reservoir temperature is beyond the scope of the present study and should be considered when applying the fitted parameters to deep-reservoir conditions. Because only seven samples from a specific formation interval were examined, the PM threshold and fitted model parameters are regarded as dataset-specific rather than universally applicable. In addition, pore-size distribution was not directly measured in this study; therefore, the pore-structure interpretations are based on mineralogical composition and stress-dependent permeability responses and should be understood as mechanistic inferences rather than direct pore-scale observations.