1. Introduction
With the continuous integration of emerging elements such as electric vehicles (EVs), internet data centers (IDCs), communication base stations (COMs), and distributed energy storage systems (DSTs), distribution networks that previously mainly served relatively stable loads are undergoing significant changes in their operating characteristics [
1,
2,
3,
4]. Unlike conventional loads, these flexible loads exhibit pronounced differences in operating mechanisms, temporal power profiles, and controllable operating ranges [
5]. As their penetration increases, they alter nodal power exchange characteristics, further influencing capacity requirements, power flow distribution, voltage levels, reactive power support, and steady-state power quality conditions in distribution networks [
6]. Consequently, accurately characterizing the differentiated impacts of various flexible load types on distribution network operating states has become an important research challenge in the analysis and planning of modern distribution systems [
7].
Recent global energy-transition pathways have placed increasing emphasis on electrification, renewable energy integration, and demand-side flexibility as key measures for reducing energy-related emissions [
8]. In this context, distribution networks are no longer only the terminal stage of electricity delivery but are becoming an important layer for accommodating new electricity demand, distributed resources, and flexible demand-side operation. Recent grid-development studies have also pointed out that insufficient grid reinforcement, planning, and operational coordination may become a constraint on clean-energy transitions, especially as renewable generation, electric mobility, and distributed resources continue to expand [
9]. Therefore, the transformation of distribution networks is not only driven by the growth of total electricity demand but also by the increasing diversity of resources connected at the distribution level.
At the same time, several emerging demand-side sectors are reshaping local load characteristics. The rapid growth of electric mobility is increasing charging demand and introducing stronger temporal concentration into distribution networks [
1]. The deployment of battery energy storage supports renewable energy accommodation and load shifting, but it also introduces bidirectional power exchange and state-dependent operating constraints [
10]. In parallel, the expansion of digital infrastructure, cloud computing, artificial intelligence services, and communication networks is increasing the electricity demand of data centers and communication facilities [
2]. These developments indicate that future distribution networks will need to accommodate resources with different operating mechanisms, temporal power profiles, controllable ranges, and reactive power characteristics. This provides a practical motivation for systematically assessing the heterogeneous impacts of emerging flexible loads on distribution network operation.
In recent years, research on the operational impacts of flexible load integration on distribution networks has expanded progressively. For EVs, Nutkani et al. [
11] provided a comprehensive review of EV charging impacts on distribution networks, summarizing the data types, assessment methods, mitigation strategies, and reported effects on load demand, voltage profiles, thermal capacity, and hosting capacity. Their review indicates that large-scale EV charging may intensify peak load, voltage deviation, and asset loading, and that coordinated charging and network management strategies are important for increasing hosting capacity. Karmaker et al. [
12] further reviewed EV hosting capacity analysis from the perspectives of technical constraints, scenario construction, data availability, software tools, and enhancement technologies. They identified active network management, flexible operating limits, demand response, optimal placement, and network reconfiguration as promising approaches for improving EV hosting capacity. These studies provide important references for EV integration, but they mainly focus on EV-related impacts and hosting capacity rather than comparing EVs with other emerging flexible load types under the same distribution network conditions.
For IDCs, Takci et al. [
13] analyzed data centers as potential flexibility resources for power systems. Their work defined the flexibility requirements of modern power systems and examined the flexibility assets of data centers, including UPS systems, backup generators, servers, thermal inertia, and workload shifting capability. The study shows that data centers can support renewable energy integration and net-zero targets by providing demand-side flexibility, but it also points out challenges related to Quality of Service, Service Level Agreements, and market participation mechanisms. Wang et al. [
14] further reviewed data center energy consumption modeling, forecasting methods, cooling technologies, and renewable power supply, and proposed an electricity–computility integration framework that couples data center operation with wind-solar-pumped-storage systems and cold energy storage. Their analysis shows that such integration can reduce operating costs, mitigate power shortages, and improve renewable energy utilization. However, these studies mainly focus on system-level flexibility, internal thermal management, or energy-computing coordination, while the local distribution-network impacts of IDCs, such as capacity pressure, voltage deviation, and reactive power demand, remain insufficiently compared with other flexible loads.
For COMs, Bin Mofidul et al. [
15] reviewed energy resilience improvement strategies for cellular base stations and critical infrastructures from multidimensional aspects. Their study emphasizes service continuity, energy coordination, uncertainty handling, backup power supply, and adaptive risk mitigation under 5G/6G development and extreme events. This provides useful insights into the resilience and backup-energy requirements of communication base stations. Nevertheless, the focus is mainly on communication-service continuity and energy resilience, while the steady-state impacts of COM integration on distribution network power flow, voltage behavior, and reactive power support are not systematically compared with other load types.
For DSTs, Mushid et al. [
10] reviewed battery energy storage systems for ancillary services in distribution networks, including voltage support, frequency response, peak shaving, renewable hosting capacity improvement, and power quality enhancement. Their review shows that BESS can provide fast active and reactive power support and improve distribution network operation, while also highlighting challenges such as battery degradation, control complexity, regulatory barriers, and high investment cost. However, most DST-related studies focus on the regulation value and ancillary service capability of storage itself, and less attention has been paid to comparing its grid impact with EVs, IDCs, and COMs under a unified assessment framework.
Recent studies on residential users’ flexibility participation and optimization-based energy management also provide useful references for flexible load modeling. Zeyad et al. [
16] proposed a transactive energy market framework for a rooftop-PV-powered residential community by integrating home energy management systems, multi-objective optimization, and aggregator-based peer-to-peer energy trading. Their study considered rooftop PV generation, battery energy storage systems, and smart appliances, and used NSGA-II to balance electricity consumption cost and peak-load reduction. The results show that the proposed framework can improve rooftop PV utilization, reduce grid dependency, and lower electricity consumption costs, demonstrating the value of residential end-user flexibility and coordinated energy exchange. This work provides an important perspective for understanding small-scale flexible resource participation. However, its focus is mainly on residential community energy management and market-based energy sharing, whereas the present study emphasizes the multi-dimensional impacts of several representative flexible load types on distribution network operating states.
Overall, existing studies have provided valuable foundations for understanding the modeling methods, flexibility potential, resilience characteristics, and grid-support functions of different flexible load types. However, two limitations remain. First, most studies focus on a single load category, such as EVs, IDCs, COMs, or DSTs, which makes it difficult to reveal the heterogeneous impacts of different flexible loads under identical distribution network conditions. Second, many existing models emphasize flexibility potential, hosting capacity, or equipment-level operation but do not sufficiently distinguish the physical constraints, behavioral response mechanisms, and regulation boundaries of multiple flexible loads within a unified impact assessment framework. Therefore, compared with previous studies, the novelty of this paper lies in developing fine-grained behavioral models for four representative flexible load types and evaluating their impacts within a unified multi-dimensional framework covering capacity, power flow and operation, and reactive power support and disturbance.
Against this backdrop, existing findings remain insufficient for systematically revealing the heterogeneous impact patterns of different flexible loads on distribution network capacity requirements, power flow distribution, voltage profiles, reactive power support, and steady-state power quality risks. To this end, this paper develops fine-grained behavioral models and a unified quantitative evaluation framework for multiple representative flexible loads, and conducts comparative analyses under graduated penetration scenarios. The main contributions of this paper are as follows:
- (1)
Fine-grained behavioral models are developed for four representative flexible load types, namely IDCs, COMs, EVs, and DSTs, capturing workload shifting, dynamic reserve capacity, vehicle-to-grid (V2G) constraints, and aging degradation, respectively.
- (2)
A multi-dimensional quantitative assessment framework is constructed to evaluate capacity pressure, power flow restructuring and operational fluctuations, and reactive power support and steady-state power quality risks in distribution networks.
- (3)
Graduated single-type penetration scenarios and an additional mixed-penetration scenario are designed to compare the operational impacts of different flexible load types and reveal their multi-dimensional heterogeneous and accumulated impact patterns on distribution network operation.
2. Fine-Grained Behavioral Models of Flexible Loads
To accurately evaluate the impacts of large-scale integration of different flexible loads on distribution network operating states, fine-grained behavioral models are first developed for IDCs, COMs, EVs, and DSTs. Each model incorporates the corresponding key physical constraints and operational characteristics to more accurately describe the operating behavior of each load type after grid integration, thereby providing a modeling foundation for the subsequent multi-dimensional impact assessment.
Since this study focuses on distribution-network impact assessment rather than electricity market clearing, the electricity price is treated as an exogenous tariff signal. In practical distribution networks, flexible loads usually respond to retail time-of-use tariffs or demand-response signals determined by utilities, aggregators, or market operators, while the distribution network itself generally does not determine real-time market-clearing prices. Therefore, a deterministic TOU tariff is adopted in this study as a practical benchmark price signal. This assumption enables the heterogeneous operating characteristics of different flexible load types to be compared under a unified external incentive. Nevertheless, in smart grid and electricity market environments, price signals may be updated in real time and exhibit uncertainty. The proposed modeling framework can be extended by replacing the TOU price sequence with real-time or stochastic price scenarios, which will be further investigated in future work.
2.1. Behavioral Model of Distributed Energy Storage Incorporating Aging Degradation
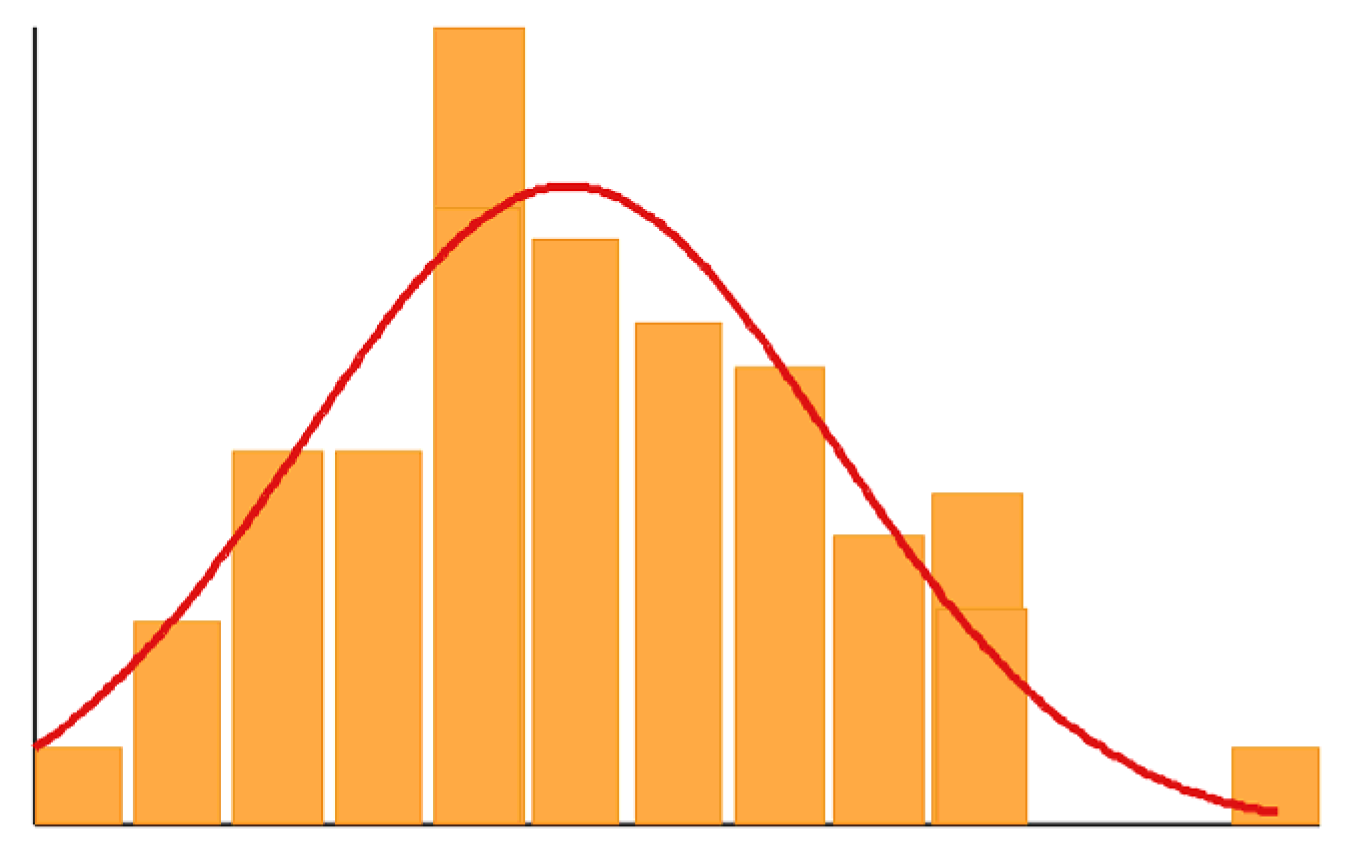
Considering the heterogeneity in rated capacity, lifetime parameters, and investment costs among distributed storage units within a region, these parameters are modeled using normal distributions, as shown in
Figure 1. Under time-of-use (TOU) pricing, storage systems typically charge during low-price periods and discharge during high-price periods to achieve energy time shifting and operational revenue. However, frequent cycling accelerates capacity degradation and incurs additional aging costs [
17,
18].
Figure 1.
Schematic of probability distributions of key DST parameters.
Figure 1.
Schematic of probability distributions of key DST parameters.
Considering the heterogeneity in rated capacity, lifetime parameters, and investment costs among distributed storage units within a region, the relevant parameters are characterized using probabilistic distributions. After samples are obtained for each parameter, weighted aggregation is applied to derive equivalent capacity, lifetime, and cost parameters that represent the overall operating characteristics. This approach accounts for parameter heterogeneity while reducing model complexity, providing a parameter basis for subsequent behavioral modeling [
19].
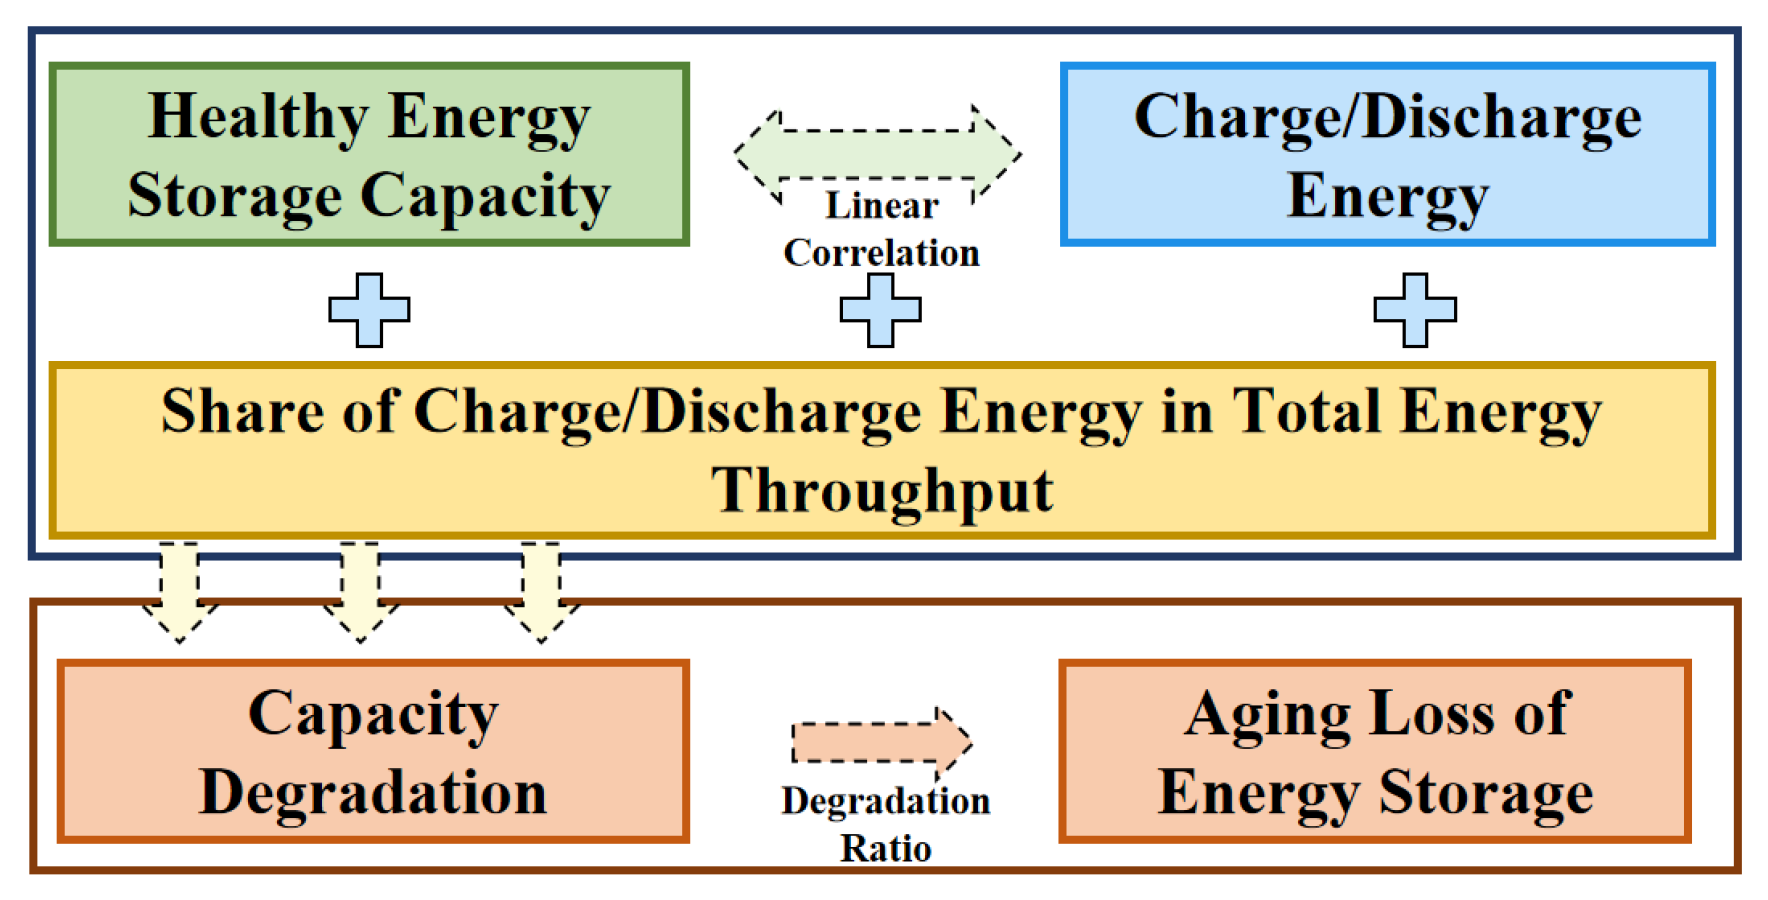
After this aggregation, the DST model represents the operation of an equivalent group of controllable storage units, with the aging characterization process illustrated in
Figure 2. Unlike EV charging, which is strongly shaped by individual travel needs, DST operation is normally scheduled by a controller, owner, or aggregator according to price signals, degradation costs, and technical limits. Thus, the probability-based parameter treatment accounts for differences among storage units, while the following optimization describes their coordinated charging and discharging behavior.
Figure 2.
Schematic of DST aging characterization.
Figure 2.
Schematic of DST aging characterization.
To characterize DST operating behavior under the joint influence of price incentives and degradation costs, an optimization model incorporating aging losses is formulated. The objective function is
where
represents the net operational cost over the scheduling horizon,
is the objective the aging loss term captures battery degradation costs and
reflects charging and discharging gains.
The aging loss and operational revenue terms are expressed as
where
and
denote the initial rated capacity and end-of-life capacity of the storage system, and
is the investment cost of the storage unit. The factor 0.2 is used as the capacity degradation conversion coefficient, since storage capacity reaching 80% of the initial rated capacity is conventionally regarded as the end-of-life threshold.
denotes the purchase price at time
,
is the charging power at time
,
is the selling price at time
, and
is the discharging power at time
.
The aging-cost term is used in this study as an equivalent representation for distribution-network impact assessment, rather than as a detailed electrochemical lifetime model for an individual battery device. The purpose of introducing this term is to reflect the degradation cost associated with frequent charge/discharge behavior and to avoid unrealistically aggressive storage operation in the aggregate DST model. The coefficient 0.2 does not represent a linear degradation rate; instead, it corresponds to the commonly adopted end-of-life criterion that a battery is retired when its available capacity decreases to 80% of its initial rated capacity. Thus, the factor 0.2 denotes the usable capacity fade range from 100% to 80% and is used to convert the investment cost into an equivalent aging cost. Detailed nonlinear degradation mechanisms related to depth of discharge, temperature, charge/discharge rate, and operating history are not explicitly modeled, because the focus of this work is on comparing the grid-impact characteristics of different flexible load types rather than predicting the lifetime evolution of specific battery cells.
To ensure the physical feasibility of the charging/discharging schedule, aging evolution and operating boundary constraints are further imposed:
where
and
denote the dispatchable energy capacity at time
and
, respectively;
and
are the charging and discharging power at time
;
and
are the charging and discharging efficiencies;
is the upper limit of charging and discharging power; and
and
are the upper and lower state-of-charge bounds.
where
and
are the actual maximum capacities at time
and
, respectively;
is the aging rate at time
;
is the cycle lifetime of the storage; and
is the fixed degradation rate.
The degradation model in this study primarily characterizes battery capacity degradation, because battery aging directly affects the dispatchable energy capacity and operational cost of DSTs and storage-related components. Aging effects of power electronic interfaces, such as EV onboard chargers, rectifiers, and converters in COM backup systems, are not explicitly modeled in the present framework. These components may experience efficiency deterioration, thermal stress, and changes in operating characteristics over long-term operation, which may further influence grid-side power demand and power factor. Incorporating such effects requires additional lifetime models for power electronic equipment and long-term operating data, and will be considered in future extensions.
2.2. Behavioral Model of Electric Vehicles Incorporating V2G Constraints
As a representative mobile flexible load, EV integration exhibits pronounced spatiotemporal stochasticity due to user travel behavior, while also providing bidirectional energy interaction potential with the grid. Unlike DSTs, EV charging/discharging behavior is not entirely determined by price signals. Instead, it is primarily constrained by factors such as arrival time, departure time, parking duration, and the energy required for the next trip. EVs can participate in grid interaction only after basic travel energy requirements are satisfied [
20,
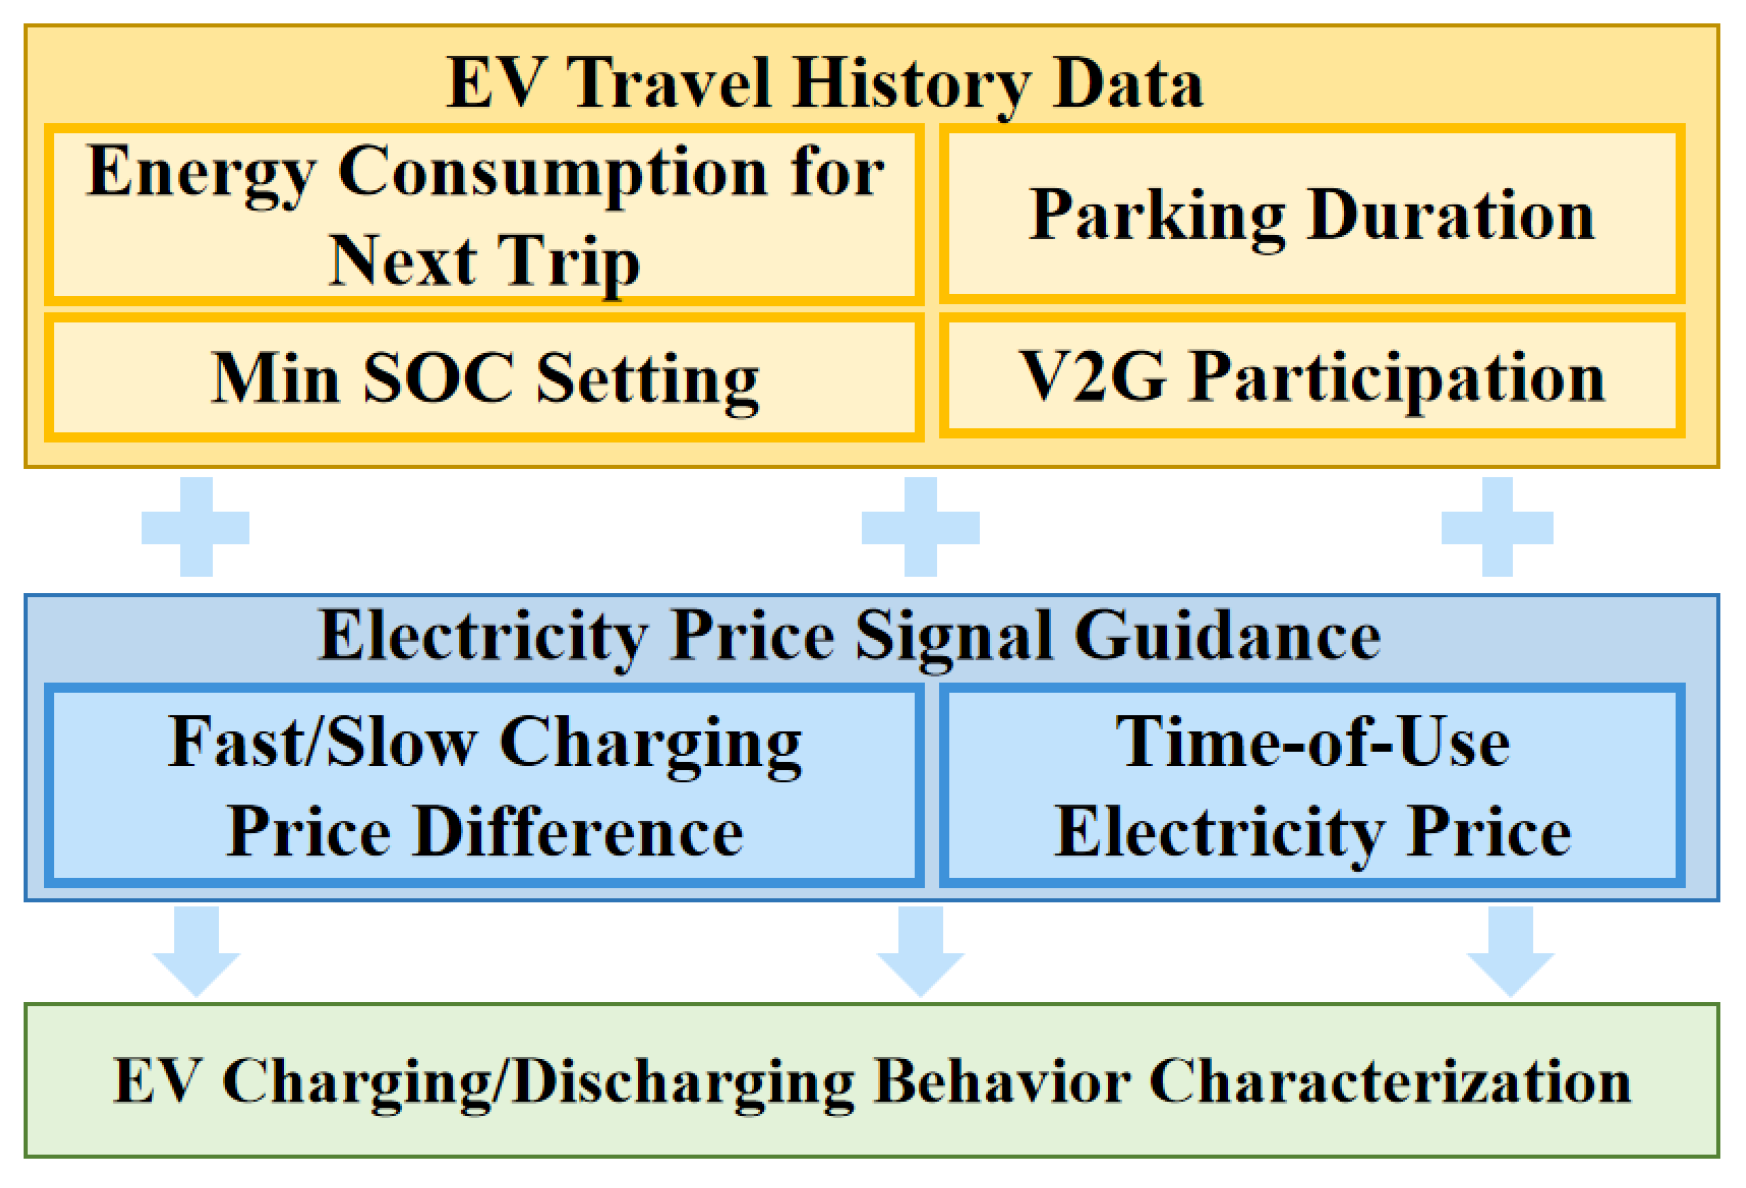
21]. Therefore, the EV model does not treat users as purely economically optimal agents. The arrival time, departure time, parking duration, minimum energy constraint, and next-trip energy requirement restrict the feasible V2G participation range and ensure that users’ basic travel reliability is satisfied before any grid interaction. These behavioral parameters are extracted or statistically characterized from historical travel and charging data, so inconsistent charging habits and user-side temporal preferences are implicitly reflected in the model through data-driven parameterization. In particular, the owner-specified minimum energy level and the energy required for the next trip can partly represent conservative charging behavior and range-anxiety-related preferences. Although an independent psychological rationality coefficient is not introduced, the model incorporates user behavior heterogeneity through historical-data-based constraints and parameters, as illustrated in
Figure 3.
Figure 3.
Schematic of EV charging/discharging modeling.
Figure 3.
Schematic of EV charging/discharging modeling.
Based on TOU pricing guidance and differentiated fast/slow charging cost structures, an EV behavioral model incorporating minimum travel energy requirements and V2G constraints is formulated to characterize the temporal response of EVs under the joint influence of user needs and grid interaction.
The optimization model is formulated to minimize the operational cost:
where
denotes the total operational cost of the EV.
The operational cost is expressed as
where
and
are the purchase prices for fast and slow charging at time
,
and
are the corresponding charging powers,
is the selling price at time
, and
is the V2G discharging power at time
.
Constraints are imposed to ensure that the operational schedule satisfies user travel requirements and physical limits:
where
is the minimum energy level;
is the minimum energy level specified by the owner; and
is the energy required for the next trip.
The V2G-related constraints are
where
,
, and
denote the dispatchable capacities at time
,
, and at departure time
;
and
are the charging and discharging power;
and
are the efficiencies;
and
are the fast and slow charging power levels; and
is the maximum rated capacity.
2.3. Behavioral Model of Communication Base Stations Incorporating Dynamic Reserve Capacity
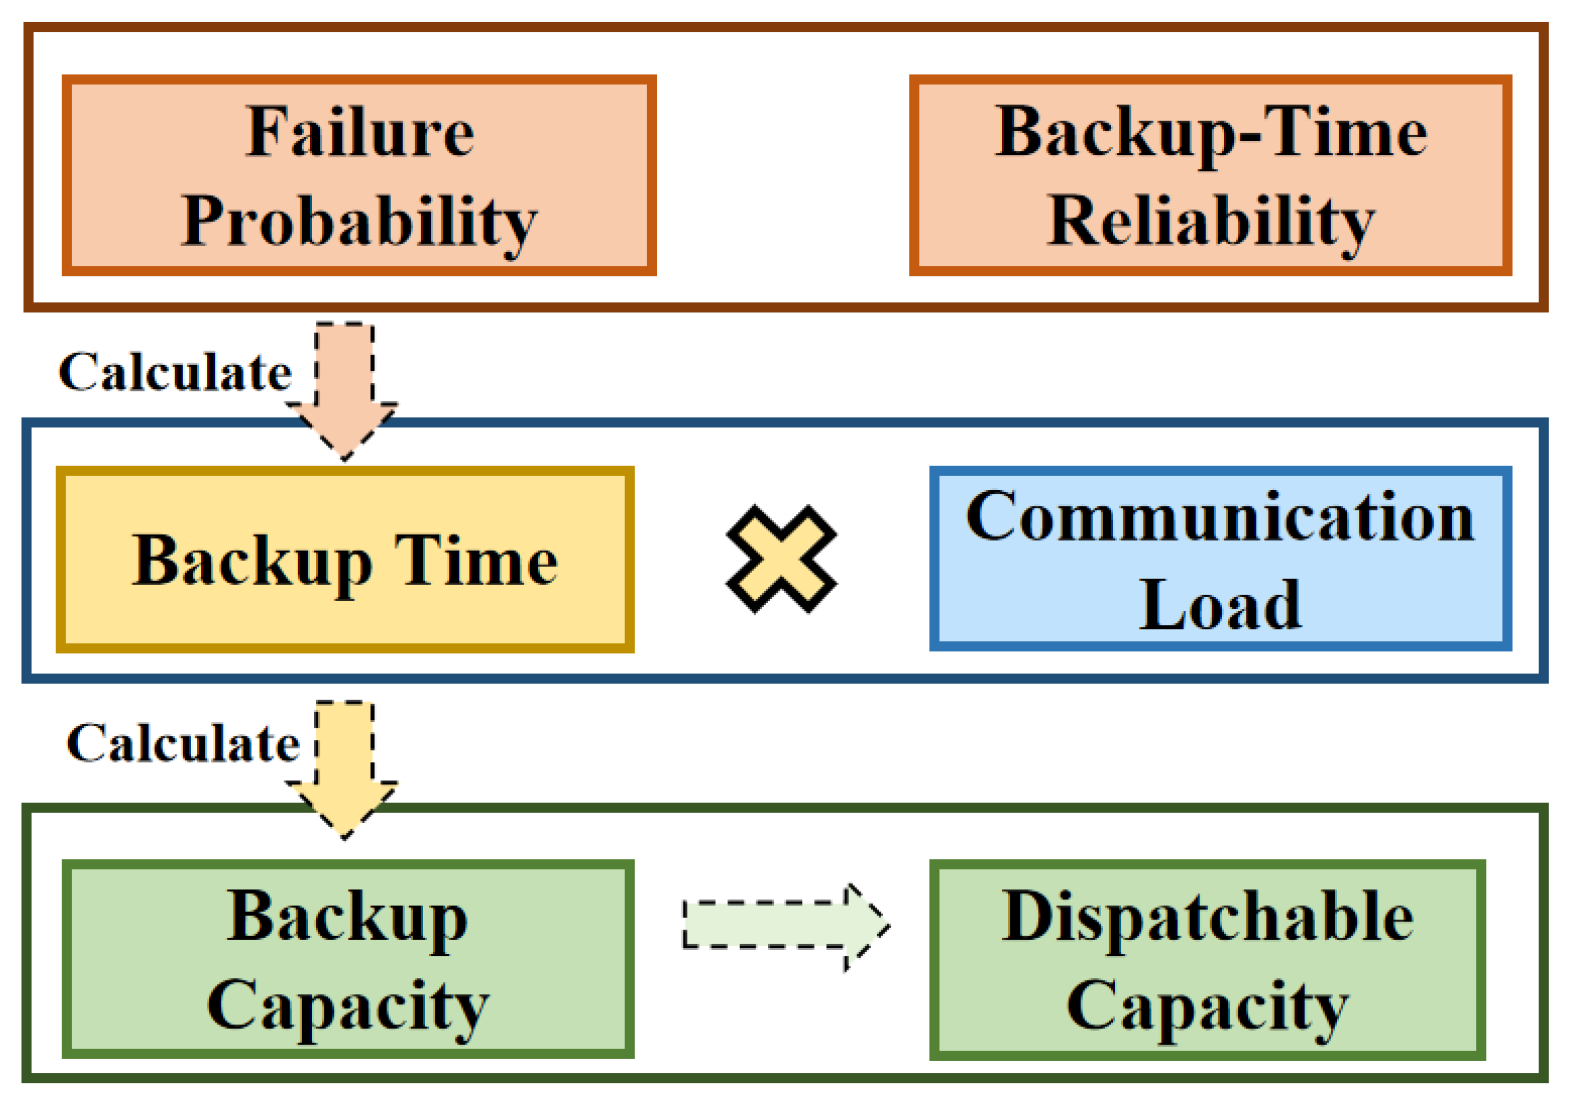
COM loads are characterized by continuous operation, high load rigidity, and stringent power supply reliability requirements, and their operating behavior is markedly different from that of ordinary adjustable loads. To ensure continuity of communication services, base stations are typically equipped with backup energy storage to provide temporary power supply under distribution network faults or outage conditions [
22,
23], as illustrated in
Figure 4.
Figure 4.
Schematic of COM dynamic reserve capacity modeling.
Figure 4.
Schematic of COM dynamic reserve capacity modeling.
Consequently, the internal storage of base stations is not fully driven by price signals. Its adjustable capacity is first constrained by backup power supply requirements, and only the remaining capacity beyond the minimum backup time and reserve capacity requirements can participate in temporal scheduling. Additionally, base stations are typically co-located with photovoltaic (PV) systems [
24,
25].
A COM behavioral model incorporating dynamic backup time, reserve capacity constraints, and internal power balance is formulated to characterize adjustable operating boundaries under reliability constraints. The objective function for minimizing the total operational cost is
where
is the total operational cost,
is the battery aging cost,
is the electricity purchase cost, and
is the penalty for photovoltaic curtailment.
Each cost component is expressed as
where
and
are the initial and end-of-life capacities of the base station storage,
is the capital cost (divided by 0.2 since storage reaching below 80% of initial capacity should be retired),
is the electricity purchase price,
is the purchase power,
is the unit curtailment penalty, and
is the curtailed PV output at time
.
To ensure adequate continuous power supply under fault scenarios, minimum reserve capacity constraints are imposed. Because nodal fault probabilities and outage durations are time-varying, the minimum backup time is not a fixed constant but is jointly determined by the outage probability distribution and backup-time reliability requirements. Combined with the communication load power consumption characteristics, the minimum reserve capacity in each period is computed as a lower bound on the dispatchable storage margin. The corresponding constraints are
where
is the communication load power consumption at time
,
and
are the corresponding power consumption coefficients,
is the communication traffic at time
,
is the nodal outage probability,
is the probability that outage duration is less than the minimum backup time,
is the backup time reliability requirement that must satisfy security criteria,
is the outage time probability distribution, T_min is the dynamic minimum backup time,
is the minimum reserve energy at time
, and
is the PV output utilized by the base station at time
.
PV operation constraints are further imposed to reflect renewable curtailment and resource availability:
where
is the maximum available PV generation at time
, and
is the permissible curtailment ratio.
The storage model for base stations follows the formulation described in
Section 2.1 and is not repeated here.
2.4. Behavioral Model of Data Centers Incorporating Workload Shifting
IDC loads are characterized by continuous operation, high energy intensity, and prominent workload constraints. Their main energy-consuming components include IT computing loads and cooling loads [
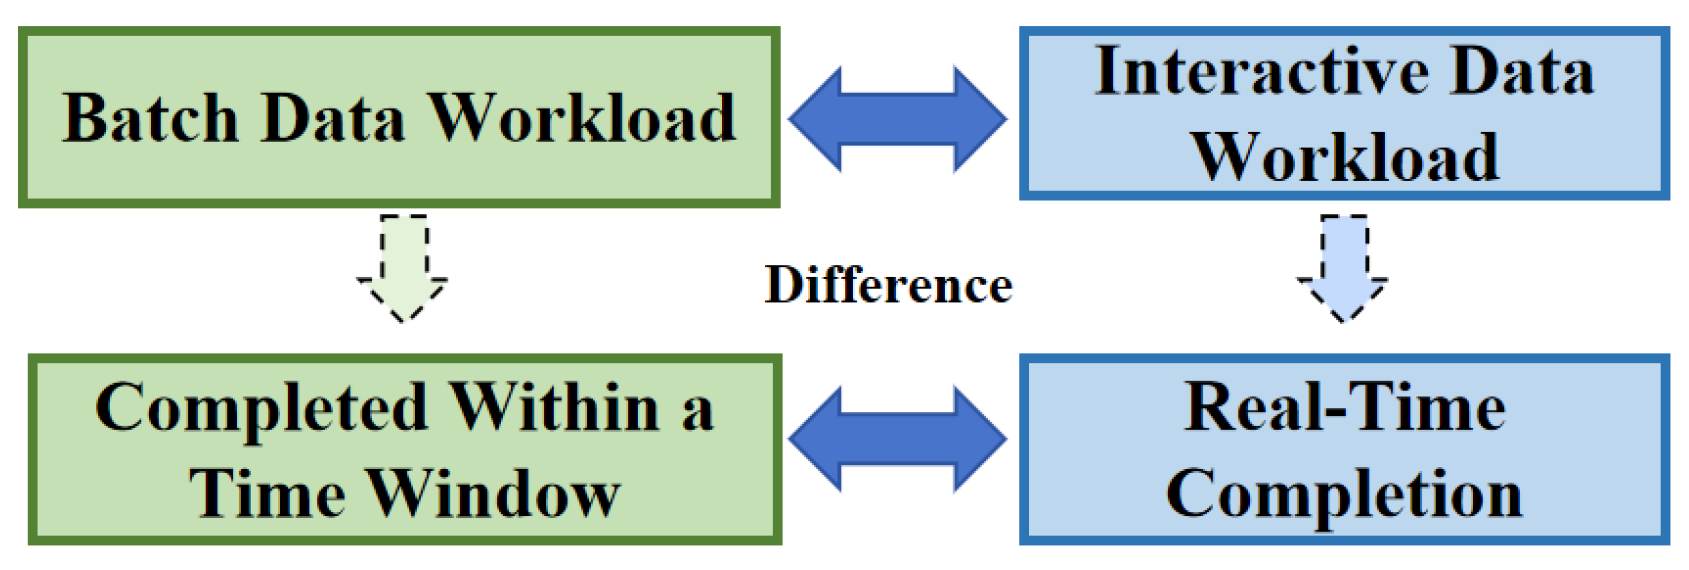
26]. According to real-time requirements, computing loads can be further categorized into interactive and batch workloads. Interactive workloads are latency-sensitive and must be processed in real time, making temporal shifting infeasible; batch workloads have relatively relaxed real-time requirements and only need to be completed within a given time window, which gives them schedulable potential [
27], as illustrated in
Figure 5.
Figure 5.
Schematic of IDC workload types and temporal characteristics.
Figure 5.
Schematic of IDC workload types and temporal characteristics.
An IDC behavioral model is developed to account for workload shifting, task completion constraints, and cooling power effects, thereby characterizing the coordination mechanism between workload constraints and energy-use adjustment. The objective function for minimizing the total operational cost is
where
is the total operational cost,
is the storage aging cost,
is the electricity purchase cost,
is the PV curtailment penalty, and
is the workload timeout penalty.
Each cost component is expressed as
where
and
are the initial and end-of-life storage capacities,
is the capital cost (divided by 0.2 for the same capacity retirement threshold),
is the purchase price,
is the purchase power,
is the unit curtailment penalty,
is the curtailed PV output,
is the total timeout duration, and
is the per-unit timeout penalty.
Workload scheduling constraints are imposed to ensure that business completion requirements are satisfied:
where
is the workload
power consumption at time
,
is a binary variable indicating whether the workload
is processed at time
,
is the workload
deadline,
is the cooling power at time
,
is the cooling-to-computing power conversion coefficient,
is the baseline cooling power,
is the total workload power, and
is the total IDC load at time
.
2.5. Model Validation and Data Sources
To substantiate the behavioral adequacy of the proposed models, the data sources and validation basis of the four flexible load models are further clarified in this subsection. The objective of this study is to establish a unified comparative assessment framework rather than to develop a new standard model for a single load type. Therefore, the model validation focuses on whether the operating characteristics, constraints, and temporal response patterns of each flexible load are consistent with reported data and existing studies.
For EVs, the key behavioral parameters, including arrival time, departure time, parking duration, owner-specified minimum energy level, and energy required for the next trip, are extracted or statistically characterized from historical travel and charging data. These parameters constrain the feasible charging and V2G participation range, ensuring that the generated EV load profile is consistent with practical user travel requirements and charging behavior reported in EV integration studies [
20,
21]. For DSTs, the rated capacity, lifetime parameters, and investment costs are characterized using probabilistic distributions to reflect the heterogeneity of distributed storage resources. The battery degradation model adopts the commonly used end-of-life criterion that battery capacity reaching 80% of its initial value represents the retirement threshold, which is consistent with degradation-aware storage scheduling studies [
17,
18,
19].
For COMs, the load model is constructed based on traffic-driven power consumption and dynamic backup reserve requirements. The communication traffic level determines the operating power demand, while outage probability and backup-time reliability requirements are used to determine the minimum reserve capacity. This treatment is consistent with studies on cellular base station energy resilience, backup energy storage configuration, and reliable power supply [
22,
23,
24,
25]. For IDCs, the model distinguishes interactive and batch workloads and considers workload shifting, task deadlines, and cooling power demand. This structure follows the typical classification of data center workloads and the coupling between computing load and cooling energy consumption discussed in existing IDC flexibility and energy management studies [
26,
27].
The present validation is mainly based on literature-supported behavioral consistency, historical-data-based parameterization, and explicit data-source justification. Due to the limited availability of field measurement data for commercial IDCs, base stations, and private flexible load resources, direct measurement-based calibration is not fully conducted in this study. Future work will further compare the generated load profiles with measured EV charging curves, standard IDC load profiles, and field data from distribution network operators to improve the empirical validation of the proposed models.
3. Multi-Dimensional Quantitative Assessment Framework for Distribution Networks with Large-Scale Flexible Load Integration
Following the large-scale integration of flexible loads, changes in nodal power and its temporal distribution affect distribution network capacity requirements, power flow operating states, reactive power support, and steady-state power quality risks [
27,
28,
29,
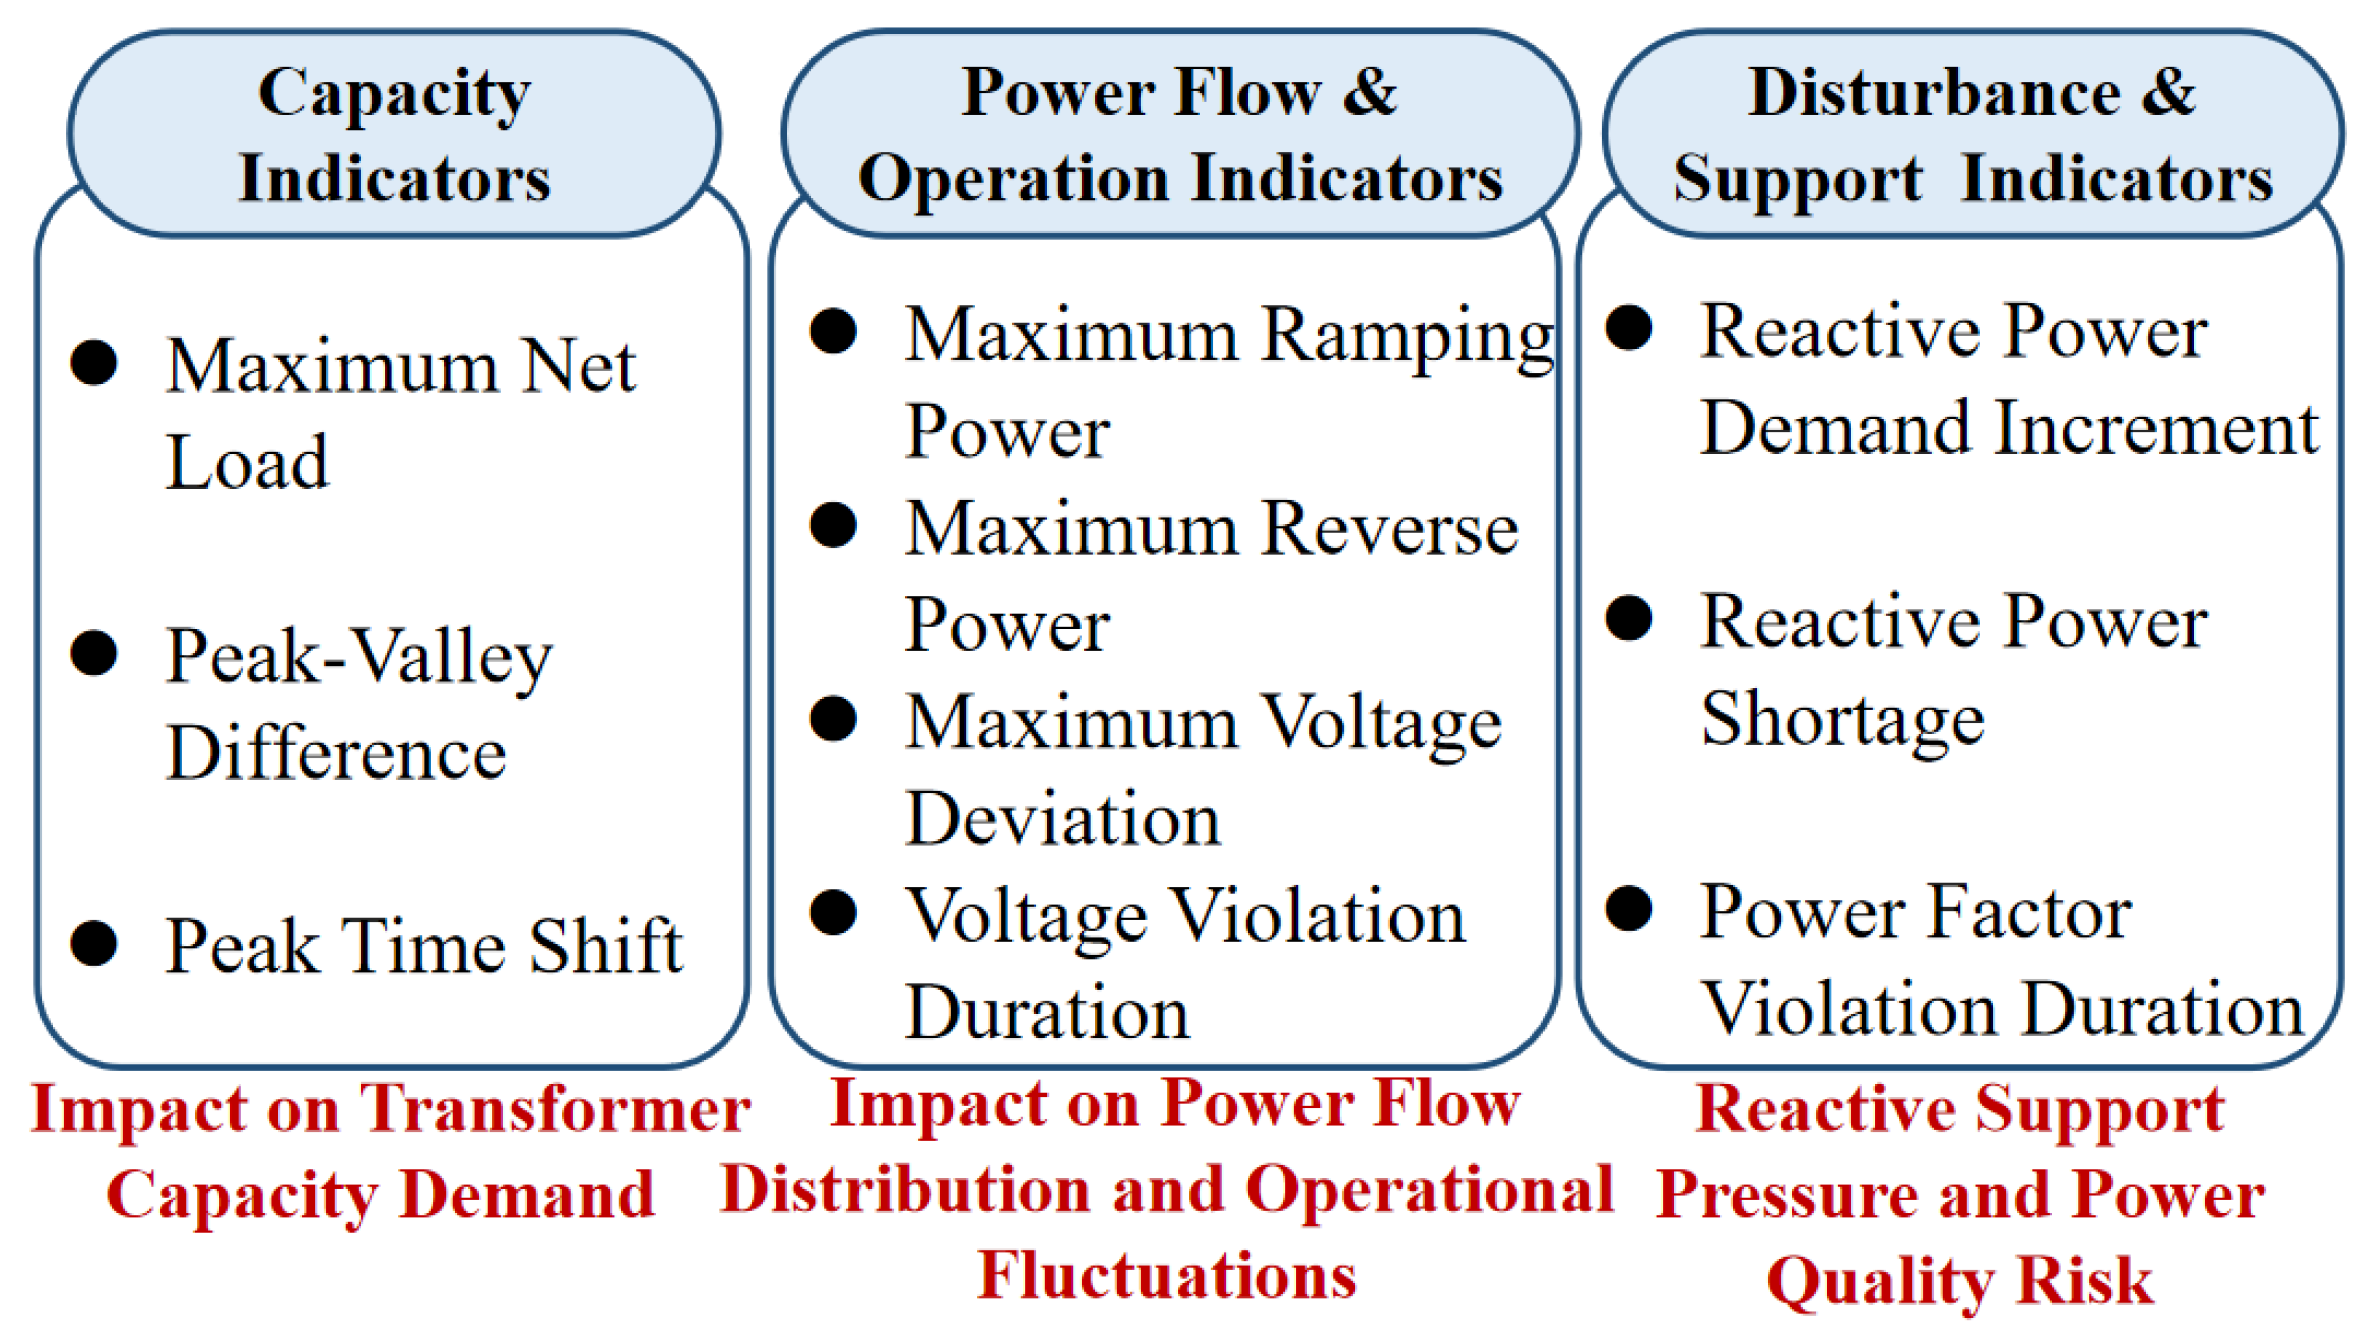
30]. To enable unified cross-type comparison of flexible load integration effects, a multi-dimensional quantitative assessment framework is constructed across three dimensions: capacity, power flow and operation, and reactive power support and disturbance, as shown in
Figure 6. Indicators with clear physical interpretations are selected for subsequent analysis. The assessment framework in this study is established for normal steady-state operating conditions. Under fault or contingency conditions, the impacts of flexible loads may become more complex because they are jointly affected by fault location, fault type, protection action, outage duration, emergency control, and network reconfiguration strategies. Therefore, network-level fault response and post-fault restoration are not explicitly simulated in the present framework. Nevertheless, the proposed indices, such as voltage deviation, reverse power flow, reactive power shortage, and power factor violation duration, can provide a steady-state risk basis for identifying nodes or load types that may require further contingency-oriented analysis.
Figure 6.
Multi-dimensional quantitative assessment index system for distribution networks.
Figure 6.
Multi-dimensional quantitative assessment index system for distribution networks.
3.1. Capacity Dimension: Quantitative Assessment Indices
Since distribution transformer capacity allocation fundamentally depends on the maximum active load demand at nodes or local areas during representative operating periods, changes in capacity requirements induced by flexible load integration can be equivalently attributed to variations in nodal net load peaks, fluctuation magnitudes, and peak occurrence times [
31]. Accordingly, the maximum nodal net load is used to characterize the trend of capacity demand change, and maximum net load, peak-valley difference, and peak-time shift are selected as capacity-dimension indices.
Let the net load at node
during period
be
. The maximum net load is defined as
where
denotes the set of periods in the evaluation horizon. This index represents the maximum load level sustained by the node during the assessment period; a larger value indicates more significant upward pressure on local transformer capacity requirements following emerging element integration.
The nodal net load peak-valley difference is defined as
This index characterizes the amplitude of nodal net load fluctuations. A larger peak-valley difference indicates greater temporal variability in the nodal load curve after integration, which may further intensify local equipment capacity allocation pressure and operational adjustment requirements.
To characterize the migration of load peak occurrence times following integration, the peak-time shift is defined as
where
denotes the period at which nodal net load reaches its maximum value after emerging element integration, while
denotes the peak period under the original load condition. This index reflects the degree to which the temporal load distribution is restructured by emerging element integration; a larger value indicates a greater deviation of the peak load occurrence from the original operating pattern.
To further quantify the capacity increment induced by integration, the maximum net load increment is defined as
where
and
denote the maximum nodal net load following integration and under original load conditions, respectively. This index directly reflects the marginal increase in local capacity demand attributable to emerging element integration.
The above indices collectively enable unified quantitative characterization of capacity demand changes induced by large-scale integration of different flexible loads from the perspectives of load level, fluctuation intensity, and temporal migration.
3.2. Power Flow and Operation Dimension: Quantitative Assessment Indices
Although different flexible load types differ in their operating mechanisms, their external impacts on distribution network power flow and operating states can be uniformly expressed as changes in nodal net active power injection levels and their temporal fluctuation characteristics [
32,
33]. Accordingly, nodal net power injection variation is adopted as the core representation quantity, and maximum ramp power, maximum reverse power, maximum voltage deviation, and voltage violation duration are selected as quantitative indices.
Let
denote the net power injection at node
during period
. The maximum ramp power is defined as
This index characterizes the maximum variation magnitude of nodal net power injection between adjacent periods. A larger value indicates stronger power fluctuations induced by flexible load integration, with more pronounced impacts on local power flow regulation and operational stability.
To reflect the possible occurrence of reverse power flow, the maximum reverse power is defined as
This index represents the maximum reverse power fed from the node to the upstream network during the evaluation period. A larger value indicates a greater likelihood of power flow direction reversal and a higher reverse power flow risk after integration.
Let
denote the voltage magnitude at node
during period
and
the rated voltage. The maximum voltage deviation is defined as
This index represents the maximum departure of the nodal voltage from the rated operating state. A larger value indicates a more pronounced disturbance to the nodal voltage condition after integration.
Let
and
denote the upper and lower voltage limits. The voltage violation duration is defined as
where
represents the cumulative duration of voltage violations at the node
during the assessment period. This index measures the persistence of voltage risk; a larger value indicates a more severe impact of integration on nodal voltage security.
The above indices address power flow restructuring, operational fluctuations, and voltage risks, thereby providing a unified characterization of the impacts of large-scale flexible load integration on distribution network operating states.
3.3. Reactive Power Support and Disturbance Dimension: Quantitative Assessment Indices
Beyond altering nodal active power injection characteristics, flexible load integration may also induce changes in reactive power demand, power factor, and voltage support conditions, further affecting local reactive power balance and steady-state power quality risks [
34]. It should be noted that the power quality issues discussed here are confined to the steady-state operating level, specifically risks associated with reactive power support, power factor, and voltage, and exclude harmonics, imbalance, and transient power quality phenomena. Accordingly, equivalent reactive power demand variation is adopted as the core representation quantity, and reactive power demand increment, reactive power shortage, and power factor violation duration are selected as quantitative indices.
Let
denote the reactive power demand at node
during period
. The reactive power demand increment is defined as
where
and
denote the reactive power demand following integration and under the original load condition, respectively. This index characterizes the additional reactive power support requirement introduced by emerging element integration; a larger value indicates greater dependence of the node on external reactive power support resources.
Let
denote the reactive power support capacity available at node
during period
. The reactive power shortage is defined as
This index represents the maximum degree of reactive power supply–demand imbalance during the assessment period. A larger value indicates a higher likelihood of local reactive power deficiency after integration, thereby increasing voltage instability and operational risk.
To measure the persistence of power factor degradation, let
and
denote the power factor at time
and its allowable lower bound. The power factor violation duration is defined as
where
denotes the cumulative duration of power factor violations at the node
during the assessment period. This index characterizes the persistence of power quality-related risks following integration; a larger value indicates that the nodal operating state deviates from the acceptable power factor range for a longer duration.
The above indices enable unified quantitative characterization of distribution network support risks induced by the large-scale integration of different flexible loads from the perspectives of reactive power support pressure and operational disturbance.
4. Case Study
To validate the effectiveness of the proposed models and assessment framework, case studies are conducted based on the fine-grained behavioral models developed in
Section 2 and the multi-dimensional quantitative indices established in
Section 3. Under a unified distribution network scenario, graduated penetration experiments are designed to comparatively analyze the large-scale integration impacts of four representative flexible load types: EVs, DSTs, IDCs, and COMs. Analyses are conducted across the three dimensions of capacity, power flow and operation, and reactive power support and disturbance, examining distribution transformer capacity demand changes, power flow restructuring and operational fluctuation characteristics, and reactive power support pressure and steady-state power-quality-related risks, thereby revealing heterogeneous impact patterns on distribution network operating states.
The unified distribution network scenario is constructed as a synthetic equivalent network for controlled comparison rather than a site-specific practical feeder. In different scenarios, EVs, DSTs, IDCs, and COMs are connected to the same representative access point, while the base-load condition, upstream network condition, and evaluation indices remain unchanged. Under this setting, the reverse power flow index represents the maximum net power injected from the representative access point to the upstream network during the evaluation period, whereas the voltage deviation index reflects the local voltage response caused by changes in active and reactive power injection. Therefore, the results should be interpreted as a controlled comparative assessment of different flexible load types rather than a direct assessment of a particular feeder.
4.1. Impact on Distribution Transformer Capacity Requirements
This section employs the capacity-dimension quantitative assessment indices to comparatively analyze changes in distribution transformer capacity requirements induced by different flexible load types at various penetration levels. Using maximum net load, peak-valley difference, and peak-time shift as key indicators, the differentiated performance of each load type in terms of peak amplification, load fluctuation enhancement, and peak-period migration is examined.
As shown in
Table 1, at a 10% penetration level, different flexible loads already exhibit clearly differentiated capacity impact characteristics. Overall, the integration of EVs, IDCs, and COMs leads to an increase in the maximum nodal net load, with IDCs producing the most pronounced increase, followed by COMs, whereas the effect of EVs is comparatively weaker. DSTs show virtually no discernible effect on peak load. A similar pattern is observed for the peak-valley difference, with IDCs and COMs showing more significant increases, indicating that even at a relatively low penetration level, these two load types simultaneously elevate the nodal peak load and amplify net-load fluctuations.
As shown in
Table 2, when the penetration level increases to 30%, the capacity impacts of each load type are further intensified, while the differences among load types remain pronounced. The integration of EVs, IDCs, and COMs continues to increase the maximum nodal net load. Among them, IDCs show the strongest peak amplification, followed by COMs, whereas the effect of EVs is relatively weaker. The impact of DSTs remains limited. Concurrently, the peak-valley difference widens further, particularly for IDCs and COMs, indicating that under high-penetration conditions, these two load types not only significantly aggravate local capacity pressure but also amplify nodal net-load fluctuations.
Regarding peak-time shift, the integration of different flexible loads also produces notable differences in load temporal distribution. EVs already exhibit peak migration at relatively low penetration levels. At 30% penetration, EVs, DSTs, and COMs all display varying degrees of peak-time shift, with EVs showing the most prominent temporal redistribution effect. In contrast, the peak time of IDCs remains essentially unchanged, indicating that their primary effect lies in amplifying the peak level and fluctuation magnitude rather than shifting the peak period.
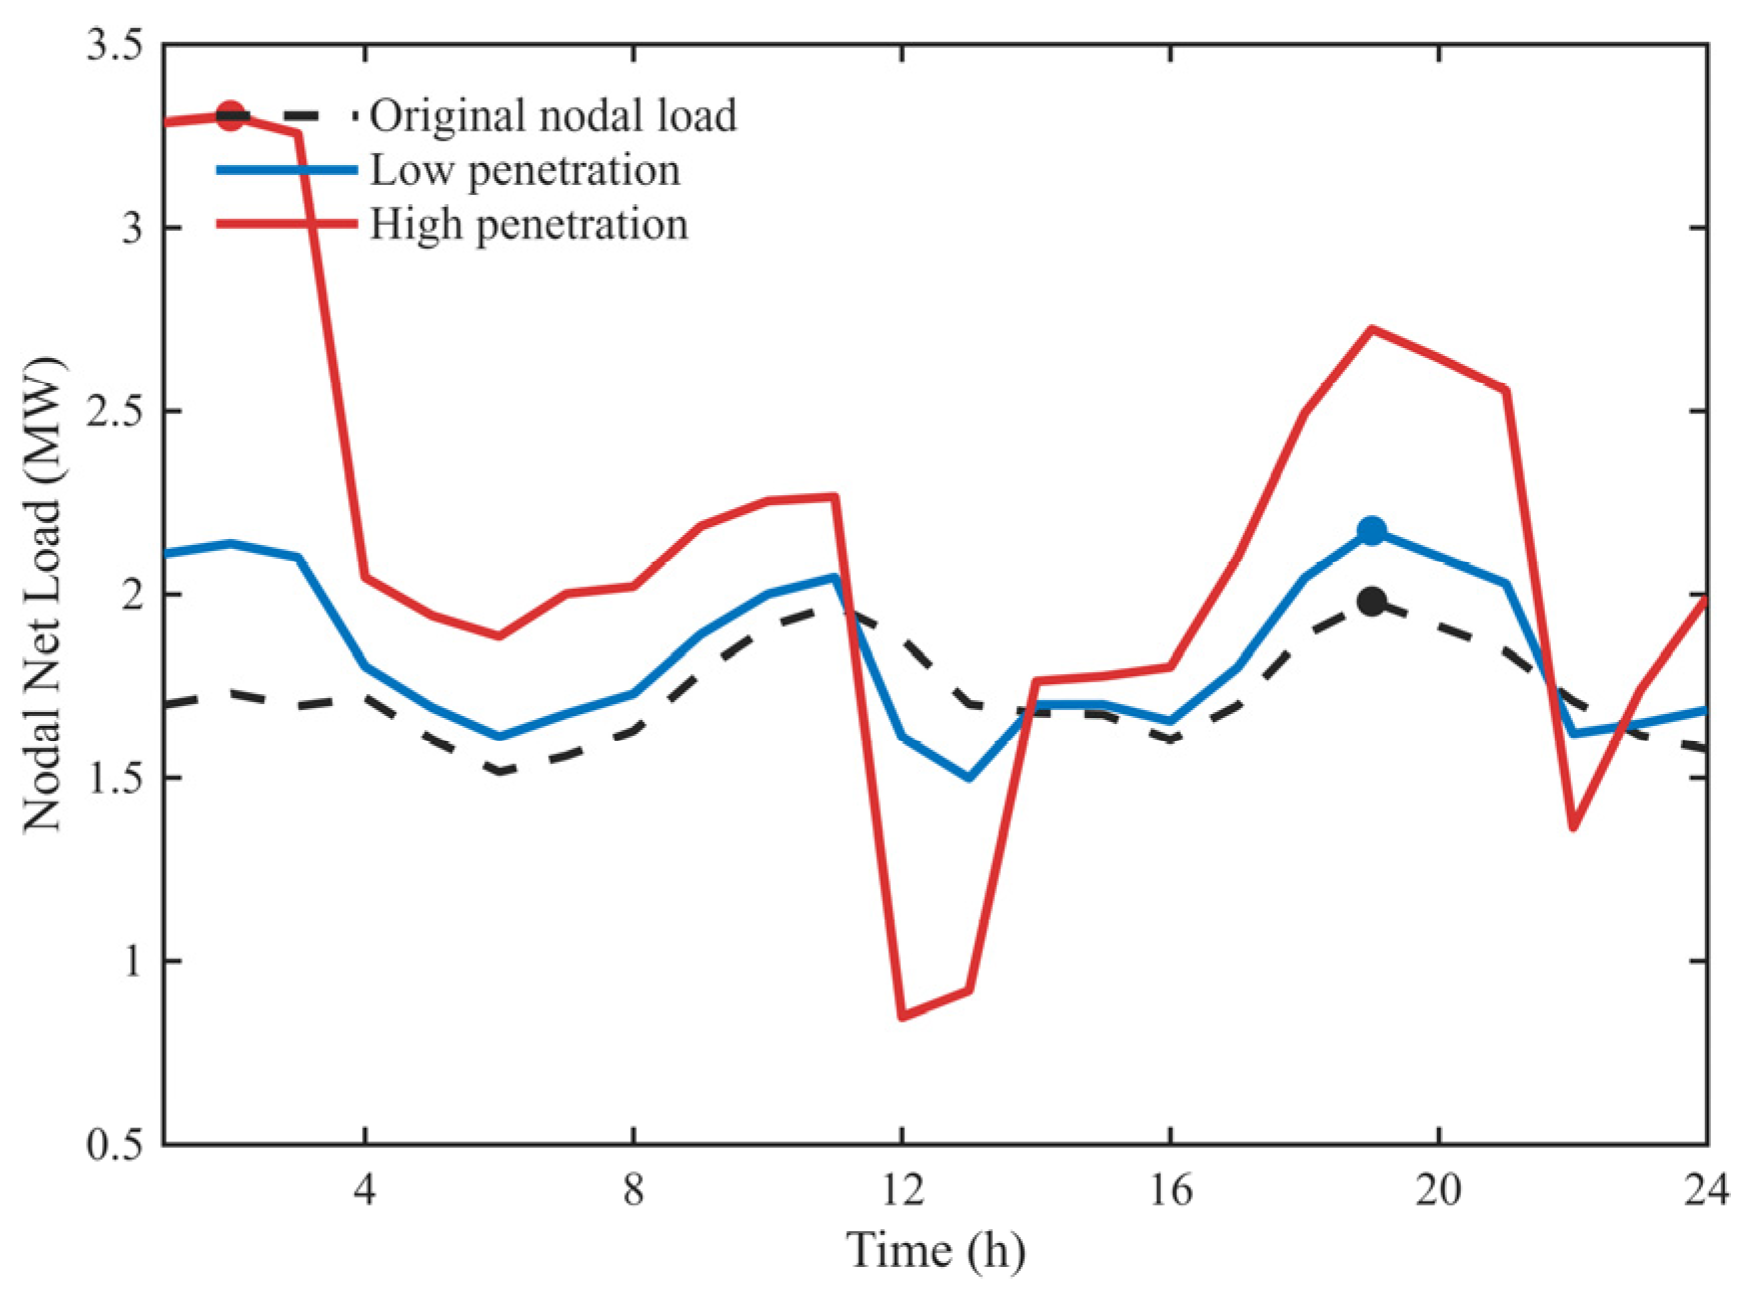
Taking COMs as an example,
Figure 7 further illustrates changes in nodal net load curves at different penetration levels. After COM integration, the nodal net load curve shifts upward overall. As the penetration level increases from 10% to 30%, the peak level rises further and the amplitude of curve fluctuations also expands. Additionally, the duration of high-load periods is extended, indicating that COM integration not only raises local peak load but also reconstructs, to some extent, the distribution of heavy-load periods at the node.
Figure 7.
Nodal net load curves following COM integration at different penetration levels.
Figure 7.
Nodal net load curves following COM integration at different penetration levels.
The differentiated capacity impacts can be further explained by the intrinsic operating characteristics of the four flexible load types. IDCs maintain a high and continuous electricity demand due to the combined operation of IT equipment and cooling systems, so their integration directly raises the local load level and enlarges the peak-valley difference. COMs also operate continuously to satisfy communication reliability requirements, and their reserve constraints limit the extent to which their load can be shifted away from heavy-load periods. Therefore, COMs also increase transformer capacity pressure, although their impact is slightly weaker than that of IDCs. EVs mainly affect capacity demand through temporally concentrated charging behavior. When charging demand overlaps with the original load peak or shifts to another high-load period, peak-time migration and peak-valley amplification become more evident. In contrast, DSTs are governed by charging/discharging constraints, state-of-charge limits, and aging costs, which make their net impact on transformer capacity comparatively moderate.
4.2. Impact on Power Flow Direction and Operational Fluctuation Characteristics
This section employs the power flow and operation dimension quantitative assessment indices to comparatively analyze the power flow restructuring and operational state changes induced by different flexible load types at various penetration levels. Using maximum ramp power, maximum reverse power, maximum voltage deviation, and voltage violation duration as key indicators, the differentiated performance of each load type in terms of operational fluctuation amplification, reverse power flow formation, and voltage deviation is examined.
Because power flow redistribution effects are negligible at low penetration levels, this analysis focuses on penetration levels of 30% and 50% to capture more pronounced directional changes in branch power flow patterns.
As shown in
Table 3, at a 30% penetration level, EVs, IDCs, and COMs all lead to increased maximum ramp power, with IDCs and COMs showing more significant increases, reaching 1.64 MW and 1.42 MW, respectively. This indicates that these two load types are more likely to intensify nodal operational fluctuations. Simultaneously, the maximum voltage deviations for IDCs and COMs both reach 0.03 p.u., exceeding those of EVs and DSTs, although no voltage violations occur at this penetration level.
When the penetration level increases to 50%, the differences are further amplified. The maximum ramp powers of IDCs and COMs increase to 3.58 MW and 3.20 MW, respectively, with maximum voltage deviations reaching 0.08 p.u. and 0.07 p.u. Voltage violations lasting 7 h and 3 h also occur, indicating that under high-penetration conditions, these two load types are more likely to cause amplified operational fluctuations and accumulated voltage risk. By contrast, the impact of DSTs on each index remains comparatively limited.
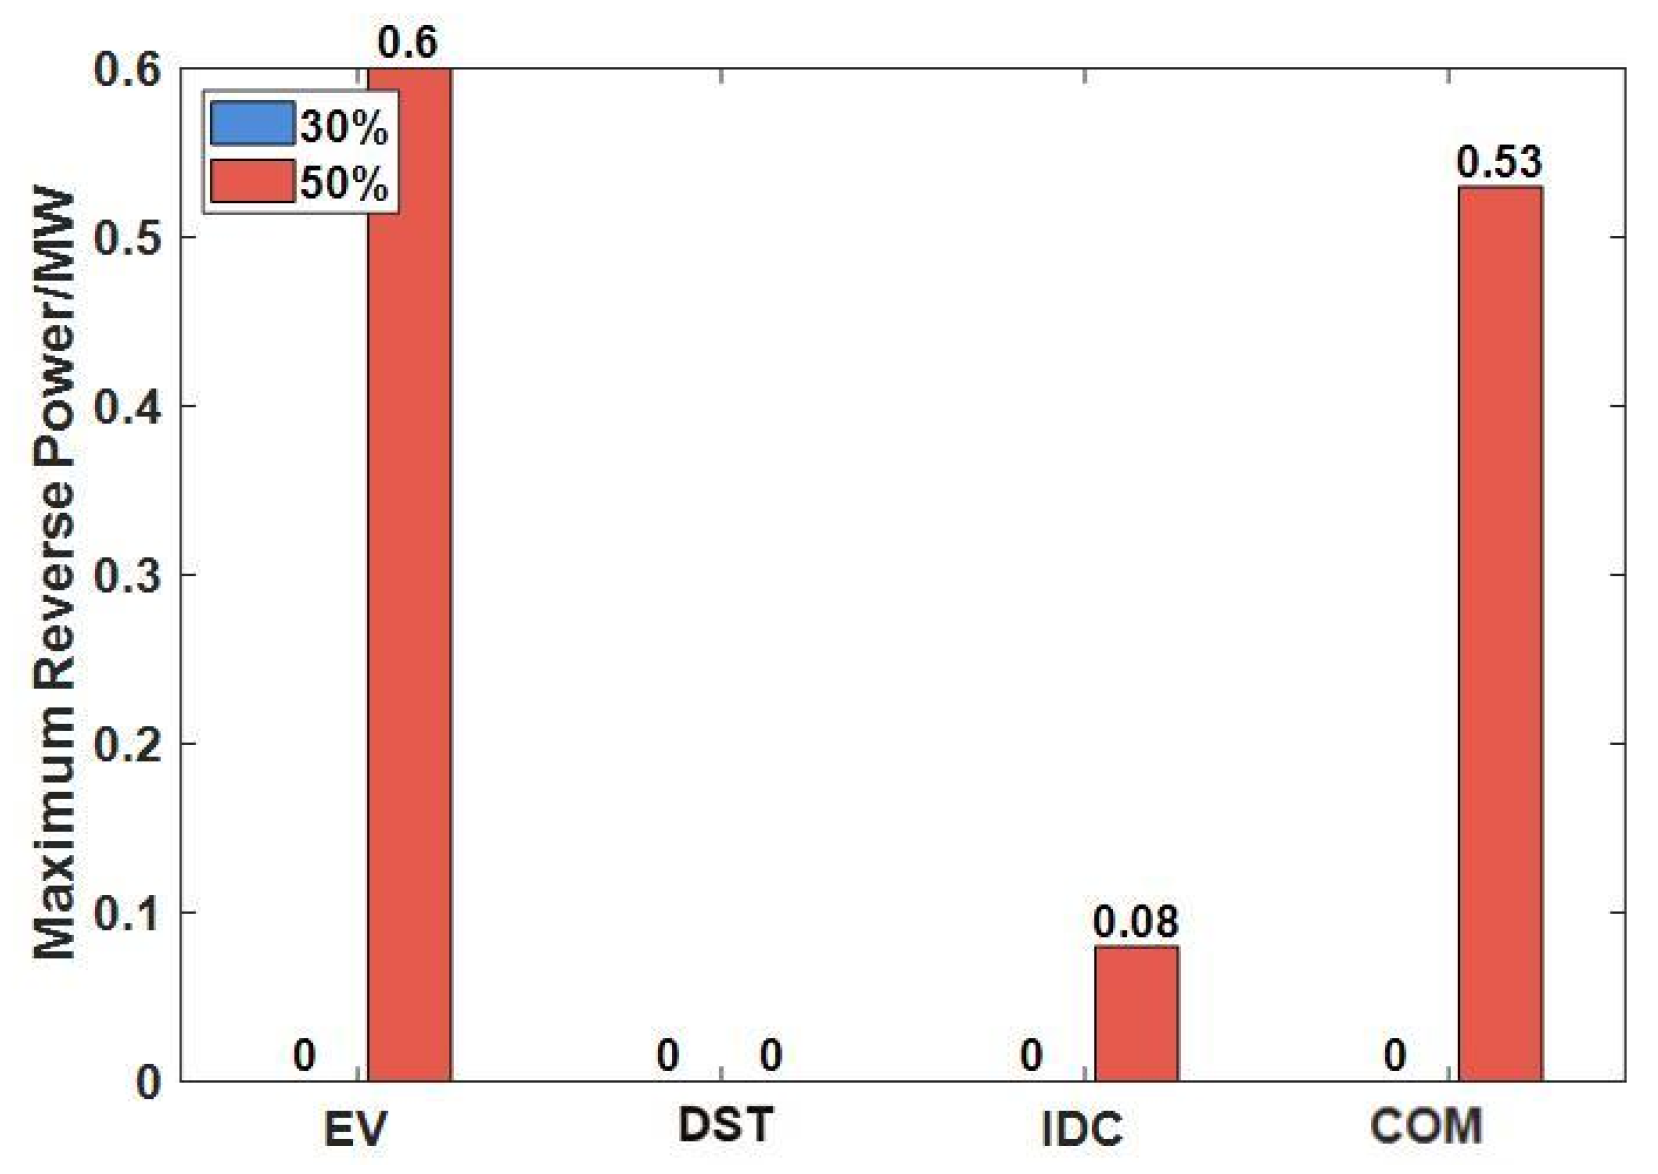
From the perspective of maximum reverse power,
Figure 8 shows that at 50% penetration, EVs and COMs exhibit notable reverse power flow, reaching 0.60 MW and 0.53 MW, respectively, whereas IDCs and DSTs show relatively weaker effects. This indicates that EVs are more prone to inducing power flow direction reversal under high-penetration conditions, demonstrating stronger power flow restructuring characteristics.
Figure 8.
Comparison of maximum reverse power across different flexible loads at various penetration levels.
Figure 8.
Comparison of maximum reverse power across different flexible loads at various penetration levels.
The differences in voltage deviation and operational fluctuation can be physically attributed to the combined effects of load magnitude, temporal concentration, and reactive power characteristics. EV integration mainly increases ramping and reverse power flow risks because charging and V2G discharging behaviors are concentrated within specific time windows determined by user travel patterns and electricity price signals. As a result, EVs show a stronger ability to reshape the temporal direction of power flow, especially at high penetration levels. DSTs exhibit smaller voltage deviations because their charging and discharging powers are constrained by storage capacity, state-of-charge limits, and degradation-related costs, which restrict abrupt and sustained power variations at the access point.
IDCs and COMs, by contrast, cause more pronounced voltage deviations. IDCs have a large and continuous power demand, and their internal equipment composition includes IT loads, cooling systems, fans, pumps, and UPS/power-conversion devices. These components increase not only active power consumption but also reactive power absorption under the adopted power factor assumptions. Since voltage variation at a distribution-network access point is affected by both active and reactive power changes, the high load magnitude and relatively lower/lagging power factor of IDCs lead to the largest voltage deviations observed in
Table 3 and
Table 4. COMs also present large deviations because communication base stations require continuous operation and reserve capacity for reliability, which reduces their ability to fully avoid high-load periods. Therefore, the voltage deviation results reflect not only the penetration level but also the physical composition and operating constraints of each flexible load type.
4.3. Impact on Reactive Power Support Pressure and Power Quality
This section employs the reactive power support and disturbance dimension quantitative assessment indices to comparatively analyze the reactive power support pressure and power-quality-related risks induced by different flexible load types at various penetration levels. Using reactive power demand increment, reactive power shortage, and power factor violation duration as key indicators, the differentiated performance of each load type in terms of reactive power demand growth, local reactive power support deficiency, and power factor degradation is examined.
As shown in
Table 5, at a 10% penetration level, different flexible loads already exhibit distinct differences in reactive power support pressure. Overall, EVs, IDCs, and COMs all increase reactive power demand, with IDCs producing the largest increment of 0.12 Mvar. EVs and COMs each contribute 0.04 Mvar, whereas the impact of DSTs on reactive power demand remains negligible. At this penetration level, no significant reactive power shortage or power factor violation is observed for any load type, indicating that the nodal reactive power support capability remains sufficient under low-penetration conditions.
As shown in
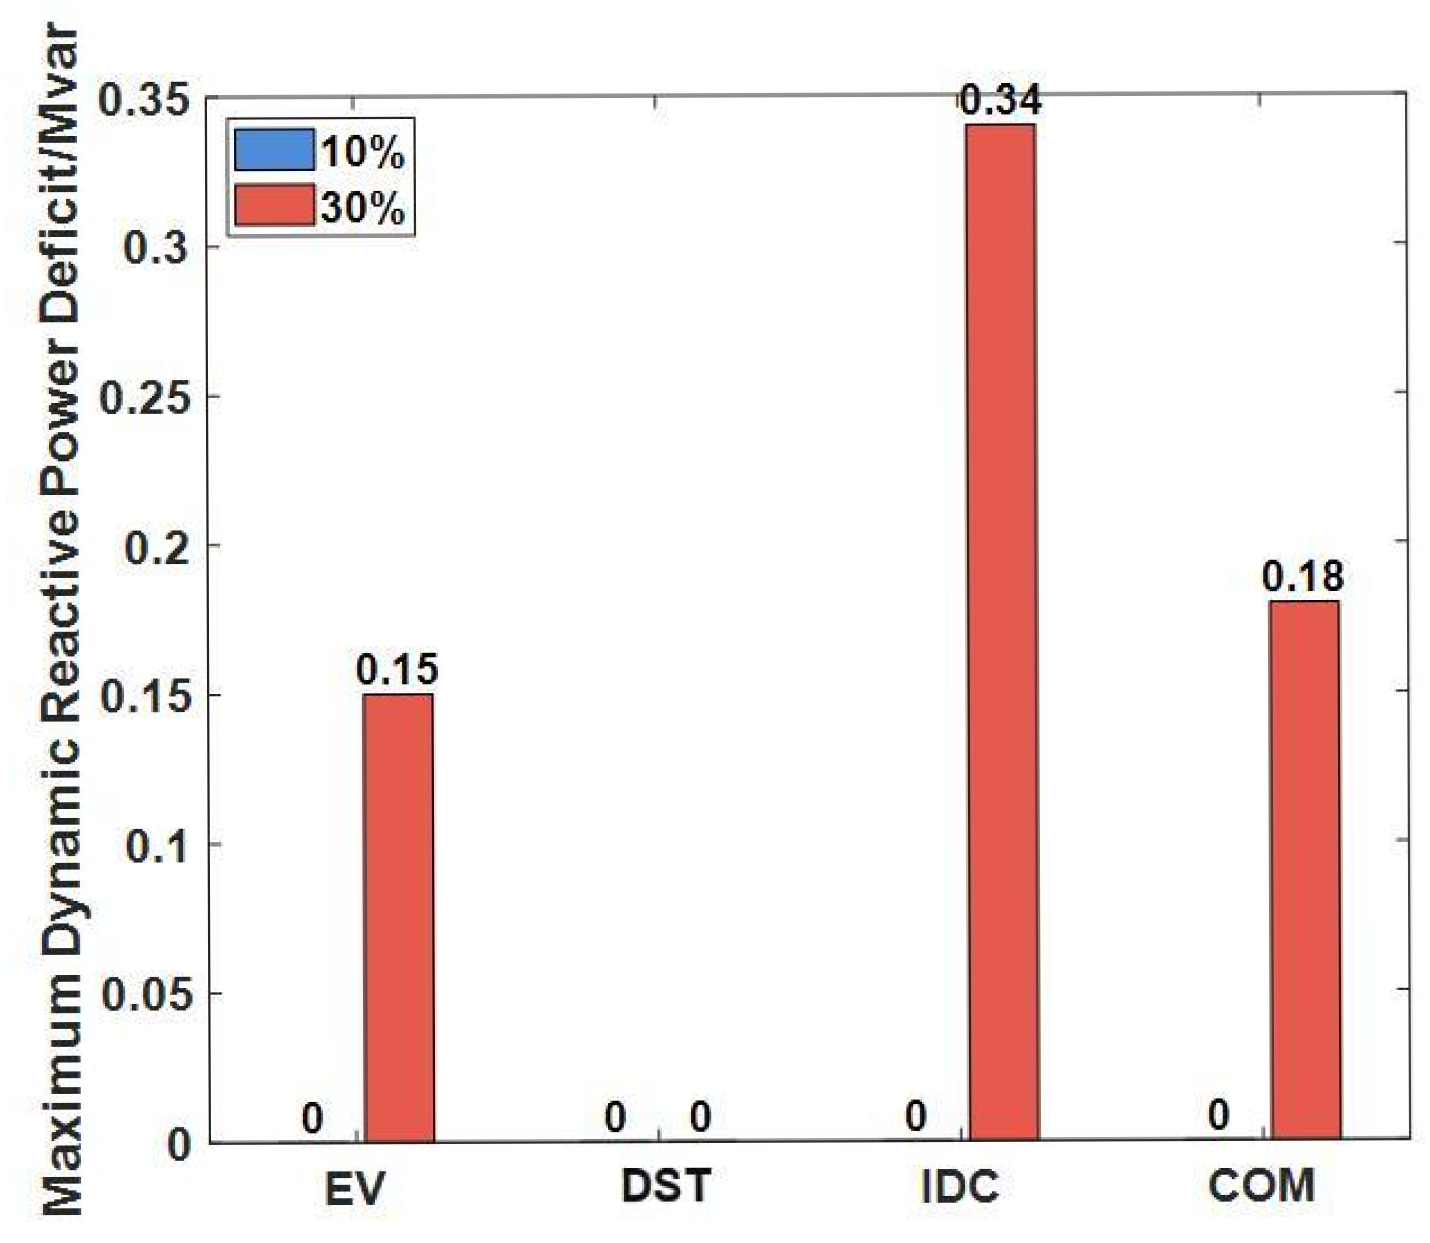
Table 6, when the penetration level increases to 30%, the differences in the reactive power support and disturbance dimension become markedly more pronounced. The reactive power demand increments induced by IDCs, COMs, and EVs increase to 0.47 Mvar, 0.31 Mvar, and 0.28 Mvar, respectively, with IDCs producing the largest increment. Concurrently, reactive power shortages of 0.34 Mvar, 0.18 Mvar, and 0.15 Mvar emerge for IDCs, COMs, and EVs, respectively, indicating that these three load types impose considerable pressure on nodal reactive power support capability at higher penetration levels.
In contrast, DSTs induce only a 0.05 Mvar reactive power demand increment with no significant reactive power shortage. However, power factor violations are also observed, suggesting that the operational disturbance introduced by some flexible loads is not fully captured by reactive power shortage metrics.
Regarding power factor violation duration, at the 50% penetration level, EVs, DSTs, IDCs, and COMs all exhibit 2 h violations. This indicates that, under high-penetration conditions, the impact of flexible load integration is no longer limited to reactive power demand growth but also extends to power factor deterioration. Combined with
Figure 9, it is further evident that IDCs exhibit the most significant maximum reactive power shortage, followed by COMs and EVs, while DSTs generate essentially no discernible shortage.
Figure 9.
Comparison of maximum reactive power shortage across different flexible loads at various penetration levels.
Figure 9.
Comparison of maximum reactive power shortage across different flexible loads at various penetration levels.
The reactive power support results further confirm the above mechanism. Among the four flexible load types, IDCs produce the largest reactive power demand increment and reactive power shortage because their cooling and power-supply subsystems introduce additional reactive power requirements on top of the computing load. This explains why IDCs also show the most significant voltage deviation in the power flow and operation dimension. COMs rank next because base-station operation is continuous and reliability-oriented, and their backup energy storage and auxiliary equipment impose additional power conversion and reserve constraints. EVs also increase reactive power demand, but modern charging equipment is generally operated with relatively high power factor, so their voltage impact is more strongly related to charging simultaneity and temporal concentration than to sustained reactive power absorption. DSTs have the weakest effect because the storage converter mainly follows the active power scheduling strategy in this study, and its charge/discharge limits prevent large sustained reactive power pressure.
4.4. Mixed-Penetration Scenario Analysis
The preceding analyses evaluate the impacts of EVs, DSTs, IDCs, and COMs independently, which helps identify the differentiated impact mechanisms of each flexible load type. However, in practical distribution networks, multiple flexible load types may increase simultaneously. Therefore, this section further constructs a mixed-penetration scenario to examine the combined impact of simultaneous EV, DST, IDC, and COM integration.
To maintain consistency with the preceding single-type analyses, the mixed-penetration scenario is constructed under the same base-load condition, network setting, penetration definition, and assessment indices. The 30% penetration level is selected as a representative case because the single-type scenarios at this level already show differentiated impacts, while the results are not yet dominated by extreme high-penetration effects. In this scenario, EVs, DSTs, IDCs, and COMs are integrated simultaneously according to the same penetration benchmark.
Table 7 compares the mixed-penetration results with the corresponding single-type results at the same penetration level.
As shown in
Table 7, the mixed-penetration scenario produces stronger overall impacts than any single-type scenario at the same penetration level. In the capacity dimension, the maximum net load increases to 5.86 MW and the peak-valley difference increases to 6.31 MW under the mixed scenario, both of which are higher than the corresponding values of EVs, DSTs, IDCs, and COMs. This indicates that when multiple flexible load types grow simultaneously, the capacity pressure is accumulated rather than being determined by only one dominant load type. The peak-time shift of the mixed scenario is 7 h, which is consistent with the temporal redistribution observed in the EV, DST, and COM scenarios.
In the power flow and operation dimension, the mixed scenario also shows more pronounced operational fluctuation and voltage deviation. The maximum ramp power reaches 3.63 MW, exceeding the values of the four single-type scenarios. More importantly, no reverse power flow occurs in any single-type scenario at the 30% penetration level, whereas the mixed scenario produces a maximum reverse power of 0.45 MW. This result suggests that simultaneous growth may trigger power flow restructuring effects that are not observed when each load type is evaluated independently. The maximum voltage deviation also increases to 0.08 p.u., indicating that the combined active and reactive power variations can aggravate voltage regulation pressure.
In the reactive power support and disturbance dimension, the mixed scenario leads to the largest reactive power demand increment and shortage, reaching 1.05 Mvar and 0.92 Mvar, respectively. These values are significantly higher than those of the single-type scenarios, reflecting the superimposed effect of different power factor characteristics and load profiles. The power factor violation duration also increases to 5 h, further indicating that simultaneous integration may intensify reactive power support pressure and steady-state power-quality-related risks. Overall, the mixed-penetration analysis shows that independent penetration scenarios are useful for identifying type-specific mechanisms, while mixed-penetration scenarios further reveal the accumulated operating pressure caused by simultaneous growth of multiple flexible load types.
4.5. Discussion
The above single-type and mixed-penetration results further demonstrate the necessity of comparing different flexible load types within a unified assessment framework. The results of this study are consistent with these findings but provide a more detailed cross-type comparison. As shown in
Table 2, at the 30% penetration level, EV integration increases the maximum net load from 1.98 MW to 2.66 MW and enlarges the peak-valley difference from 0.46 MW to 1.94 MW. However, compared with IDCs and COMs, the dominant characteristic of EVs is not the largest peak amplification but stronger temporal redistribution and reverse power flow risk. At the 50% penetration level, EVs produce the largest maximum reverse power, reaching 0.60 MW, which is higher than that of COMs and IDCs. This result indicates that EV-related impacts should not be evaluated only from the perspective of load growth but also from the perspective of peak migration and power flow restructuring.
For IDCs, previous studies have emphasized their flexibility potential, workload shifting capability, internal cooling demand, and coordination with external power systems [
14,
15]. The results of this study further show that, when IDCs are connected to distribution networks as high-density loads, their local network impacts are more significant than those of other flexible load types. At the 30% penetration level, IDCs increase the maximum net load to 3.60 MW and the peak-valley difference to 2.66 MW, both of which are the largest among the four load types. At the 50% penetration level, IDCs also produce the largest maximum ramp power and voltage deviation, reaching 3.58 MW and 0.08 p.u., respectively. In the reactive power support dimension, IDCs cause the largest reactive power demand increment and shortage at the 30% penetration level, reaching 0.47 Mvar and 0.34 Mvar, respectively. These results provide quantitative evidence that IDCs may impose stronger capacity, voltage, and reactive power support pressure on local distribution networks.
For COMs, existing research mainly focuses on energy resilience, backup energy storage, and service continuity of cellular base stations [
10]. The results of this study complement these works by quantifying the steady-state distribution-network impacts of COM integration. At the 30% penetration level, COMs increase the maximum net load to 3.31 MW and the peak-valley difference to 2.46 MW. At the 50% penetration level, COMs produce a maximum ramp power of 3.20 MW, a maximum reverse power of 0.53 MW, and a maximum voltage deviation of 0.07 p.u. These values indicate that COMs not only require reliable backup capacity, as emphasized in resilience-oriented studies but may also cause considerable local capacity pressure, power flow fluctuation, and voltage risk after large-scale integration.
For DSTs, previous studies have highlighted the value of battery energy storage in voltage support, peak shaving, power regulation, and ancillary services [
16]. The present results show that DSTs have a comparatively moderate impact on distribution network operating states under the studied scenarios. At the 30% penetration level, DSTs increase the maximum net load only to 2.16 MW and cause no reactive power shortage. At the 50% penetration level, their maximum voltage deviation is 0.02 p.u., which is lower than those of EVs, IDCs, and COMs. This indicates that, compared with load-dominated resources such as IDCs and COMs, DSTs impose less direct capacity and reactive power pressure under the same penetration benchmark.
Therefore, the main gain of this study compared with the existing literature is not limited to modeling a single flexible load type. Instead, this paper establishes a unified comparison benchmark for multiple representative flexible loads. By evaluating EVs, DSTs, COMs, and IDCs under the same distribution network scenario and the same multi-dimensional index system, the proposed framework reveals their different dominant impact mechanisms: IDCs mainly intensify capacity pressure, operational fluctuation, voltage deviation, and reactive power shortage; COMs impose considerable capacity and voltage stress while also involving backup power requirements; EVs are more strongly associated with peak-time migration and reverse power flow risk; and DSTs show relatively moderate impacts under the studied conditions. These findings provide more targeted references for distribution network assessment, planning, and operational optimization than single-category studies.
The proposed framework is not restricted to large-scale integration studies. Since the behavioral models are formulated according to the operating constraints of flexible load resources and the assessment indices are defined at the node and time-period levels, the framework can also be applied to small-scale scenarios by adjusting the number, capacity, penetration level, and connection location of flexible loads. For example, it can be used to evaluate a single feeder, a residential community, a local EV charging cluster, or a small group of distributed storage resources. In such cases, however, individual user behavior, device-level parameter differences, and local network topology may have a more significant influence on the results. Therefore, small-scale applications require more detailed historical behavior data, device parameters, and connection information to improve the accuracy of impact assessment.
For residential end-users and residential communities, the proposed framework can be implemented through a bottom-up aggregation process. At the end-user level, flexible resources such as EVs, household batteries, controllable appliances, and rooftop-PV-related net load variations can be modeled or converted into time-series load profiles according to user behavior, device constraints, and local energy management strategies. At the community level, these individual profiles can be aggregated at the transformer, feeder, or node level and then evaluated using the proposed capacity, power flow and operation, and reactive power support indices. For communities with both small-scale and large-scale flexible loads, the same framework can be used by assigning different resource types to their corresponding nodes and aggregation levels. In this way, the framework can support both household-level flexibility analysis and community-level impact assessment, although its accuracy depends on the availability of detailed user behavior data, device parameters, and network topology information.
5. Conclusions
This paper investigates the heterogeneous impacts of flexible load integration on distribution networks under different penetration scenarios. Differentiated behavioral models are developed for EVs, DSTs, COMs, and IDCs, and their effects are evaluated within a unified multi-dimensional assessment framework. Compared with previous studies that mainly focus on individual flexible load categories or specific application scenarios, this study provides a cross-type comparison under consistent network conditions, penetration settings, and assessment indices. The main conclusions are as follows:
- (1)
The proposed fine-grained behavioral models can distinguish the operating mechanisms and constraint boundaries of different flexible load types. EVs are characterized by travel-demand constraints and V2G interaction, DSTs by charge/discharge regulation and battery aging degradation, COMs by continuous service requirements and dynamic reserve capacity, and IDCs by workload shifting and cooling-related energy demand. These differentiated models provide a basis for comparing the network impacts of multiple flexible loads under the same distribution network scenario.
- (2)
The capacity-dimension results show that IDCs and COMs impose the most significant local capacity pressure. At the 30% penetration level, IDCs increase the maximum net load from 1.98 MW to 3.60 MW and enlarge the peak-valley difference from 0.46 MW to 2.66 MW, both of which are the largest among the four load types. COMs also produce considerable capacity stress, with a maximum net load of 3.31 MW and a peak-valley difference of 2.46 MW. By contrast, DSTs show a relatively limited capacity impact, with the maximum net load increasing only to 2.16 MW at the same penetration level.
- (3)
The power flow and operation results indicate that different flexible loads have distinct dominant impact mechanisms. At the 50% penetration level, IDCs and COMs produce the largest operational fluctuations, with maximum ramp powers of 3.58 MW and 3.20 MW, respectively. IDCs also cause the largest voltage deviation, reaching 0.08 p.u., followed by COMs at 0.07 p.u. In contrast, EVs show the most significant reverse power flow characteristic, with a maximum reverse power of 0.60 MW, indicating that EV integration should be carefully considered in peak-time migration and power flow restructuring analysis.
- (4)
The reactive power support and disturbance results show that IDCs impose the greatest reactive power support burden. At the 30% penetration level, IDCs produce a reactive power demand increment of 0.47 Mvar and a reactive power shortage of 0.34 Mvar, both higher than those of EVs, DSTs, and COMs. COMs and EVs also increase reactive power support pressure, while DSTs cause no significant reactive power shortage under the studied scenarios. These results demonstrate that the proposed framework can identify the differentiated grid-impact patterns of multiple flexible load types and provide targeted references for distribution network assessment, planning, and operational optimization.
- (5)
The mixed-penetration scenario further shows that simultaneous growth of multiple flexible load types may amplify overall distribution-network operating pressure. At the 30% penetration level, the mixed scenario increases the maximum net load to 5.86 MW and the peak-valley difference to 6.31 MW, both higher than those of any single-type scenario. It also produces a maximum reverse power of 0.45 MW, a maximum voltage deviation of 0.08 p.u., and a reactive power shortage of 0.92 Mvar. These results indicate that mixed integration can trigger accumulated capacity, power flow, voltage, and reactive power support risks that are not fully reflected by independent single-type scenarios.
Future research will extend the present benchmark assessment in three directions. First, the current representative mixed-penetration scenario will be expanded to more diverse mixed-integration cases with different growth ratios, spatial connection locations, and feeder topology conditions, so that the coupled effects of multiple flexible load types can be evaluated more comprehensively. Second, dynamic price signals, heterogeneous user responses, and long-term component aging effects will be further incorporated to represent real-time market uncertainty, range-anxiety-related EV behavior, non-fully rational operation of distributed resources, and efficiency deterioration for power electronic interfaces. Third, the present normal-operation assessment will be extended to contingency and worst-case operating conditions by considering fault scenarios, protection actions, network reconfiguration, emergency load control, and restoration strategies. These extensions will further improve the applicability of the proposed behavioral models and assessment framework for distribution network planning and operational optimization.