Article

Fracture Interferences in Combined Vertical–Horizontal Well Patterns and Their Field Application


Department of Engineering Mechanics, College of Petroleum Engineering, China University of Petroleum (Beijing), Beijing 102249, China
*
Author to whom correspondence should be addressed.
Processes 2026, 14(12), 2010; https://doi.org/10.3390/pr14122010
Submission received: 21 May 2026 / Revised: 12 June 2026 / Accepted: 18 June 2026 / Published: 20 June 2026

Abstract

Combined Vertical–Horizontal Well Patterns (CVHWPs) have been increasingly applied in mature and complex reservoirs, such as the C5 Block. Their application is attractive because they provide extensive reservoir coverage and high development efficiency. However, close well spacing and the three-dimensional configuration of vertical and horizontal wells can induce strong stress-shadow interference. This interference makes fracture propagation difficult to control and may reduce stimulation effectiveness. To address this problem, a multi-well, multi-fracture induced-stress model for CVHWP stimulation was developed in this study. The model was validated using laboratory three-stage fracturing experiments, including two horizontal-well stages and one vertical-well stage, together with field observations. Across three stages, the calculated stress intensity factors at breakdown are closely matched, validating the induced-stress model. When the vertical well was fractured first, the horizontal principal-stress difference at the adjacent horizontal stage increased by 2.01 MPa, which was unfavorable for branched fracture development. In contrast, when the horizontal stage was fractured first, the stress difference decreased by 3.25 MPa at the subsequent horizontal stage and by 3.89 MPa at the vertical-well stage. This sequence is preferable because fractures generated from the vertical well impose a stronger stress perturbation on adjacent horizontal-well fractures than fractures generated from the horizontal well impose on the subsequent vertical-well fracture. Under the tested CVHWP conditions, the horizontal-well fractures tended to form nearly symmetric bi-wing planar fractures, whereas branched fractures were more likely to develop in the vertical well. Therefore, for CVHWP reservoirs with close vertical–horizontal well spacing and significant stress interference, fracturing the horizontal well before the vertical well is recommended to control fracture propagation and promote multiple-fracture formation. Field application of this sequence showed notable production improvement, indicating that the proposed method can provide practical guidance for unconventional well-pattern fracturing design.

1. Introduction

As global energy demand continues to increase and conventional hydrocarbon reserves decline, unconventional resources have become an increasingly important target for petroleum development. However, unconventional reservoirs significantly restrict natural productivity and make commercial development highly dependent on hydraulic fracturing. Under complex geological or surface constraints, such as reservoirs located near environmentally protected areas, conventional regular well patterns may be difficult to implement, and irregular or combined well-pattern designs are often required [1]. Conventionally, horizontal wells are arranged approximately parallel to each other and perpendicular to the minimum horizontal principal stress, and multi-stage hydraulic fracturing is performed to create a conductive fracture network [2,3].
Except for environmental considerations, well pattern in reservoirs is often constrained by geological complexity, existing development patterns, heterogeneous reservoir properties, and alternate well-pattern designs [4,5], in which the CVHWP has attracted growing interest [6,7]. In CVHWP, vertical and horizontal wells are integrated through optimized design, thereby exploiting both advantages: the operational simplicity and lower cost of vertical wells, and the larger stimulated reservoir volume (SRV) and higher productivity.
In CVHWP, stresses induced by inter-well interference and deviations in the in situ horizontal stress can alter fracture propagation. This increases uncertainty in fracture azimuth and extent and may induce fracture interactions, which can reduce single-well productivity and overall development efficiency. Therefore, clarifying fracture-interaction mechanisms in CVHWP is essential for stimulation design.
Previous studies have established frameworks for fracture initiation and propagation during multi-stage hydraulic fracturing of horizontal wells [2,8,9,10]. Sneddon [11,12] derived the plane-strain stress field for a semi-infinite, internally pressurized crack, which underpins subsequent stress-shadow analyses [13,14,15]. Weng [16] proposed the Unconventional Fracture Model (UFM). Olson [17] formulated a simplified numerical model using the Displacement Discontinuity Method (DDM), and showed that interactions between hydraulic fractures and natural fractures can generate complex fracture networks. By comparing elliptical and plane-strain solutions, Zhao [18] delineated the validity range of the plane-strain assumption and proposed a corrected plane-strain formulation. Tang [19] applied 3D DDM to quantify multi-fracture interference, highlighting that three-dimensional stress redistribution produces more complex fracture geometries than their two-dimensional cases. For multi-well pads, Wang [4] developed a dislocation-theory-based stress-shadow model to evaluate stress perturbations and stress-shadow effects at arbitrary spatial locations. Dontsov [20] related fracture geometry to energy-dissipation mechanisms and reported stronger stress shadowing and more complex morphologies in toughness-dominated regimes.
El Rabaa [21] used laboratory experiments to show that closely spaced fractures can interact and propagate non-planarly. Warpinski [22] conducted field tests and reported a stress change of approximately 2 MPa in micro-fractures within an offset well located 37 m from the treatment well. Crosby [23] found that existing fractures can increase the initiation pressure of new fractures (by ~14%) at tight spacing. From field observations, Daneshy [24] identified stress shadowing around hydraulic fractures and reported asymmetric fractures growth. Collectively, fracture interactions can deflect fractures and lead to complex, less predictable geometries [25,26,27].
As understanding of complex fracture-network formation has advanced, stress shadowing is now treated as an adjustable design parameter. This shift enables active stress-field management to improve stimulation efficiency. Wang [28] showed that alternate fracturing sequences can harness stress interactions to improve control of complex fracture networks. Using an Extended Finite Element Method (XFEM) model, Liao [29] found that alternate fracturing reduces inter-fracture interference and remains effective at tighter stage spacing. Li [30] further confirmed that alternate fracturing improves fracture-geometry control and increases horizontal-wells productivity compared with sequential fracturing, as evidenced by NMR.
Recent studies have further advanced the understanding of 3D fracture interference and complex fracturing dynamics. Ju et al. [31] investigated hydraulic-fracture reorientation and stress-shadow effects in double-well fracturing. Yang et al. [32] simulated multi-cluster 3D hydraulic-fracture propagation in shale reservoirs with natural fractures. Shan et al. [33] established a 3D seepage–stress–damage coupled model considering actual perforation geometry. Bai et al. [34] examined inter-well stress interference and multifracture propagation in tight reservoirs. Liu et al. [35] discussed hydraulic-fracture propagation in fractured reservoirs using a hydromechanical coupling numerical model. These recent studies demonstrate that fully coupled 3D numerical models are powerful for capturing nonlinear fracture propagation, hydraulic–natural fracture interaction, bedding-plane effects, and reservoir heterogeneity.
Although previous studies have improved the understanding of fracture interference in horizontal-well pads, naturally fractured reservoirs, and fully coupled numerical simulations of fracture propagation, fracture interference in combined vertical–horizontal well patterns remains insufficiently understood. Compared with fully coupled three-dimensional numerical models, the analytical induced-stress model proposed in this study is not intended to reproduce all nonlinear fracture-growth processes. Instead, it provides a transparent and computationally efficient framework for evaluating stress-shadow interference and screening fracturing sequences in CVHWP systems. Therefore, this study establishes an analytical solution for the stress distribution induced by multiple wells and fractures, and conducts CVHWP multi-stage fracturing experiments to assess how fracturing sequence influences fracture propagation. Based on the combined analytical and experimental results, we clarify the mechanism of sequence-dependent fracture interference and provide guidance for stimulation design in combined vertical–horizontal well patterns.

2. Derivation of an Induced-Stress Model for Combined Well Patterns

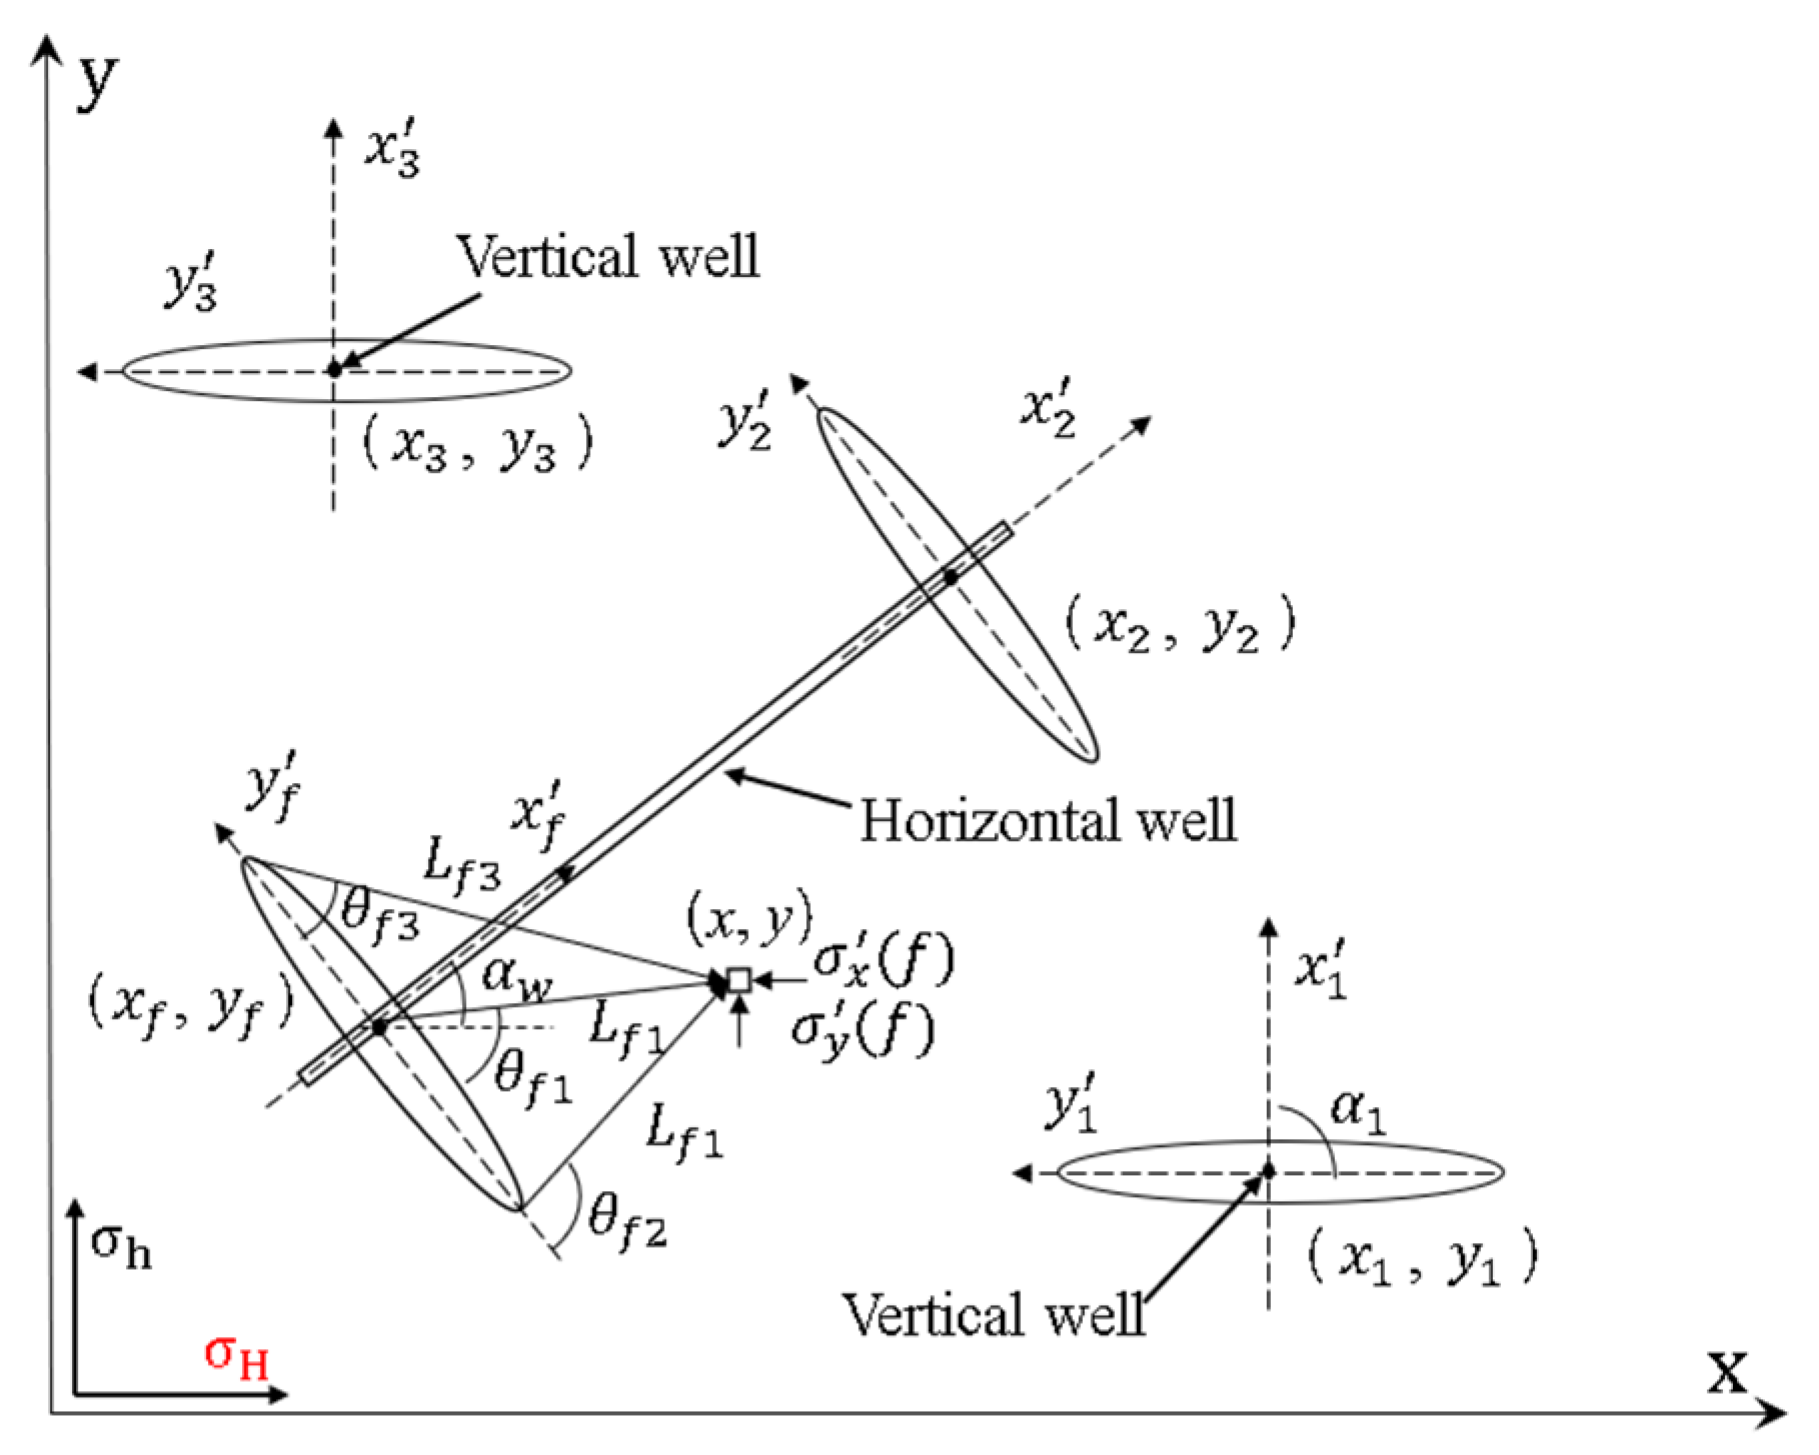
Building on the Sneddon model [11,12] and the principle of stress superposition, we establish a model for a stress field in a CVHWP with multiple wells and fractures. It should be noted that the present study does not use any specific well or fracture data from Sneddon’s original work. Instead, Sneddon’s internally pressurized crack solution is used as the theoretical basis for calculating the stress perturbation induced by a single hydraulic fracture. The coordinate system and the interaction geometry for f fractures and w wells in the combined pattern is shown in Figure 1.
The proposed model is formulated within the framework of homogeneous linear elasticity. The following assumptions are adopted: small deformation, constant net pressure within each fracture, fixed fracture geometry during stress-field evaluation, quasi-static fracture interaction, and linear superposition of induced stresses. Poroelastic, plastic, and fully coupled fracture–fluid–solid effects are not explicitly considered. Therefore, the model does not solve nonlinear three-dimensional fracture propagation. Instead, the spatial configuration of the combined vertical–horizontal well pattern is represented by the relative positions and orientations of wells and fractures, and the induced stresses generated by individual pressurized fractures are linearly superposed as a first-order approximation. This formulation provides a transparent and computationally efficient method for evaluating stress-shadow interference and screening fracturing sequences in CVHWP systems.
The induced stresses generated by the f-th fracture is expressed as:
σ f x + σ f y = 2 p f L f 1 ( L f 2 L f 3 ) 1 / 2 c o s θ f 1 1 2 θ f 2 + θ f 3 1
σ f y σ f x = 2 p f L f 1 sin θ f 1 h / 2 h 2 / 4 L f 2 L f 3 3 / 2 sin 3 2 θ f 2 + θ f 3
τ f x y = p f L f 1 sin θ f 1 h / 2 h 2 / 4 L f 2 L f 3 3 / 2 cos 3 2 θ f 2 + θ f 3
σ f z = μ σ f x + σ f y
where pf is the net pressure in the f-th fracture, MPa; hf is the fracture length, m; σ f x ,   σ f y , and   σ f z are the induced normal-stress change in the x-, y-, and z-directions, respectively, MPa; τ f x y is the induced shear-stress change on the xy-plane, MPa; Lf1, Lf2, and Lf3 are the distances from the evaluation point to the fracture midpoint, upper tip, and lower tip, respectively, m; θf1, θf2, and θf3 are the corresponding angles, °; μ is Poisson’s ratio. The geometric terms Lfi and θfi (i = 1–3) are as follows:
L f 1 = ( x f 2 + y f 2 ) 1 / 2 θ f 1 = cos 1 ( y f L f 1 ) L f
L f 2 = x f 2 + y f h / 2 2 1 / 2 θ f 2 = cos 1 ( h / 2 y f L f 2 ) L f
L f 3 = x f 2 + y f h / 2 2 1 / 2 θ f 3 = cos 1 ( h / 2 y f L f 3 ) L f
where (x, y) is the evaluation point in the global (stress-distribution) coordinates system; (xf, yf) is the midpoint of the f-th fracture in the same system; ( x f , y f ) are the coordinates of (x, y) in the local coordinates obtained by rotating the global axes by αw about (xf, yf):
x f = x x f cos α w + y y f sin α w y f = ( y y f ) cos α w ( x x f ) sin α w
Here αw is the angle between the w-th well and the global x-axis, °. The auxiliary sign function T(x) is used to select the appropriate trigonometric branch:
T ( x ) = 1 i f ( x x f ) cos α w 0 ; 1 i f   ( x x f ) cos α w < 0 ;
For a system containing f fractures and w wells, the induced stress field is obtained by linear superposition of the individual contributions:
σ x f = σ 1 x + σ f x
σ y f = σ 1 y + σ f y
When the configuration reduces to a single well and a single fracture with α = π/2 and ( x f , y f ) = (0, 0), the formulation is simplified to the classical Sneddon solution.

3. Laboratory Fracturing Experiments for Combined Well Patterns

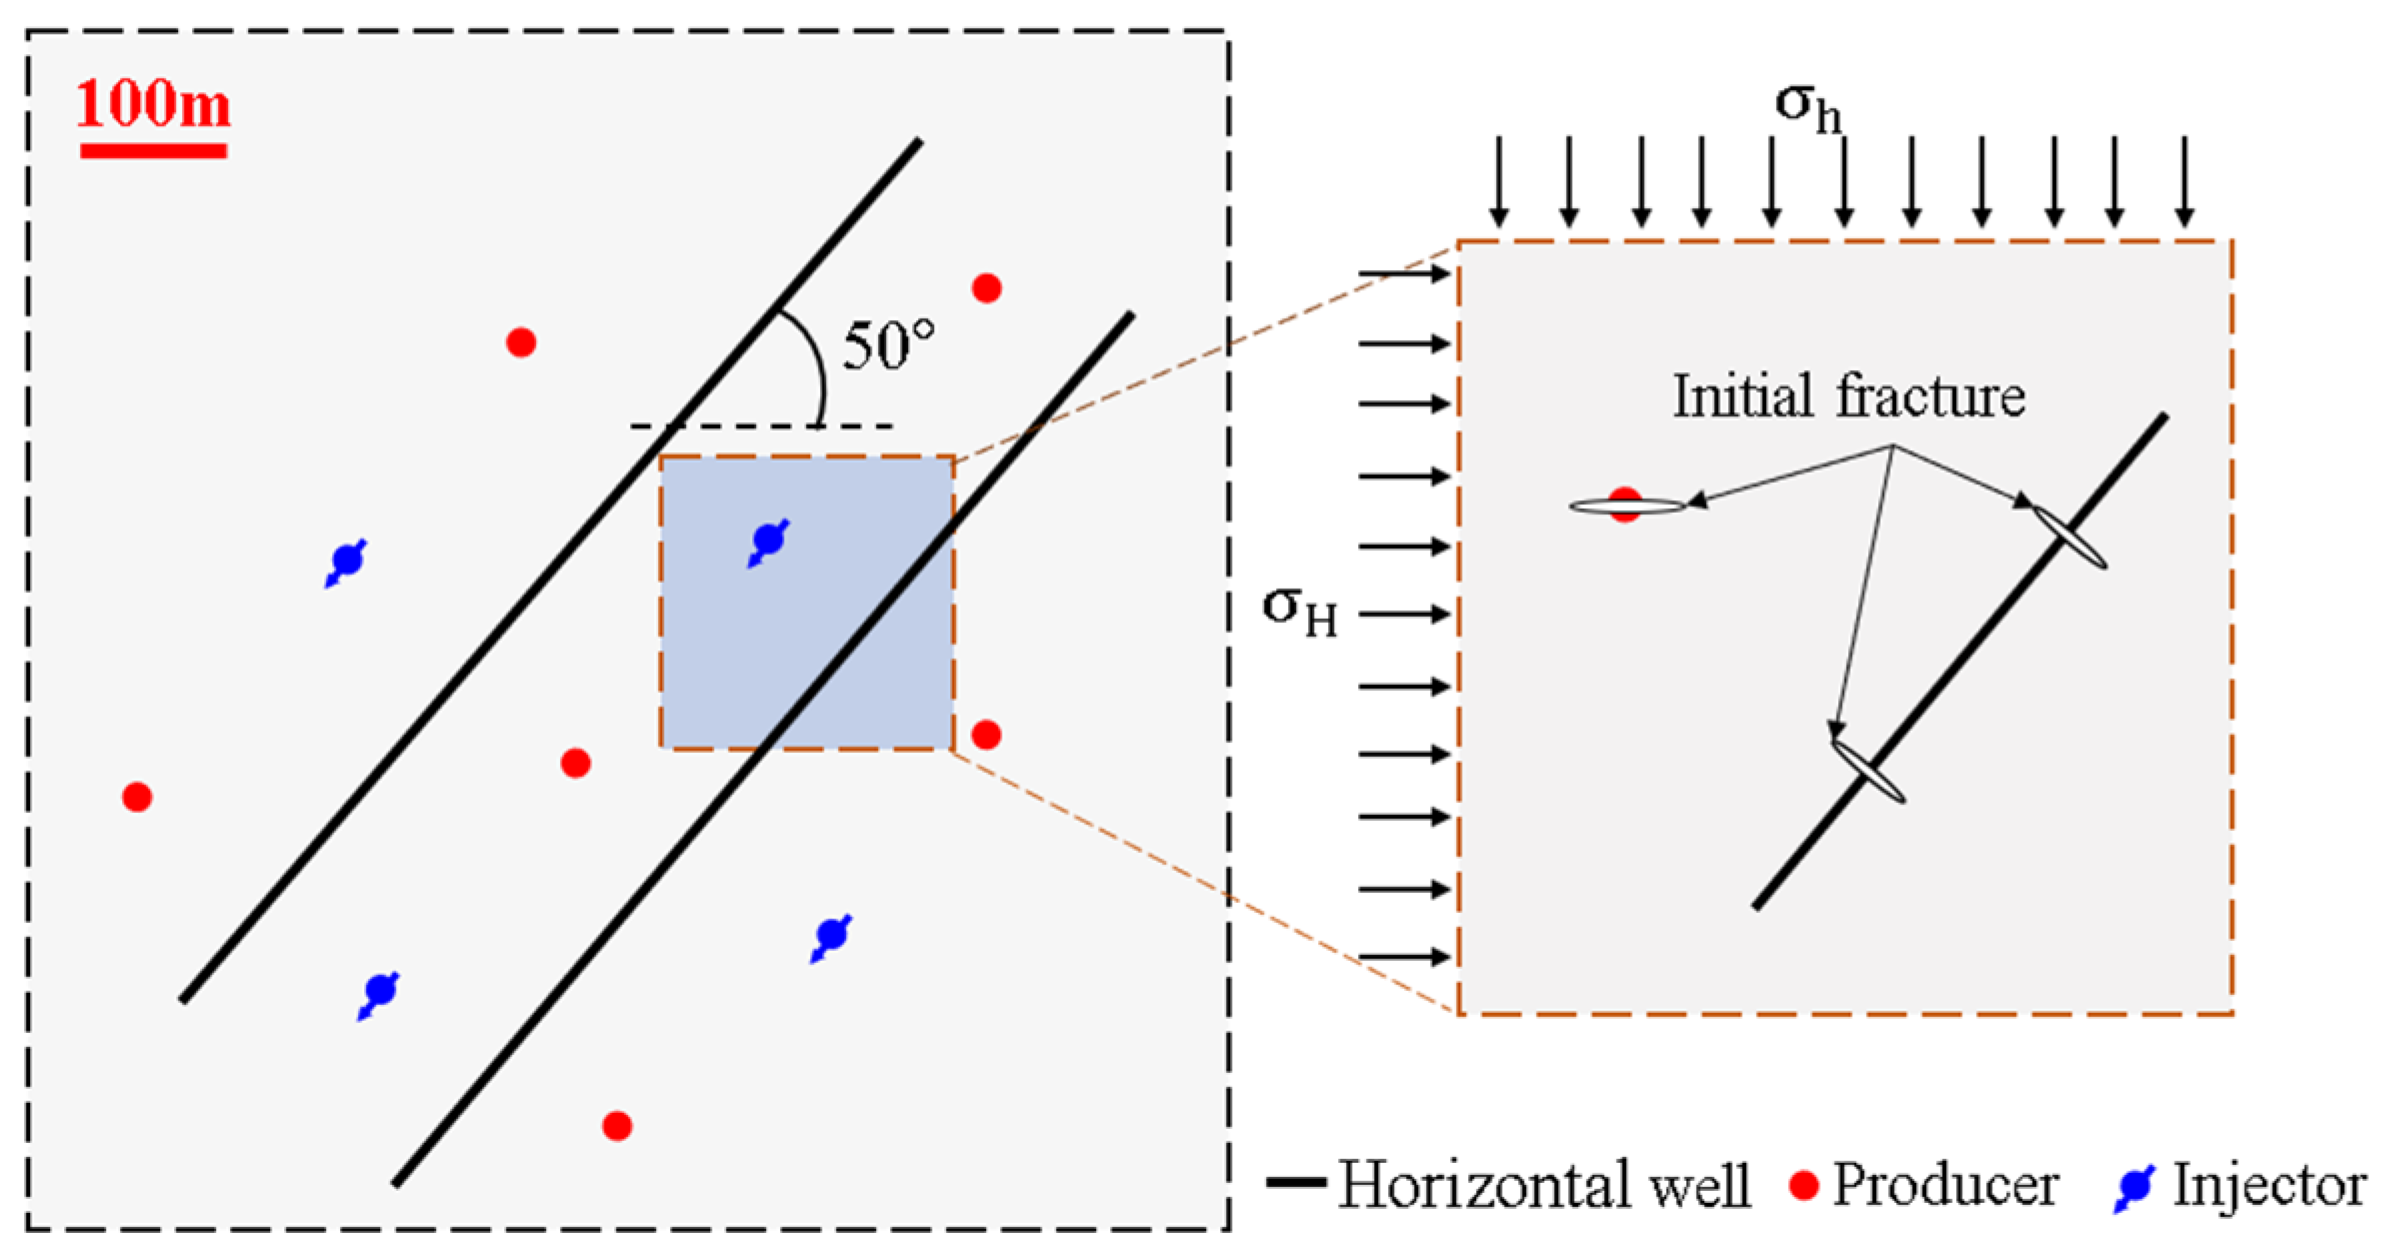
The multistage fracturing experiments were designed based on the field conditions of the C5 Block and the geometric characteristics of the combined vertical–horizontal well pattern. In this field setting, horizontal infill wells were drilled within an existing vertical-well pattern, and the horizontal wellbore was oriented at an azimuth of 50° from the maximum horizontal principal stress, σH. In addition, the horizontal-well perforation direction formed an approximately 40° offset from σH. These field characteristics were incorporated into the physical model to reproduce the key geometric and stress-related controls on fracture initiation and propagation.
To investigate the effect of fracturing sequence on fracture interference, the physical model included two horizontal-well stages and one vertical-well section, denoted as HW1, HW2, and VW, respectively. Three experimental sequences were designed: horizontal-well-first fracturing, vertical-well-first fracturing, and zipper-style alternating fracturing. This design enables a systematic comparison of sequence-dependent stress-shadow interference, fracture deflection, and multiple-fracture development in CVHWP systems.

3.1. Determination of Specimen Boundary Conditions

The C5 Block is a mature extra-low-permeability reservoir, with an average porosity of 12.5% and an average matrix permeability of 2.4 mD. During early development, waterflooding was implemented using a vertical-well pattern, with a well spacing of 280 m and a row spacing of approximately 140 m. After prolonged production, the displacement efficiency between injectors and producers remained low, production rates declined rapidly, and the ultimate recovery factor was consequently limited. In such low-permeability settings, substantial bypassed reserves may remain between injector–producer pairs because of the inadequate sweep of the remaining oil. Therefore, conventional waterflooding alone is insufficient to effectively mobilize and produce these residual resources.
To improve recovery and develop bypassed reserves, horizontal infill wells were drilled within the existing vertical-well pattern to form a CVHWP, followed by integrated stimulation. The CVHWP configuration is shown in Figure 2. Constrained by the existing well-pattern geometry and reservoir distribution, the horizontal wells were infilled at an azimuth of 50° from the direction of the maximum horizontal principal stress, σH. For confidentiality and consistency in the laboratory and modeling analysis, the field wells and corresponding experimental sections are identified using anonymized labels. The two horizontal-well stages are denoted as HW1 and HW2, and the vertical-well section is denoted as VW.
Vertical wells are perforated using shaped-charge guns (Figure 2). Conical perforation tunnels were formed through the casing and cement sheath and extended into the formation. During fracturing, fractures initiated from the vertical wells preferentially propagated parallel to σH. In the horizontal wells, multistage hydraulic-jet fracturing was employed. During treatment, perforation tunnels were formed by high-velocity jets oriented perpendicular to the wellbore, producing an approximately 40° offset between the perforation azimuth and σH. This offset indicates that the initial fracture path in the horizontal well may be affected not only by the far-field principal stress direction, but also by the local stress concentration and mechanical weakness introduced by the perforations. Accordingly, the specimens were designed to incorporate both wellbore trajectories and perforation orientations to replicate field conditions and to consider the combined effects of perforation-guided initiation and stress-controlled fracture propagation.

3.2. Specimen Fabrication and Experimental Design

Three types of specimens are commonly used in laboratory hydraulic-fracturing experiments: outcrop specimens, cement-based specimens, and full-diameter rock cores embedded in cement.
(1)
Outcrops are preferably from the same reservoir to be studied, with the same or similar mechanical properties.
(2)
Cement-based specimens are advantageous because their mechanical properties can be adjusted by changing the proportions of water, cement, and quartz sand, thereby allowing the target reservoir response to be approximated under repeatable laboratory conditions.
(3)
Full-diameter cores embedded in cement can preserve the natural fractures and original rock properties of the reservoir core while allowing external specimen geometry to be controlled.
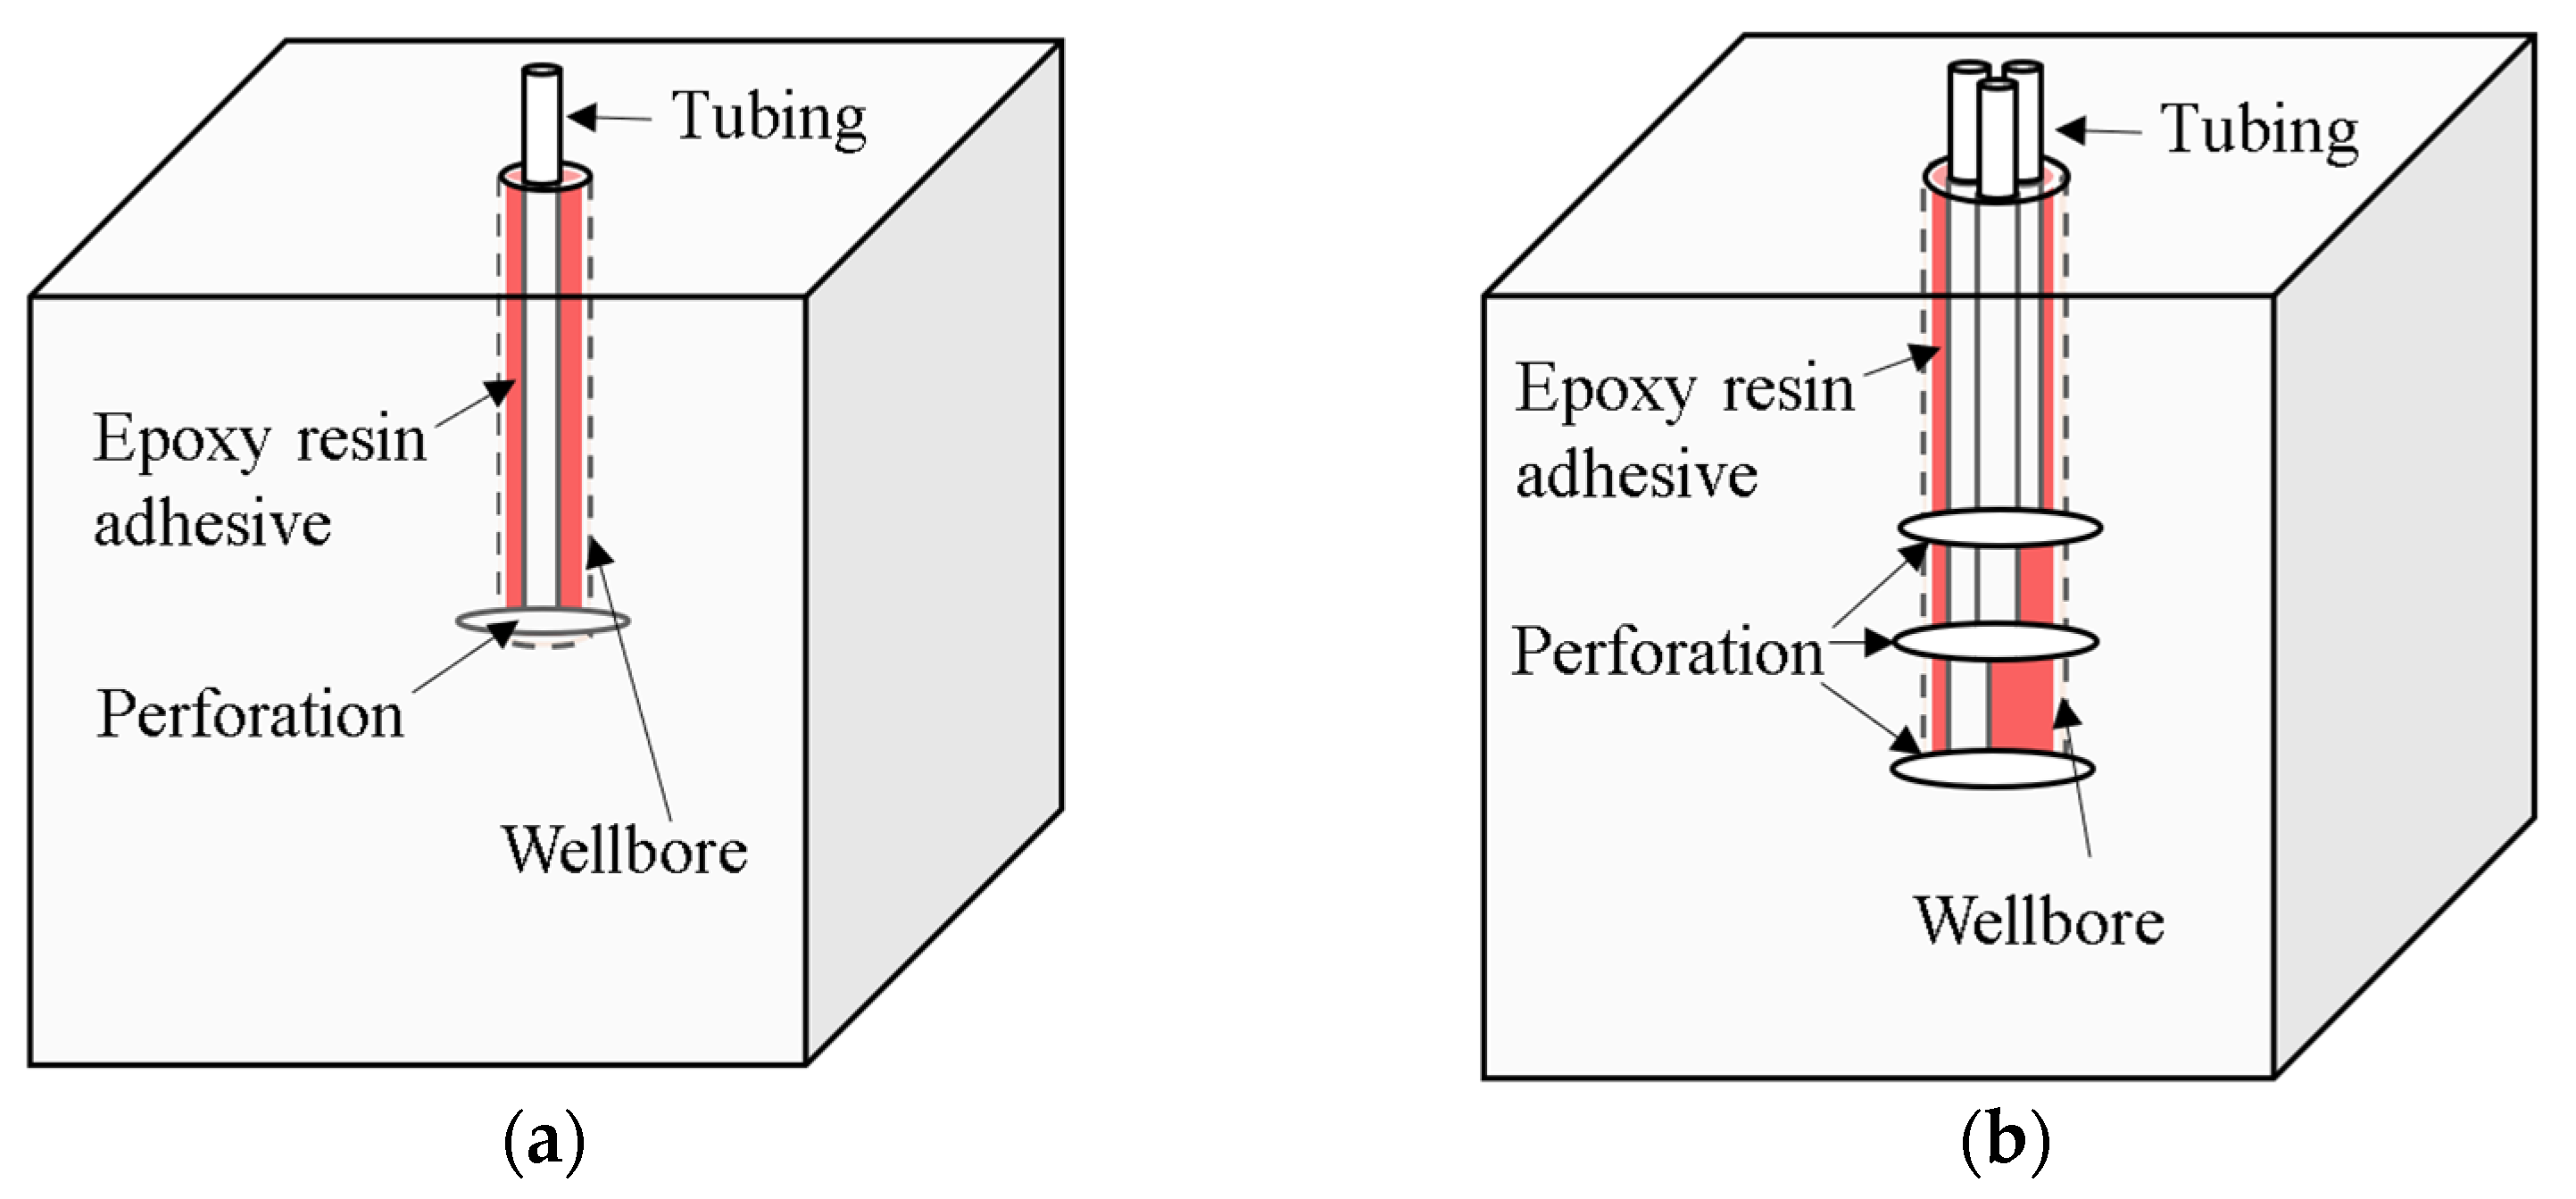
For conventional single-stage fracturing experiments, specimens are usually prepared by cutting and polishing the material to the required dimensions, drilling a wellbore in the central part of the specimen, cutting an initial slot at the end of the wellbore to reduce breakdown pressure, and bonding the casing to the wellbore with epoxy resin. This method is relatively simple for single-stage models. However, it is difficult to apply to multistage fracturing experiments in a combined vertical–horizontal well pattern because multiple wellbores, multiple casings, and independently controlled injection lines are required in the same specimen. These requirements may lead to eccentric wellbore placement, poor casing bonding, and difficulty in sealing and controlling each fracturing stage independently (see Figure 3).
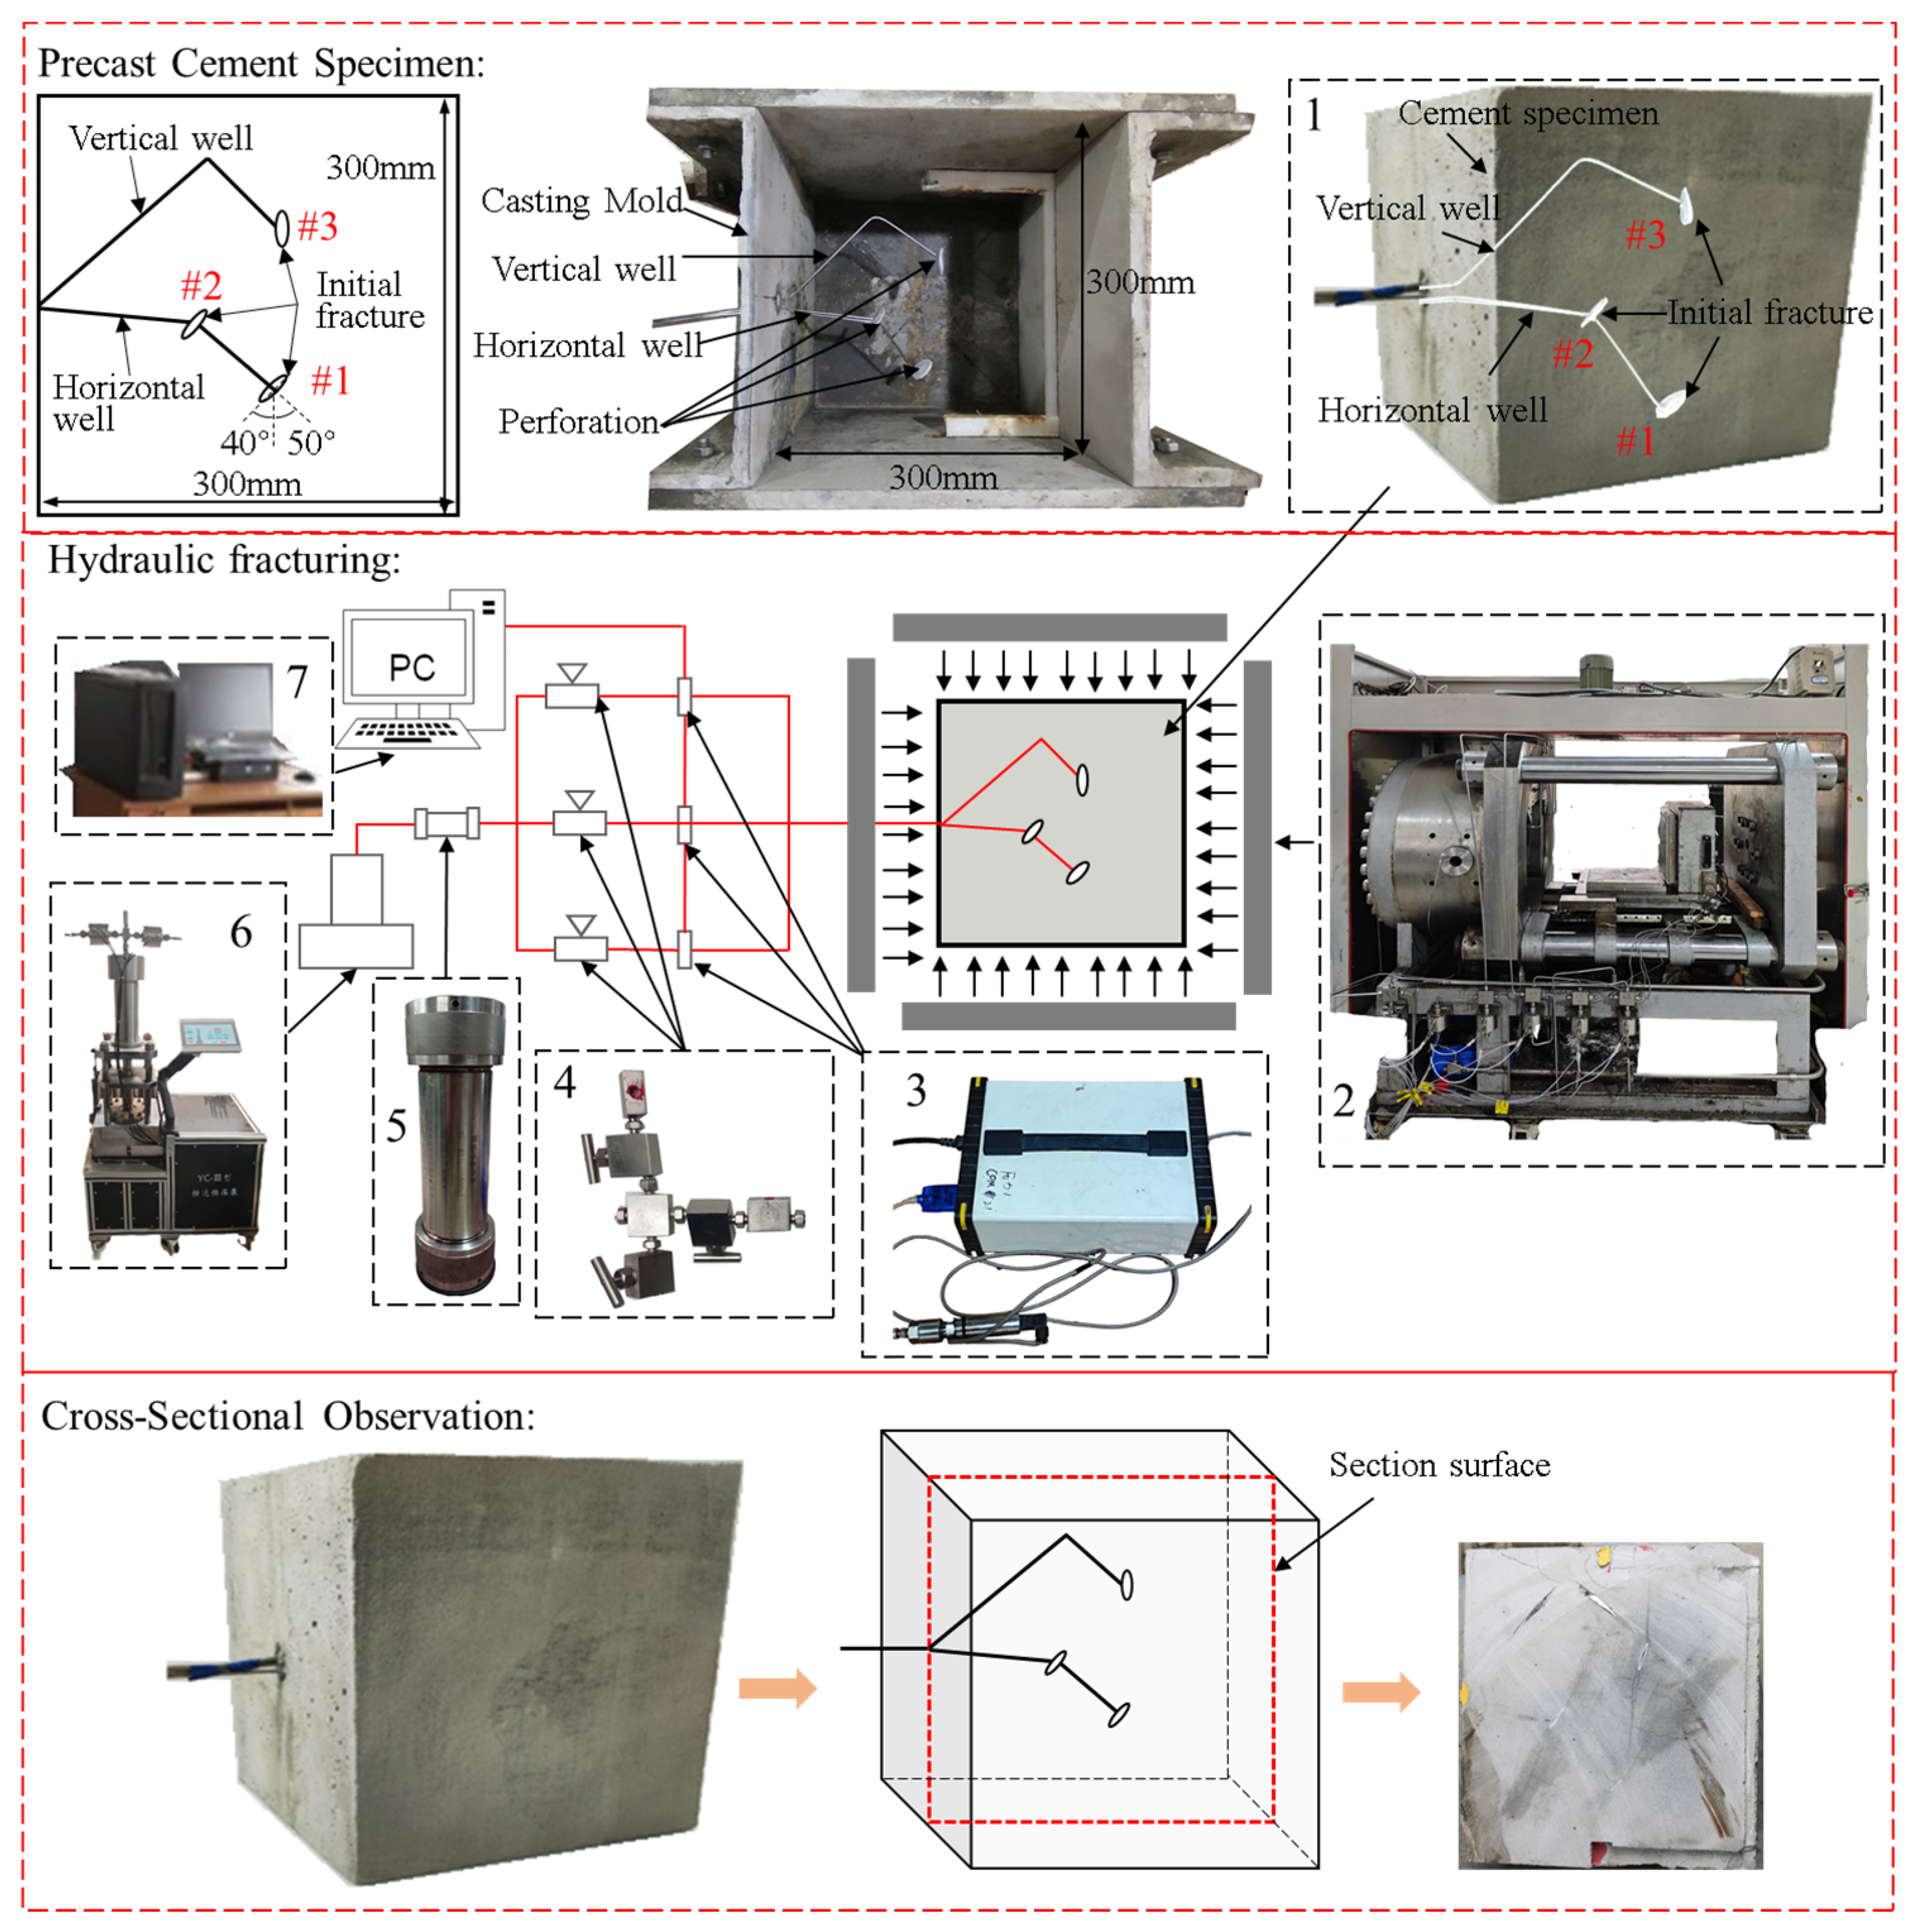
To overcome these limitations, a pre-installed multi-wellbore method was adopted in this study (Figure 4). Flexible high-pressure pipelines were used as wellbores so that each stage could be pressurized, sealed, and controlled independently. Polytetrafluoroethylene (PTFE) sheets were used to form pre-defined initial fractures, and their orientations could be adjusted to represent different perforation directions in the vertical and horizontal wells. This method avoids post-drilling, slot cutting, and casing bonding, and is therefore more suitable for multistage fracturing experiments in CVHWP systems.
The specimens prepared using the second method were made of cement. The binder was composite Portland cement, and the aggregate was 40/70-mesh quartz sand. Each specimen had dimensions of 300 mm × 300 mm × 300 mm (Figure 4). Two wells were included in each specimen: one horizontal and one vertical. High-pressure-pipeline with a diameter of 3 mm was used; two pipelines are used in the horizontal well, one in the vertical well. Initial fractures were made by joining two PTFE sheets and connecting them to one end of the pipeline. In total, there are three stages: stages 1 and 2 are in the two horizontal sections, and Stage 3 is in the vertical section. The vertical-well initial fracture is oriented parallel to σH, whereas the horizontal-well initial fractures are oriented at 40° to σH. The spacing between the two horizontal-well stages is 85 mm.
Triaxial stresses were applied using confining pressure plates. Based on in situ stress state, σH = 8 MPa, σh = 5 MPa, and σv = 12 MPa. The injection rate is 2 mL/min, and the fracturing-fluid viscosity is 125 mPa·s.
The system comprised a true-triaxial loading frame for hydraulic fracturing, pressure sensors, fracturing pumps, and a data-acquisition system. After testing, the specimen was sectioned along the section plane shown in Figure 4 to observe the fracture morphology.
To evaluate how the fracturing sequence affects fracture growth and inter-stage interference, three tests were designed. Specimen A was fractured from the horizontal well to the vertical well, Specimen B was fractured from the vertical well to the horizontal well, and Specimen C used zipper-style alternating fracturing. Specimens A and B were used to compare the effects of “horizontal-first” and “vertical-first,” and Specimen C was used to represent a common field zipper schedule. After each stage, the casing was sealed so that the pressure in the fracture could be maintained and the stress-shadow effect between stages could be evaluated. The procedure is as follows:
Specimen A: horizontal well first, then vertical well. Horizontal wells were fractured in sequence. After each stage, the wellbore was sealed to maintain the in-fracture pressure. The vertical well was fractured last.
Specimen B: vertical well first, then horizontal well. The vertical well was fractured first and was sealed after the treatment to maintain pressure. Two stages in the horizontal well were then fractured in sequence, and the wellbore was sealed after each stage.
Specimen C: zipper fracturing. The first stage in the horizontal well was fractured first and then was sealed to maintain pressure. The vertical well was fractured next and subsequently sealed. The second stage in the horizontal well was fractured last.

3.3. Experimental Results and Analysis

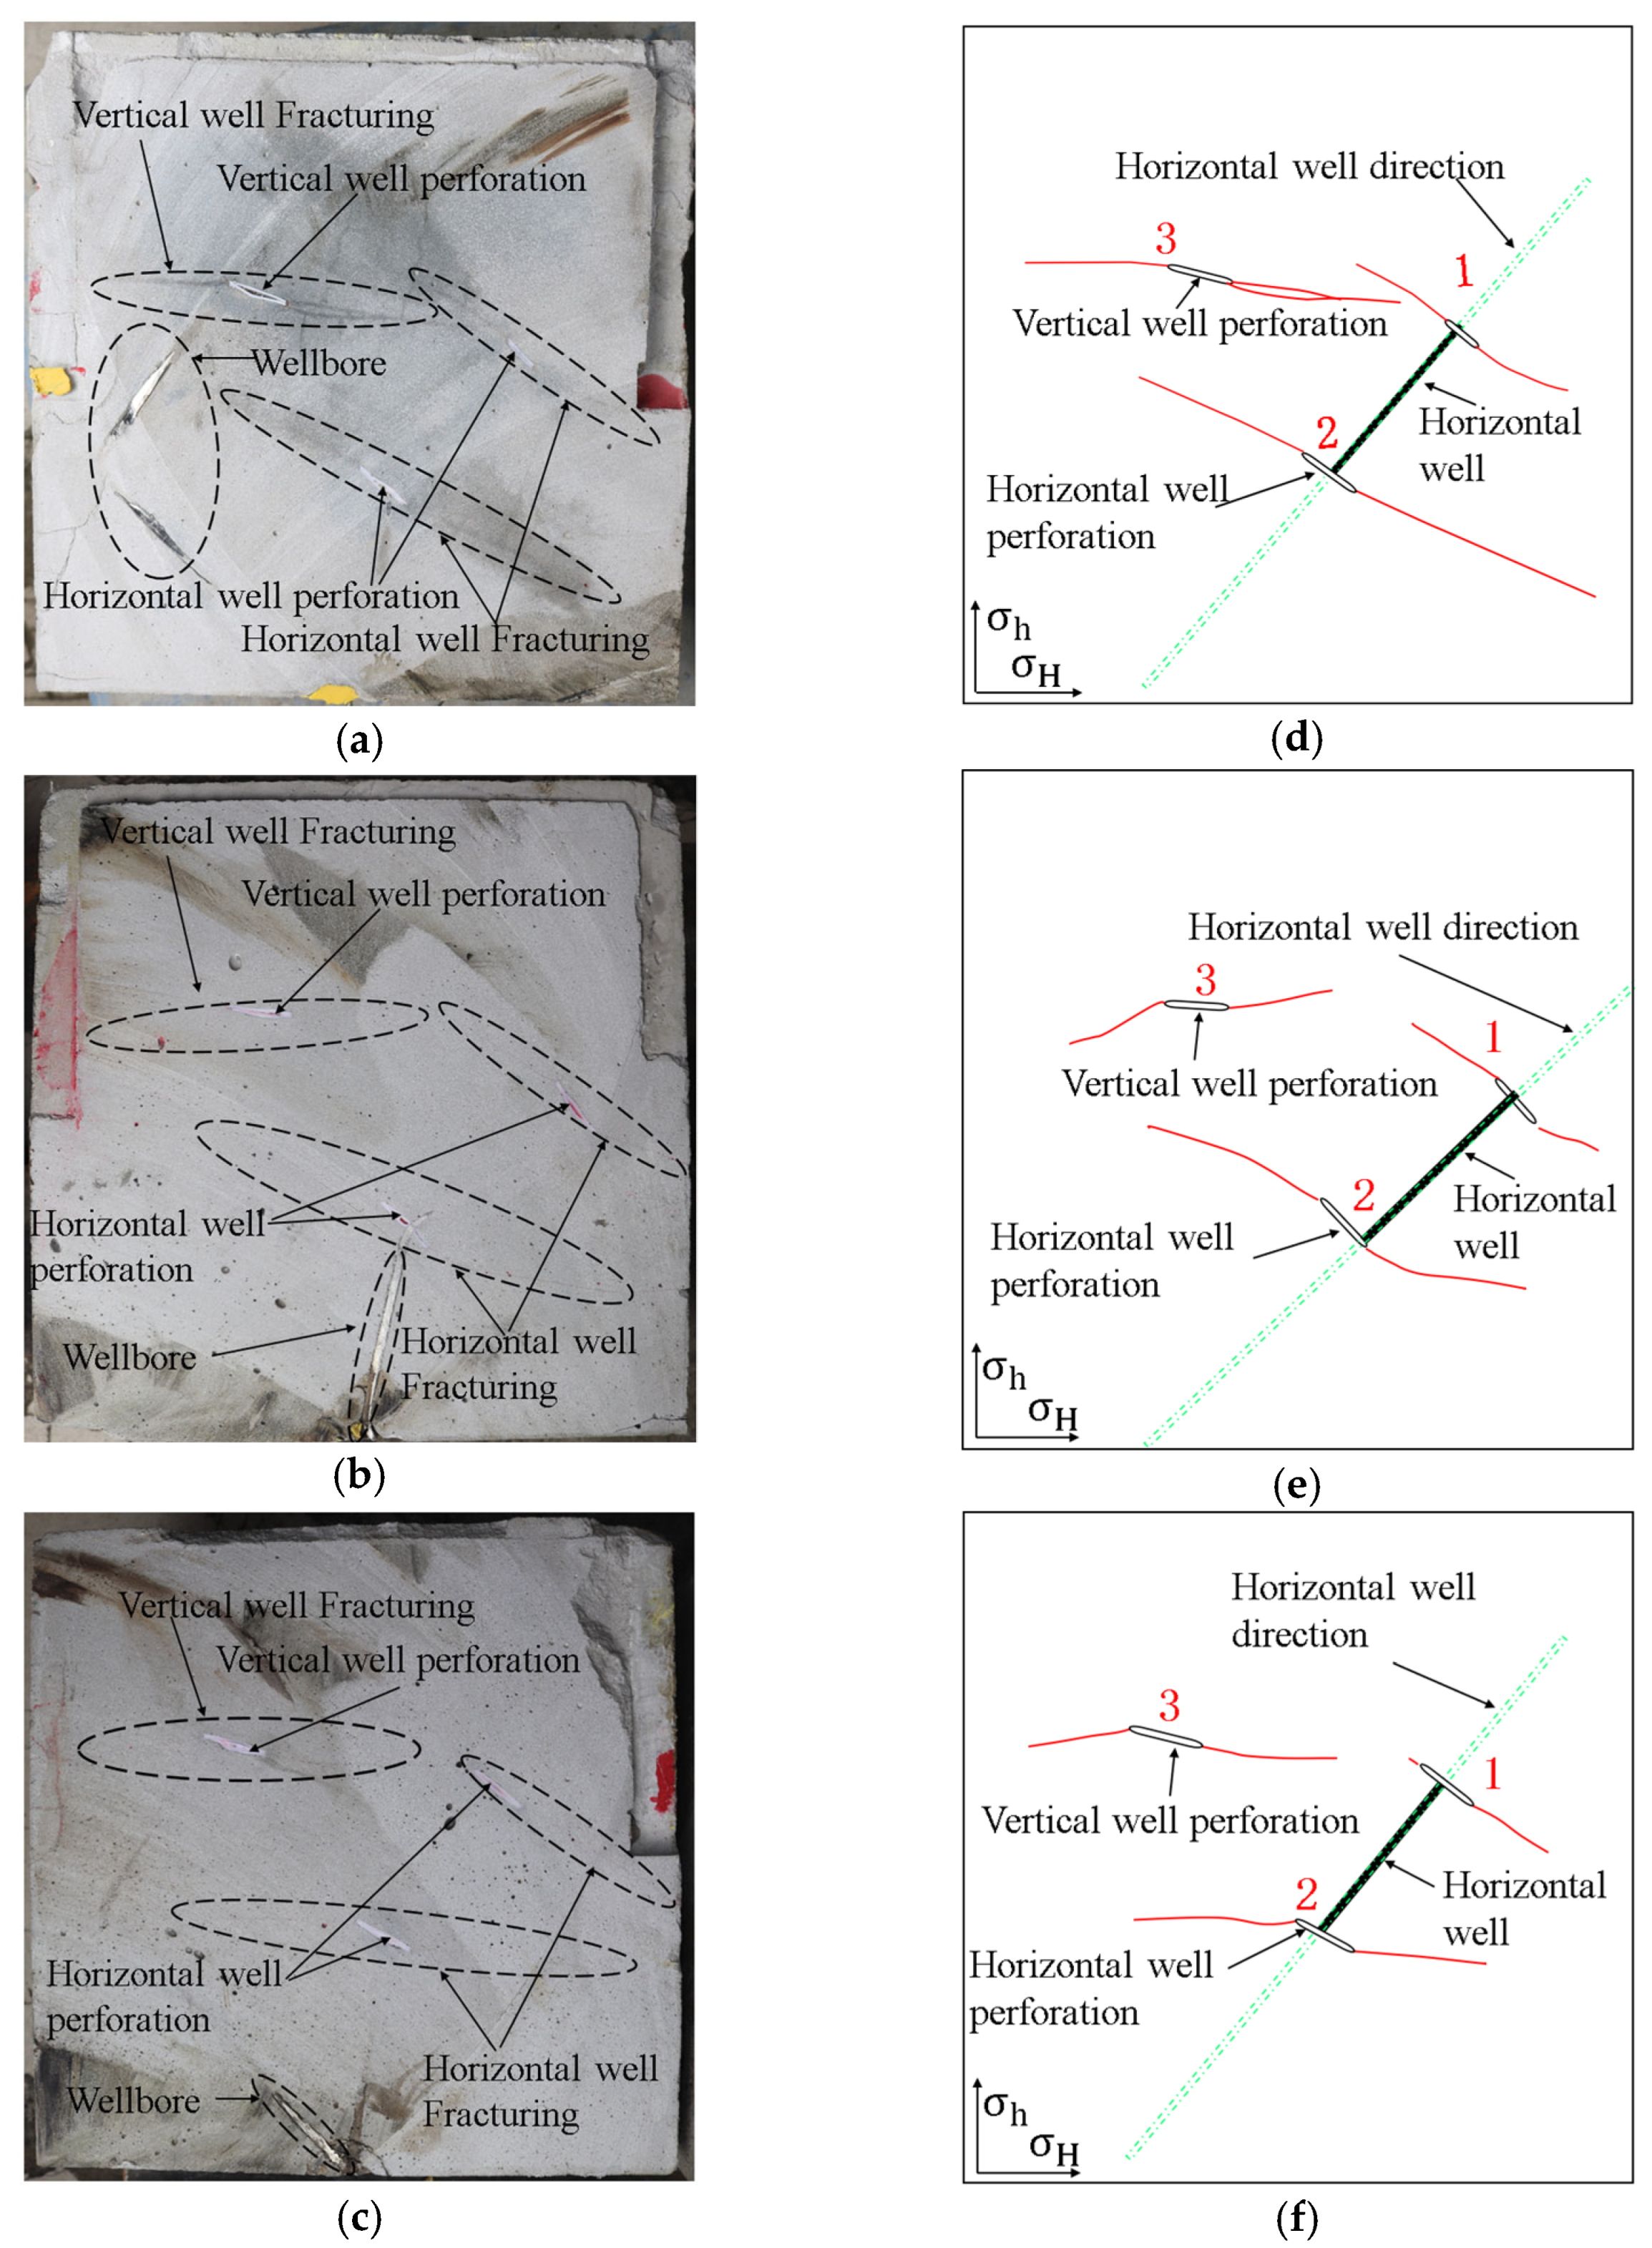
In hydraulic-fracturing models, hydraulic fractures are often simplified as symmetric bi-wing plane fractures, and the propagation direction is governed by the initial in situ stress field [36]. However, fracture propagation can be affected by stress-shadow effects, and nonplanar fractures have frequently been reported [28,30]. To characterize the three-dimensional fracture and to confirm the non-planar features, the specimens were cut after the tests, and the fractures of the three specimens are shown in Figure 5.
For clarity, we use two numbering systems: a treatment-order index and a fixed-section index. Stage 1–Stage 3 denote the fracturing order (the 1st to 3rd treatment). The well section associated with a given stage may change under different sequences; therefore, the stage number does not represent a fixed well section. Fixed well sections are denoted by HW1, HW2, and VW: HW1 refers to Section 1 of the horizontal well, HW2 refers to Section 2 of the horizontal well, and VW refers to the vertical-well section. This fixed-section notation is consistent across all specimens and sequences.
As shown in Figure 5, in Specimen A, fractures in HW1 were initiated from the perforations, and a symmetric bi-wing planar fracture was formed perpendicular to the wellbore. In HW2, a bi-wing planar fracture was formed and extended perpendicular to the wellbore. In VW, the primary fracture was oriented parallel to the σH, and two main fractures were observed at one end. For HW1, because it was fractured first, its morphology was not affected by the induced stress from previously created fractures. Near the wellbore, the fracture initiated symmetrically along the perforation direction and formed an approximately bi-wing planar fracture nearly perpendicular to the wellbore. This indicates that the perforation direction played an important role in guiding near-wellbore fracture initiation. As the fracture propagated away from the perforation, the influence of perforation-guided initiation gradually weakened, while the control of the far-field maximum horizontal principal stress became more significant. Therefore, the slight fracture deflection observed during further propagation can be attributed to the combined effect of perforation-guided initiation and stress-controlled propagation.
In Specimen B, the main fracture in VW was extended along the σH. In HW1, the upper part of the fracture extended perpendicular to the wellbore, while the lower part was deflected, forming a non-planar fracture. In HW2, a symmetric bi-wing deflecting fracture was formed. In Specimen C, a planar fracture perpendicular to the wellbore was formed in HW1. In VW, the fracture extended along the σH. In HW2, a symmetric bi-wing deflecting fracture was formed.
To provide quantitative support for the fracture observations, the post-test fracture morphologies were summarized using descriptive indicators, including fracture type, number of main fractures or branches, and deflection behavior. Because one specimen was tested for each fracturing sequence, the analysis is descriptive rather than inferential. Nevertheless, these indicators provide a quantitative basis for comparing the effects of different fracturing sequences on fracture geometry. The results show that Specimen A, corresponding to the horizontal-well-first sequence, produced relatively stable bi-wing fractures in the horizontal-well stages and multiple fractures in the vertical-well section. In contrast, Specimen B, corresponding to the vertical-well-first sequence, showed more evident fracture deflection in the horizontal-well stages. Specimen C showed intermediate behavior under zipper-style alternating fracturing (see Table 1).
The fracturing geometry is sensitive to the stimulation sequence. Under the sequence of fracturing the horizontal well first and the vertical well second, the horizontal well tended to generate a symmetrical bi-wing planar fracture normal to the wellbore. In the vertical well, multiple fractures were more likely to form.

3.4. Verification of the Induced Stress Model for Combined Well Patterns

To assess the accuracy of the induced-stress model for the CVHWP, fracturing pressure data from a three-stage fracturing were substituted into the Linear Elastic Fracture Mechanics (LEFM) expressions for the Mode I stress intensity factor (KI). The KI for different stages were calculated and compared to assess the model. In the model, each hydraulic fracture is represented as an internally pressurized crack. The crack faces are loaded by the net pressure, whereas the far-field stresses are prescribed by the true-triaxial loading conditions. The crack-tip singularity is treated within the framework of linear elastic fracture mechanics. The singular stress at the crack tip is not taken as a finite stress value; instead, the near-tip field is evaluated using the Mode-I stress intensity factor.
For an infinite plate containing a crack of length h, the analytical expression for the KI at the crack tip is:
K I = 1 π h / 2 h / 2 h / 2 σ x ( 0 , y ) h / 2 + y h / 2 y d y
where σx(0, y) is the normal stress acting on the crack surface at x = 0, MPa.
For a crack with fixed geometry (shape and size), KI increases with the applied stress. When KI reaches a critical value, crack growth becomes unstable and may lead to structural fracture. The critical is denoted as KIc, which is the fracture toughness of the material. Here, KI quantifies the intensity of the near-tip stress field and depends on the crack geometry, the distribution of applied stress, and the boundary conditions. In contrast, KIc characterizes the resistance of a material to unstable crack extension. It is an intrinsic material property and is independent of the crack geometry and external stress states.
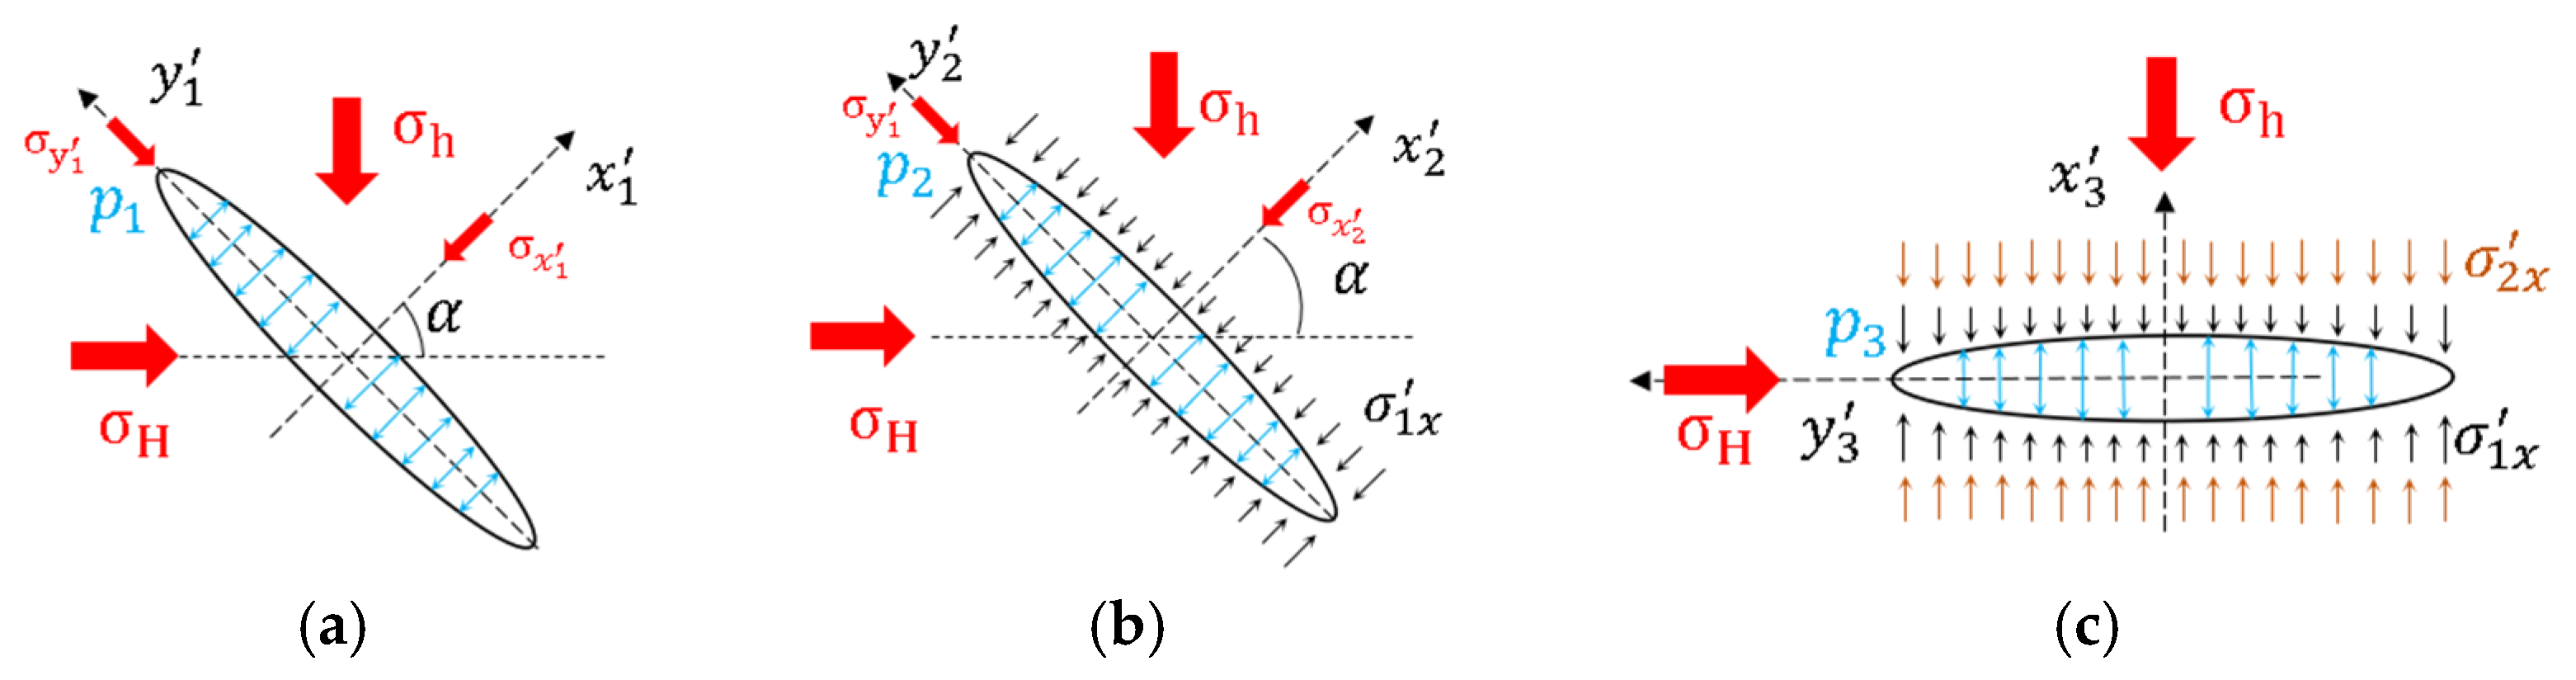
In hydraulic fracturing, tensile failure (Model I) is usually dominant. As shown in Figure 5d, the fractures produced in the three-stage fracturing exhibit bi-planar fracture geometries that are perpendicular to the wellbore. For Specimen A, to simplify the calculation, a local coordinate was defined for each fracture. The fracture plane was taken as the y-axis, and the crack midpoint was taken as the origin. The stress intensity factor at the tip of each fracture was then calculated. A schematic of the loading conditions for the three fractures is shown in Figure 6.
Propagation of the first fracture is controlled by the intra-fracture fluid pressure p1 and by the normal stress component σ x 1 acting on the fracture plane, where σ x 1 is derived from the σh. The KI(1) is evaluated using linear superposition:
K I 1 = K I p 1 K I σ x 1
where KI (1), KI (p1), and KI ( σ x 1 ) denote the Mode I stress intensity factor contributions at the crack tip associated with (i) the first crack, (ii) the internal fluid pressure p1, and (iii) the normal stress component σ x 1 , MPa∙m1/2.
After the first fracture is initiated and propagates, stress is redistributed around it, and the actual stress acting on a later fracture surface is changed. For the second fracture, the normal stress on the fracture surface is determined jointly by the internal fluid pressure p2, the projected stress component σ x 2 obtained by projecting σh onto the second-fracture plane, and the induced stress σ 1 x transmitted from the first fracture to the second-fracture plane. The KI(2) is then evaluated as:
K I 2 = K I p 2 K 2 σ x 2 K I σ 1 x
where KI (2), KI (p2), KI ( σ x 2 ), and K I σ 1 x denote the Mode I stress intensity factor at the crack tip induced by the second fracture, p2, σ x 2 , and σ 1 x , MPa∙m1/2.
The propagation of the third fracture is controlled by the intra-fracture fluid pressure p3, the minimum horizontal in situ stress σh, and the induced stresses σ 1 x and σ 2 x generated by the first two fractures and resolved on the third plane of the fracture. The KI(3) is computed as follows:
K I 3 = K I p 3 K 3 σ h K I σ 1 x K I σ 2 x
where KI(3), KI(p3), KI(σh), K I σ 1 x , and K I σ 2 x are the stress intensity factors at the crack tip induced by the third fracture, p3, σh, σ 1 x , and σ 2 x , MPa∙m1/2.
The KI for the three fractures are obtained from Equations (12)–(15):
K I 1 = 1 π h / 2 h / 2 h / 2 ( p 1 σ x 1 ) h / 2 + y h / 2 y d y
K I 2 = 1 π h / 2 h / 2 h / 2 [ p 2 σ x 2 σ 1 x ( 0 , y ) ] h / 2 + y h / 2 y d y
K I 3 = 1 π h / 2 h / 2 h / 2 [ p 3 σ h σ 1 x 0 , y σ 2 x 0 , y ] h / 2 + y h / 2 y d y
where p1, p2, p3 are the intra-fracture pressures of the three fractures, MPa; σ x 1 and σ x 2 are the components of the σh resolved on the planes of the first and second fractures, MPa; σ 1 x ( 0 , y ) and σ 2 x 0 , y are the induced stresses on the fracture planes due to the first and second fractures, MPa. The normal stress components on the fracture planes are determined using Mohr’s stress circle:
σ x 1 = σ x 2 = σ H cos 2 α + σ h sin 2 α
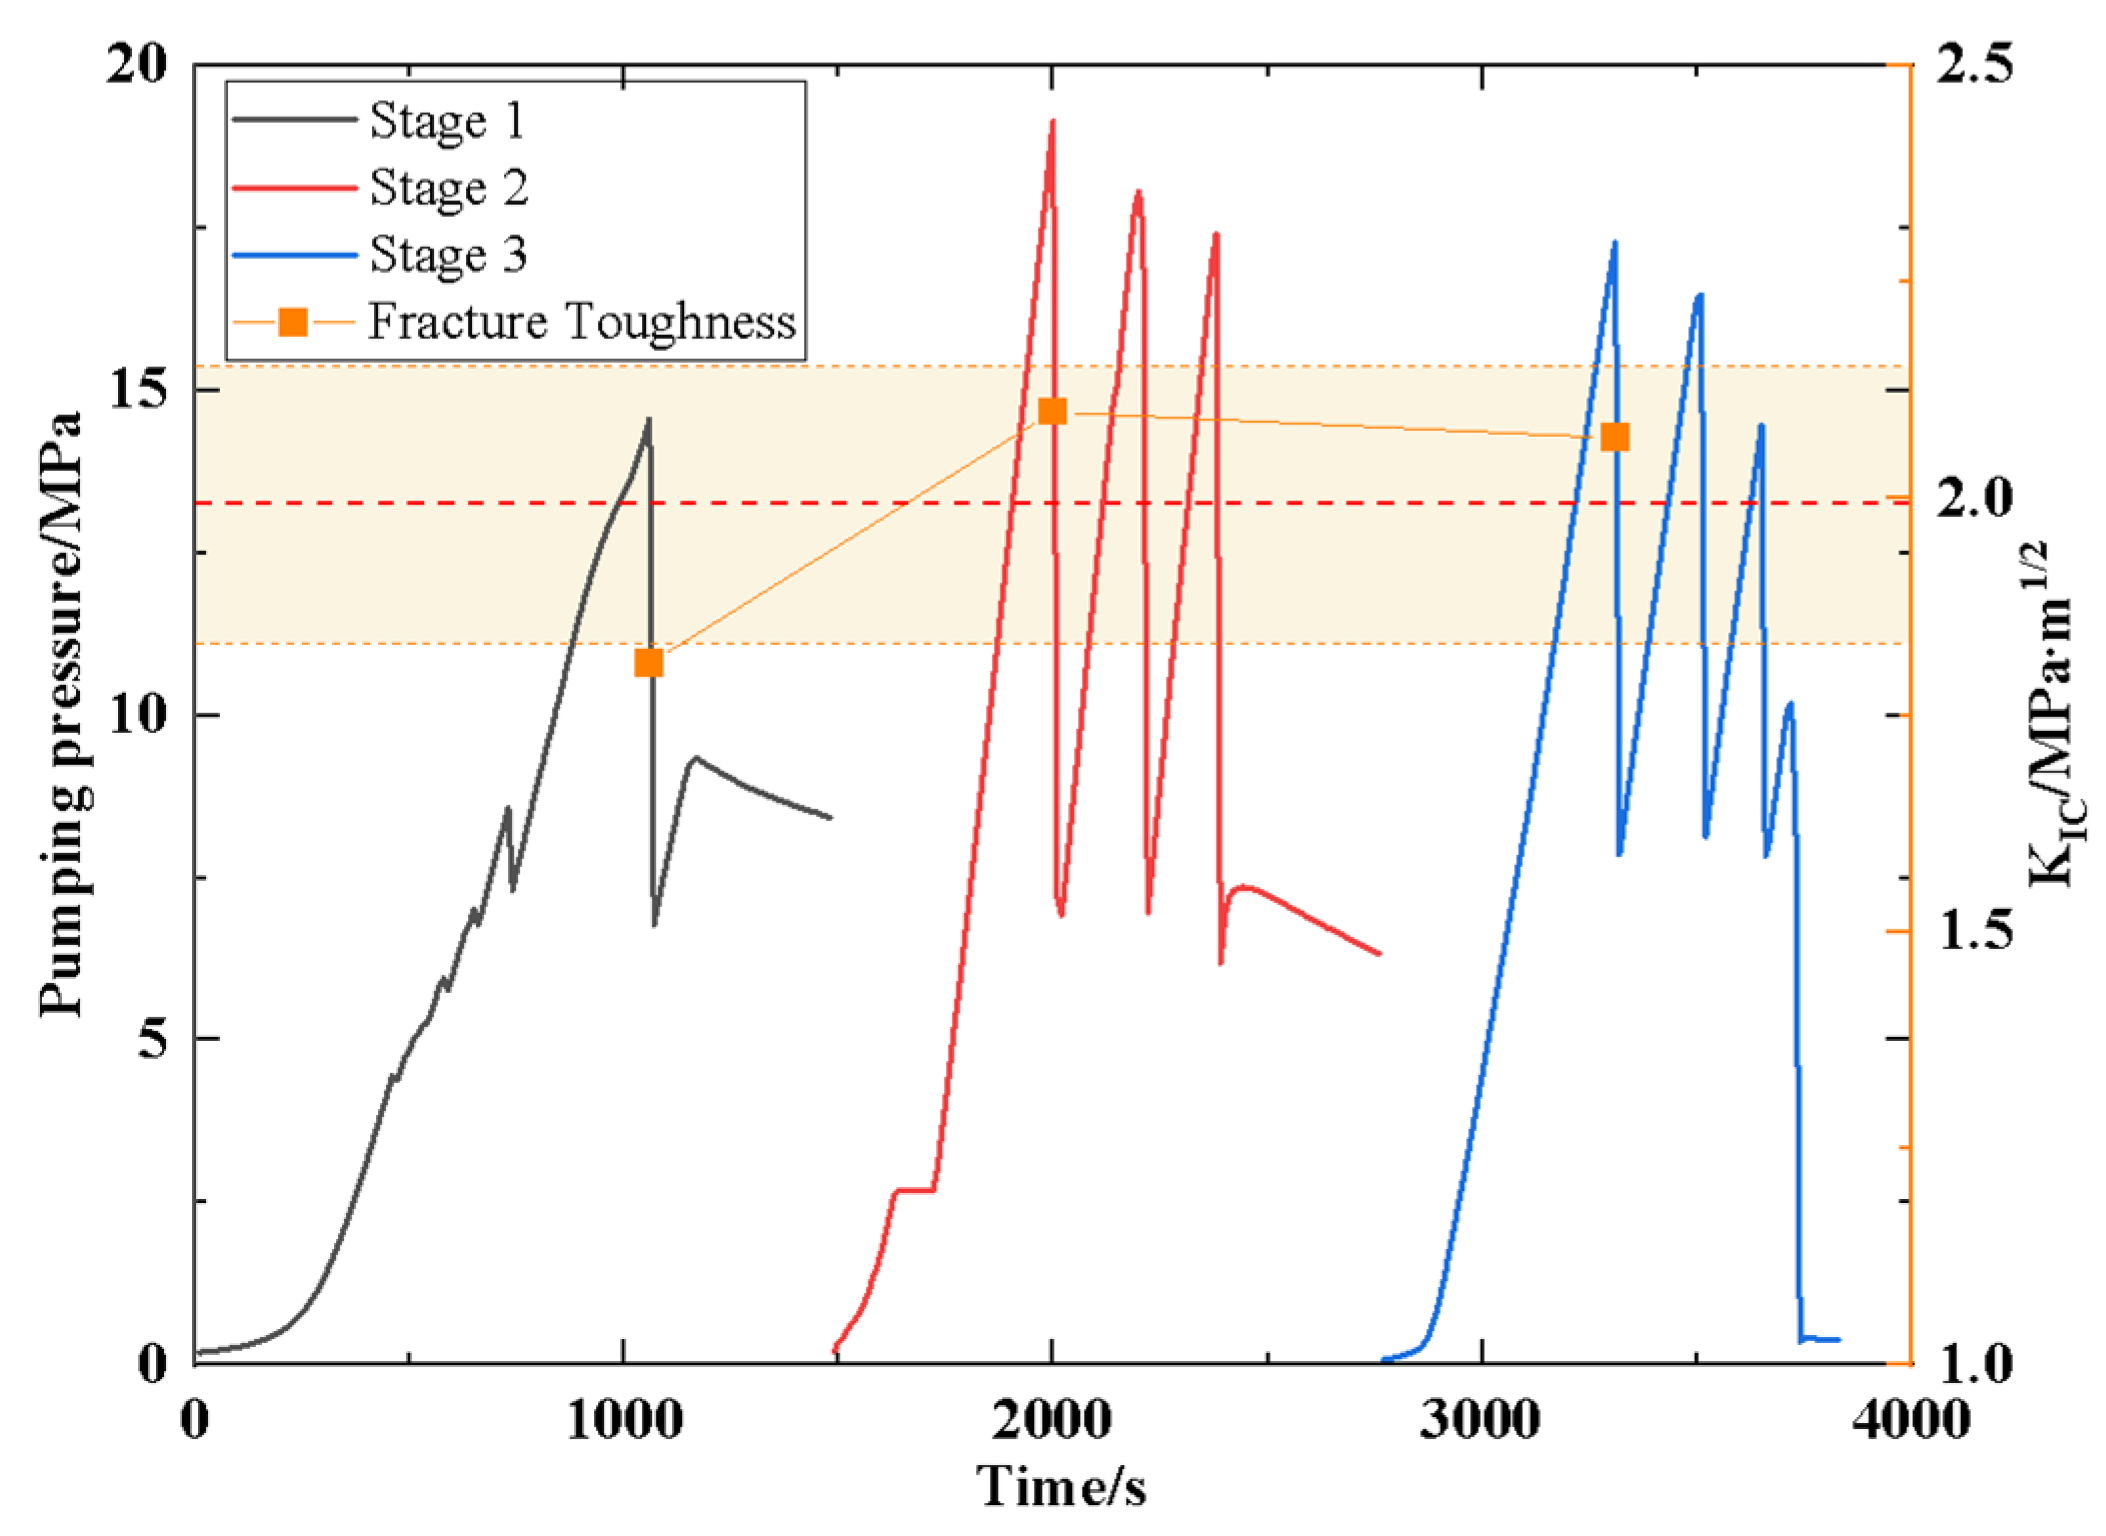
The KI was computed numerically in Mathematica. Figure 7 shows the injection-pressure history and the corresponding KI for Specimen A. The Stage 1 breakdown pressure in the horizontal well was 14.56 MPa, whereas Stage 2 required a higher breakdown pressure of 19.15 MPa. Because the two fractures were oriented at the same angle relative to the principal stress direction, the 4.59 MPa increase in Stage 2 breakdown pressure is attributed to a pronounced stress-shadow effect from the existing fracture. Specifically, pressurization of the existing fracture induced stresses that altered the local stress field, thereby increasing the pressure required to initiate a subsequent fracture despite an identical orientation.
Based on Equations (16)–(18), the KI values at breakdown for the three-stage fracturing sequence were computed using the parameters listed in Table 2. The calculated KI values for the three stages were 1.81, 2.10, and 2.07 MPa·m1/2, respectively. The average KI was 1.99 MPa·m1/2, with a standard deviation of 0.16 MPa·m1/2 and a coefficient of variation of 8.00%. The relative deviations of the three stages from the average value were 9.05%, 5.53%, and 4.02%, respectively. These low deviations indicate that the KI values are consistent among different fracturing stages, thereby providing a quantitative metric for validating the induced-stress model for the CVHWP.
It should be noted that a full spatial error metric between the predicted and observed fracture trajectories was not calculated because the fracture geometries were obtained from post-test sectioned specimens rather than from real-time fracture-tip tracking. Therefore, in this study, the consistency of the breakdown stress intensity factors was used as the primary quantitative validation metric.

3.5. Analysis of Influencing Factors

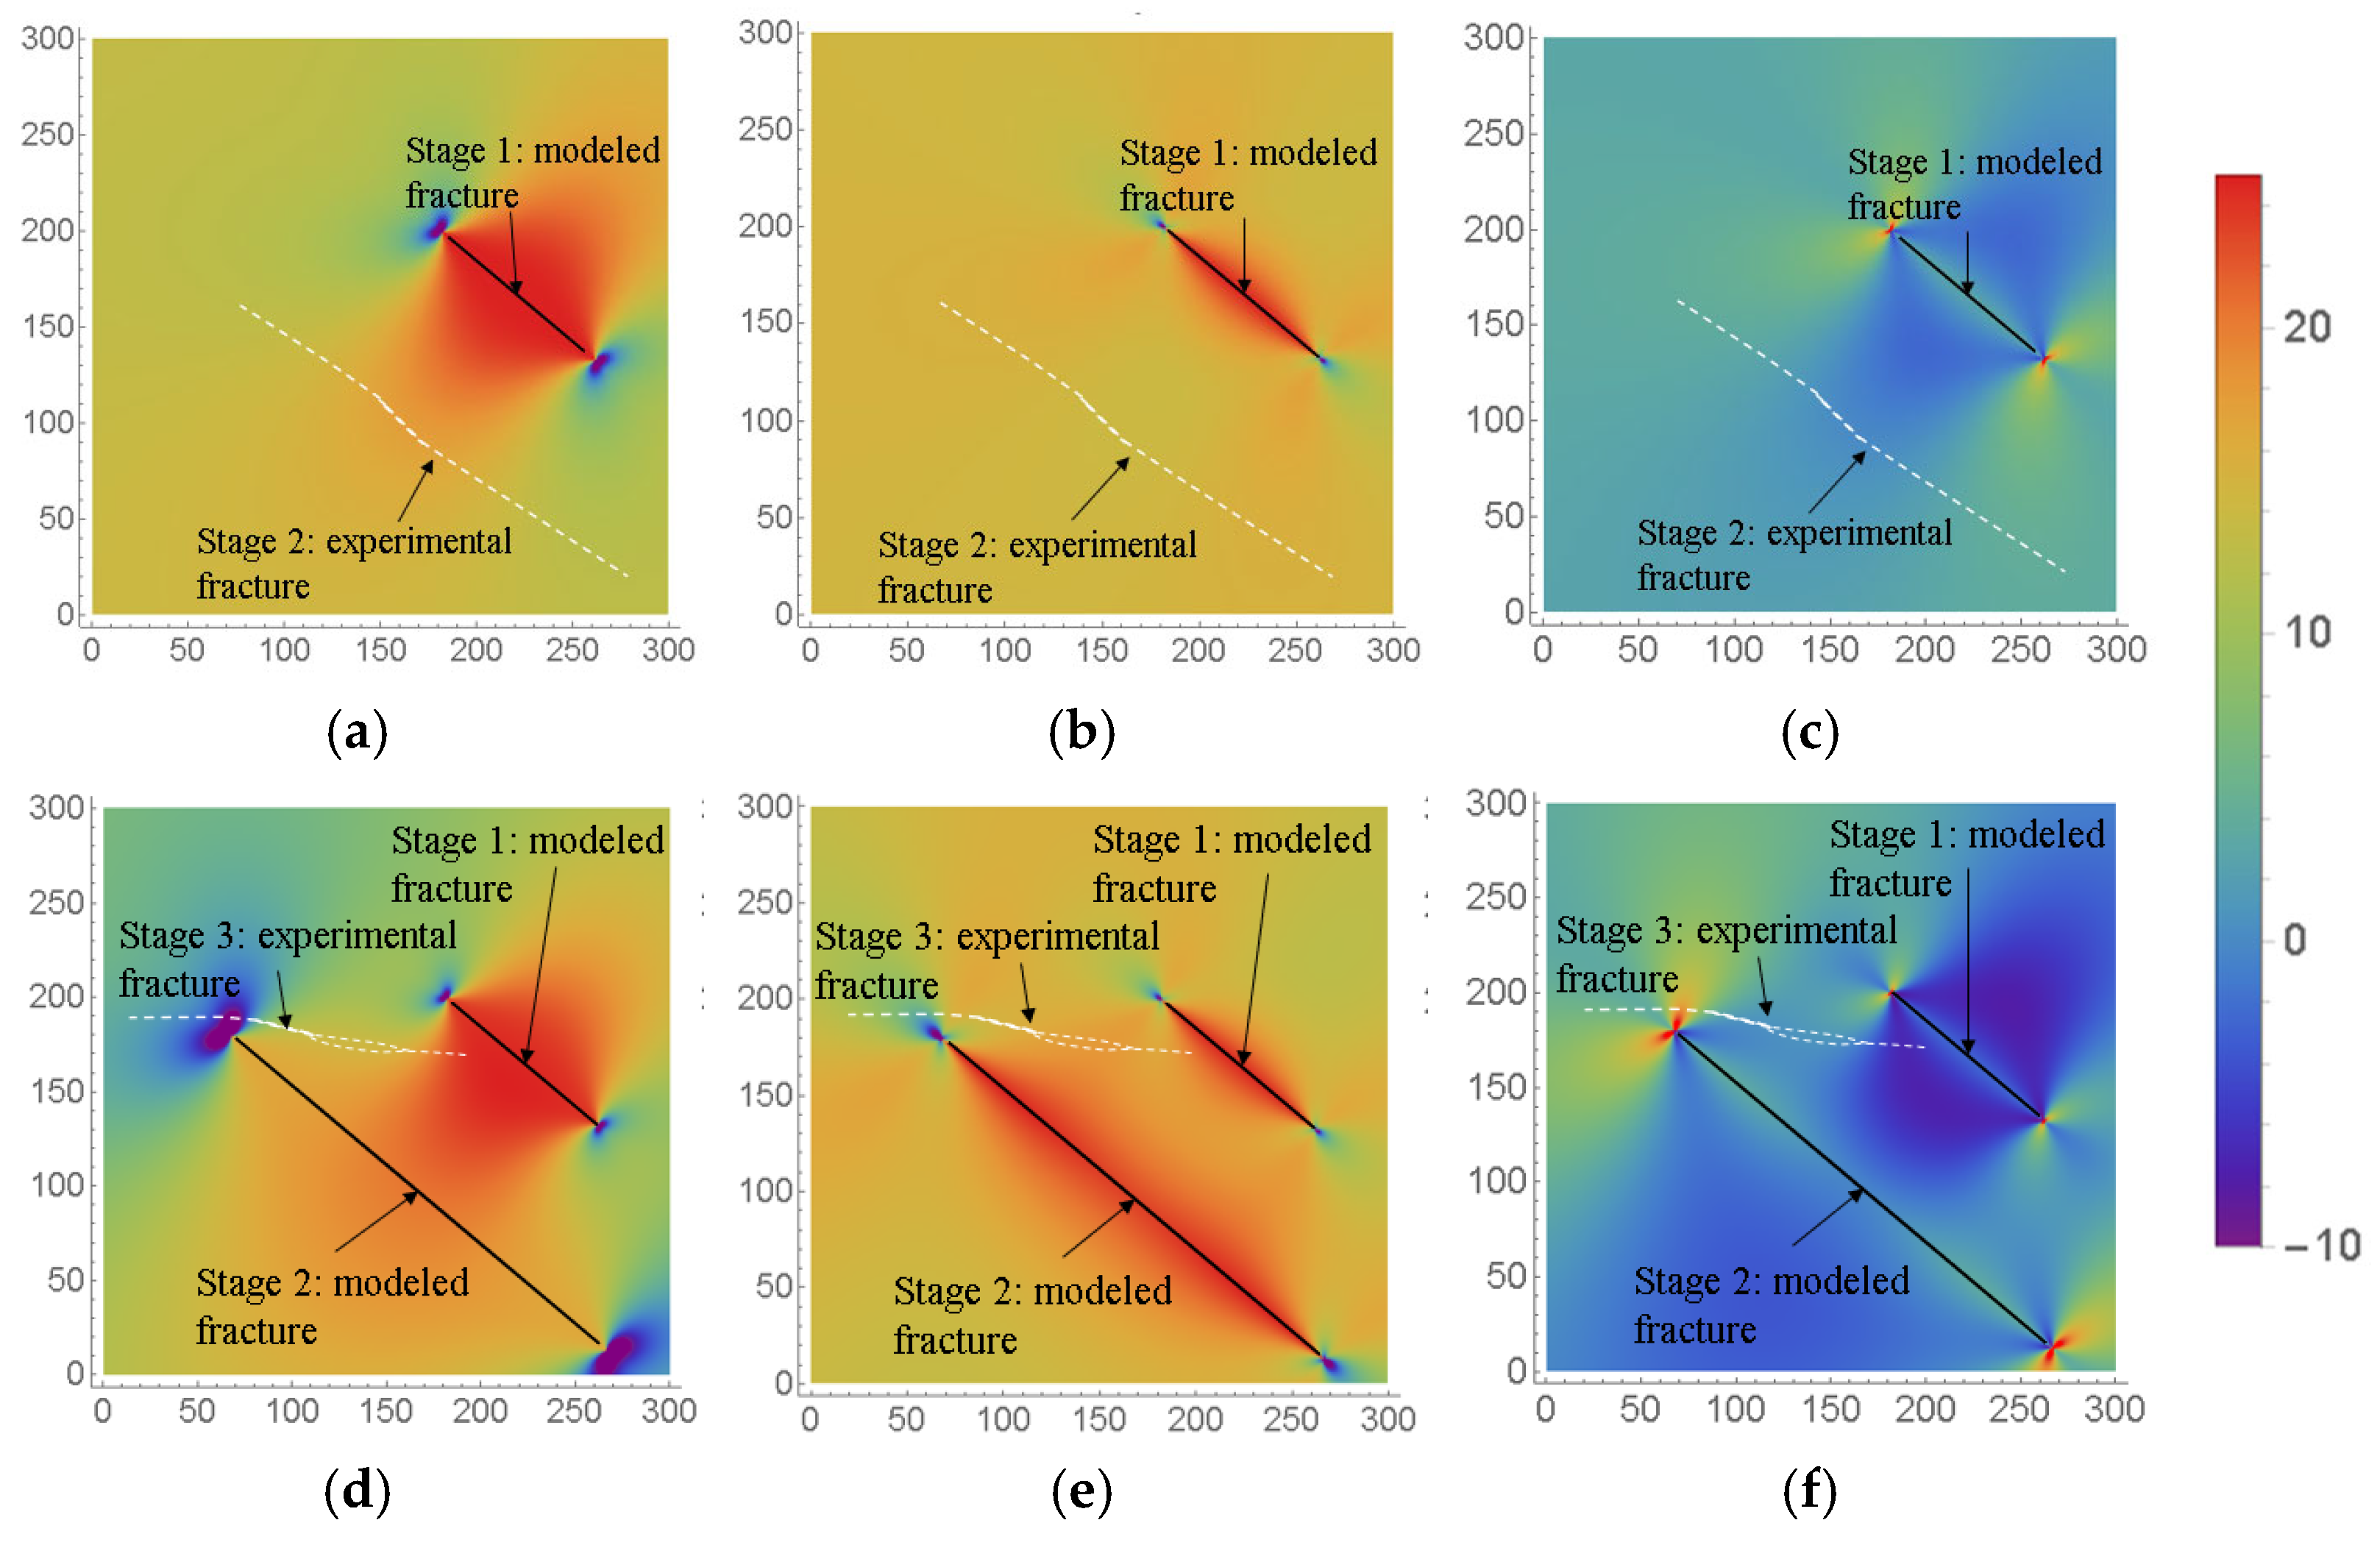
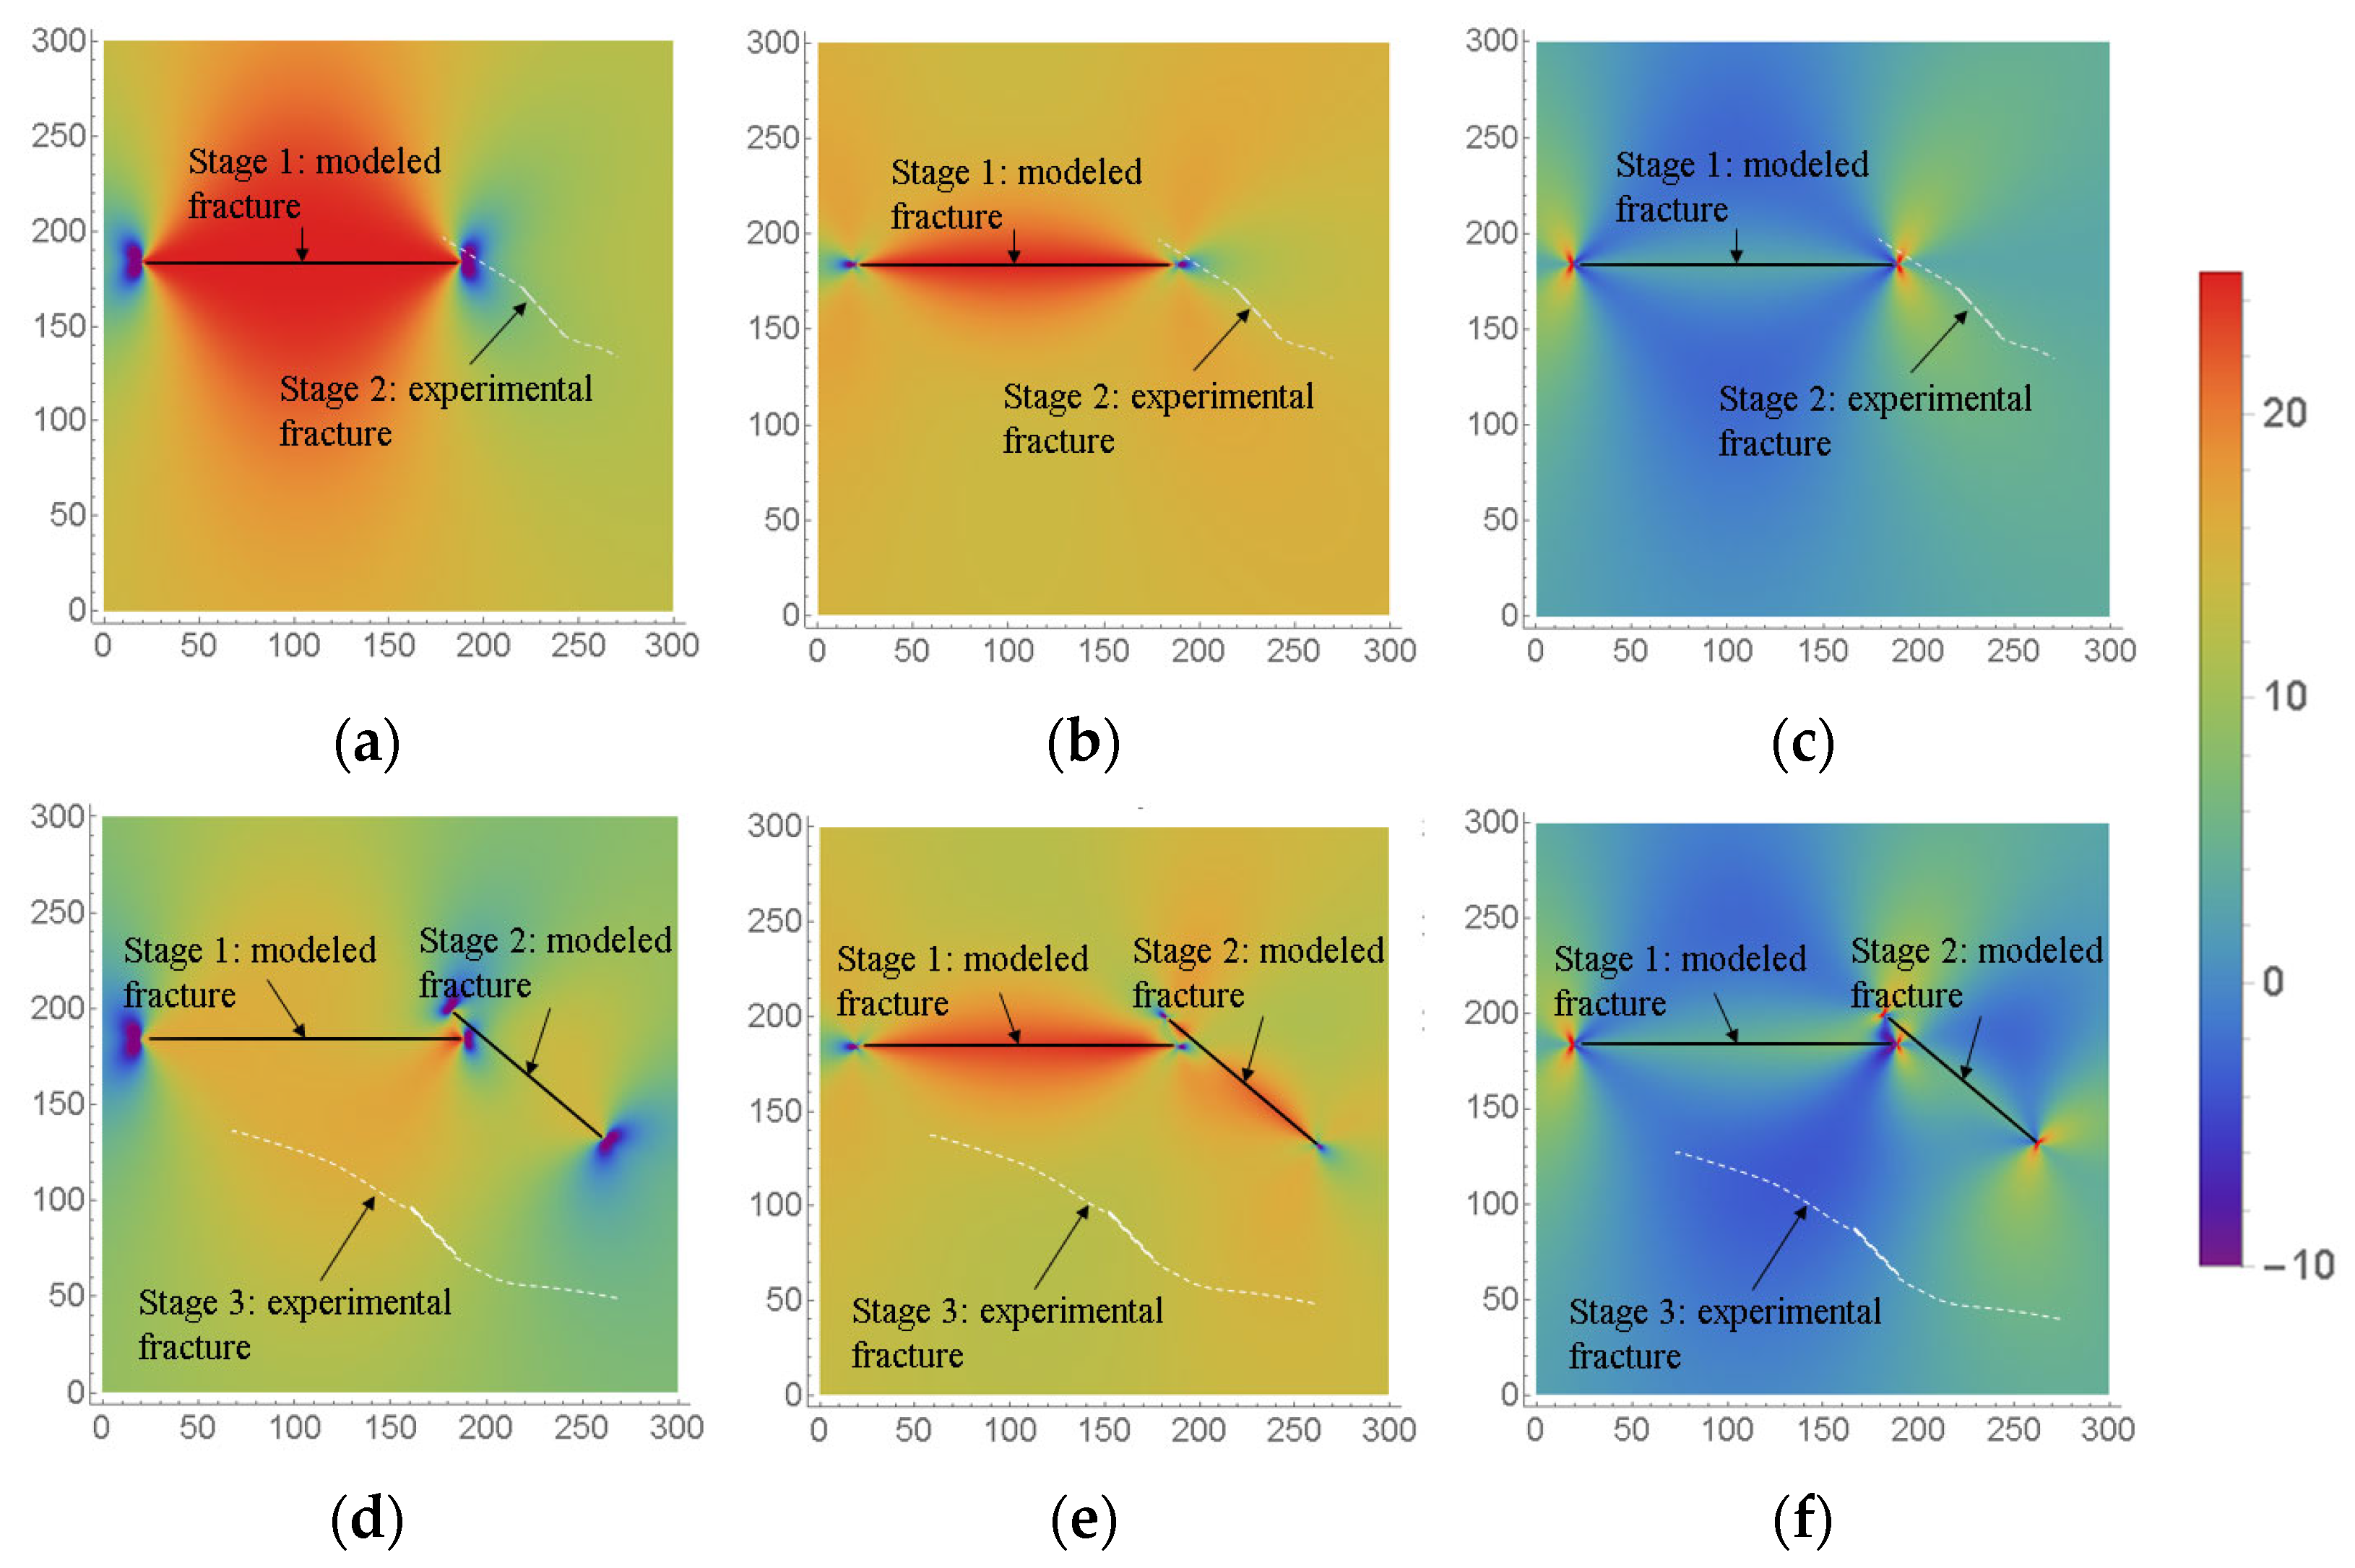
An induced-stress model was solved in Mathematica to calculate the induced stresses generated by the first two treatments under different fracturing sequences. Because the present model is analytical rather than finite-element-based, no finite-element mesh or mesh-refinement strategy is involved. The stress-contour maps were obtained by evaluating the analytical stress expressions at calculation points in the model domain. Points located exactly at the crack tips were excluded from direct finite-stress interpretation to avoid the influence of stress singularity. To quantify the effect of sequence on stress shadowing, key parameters (e.g., fracture length and in-fracture pressure) were kept the same for all cases, and the net pressure was set to 7.38 MPa (the average of horizontal stages 1 and 2). Figure 8 presents the induced-stress contour maps in the x and y directions, the horizontal stress-difference maps, and a comparison with the fracture observed in the subsequent treatment. In Figure 8, solid lines represent the modeled fracture in the current treatment used for induced-stress calculation, whereas dashed lines represent the fracture observed experimentally in the next treatment. The overlay was used to examine whether the subsequent fracture agreed with the stress-controlled prediction under the combined effects of induced stress from the current fracture and the in situ stress field.
The induced stress is distributed in an axisymmetric pattern on the two sides of the fracture. Tensile stresses develop on both sides of the fracture tip, accompanied by stress concentration, whereas compressive stresses occur on both sides of the fracture. The induced stress decreases as the distance from the fracture increased. A larger influence range and magnitude are found perpendicular to the fracture compared to parallel to the fracture. As a result, the induced stress reduces the horizontal stress difference, as shown in Figure 8c. At a distance of 37 mm from the fracture, the horizontal stress difference reaches its minimum, decreasing from 3 MPa to −2.68 MPa. The negative value of the horizontal stress difference does not indicate a tensile horizontal stress state. It indicates that the induced stress locally reverses the relative magnitudes of the two horizontal stress components, so that the stress component along the original σh direction becomes larger than that along the original σH direction. This local stress-difference reversal reflects a significant reduction in stress anisotropy and may be accompanied by local principal-stress reorientation. As shown in Figure 8f, the horizontal stress difference is minimized at a distance of about 60 mm from the fracture, with a minimum value of −2.68 MPa. Under the constant-net-pressure assumption of the present analytical model, increasing fracture length mainly enlarges the affected range of stress redistribution, while the minimum horizontal stress difference is not significantly changed. Because field-scale fracturing is affected by net pressure variation, leak-off, fracture-height growth, proppant transport, natural fractures, bedding planes, and reservoir heterogeneity, this result should be re-evaluated using field-specific parameters before field application.
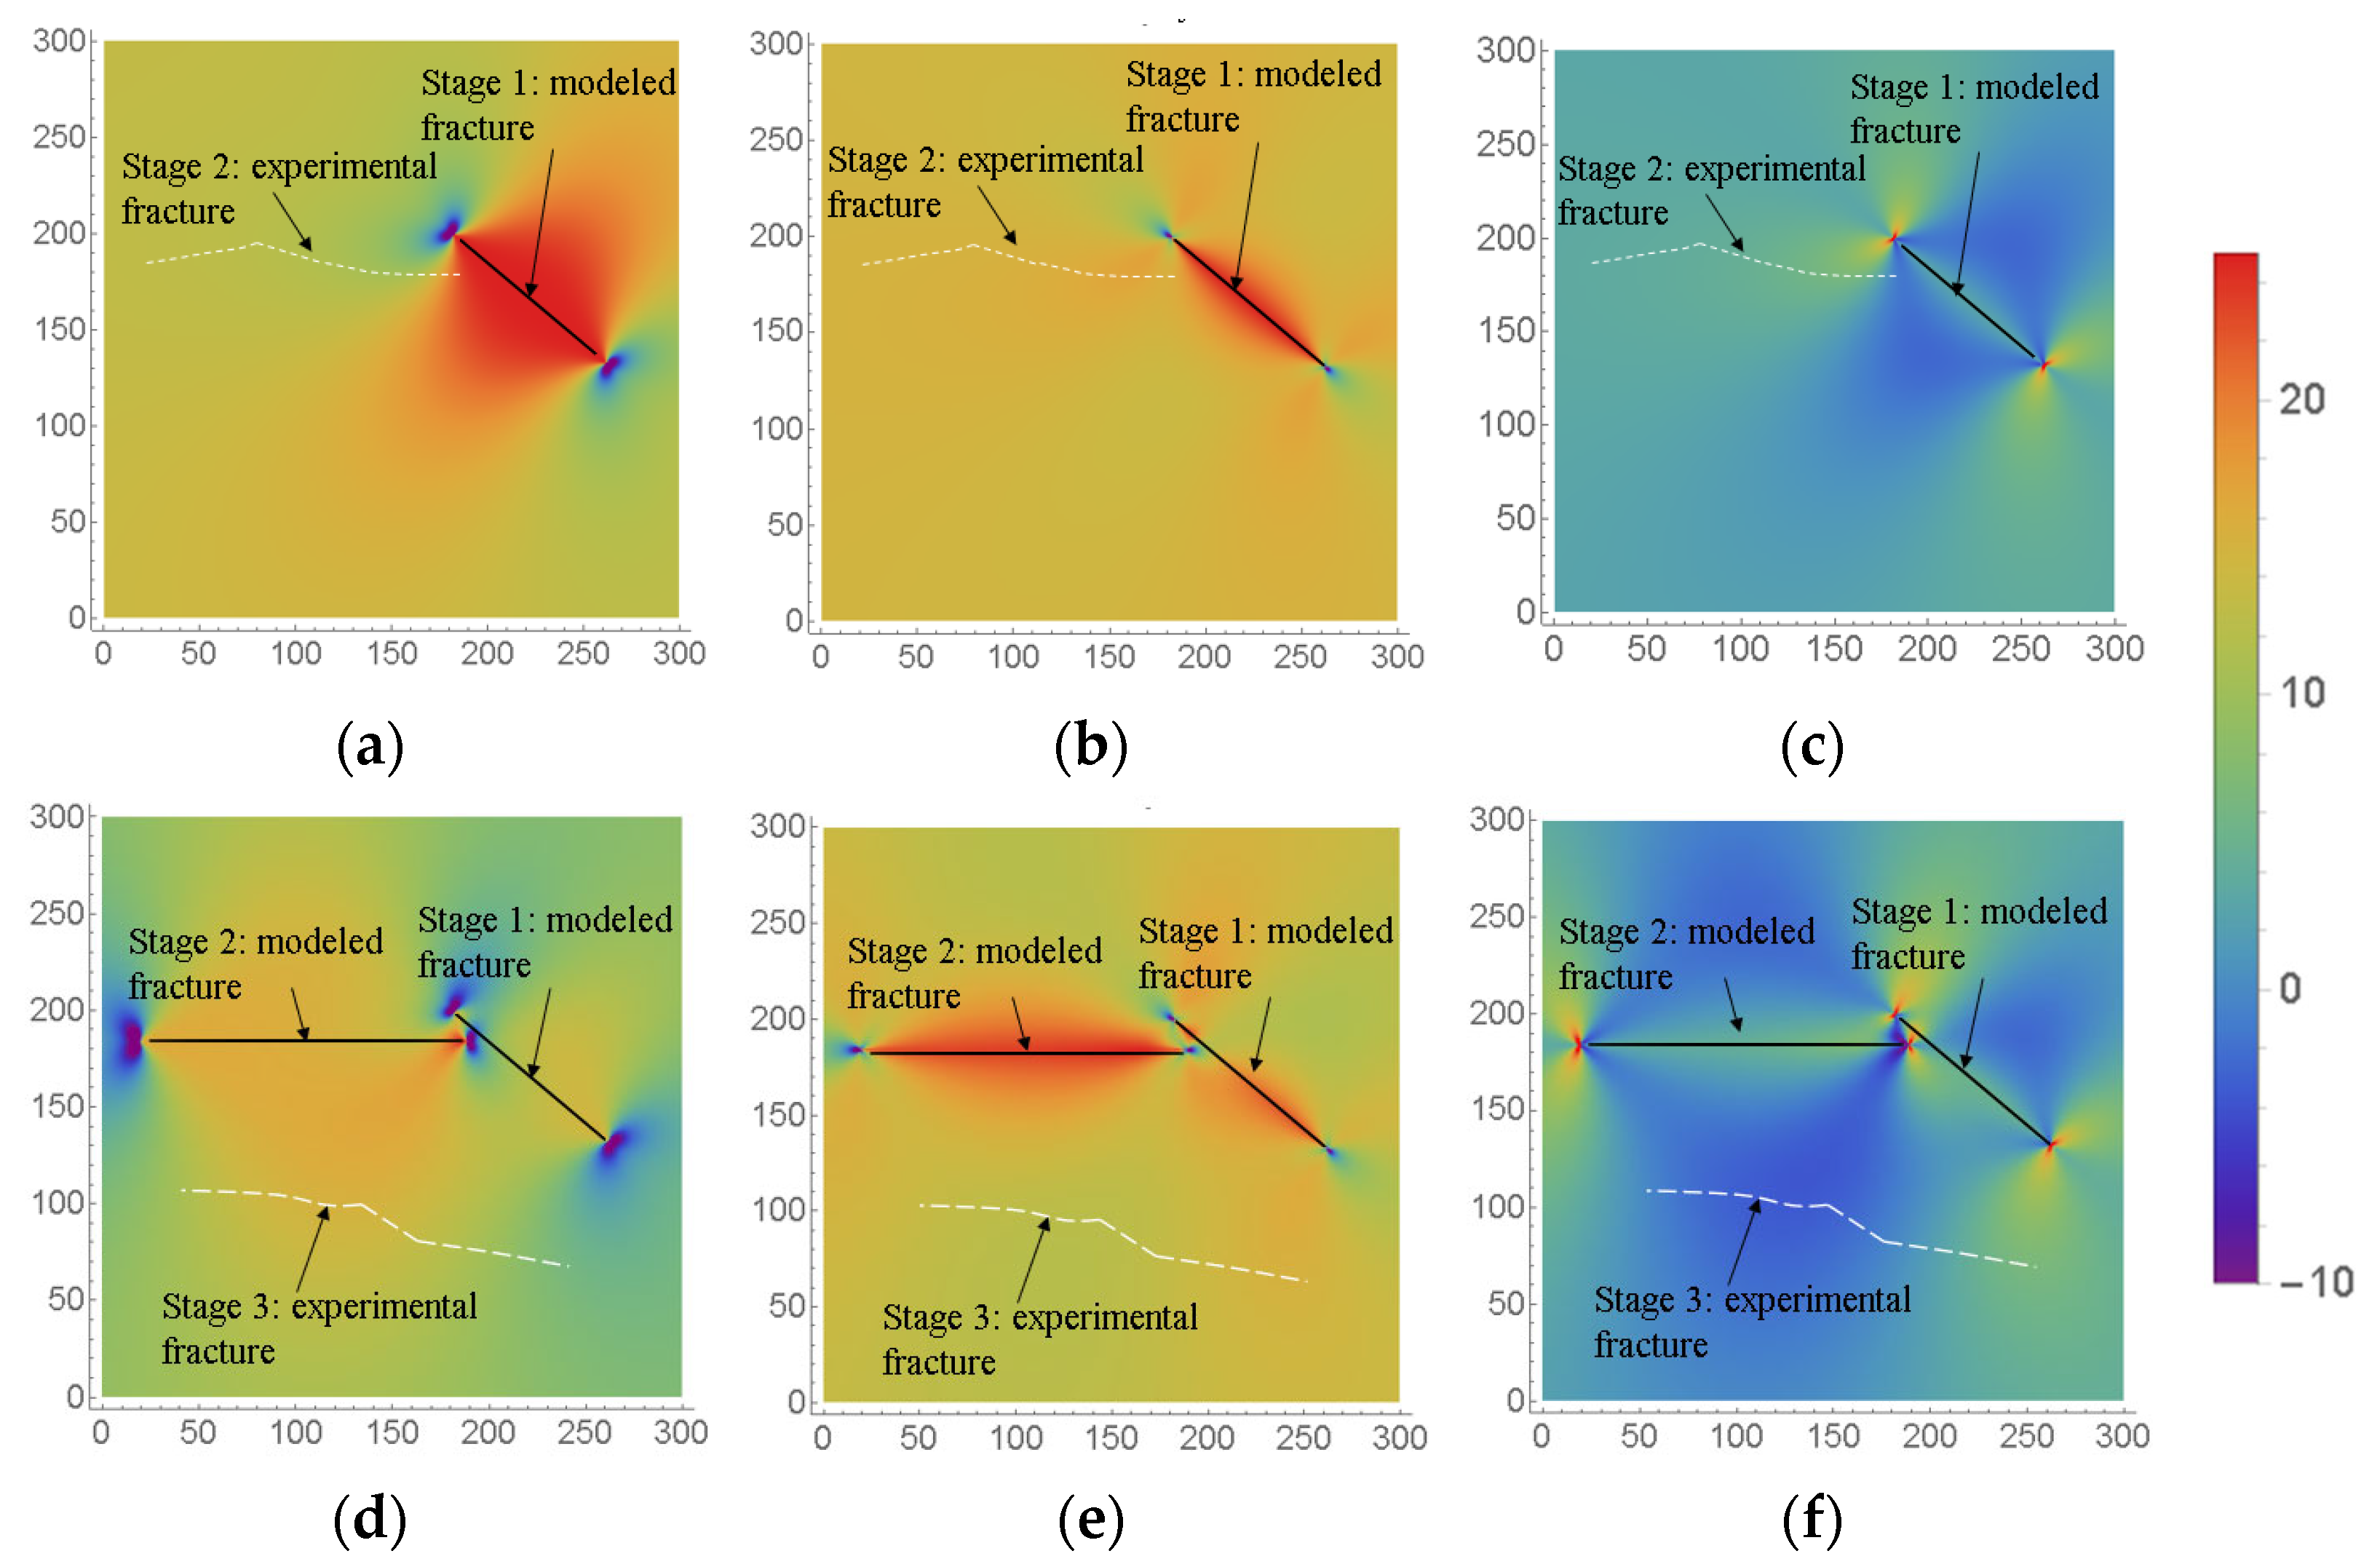
It is widely accepted among scholars [37,38,39] that fracture initiation and propagation are strongly influenced by the horizontal stress difference. Under a reduced stress difference, fracture diversion and branching are more readily observed, which is conducive to the development of multiple fractures. In contrast, a large stress difference inhibits the activation of pre-existing weak planes and tends to produce a primary fracture rather than a complex network. When VW was fractured first, the horizontal stress difference at the planned initiation point of HW1 increased from 3.00 MPa to 5.01 MPa, representing an increase of 2.01 MPa, as shown in Figure 9. The value of 5.01 MPa was extracted from the calculated horizontal stress-difference field at the HW1 initiation-point coordinate of (222, 166). Therefore, it represents a local representative value at the subsequent fracture-initiation point, rather than a domain-averaged value or the global maximum value. This point was selected because the stress-shadow effect mainly affects the local stress condition controlling the initiation of the next fracturing stage. Under the larger stress difference, multiple fractures were less likely to be formed in the horizontal well. In addition, fracture growth was more likely to occur in the y direction and fracture deflection was more likely to be observed. There was a close match between the experimental fracture azimuth and the model prediction (see Figure 10).
When the HW1 was fractured first, the induced stresses reduced the horizontal stress difference at HW2 from 3.00 MPa to −0.25 MPa, representing a 3.25 MPa reduction. Meanwhile, the stress difference at VW increased to 4.54 MPa, a 1.54 MPa enhancement. In the calculation grid, the initiation-point coordinates of HW1, HW2, and VW are (222, 166), (167, 96), and (104, 184), respectively. These values were selected because the stress-shadow effect mainly affects the initiation condition of the next fracturing stage. It is observed that fracturing HW1 decreases the stress difference at HW2 while increasing it at the VW. Consequently, the sequence of fracturing of HW1 followed by HW2 is preferred. After HW1 and HW2 were completed, the stress difference at VW decreased from 4.54 MPa to 0.65 MPa, a 3.89 MPa reduction, which is conducive to the formation of branched fractures. As shown in Figure 8f, multiple fractures were observed on the right side of VW in specimen A. This pattern is consistent with the simulation results, supporting the reliability of the model.
It should also be noted that fracture deflection in the horizontal well is not controlled solely by induced-stress changes. The perforation direction affects the near-wellbore initiation path, whereas the far-field stress and the induced stress generated by previous fractures become increasingly important during subsequent fracture propagation. Therefore, the observed fracture deflection should be interpreted as the combined result of perforation-guided initiation and stress-controlled propagation.
Accordingly, for the CVHWP configuration investigated in this study, the preferred fracturing sequence is to stimulate the horizontal well first and the vertical well later. Under the present stress state, well spacing, perforation orientation, fracture length, and net-pressure conditions, this sequence can use the stress-shadow effect to reduce the horizontal stress difference in subsequent stages, thereby favoring fracture deflection and local branching.

4. Field Application

4.1. CVHWP: Field Implementation and Results

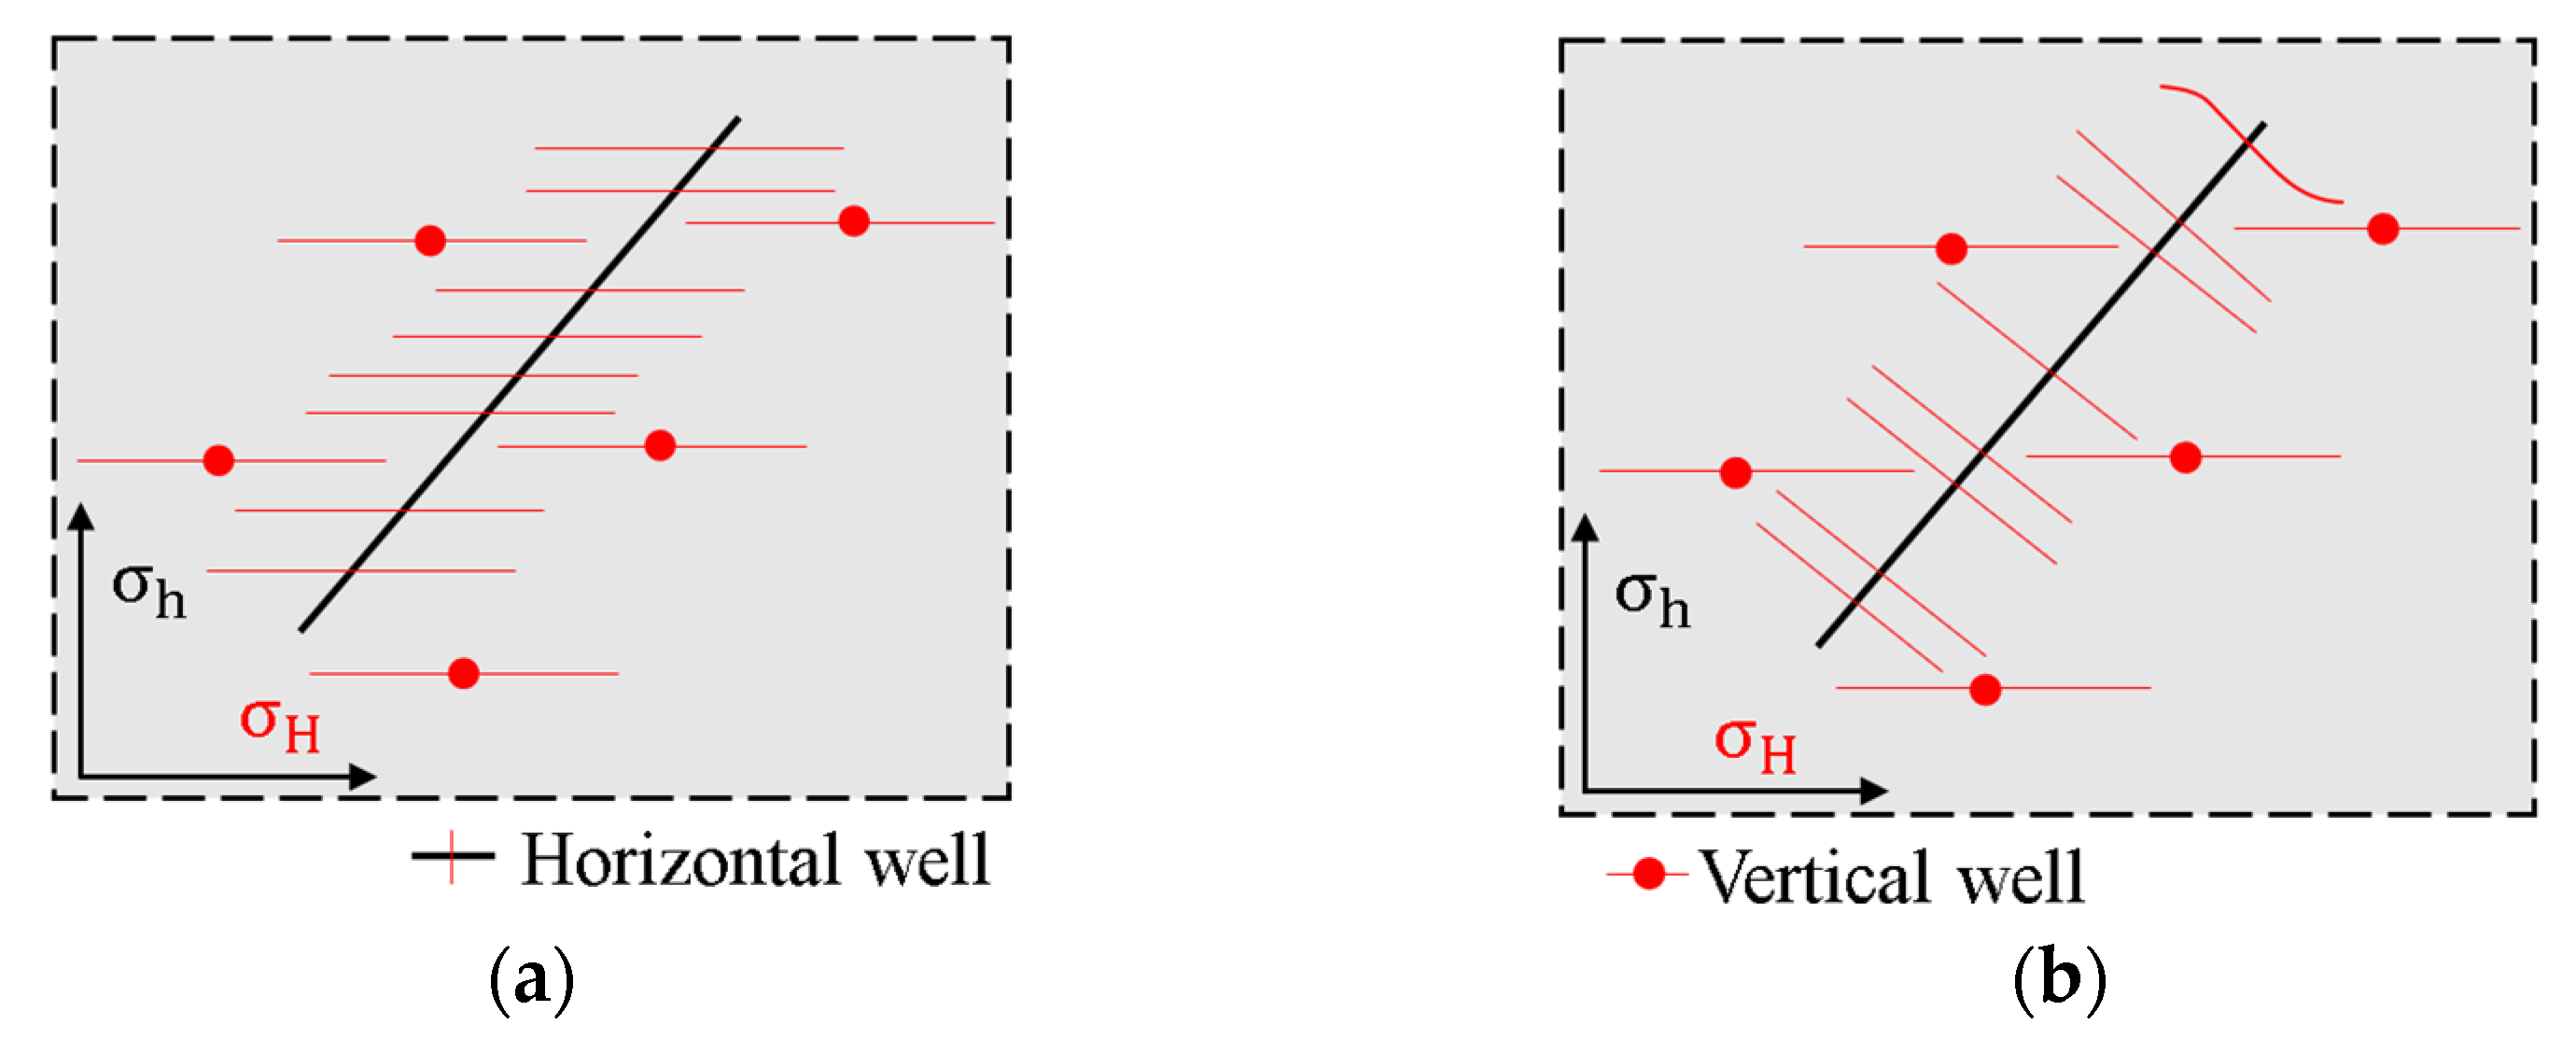
It is widely accepted that the direction of maximum principal stress controls fracture orientation, and field fracturing designs are commonly based on this view [40,41,42,43]. Accordingly, traditional CVHWP fracturing is typically planned as illustrated in Figure 11a. Fractures in the horizontal and vertical wells are assumed to exhibit consistent morphologies and to propagate parallel to σH, forming parallel bi-wing planar fractures. Consequently, well placement is considered during the design stage: at locations corresponding to the vertical-well intervals, stimulation in the horizontal stages is either omitted or the stage spacing is increased. Coordinated stimulation between vertical wells and horizontal wells is then used to expand the SRV and improve recovery efficiency.
However, it was observed in experiments that when the horizontal well is oriented at a nonzero angle to the σh, the fracture propagation behavior in the horizontal well changes. When the horizontal well is stimulated first, fractures in adjacent horizontal stages tend to propagate toward the vertical wellbore owing to stress-shadow effects, as shown in Figure 5a. Therefore, the original design should be revised. The fracture direction in the vertical section should be kept unchanged, while fractures in the horizontal section should be designed to extend toward the vertical wellbore, as shown in Figure 11b.
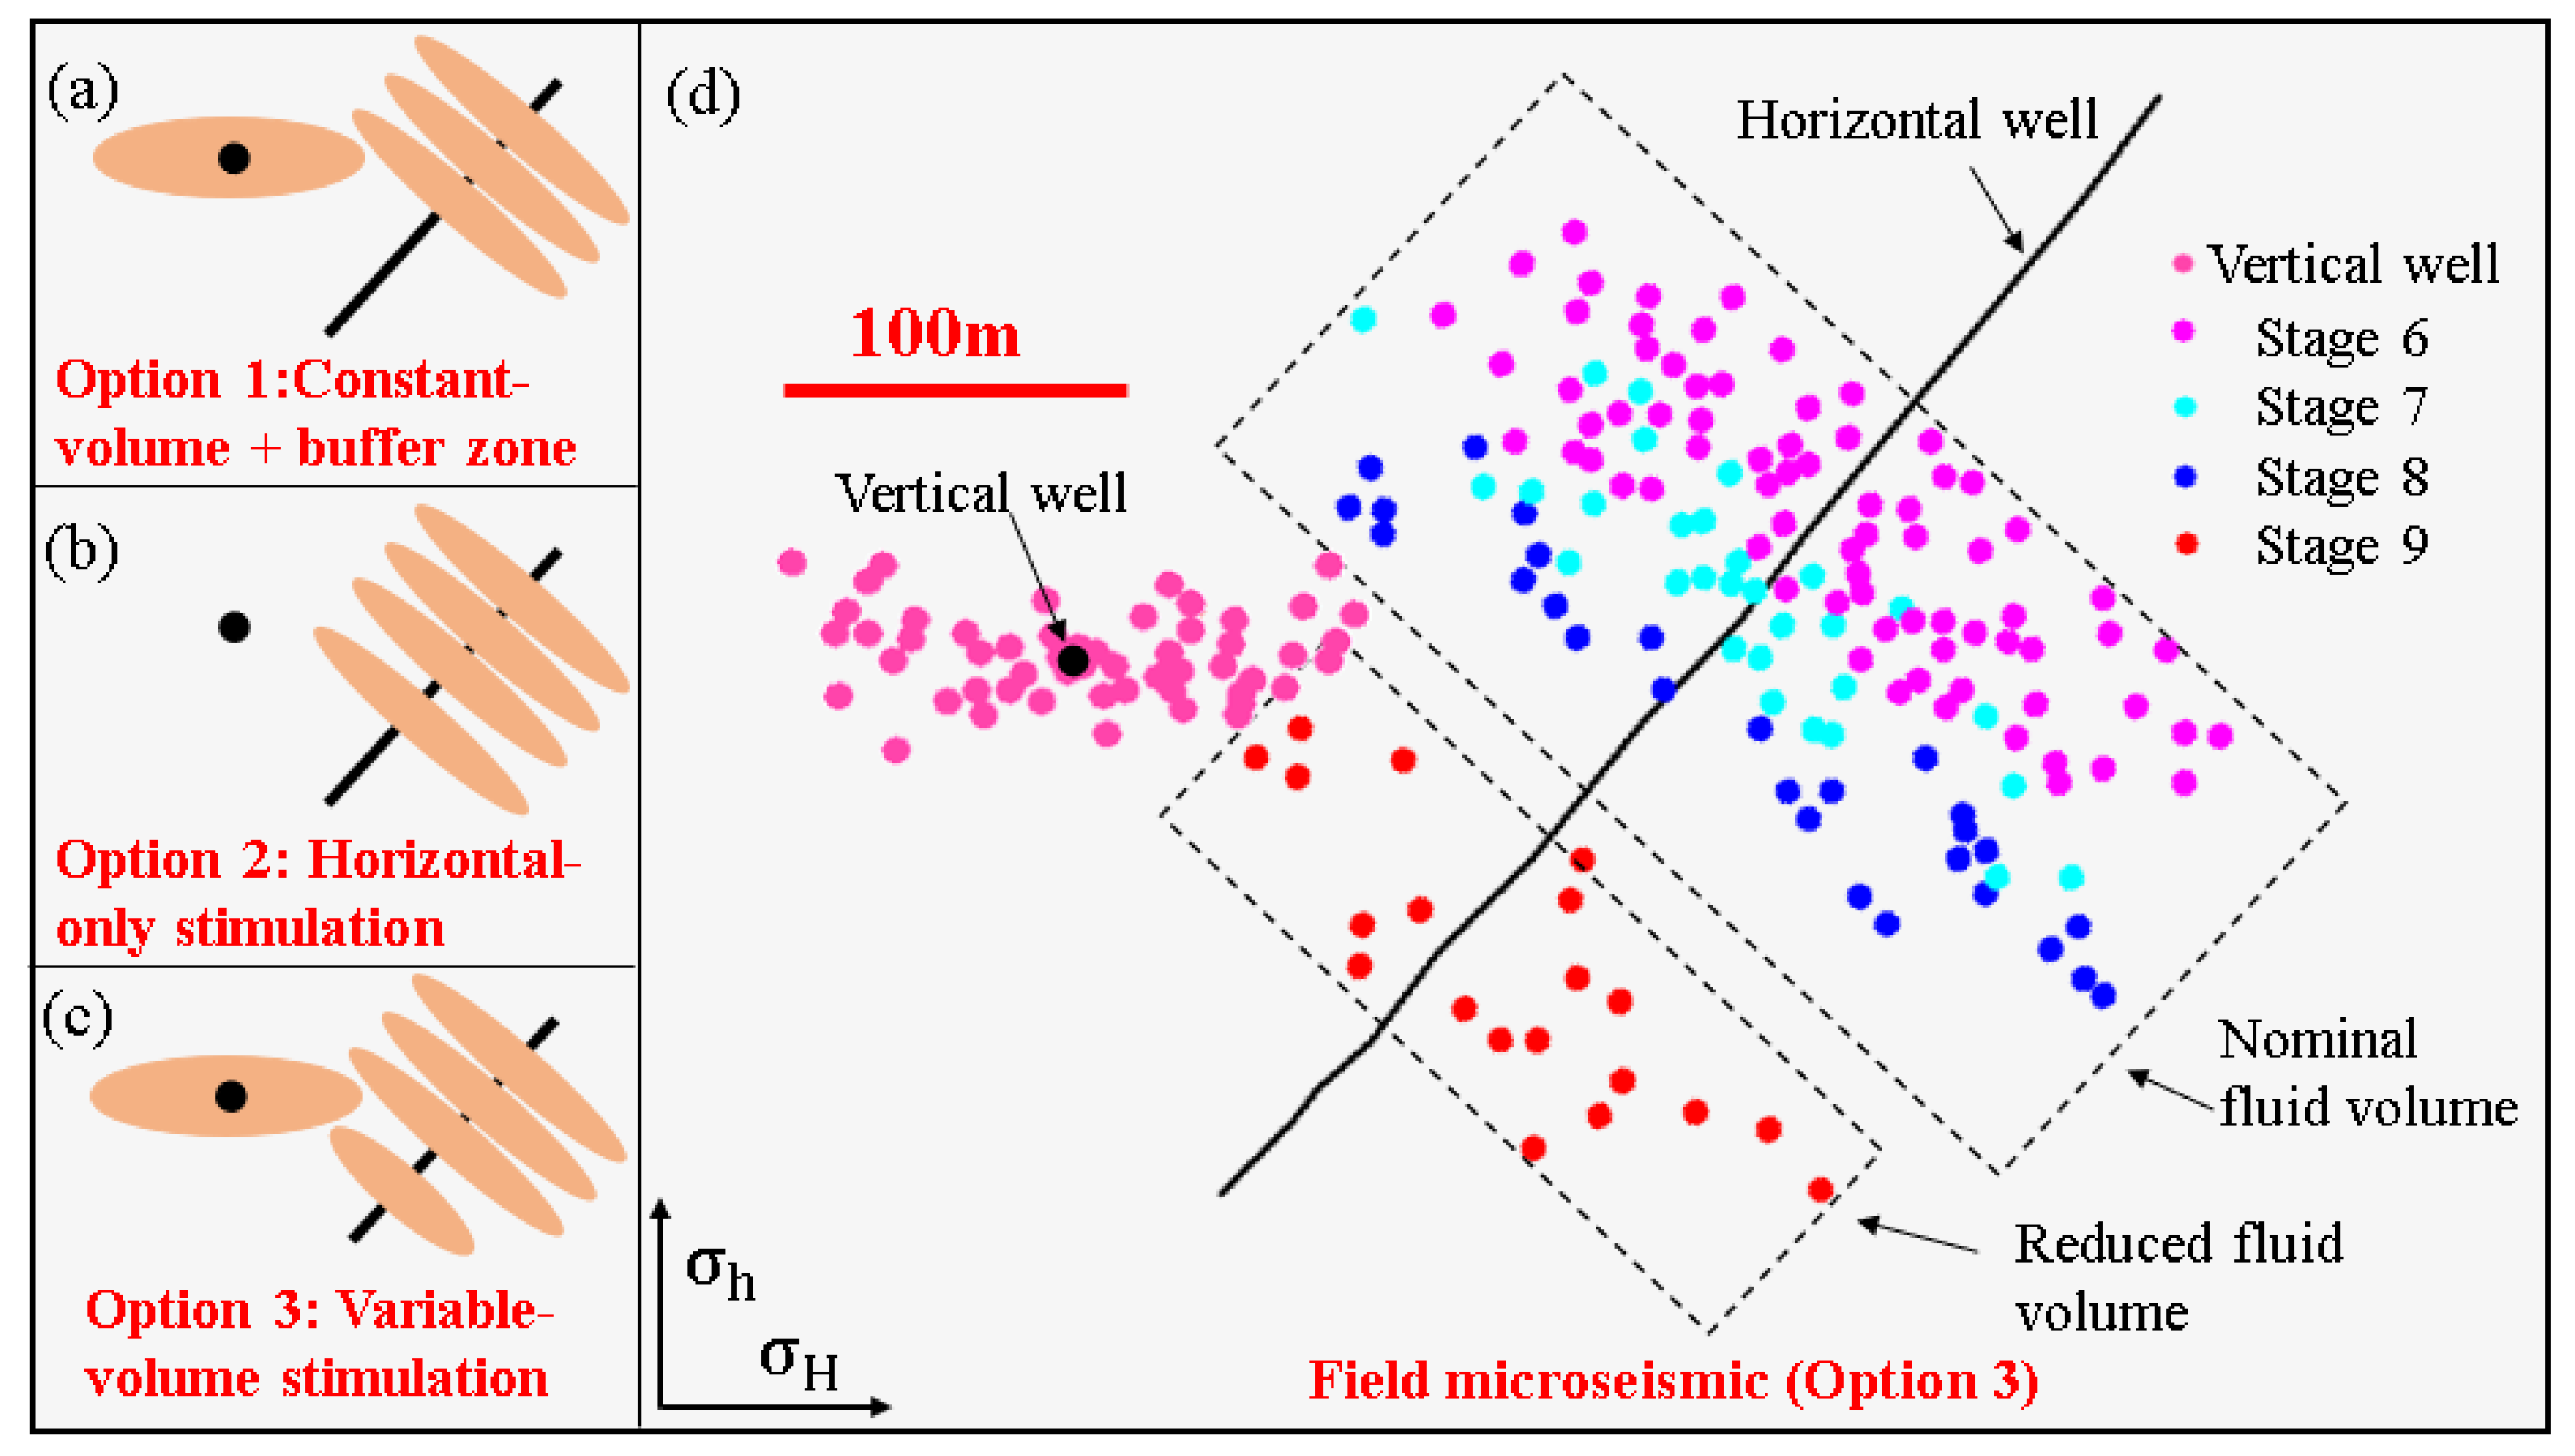
Assuming similar reservoir properties, three CVHWP stimulation options are considered. In Option 1, both vertical and horizontal wells are stimulated using a constant fluid volume for each horizontal-well stage; however, to avoid inter-well fracture communication, an undeveloped buffer zone is retained near the vertical well, as shown in Figure 12a. In Option 2, only the horizontal wells are stimulated, whereas the vertical wells remain unstimulated, as shown in Figure 12b. In Option 3, both the vertical and horizontal wells are stimulated with stage-dependent fluid volumes: a nominal fluid volume is applied where fracture communication between the two wells is unlikely, whereas a reduced fluid volume is used where communication is more likely, as shown in Figure 12c. Among these options, Option 3 was selected because it balances two competing objectives: maintaining sufficient stimulated reservoir volume in regions away from the vertical well and reducing the risk of unwanted fracture communication near the vertical well. In this design, the control of inter-well fracture communication is mainly achieved by the stage-dependent fluid-volume strategy, whereas the horizontal-well-first sequence is used to modify the local stress field before vertical-well stimulation and to create stress conditions favorable for fracture branching.
On the basis of this study, Option 3 was adopted in the field, and the stimulation sequence was arranged as “horizontal well first, vertical well later”. For the horizontal well, the microseismic dataset covered stages 6–9, as shown in Figure 12d. When these observations were interpreted together with the induced-stress model, fractures in stages 6–9 were inferred to be controlled by both the induced stresses and the initial horizontal stress field, resulting in nearly symmetric bi-wing fractures propagating approximately perpendicular to the horizontal wellbore. Because Stage 9 was adjacent to the vertical well and was treated with a reduced fluid volume, the resulting fracture length was markedly shorter than that of the other stages, indicating that the reduced-volume design helped control excessive fracture extension near the vertical well. For the vertical well, the microseismic interpretation showed fractures propagating generally parallel to σH, and branched fractures were observed under the modified stress field generated by the preceding horizontal-well stages. Overall, the field-observed fracture morphologies were consistent with the laboratory observations and the induced-stress model predictions, supporting the revised CVHWP stimulation design.
For field application, the fracturing sequence should be selected using a stress-interference-based decision protocol rather than by directly adopting a fixed sequence. First, engineers should establish a field-scale geomechanical model using in situ stresses, vertical–horizontal well spacing, wellbore azimuth, perforation orientation, expected fracture length, net pressure, and reservoir heterogeneity. Second, the induced horizontal stress difference at the planned initiation regions of subsequent stages should be recalculated under different candidate fracturing sequences. Third, the sequence should be evaluated according to whether it can reduce the local horizontal stress difference to a level favorable for fracture branching while keeping fracture extension within an acceptable communication-risk range. In the laboratory-scale C5-type configuration investigated in this study, when the horizontal stress difference around the vertical-well initiation region was reduced to approximately 0.65 MPa, branched fractures were observed in the vertical-well section. Therefore, for reservoirs with similar stress conditions, well-pattern geometry, and mechanical properties, a local horizontal stress difference of approximately 0.65 MPa may be used as a preliminary case-specific criterion for selecting the horizontal-well-first sequence to promote fracture branching and SRV enlargement. However, this value should not be regarded as a universal field-scale threshold. When the in situ stress anisotropy, well spacing, wellbore azimuth, perforation orientation, fracture length, net pressure, or reservoir heterogeneity differ from the present case, the induced stress field should be recalculated and the threshold should be re-evaluated.

4.2. Representative Field Cases of Irregular Well Patterns

After decades of waterflooding in vertical-well patterns, several fields (e.g., Changqing, Daqing, and Shengli) have faced persistent challenges, including increasing difficulty in reserve development, production decline, and low recovery. In a CVHWP, dispersed reservoir units are connected by horizontal wellbores while existing vertical-well and surface infrastructure is retained; consequently, capital expenditures can be reduced and the SRV can be expanded. In those fields, improved production performance and extended field life have been observed following implementation of this integrated strategy.
Understanding of fracture initiation, propagation, and interactions under complex well-patterns can be improved by studying fracture mechanisms in CVHWP stimulation. In addition, a stronger theoretical framework for stimulation of unconventional reservoirs and a basis for more accurate fracture-prediction models can be established through such studies. By elucidating the fracture propagation behavior in CVHWP, guidance can be provided for the optimizing well-pattern and designing stimulation parameters, thereby improving stimulation effectiveness and reducing development costs.
By investigating CVHWP, well-pattern optimization can be extended to more complex geological settings, and more well-pattern design options can be identified. Consequently, horizontal-well layouts do not need to be limited to irregular well patterns, and greater design flexibility can be achieved under a broader range of geological conditions. On this basis, the optimization of existing stimulation practices is facilitated, and subsequent research on irregular well-pattern configurations is advanced.
The representative field cases discussed below are therefore used to demonstrate the engineering applicability of CVHWP stimulation under constrained reservoir and well-pattern conditions. They support the practical implication of this study that fracture interference should be considered in combined well-pattern stimulation, and that fracturing sequence and stimulation parameters should be optimized based on stress-interference evaluation rather than by directly adopting a fixed design.
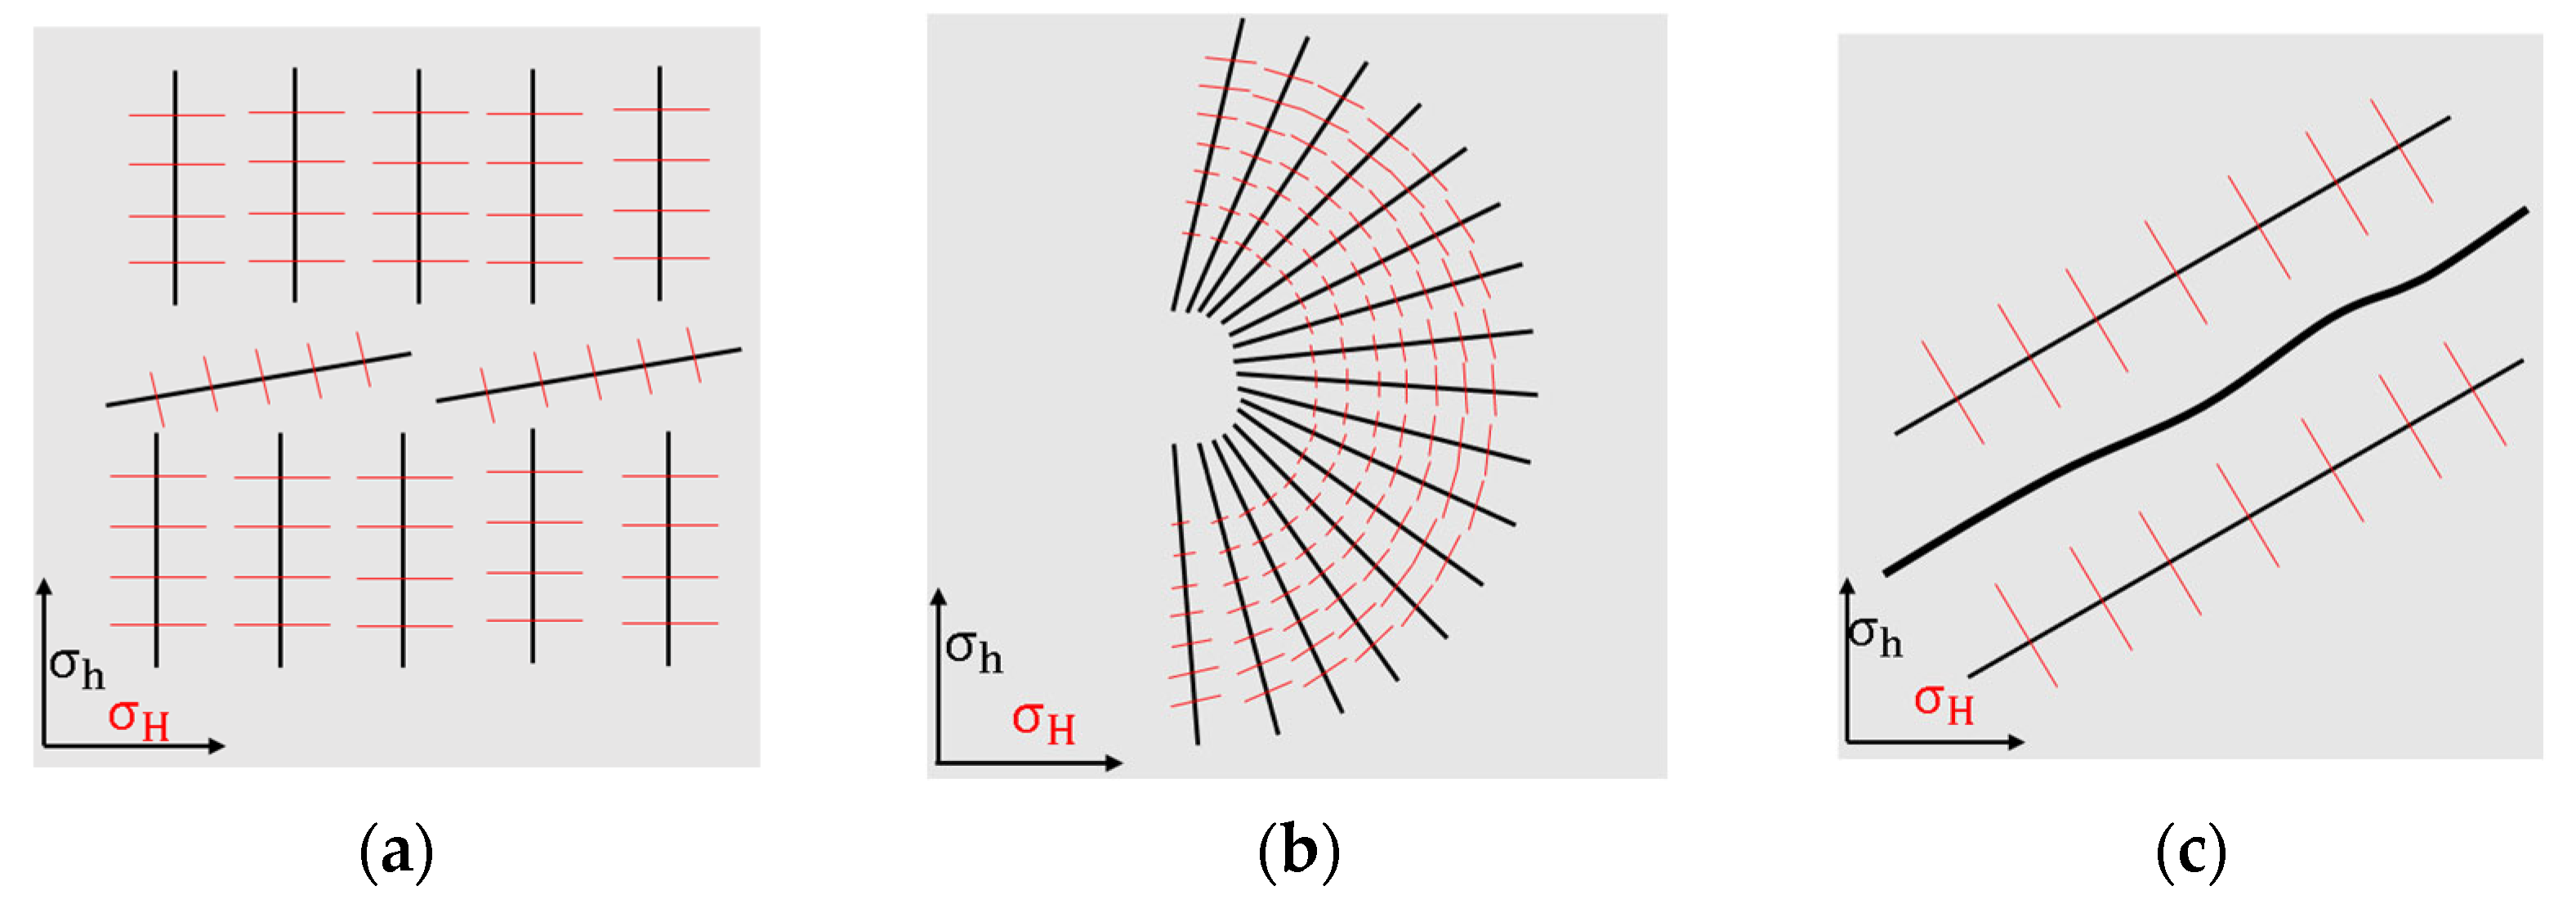
Irregular well patterns concepts have been applied in several oil fields and have proved successful. Chang-7 tight reservoir [4] has been developed through horizontal wells. Between the horizontal well groups exists a large non-stimulated area, due to inclined sections when drilling the horizontal wells. Therefore, the large non-stimulated area should be stimulated with infilled horizontal wells, as shown in Figure 13a, to produce additional shale oil in the Chang-7 reservoir.
Researchers in Changqing Oilfield [5] proposed a new type of fan-shaped well pattern, as shown in Figure 13b, to avoid forest reserves. In total, 20 horizontal well volume fracturing experiments were conducted, and nine wells were put into operation. The initial single well production reached 14.2 t/d, demonstrating good production potential, and it is expected to increase shale oil storage by 150–200 million tons. As shown in Figure 13c, there is a fault with a certain angle to σh in a certain block of the oil reservoir in the southwest. Horizontal wells can be deployed along the direction of the fault to improve production efficiency.
These three cases cannot be handled effectively using regular well patterns; instead, irregular well patterns are required. In field practice, regular well patterns can be adapted and expended as required to improve development economics for unconventional reservoirs. Refinements to existing well-layout approaches are proposed, with broad applicability.
The comparison with recent fully coupled three-dimensional numerical studies [31,32,33,34,35] also clarifies the applicability and limitations of the present model. Modern numerical approaches can explicitly simulate nonlinear fracture propagation, fluid–solid coupling, natural-fracture interaction, bedding-plane effects, and reservoir heterogeneity. By contrast, the model proposed in this study is based on linear-elastic induced-stress superposition and therefore provides a first-order evaluation of stress-shadow interference rather than a complete three-dimensional fracture-propagation simulation. Its advantage lies in its clear physical meaning and low computational cost, which make it suitable for preliminary sequence screening and engineering decision-making in CVHWP fracturing. Therefore, the horizontal-first sequence recommended in this study should be interpreted as a mechanism-based strategy for the studied CVHWP conditions, supported by the present experiments, analytical stress calculations, and field observations, rather than as a universally applicable rule. Its direct application to reservoirs beyond these conditions should be preceded by field-specific calibration.
It should be noted that the present model and experiments mainly focus on stress interference in a simplified CVHWP configuration. Reservoir heterogeneity, natural fractures, bedding planes, fracture-height growth, fluid leak-off, and proppant transport were not explicitly considered, although these factors may affect fracture initiation, propagation direction, local branching, and inter-well communication in field-scale fracturing. Therefore, field-specific geological and engineering parameters should be considered when applying the proposed strategy to heterogeneous or naturally fractured reservoirs. These factors will be incorporated in future work to further evaluate the applicability of the optimized fracturing sequence in complex reservoirs.

5. Conclusions

An induced-stress model is developed for multiple wells and fractures with arbitrary orientations. Based on the CVHWP well layout, laboratory experiments were performed to simulate fracture initiation and propagation. The main conclusions are as follows:
(1)
An induced-stress model for multiple wells and fractures with arbitrary orientations was formulated based on stress superposition. Breakdown-pressure data from three-stage fracturing experiments were incorporated into a stress-intensity-factor formulation that includes stress-shadow effects. The calculated Mode I stress intensity factors at breakdown were 1.81, 2.10, and 2.07 MPa·m1/2 for the three stages, respectively, with an average value of 1.99 MPa·m1/2 and a coefficient of variation of 8.00%. The consistency of these values indicates that the proposed model can reasonably describe the induced stress state during multistage fracturing in the CVHWP configuration.
(2)
Model calculations show that the fracturing sequence significantly affects the local horizontal principal-stress difference. When the vertical well is fractured first, the horizontal principal-stress difference in the adjacent horizontal stage increases by 2.01 MPa, indicating enhanced local stress anisotropy. In contrast, when the horizontal well is fractured first, the horizontal principal-stress difference decreases by 3.25 MPa in the subsequent horizontal stage and by 3.89 MPa in the vertical-well stage. This indicates that the horizontal-well-first sequence creates a more favorable stress-interference condition through stress-shadow effects.
(3)
The laboratory experiments confirm the sequence-dependent fracture morphology predicted by the induced-stress analysis. Under the horizontal-well-first and vertical-well-second sequence, fractures in the horizontal well tend to form nearly symmetric bi-wing planar fractures perpendicular to the wellbore, whereas local branching is observed in the vertical-well fracture. The agreement between the observed fracture geometries and the calculated stress-field evolution indicates that stress interference can be used to regulate fracture propagation in CVHWP systems.
(4)
Field implementation further supports the applicability of the optimized sequence under the C5-type CVHWP configuration investigated in this study. After applying the horizontal-well-first and vertical-well-second strategy, the cumulative incremental oil production in the block reached 32,000 tons. These field results are consistent with the laboratory observations and the induced-stress model prediction. However, the horizontal-well-first sequence should be regarded as a mechanism-level indication rather than a universal field-scale design criterion. For other reservoirs or well-pattern configurations, the optimal fracturing sequence should be recalculated and re-optimized using field-specific stress conditions, well spacing, wellbore azimuth, perforation orientation, fracture length, net pressure, and reservoir heterogeneity.
The present study does not explicitly consider reservoir heterogeneity, natural fractures, bedding planes, fracture-height growth, fluid leak-off, or proppant transport. These factors may influence fracture propagation and inter-well communication and will be incorporated in future work to further evaluate the applicability of the optimized fracturing sequence in complex reservoirs. In addition, although the present study focuses on model development, laboratory validation, and field consistency for different fracturing sequences, a systematic sensitivity analysis of key geological and engineering parameters remains necessary. Future work will quantify the effects of net pressure, fracture length, inter-stage spacing, well spacing, wellbore azimuth, perforation orientation, and reservoir heterogeneity on stress-shadow interference and fracture propagation in CVHWP systems.

Author Contributions

Conceptualization, S.L. and G.Z.; methodology, S.L.; software, S.L.; validation, S.L., G.Z. and H.C.; formal analysis, S.L.; investigation, S.L.; resources, G.Z.; data curation, S.L.; writing—original draft preparation, S.L.; writing—review and editing, G.Z.; visualization, S.L.; supervision, G.Z.; project administration, G.Z.; funding acquisition, G.Z. All authors have read and agreed to the published version of the manuscript.

Funding

This work was financially supported by the National Natural Science Foundation of China (52434001 and 52104050).

Data Availability Statement

The original contributions presented in this study are included in the article. Further inquiries can be directed to the corresponding author.

Conflicts of Interest

The authors declare no conflicts of interest.

Abbreviations

The following abbreviations are used in this manuscript:
CVHWPCombined Vertical–Horizontal Well Pattern
DDMDisplacement Discontinuity Method
XFEMExtended Finite Element Method
UCSUniaxial Compressive Strength
LEFMLinear Elastic Fracture Mechanics

References

  1. King, G.E. 60 years of multi-fractured vertical, deviated and horizontal wells: What have we learned? In Proceedings of the SPE Annual Technical Conference and Exhibition, Amsterdam, The Netherlands, 27–29 October 2014. [Google Scholar]
  2. Zhao, J.; Chen, X.; Li, Y.; Fu, B. Simulation of simultaneous propagation of multiple hydraulic fractures in horizontal wells. J. Pet. Sci. Eng. 2016, 147, 788–800. [Google Scholar] [CrossRef] [Scilit]
  3. Liu, X.; Tan, Y.; Singh, A.; Waddle, R.; Hilarides, K.; Forand, D.; Liang, B.; Khan, S.; Rijken, M. Learnings on fracture and geomechanical modeling from the hydraulic fracturing test site in the Midland Basin, West Texas. In Proceedings of the Asia Pacific Unconventional Resources Technology Conference, Virtual, 16–18 November 2021; pp. 416–442. [Google Scholar]
  4. Wang, X.; Zhang, F.; Tang, M.; Du, X.; Tang, J. Effect of Stress Shadow Caused by Multistage Fracturing from Multiple Well Pads on Fracture Initiation and Near-Wellbore Propagation from Infill Wells. SPE J. 2022, 27, 204–225. [Google Scholar]
  5. Liu, Y.-H.; Zhang, J.-T.; Bai, J.; Zhang, F.-S.; Tang, J.-Z. Numerical study of hydraulic fracturing in the sectorial well-factory considering well interference and stress shadowing. Pet. Sci. 2023, 20, 3567–3581. [Google Scholar] [CrossRef] [Scilit]
  6. Li, J.; Wei, J.; Chen, Y.; Wang, A.; Zhou, X. Analysis of asynchronous/inter-fracture injection-production mechanism under the condition of five-spot vertical and horizontal well combination in low permeability oil reservoirs. Energy 2024, 308, 132923. [Google Scholar] [CrossRef] [Scilit]
  7. Luan, H.; Liu, M.; Yan, P.; Jiang, Y.; Du, X.; Ma, X.; Shi, Y. Two-dimensional experimental study on stepwise depressurization production characteristics of natural gas hydrate with combined horizontal well and vertical well. Geoenergy Sci. Eng. 2024, 239, 212970. [Google Scholar] [CrossRef] [Scilit]
  8. Crosby, D.; Rahman, M.M.; Rahman, M.; Rahman, S. Single and multiple transverse fracture initiation from horizontal wells. J. Pet. Sci. Eng. 2002, 35, 191–204. [Google Scholar] [CrossRef] [Scilit]
  9. Zhao, K.; Stead, D.; Kang, H.; Gao, F.; Donati, D. Three-dimensional numerical investigation of the interaction between multiple hydraulic fractures in horizontal wells. Eng. Fract. Mech. 2021, 246, 107620. [Google Scholar] [CrossRef] [Scilit]
  10. Yu, W.; Sepehrnoori, K. Optimization of multiple hydraulically fractured horizontal wells in unconventional gas reservoirs. J. Pet. Eng. 2013, 2013, 151898. [Google Scholar] [CrossRef] [Scilit]
  11. Sneddon, I.N. The distribution of stress in the neighbourhood of a crack in an elastic solid. Proc. R. Soc. Lond. Ser. A Math. Phys. Sci. 1946, 187, 229–260. [Google Scholar] [CrossRef] [Scilit]
  12. Sneddon, I.; Elliot, H. The opening of a Griffith crack under internal pressure. Q. Appl. Math. 1946, 4, 262–267. [Google Scholar] [CrossRef] [Scilit]
  13. Olson, J.E. Predicting fracture swarms–the influence of subcritical crack growth and the crack-tip process zone on joint spacing in rock. Geol. Soc. Lond. Spéc. Publ. 2004, 231, 73–88. [Google Scholar] [CrossRef] [Scilit]
  14. Meyer, B.R.; Bazan, L.W.; Brown, E.K.; Brinzer, B.C. Key parameters affecting successful hydraulic fracture design and optimized production in unconventional wells. In Proceedings of the SPE Eastern Regional Meeting; SPE: Houston, TX, USA, 2013. [Google Scholar]
  15. Manchanda, R.; Sharma, M.M.; Holzhauser, S. Time-dependent fracture-interference effects in pad wells. SPE Prod. Oper. 2014, 29, 274–287. [Google Scholar] [CrossRef] [Scilit]
  16. Weng, X.; Kresse, O.; Cohen, C.; Wu, R.; Gu, H. Modeling of hydraulic-fracture-network propagation in a naturally fractured formation. SPE Prod. Oper. 2011, 26, 368–380. [Google Scholar] [CrossRef] [Scilit]
  17. Olson, J.E.; Dahi-Taleghani, A. Modeling simultaneous growth of multiple hydraulic fractures and their interaction with natural fractures. In Proceedings of the SPE Hydraulic Fracturing Technology Conference and Exhibition; SPE: Houston, TX, USA, 2009. [Google Scholar]
  18. Zhao, J.; Peng, Y.; Li, Y.; Tian, Z. Applicable conditions and analytical corrections of plane strain assumption in the simulation of hydraulic fracturing. Pet. Explor. Dev. 2017, 44, 454–461. [Google Scholar] [CrossRef] [Scilit]
  19. Tang, H.; Wang, S.; Zhang, R.; Li, S.; Zhang, L.; Wu, Y.-S. Analysis of stress interference among multiple hydraulic fractures using a fully three-dimensional displacement discontinuity method. J. Pet. Sci. Eng. Fract. Mech. 2019, 179, 378–393. [Google Scholar] [CrossRef] [Scilit]
  20. Dontsov, E.; Suarez-Rivera, R. Propagation of multiple hydraulic fractures in different regimes. Int. J. Rock Mech. Min. Sci. 2020, 128, 104270. [Google Scholar] [CrossRef] [Scilit]
  21. El Rabaa, W. Experimental study of hydraulic fracture geometry initiated from horizontal wells. In Proceedings of the SPE Annual Technical Conference and Exhibition, San Antonio, TX, USA, 8–11 October 1989. [Google Scholar]
  22. Warpinski, N.R.; Branagan, P.T. Altered-stress fracturing. J. Pet. Technol. 1989, 41, 990–997. [Google Scholar] [CrossRef] [Scilit]
  23. Crosby, D.; Yang, Z.; Rahman, S. Methodology to predict the initiation of multiple transverse fractures from horizontal wellbores. J. Can. Pet. Technol. 2001, 40, PETSOC-01-10-04. [Google Scholar] [CrossRef] [Scilit]
  24. Daneshy, A.; Au-Yeung, J.; Thompson, T.; Tymko, D. Fracture Shadowing: A Direct Method for Determination of the Reach and Propagation Pattern of Hydraulic Fractures in Horizontal Wells. In Proceedings of the SPE Hydraulic Fracturing Technology Conference, The Woodlands, TX, USA, 6–8 February 2012. [Google Scholar]
  25. Wu, K.; Olson, J.E. A simplified three-dimensional displacement discontinuity method for multiple fracture simulations. Int. J. Fract. 2015, 193, 191–204. [Google Scholar] [CrossRef] [Scilit]
  26. Chang, Z.; Hou, B. Numerical simulation on cracked shale oil reservoirs multi-cluster fracturing under inter-well and inter-cluster stress interferences. Rock Mech. Rock Eng. 2023, 56, 1909–1925. [Google Scholar]
  27. Bi, Z.; Wang, L.; Yang, H.; Guo, Y.; Chang, X.; Zhou, J. Experimental study on the initiation and propagation of multi-cluster hydraulic fractures within one stage in horizontal wells. Energies 2021, 14, 5357. [Google Scholar] [CrossRef] [Scilit]
  28. Wang, W.; Zhang, G.; Zhao, C.; Shen, L.; Chen, H.; Zhang, T. Stress Interference Between Fractures of Alternating Fracturing of Horizontal Wells. In Proceedings of the 56th US Rock Mechanics/Geomechanics Symposium, Santa Fe, NM, USA, 26–29 June 2022. [Google Scholar]
  29. Liao, S.; Hu, J.; Zhang, Y. Investigation on the influence of multiple fracture interference on hydraulic fracture propagation in tight reservoirs. J. Pet. Sci. Eng. Fract. Mech. 2022, 211, 110160. [Google Scholar] [CrossRef] [Scilit]
  30. Li, S.; Zhang, G.; Zhang, L.; Wang, W.; Zhao, C. Effect of Alternate Fracturing on Rock Porosity and Permeability Near Hydraulic Fractures. In Proceedings of the 57th U.S. Rock Mechanics/Geomechanics Symposium, Atlanta, GA, USA, 25–28 June 2023. [Google Scholar]
  31. Ju, Y.; Li, Y.; Yang, Y.; Wang, Y. Reorientation of hydraulic fractures and stress-shadow effect in double-well fracturing of hydrocarbon reservoirs: 3D numerical model and analysis. Int. J. Min. Sci. Technol. 2025, 35, 499–517. [Google Scholar] [CrossRef] [Scilit]
  32. Yang, L.; Wang, X.; Niu, T. Propagation characteristics of multi-cluster hydraulic fracturing in shale reservoirs with natural fractures. Appl. Sci. 2025, 15, 4418. [Google Scholar] [CrossRef] [Scilit]
  33. Shan, Q.; Mu, L.; Yuan, L.; Ji, Z.; Cheng, X.; Luan, H.; Jiang, Y.; Xun, W. Investigating multi-cluster hydraulic fracture propagation in tight reservoir considering actual perforation geometry. Geomech. Geophys. Geo-Energy Geo-Resour. 2025, 11, 69. [Google Scholar] [CrossRef] [Scilit]
  34. Bai, X.; Li, Z.; Lai, F.; Liu, C. Impact of Inter-Well Stress Interference on Multifracture Propagation in Tight Reservoirs. Energy Sci. Eng. 2026, 14, 347–363. [Google Scholar] [CrossRef] [Scilit]
  35. Liu, Y.; Gong, X.; Ma, X. Investigation of the propagation behavior of hydraulic fractures and its influencing mechanisms in fractured reservoirs based on a hydromechanical coupling numerical model. Sci. Rep. 2026, 16, 11984. [Google Scholar] [CrossRef] [Scilit] [PubMed]
  36. Soliman, M.; Hunt, J.L.; El Rabaa, A. Fracturing aspects of horizontal wells. J. Pet. Technol. 1990, 42, 966–973. [Google Scholar] [CrossRef] [Scilit]
  37. Garavand, A.; Podgornov, V.M. Hydraulic fracture optimization by using a modified Pseudo-3D model in multi-layered reservoirs. J. Nat. Gas Geosci. 2018, 3, 233–242. [Google Scholar] [CrossRef] [Scilit]
  38. Gai, S.; Nie, Z.; Yi, X.; Zou, Y.; Zhang, Z. Study on the interference law of staged fracturing crack propagation in horizontal wells of tight reservoirs. ACS Omega 2020, 5, 10327–10338. [Google Scholar] [CrossRef] [Scilit] [PubMed]
  39. Hou, B.; Zhang, R.; Zeng, Y.; Fu, W.; Muhadasi, Y.; Chen, M. Analysis of hydraulic fracture initiation and propagation in deep shale formation with high horizontal stress difference. J. Pet. Sci. Eng. Fract. Mech. 2018, 170, 231–243. [Google Scholar] [CrossRef] [Scilit]
  40. Wu, K.; Olson, J.E. Simultaneous multifracture treatments: Fully coupled fluid flow and fracture mechanics for horizontal wells. SPE J. 2015, 20, 337–346. [Google Scholar]
  41. Wu, K.; Olson, J.E. Mechanisms of simultaneous hydraulic-fracture propagation from multiple perforation clusters in horizontal wells. SPE J. 2016, 21, 1000–1008. [Google Scholar] [CrossRef] [Scilit]
  42. Chen, Z.; Liao, X.; Zhao, X.; Lv, S.; Zhu, L. A semianalytical approach for obtaining type curves of multiple-fractured horizontal wells with secondary-fracture networks. SPE J. 2016, 21, 538–549. [Google Scholar] [CrossRef] [Scilit]
  43. Chen, Z.; Liao, X.; Zhao, X.; Dou, X.; Zhu, L.; Sanbo, L. A finite-conductivity horizontal-well model for pressure-transient analysis in multiple-fractured horizontal wells. SPE J. 2017, 22, 1112–1122. [Google Scholar] [CrossRef] [Scilit]
Figure 1. Stress distribution coordinates in combined well pattern with f fractures and w wells.
Processes 14 02010 g001
Figure 2. Schematic of the CVHWP specimen and field-inspired well-pattern configuration. HW1 and HW2 denote the two horizontal-well stages, and VW denotes the vertical-well section.
Processes 14 02010 g002
Figure 3. (a) Single-stage fracturing physical model specimen. (b) Multi-stage fracturing physical model specimen.
Processes 14 02010 g003
Figure 4. Fracturing flow diagram of CVHWP. 1—Cement specimen; 2—True triaxial hydraulic fracturing equipment; 3—Pressure monitoring gauge; 4—Control valve; 5—Oil–water separator; 6—Fracturing pump; 7—Data acquisition system. The red labels #1–#3 indicate the three initial fractures.
Processes 14 02010 g004
Figure 5. (a) Cross-sectional view of Specimen A, (b) cross-sectional view of Specimen B, (c) cross-sectional view of Specimen C, (d) fracture geometry of Specimen A, (e) fracture geometry of Specimen B, (f) fracture geometry of Specimen C. The green dashed line indicates the horizontal well direction, and numbers 1–3 denote the three initial fractures.
Processes 14 02010 g005
Figure 6. (a) Stress distribution of hydraulic fracture 1 in Specimen A; (b) stress distribution of hydraulic fracture 2 in Specimen A; (c) stress distribution of hydraulic fracture 3 in Specimen A.
Processes 14 02010 g006
Figure 7. Pressure curve and stress intensity factor of Specimen A. The orange shaded area bounded by the dashed lines represents the average (KI) value ± standard deviation, and the orange squares indicate the calculated (KI) values for the three fracturing stages.
Processes 14 02010 g007
Figure 8. (a) Induced stress σ x of Stage 1 in Specimen A; (b) induced stress σ y of Stage 1 in Specimen A; (c) induced stress σ of Stage 1 in Specimen A; (d) induced stress σ x of Stage 2 in Specimen A; (e) induced stress σ y of Stage 2 in Specimen A; (f) induced stress σ of the Stage 2 in Specimen A.
Processes 14 02010 g008
Figure 9. (a) Induced stress σ x of Stage 3 in Specimen B; (b) induced stress σ y of Stage 3 in Specimen B; (c) induced stress σ of Stage 3 in Specimen B; (d) induced stress σ x of Stage 1 in Specimen B; (e) induced stress σ y of Stage 1 in Specimen B; (f) induced stress σ of Stage 1 in Specimen B.
Processes 14 02010 g009
Figure 10. (a) Induced stress σ x of Stage 1 in Specimen C; (b) induced stress σ y of Stage 1 in Specimen C; (c) induced stress σ of Stage 1 in Specimen C; (d) induced stress σ x of Stage 3 in Specimen C; (e) induced stress σ y of Stage 3 in Specimen C; (f) induced stress σ of Stage 3 in Specimen C.
Processes 14 02010 g010
Figure 11. (a) Fracture geometry in conventional fracturing design for CVHWP; (b) fracture geometry in optimized fracturing design for CVHWP.
Processes 14 02010 g011
Figure 12. (a) Horizontal well fracturing liquid volume remains constant; (b) horizontal well fracturing with vertical well unstimulated; (c) variable-rate fracturing; (d) field microseismic (Option 3).
Processes 14 02010 g012
Figure 13. Irregular well-pattern applications: (a) infilled horizontal wells in a non-stimulated area; (b) fan-shaped well pattern; (c) horizontal wells along a fault. In (a,b), the thin black and red line segments both denote horizontal wells with different orientations; in (c), the thick black curve denotes the fault, and the thin black lines denote horizontal wells.
Processes 14 02010 g013
Table 1. Descriptive statistics of fracture morphology under different fracturing sequences.
SpecimenFracturing SequenceHorizontal-Well Fracture MorphologyVertical-Well Fracture Morphology
AHorizontal-well-firstNearly symmetric bi-wing planar fractures in HW1 and HW2Multiple fractures developed in VW
BVertical-well-firstNon-planar or deflected fractures in HW1 and HW2Main fracture propagated along σH
CZipper fracturingPlanar fracture in HW1 and deflected bi-wing fracture in HW2Main fracture propagated along σH
Table 2. Stress intensity factor calculation.
Fracturing Stage123
Initial Fracture Length/m0.030.030.03
Breakdown Pressure/MPa14.5619.1517.28
Fracture Length/m0.1050.260.17
Net Pressure/MPa8.436.33/
Stress Intensity Factor/MPa∙m1/21.812.102.07
Average Stress Intensity Factor/MPa∙m1/21.99
Disclaimer/Publisher’s Note: The statements, opinions and data contained in all publications are solely those of the individual author(s) and contributor(s) and not of MDPI and/or the editor(s). MDPI and/or the editor(s) disclaim responsibility for any injury to people or property resulting from any ideas, methods, instructions or products referred to in the content.