Article

Niobium Recovery from Eschynite-Type Niobium Ore via Flotation
1
Department of Chemical Engineering, Zhengzhou University, Zhengzhou 450001, China
2
Baogang Group Mining Research Institute, Baotou 014030, China
3
Inner Mongolia Key Laboratory of Mining and Metallurgical Solid Waste Resource and Green Comprehensive Utilization, Baotou 014030, China
*
Author to whom correspondence should be addressed.
Processes 2026, 14(12), 2000; https://doi.org/10.3390/pr14122000
Submission received: 7 April 2026 / Revised: 15 May 2026 / Accepted: 26 May 2026 / Published: 19 June 2026
(This article belongs to the Special Issue Mineral Processing Equipments and Cross-Disciplinary Approaches)

Abstract

As a rare metal element, niobium is widely used in steel, electronics, aerospace and many other fields. Eschynite is one of the most important niobium-bearing minerals in Bayan Obo niobium ores. Investigating the beneficiation process and associated reagents is of great significance for improving niobium resource utilization. In this study, mixed ore with eschynite as the main niobium-bearing mineral was used as the research object. Under the condition that the Nb2O5 grade of the feed ore was 0.37%, a niobium concentrate with an Nb2O5 grade of 5.250% was obtained through one rougher stage and four cleaner stages, followed by magnetic separation. The content of eschynite in the niobium concentrate increased from 0.76% in the run-of-mine ore to 26.32%, with an enrichment ratio of 34.63 times, and the proportion of eschynite in all niobium-bearing minerals rose from 50.67% to 86.10%. Experimental results show that the combined flotation–magnetic separation process can realize the efficient concentration of niobium minerals dominated by eschynite, providing a technical reference for the subsequent development and utilization of eschynite-type niobium ore resources.

1. Introduction

Niobium is a transition metal element with an abundance of 20 ppm in the Earth’s crust, an atomic number of 41, a melting point of 2468 °C, a boiling point of 4930 °C, and a density of 8.58 g/cm3. Niobium oxides exhibit a high dielectric constant and excellent stability, and niobium demonstrates superconducting properties at low temperatures. Owing to its outstanding characteristics, such as high melting point, corrosion resistance, and superconductivity, niobium has become an indispensable critical metal for emerging industries and national defense and military industries. Major economies worldwide are highly dependent on imports for niobium supply, and the European Union, the United States, and China have all listed niobium as a key raw material and critical mineral for strategic security.
The distribution of global niobium resources is relatively concentrated, mainly in the Americas. As of March 2023, niobium resources in Brazil and Canada accounted for 87.18% of the world’s total niobium resources. Among them, Brazil possesses approximately 80% of global niobium resources, with nearly 95% of its niobium deposits being pyrochlore-type deposits with an average Nb2O5 grade of 2.5%, followed by columbite [1,2,3,4,5]. Pyrochlore has a chemical composition of (Ca, Na)2(Nb, Ti)2O6F, and the theoretical Nb2O5 content of pure pyrochlore is 73.05% [6].
China is the world’s largest consumer of niobium, yet its niobium resources are extremely scarce and heavily reliant on the international market, with an external dependence of over 99% [7,8]. Such minerals have been classified as national strategic resources [9,10]. China’s niobium resources are mainly concentrated in Bayan Obo of Inner Mongolia, Hubei, Fujian, Xinjiang and other regions. The niobium reserves (Nb2O5) exceed 9 million tons [11], and there are no independent niobium mines, as niobium mostly occurs in multi-component-associated ores. The prospective niobium reserve in the Bayan Obo REE-Nb-Fe deposit is approximately 6.6 million tons, accounting for 63.4% of China’s total niobium reserves and 82.7% of its industrial niobium reserves [5]. However, despite the large niobium reserves in the Bayan Obo deposit, the niobium grade is low (Nb2O5 grade ranging from 0.068% to 0.14%), accompanied by a wide variety of niobium-bearing minerals, high dispersion, and fine dissemination size, all of which pose considerable challenges to niobium recovery via mineral processing. The Bayan Obo deposit is rich in niobium-bearing minerals, comprising over 30 species, including eschynite, ilmenorutite, daomanite, manganocolumbite, baotite, pyrochlore, euxenite, fergusonite, and columbite [12,13,14,15,16,17]. Most of the grain sizes are less than 20 μm, with some smaller than 3 μm [18]. Different niobium-bearing minerals exhibit minor differences in physical and chemical properties and have complex symbiotic relationships with other minerals. As a result, conventional mineral processing methods are often unable to achieve effective enrichment of a specific niobium mineral, leading to low niobium recovery and poor resource utilization efficiency.
Geological analysis indicates that the West Ore Block of Bayan Obo is dominated by columbite and pyrochlore. In the aegirine-type niobium rare earth ores from the Main and East Ore Blocks, eschynite serves as the principal niobium-bearing mineral. Moreover, the grain size of eschynite is relatively coarse, with some grains measuring 50–100 μm. The Nb2O5 grade in pure eschynite is also relatively high, at 30–35% [17,19,20]. Therefore, separate stockpiling and beneficiation tests on aegirine-type eschynite ore are of great practical significance for the efficient recovery of niobium resources in Bayan Obo. Moreover, given that no dedicated aeschynite mines exist worldwide, research on the beneficiation and concentration of this type of niobium mineral is of equally important scientific significance.
Given that aeschynite deposits are extremely rare worldwide, very few studies have been devoted to flotation collectors for aeschynite minerals. Diisooctyl phosphate and oleic acid were employed as collectors for the flotation of niobium minerals from the medium- to fine-grained ore hosted in the early aeschynite enrichment zone of the pyroxene-type ore in the Bayan Obo Main deposit. This yielded a niobium flotation concentrate with an Nb2O5 grade of 2.08–2.15% [21]. Zhou Yulin et al. [22] applied a self-synthesized C6–12 alkyl hydroxamic acid as collector for the direct flotation of niobium from a pre-concentrated sample of Bayan Obo production line tailings, in which aeschynite accounted for 75% of the niobium minerals. A niobium flotation concentrate with an Nb2O5 grade of 12.36% was ultimately obtained. It has been shown that C5–9 hydroxamic acid exhibits strong collecting ability for four minerals, namely columbite, aeschynite, pyrochlore, and ilmenorutile [23]. In light of existing reagent studies on aeschynite, this paper focuses on hydroxamic acid-based collectors as the research priority.

2. Materials and Methods

2.1. Materials

The raw material used in the experiments was a bulk sample of aegirine-type niobium–rare earth ore with a particle size of 0–100 mm, obtained from a mining area in Inner Mongolia, assaying 0.14% Nb2O5. The sample was then crushed to 0–2 mm using a jaw crusher followed by a roll crusher. After grinding, low-intensity magnetic separation and rare earth flotation, the resulting rare earth flotation tailings were used as the feed ore for niobium beneficiation tests in this study. In addition, chemical composition analysis and MLA analysis were conducted on the niobium feed ore.

2.2. Properties of the Feed Ore

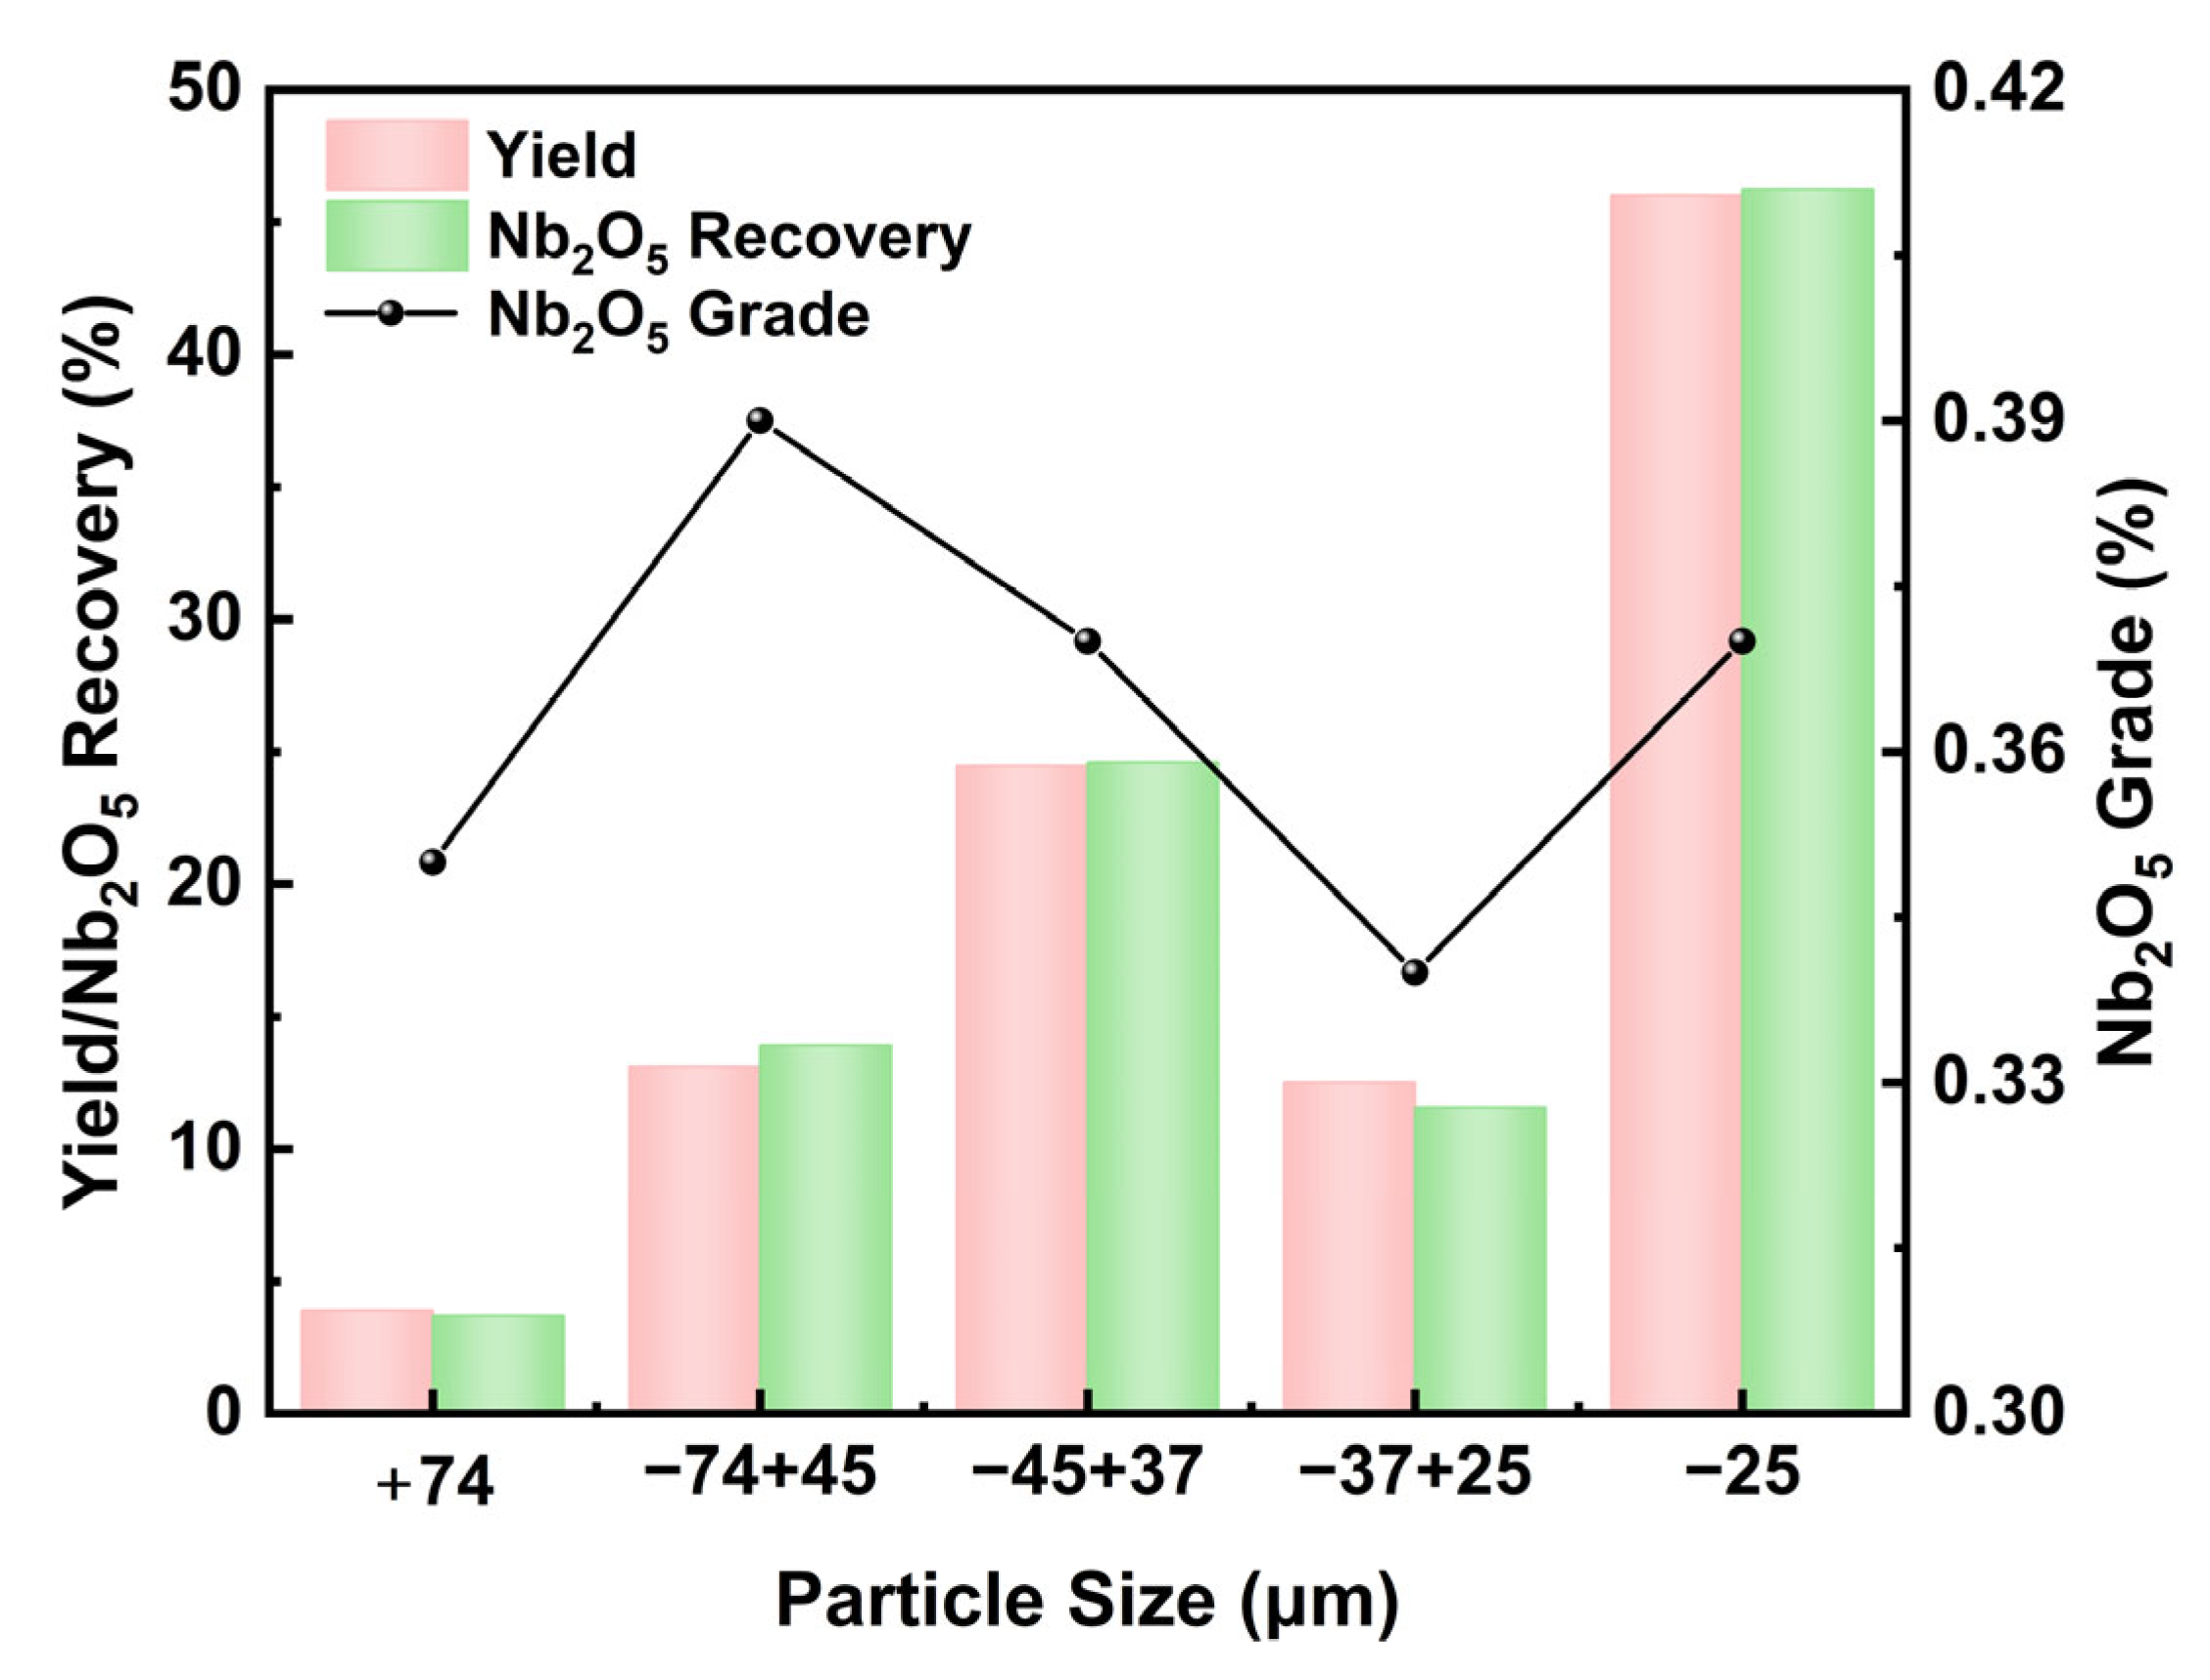
To determine the particle size distribution and ore properties of the feed ore, analyses of the main chemical elements, iron phase composition, and particle size distribution were conducted, with the results presented in Table 1, Figure 1, and Figure 2, respectively.
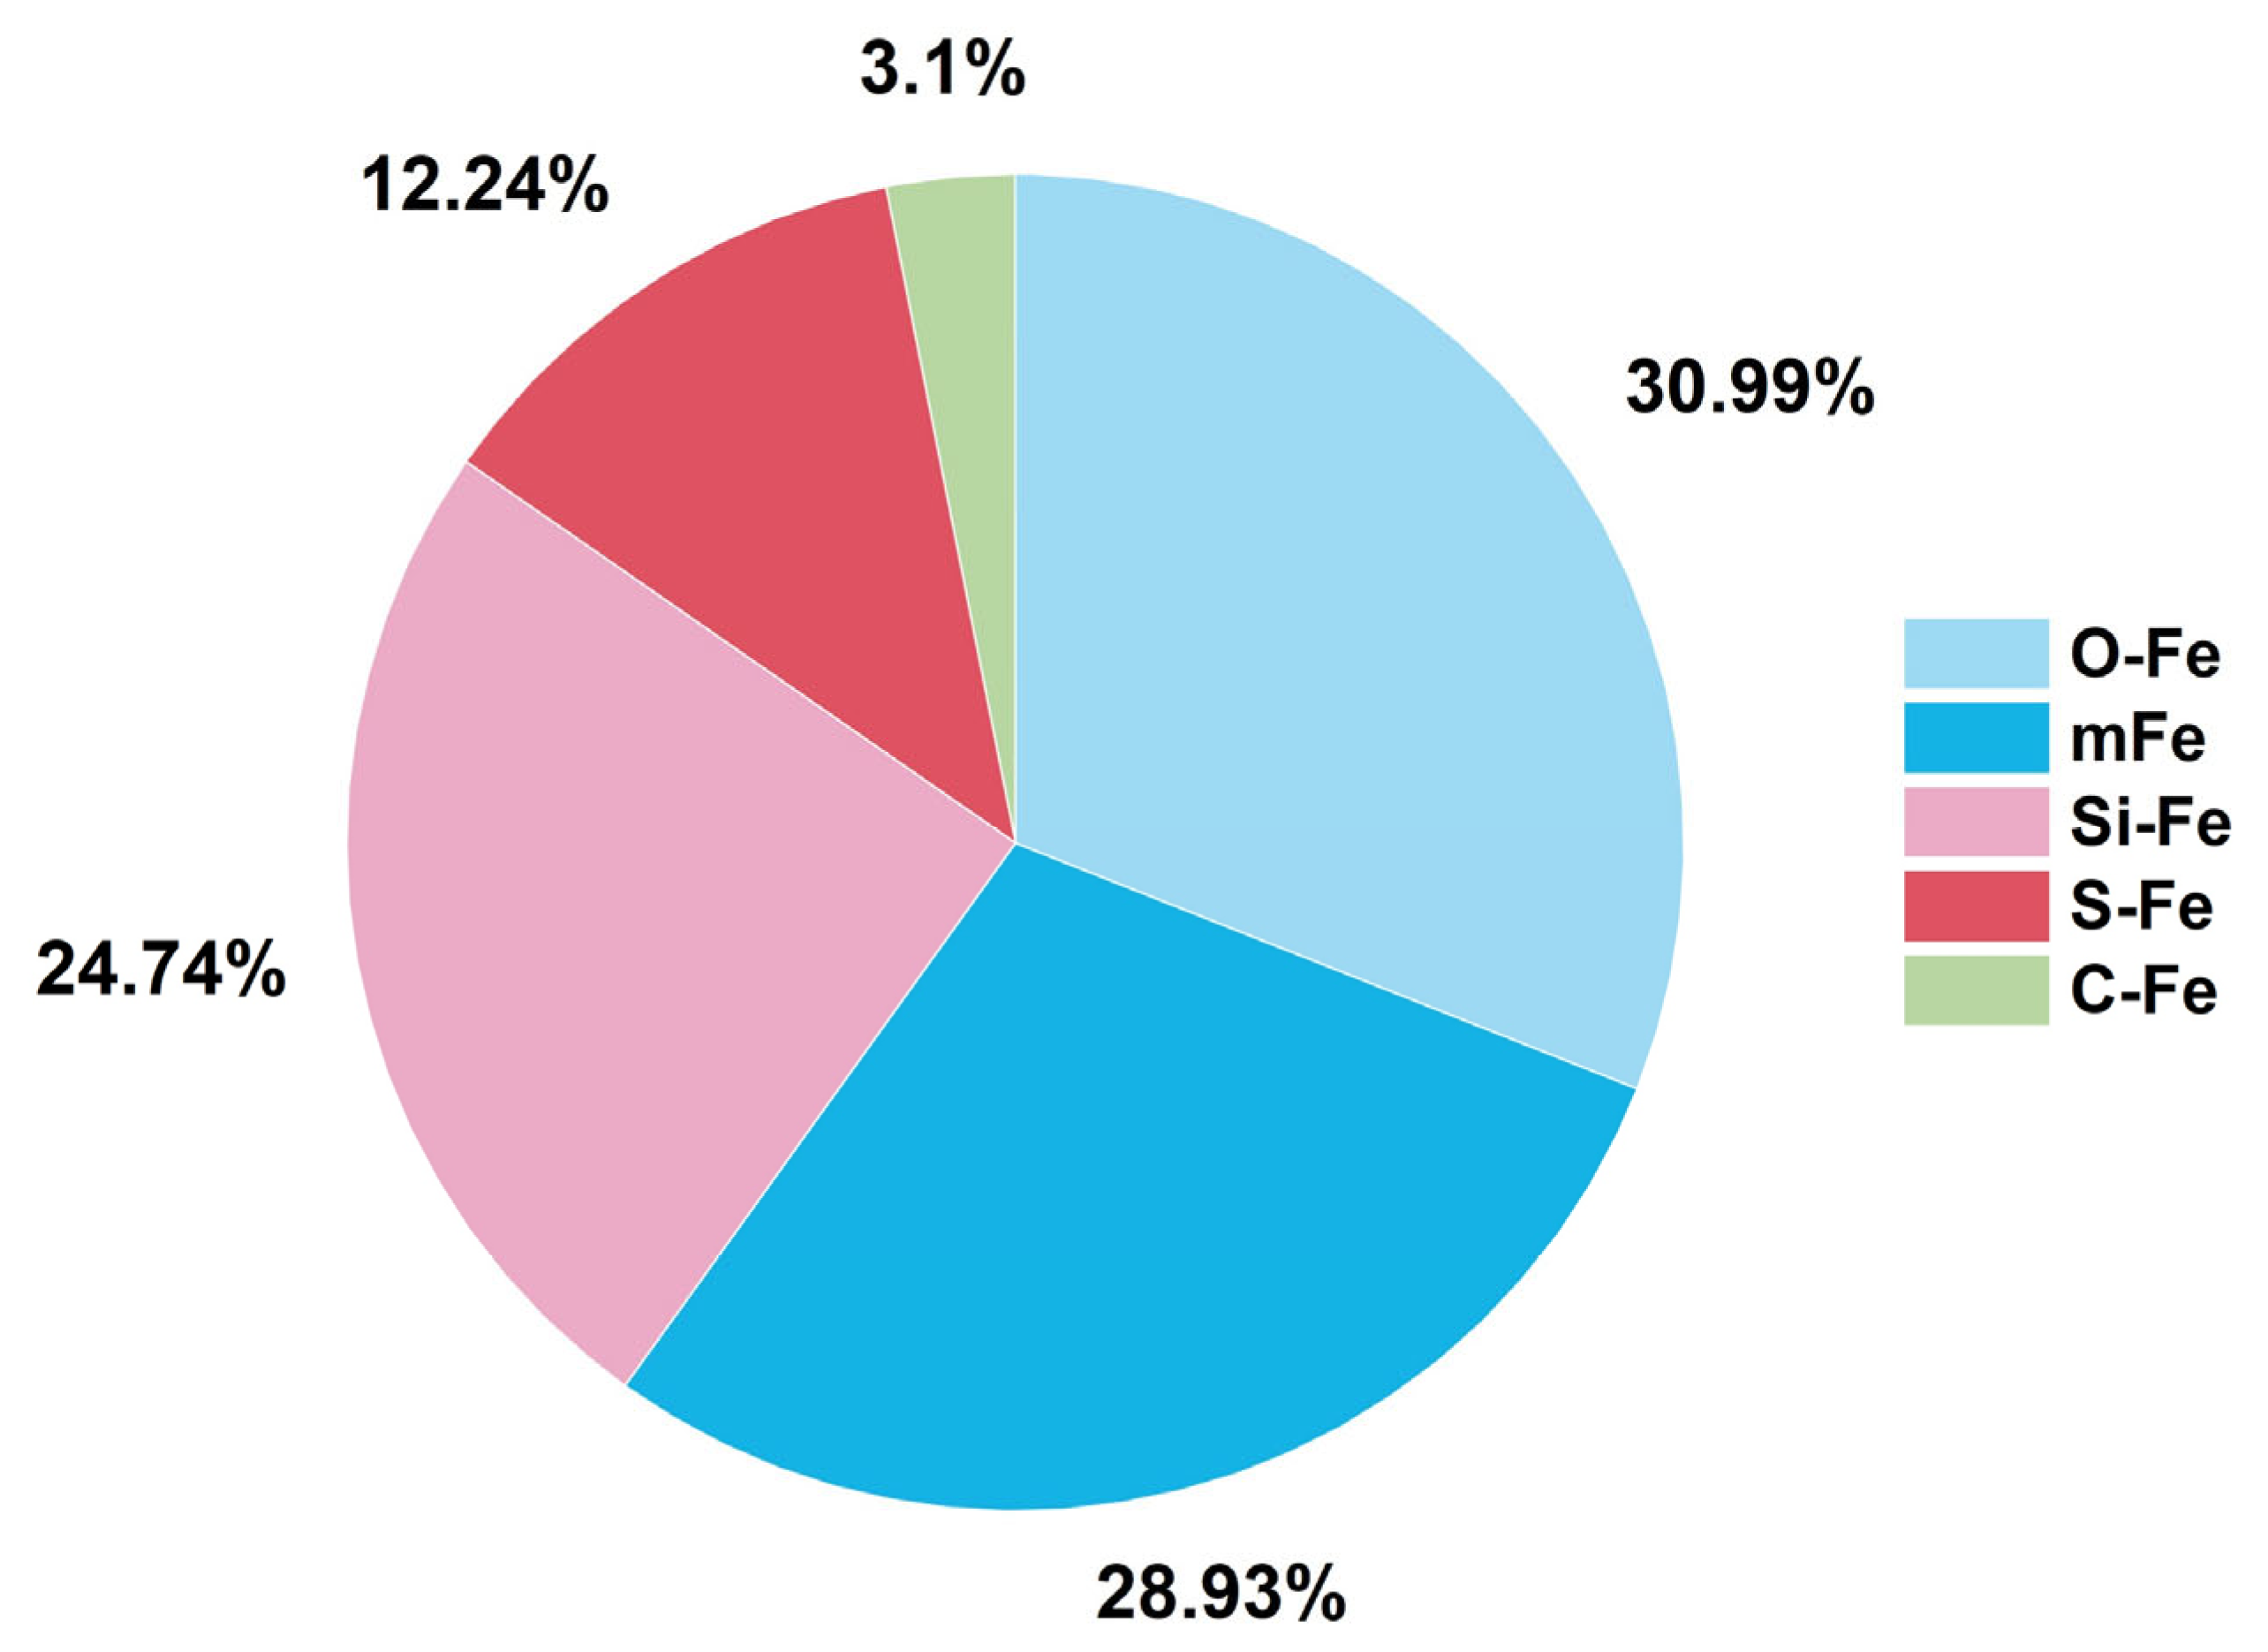
As shown in Table 1, the feed ore contains 0.370% Nb2O5, 19.36% total Fe (TFe), and 10.93% BaO, accompanied by impurities such as Si, P, S, and F. As illustrated in Figure 1, iron phases are dominated by oxidized iron, magnetic iron, and silicate iron, accounting for 30.99%, 28.93%, and 24.74%, respectively. According to Figure 2, the yield of the −75 μm fraction reaches 96.10%, and niobium minerals are mainly concentrated in the −25 μm and 50–38 μm size ranges. The −25 μm fraction accounts for 46% of the total mass, indicating a relatively high content of fine particles.

2.3. Mineral Liberation Analysis

To identify a suitable niobium recovery process and achieve satisfactory metallurgical performance, it is necessary to thoroughly characterize the main mineral composition and content of the feed ore, the particle size distribution of the key minerals, and the mineral content, liberation, and locking characteristics across different size fractions. The analytical results are presented in Figure 3, Figure 4 and Figure 5.
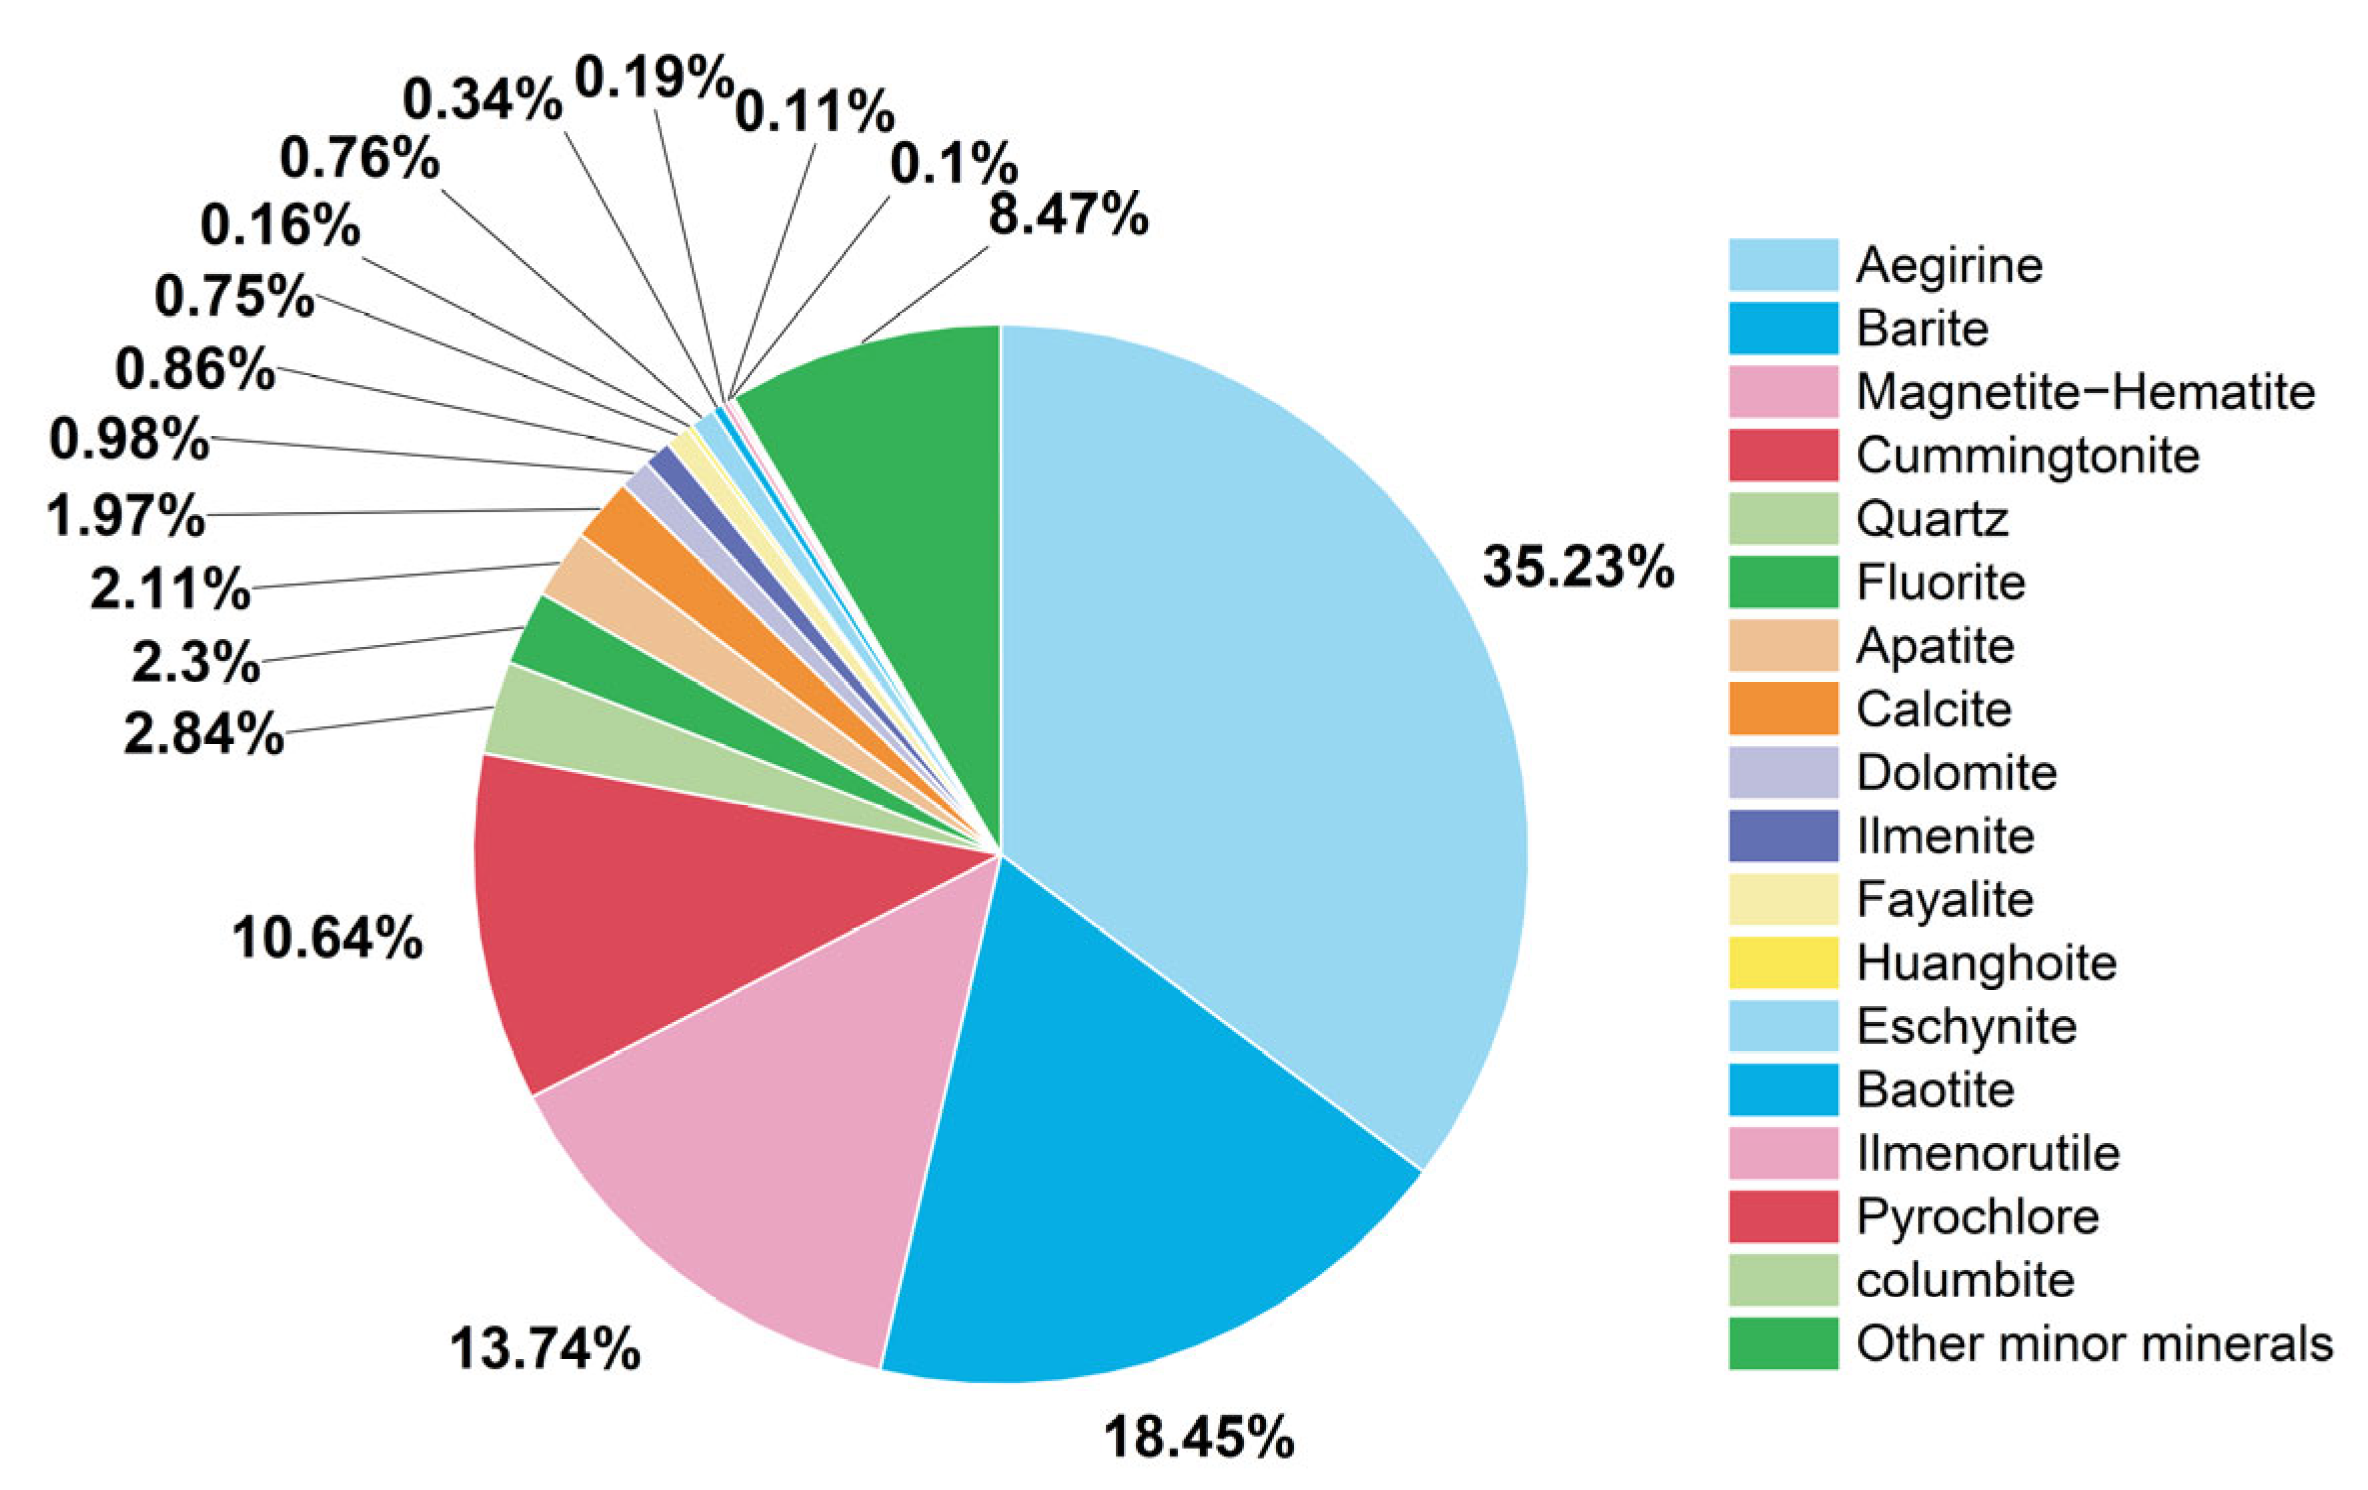
It can be seen from Figure 3 that the niobium-bearing minerals in the feed ore mainly consist of five types: columbite, pyrochlore, baotite, eschynite and ilmenorutile. The contents of each niobium mineral are 0.10% for columbite, 0.11% for pyrochlore, 0.34% for baotite, 0.76% for eschynite and 0.19% for ilmenorutile, with a total proportion of 1.50%. Among them, eschynite accounts for 50.67% of all niobium-bearing minerals. Other major minerals include aegirine, magnetite-hematite, cummingtonite, quartz, barite, fluorite, calcite, dolomite, apatite, ilmenite, fayalite, huanghoite.
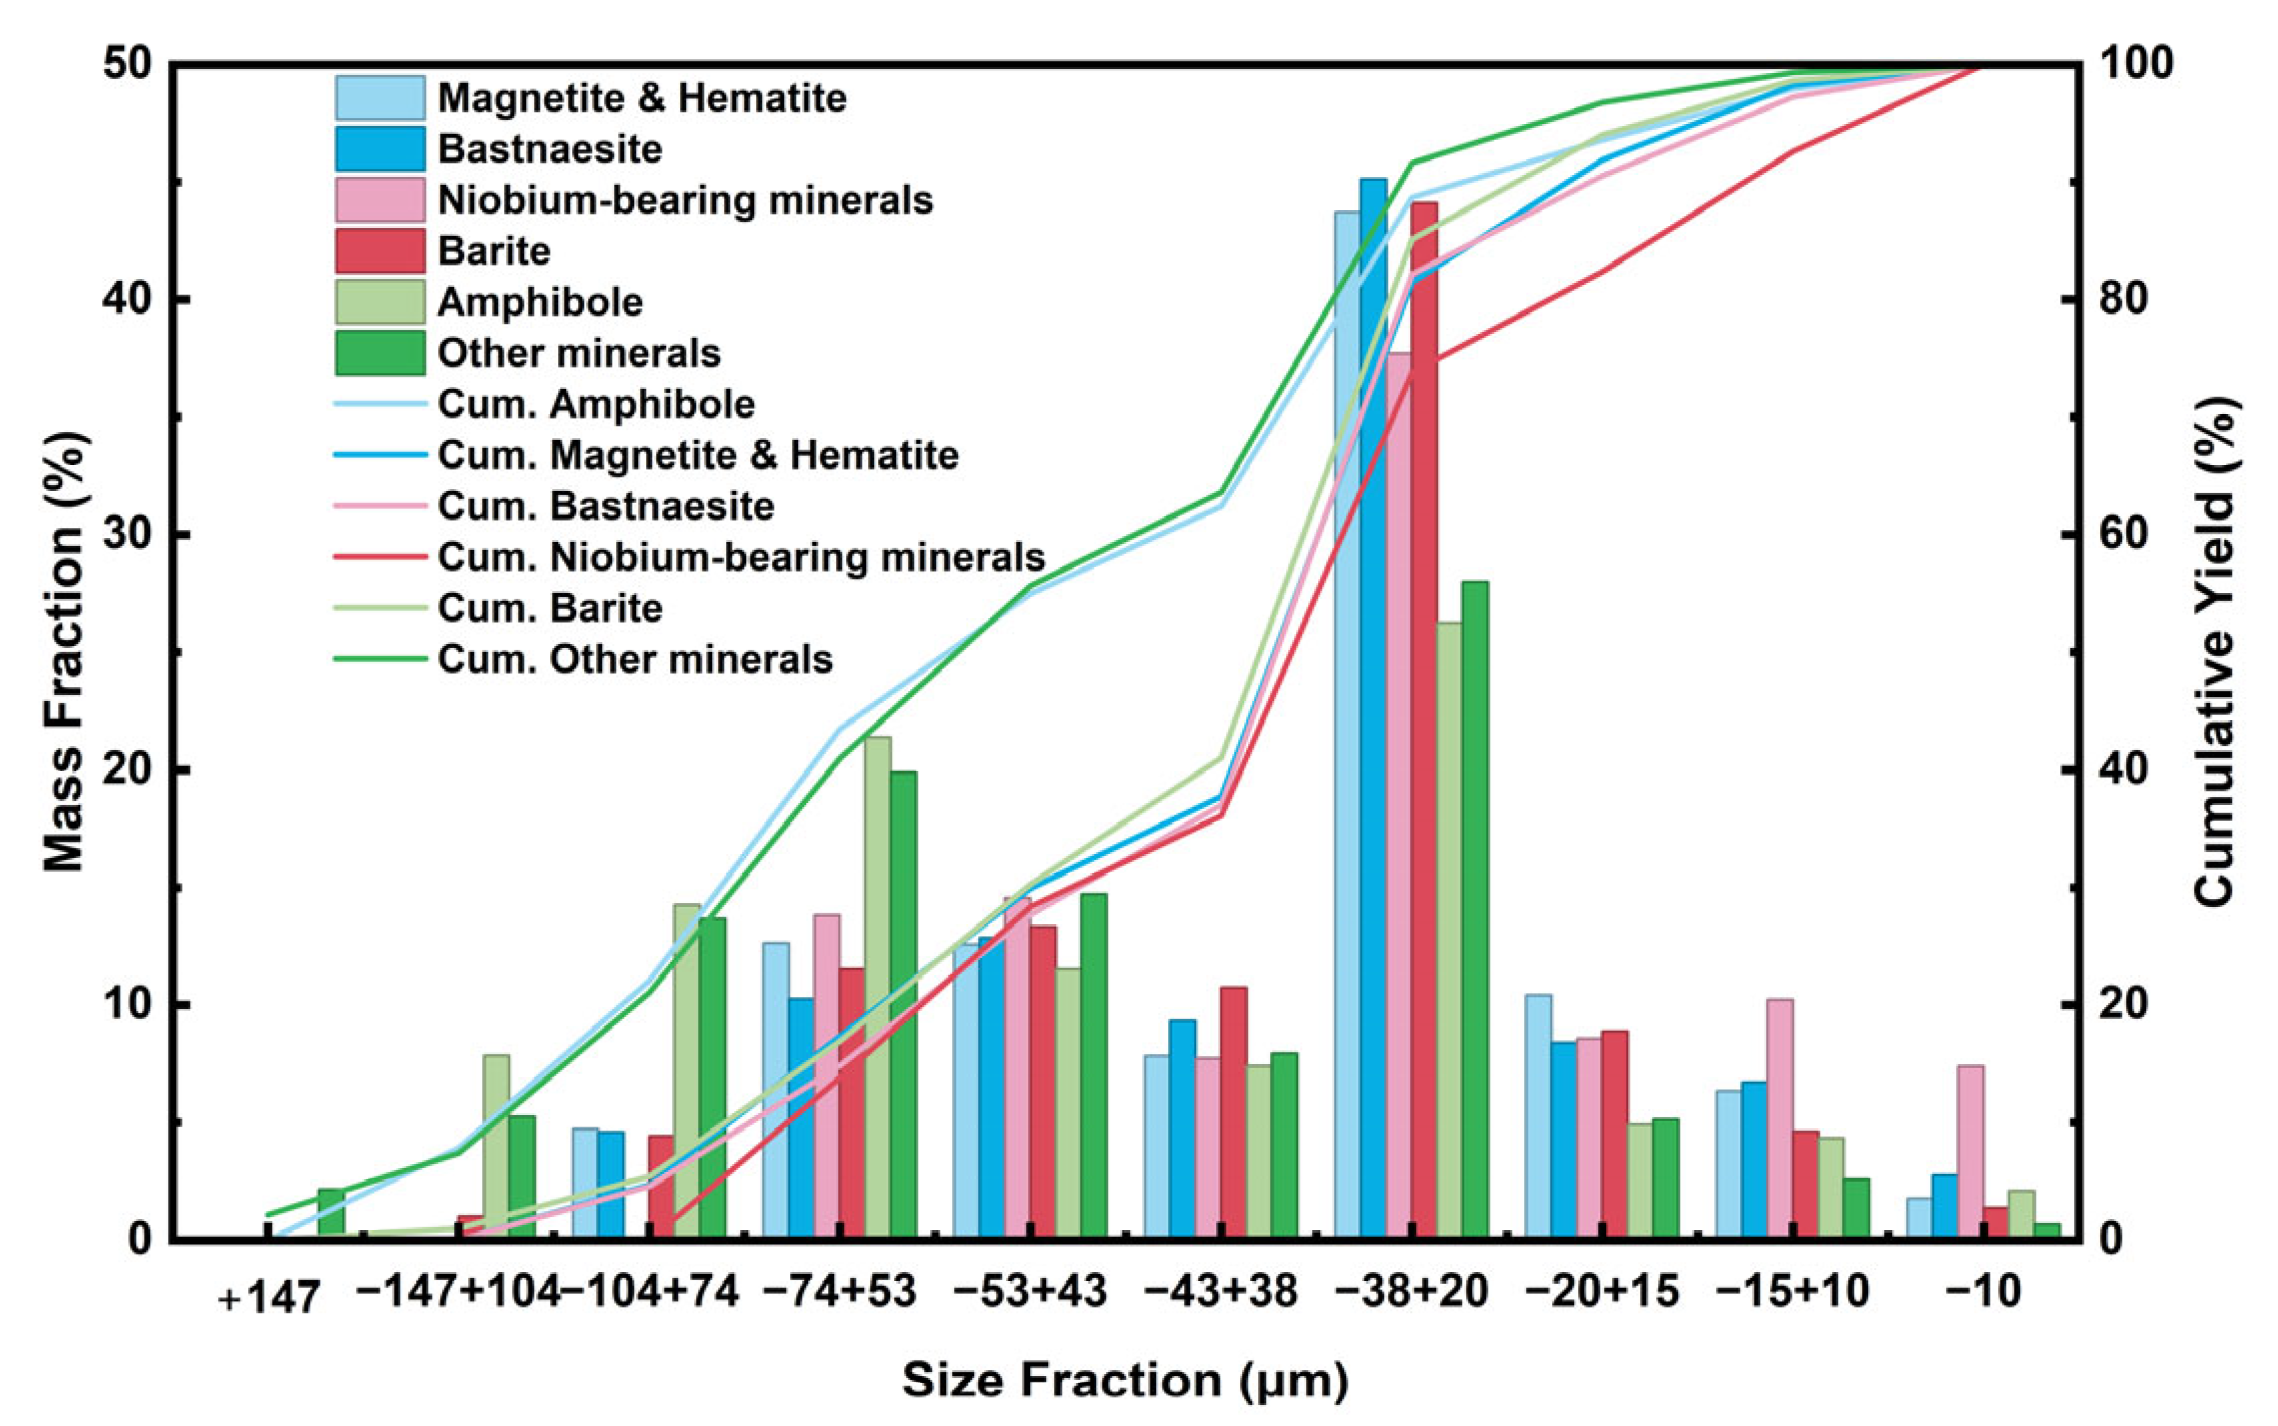
As shown in Figure 4, magnetite, bastnaesite, niobium-bearing minerals and barite are mainly distributed in the size fraction of −38 + 20 μm. For gangue minerals, the contents of amphibole and aegirine in the +74 μm fraction are relatively high, both exceeding 20%. Niobium-bearing minerals are all found in the −74 μm fraction and mainly distributed in the −74 + 20 μm fraction, with a content of 73.8%. The content in the −10 μm fraction is also relatively high (7.3%), and such fine particles are difficult to recover.
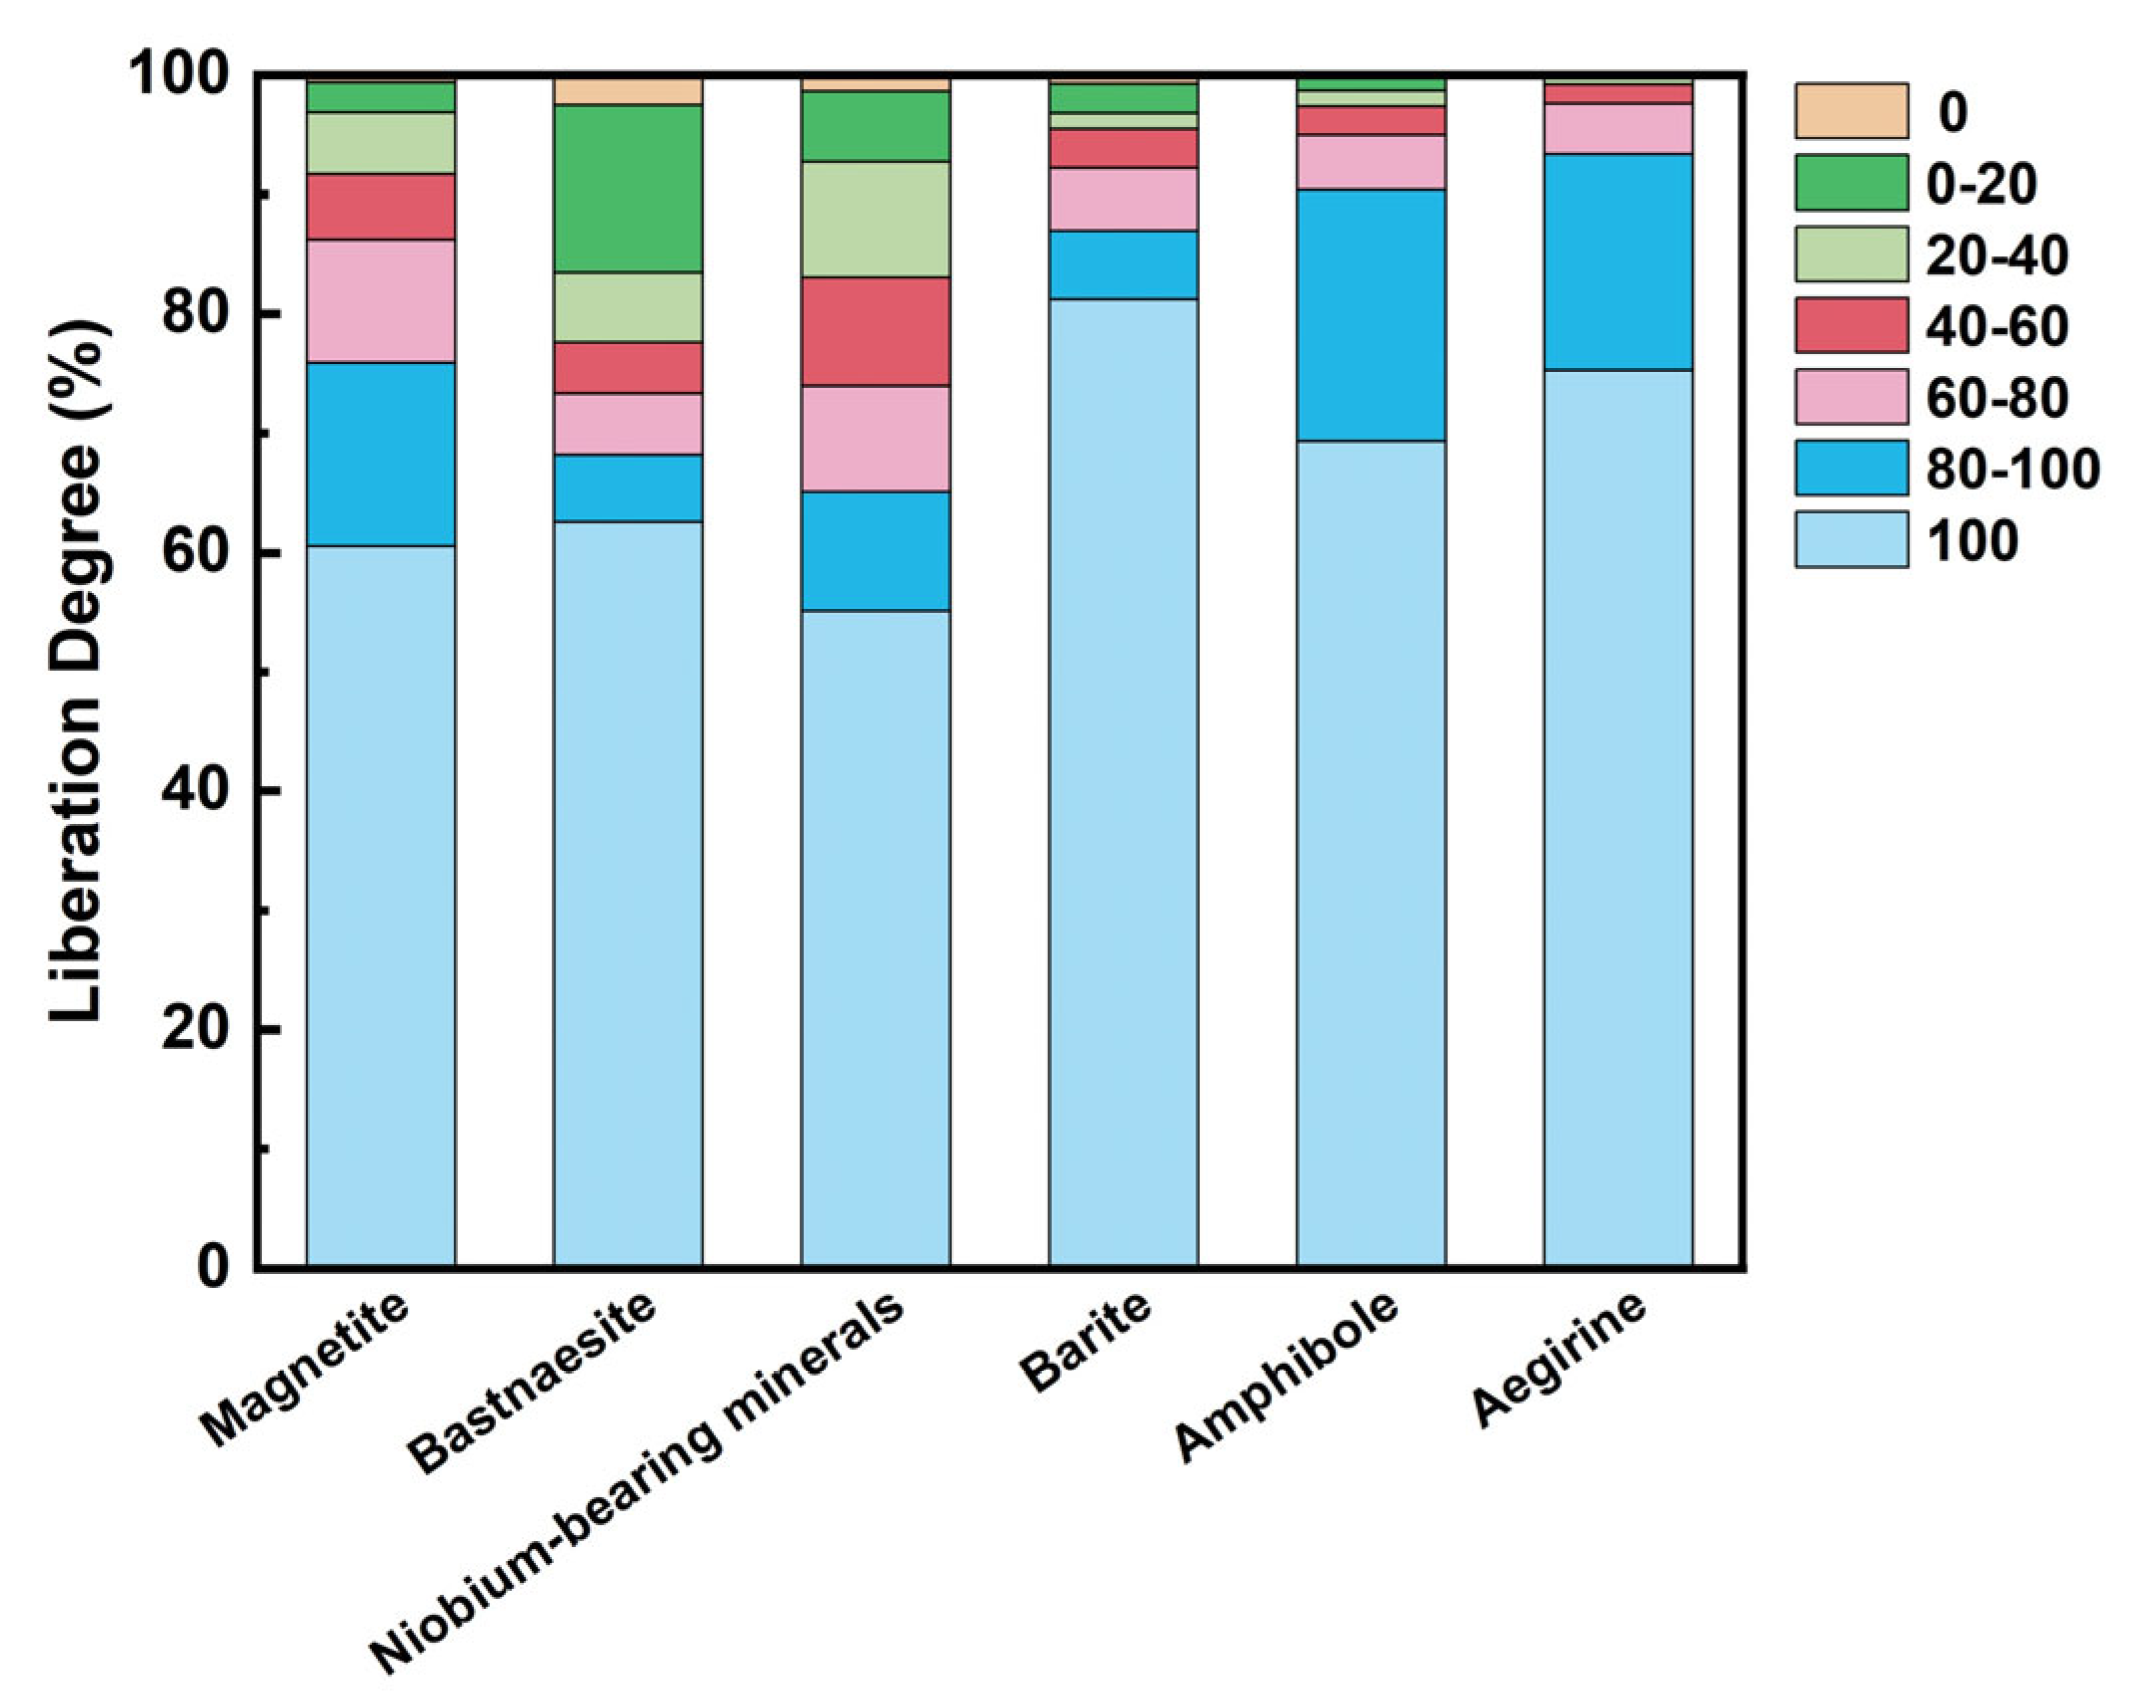
As shown in Figure 5, three gangue minerals—barite, amphibole, and aegirine—exhibit the best liberation behavior, with all proportions exceeding 80% at a liberation degree above 80%. The proportion of niobium-bearing minerals with a liberation degree higher than 80% is 65.08%, indicating a moderate liberation level. For bastnaesite, the proportion with a liberation degree above 80% is 68.18%. To clarify the locking characteristics of niobium-bearing minerals, an analysis of the intergrowth degree of the main minerals was conducted, and the results are displayed in Figure 6.
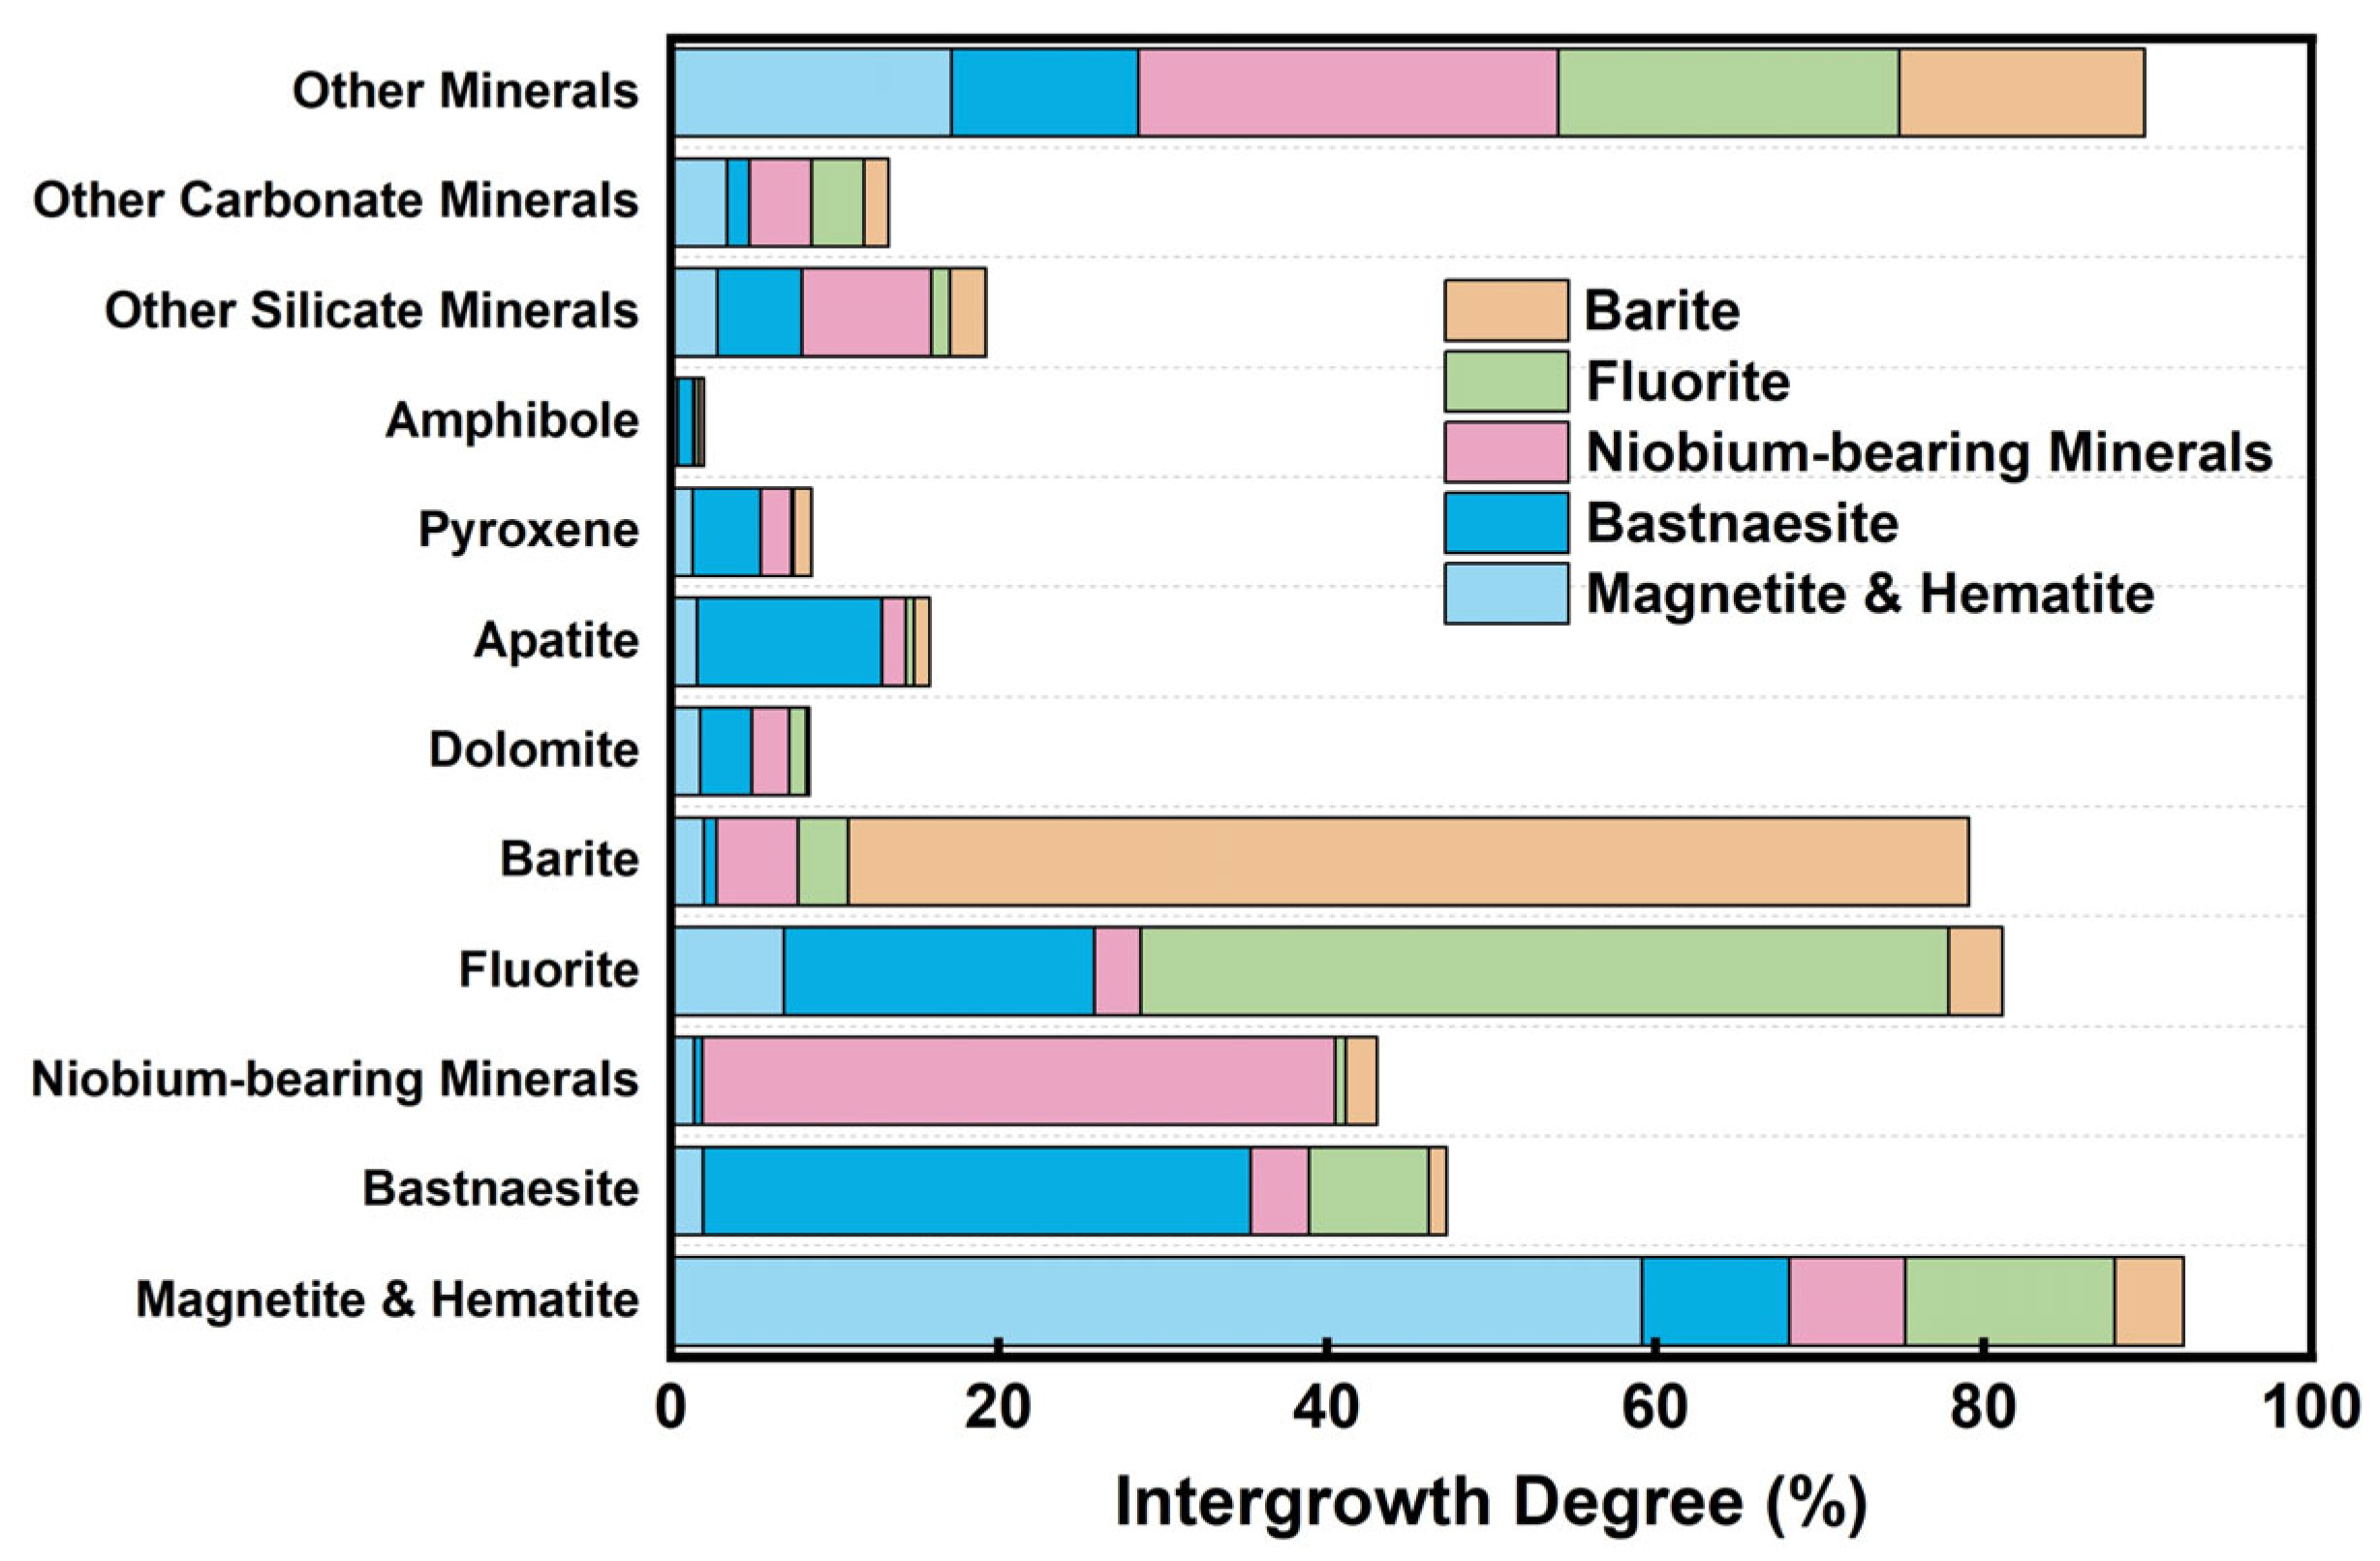
As shown in Figure 6, niobium-bearing minerals are intergrown with iron minerals, rare earth minerals, fluorite, and barite, as well as other silicate and carbonate minerals. Of these, the intergrowth proportions of niobium-bearing minerals with maghemite, bastnaesite, barite, other silicate minerals, and other minerals are 7.05%, 3.59%, 4.98%, 7.90%, and 25.18%, respectively. This indicates that the locking configuration of niobium-bearing minerals is relatively complicated. However, for the recovery of niobium minerals dominated by eschynite, excessive grinding should be avoided, as it would generate more ultrafine particles and thereby adversely affect the separation performance.
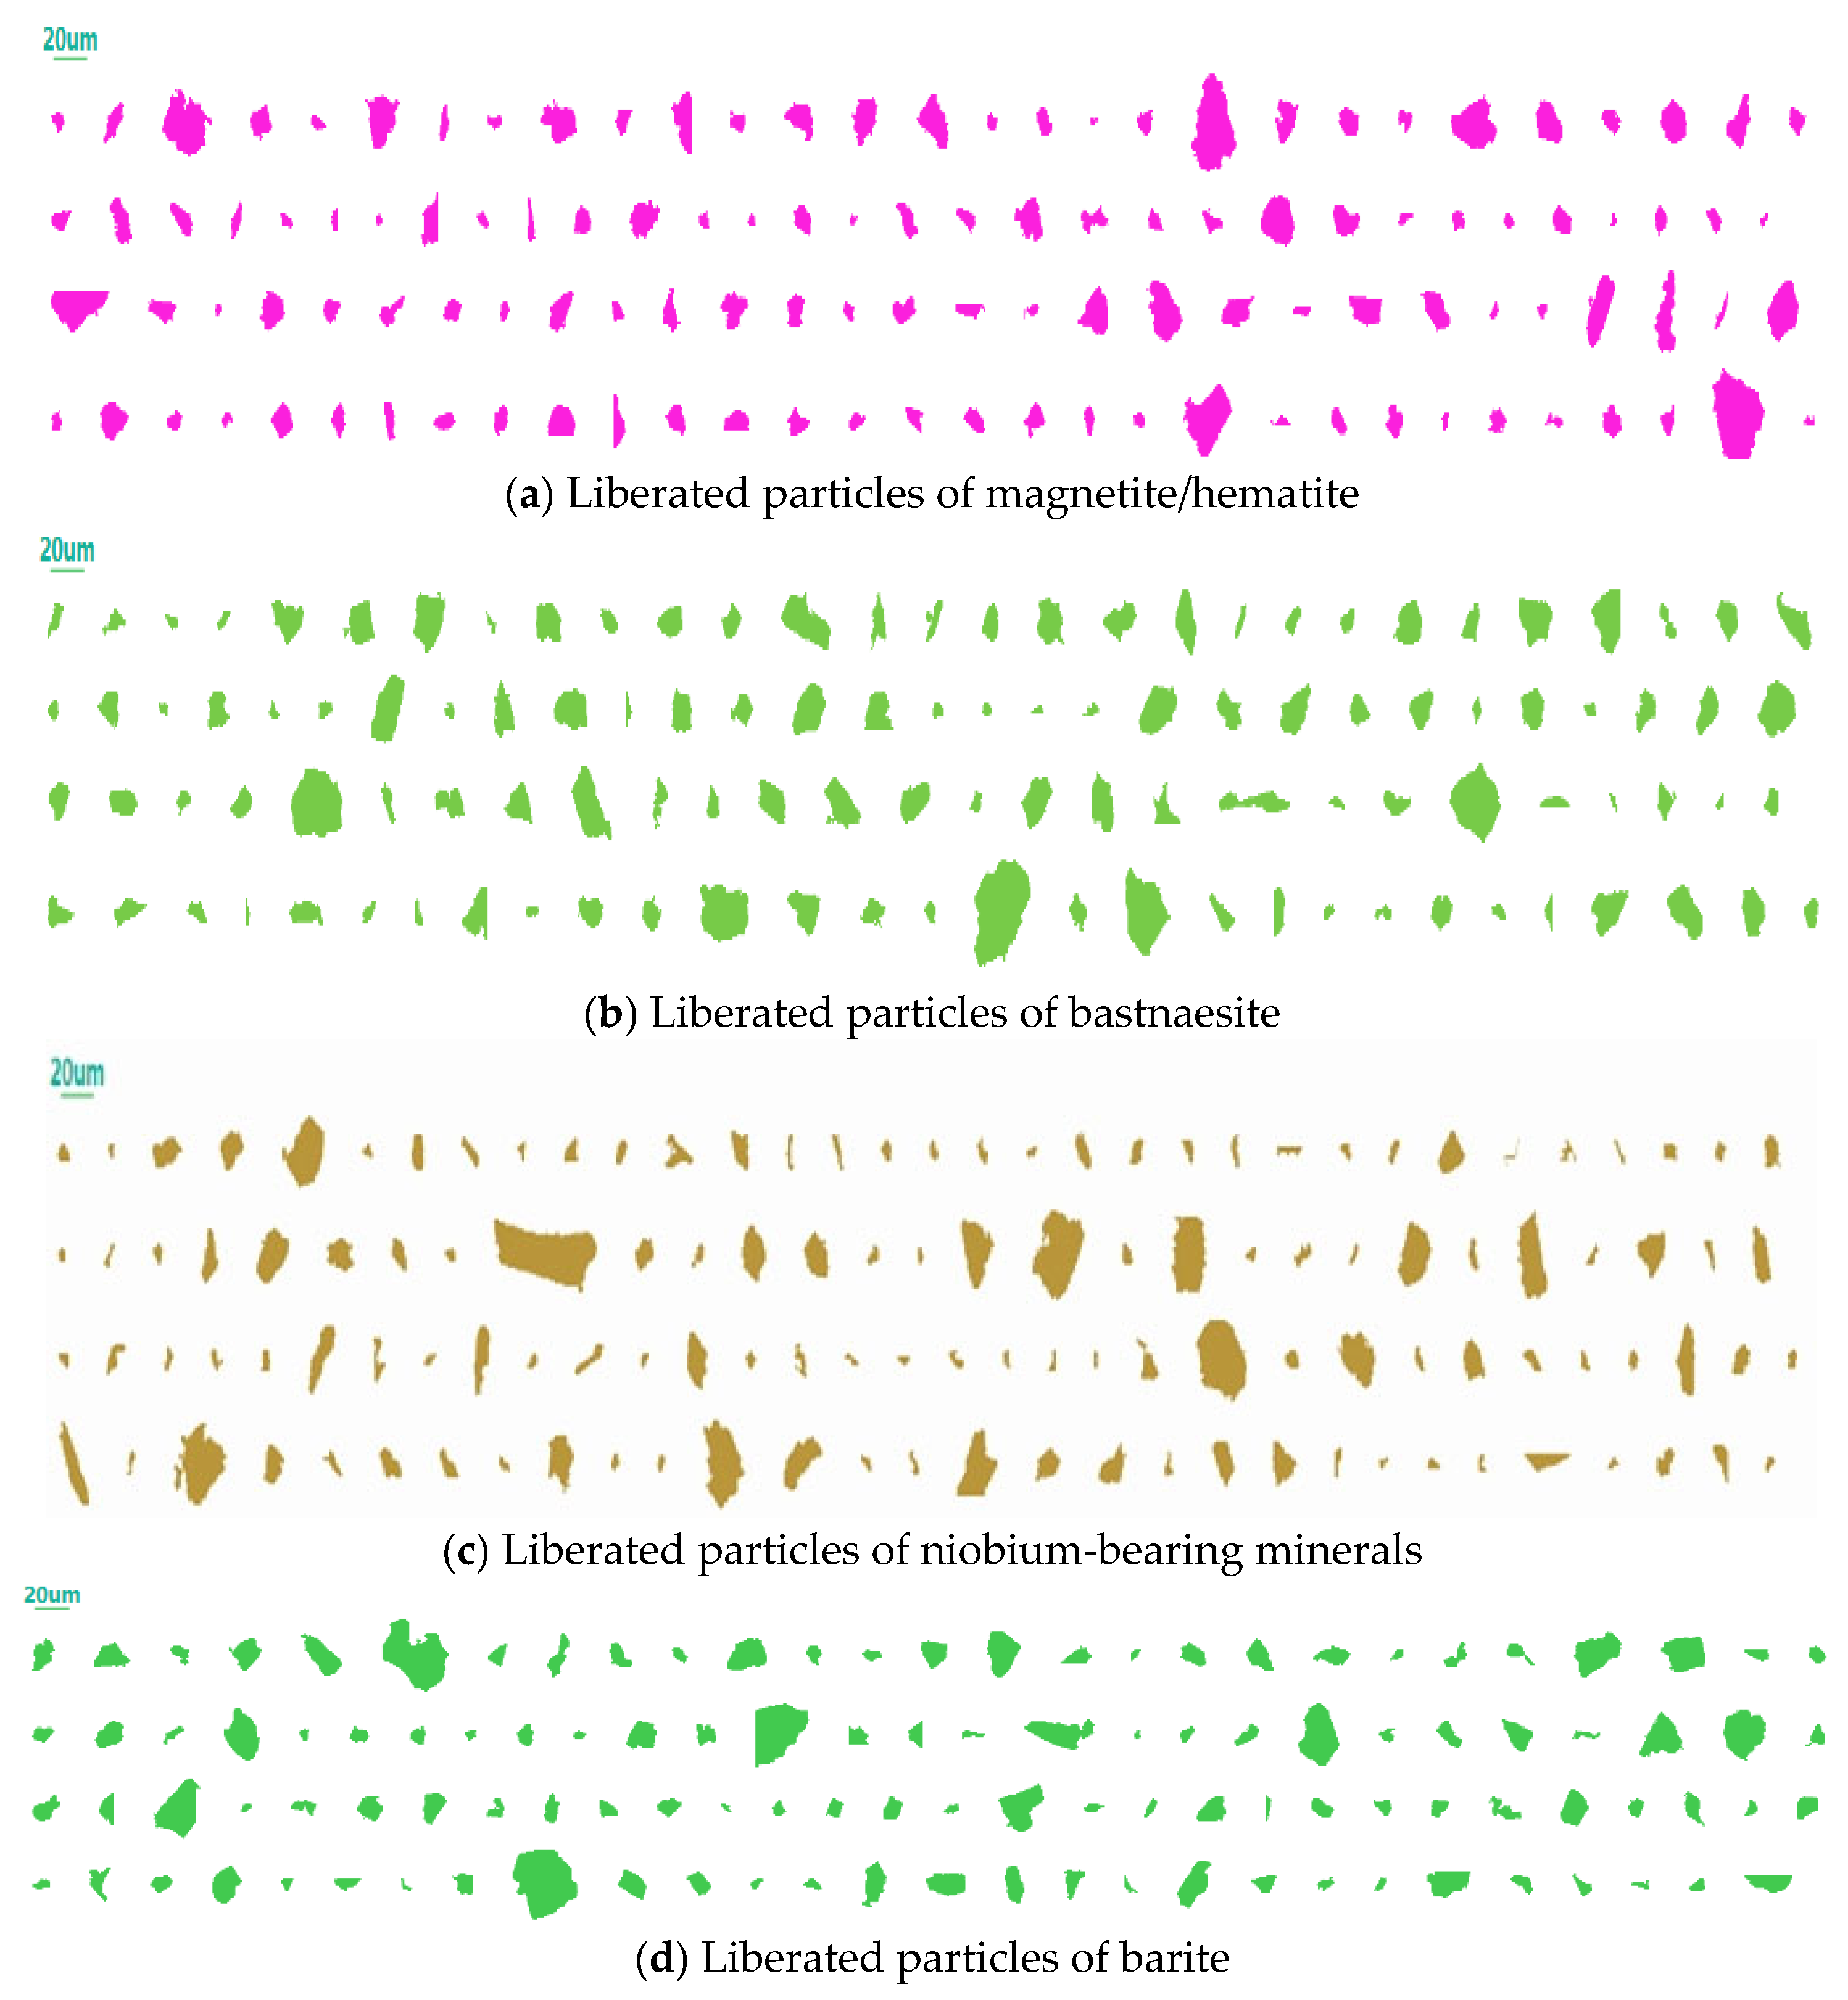
The particle size distributions of individual mineral grains measured by MLA are presented in Figure 7. The grain size distributions of the major individual minerals are shown in Figure 8.
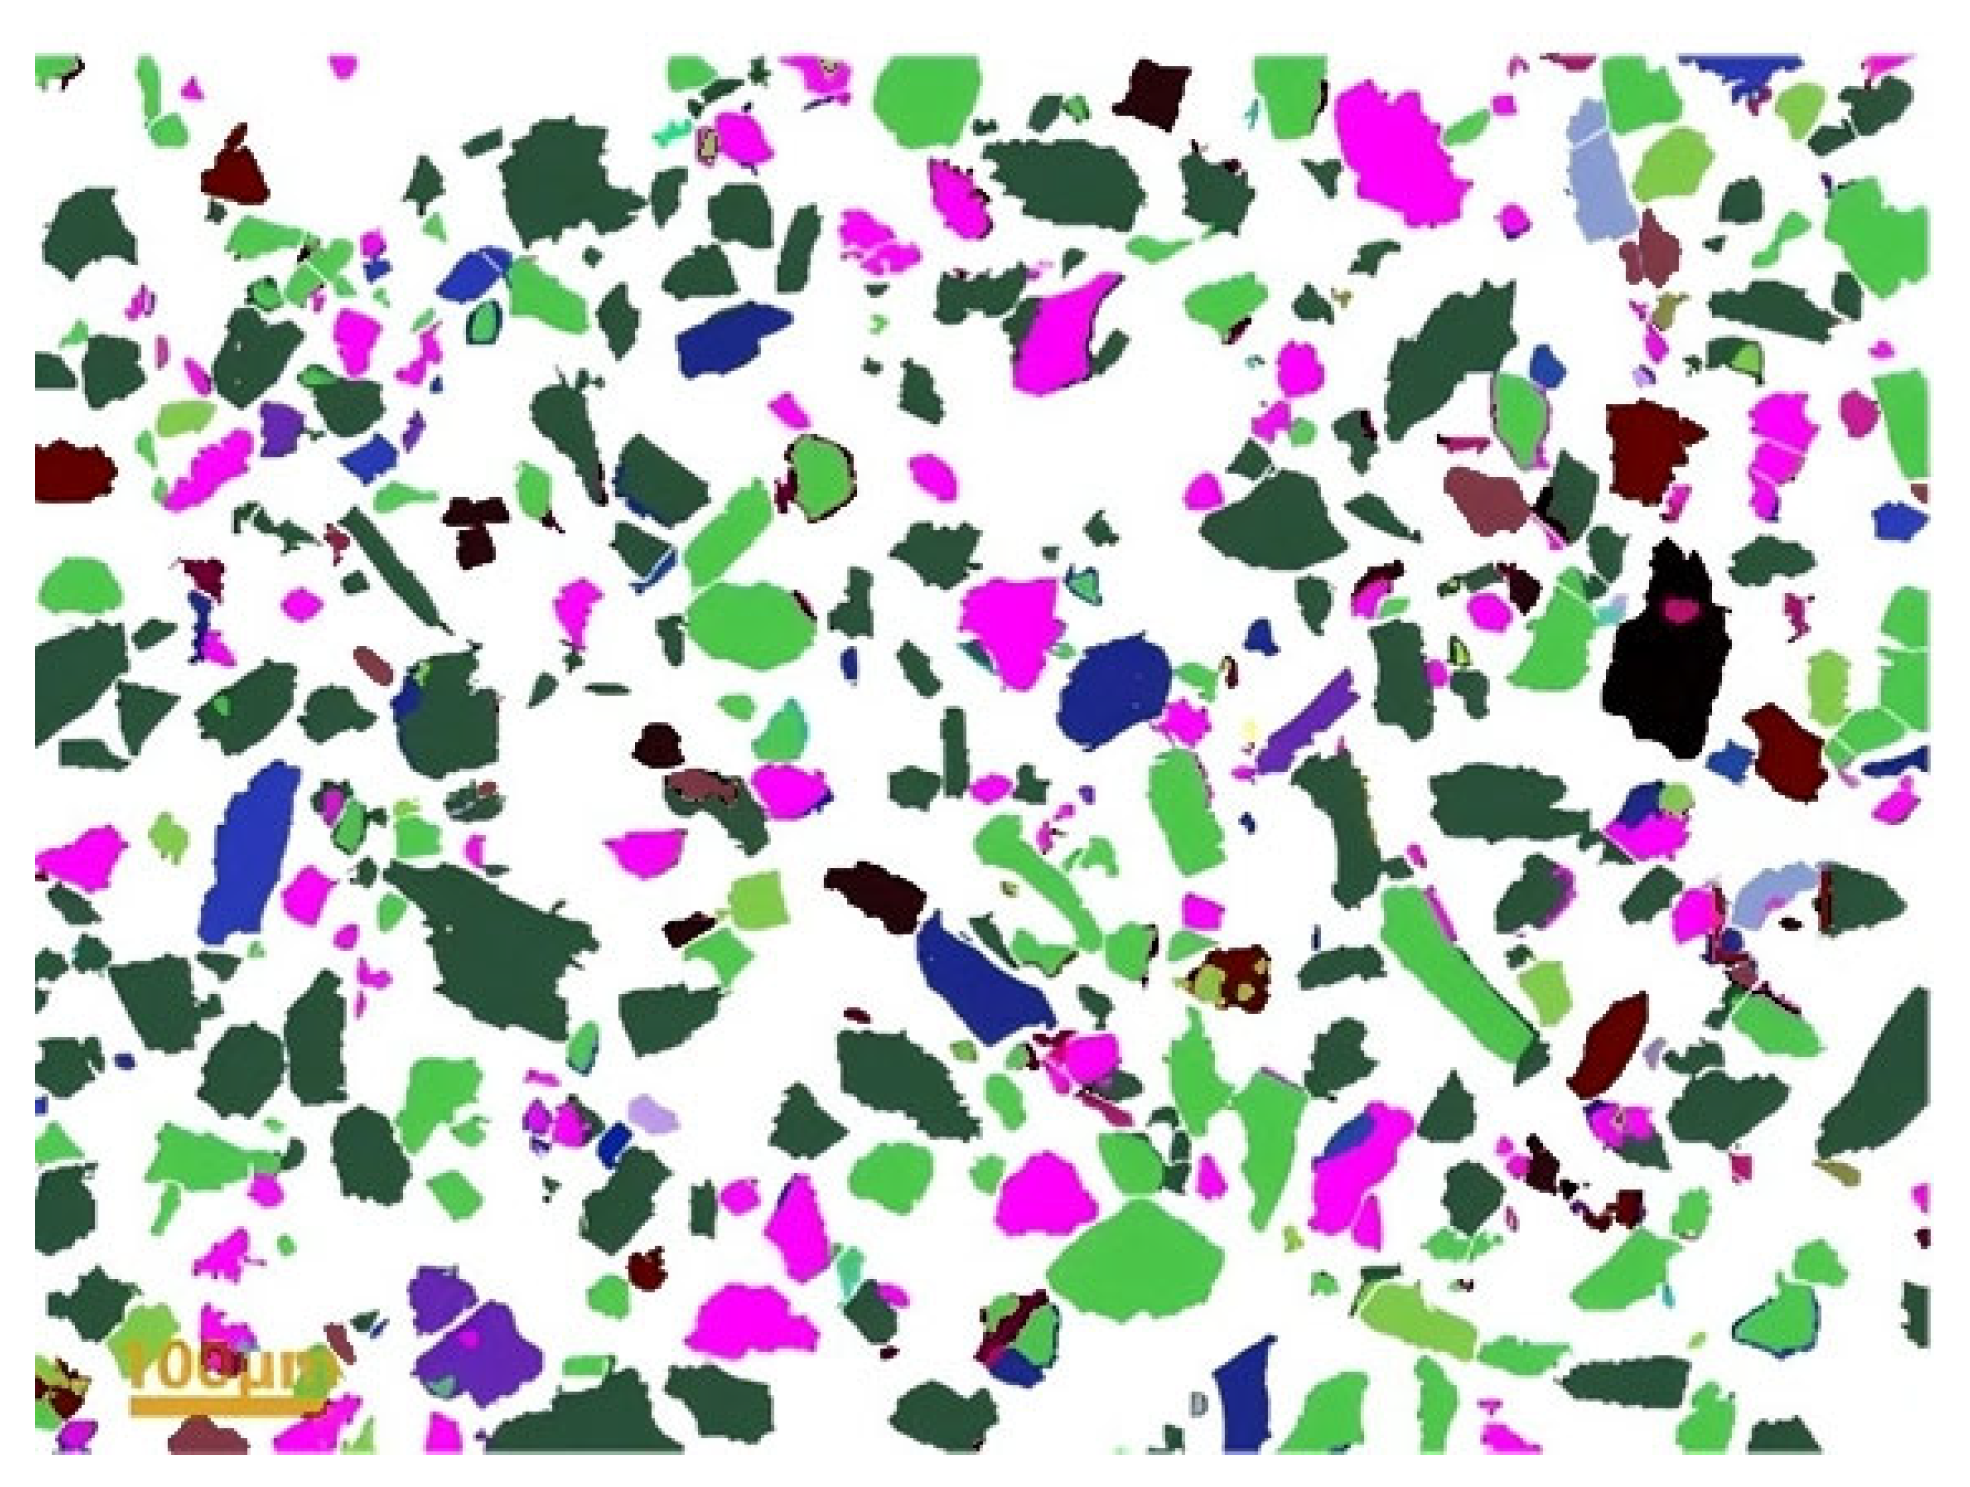
As shown in Figure 7, there are relatively few large liberated particles of niobium-bearing minerals within the 100 μm field of view, and most of them are intergrown. It can be seen from Figure 8 that the liberated particles of niobium-bearing minerals are distributed at both the coarse and fine size fractions. The content of fine-grained particles is relatively high, and most of them are smaller than 10 μm, making them difficult to recover in the subsequent process; the content of large liberated mineral particles is small, but their particle size is relatively large, so priority should be given to the recovery of large niobium-bearing mineral particles. Barite, bastnaesite, and magnetite mostly exhibit the same distribution characteristics. Therefore, further grinding may be carried out to improve liberation, but care should be taken to avoid overgrinding. In the subsequent flotation, the emphasis should be on depressing coarse gangue mineral particles and recovering coarse niobium-bearing mineral particles.
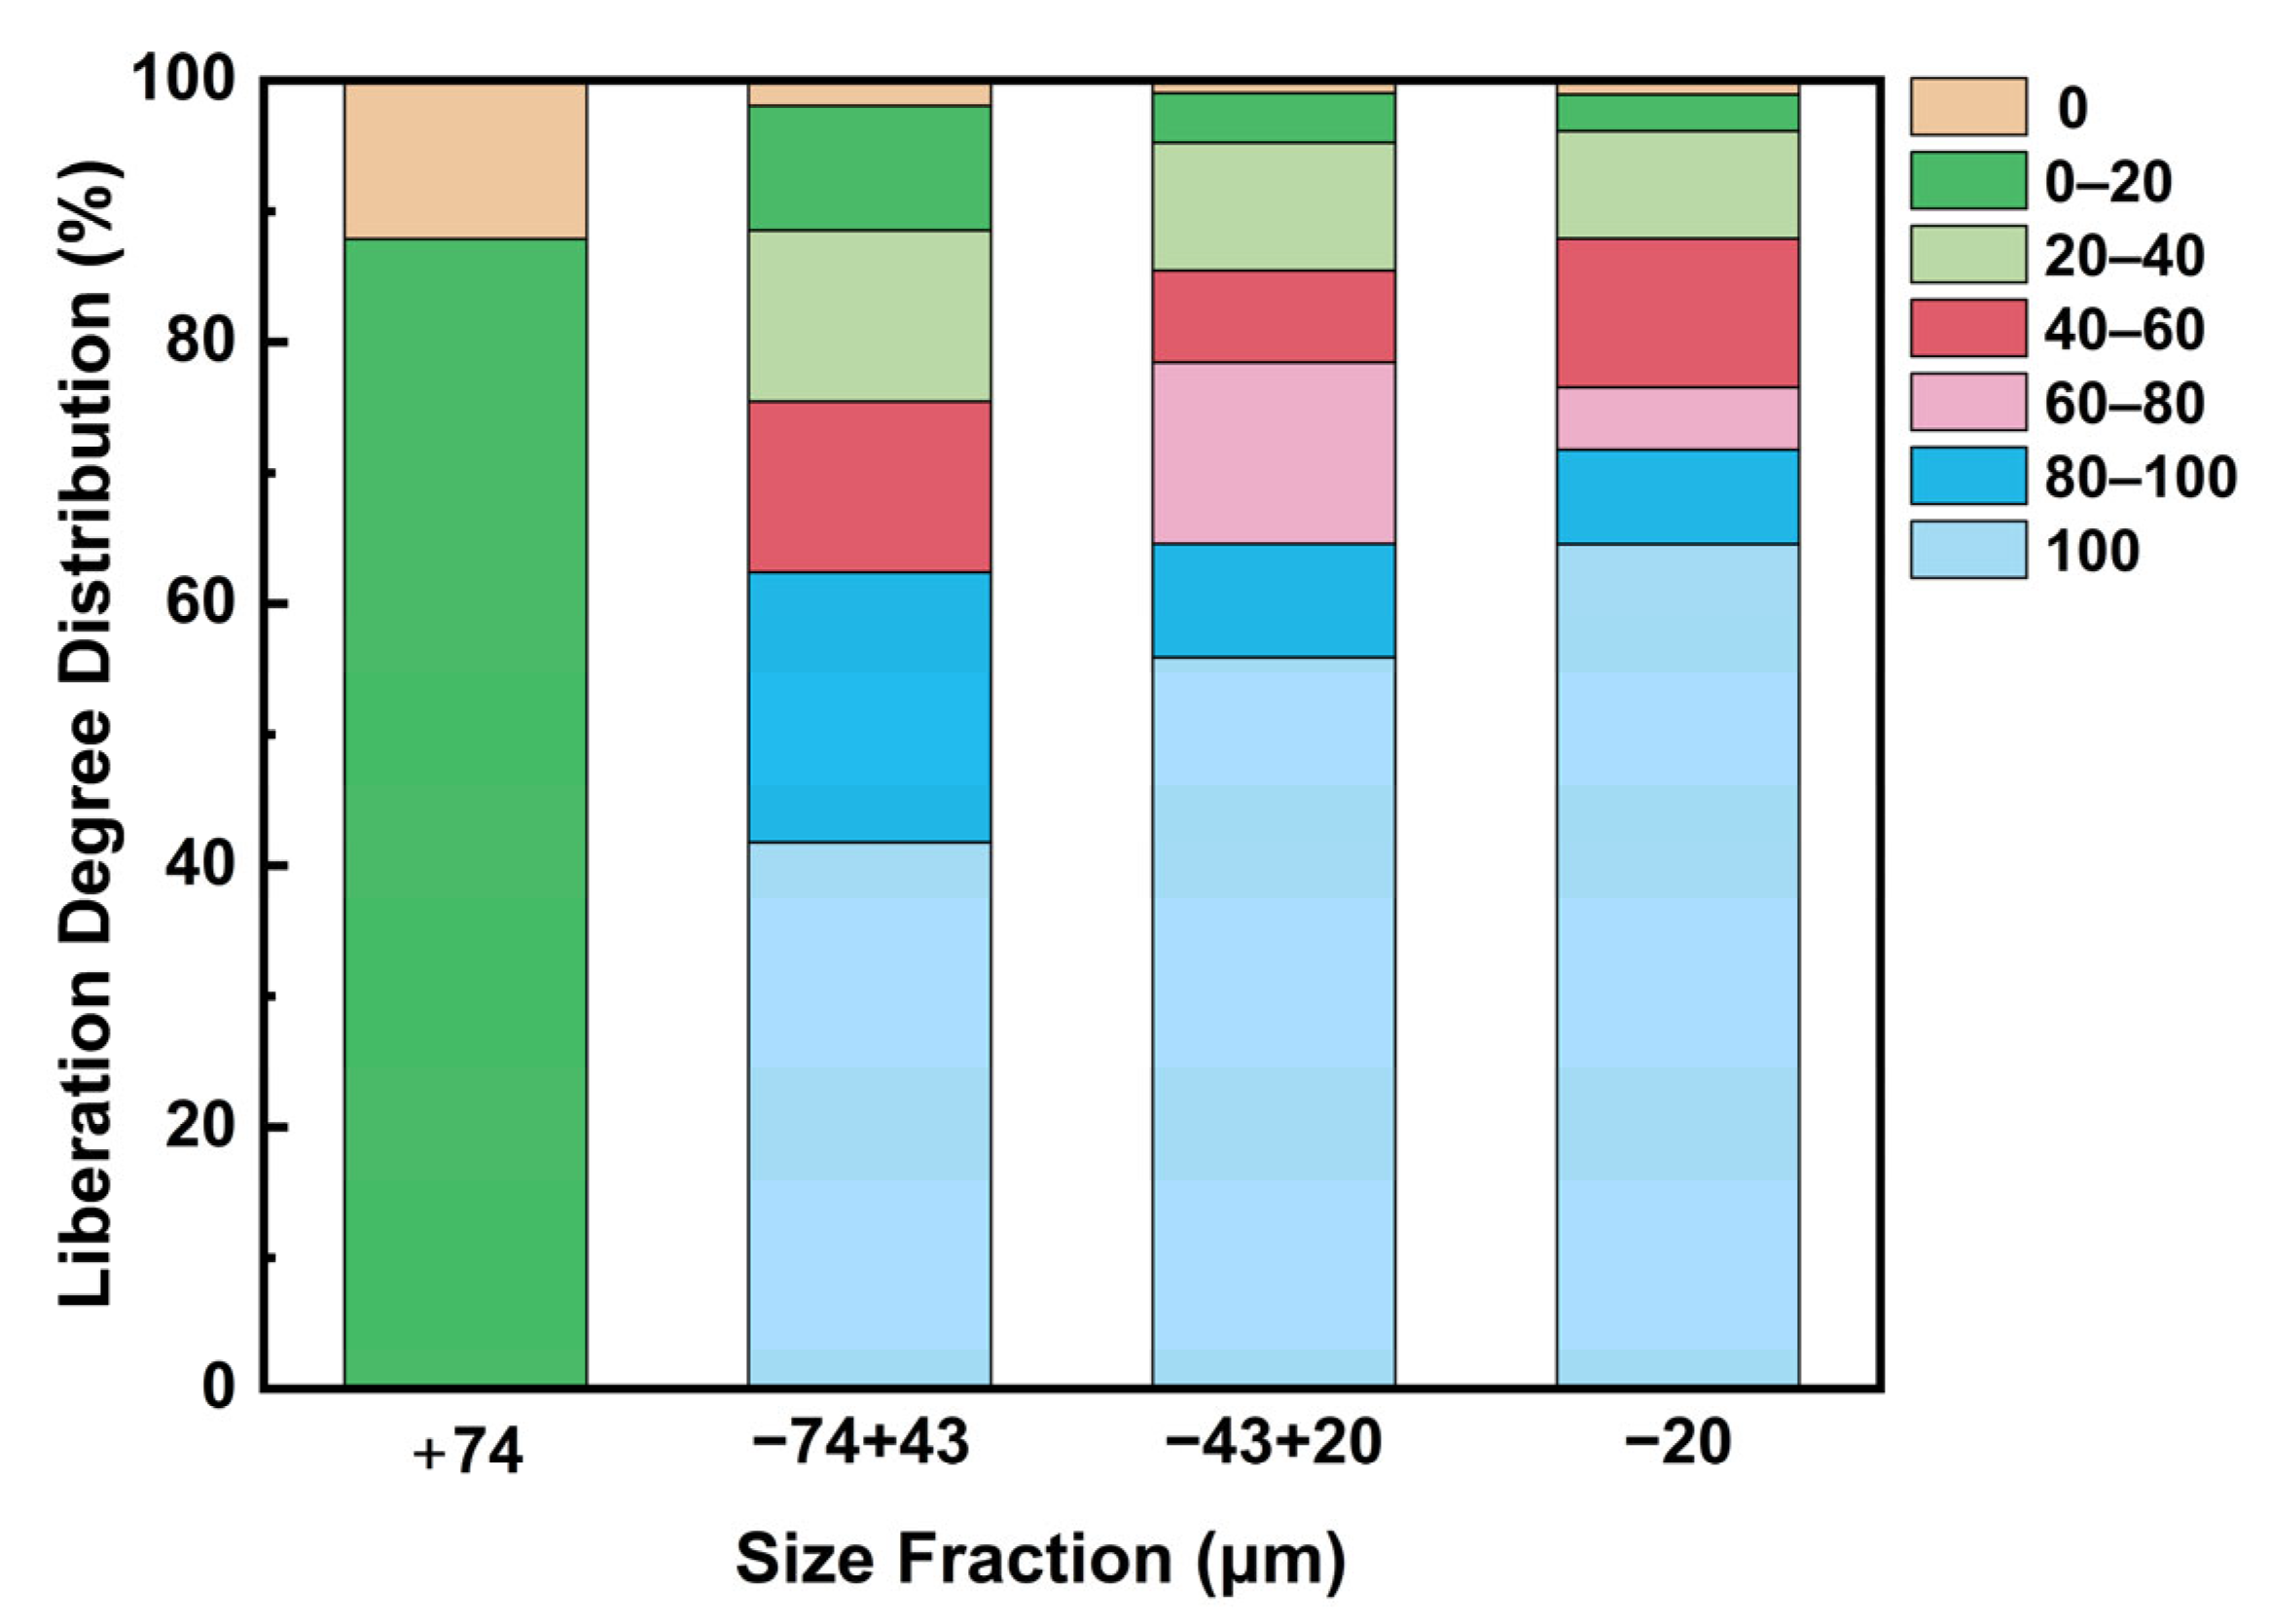
The liberation behavior of niobium-bearing minerals in each size fraction is analyzed in Figure 9.
As shown in Figure 9, the proportion of niobium-bearing minerals with a liberation degree higher than 80% reached 71.76% in the −20 μm fraction, 64.56% in the −43 + 20 μm fraction, and 62.40% in the −74 + 43 μm fraction. In contrast, the liberation degree of particles in the +74 μm fraction was consistently below 20%. In general, more than 60% of niobium-bearing minerals in each size fraction achieved a liberation degree above 80%. Although further grinding could improve the overall liberation degree, it would also significantly increase the content of fine particles, which is harmful to subsequent separation. Therefore, further grinding was not performed.

2.4. Experimental Equipment

The experimental equipment used in this study included a wet drum low-intensity magnetic separator (RK/CZS-Φ450×540, Wuhan Rock Grinding Equipment Manufacturing Co., Ltd., Wuhan, Hubei, China), a disk filter (RK/ZL-ϕ260/ϕ200, Wuhan Rock Grinding Equipment Manufacturing Co., Ltd., Wuhan, China), an electric heating forced-air drying oven (DHG-9070B, Zhongyi Guoke (Beijing) Technology Co., Ltd., Beijing, China), a three-head grinder (RK/ZL-ϕ120×3, Wuhan Rock Grinding Equipment Manufacturing Co., Ltd., Wuhan, Hubei, China), an electronic balance (YP1002, Shanghai Yueping Scientific Instrument (Suzhou) Manufacturing Co., Ltd., Suzhou, Jiangsu, China), a single-cell flotation machine (Type XFD IV, Jilin Provincial Geological Prospecting Machinery Factory, Changchun, Jilin, China), a multi-cell flotation machine (XFD-12, Jiangxi Victor International Mining Equipment Co., Ltd., Ganzhou, Jiangxi, China), an X-ray fluorescence spectrometer (ZSX Primus II 03030429, Rigaku Corporation, Tokyo, Japan), and an automatic analyzer for elemental occurrence state and process mineral parameters (BPMA V2.7.10, BGRIMM Technology Group Co., Ltd., Beijing, China).

3. Results

The single-factor test method was adopted in this study. It should be noted that the single-factor testing approach adopted in this study does not account for potential interactive effects among variables. This limitation is a consequence of the restricted quantity of the available ore sample. When sufficient samples become accessible, multivariate experimental designs are recommended for further process optimization.

3.1. Collector Comparison Test

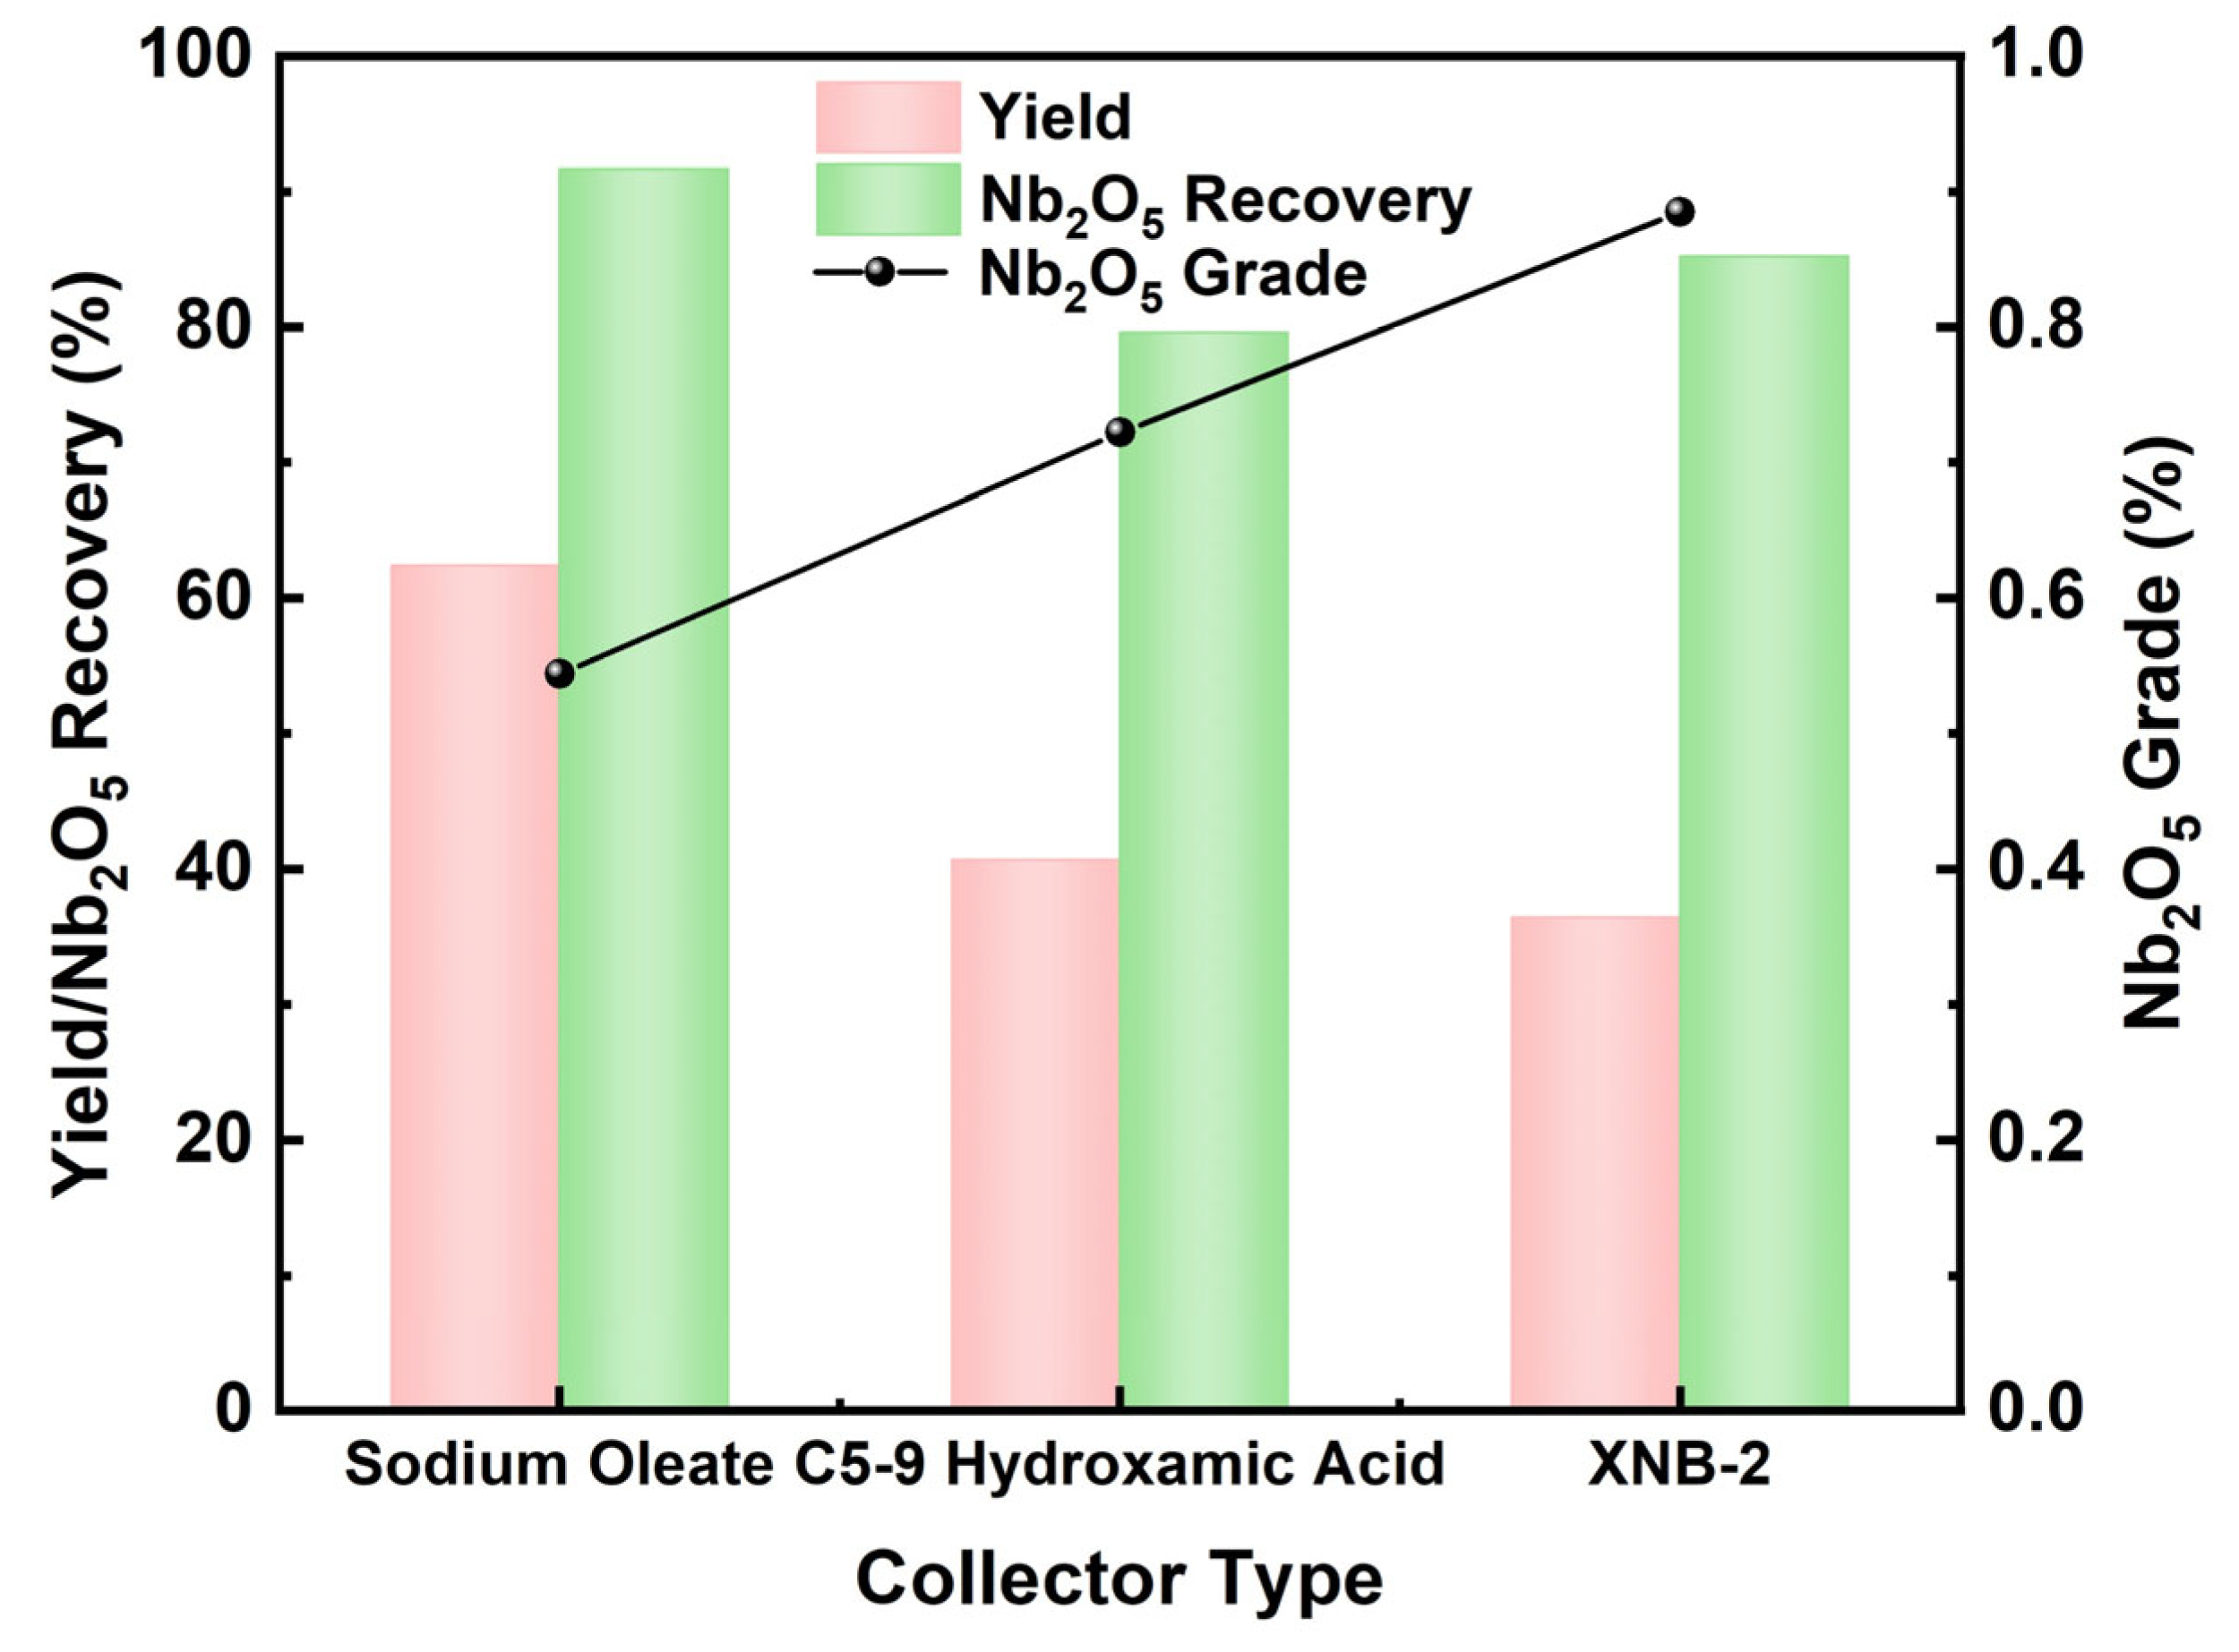
Flotation was employed as the primary method for niobium beneficiation, with magnetic separation as an auxiliary means to improve the quality of the concentrate. As collectors for niobium-bearing minerals, both hydroxamic acids and fatty acids exhibit favorable performance on columbite, pyrochlore, and other niobium minerals. In the flotation tests, XNY-1 was used as the depressant, XNH-2 as the activator, and industrial No. 2 oil (terpenic alcohol) as the frother. The three collectors tested were C5–9 hydroxamic acid, sodium oleate, and a self-synthesized hydroxamic acid reagent, XNB-2. The optimum flotation results obtained with these three collectors are shown in Figure 10.
As shown in Figure 10, sodium oleate, as a collector for niobium-bearing minerals, exhibited good collecting performance but poor selectivity. In contrast, C5–9 hydroxamic acid showed relatively weak collecting performance but better selectivity than sodium oleate. The self-synthesized reagent XNB-2 exhibited the highest selectivity for niobium-bearing minerals along with relatively good collecting performance, yielding an optimal flotation result of 0.885% Nb2O5 grade and 85.22% recovery. Therefore, XNB-2 was selected for the subsequent condition tests.

3.2. Flotation Concentration Test

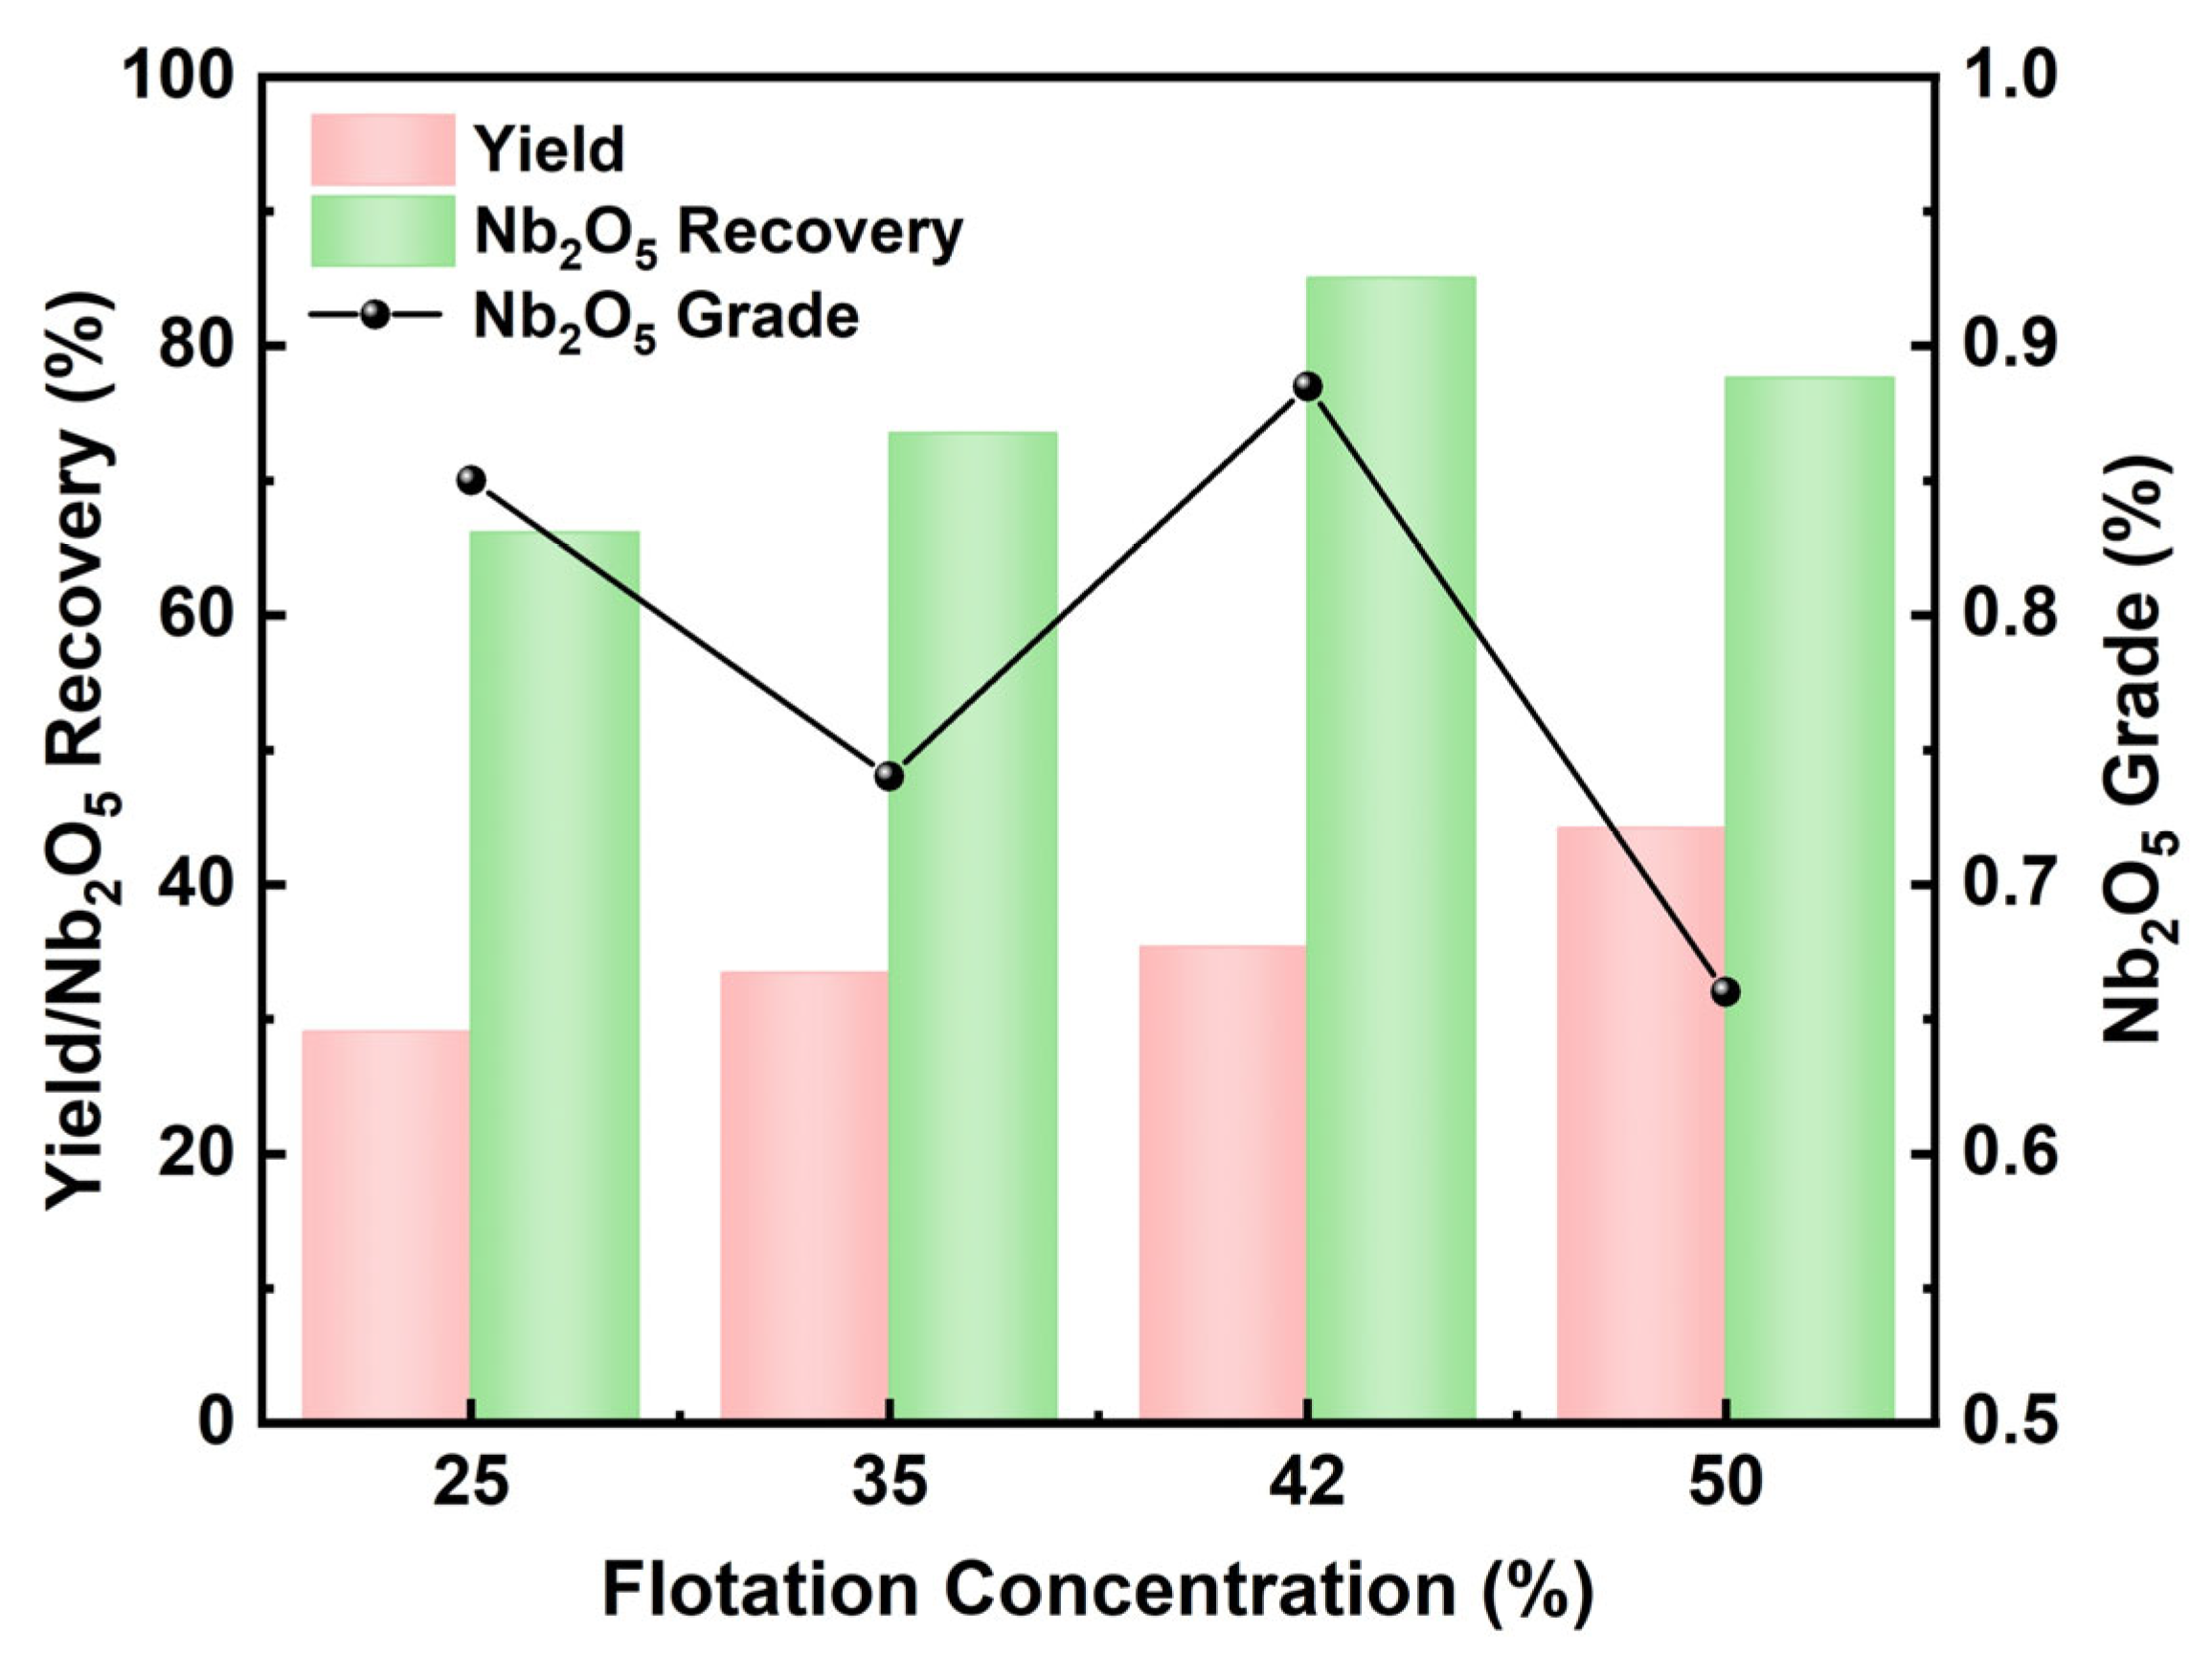
Based on the relatively optimal flotation conditions determined in earlier exploratory tests on a small quantity of high-grade aeschynite-type ore samples, the provisional flotation conditions were set as follows: flotation temperature of 60 °C, activator XNH-2 dosage of 1.33 kg/t, depressant XNY-1 dosage of 0.53 kg/t, collector XNB-2 dosage of 5.33 kg/t, and No. 2 oil frother dosage of 36 g/t. Under these fixed conditions, flotation tests with different pulp concentrations were conducted to determine the preferred flotation concentration, and the experimental results are presented in Figure 11.
As shown in Figure 11, with increasing pulp concentration, the tailing yield gradually decreased, while the Nb2O5 grade in the tailings initially decreased and then rose. At a pulp concentration of 42%, the flotation concentrate exhibited relatively favorable metallurgical performance; therefore, 42% was adopted as the preferred flotation pulp concentration. Subsequent condition tests were then conducted to optimize other variables stepwise on this basis.

3.3. Activator Dosage Test

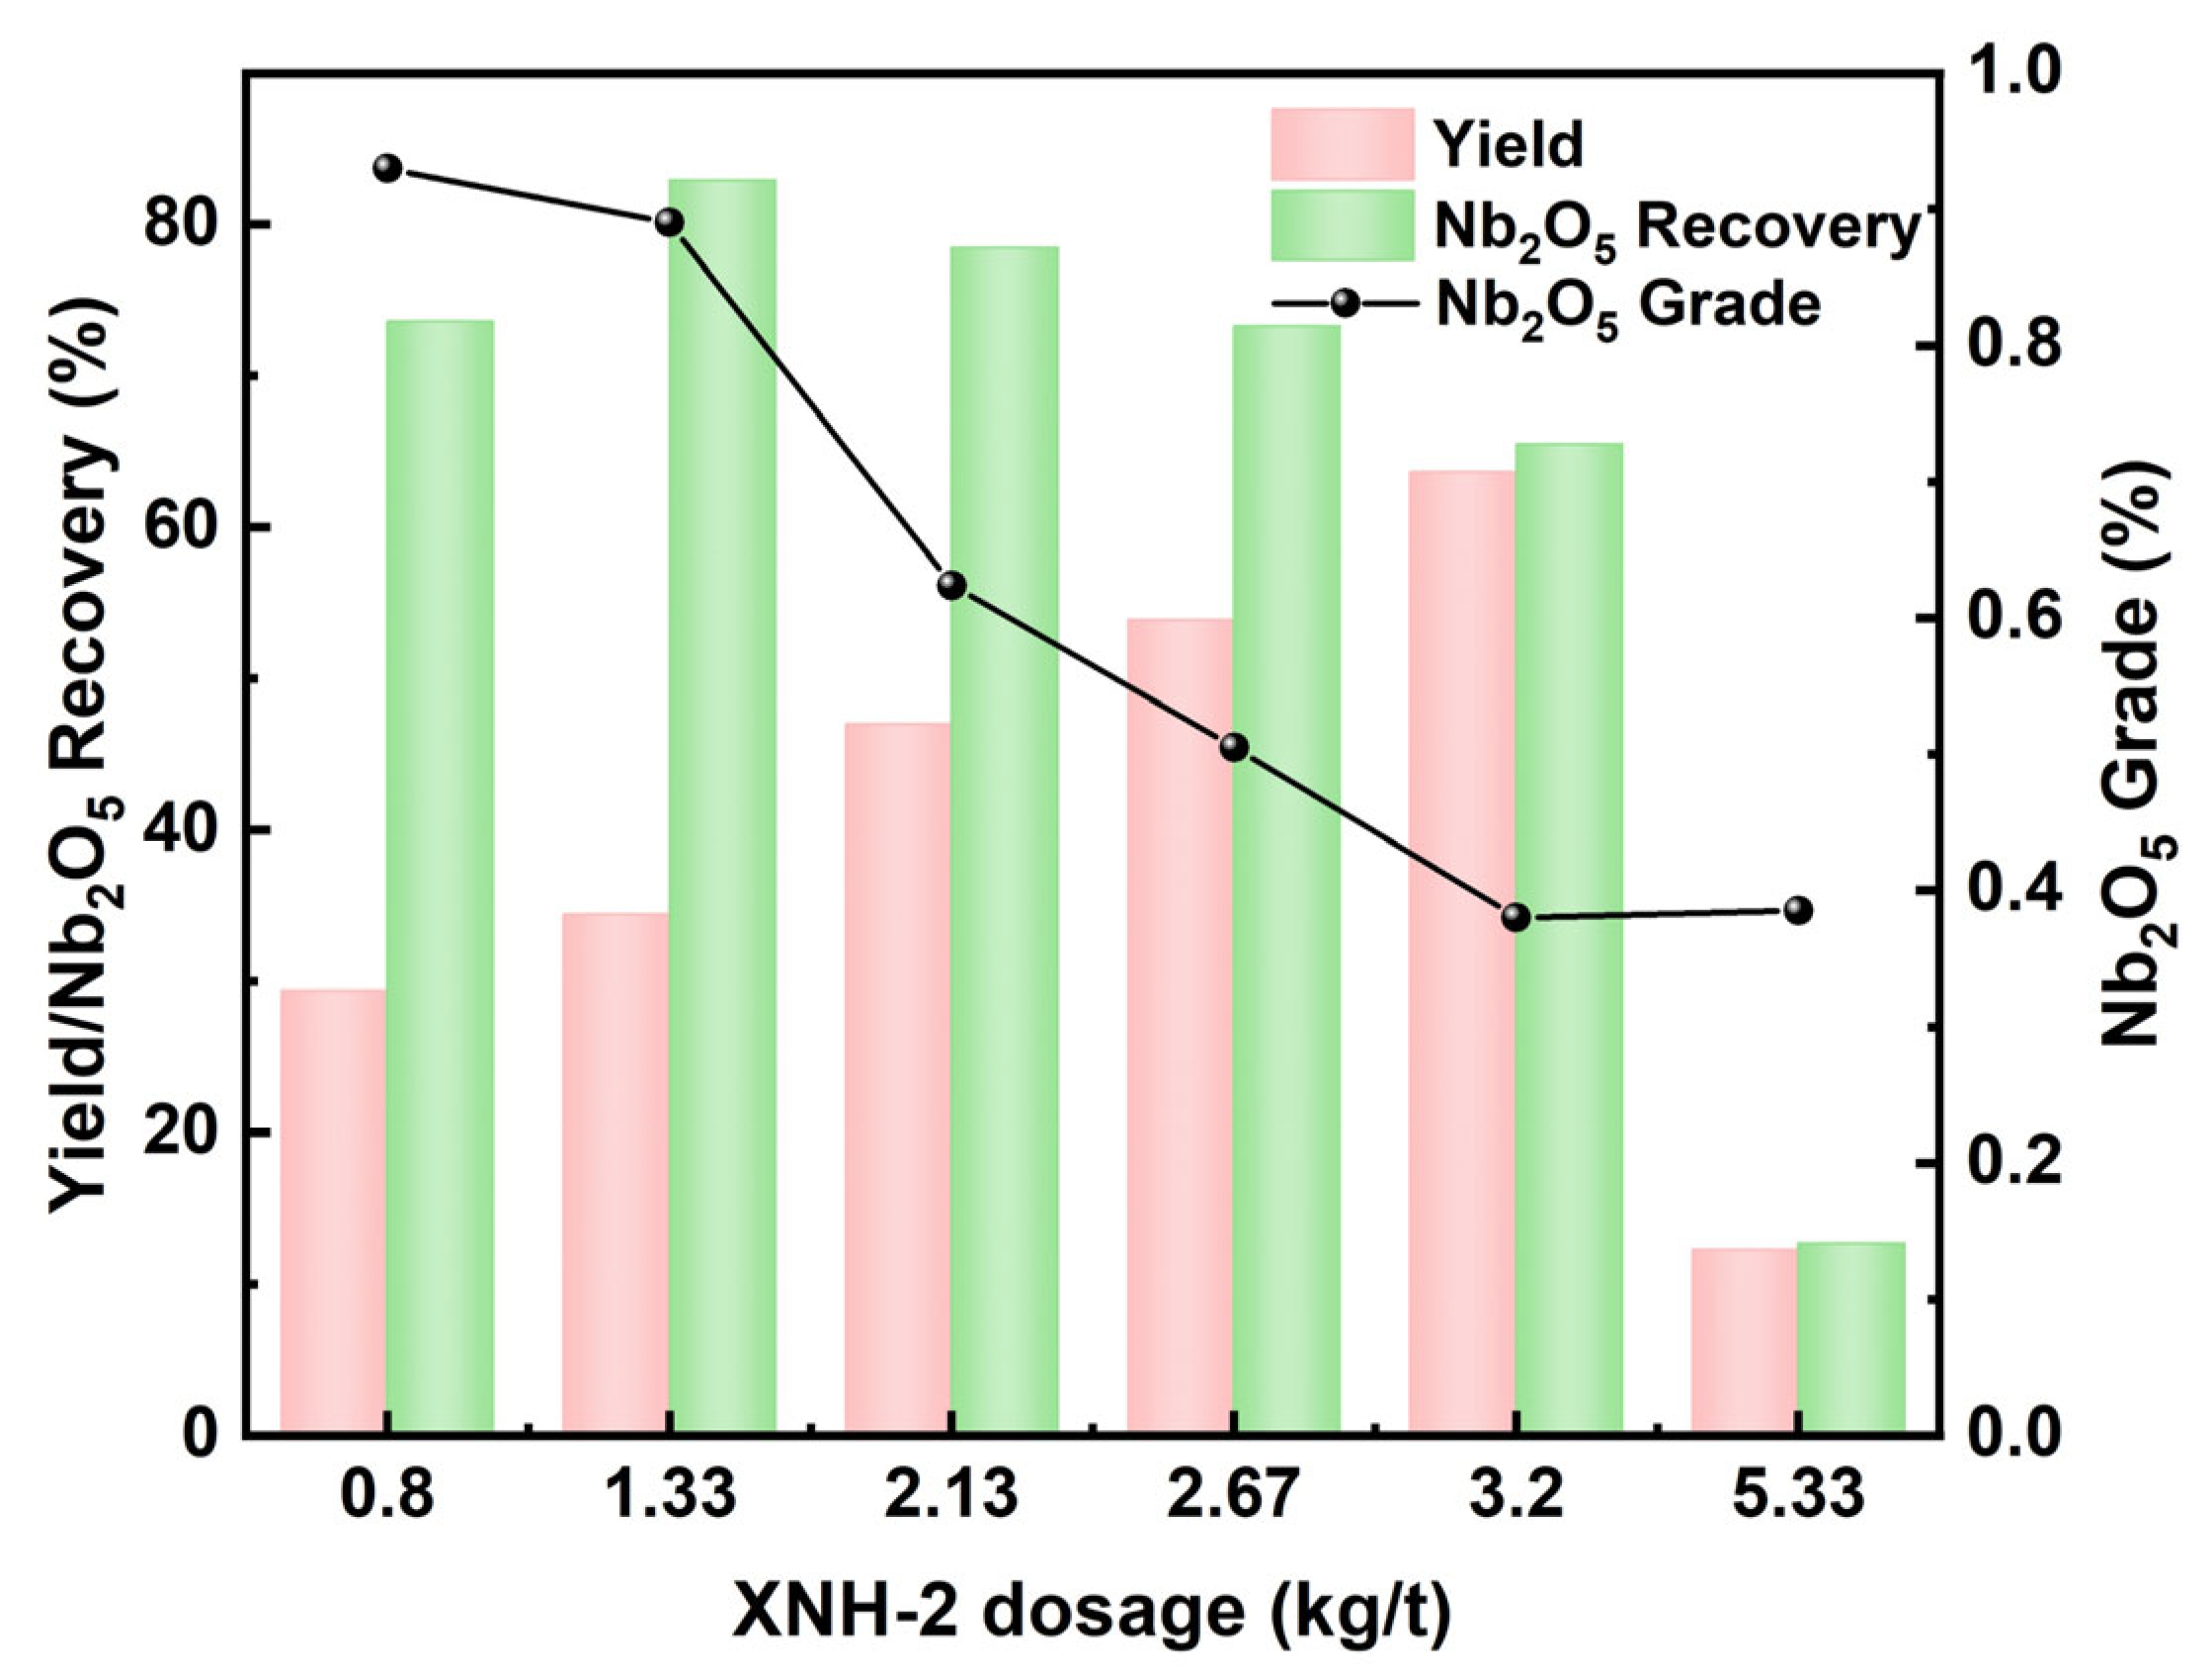
Flotation tests with different activator dosages were carried out, and the experimental results are shown in Figure 12.
As shown in Figure 12, with decreasing activator XNH-2 dosage, the concentrate yield gradually decreased, the Nb2O5 grade steadily increased, and the niobium recovery declined accordingly. By trading off grade against recovery, 1.33 kg/t was determined as the optimum activator dosage, under which a concentrate yield of 34.41%, an Nb2O5 grade of 0.890%, and a niobium recovery of 82.94% were obtained.

3.4. Depressant Dosage Test

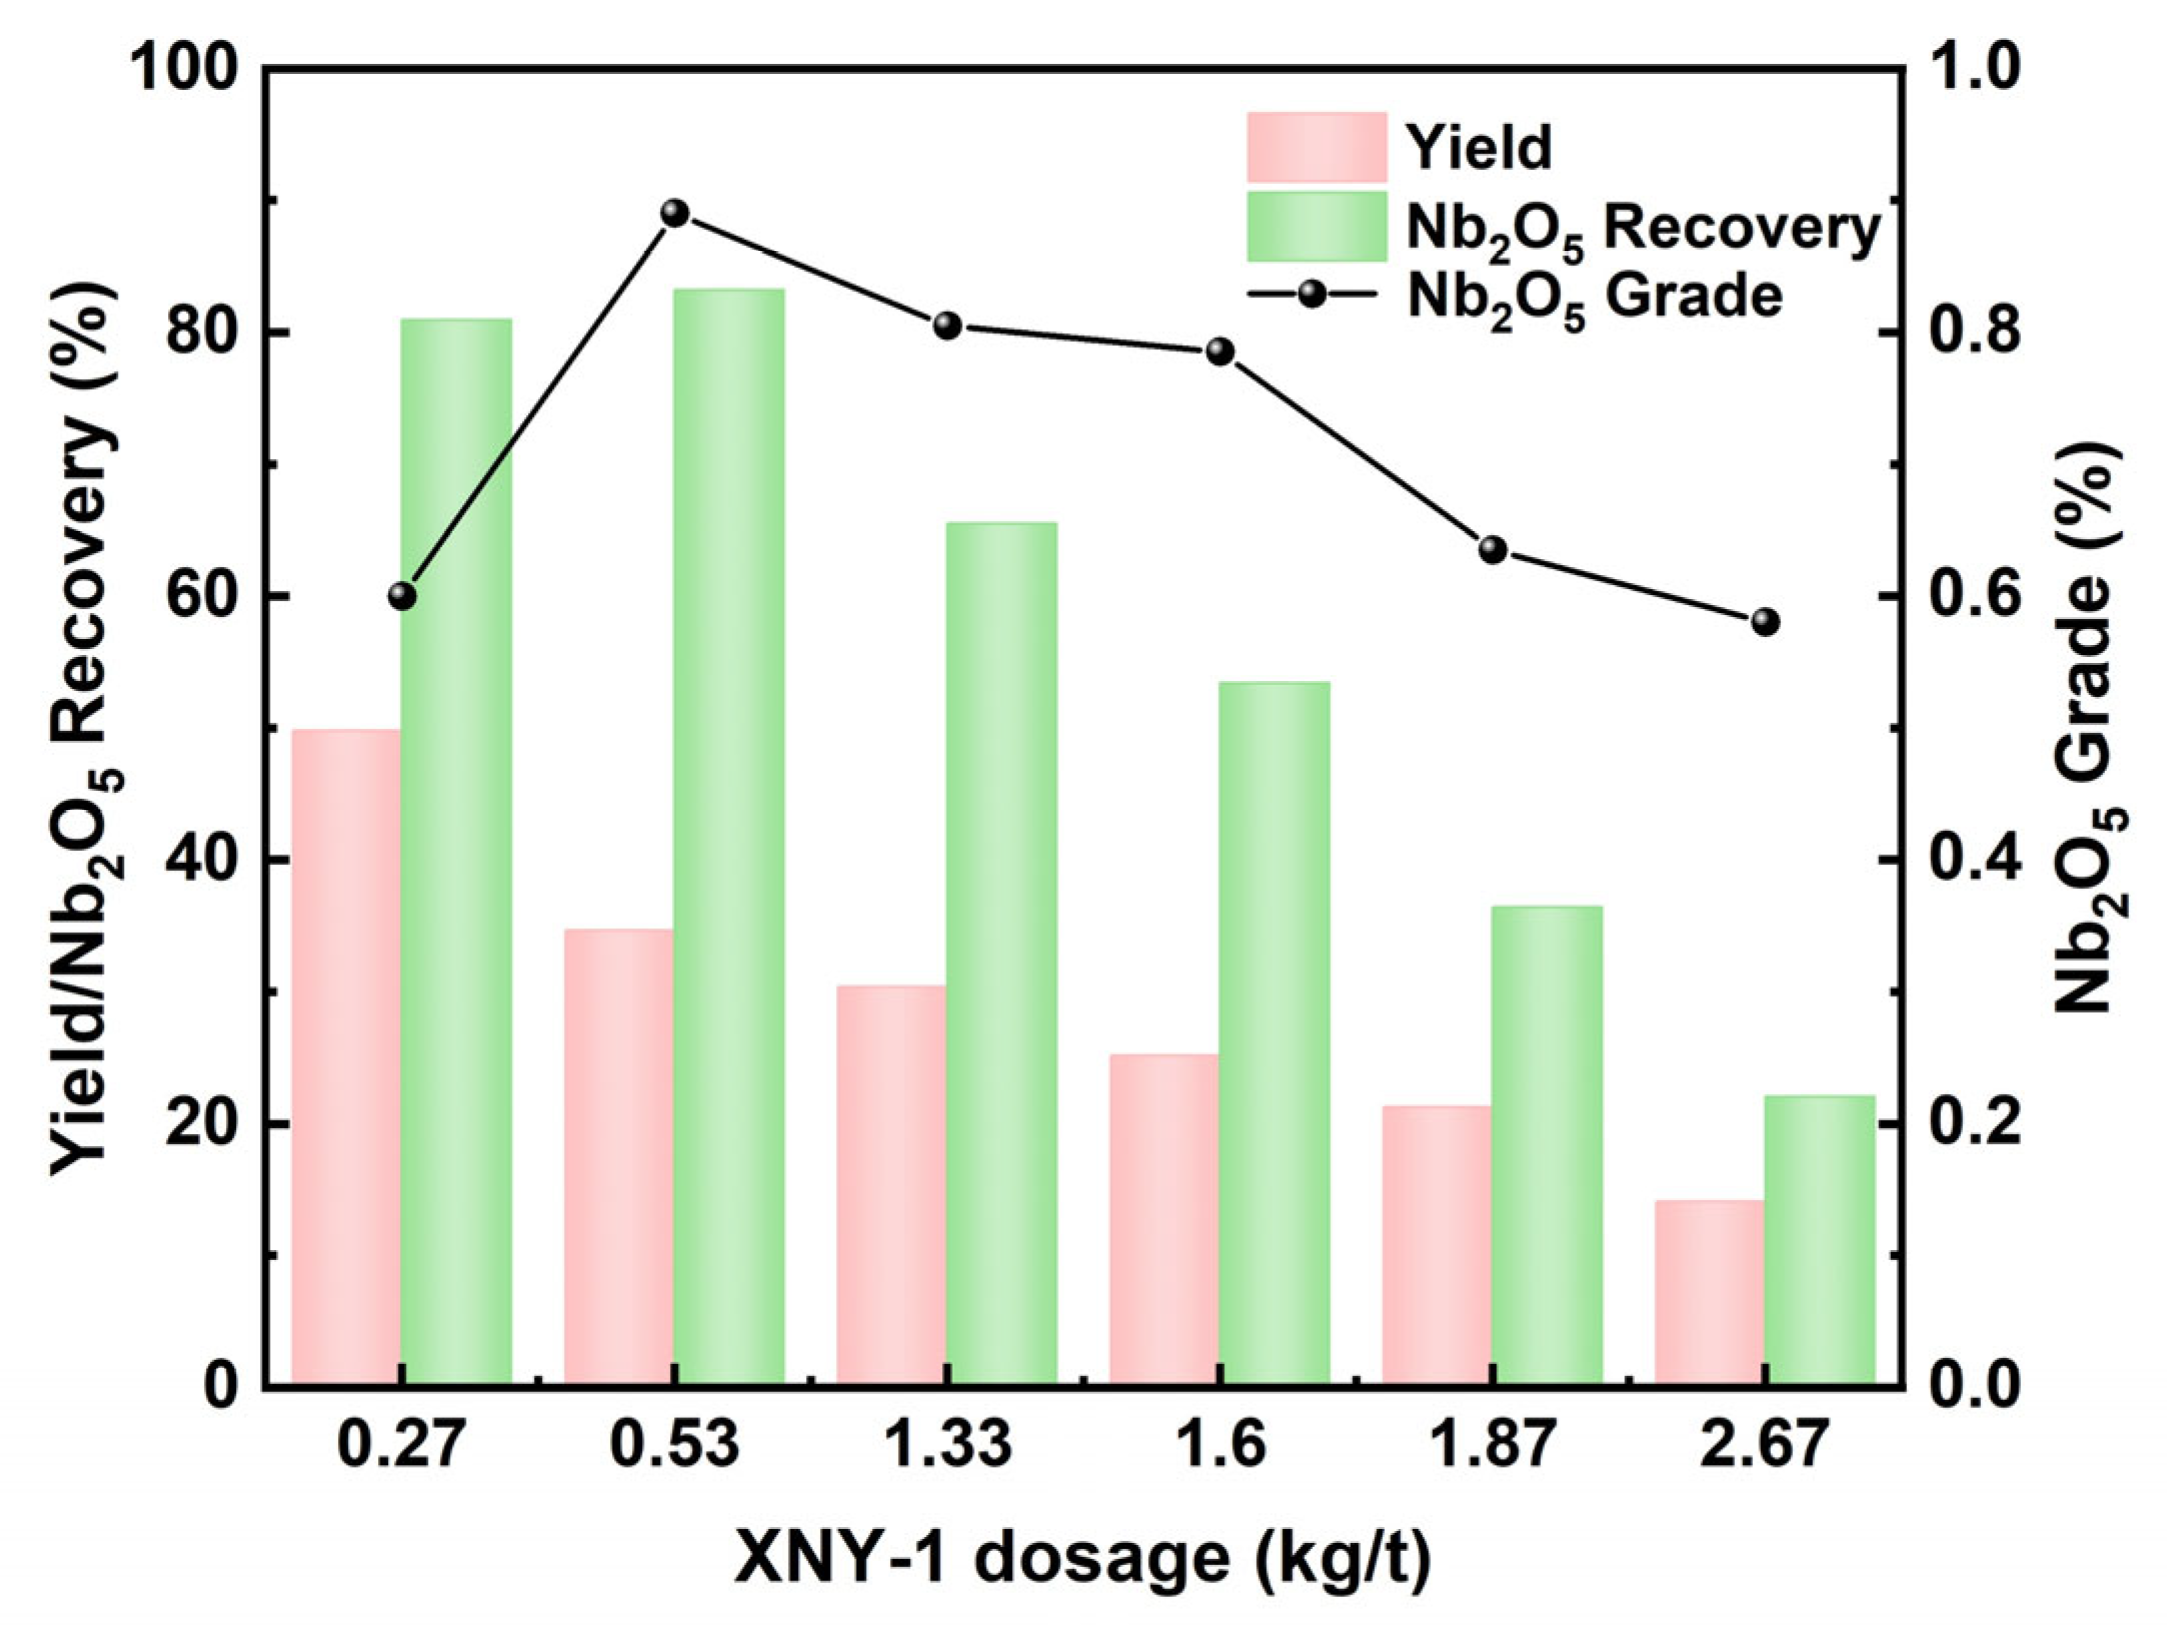
Flotation tests with different depressant dosages were carried out, and the experimental results are shown in Figure 13.
As shown in Figure 13, as the depressant dosage decreased, both the Nb2O5 grade and recovery of the concentrate initially increased and then declined. The optimum depressant dosage of XNY-1 was determined to be 0.53 kg/t. Under this condition, a concentrate yield of 34.66%, an Nb2O5 grade of 0.890%, and a recovery of 83.25% were obtained.

3.5. Collector Dosage Test

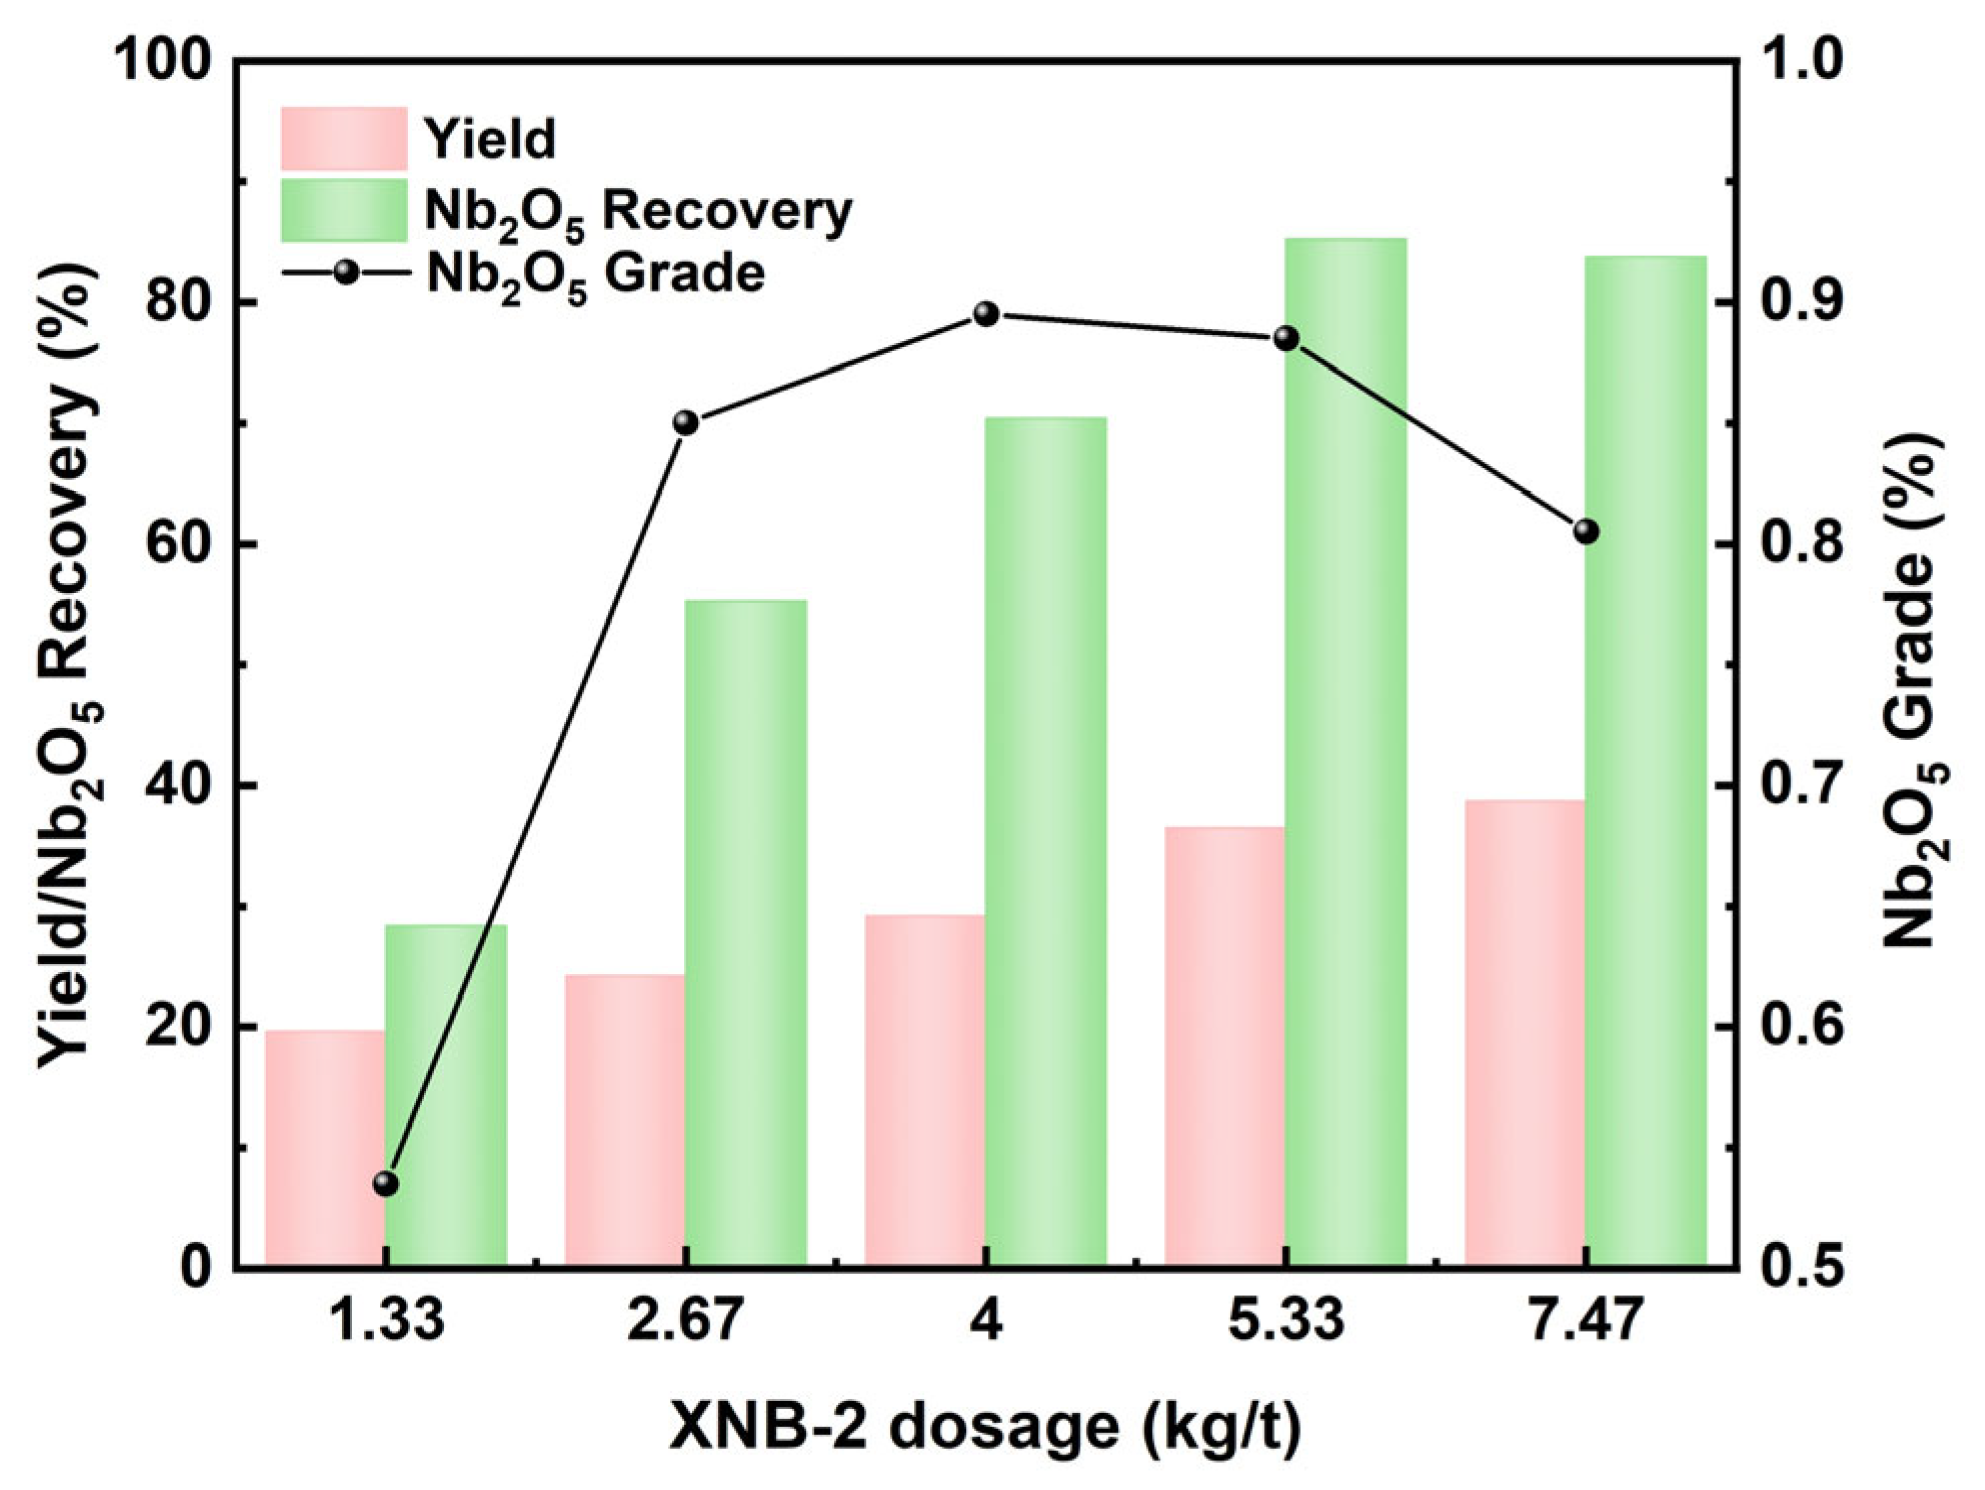
Flotation tests were conducted at various dosages of the collector, and the results are presented in Figure 14.
As shown in Figure 14, as the collector XNB-2 dosage increased, the concentrate yield gradually increased, while both the Nb2O5 grade and recovery initially rose and then declined. The optimum XNB-2 dosage was determined to be 5.33 kg/t, under which a concentrate yield of 36.44%, an Nb2O5 grade of 0.885%, and a recovery of 85.22% were obtained.

3.6. Frother Dosage Test

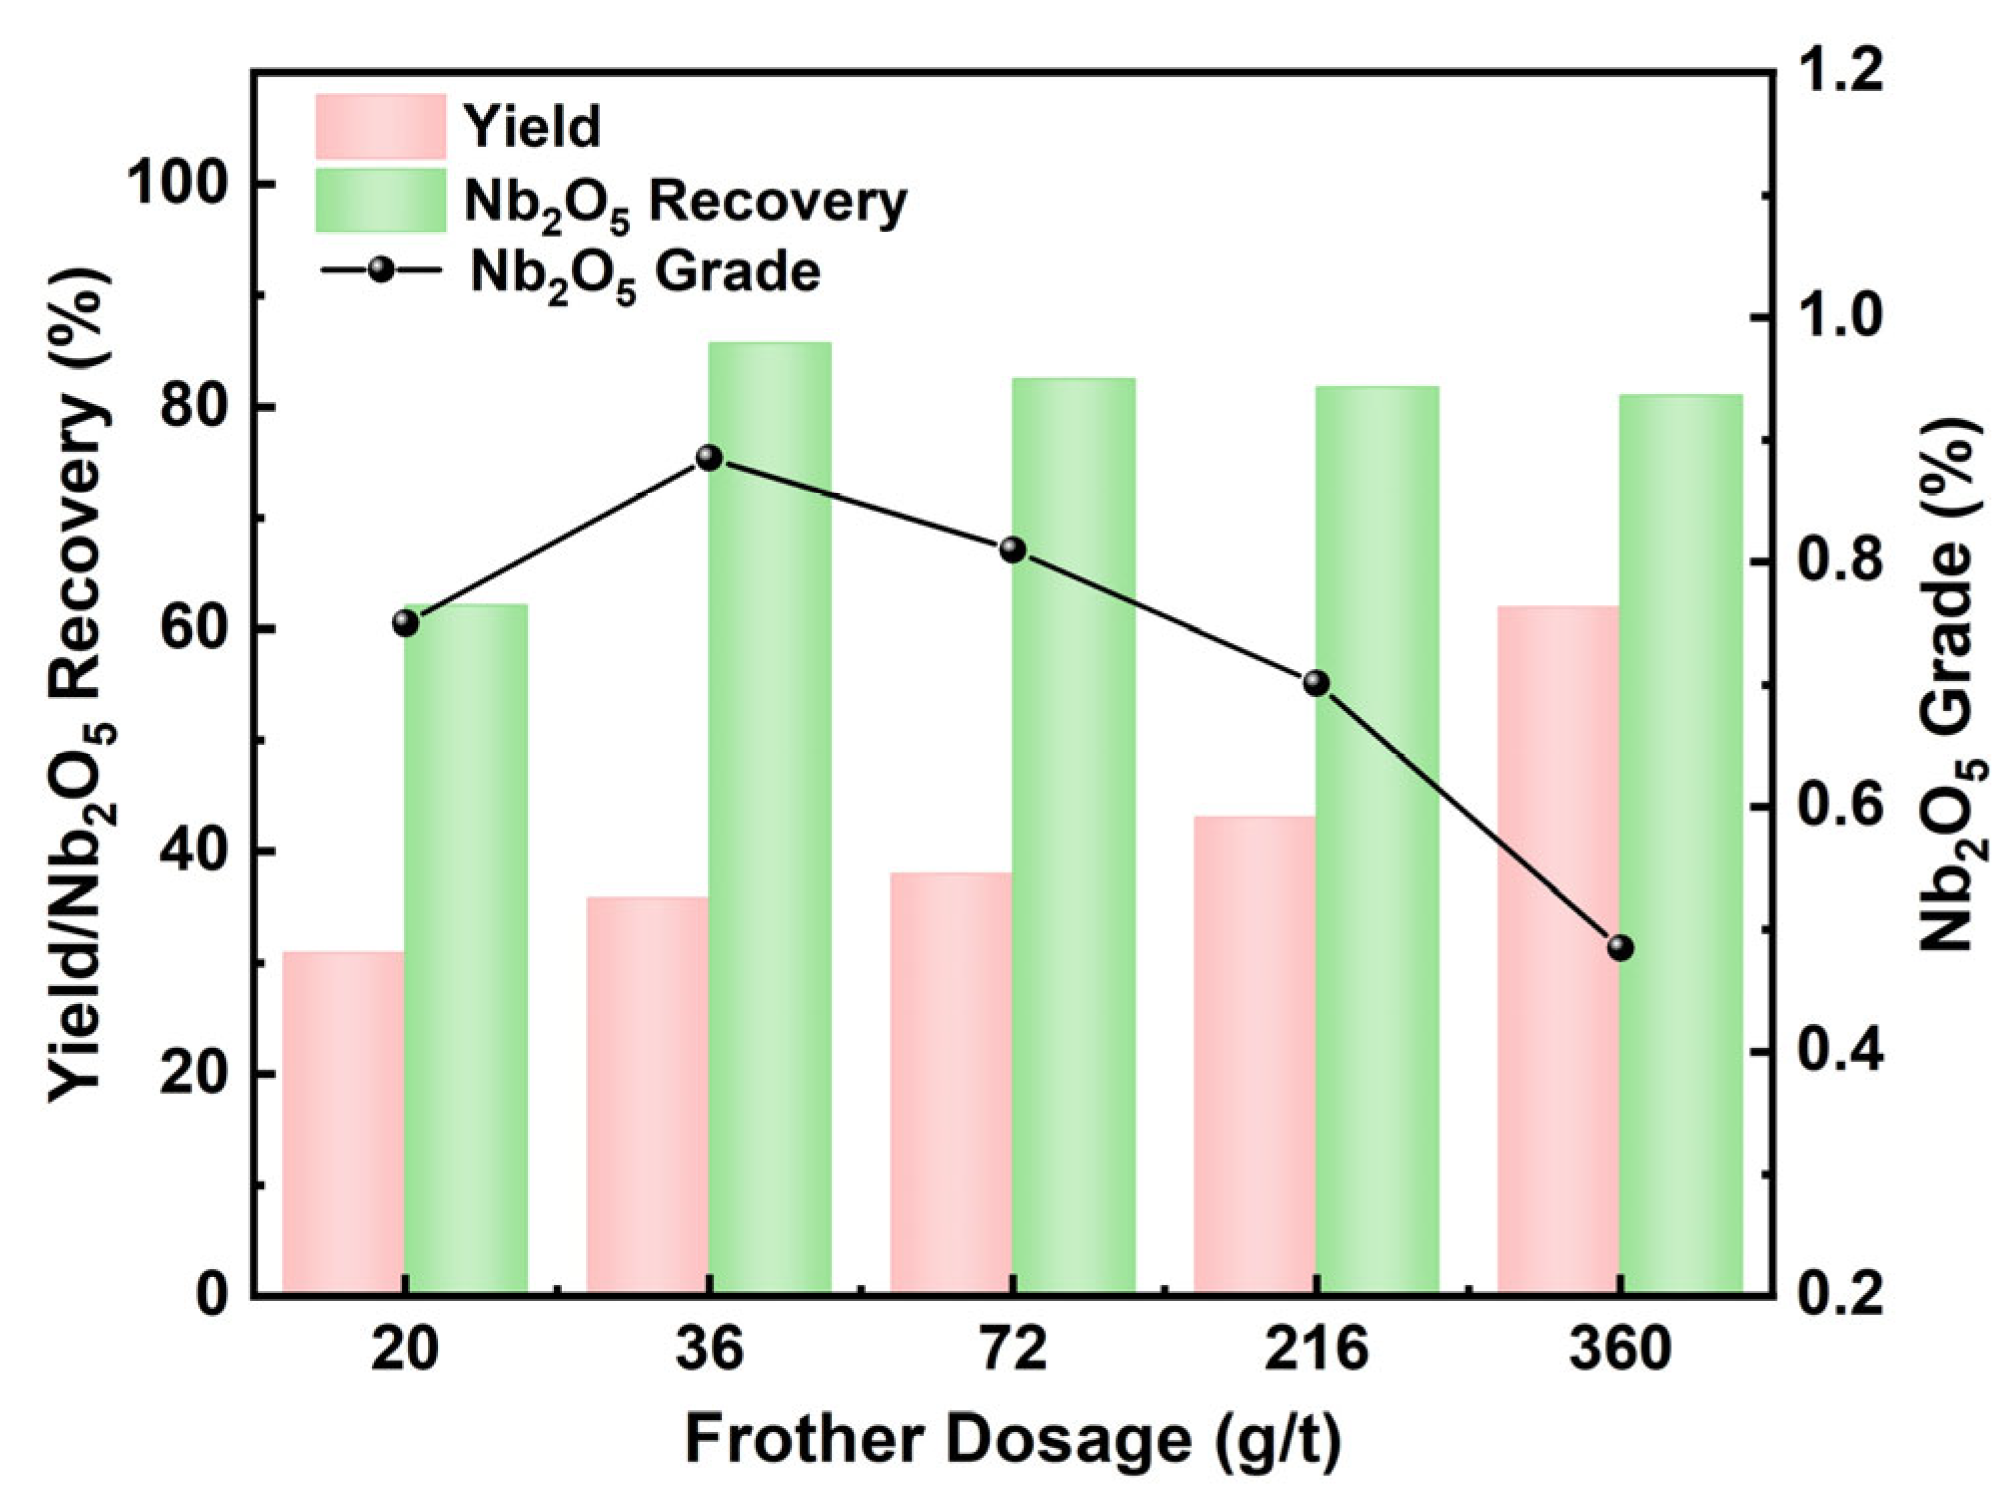
Flotation tests were performed at various dosages of frother, and the results are displayed in Figure 15.
As shown in Figure 15, as the frother dosage increased, the concentrate yield gradually rose, while both the Nb2O5 grade and recovery initially increased and then declined. The optimum frother dosage was determined to be 36.0 g/t, yielding an Nb2O5 grade of 0.885% and a recovery of 85.67%. Chemical analysis of the resulting niobium rougher concentrate showed that it contained 53.19% TFe and 32.86% magnetic Fe, with magnetic iron accounting for 61.78% of the total iron. Therefore, magnetic separation is necessary to further increase the niobium grade of the concentrate.

3.7. Magnetic Separation Tests

The test was performed at a feed concentration of 25% and a magnetic field intensity of 143.28 kA/m. The experimental results are presented in Table 2.
As can be seen from Table 2, after one-stage magnetic separation, an iron concentrate with a TFe grade of 64.40% was obtained, while a niobium concentrate with an Nb2O5 grade of 5.180% and a recovery of 98.44% was achieved.

3.8. Closed-Circuit Tests

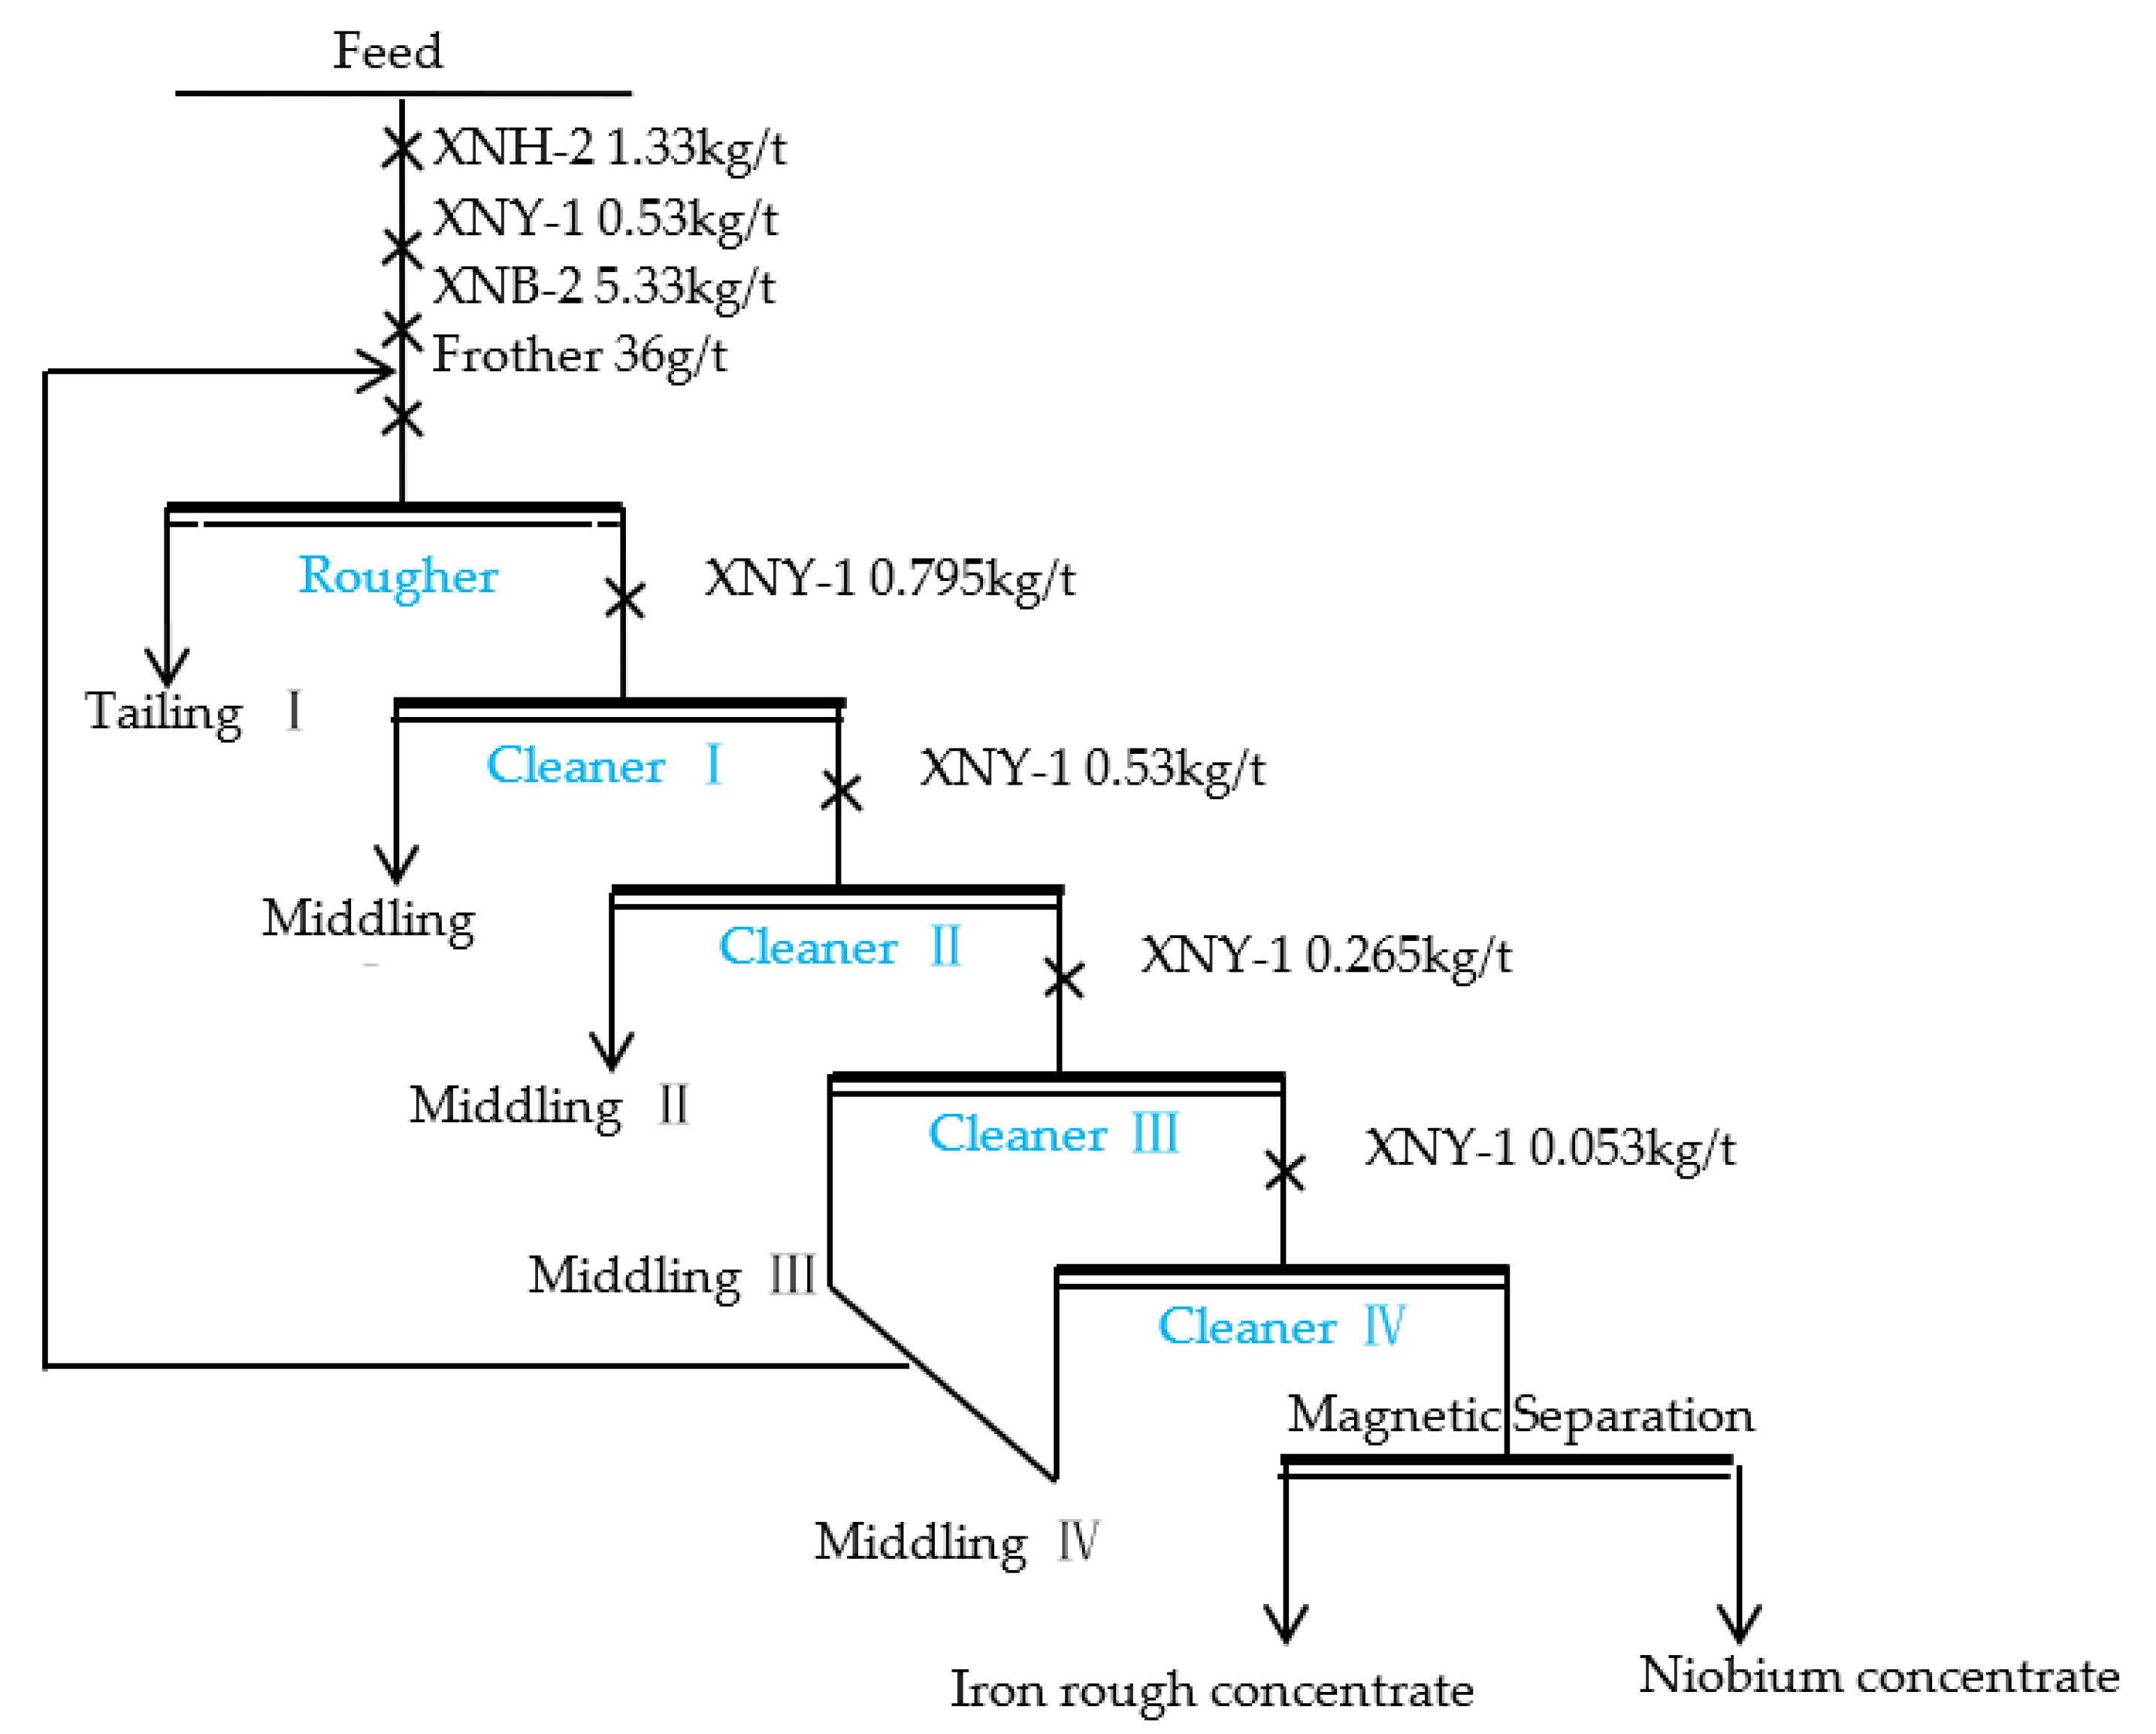
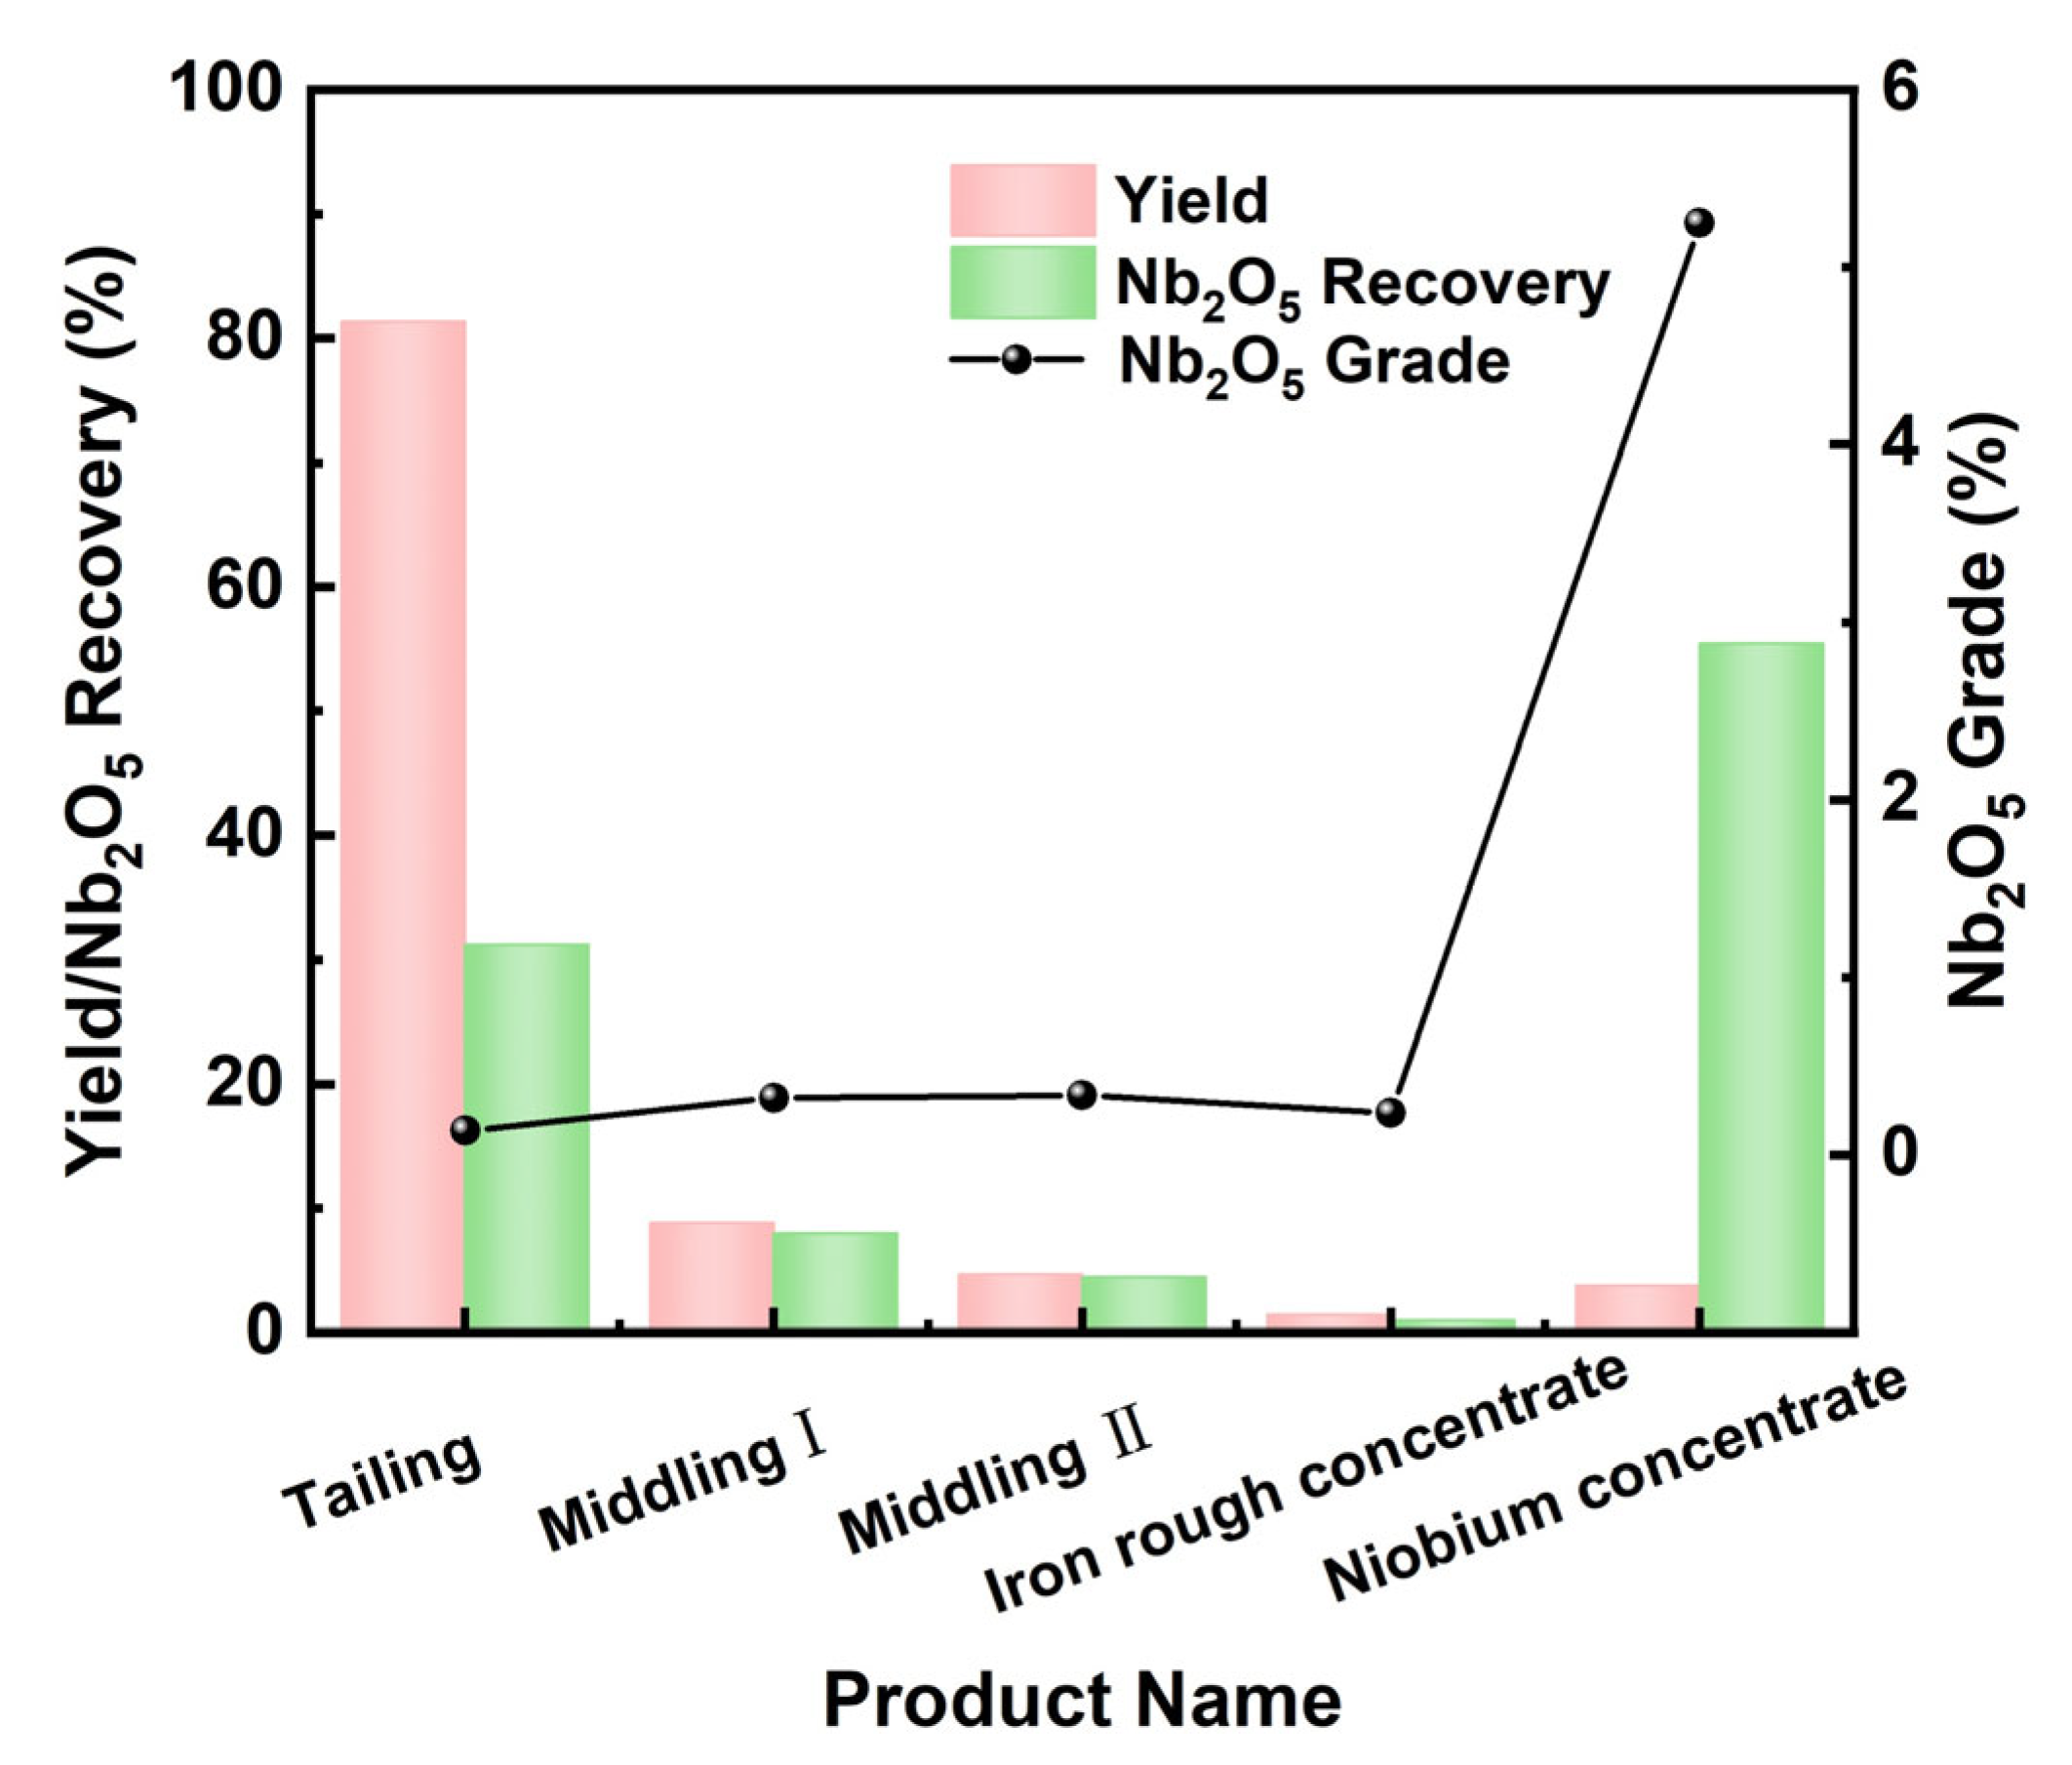
Based on the condition test results, a flowsheet consisting of one rougher and four cleaner flotation stages, followed by one stage of low-intensity magnetic separation, was adopted. A closed-circuit test was then conducted, in which the middlings from the third and fourth cleaner stages were returned to the rougher. Due to the low mineral liberation degree of middling I and middling II, their return would have seriously deteriorated the concentrate grade; therefore, they were not returned to the flotation circuit. The flowchart is shown in Figure 16, and the experimental results are presented in Figure 17.
As shown in Figure 17, a niobium concentrate with an Nb2O5 grade of 5.250% and a recovery of 55.43% was obtained through a flowsheet consisting of one rougher stage, four cleaner stages, and one magnetic separation stage.

4. Discussion

4.1. Niobium Concentrate Analysis

To determine the content of each element in the niobium concentrate, a major element analysis was conducted on the sample, and the analytical results are presented in Table 3.
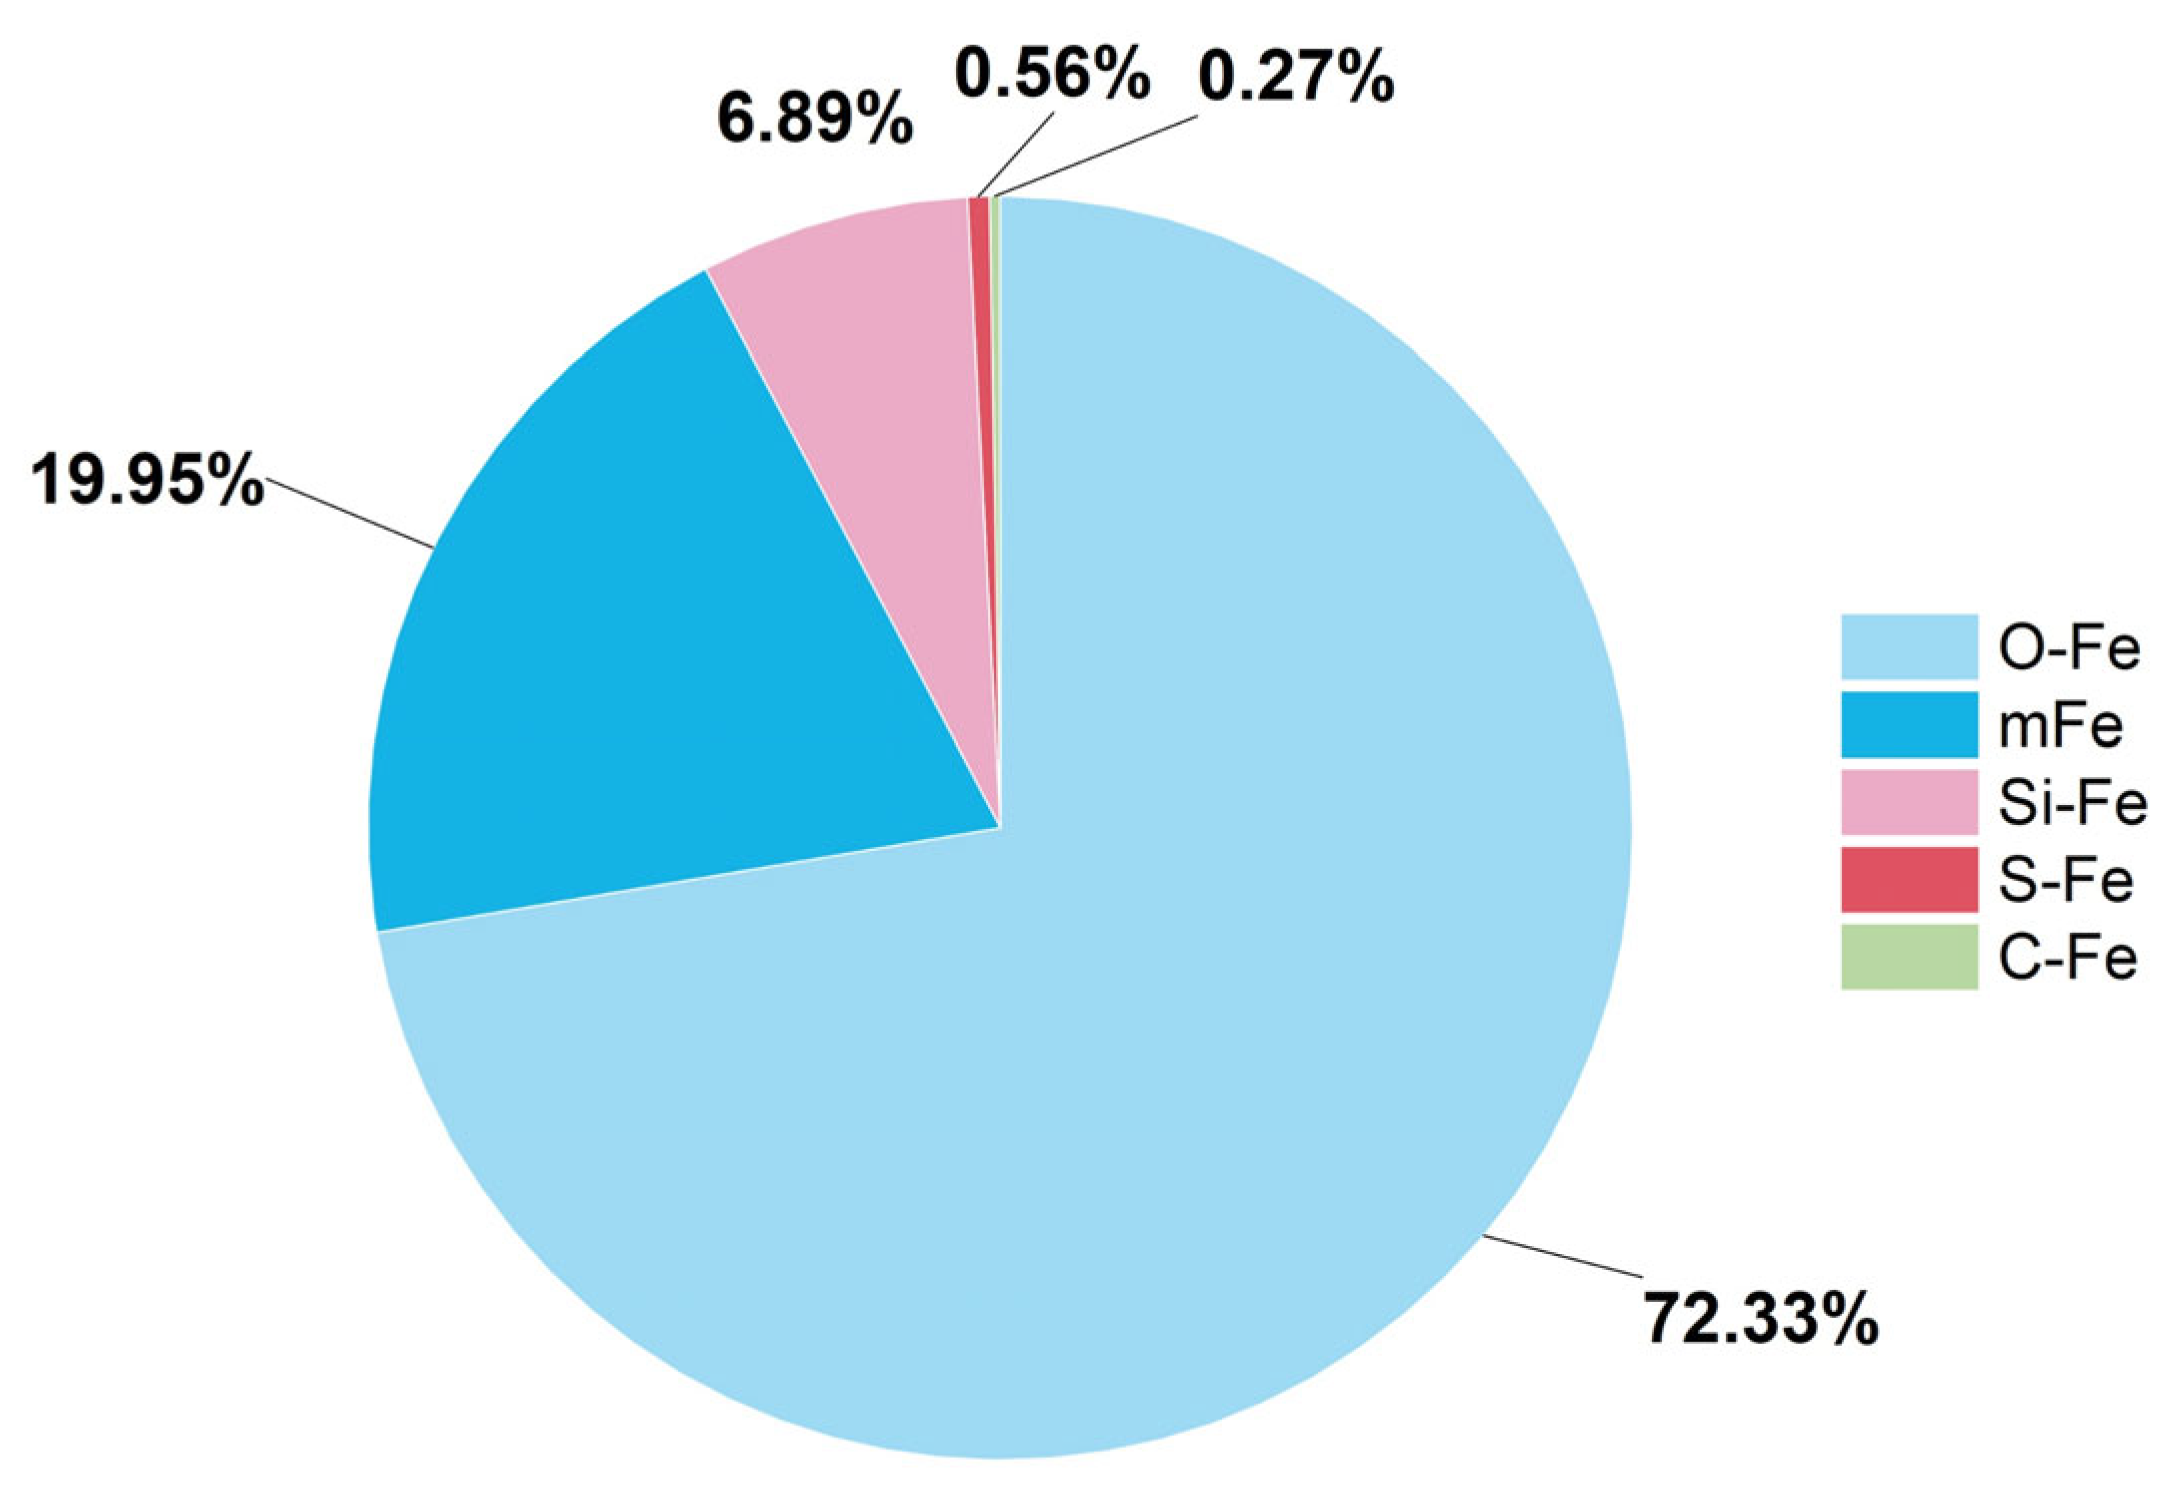
As shown in Table 3, the niobium concentrate has an Nb2O5 grade of 5.250%, a total Fe (TFe) grade of 37.60%, and a TiO2 grade of 12.77%, along with small amounts of calcium, fluorine, sulfur, silicon, and other elements. Given the high iron grade, an iron-phase analysis was performed on the niobium concentrate to identify the forms of occurrence of iron, and the analytical results are listed in Figure 18.
As shown in Figure 18, iron in the niobium concentrate exists predominantly as oxidized iron, accounting for 72.34%, followed by magnetic iron at 19.95%. This iron is mostly present in locked form and cannot be removed by low-intensity magnetic separation. Although a portion could have been removed by high-intensity magnetic separation, the accompanying niobium loss would have been considerable; therefore, high-intensity magnetic separation was not adopted.

4.2. Recovery of Aeschynite Minerals in Niobium Concentrate

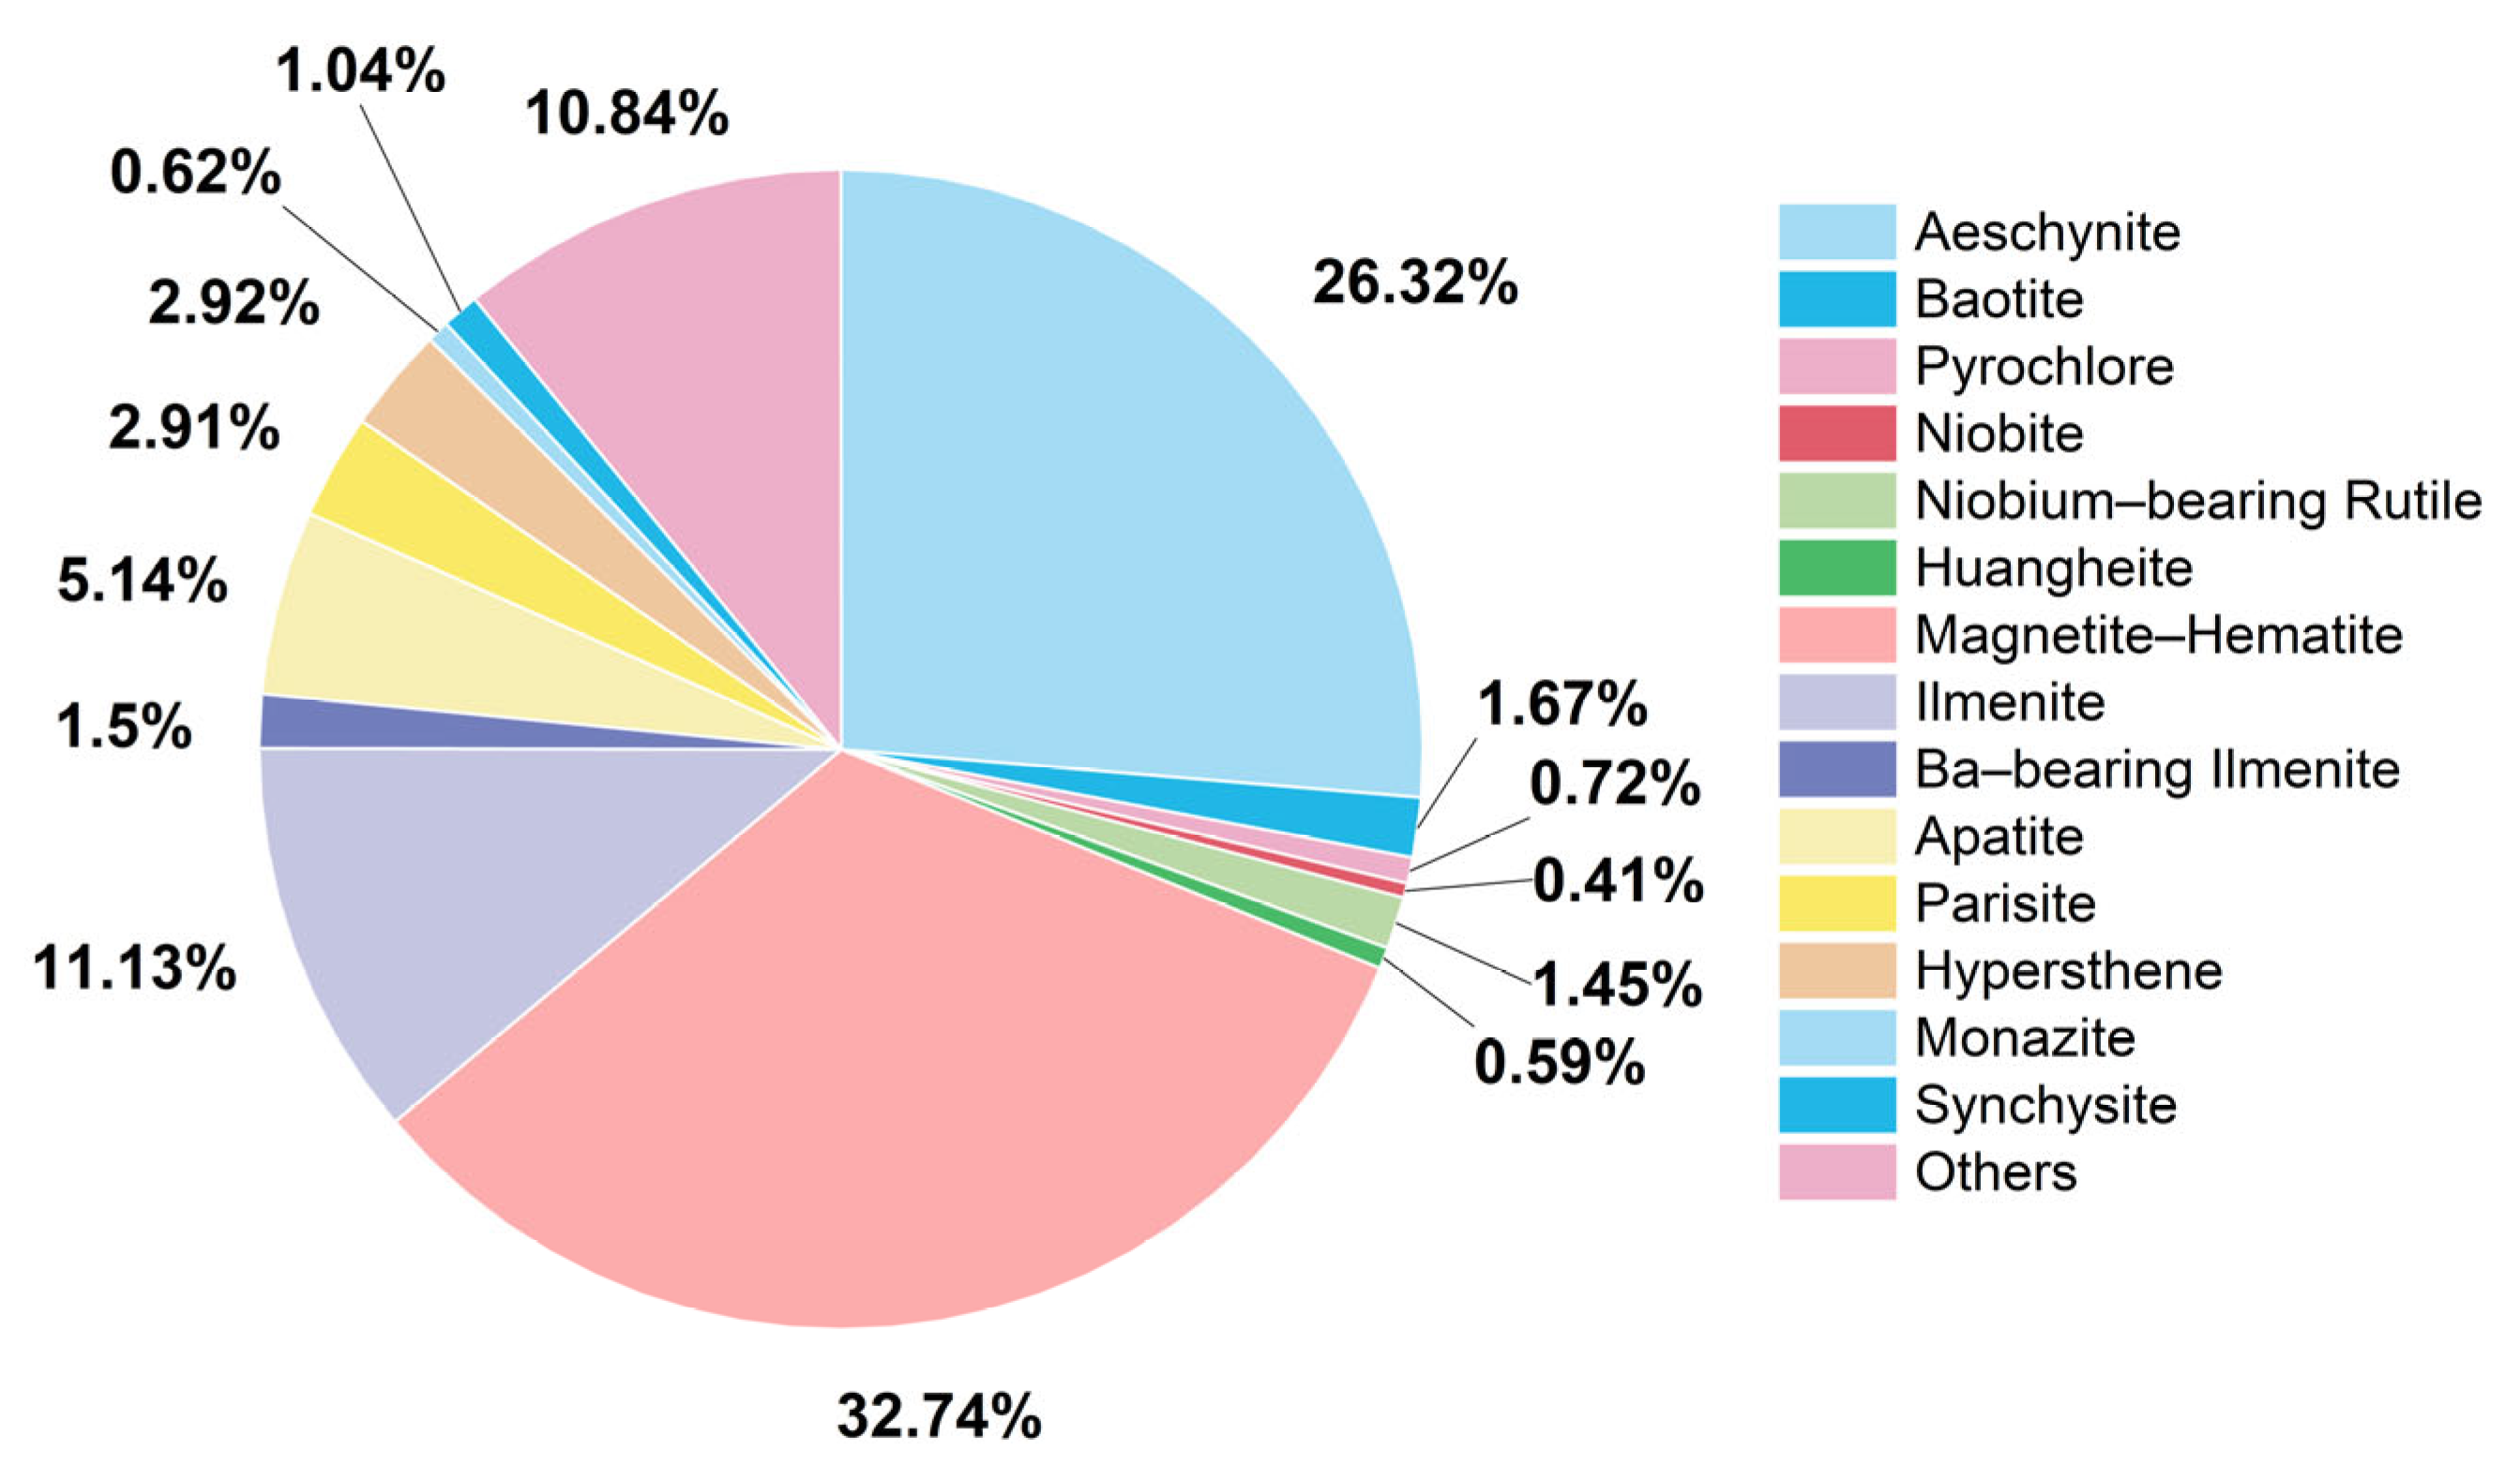
An MLA mineralogical analysis was conducted on the niobium concentrate, and the mineral species and their relative contents are presented in Figure 19.
As shown in Figure 19, the niobium-bearing minerals in the niobium concentrate consist of 0.41% columbite, 1.67% baotite, 26.32% eschynite, 1.45% ilmenorutile, and 0.72% pyrochlore, with a total content of 30.57%. The eschynite content in the niobium concentrate increased from 0.76% in the feed ore to 26.32%, and its proportion among all niobium-bearing minerals rose from 50.67% to 86.10%, indicating the efficient enrichment of eschynite.

4.3. Separation Efficiency Comparison

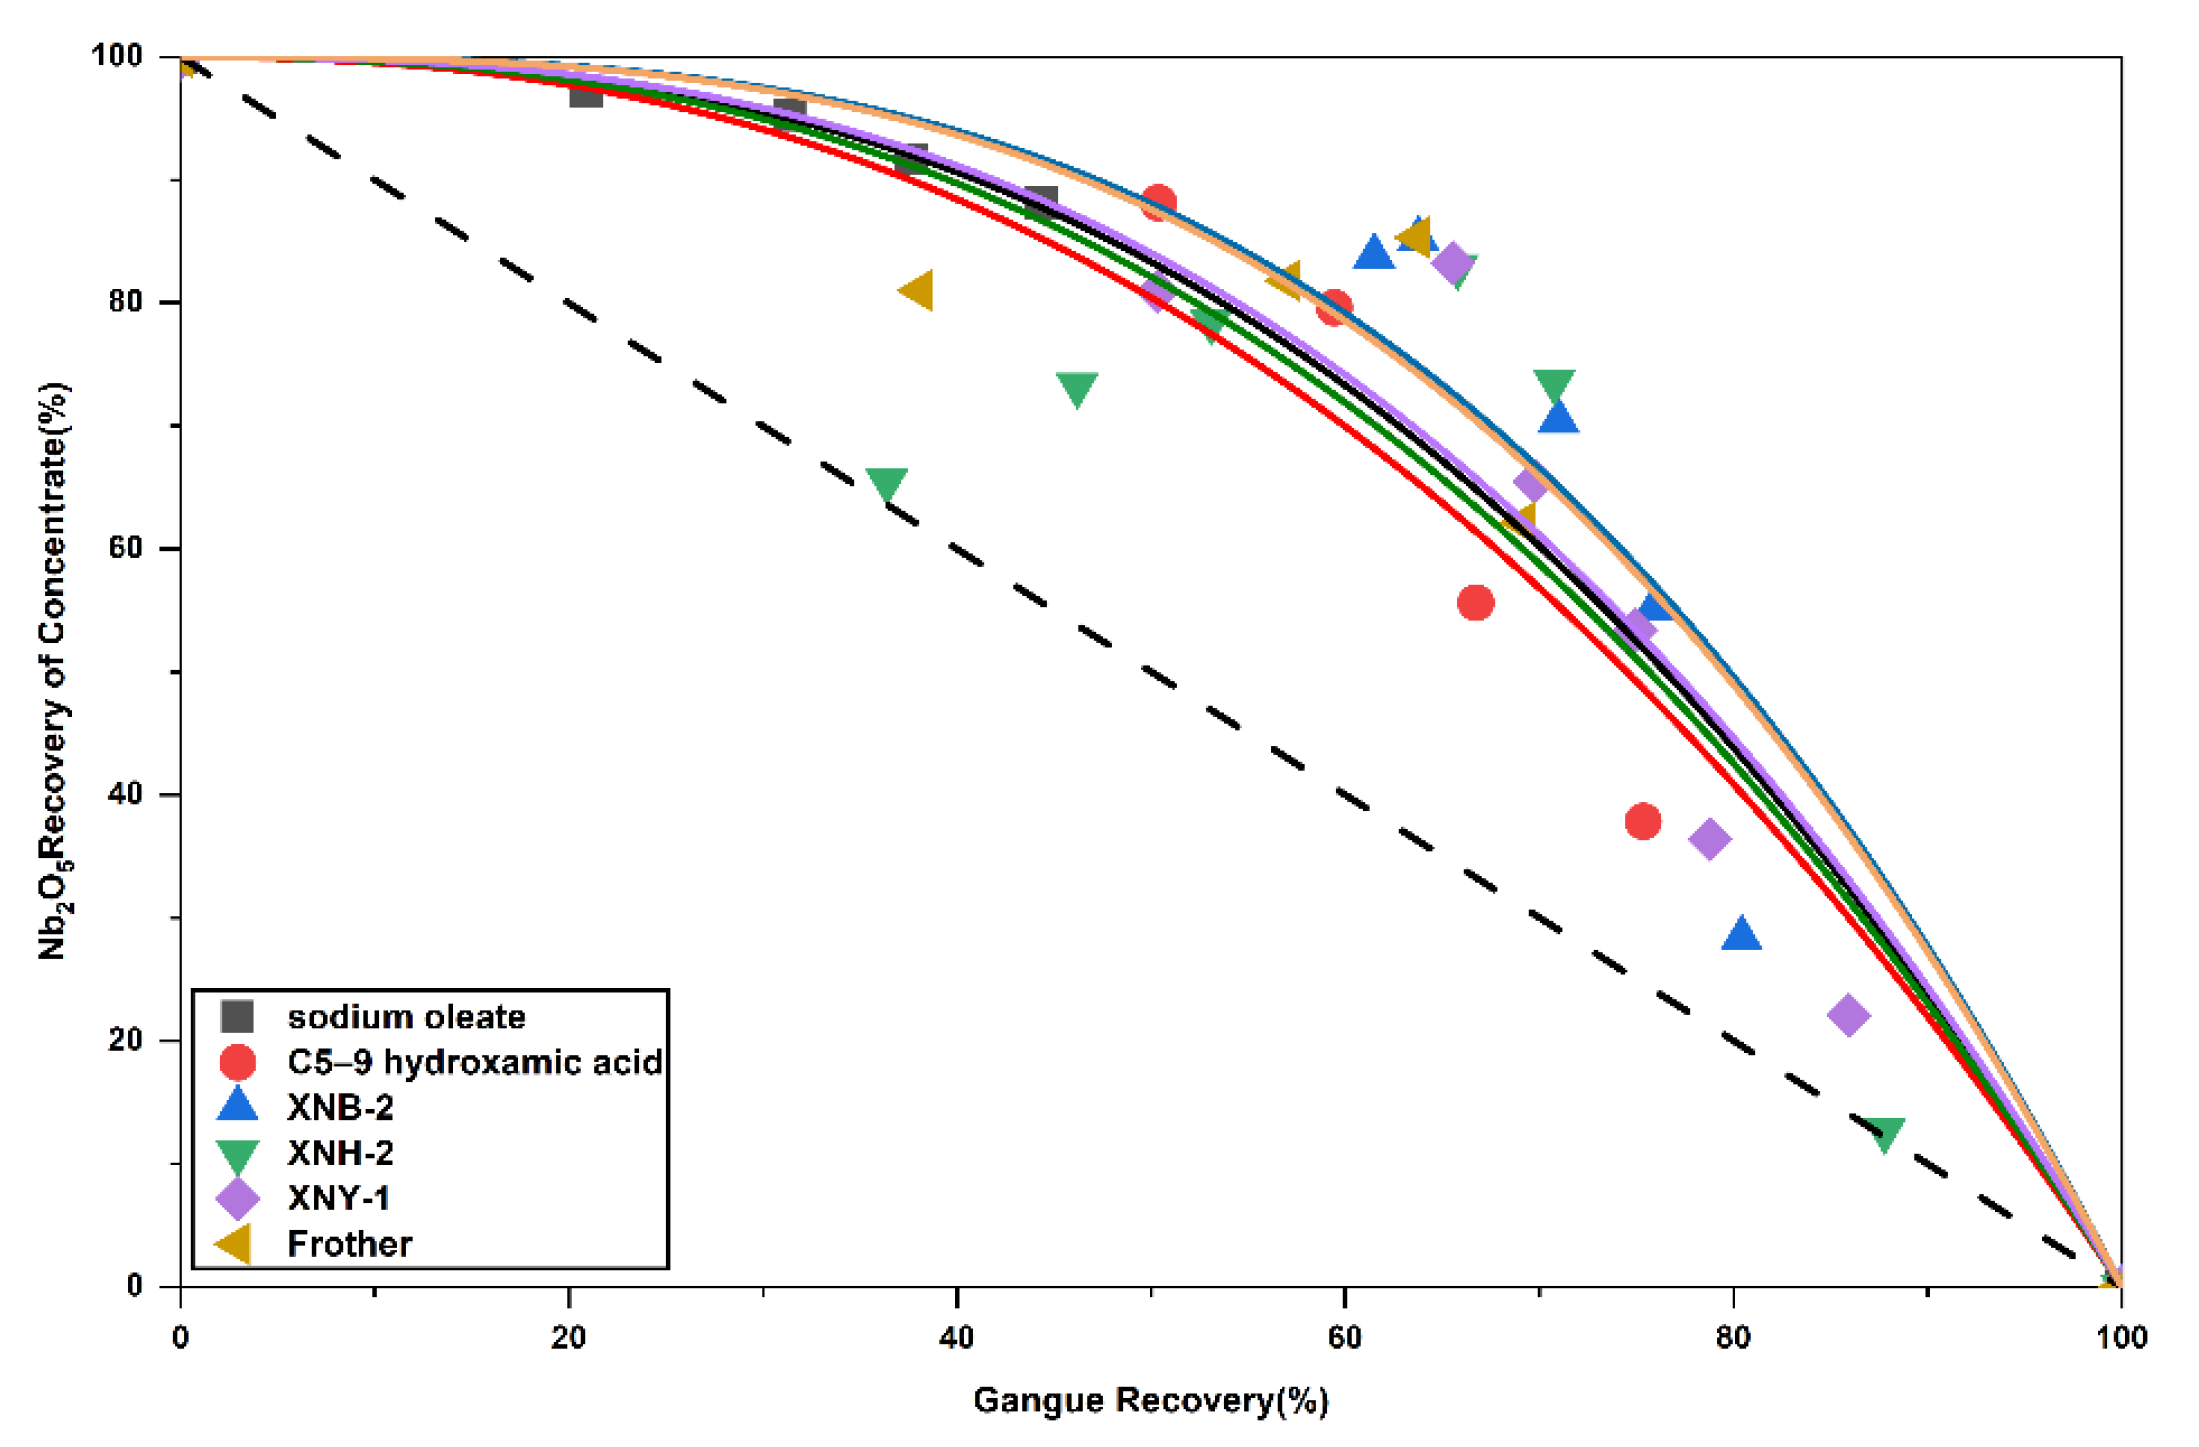
Separation upgrading curves can be used to characterize, compare, and analyze separation processes. In certain cases, particularly when data points are relatively scattered, suitable mathematical expressions can be employed for comparative and statistical analysis of separation results [24]. The Fuerstenau upgrading curve provides an intuitive representation of separation performance by plotting the recovery of valuable minerals in the concentrate against the recovery of gangue minerals in the tailings. It has been widely used to evaluate and compare the separation efficiency of mineral processing operations, such as copper ore [25], graphite [26], clean coal [27], chromite ore [28], and others. According to Drzymala and Ahmed, many calculation equations are available for fitting the Fuerstenau upgrading curve [24]. In this study, an equation containing only one adjustable parameter (α) [28] is adopted, which is given by:
R c = 100 α R T α 100 α 1
where Rc and RT represent the recovery of niobium-bearing minerals in the flotation concentrate and the recovery of gangue minerals in the tailings, respectively. α is the separation efficiency factor, which characterizes the separation efficiency. When α = 0 or α → ∞, the separation of niobium-bearing minerals from gangue minerals is ideal. When 0 < α < 1, niobium-bearing minerals tend to be enriched in the tailings. When α = 1, no separation occurs between niobium-bearing minerals and gangue minerals. When α > 1, niobium-bearing minerals become enriched in the concentrate. After the separation factor α is fitted, a larger α value indicates higher separation efficiency. The equations for calculating Rc and RT are given below.
R c = Y c × G c G T o t a l
R T = Y T × ( 100 G T ) 100 G T o t a l
where YC is the concentrate yield, GC is the Nb2O5 grade of the concentrate, YT is the tailing yield, GT is the Nb2O5 grade of the tailings, and GTotal is the overall head grade of Nb2O5.
The calculated results of the Fuerstenau upgrading curves for tests under different reagent conditions are presented in Table 4. The Fuerstenau upgrading curves for various separation processes are shown in Figure 20. The upgrading curves were obtained by fitting the experimental data. It can be seen from Figure 20 that the Fuerstenau upgrading curves are in good agreement with the experimental results.
Table 4 presents the separation efficiency factors (α) calculated using Origin (version number 2026 SR1). An adjusted coefficient of determination (R2) greater than 0.80 indicates that the model fits the data well, allowing the separation results to be approximated using Equation (1). Among the collectors tested, the α value obtained with XBN-2 was 3.0676, which is higher than those of the other conventional collectors. This indicates that XBN-2 possesses superior selectivity toward niobium-bearing minerals and delivers higher separation efficiency compared with sodium oleate and C5–9 hydroxamic acid. With respect to the influence of different reagent types (collector, depressant, activator, and frother) on flotation separation performance, XBN-2 again yielded the highest α value (3.0676). The relative influence of the reagents on separation efficiency followed the order XNB-2 > frother > XNY-1 > XNH-2. This demonstrates that, among the reagents studied, the dosage of XNB-2 exerts the most pronounced effect on separation efficiency. It is noteworthy that, although frothers are generally considered auxiliary agents primarily responsible for bubble generation, in the present flotation system the frother exhibits the second strongest influence on flotation efficiency after XNB-2, and therefore represents a factor of critical importance.
Under the optimum conditions, an Nb2O5 grade of 0.885% and a recovery of 85.67% were achieved.

5. Conclusions

  • The feed for niobium flotation assayed 0.370% Nb2O5, 19.36% TFe, and 10.93% BaO, with other impurities including Si, P, S, and F. MLA analysis revealed an eschynite content of 0.76%, accounting for 50.67% of all niobium-bearing minerals.
  • After one rougher stage, four cleaner stages, and magnetic separation, a niobium concentrate assaying 5.250% Nb2O5 and 37.60% TFe was obtained. MLA analysis revealed that the eschynite content in the concentrate increased from 0.76% in the feed ore to 26.32%, and its proportion among all niobium-bearing minerals rose from 50.67% to 86.10%, indicating efficient enrichment of eschynite. Calculations based on various Fuerstenau upgrading curves demonstrated that XNB-2 as the collector had the greatest effect on improving separation efficiency. Under the optimum conditions, an Nb2O5 grade of 0.885% and a recovery of 85.67% were achieved.

Author Contributions

Conceptualization, H.L. and J.L.; Methodology, H.L. and J.L.; Software, H.L. and G.F.; Validation, H.L., M.L., H.R., J.J. and Z.S.; Formal analysis, H.L., M.L. and F.J.; Investigation, H.L., M.L., H.R. and Z.S.; Resources, J.L.; Data curation, H.L., M.L. and H.R.; Writing—original draft, H.L., M.L. and G.F.; Writing—review & editing, H.L. and G.F.; Visualization, H.L., M.L. and G.F.; Supervision, H.L. and J.L.; Project administration, H.L. and J.L. All authors have read and agreed to the published version of the manuscript.

Funding

This research was funded by [Baotou Iron and Steel (Group) Co., Ltd.] grant number [BGKY-ZY-2024-Z-003].

Data Availability Statement

The original contributions presented in this study are included in the article. Further inquiries can be directed to the corresponding author.

Conflicts of Interest

Authors Hongjing Li, Mannian Li, Feng Jiang, Hui Ren, Jianfei Liu, Jia Jia and Zhuohan Song were employed by Baogang Group Mining Research Institute. The remaining author declares that the research was conducted in the absence of any commercial or financial relationships that could be construed as a potential conflict of interest. The founder had no role in the design of the study; in the collection, analyses, or interpretation of data; in the writing of the manuscript, or in the decision to publish the results.

References

  1. Dong, Y.; Li, T.; Chen, X. Development and utilization pattern and governance strategies of global niobium and tantalum resources. Nat. Resour. Inf. 2024, 5, 32–40. [Google Scholar]
  2. Lin, H.; Xiong, W.; Zhang, L.; Chen, D.; Liu, N. Mineral Characteristics and Beneficiation Technology of Pyrochlore. Nonferrous Met. Miner. Process. Sect. 2021, 6, 134–138. [Google Scholar]
  3. Ai, Y.; Fan, G. Resources status and mineral processing of pyrochlore. China Min. Mag. 2015, 24, 130–133, 143. [Google Scholar]
  4. Ren, J.; Lu, S. Overview and Characteristics of Global Niobium Resources. Non-Ferr. Min. Metall. 1997, 5, 1–3. [Google Scholar]
  5. Cao, Z.; Lu, W.; Wang, J.; Wu, X.; Tang, J.; Wang, W.; Liu, W. Research Status and Prospect of Niobium Ore Beneficiation Technology. Met. Mine 2024, 12, 1–9. [Google Scholar]
  6. Liang, D.; Li, B. Process Mineralogy of Rare Metal Ores; Metallurgical Industry Press: Beijing, China, 2015; ISBN 978-7-5024-6934-4. [Google Scholar]
  7. Yin, Z.; Gao, L.; Rao, B. Overview of Niobium Resources and Progress in Mineral Processing Technology in China. Conserv. Util. Miner. Resour. 2024, 44, 115–125. [Google Scholar]
  8. Zhao, Y.; Li, X.; Yang, L.; Li, X.; Yang, B.; Guo, R.; Liu, W.; Yang, J. Nb Resource Distribution Characteristics and Precise Mining & Beneficiation Exploration in the Bayan Obo Rare Earth-Niobium Deposit. In Proceedings of the Abstracts of 2024 Annual Conference of the Chinese Society of Rare Earths, Chengdu, China, 25–28 October 2024. [Google Scholar]
  9. Zhang, L.; Lin, D. Current Situation of Rare Metal Resources in China. Geol. Prospect. 2004, 40, 26–30. [Google Scholar]
  10. Zuo, G. Thinking on the Problem of Stable supply of Scarce Strategic Metal Resources in China—Take Tantalum, Niobium, Chromium and Cobalt for Example. Nat. Resour. Econ. China 2023, 36, 4–13. [Google Scholar]
  11. Wang, R.; Che, X.; Wu, B.; Xie, L. Critical mineral resources of Nb, Ta, Zr, and Hf in China. Chin. Sci. Bull. 2020, 65, 3763–3777. [Google Scholar] [CrossRef] [Scilit]
  12. Lin, P.; Zhang, Q.; He, D.; Liu, S.; Li, Z.; Li, J. Leaching of Niobium from Niobium-bearing Rough Concentrate. Nonferrous Met. Extr. Metall. 2021, 12, 69–74. [Google Scholar] [CrossRef] [Scilit]
  13. Sun, L.; Wang, L.; Yu, H.; Su, H.; Chen, D.; Qi, T. Research progress on extraction technologies of niobium from low-grade niobium-bearing minerals. CIESC J. 2021, 72, 1847–1862. [Google Scholar]
  14. Wang, J.; Sun, H.; Zhao, Z.; Ren, H.; Lei, X. Enrichment Behavior of Weak Magnetic Rare Earth and Niobium in Bayan Obo Ore through Cascade Magnetic Separation. J. Chin. Soc. Rare Earths 2025, 43, 205–214. [Google Scholar]
  15. Lu, X.; Xu, H.; Zhou, Y.; Chen, W. Reaction Mechanism for Solid-Phase Transformation of Ferroniobite to Pyrochlore under Different Atmospheres. In Proceedings of the Abstracts of the 4th Youth Academic Conference of the Chinese Society of Rare Earths, Ganzhou, China, 19–21 May 2023. [Google Scholar]
  16. Yang, L.; Yang, B.; Yu, J.; Ao, X.; Yan, Z.; Meng, W. Types and Distribution of Rare Earth Minerals in the Bayan Obo Deposit. In Proceedings of the Abstracts of the 2024 Annual Meeting of the Chinese Society of Rare Earths, Chengdu, China, 25–28 October 2024. [Google Scholar]
  17. Yang, L.; Yan, G.; Yang, B.; Meng, W.; Liu, J. Minerals of Bayan Obo; Geological Publishing House: Beijing, China, 2024; ISBN 978-7-116-13744-8. [Google Scholar]
  18. Zhang, Q. Analysis on Mineralogical Characteristics of Niobium-bearing Resources in Baiyan Obo Deposit. Nonferrous Met. 2005, 57, 111–113. [Google Scholar]
  19. Yang, B.; Yang, L.; Zhao, Y.-G.; Yan, G.-Y.; Liu, J.-Y.; Meng, W.-X.; Yu, J.-F.; Chen, L.; Li, X.-C.; Li, X.-H. Aeschynite Group Minerals Are a Potential Recovery Target for Niobium Resources at the Giant Bayan Obo Nb–REE–Fe Deposit in China. Minerals 2024, 14, 1029. [Google Scholar] [CrossRef] [Scilit]
  20. Zhu, Z.; Ke, C.; Zhao, Y.; Wang, D.; Zhang, L.; Li, Y.; Zhao, J.; Yu, H. Spatial distribution, occurrence and enrichment of Nb in the giant BayanObo deposit. Acta Petrol. Sin. 2025, 41, 1170–1193. [Google Scholar] [CrossRef] [Scilit]
  21. Yu, Y.; Chen, Y. Study on bayan obo niobium mineral processing: Study present state and respects. Min. Metall. Eng. 1992, 12, 62–65. [Google Scholar]
  22. Zhou, Y.; Zhao, X.; Chen, W. Beneficiation Experiment of Low Grade Niobium Ore for Super Enrichment. Min. Metall. Eng. 2025, 45, 63–67. [Google Scholar]
  23. Zhang, Q. present situation and feasibility about utilization of niobium bearing resource in China. China Min. Mag. 2003, 12, 30–33. [Google Scholar]
  24. Drzymala, J.; Ahmed, H.A.M. Mathematical Equations for Approximation of Separation Results Using the Fuerstenau Upgrading Curves. Int. J. Miner. Process. 2005, 76, 55–65. [Google Scholar] [CrossRef] [Scilit]
  25. Drzymala, J.; Luszczkiewicz, A.; Foszcz, D. Application of Upgrading Curves for Evaluation of Past, Present, and Future Performance of a Separation Plant. Miner. Process. Extr. Metall. Rev. 2010, 31, 165–175. [Google Scholar] [CrossRef] [Scilit]
  26. Oney, O.; Samanli, S.; Niedoba, T.; Surowiak, A.; Pięta, P. Optimization of Reagent Dosages with the Use of Response Surface Methodology and Evaluation of Test Results with Upgrading Curves in Graphite Flotation. Part. Sci. Technol. 2019, 37, 171–181. [Google Scholar]
  27. Xing, Y.; Gui, X.; Cao, Y.; Wang, Y.; Xu, M.; Wang, D.; Li, C. Effect of Compound Collector and Blending Frother on Froth Stability and Flotation Performance of Oxidized Coal. Powder Technol. 2017, 305, 166–173. [Google Scholar] [CrossRef] [Scilit]
  28. Shao, H. Mineralogical Characterisation and Separation Studies on the Recovery of Cr2O3 in the High Carbon Ferrochrome Slag. Physicochem. Probl. Miner. Process. 2020, 56, 460–470. [Google Scholar] [CrossRef] [Scilit]
Figure 1. Distribution of iron phases in the feed ore (%).
Processes 14 02000 g001
Figure 2. Screening analysis of the feed ore (%).
Processes 14 02000 g002
Figure 3. Mineral species and their relative contents (%).
Processes 14 02000 g003
Figure 4. Particle size distribution of the main minerals (%).
Processes 14 02000 g004
Figure 5. Liberation degree distribution of main minerals (%).
Processes 14 02000 g005
Figure 6. Intergrowth degree of main minerals in the feed ore (%).
Processes 14 02000 g006
Figure 7. Particle size distribution of single minerals under MLA analysis.
Processes 14 02000 g007
Figure 8. Single mineral particles of main minerals.
Processes 14 02000 g008
Figure 9. Liberation degree distribution of niobium-bearing minerals in different size fractions (%).
Processes 14 02000 g009
Figure 10. Effects of different collectors on concentrate Nb2O5 grade and recovery (%).
Processes 14 02000 g010
Figure 11. Effects of different pulp concentrations on concentrate Nb2O5 grade and recovery (%).
Processes 14 02000 g011
Figure 12. Effects of XNH-2 dosage on concentrate Nb2O5 grade and recovery (%).
Processes 14 02000 g012
Figure 13. Effects of XNY-1 dosage on concentrate Nb2O5 grade and recovery (%).
Processes 14 02000 g013
Figure 14. Effects of XNB-2 dosage on concentrate Nb2O5 grade and recovery (%).
Processes 14 02000 g014
Figure 15. Effects of frother dosage on concentrate Nb2O5 grade and recovery (%).
Processes 14 02000 g015
Figure 16. Flowchart of niobium separation process.
Processes 14 02000 g016
Figure 17. Results of closed-circuit test (%).
Processes 14 02000 g017
Figure 18. Iron phases of the niobium concentrate (%).
Processes 14 02000 g018
Figure 19. MLA analysis of the niobium concentrate (%).
Processes 14 02000 g019
Figure 20. Fuerstenau upgrading curves without reagents.
Processes 14 02000 g020
Table 1. Analytical results of the main chemical components in the feed ore (%).
Chemical
Components
TFeNb2O5PFSCaOMgO
Grade19.360.3700.682.423.1643.1643.164
Chemical
Components
Al2O3BaOK2ONa2OSiO2TiO2MnO
Grade0.0810.930.0053.6617.710.950.38
Table 2. Results of magnetic separation experiments (%).
Magnetic Field Strength
(kA/m)
ItemYieldTFeNb2O5
GradeRecoveryGradeRecovery
143.28Tailing73.3237.6061.835.1801.56
Concentrate26.6863.8038.170.22598.44
Feed100.0044.59100.003.858100.00
Table 3. Analysis of the main chemical components in the niobium concentrate (%).
Chemical ComponentsTFeNb2O5FS
Grade37.605.2500.800.47
Chemical ComponentsBaOSiO2TiO2CaO
Grade1.122.9712.772.09
Table 4. Separation efficiency factors under different reagent conditions (%).
Reagent TypeCalculation ParametersOptimal Results
αAdjusted R2Nb2O5GradeRecovery
Sodium oleate2.58410.99980.54491.69
C5–9 hydroxamic acid2.53660.95710.72279.62
XNB-23.06760.92100.88585.22
XNH-22.48330.80990.89082.94
XNY-12.64780.93720.89083.25
Frother3.01120.94810.88585.67
Disclaimer/Publisher’s Note: The statements, opinions and data contained in all publications are solely those of the individual author(s) and contributor(s) and not of MDPI and/or the editor(s). MDPI and/or the editor(s) disclaim responsibility for any injury to people or property resulting from any ideas, methods, instructions or products referred to in the content.