Article

Impact of Geomembrane Defect on Leakage Rate of Landfill Composite Liner Under Mechanical–Chemical Coupled Conditions


1
School of Mechanics and Engineering Science, Shanghai University, Shanghai 200444, China
2
School of Civil Engineering and Water Resources, Qinghai University, Xining 810016, China
*
Author to whom correspondence should be addressed.
Processes 2026, 14(11), 1775; https://doi.org/10.3390/pr14111775
Submission received: 2 May 2026 / Revised: 22 May 2026 / Accepted: 27 May 2026 / Published: 29 May 2026
(This article belongs to the Special Issue Hydraulic Barriers in Environmental Containment Systems)

Abstract

Hydraulic conductivity tests and numerical simulations were conducted to evaluate the leakage through a geosynthetic clay liner (GCL)–geomembrane composite liner with a geomembrane defect under mechanical–chemical coupled conditions. A circular geomembrane defect with a diameter of 2 to 7 mm was created in the geomembrane to simulate different defect sizes that may be encountered in the field. Hydraulic conductivity tests were conducted on 155-mm-diameter specimens under an average effective stress of 40 or 240 kPa to simulate different layers of waste placed and permeated with the 100 or 250 mM CaCl2 solution to simulate the aggressive waste leachates that could increase the hydraulic conductivity of GCLs. The maximum leakage rate that can be observed in the field was calculated using the equivalent hydraulic conductivity of the composite liner or predicted using finite-element modeling. The results show that the leakage rate of the composite liner with a geomembrane defect was consistently lower than the leakage rate of the GCL alone. The decrease in the size of geomembrane defects, the decrease in leachate concentration, and the increase in effective stress resulted in a decrease in the leakage rate. Nevertheless, the leakage rate of the composite liner was only up to 17× lower than the leakage rate of GCL alone. The composite liner with a geomembrane defect was not able to achieve an equivalent or lower leakage rate than a standard compacted clay liner alone, suggesting that GCLs need to maintain low hydraulic conductivity even with the protection of geomembranes.

1. Introduction

Composite liners and bentonite-based materials have been used in diverse waste contaminant facilities, ranging from municipal solid waste landfills to radioactive waste disposal facilities, to reduce the leakage rate of waste leachate and gases to the environment worldwide [1,2,3,4,5,6,7,8]. A composite liner contains a clay liner overlaid by a geomembrane, typically high-density polyethylene (HDPE) geomembranes. The two components function synergistically to contain waste leachate, i.e., the geomembrane serves as the primary barrier for containing leachates, and the clay liner slows down the leakage when the geomembrane contains defects [9,10,11,12,13,14]. For the clay liner, the regulations typically require a 0.6- or 0.72-m-thick compacted clay liner (CCL) with a hydraulic conductivity lower than 1 × 10⁻⁹ m/s [15,16]. The regulations also allow alternative clay liners that yield equivalent or lower leakage rates, such as geosynthetic clay liners (GCLs) [16].
GCLs are manufactured clay liners with a thin layer of bentonite sandwiched by two layers of geotextiles [17,18,19,20]. GCLs have very low hydraulic conductivity to water, typically around 2 × 10⁻¹¹ m/s, but their hydraulic conductivity is sensitive to waste leachate chemistry [21,22,23,24]. The increased hydraulic conductivity of GCLs to waste leachate with high concentrations or containing divalent cations has been extensively reported in the literature [25,26,27,28,29,30,31,32]. In extreme cases, the hydraulic conductivity of GCLs can exceed 10−6 m/s due to leachate chemistry [33,34,35,36,37,38] and the suppressed swelling of bentonite [39,40,41,42,43,44,45]. In such conditions, GCLs alone will not be able to contain the waste leachate. While various emerging soil stabilization and barrier modification techniques (e.g., microbial-induced biomineralization, polymer-enhancement, and bio-clogging) are being actively explored [46,47,48,49,50,51,52,53,54,55,56], the question remains whether traditional composite liners are able to reduce the leakage rate even when the GCL has elevated hydraulic conductivity due to the leachate.
Since geomembranes have extremely low hydraulic conductivity to water and most of the waste leachate, typically lower than 10−16 m/s [17], the leakage rate of composite liners is mainly controlled by the leakage rate around geomembrane defects [57,58,59]. The leakage rate of leachate through geomembrane defects is dominated by three factors, i.e., the hydraulic conductivity of the GCL below the defect that is strongly affected by leachate chemistry, the interface transmissivity that is strongly affected by stress above the geomembrane, and the size of the defect [58,60,61,62,63,64,65,66]. Therefore, a comprehensive investigation into the leakage rate of composite liners with variously sized geomembrane defects, under the coupled effects of leachate chemistry and stress, is highly desired.
In this study, hydraulic conductivity tests were conducted on GCL–geomembrane composite liners with geomembrane defects to evaluate the efficacy of the liners in containing leachate. The composite liners with different geomembrane defect sizes were tested with different concentrations of aggressive solutions (100 or 250 mM CaCl2 solutions) and under different effective stress conditions (40 or 240 kPa) to simulate mechanical–chemical coupled conditions in the field [67]. Tests were also conducted on GCL alone to determine the impact of the GCL for comparison. Numerical simulations were conducted to develop a model that can be used to predict the leakage rate through composite liners and discuss the mechanism of leakage through the GCL-GM interface. The findings of this study will provide suggestions for composite liner design in engineering practice.

2. Materials and Methods

2.1. Geomembrane

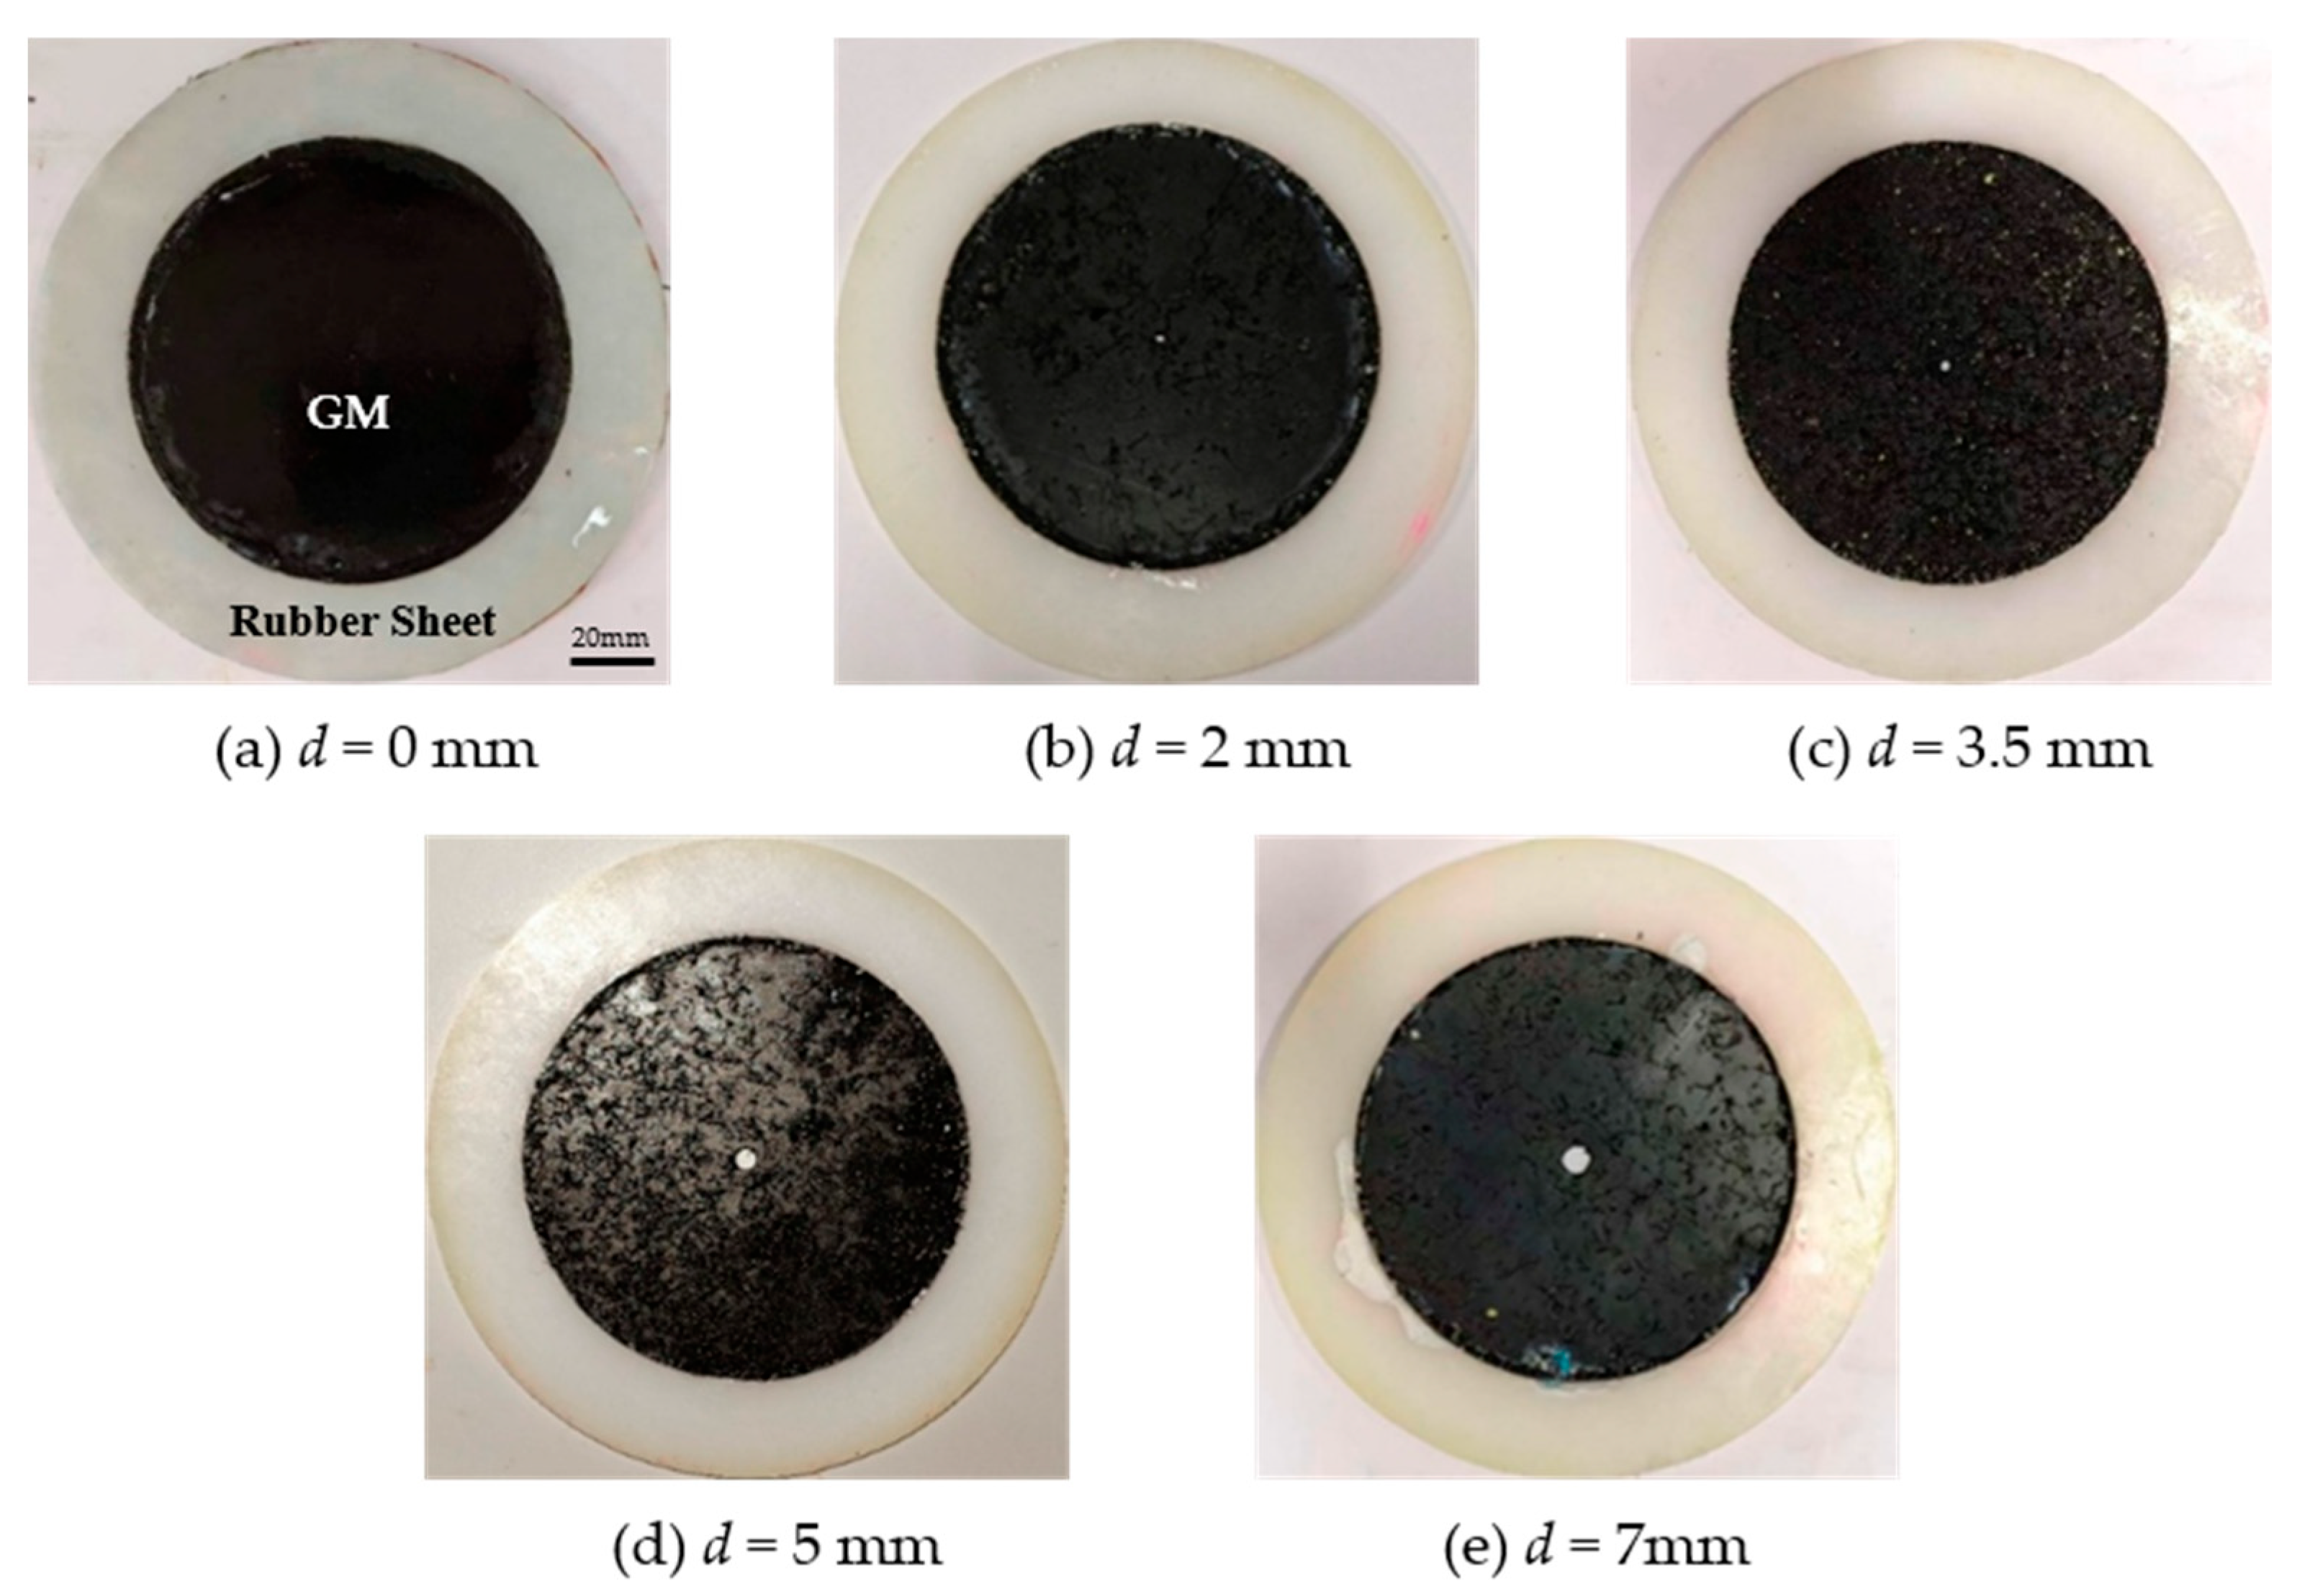
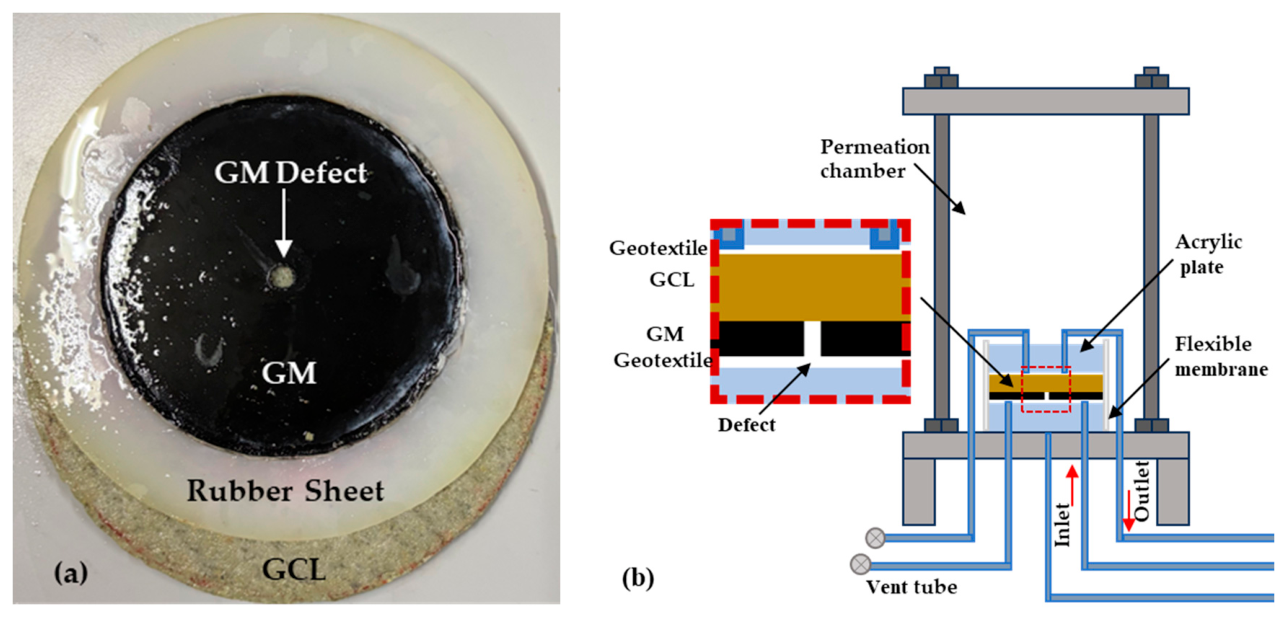
A 2.0-mm-thick commercial HDPE geomembrane was used in this study. The thickness of the geomembrane is within the typical thickness range (1.5–3 mm) used for geomembranes in practice [68]. The physical properties of the evaluated geomembrane are listed in Table 1. The surface of one side of the geomembrane is textured to increase the interface share strength of the geomembrane. The asperity height of the geomembrane is 0.25 mm. Circular defects with diameters of 2 mm, 3.5 mm, 5 mm, or 7 mm were created in the geomembrane, as shown in Figure 1, in order to simulate the most frequently encountered defect sizes in actual field conditions [69]. Since the geomembrane with a diameter of 155 mm was evaluated, the selected diameters of defects were smaller than the defect diameters in the field by considering the size effects.

2.2. Geosynthetic Clay Liner

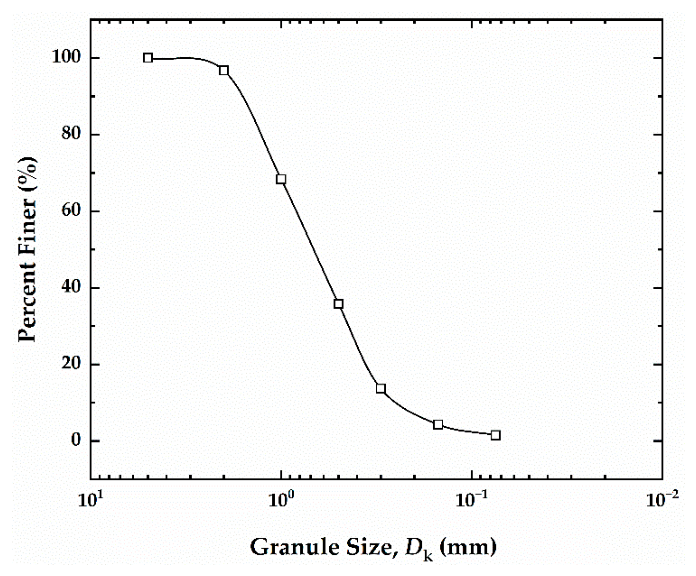
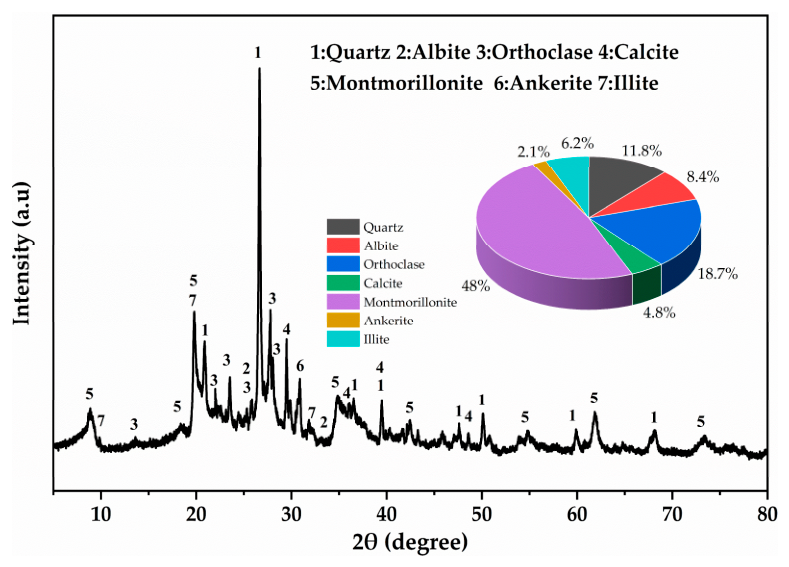
The evaluated commercial GCL consists of a granular sodium (NaB) bentonite sandwiched between a woven polypropylene (PP) carrier geotextile and a nonwoven PP cover geotextile. The two geotextiles were bonded through needle punching. The basic index properties of the GCL and the bentonite are summarized in Table 2. The mass per unit area of the GCL is 5.5 kg/m2. The granule size distribution of the bentonite was measured using dry sieve per ASTM D6913 [71] and the gradation curve is presented in Figure 2. The mineralogical composition of the bentonite was determined via X-ray diffraction (XRD). As illustrated in Figure 3, quantitative analysis reveals that the bentonite primarily consists of montmorillonite (48.0%), orthoclase (18.7%), quartz (11.8%), and albite (8.4%), alongside minor amounts of illite (6.2%), calcite (4.8%), and ankerite (2.1%). The bentonite exhibits a high swell index in deionized water, i.e., 23.5 mL/2 g. This relatively low montmorillonite content likely contributed to the moderate swell index and the severe leakage observed under chemical attack.

2.3. Permeant Solutions

Calcium chloride (CaCl2) solutions with concentrations of 100 mmol/L and 250 mmol/L were used as permeant solutions to represent aggressive leachates. Ca2+ is effective in suppressing the swelling of NaB and has strong impacts on the hydraulic conductivity of GCLs. The 100 mmol/L solution was selected to represent a typical concentration of industrial waste leachates, and 250 mmol/L was selected to represent industrial waste leachates with elevated concentrations [25,72,73]. Deionized water was also evaluated as the hydrating and permeant solution for comparison. The CaCl2 solutions were prepared by dissolving reagent-grade CaCl2 (Sinopharm Chemical Reagent Co., Ltd., Shanghai, China) into DIW to the targeted concentration following the method described by Benson et al. [74].

2.4. Hydraulic Conductivity Testing

Hydraulic conductivity tests were conducted on composite liners with geomembrane defects as shown in Figure 4. The perimeter of the geomembrane was glued with a rubber ring to increase the contact area with the flexible latex membrane, thereby avoiding sidewall leakage. The geomembrane overlaid by a GCL was measured in a flexible-wall permeameter using the falling headwater-consistent tailwater method in ASTM D6766 [75] (with continuous pneumatic pressure control). It should be noted that ASTM D6766 is designated for GCLs only. As no standard exists for GM/GCL composite liners, D6766 was adopted to ensure methodological consistency with GCL-alone baseline tests. Upward flow was conducted to facilitate the saturation of the GCL. The GCL was cut directly from a GCL roll provided by the manufacturer using a razor knife. The perimeter of the GCL specimen was sealed with DIW prior to cutting to prevent the potential loss of bentonite during operations.
All composite liner specimens were hydrated with the permeant solution for 48 h prior to permeation to simulate a realistic scenario that may occur in the field. During the hydration, the effluent line was closed with the cell and headwater pressure applied. No backpressure was applied to minimize geochemistry alterations that would occur in the field (e.g., Le Chatelier principle) [13,18,72]. This procedure is permitted by ASTM D6766 and better represents actual field conditions (no back pressure in landfills). The applied average effective stress was 40 or 240 kPa to simulate different pressures in the field due to the self-weight of the waste. The 40 kPa pressure was used to simulate the first lift of waste placed, and the 240 kPa pressure was used to simulate more waste being placed, which was similar to the stress evaluated by [76]. The effective stress was applied at the beginning of hydration and maintained throughout the permeation. The average hydraulic gradient of the test was approximately 150, which is consistent with the experimental conditions reported by [20]. Tests were continued to establish hydraulic equilibrium per ASTM D6766. Hydraulic equilibrium was defined as steady hydraulic conductivity and the incremental outflow-to-inflow ratio (within 25%). At least two pore volumes of flow (PVF) were required to pass through the specimen. Chemical equilibrium was not examined in this study.
Equivalent hydraulic conductivity of the composite liner (ke) was calculated using Darcy’s law:
k e = a L A ( t 1 t 2 ) Δ t ln ( h 1 h 2 ) ,
where a is the cross-sectional area of the influent reservoir, L is the thickness of the specimen (GCL + GM), A is the cross-sectional area of the specimen (188.7 cm2 in this work), h1 is the head loss across the specimen at time t1, and h2 is the head loss across the specimen at time t2. Equivalent hydraulic conductivity assumes that the cross-section of the flow is still the full cross-section of the specimen, which may not be true due to the presence of the geomembrane. This simplification was used for leakage rate calculation.

2.5. Leakage Rate Calculation

The leakage rate (Q) of leachate through a composite liner was calculated following Darcy’s law:
Q = k e A I ,
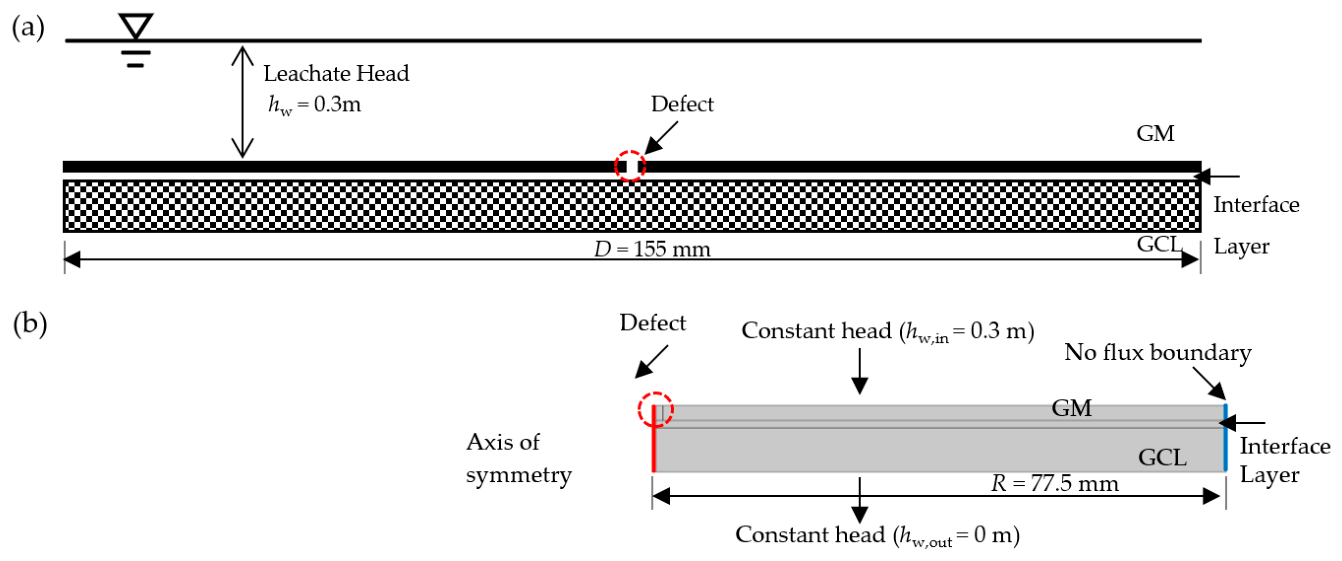
where A is still the cross-sectional area of the specimen, and I is the hydraulic gradient. The scenario of a landfill liner in engineering practice was used to calculate the leakage rate in the field, as shown in Figure 5a. The leachate head (hw) was assumed to be 0.3 m above the liner, which is the maximum leakage head allowed by the regulation. The bottom of the liner was assumed to have a constant water head at zero, which was not the case in practice but was used to calculate the maximum leakage rate through the liner.

2.6. Leakage Simulation

Leakage through a composite liner was simulated in a finite-element tool (COMSOL Multiphysics 6.2) to predict the leakage rate for the scenario as shown in Figure 5a. The flow is governed by Darcy’s law. While localized non-Darcy flow may occur within the defect region, a comparative simulation using the Brinkman model showed negligible difference (<0.2%) in global leakage; the Darcy assumption slightly overestimates leakage, which is conservative. Hydraulic conductivity of the GCL measured alone was applied in the simulation. A relatively large hydraulic conductivity (0.1 m/s) was applied to the geomembrane defect to ensure that the defect itself did not act as a head loss barrier [37]. A sensitivity test showed that further increasing this value resulted in negligible change in the leakage rate (<0.02%). An interface was created between the geomembrane and GCL to allow the interface transmission. The interface transmissivity was adjusted to achieve the leakage rate calculated from Equation (2). The applied boundary conditions include a constant water head (hw) boundary at the top of the geomembrane
h w ( t o p , t ) = 0.3 ,
and a constant water head boundary at the bottom of the clay liner:
h w ( b o t t o m , t ) = 0 ,
The unit of the water head is meters.
A 2D axisymmetric model of the composite liner was built in COMSOL to simulate leachate flow through the liner, as shown in Figure 5b. The interface between the GMB and the CCL was set as a thin layer (interface layer) with thickness of 1 mm [76,77]. The interface was modeled as homogeneous. While aggressive chemical exposure may induce heterogeneity and preferential flow paths, this simplification is necessary due to the lack of experimental data to characterize such localized behavior. Physical-controlled triangular meshes were built for high precision and accuracy as recommended by [78]. The maximum mesh for the geomembrane and defect was set as 0.1 mm to establish enough nodes within the domains, as recommended by [37]. Conservation of mass was applied to the interface between layers. The initial condition was set as a zero-pressure head throughout the domain. The maximum number of iterations was set at 100, and the velocity tolerance was restricted to less than 0.001 m/s to ensure computational convergence and accuracy, as recommended by Hou et al. [79]. The parameters of each component in the simulation are listed in Table 3.

3. Results and Discussion

The experimental conditions, including various chemical concentrations and confining pressures, and the resulting experimental and simulation data are summarized in Table 4. Post-test saturation of the GCL specimens exceeded 95%.

3.1. Defect Size Impact on Leakage Rate

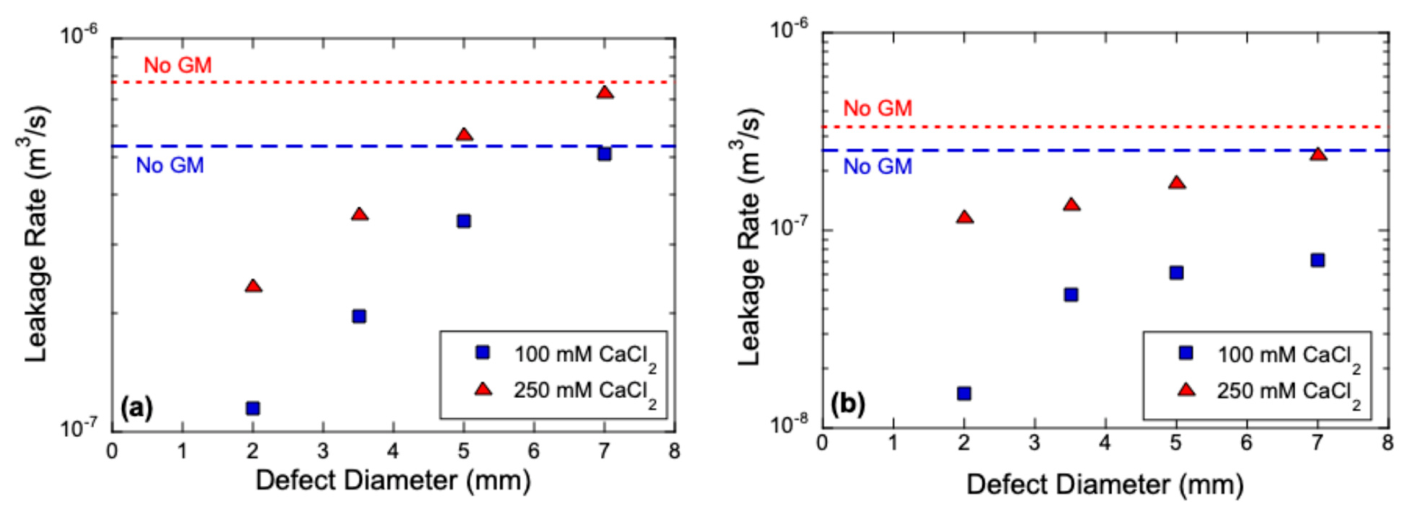
Leakage rate through a composite liner with a geomembrane defect in the scenario of Figure 5a is calculated using Equation (2), as shown in Figure 6. Figure 6a shows the leakage rate under 40 kPa that simulates one lift of waste placed, and Figure 6b shows the leakage rate under 240 kPa that simulates more waste placed. The blue squares show the liner permeated with the 100 mM CaCl2 solution, and the red triangles show the liner permeated with the 250 mM CaCl2 solution.
The leakage rate of the composite liner monotonically increases with the increase in the diameter of the geomembrane defect, regardless of the permeant solution concentrations and effective stress. The trend is consistent with the observation of the results reported by [58,65], as a larger geomembrane defect results in a larger flow path for the leachate and a larger flow rate. The increasing rate of the leakage as a function of the defect diameter is similar for the liner permeated with the CaCl2 solutions with different concentrations, except for a sharp increase when the diameter increases from 2.0 to 3.5 mm for the liner permeated with 100 mM CaCl2 solution under 40 kPa. The results suggest that the leakage rate is predominantly controlled by the defect. Nevertheless, both the effective stress and leachate concentrations have impacts on the leakage rate.
The leakage rate of the GCL alone in the scenario varies from 2.6 × 10⁻⁷ to 7.7 × 10⁻⁷ m3/s when permeated with the CaCl2 solutions. When a geomembrane with a defect was included in the liner, the leakage rate of the liner decreased by up to 17 times. None of the composite liners showed a higher leakage rate than the GCL alone. The results suggest that geomembranes provide extra protection of the liner and reduce the leakage, even if the geomembrane contains defects. The highest leakage rate was observed on the GCL alone when permeated with 250 mM CaCl2 solution under 40 kPa, which yielded a leakage rate of 7.7 × 10⁻⁷ m3/s. The lowest leakage rate was observed on the composite liner when permeated with 100 mM CaCl2 solution and a 2 mm diameter geomembrane defect under 240 kPa. The lowest leakage rate was 1.5 × 10⁻⁷ m3/s. These results suggest that both the concentration of permeant solutions and effective stress have impacts on the leakage rate of the composite liner.

3.2. Permeant Solution Impact on Leakage Rate

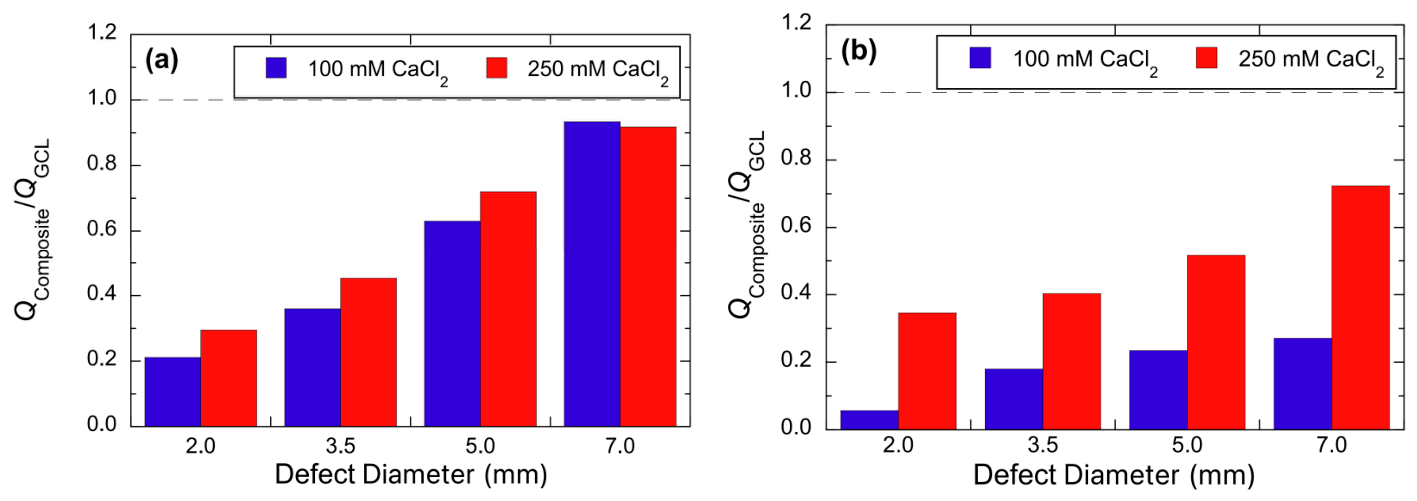
Figure 7 presents the leakage rate of the composite liner relative to the GCL alone (Qcomposite/QGCL) under two effective stresses (40 kPa and 240 kPa) with the same permeant solution. The liners permeated with different concentrations of CaCl2 solutions were compared to highlight the impact of permeation solution concentration in the reduction in rate due to the presence of the geomembrane. The results show that the composite liner had a lower reduction in leakage rate when permeated with 100 mM CaCl2 solution than permeated with 250 mM CaCl2 in all the evaluated cases but one. The exception is the liners with a 7 mm diameter geomembrane defect tested at 40 kPa. When the composite liner had a 7 mm diameter geomembrane defect and was tested under 40 kPa, the hydraulic conductivity of the composite liners tested under 40 kPa had comparable hydraulic conductivity to the GCL alone (within 0.9×), regardless of the concentrations of the permeant solutions. The highest reduction in leakage rate was observed for the composite liner with a 2-mm-diameter geomembrane and permeated with 100 mM CaCl2 solution under 240 kPa, whose hydraulic conductivity was less than 10% of the hydraulic conductivity of the GCL alone permeated with the same solution under the same stress. The results suggest that a geomembrane with a defect offers more effective protection for the liner when the GCL is permeated with less aggressive solutions and has low hydraulic conductivity. The results are consistent with the mechanism that controls the leakage rate of composite liners through geomembrane defects. When a composite liner contains geomembrane defects, the GCL below the geomembrane defect is expected to slow down the leachate flow and reduce the leakage. When the GCL has a low hydraulic conductivity, the GCL will be more effective in reducing the leakage rate. Thus, the GCL requires maintaining low hydraulic conductivity to be effective when the geomembrane contains defects.
When the composite liner was tested under 40 kPa, the reduction in hydraulic conductivity was comparable with the composite liner permeated with the 100 or 250 mM CaCl2 solution. In contrast, the composite liner permeated with the 100 mM CaCl2 solution apparently showed more reduction in hydraulic conductivity than the liner permeated with the 250 mM CaCl2 solution, when the liner was evaluated at 240 kPa. The higher stress offers extra protection for the liner by reducing the interface transmissivity, and the reduction shows greater impacts when the GCL has lower hydraulic conductivity.
The increase in leakage rate with higher CaCl2 concentration is attributed to the reduced swelling capacity of the bentonite. Swell index tests showed that the bentonite swell index decreased from 23.5 mL/2 g in deionized water to 5 mL/2 g in 100 mM CaCl2 and 4 mL/2 g in 250 mM CaCl2. This reduction in swelling capacity impairs the self-healing ability of the GCL. Consequently, the GCL cannot effectively seal geomembrane defects under hydraulic pressure, and the barrier performance of the composite liner is weakened.

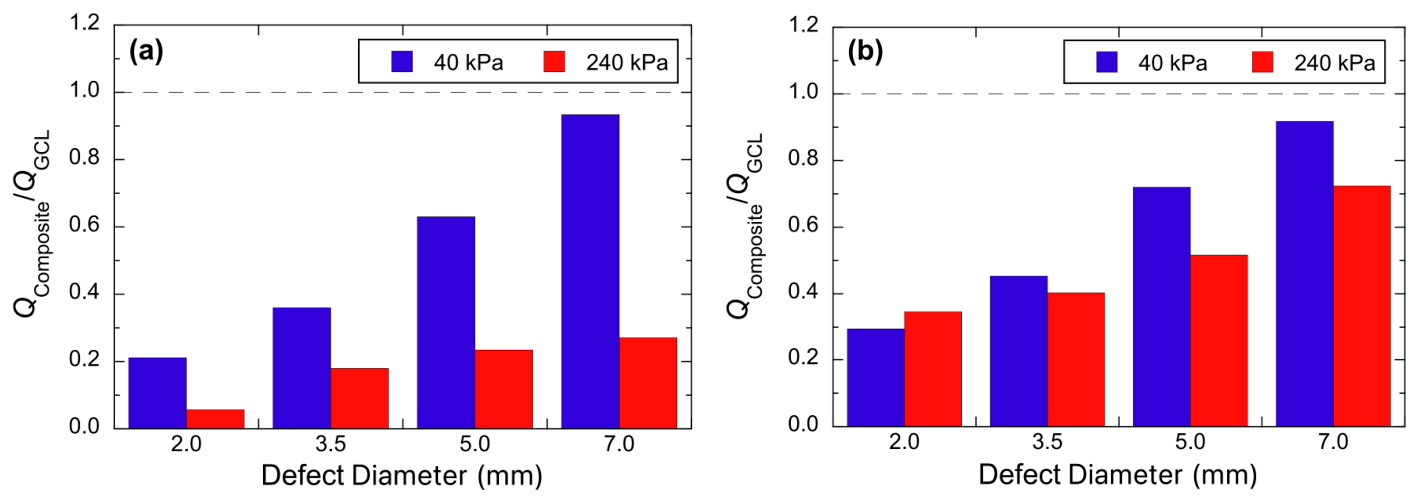
3.3. Stress Impact on Leakage Rate

Figure 8 presents the leakage rate of the composite liner relative to the GCL alone (Qcomposite/QGCL) under two permeant concentrations (100 mM and 250 mM CaCl2). This figure compares the impact of effective stress on the reduction in leakage rate attributed to the presence of the geomembrane. The results show that the composite liner had a lower reduction in leakage rate when evaluated under 240 kPa than evaluated under 40 kPa for all the evaluated cases but one. The exception is the liner with a 2-mm-diameter geomembrane defect permeated with the 250 mM CaCl2 solution. When the composite liner had a 2 mm diameter geomembrane defect and was permeated with the 250 mM CaCl2 solution, the composite liners tested under 50 kPa had slightly lower but comparable leakage rates to the liner tested under 240 kPa. The highest reduction in leakage rate was observed for the composite liner with a 2-mm-diameter geomembrane and permeated with 100 mM CaCl2 solution under 240 kPa, whose hydraulic conductivity was less than 10% of the hydraulic conductivity of the GCL alone permeated with the same solution under the same stress. The results suggest that high effective stress is able to reduce the leakage rate of composite liners around geomembrane defects. The high stress enhances the contact between the geomembrane and the GCL, reduces the interface transmissivity, constrains the leakage around the defect, and thus reduces the leakage rate. This interpretation is supported by the post-test water content data (Table 4), which decreased with increasing stress and ionic concentration, reflecting the progressively impaired self-healing ability of the GCL.

3.4. Geomembrane–GCL Interface Transmissivity

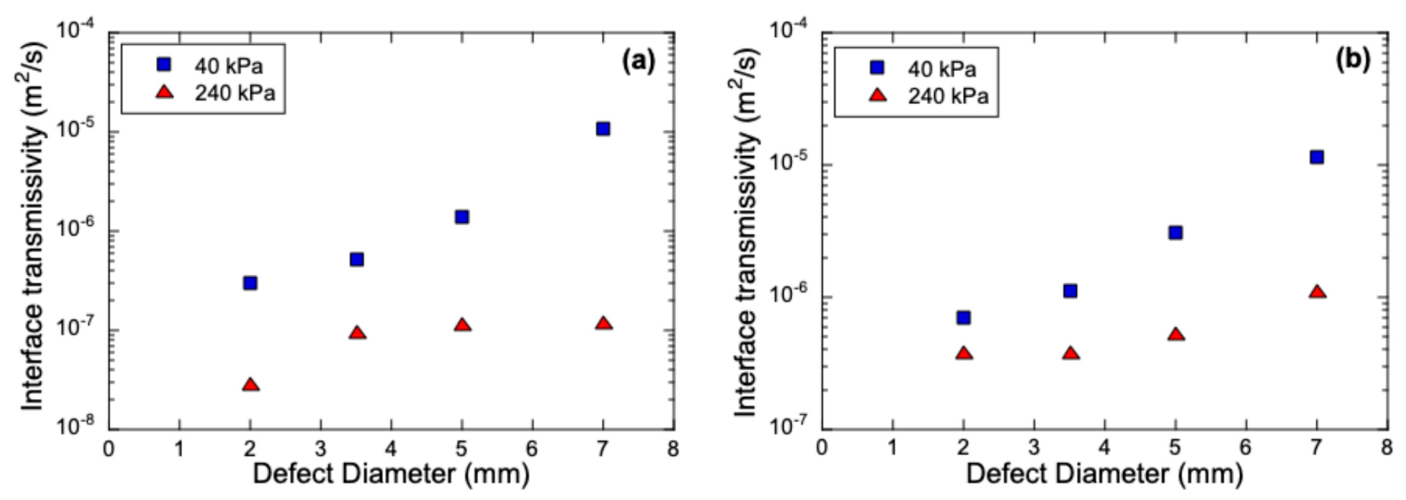
The interface transmissivity of the geomembrane–GCL interface was estimated by simulating the leakage through composite liners, using the developed finite-element model, as shown in Figure 5a. The leakage rate of the composite liner in the simulation was matched with the leakage rate calculated using Equation (2) by adjusting the interface transmissivity. The estimated interface transmissivity is shown in Figure 9.
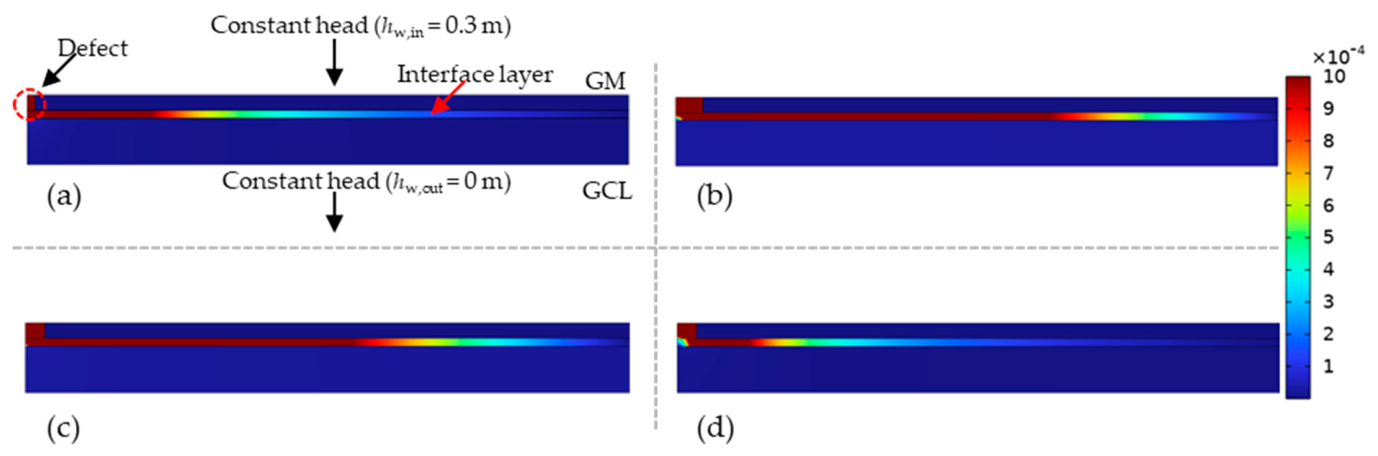
Interface transmissivity between the GCL and the geomembrane varied from 2.9 × 10⁻⁸ to 1.1 × 10⁻⁵ m2/s, which is higher than the interface transmissivity reported by [60]. For comparison, Rowe et al. reported an interface transmissivity of 1.4 × 10⁻⁷ m2/s for a geomembrane–GCL interface under high-concentration solution and low stress. One of our measured values (7.1 × 10⁻⁷ m2/s) falls within the same order of magnitude. The higher value in this study is likely attributed to the lower swelling capacity of the evaluated GCL, which provides less confinement to interface flow. The higher interface transmissivity is likely due to the smaller testing diameter of the specimen compared to the diameter of the specimen measured by AbdelRazek. The impact of geomembrane defects and interface transmission is more concentrated around the defect and is reduced when away from the defects. This phenomenon was reported by [10] using numerical simulation. This phenomenon was illustrated in Figure 10a,b by illustrating the velocity field in a cross-section of the simulated sample. The red color is used to represent high velocity, and the blue color is used to represent low velocity. It is clear that the geomembrane containing a 2-mm-diameter geomembrane defect results in interface transmission concentrated around the defect. However, the geomembrane containing a 7-mm-diameter geomembrane defect results in more spread flow at the interface, and the red color representing the high velocity nearly reaches the edge of the specimen, suggesting a larger impact area below a geomembrane defect when the defect has a larger diameter. It should be noted that the measured interface transmissivity may be influenced by the specimen size and the imperable lateral boundary. Validations with large-scale experimental tests or field-scale tests are recommended for quantitative application.
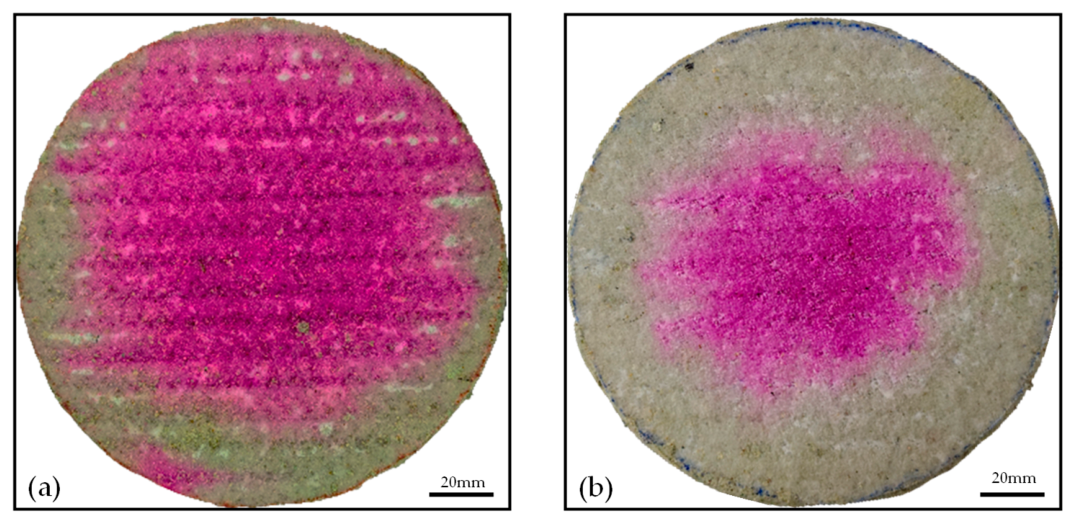
A similar phenomenon is also observed for the specimens evaluated under different stress conditions. As shown in Figure 9, the interface transmissivity at the geomembrane–GCL interface was always lower when the specimen was evaluated under 240 kPa than when evaluated under 40 kPa when other testing conditions were equal. This result is consistent with the results reported by [60]. Figure 10c,d also show that the specimen evaluated under 40 kPa has more spread flow at the interface than the specimen evaluated under 240 kPa, as illustrated by the more spread red color. The results of dye tests also confirm the spread flow at the interface when the specimen was evaluated under 40 kPa. As shown in Figure 11, compared to the specimen evaluated under 240 kPa, the red dye was more spread at the influent end when the specimen was evaluated under 40 kPa. The red dye was used to track the flow path, suggesting that the high effective stress was able to facilitate the contact between the geomembrane and GCL, reduce the impact area of the defect, and reduce the interface transmissivity. Both the dye test and the simulation suggest that the interface transmission was related to the diameter of the geomembrane defect and the stress above the geomembrane. Nevertheless, the edge of the specimen was not dyed by the red color in the dye test and was not predicted with high interface transmissivity in the modeling when the specimen was evaluated under 240 kPa. These phenomena did not suggest that the impact of a defect was smaller than a radial distance of 77.5 mm, because the no-flux boundary was created at the edge. In the service of a geomembrane, the impact area of a defect is likely to be larger than a 77.5 mm radius due to the lateral spread of the leakage along the interface, and a no-flux boundary is not realistic. Future work with additional experimental datasets is needed to establish a quantitatively validated predictive model.

3.5. Practical Implications

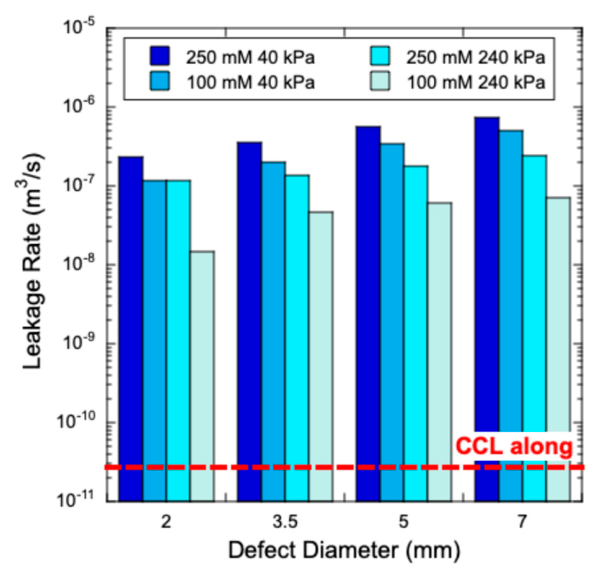
Compared to GCL alone, composite liners are able to reduce the leakage rate by up to 17 times, even when the geomembrane has a defect. Nevertheless, the GCLs evaluated in this study had a hydraulic conductivity higher than 2 × 10⁻⁷ m/s, which is higher than the requirement for a CCL, i.e., 1 × 10⁻⁹ m/s. The decreased leakage rate may not be sufficient to meet the criteria for a liner. The regulation requires a liner to have a leakage rate that is lower than the leakage rate of CCL alone (0.6 m thick). For CCL alone in the scenario of Figure 5a, the leakage rate for a 155 mm diameter CCL, calculated based on Darcy’s Law, is 2.8 × 10⁻¹¹ m3/s, which is still much lower than the leakage rates of the composite liners evaluated in this study, as shown in Figure 12. The high leakage rates in this study are due to the elevated hydraulic conductivity of the GCLs. The findings in this study suggest that a GCL composite liner is not able to achieve an equivalent or lower leakage rate than a CCL when the hydraulic conductivity of the GCL is elevated and the geomembrane contains defects. Geomembranes containing defects (even as small as 2 mm in diameter) are able to reduce the leakage rate compared to GCL alone, but the reduced leakage rate is less than 17×, which is not sufficient in engineering practice. Thus, it is still critical to evaluate the chemical compatibility between the GCL and the leachate to be contained for GCL composite liners.
This study also highlights the impact area of a geomembrane defect. It is clear that leachate passes through the geomembrane defect, gets spread at the GCL–geomembrane interface, and generates a large affected area around the defect. The impact area of a defect can be affected by the size of the defect, by the leachate chemistry, by the properties of the geomembrane and GCL, and by the stress above the geomembrane. In short, the impact area of a geomembrane defect is strongly related to the interface transmissivity between the GCL and geomembrane. The interface transmissivity can also be affected by the temperature of installation of the geomembranes and other factors in engineering practice, as discussed in the literature [60]. The impact area of a defect is likely to be larger than the size of the specimens evaluated in this study. It can be imagined that the leakage rate of the composite liner will decrease and be closer to the leakage rate of a CCL alone. This trend does not necessarily suggest that a composite liner can be used or not in engineering practice. This suggests that the selected study domain around geomembrane defects has an impact on the leakage rate comparison, and more rigorous criteria to select an appropriate sample size for the comparison are highly desired.

4. Conclusions

The paper investigates the leakage rate of GCL–geomembrane composite liners with geomembrane defects under chemical–mechanical coupled conditions, considering factors such as the defect size (2 to 7 mm), permeant chemistry (100 or 250 mM CaCl2), and effective stress (40 or 240 kPa). The main results are as follows:
(1)
The equivalent hydraulic conductivity of the composite liner was at most 17 times lower than that of the GCL alone, resulting in a corresponding reduction in leakage rate of up to 17 times. This reduced leakage rate is not sufficient to be lower than the leakage rate of a standard compacted clay liner (CCL). Thus, a GCL–geomembrane composite liner is not highly effective when the hydraulic conductivity of the GCL is significantly elevated due to the leachate chemistry.
(2)
Composite liners consistently showed a lower leakage rate than the GCL alone, even when the geomembrane contained defects. The leakage rate of the composite liner decreased due to the decrease in the size of the geomembrane defects, the increased stress above the geomembrane, and the decreased hydraulic conductivity of the GCL. These findings provide practical engineering suggestions to maintain a low leakage rate by minimizing the number and size of geomembrane defects, placing waste to increase stress above the geomembrane, and selecting a suitable GCL resistant to the target leachate.
(3)
Interface transmissivity at the GCL–geomembrane interface is also affected by the size of the geomembrane defect, the stress above the geomembrane, and the leachate chemistry. Because interface transmissivity controls the impact area of a geomembrane defect, it leads to varying leakage rates when different sizes of composite liners are evaluated. Consequently, rigorous criteria are needed for selecting appropriate sizes of the composite liners with geomembrane defects for the accurate evaluation of leakage rates.

Author Contributions

Conceptualization, J.H.; methodology, J.H. and J.L.; software, J.L.; validation, J.H. and J.L.; formal analysis, J.H. and J.L.; investigation, J.H. and J.L.; resources, J.H. and J.L.; data curation, J.H. and J.L.; writing—original draft preparation, J.H. and J.L.; writing—review and editing, J.H.; visualization, J.H. and J.L.; supervision, J.H.; project administration, J.H.; funding acquisition, J.H. All authors have read and agreed to the published version of the manuscript.

Funding

Financial support for Hou’s contributions to this study was provided by the National Natural Science Foundation of China (NSFC) (Nos. 52478349, 51978390), the Qinghai Provincial Department of Science and Technology International Cooperation Project, grant number [2025-HE-8061], and the China Scholarship Council (CSC 202506890127). And the APC was funded by [52478349].

Data Availability Statement

The original contributions presented in this study are included in the article. Further inquiries can be directed to the corresponding author.

Conflicts of Interest

The authors declare no conflicts of interest.

References

  1. Albright, W.H.; Benson, C.H.; Apiwantragoon, P. Field hydrology of landfill final covers with composite barrier layers. J. Geotech. Geoenviron. Eng. 2013, 139, 1–12. [Google Scholar] [CrossRef]
  2. Foose, G.J.; Benson, C.H.; Edil, T.B. Predicting leakage through composite landfill liners. J. Geotech. Geoenviron. Eng. 2001, 127, 510–520. [Google Scholar] [CrossRef]
  3. Foose, G.J.; Benson, C.H.; Edil, T.B. Comparison of solute transport in three composite liners. J. Geotech. Geoenviron. Eng. 2002, 128, 391–403. [Google Scholar] [CrossRef]
  4. Feng, Y.; Eun, J.; Moon, S.; Nam, Y. Assessment of gas dispersion near an operating landfill treated by different intermediate covers with soil alone, low-density polyethylene (LLDPE), or ethylene vinyl alcohol (EVOH) geomembrane. Environ. Sci. Pollut. Res. 2023, 30, 9672–9687. [Google Scholar] [CrossRef]
  5. Noh, D.-H.; Kim, S.; Calaunan, J.M.F.V.; Feng, Y.; Eun, J.; Kim, Y.-R. Bentonite as an engineered barrier material for nuclear waste repository––Geotechnical perspectives, key properties, knowledge gaps, and opportunities. Nucl. Eng. Technol. 2025, 57, 103700. [Google Scholar] [CrossRef]
  6. Zhu, J.; Wang, T.; Zhang, H.; Zhou, G. Alkaline buffer characteristics and mechanism of Gaomiaozi bentonite in high-level radioactive waste repository. Environ. Earth Sci. 2023, 82, 346. [Google Scholar] [CrossRef]
  7. Zhu, J.; Su, Z.; Zhang, H. Soil–water characteristic curves and hydraulic conductivity of Gaomiaozi bentonite pellet-contained materials. Environ. Earth Sci. 2022, 81, 92. [Google Scholar] [CrossRef]
  8. Xie, J.; Du, Q.; Tang, Q.; Gu, F. Use of geopolymer stabilized municipal solid waste incineration bottom ash as sustainable subgrade filler: Mechanical performance and environmental impact. Transp. Geotech. 2026, 56, 101798. [Google Scholar] [CrossRef]
  9. Rowe, R.K. Geosynthetic clay liners: Perceptions and misconceptions. Geotext. Geomembr. 2020, 48, 137–156. [Google Scholar] [CrossRef]
  10. Tan, Y. Effectiveness of Landfill Composite Liners in Containing per- and Polyfluoroalkyl Substances. Ph.D. Thesis, University of Wisconsin–Madison, Madison, WI, USA, 2024. [Google Scholar]
  11. Tan, Y.; Benson, C.H.; Yilmaz, M.; Bradshaw, S.L.; Edil, T.B. Hydraulic conductivity of compacted clay liners to landfill leachates containing PFAS. In Proceedings of the 9th International Congress on Environmental Geotechnics, Chania, Greece, 25–28 June 2023; pp. 252–258. [Google Scholar]
  12. Tan, Y.; Benson, C.H.; Youngblood, J. Hydraulic conductivity of bentonite-polymer composite geosynthetic clay liners with typical or elevated polymer loadings to coal combustion product leachates. In Proceedings of the 13th International Conference on Geosynthetics, Montreal, QC, Canada, 13–17 September 2026. [Google Scholar]
  13. Tan, Y.; Bradshaw, S.L.; Edil, T.B.; Benson, C.H. Hydraulic conductivity of geosynthetic clay liners and compacted clays to leachate with PFAS. J. Geotech. Geoenviron. Eng. 2026, in press. [Google Scholar]
  14. Tan, Y.; Benson, C.H. Evaluating diffusion of per- and polyfluoroalkyl substances through composite liners. In Proceedings of the GeoenvironMeet, ASCE, Louisville, KY, USA, 27 February 2025; pp. 127–137. [Google Scholar] [CrossRef]
  15. Federal Register. Solid waste disposal facility criteria: Final Rule. Fed. Regist. 1991, 56, 50978–51119. [Google Scholar]
  16. GB 18599-2020; Standard for Pollution Control on the Non-Hazardous Industrial Solid Waste Storage and Landfill. Ministry of Ecology and Environment of the People’s Republic of China: Beijing, China; China Environmental Science Press: Beijing, China, 2020.
  17. Rowe, R.K. Protecting the environment with geosynthetics: 53rd Karl Terzaghi Lecture. J. Geotech. Geoenviron. Eng. 2020, 146, 04020081. [Google Scholar] [CrossRef]
  18. Shackelford, C.D.; Benson, C.H.; Katsumi, T.; Edil, T.B.; Lin, L. Evaluating the hydraulic conductivity of GCLs permeated with non-standard liquids. Geotext. Geomembr. 2000, 18, 133–161. [Google Scholar] [CrossRef]
  19. Shackelford, C.D.; Sevick, G.W.; Eykholt, G.R. Hydraulic conductivity of geosynthetic clay liners to tailings impoundment solutions. Geotext. Geomembr. 2010, 28, 149–162. [Google Scholar] [CrossRef]
  20. Hou, J.; Chu, C.; Sun, Y.; Zhang, J.; Sun, R. Hydro-mechanical-chemical coupling effects on hydraulic conductivity of geosynthetic clay liners. Chin. J. Geotechn. Eng. 2026, 48, 608–618. (In Chinese) [Google Scholar] [CrossRef]
  21. Dong, X.; Wang, B.; Hu, Y. Hydraulic performance of sodium carboxymethyl cellulose-amended bentonite in vertical cutoff walls for containing acid mine drainage. Processes 2025, 13, 3866. [Google Scholar] [CrossRef]
  22. Tan, Y.; Chen, J.; Benson, C.H. Predicting hydraulic conductivity of geosynthetic clay liners using a neural network algorithm. In Proceedings of the Geo-Congress 2022, Charlotte, NC, USA, 20–23 March 2022; ASCE: Reston, VA, USA, 2022; pp. 21–28. [Google Scholar] [CrossRef]
  23. Tan, Y.; Benson, C.H.; Zhou, G.; Bradshaw, S.; Edil, T. Hydraulic conductivity of two geosynthetic clay liners with different bentonite granule sizes. In Proceedings of the GeoAmericas 2024, Toronto, ON, Canada, 28 April–1 May 2024. [Google Scholar] [CrossRef]
  24. Wang, B.; Xu, J.; Chen, B.; Dong, X.; Dou, T. Hydraulic conductivity of geosynthetic clay liners to inorganic waste leachate. Appl. Clay Sci. 2019, 168, 244–248. [Google Scholar] [CrossRef]
  25. Jo, H.Y.; Katsumi, T.; Benson, C.H.; Edil, T.B. Hydraulic conductivity and swelling of nonprehydrated GCLs permeated with single-species salt solutions. J. Geotech. Geoenviron. Eng. 2001, 127, 557–567. [Google Scholar] [CrossRef]
  26. Jo, H.Y.; Benson, C.H.; Edil, T.B. Hydraulic conductivity and cation exchange in non-prehydrated and prehydrated bentonite permeated with weak inorganic salt solutions. Clay Clay Min. 2004, 52, 661–679. [Google Scholar] [CrossRef]
  27. Jo, H.Y.; Benson, C.H.; Shackelford, C.D.; Lee, J.-M.; Edil, T.B. Long-term hydraulic conductivity of a geosynthetic clay liner permeated with inorganic salt solutions. J. Geotech. Geoenviron. Eng. 2005, 131, 405–417. [Google Scholar] [CrossRef]
  28. Tang, Q.; Liu, W.; Wang, H.Y.; Cheng, R.; Qian, Y.F. Membrane behavior of bentonite-amended Fukakusa clay in K, Na and Ca solutions. J. Cent. South Univ. 2016, 23, 3122–3131. [Google Scholar] [CrossRef]
  29. Katsumi, T.; Ishimori, H.; Ogawa, A.; Yoshikawa, K.; Hanamoto, K.; Fukagawa, R. Hydraulic conductivity of nonprehydrated geosynthetic clay liners permeated with inorganic solutions and waste leachates. Soils Found. 2007, 47, 79–96. [Google Scholar] [CrossRef]
  30. Kolstad, D.C.; Benson, C.H.; Edil, T.B. Hydraulic conductivity and swell of nonprehydrated geosynthetic clay liners permeated with multispecies inorganic solutions. J. Geotech. Geoenviron. Eng. 2004, 130, 1236–1249. [Google Scholar] [CrossRef]
  31. Tian, K.; Benson, C.H.; Likos, W.J. Hydraulic conductivity of geosynthetic clay liners to low-level radioactive waste leachate. J. Geotech. Geoenviron. Eng. 2016, 142, 04016037. [Google Scholar] [CrossRef]
  32. Tian, K.; Likos, W.J.; Benson, C.H. Polymer elution and hydraulic conductivity of bentonite–polymer composite geosynthetic clay liners. J. Geotech. Geoenviron. Eng. 2019, 145, 04019071. [Google Scholar] [CrossRef]
  33. Chen, J.; Benson, C.H.; Edil, T.B. Hydraulic conductivity of geosynthetic clay liners with sodium bentonite to coal combustion product leachates. J. Geotech. Geoenviron. Eng. 2018, 144, 04018008. [Google Scholar] [CrossRef]
  34. Chen, J.; Salihoglu, H.; Benson, C.H.; Likos, W.J.; Edil, T.B. Hydraulic conductivity of bentonite–polymer composite geosynthetic clay liners permeated with coal combustion product leachates. J. Geotech. Geoenviron. Eng. 2019, 145, 04019038. [Google Scholar] [CrossRef]
  35. Chen, X.; Tan, Y.; Copeland, T.; Chen, J.; Peng, D.; Huang, T. Polymer elution and hydraulic conductivity of polymer-bentonite geosynthetic clay liners to bauxite liquors. Appl. Clay Sci. 2023, 242, 107039. [Google Scholar] [CrossRef]
  36. Chen, X.; Tan, Y.; Chen, J.; Peng, D.; Huang, T.; Meng, C. Hydraulic conductivity and multi-scale pore structure of polymer-enhanced geosynthetic clay liners permeated with bauxite liquors. Geotext. Geomembr. 2024, 52, 46–58. [Google Scholar] [CrossRef]
  37. Pu, G.; Wang, X.; Tian, J.; Shi, L.; Tan, Y.; Chen, L. Geosynthetic clay liner for coal combustion product landfill: An environmental impact assessment. J. Environ. Manag. 2025, 395, 127886. [Google Scholar] [CrossRef] [PubMed]
  38. Zhou, G.; Tan, Y.; Peng, Y.; Zhang, H.; Zhang, P.; Chen, J.; Liu, P. Hydraulic conductivity of air-dried bentonite-sand blocks permeated with synthetic groundwater from radioactive waste repository. Can. Geotech. J. 2025, 62, 1–16. [Google Scholar] [CrossRef]
  39. Ma, G.; Zhang, H.; Ji, Z.; Tan, Y. Comparison of the swelling pressure of bentonite pellet-contained materials and powder. Constr. Build. Mater. 2021, 281, 122531. [Google Scholar] [CrossRef]
  40. Scalia, J.; Benson, C.H.; Finnegan, M. Alternate procedures for swell index testing of granular bentonite from GCLs. Geotech. Test. J. 2019, 42, 1169–1184. [Google Scholar] [CrossRef]
  41. Tan, Y.; Zhang, H.; Zhang, T.; Zhang, G.; He, D.; Ding, Z. Anisotropic hydro-mechanical behavior of full-scale compacted bentonite-sand blocks. Eng. Geol. 2021, 287, 106093. [Google Scholar] [CrossRef]
  42. Tan, Y.; Zhou, G.P.; Ding, Z.N.; Zhang, H.Y. Effect of desiccation on the hydraulic conductivity of compacted bentonite–sand blocks. IOP Conf. Ser. Earth Environ. Sci. 2021, 861, 042122. [Google Scholar] [CrossRef]
  43. Tan, Y.; Zhou, G.; Zhang, H.; Li, X.; Liu, P. Effect of drying cracks on swelling and self-healing of bentonite-sand blocks used as engineered barriers for radioactive waste disposal. J. Rock Mech. Geotech. Eng. 2024, 16, 1776–1787. [Google Scholar] [CrossRef]
  44. Wang, Y.; Zhang, H.; Tan, Y.; Zhu, J. Sealing performance of compacted block joints backfilled with bentonite paste or a particle-powder mixture. Soils Found. 2021, 61, 496–505. [Google Scholar] [CrossRef]
  45. Zhang, H.; Tan, Y.; Zhu, F.; He, D.; Zhu, J. Shrinkage property of bentonite-sand mixtures as influenced by sand content and water salinity. Constr. Build. Mater. 2019, 224, 78–88. [Google Scholar] [CrossRef]
  46. Calaunan, J.M.F.; Feng, Y.; Eun, J.; Kim, S.; Kim, Y.-R. Evaluation of Shearing Behavior of Inorganic Microfiber-Reinforced Bentonite for Engineered Barrier Materials. In Proceedings of the 57th U.S. Rock Mechanics/Geomechanics Symposium, Atlanta, GA, USA, 25–28 June 2023. [Google Scholar] [CrossRef]
  47. Zhu, J.H.; Tan, Y.; Benson, C.H.; Youngblood, J.; Bradshaw, S.; Edil, T.B. Using viscosity as an index for polymer loading of bentonite-polymer composite geosynthetic clay liners. In Proceedings of the GeoAmericas 2024, Toronto, ON, Canada, 28 April–1 May 2024; pp. 1–9. [Google Scholar] [CrossRef]
  48. Tang, Q.; Katsumi, T.; Inui, T.; Li, Z. Influence of pH on the membrane behavior of bentonite amended Fukakusa clay. Sep. Purif. Technol. 2015, 141, 132–142. [Google Scholar] [CrossRef]
  49. Zhou, P.; Wang, H.; Xu, C.; Fang, T.; Ma, G.; Liu, H. Geopolymers for stabilizing soils with diverse compositions. Sci. China Technol. Sci. 2026, 69, 1320701. [Google Scholar] [CrossRef]
  50. Tang, Q.; Gu, F.; Zhang, Y.; Zhang, Y.; Mo, J. Impact of biological clogging on the barrier performance of landfill liners. J. Environ. Manag. 2018, 222, 44–53. [Google Scholar] [CrossRef]
  51. Xiao, Y.; Zhao, C.; Cui, H.; Chen, Y.; Wu, B.; Liu, H. Microscale insights into enzyme-induced carbonate precipitation in rock-based microfluidic chips. Geotechnique 2025, 75, 846–857. [Google Scholar] [CrossRef]
  52. Xiao, Y.; Wang, Y.; Wang, S.; Evans, T.M.; Stuedlein, A.W.; Chu, J.; Zhao, C.; Wu, H.; Liu, H. Homogeneity and Mechanical Behaviors of Sands Improved by a Temperature-Controlled One-Phase MICP Method. Acta Geotech. 2021, 16, 1417–1427. [Google Scholar] [CrossRef]
  53. Xiao, Y.; He, X.; Liu, H. New lightweight geomaterials: Biocemented sand mixed with expanded polystyrene beads. Sci. China Technol. Sci. 2017, 60, 1118–1120. [Google Scholar] [CrossRef]
  54. Ma, G.L.; Xiao, Y.; He, X.; Wu, S.F.; Chu, J. Comparison of Biomineralization Kinetics Induced by Bacteria, Bacterial Enzyme, and Soybean Enzyme. Acta Geotech. 2025, 20, 2185–2200. [Google Scholar] [CrossRef]
  55. Ma, G.; Xiao, Y.; Chu, J.; Yin, Z.-Y.; Zhou, B.; Liu, H. Pore-scale investigation of MICP in simplified pore structures through microfluidic tests. Water Resour. Res. 2025, 61, e2024WR037807. [Google Scholar] [CrossRef]
  56. Ma, G.L.; Xiao, Y.; Liu, H.L.; Chu, J.; Yin, Z.-Y.; Jiang, N.-J. Migration and breakthrough of bacteria in heterogeneous soils and stabilization performance of bio-grouting. Can. Geotech. J. 2025, 62, 1–18. [Google Scholar] [CrossRef]
  57. Rowe, R.K.; Abdelatty, K. Leakage and contaminant transport through a single hole in the geomembrane component of a composite liner. J. Geotech. Geoenviron. Eng. 2013, 139, 357–366. [Google Scholar] [CrossRef]
  58. Rowe, R.K.; Fan, J. Effect of geomembrane hole geometry on leakage overlain by saturated tailings. Geotext. Geomembr. 2021, 49, 1506–1518. [Google Scholar] [CrossRef]
  59. Rowe, R.K.; Fan, J. A general solution for leakage through geomembrane defects overlain by saturated tailings and underlain by highly permeable subgrade. Geotext. Geomembr. 2022, 50, 694–707. [Google Scholar] [CrossRef]
  60. AbdelRazek, A.Y.; Rowe, R.K. Interface transmissivity of conventional and multicomponent GCLs for three permeants. Geotext. Geomembr. 2019, 47, 60–74. [Google Scholar] [CrossRef]
  61. Cao, L.-F.; Li, Y.-C.; Huang, B. Leakage of composite cutoff walls through geomembrane joint defects. Geotext. Geomembr. 2025, 53, 1063–1075. [Google Scholar] [CrossRef]
  62. Fan, J.; Rowe, R.K. Effect of subgrade on leakage through a defective geomembrane seam below saturated tailings. Geotext. Geomembr. 2023, 51, 360–369. [Google Scholar] [CrossRef]
  63. Fan, J.; Rowe, R.K. Effect of a lateral drainage layer on leakage through a defect in a geomembrane overlain by saturated tailings. Geotext. Geomembr. 2024, 52, 383–395. [Google Scholar] [CrossRef]
  64. Fan, Y.H.; Rowe, R.K.; Brachman, R.W.I.; Van Gulck, J. Impact of differential settlement on leakage through geomembranes in waste covers. Geosynth. Int. 2025, 32, 82–93. [Google Scholar] [CrossRef]
  65. Giroud, J.P.; Badu-Tweneboah, K.; Soderman, K.L. Comparison of leachate flow through compacted clay liners in landfill liner systems. Geosynth. Int. 1997, 4, 391–431. [Google Scholar] [CrossRef]
  66. Huang, B.; Cao, L.-F.; Li, Y.-C. Pollutant transport and performance evaluation in defective composite cutoff walls: Centrifuge test and numerical simulation. Soils Found. 2025, 65, 101618. [Google Scholar] [CrossRef]
  67. Tang, Q.; Katsumi, T.; Inui, T.; Takai, A.; Li, Z. Influence of Compaction Degree on Membrane Behavior of Compacted Clay Amended with Bentonite. In Proceedings of the Geo-Congress 2014: Geo-Characterization and Modeling for Sustainability, Atlanta, GA, USA, 23–26 February 2014; ASCE: Reston, VA, USA, 2014; pp. 1880–1889. [Google Scholar] [CrossRef]
  68. Zhan, L.T.; Zeng, X.; Li, Y.C.; Chen, Y.M. Analytical solution for one-dimensional diffusion of organic pollutants in a geomembrane–bentonite composite barrier and parametric analyses. J. Environ. Eng. 2014, 140, 57–68. [Google Scholar] [CrossRef]
  69. Wan, Y.; Dong, Z.; Cai, Y.; Xue, Q.; Liu, K.; Liu, L.; Guo, D. Geomembrane leaks detection and leakage correlation factor analysis of composite liner systems for fifty-five solid waste landfills in China. Environ. Technol. Innov. 2023, 32, 103308. [Google Scholar] [CrossRef]
  70. Hou, J.; Zhang, Y.; Xie, X. Experimental investigation of the effects of moisture levels on geocomposite drainage–geomembrane interface shear behavior. Sustainability 2025, 17, 7850. [Google Scholar] [CrossRef]
  71. ASTM D6913/D6913M-17; Standard Test Methods for Particle-Size Distribution (Gradation) of Soils Using Sieve Analysis. ASTM International: West Conshohocken, PA, USA, 2017. [CrossRef]
  72. Scalia, J.; Benson, C.H.; Bohnhoff, G.L.; Edil, T.B.; Shackelford, C.D. Long-term hydraulic conductivity of a bentonite-polymer composite permeated with aggressive inorganic solutions. J. Geotech. Geoenviron. Eng. 2014, 140, 04013025. [Google Scholar] [CrossRef]
  73. Scalia, J.; Bohnhoff, G.L.; Shackelford, C.D.; Benson, C.H.; Sample-Lord, K.M.; Malusis, M.A.; Likos, W.J. Enhanced bentonites for containment of inorganic waste leachates by GCLs. Geosynth. Int. 2018, 25, 392–411. [Google Scholar] [CrossRef]
  74. Benson, C.H.; Tan, Y.; Youngblood, J.; Bradshaw, S.L. Bentonite-polymer composite geosynthetic clay liners for heap leach liners. In Proceedings of the 5th International Conference on Heap Leach Mining Solutions, Sparks, NV, USA, 16–18 October 2022. [Google Scholar] [CrossRef]
  75. ASTM D6766; Standard Test Method for Evaluation of Hydraulic Properties of Geosynthetic Clay Liners Permeated with Potentially Incompatible Aqueous Solutions. ASTM: West Conshohocken, PA, USA, 2020. [CrossRef]
  76. Rowe, R.K.; Abdelatty, K. Modeling contaminant transport through composite liner with a hole in the geomembrane. Can. Geotech. J. 2012, 49, 773–781. [Google Scholar] [CrossRef]
  77. Li, Y.C.; Yao, S.Y.; Chen, C.; Chen, Y.M.; Chen, G.N.; Zhang, R.H. A solution for calculating the leakage rate through GMB/CCL composite liners with long defects. Comput. Geotech. 2023, 163, 105770. [Google Scholar] [CrossRef]
  78. Hou, J.; Sun, R.; Benson, C.H. Hydrodynamic assessment of bentonite granule size and granule swelling on hydraulic conductivity of geosynthetic clay liners. Geotext. Geomembr. 2023, 51, 93–103. [Google Scholar] [CrossRef]
  79. Hou, J.; Sun, Y.; Chu, C.; Sun, R. Numerical investigation of confining pressure effects on microscopic structure and hydraulic conductivity of geosynthetic clay liners. Processes 2024, 12, 980. [Google Scholar] [CrossRef]
Figure 1. Photos of GM specimens with various defect diameters. (a) Intact; (b) d = 2 mm; (c) d = 3.5 mm; (d) d = 5 mm; (e) d = 7 mm. Note: The inner black circle is the GM specimen, and the outer white ring is a rubber sheet used to ensure peripheral boundary sealing during the permeation tests.
Processes 14 01775 g001
Figure 2. Granule size distribution curve of the bentonite in the evaluated GCL.
Processes 14 01775 g002
Figure 3. X-ray diffraction (XRD) pattern and quantitative mineralogical composition of the granular sodium bentonite.
Processes 14 01775 g003
Figure 4. Illustration of the evaluated composite liner with a geomembrane defect (a) and the hydraulic conductivity testing in an ASTM D6766-compliant flexible-wall permeameter (b).
Processes 14 01775 g004
Figure 5. Illustration of landfill composite liner (a) and the simulation of the composite liner (b).
Processes 14 01775 g005
Figure 6. Leakage rate of composite liner evaluated under 40 kPa (a) or 240 kPa (b). The dashed lines represent the leakage rates of the GCL-only specimens (No GM).
Processes 14 01775 g006
Figure 7. Relative leakage rate of composite liner evaluated under 40 kPa (a) or 240 kPa (b).
Processes 14 01775 g007
Figure 8. Relative leakage rate of composite liner permeated with 100 mM CaCl2 (a) or 250 mM CaCl2 solution (b).
Processes 14 01775 g008
Figure 9. Interface transmissivity of composite liner permeated with 100 mM CaCl2 (a) or 250 mM CaCl2 solution (b).
Processes 14 01775 g009
Figure 10. Velocity fields across the cross-section of the composite liner permeated with 100 mM CaCl2 solution under various average effective stresses and geomembrane defect diameters (d): (a) 40 kPa, d = 2 mm; (b) 40 kPa, d = 7 mm; (c) 40 kPa, d = 5 mm; and (d) 240 kPa, d = 5 mm.
Processes 14 01775 g010
Figure 11. Dye test results of the composite liner permeated with 100 mM CaCl2 solution (defect diameter d = 5 mm) under an average effective stress of (a) 40 kPa and (b) 240 kPa.
Processes 14 01775 g011
Figure 12. Leakage rate of GCL–geomembrane composite liner with a geomembrane defect compared to the leakage rate of a standard CCL.
Processes 14 01775 g012
Table 1. Basic properties of the evaluated geomembrane [70].
Thickness
(mm)
Density
(kg/m3)
Tensile Strength at Yield
(N/mm)
Tensile Elongation at Yield or Break (%)Asperity Height (mm)
294933120.25
Table 2. Basic properties of the evaluated GCL and bentonite.
MaterialMass per Unit Area (kg/m2)Average Thickness (mm)Specific GravitySwell Index in Deionized Water (mL/2 g)As Reserved Water Content (%)
GCL5.56.02.6523.57.4
Table 3. Parameters used in the simulation.
MaterialThickness (mm)Hydraulic Conductivity, k (m/s)
GM21 × 10−16
Geomembrane defect20.1
Interface1 TBD a
GCL6 From Table 4
a TBD means to be determined in the simulation.
Table 4. Summary of the equivalent hydraulic conductivity and testing results of the composite liner with a geomembrane defect.
Concentration (mM)Effective
Stress (kPa)
Defect Diameter, d (mm)PVFPost-Test Water Content of GCL (%)Equivalent Hydraulic Conductivity,
ke (m/s)
Leakage Rate,
Q (m3/s)
Interface Transmissivity, θ (m2/s)
10040a5.1566.25.6 × 10−75.3 × 10⁻⁷
23.4965.11.6 × 10−71.1 × 10−73.0 × 10−7
3.53.4464.52.7 × 10−71.9 × 10−75.2 × 10−7
55.2265.64.7 × 10−73.3 × 10−71.4 × 10−6
72.8865.87.0 × 10−75.0 × 10−71.1 × 10−5
2404.1151.82.7 × 10−72.6 × 10⁻⁷
24.1451.42.1 × 10−81.5 × 10−82.9 × 10−8
3.54.7452.16.5 × 10−84.6 × 10−89.6 × 10−8
54.5151.08.5 × 10−86.0 × 10−81.2 × 10−7
73.9452.59.8 × 10−86.9 × 10−81.2 × 10−7
250405.4659.58.2 × 10−77.8 × 10⁻⁷
23.6558.83.2 × 10−72.3 × 10−77.1 × 10−7
3.54.1360.25.0 × 10−73.5 × 10−71.1 × 10−6
53.8161.17.9 × 10−75.6 × 10−73.1 × 10−6
73.9959.81.0 × 10−67.1 × 10−71.2 × 10−5
2404.5049.53.5 × 10−73.3 × 10⁻⁷
25.1848.81.6 × 10−71.1 × 10−73.8 × 10−7
3.54.1049.21.9 × 10−71.3 × 10−73.9 × 10−7
53.2550.62.4 × 10−71.7 × 10−75.4 × 10−7
73.2548.53.4 × 10−72.4 × 10−71.1 × 10−6
a—No geomembrane.
Disclaimer/Publisher’s Note: The statements, opinions and data contained in all publications are solely those of the individual author(s) and contributor(s) and not of MDPI and/or the editor(s). MDPI and/or the editor(s) disclaim responsibility for any injury to people or property resulting from any ideas, methods, instructions or products referred to in the content.