Article

Improved Mechanistic Modeling of TBM Disc Cutter Wear and Comparison with Data-Driven Prediction Models

1
Henan Qianping Reservoir Irrigation District Project Company, Luoyang 471200, China
2
Henan Provincial Water Conservancy Technology Application Center, Zhengzhou 450003, China
3
Henan Key Laboratory of Safety Technology for Water Conservancy Project, Zhengzhou 450003, China
4
Ruzhou Water Conservancy Bureau, Pingdingshan 467000, China
5
School of Water Conservancy and Transportation, Zhengzhou University, Zhengzhou 450001, China
*
Author to whom correspondence should be addressed.
Processes 2026, 14(11), 1732; https://doi.org/10.3390/pr14111732
Submission received: 24 April 2026 / Revised: 14 May 2026 / Accepted: 22 May 2026 / Published: 26 May 2026

Abstract

To improve the accuracy of cutter wear and service life prediction for disc cutters, an improved normal force model is established based on the traditional CSM model by considering the supporting force and friction acting on the disc cutter from the side crushing zones. By incorporating the micro-mechanism of abrasive wear, an analytical model for the radial wear of the disc cutter and a service life prediction model are derived. Meanwhile, a regression model for cutter wear is established based on field operational parameters and cutter wear data. The mechanistic model is validated using field data from a tunnel project in Guangdong, China, and the results show that the average prediction errors of wear and service life are 8.13% and 8.85%, respectively, which are significantly lower than those of the traditional CSM model. Further comparative analysis between the two types of models is conducted, and the results indicate that the regression model achieves average prediction errors of 7.57% and 7.86% for wear and service life, respectively, showing higher prediction accuracy than the mechanistic model. The results demonstrate that the mechanistic model is suitable for revealing the wear mechanism of the disc cutter, while the regression model is more applicable for engineering prediction, and the two approaches can be used in a complementary manner.

1. Introduction

With the continuous development of shield tunneling technology, its application in underground space construction has become increasingly widespread, particularly showing significant advantages in complex engineering conditions such as large-diameter tunnels [1], special-shaped cross-section tunnels [2], and high water-pressure tunnels [3]. Due to its high construction efficiency, good safety performance, and minimal disturbance to the surrounding environment, the shield tunneling method has been widely applied in underground engineering projects such as subsea tunnels [4], water conveyance tunnels [5], and urban utility tunnels [6]. However, with the expanding application of the shield tunneling method, several critical construction issues have gradually become prominent, such as difficulties in shield attitude control, insufficient excavation face stability, mud cake formation on the cutterhead, and cutter wear [7,8,9,10,11]. Among these issues, cutter wear is the most common and unavoidable problem during shield tunneling, and it is particularly significant under rock ground conditions, which not only reduces tunneling efficiency and increases cutter replacement frequency and construction costs, but may also affect engineering safety and schedule control. Therefore, research on cutter wear and service life prediction of disc cutters is of great engineering significance.
In terms of mechanical models for rock fragmentation by disc cutters, existing studies are mainly based on theories of indentation rock breaking, indentation–shear rock breaking, and combined rock breaking [12,13,14]. Among them, the CSM model proposed by Ozdemir and the improved model developed by Rostami are the most widely used [15], and have been extensively applied in studies on force analysis of disc cutters, cutter wear prediction, and service life evaluation [16]. To improve the applicability of the CSM model under different rock types and operating conditions, some researchers have carried out improvement studies focusing on the incorporation of operational parameters, model simplification, and enhancement of prediction accuracy [17]. However, the existing CSM model and its related improvements generally simplify the forces acting on the disc cutter as the result of the crushing zone directly beneath the cutter edge, while insufficiently considering the forces from the side crushing zones, which makes it difficult to fully reflect the complex force conditions during the actual rock fragmentation process of the disc cutter, thereby limiting, to some extent, the accuracy of cutter wear and service life prediction methods established based on this model [14,16].
In terms of cutter wear prediction, existing studies can generally be divided into two categories: one is theoretical prediction models based on force analysis of the disc cutter and abrasive wear theory, and the other is empirical prediction models based on field monitoring data and statistical learning methods. Theoretical models are usually established on the basis of force models of the disc cutter, combined with abrasive wear theory, friction energy theory, or cutter kinematic relationships to develop prediction formulas for wear and service life [18,19,20,21]. Such methods have relatively clear mechanical and physical foundations and can reveal the wear mechanism of the disc cutter as well as the roles of related parameters, but due to the simplification of the force model itself and the fact that model parameters are often taken as empirical values or regional average values, their prediction results are often conservative and still show some deviation from the actual wear conditions under complex engineering environments [18,19,22]. Empirical models, by contrast, are mainly based on rock parameters, disc cutter parameters, and operational parameters, and establish prediction relationships for cutter wear through regression analysis or intelligent algorithms [23,24]. Such models usually exhibit good engineering fitting capability and high prediction accuracy, but their ability to explain the underlying mechanism is relatively limited, and their generalization to different engineering conditions is also restricted to some extent [25,26].
In summary, existing studies on cutter wear prediction have formed two main technical approaches, namely mechanistic models and empirical models, but several limitations still remain: (1) The widely used CSM model insufficiently considers the forces from the side crushing zones of the disc cutter, resulting in limited accuracy of the wear and service life prediction models established based on it [16,17]. (2) Although empirical models exhibit good field prediction capability, they are insufficient in revealing the wear mechanism of the disc cutter and the roles of key parameters [25,26]. (3) Studies on the unified validation, systematic comparison, and applicability analysis of mechanistic and empirical models are still relatively limited. To address these limitations, this study develops an improved mechanistic model for disc cutters by incorporating the effect of the side crushing zones and establishes a regression-based model using field data. Furthermore, a systematic comparison between the two models is conducted to evaluate their prediction performance and applicability.
Based on the traditional CSM model, an improved normal force model of the disc cutter is first established by considering the supporting force and friction exerted by the side crushing zones. Then, by incorporating the micro-mechanism of abrasive wear, an analytical model for cutter wear and a service life prediction model are derived. Meanwhile, a regression model for cutter wear is developed using field operational parameters. Finally, the prediction capabilities of the two types of models are validated using engineering case data, and a comparative analysis is conducted in terms of wear prediction, service life prediction, and engineering applicability. The results are expected to provide a reference for cutter wear evaluation, service life prediction, and cutter replacement decision-making in shield tunneling.

2. Development of Two Types of Cutter Wear Prediction Models

2.1. Mechanistic Model for Cutter Wear Prediction Based on Force Analysis

2.1.1. Traditional CSM Force Model for Disc Cutter

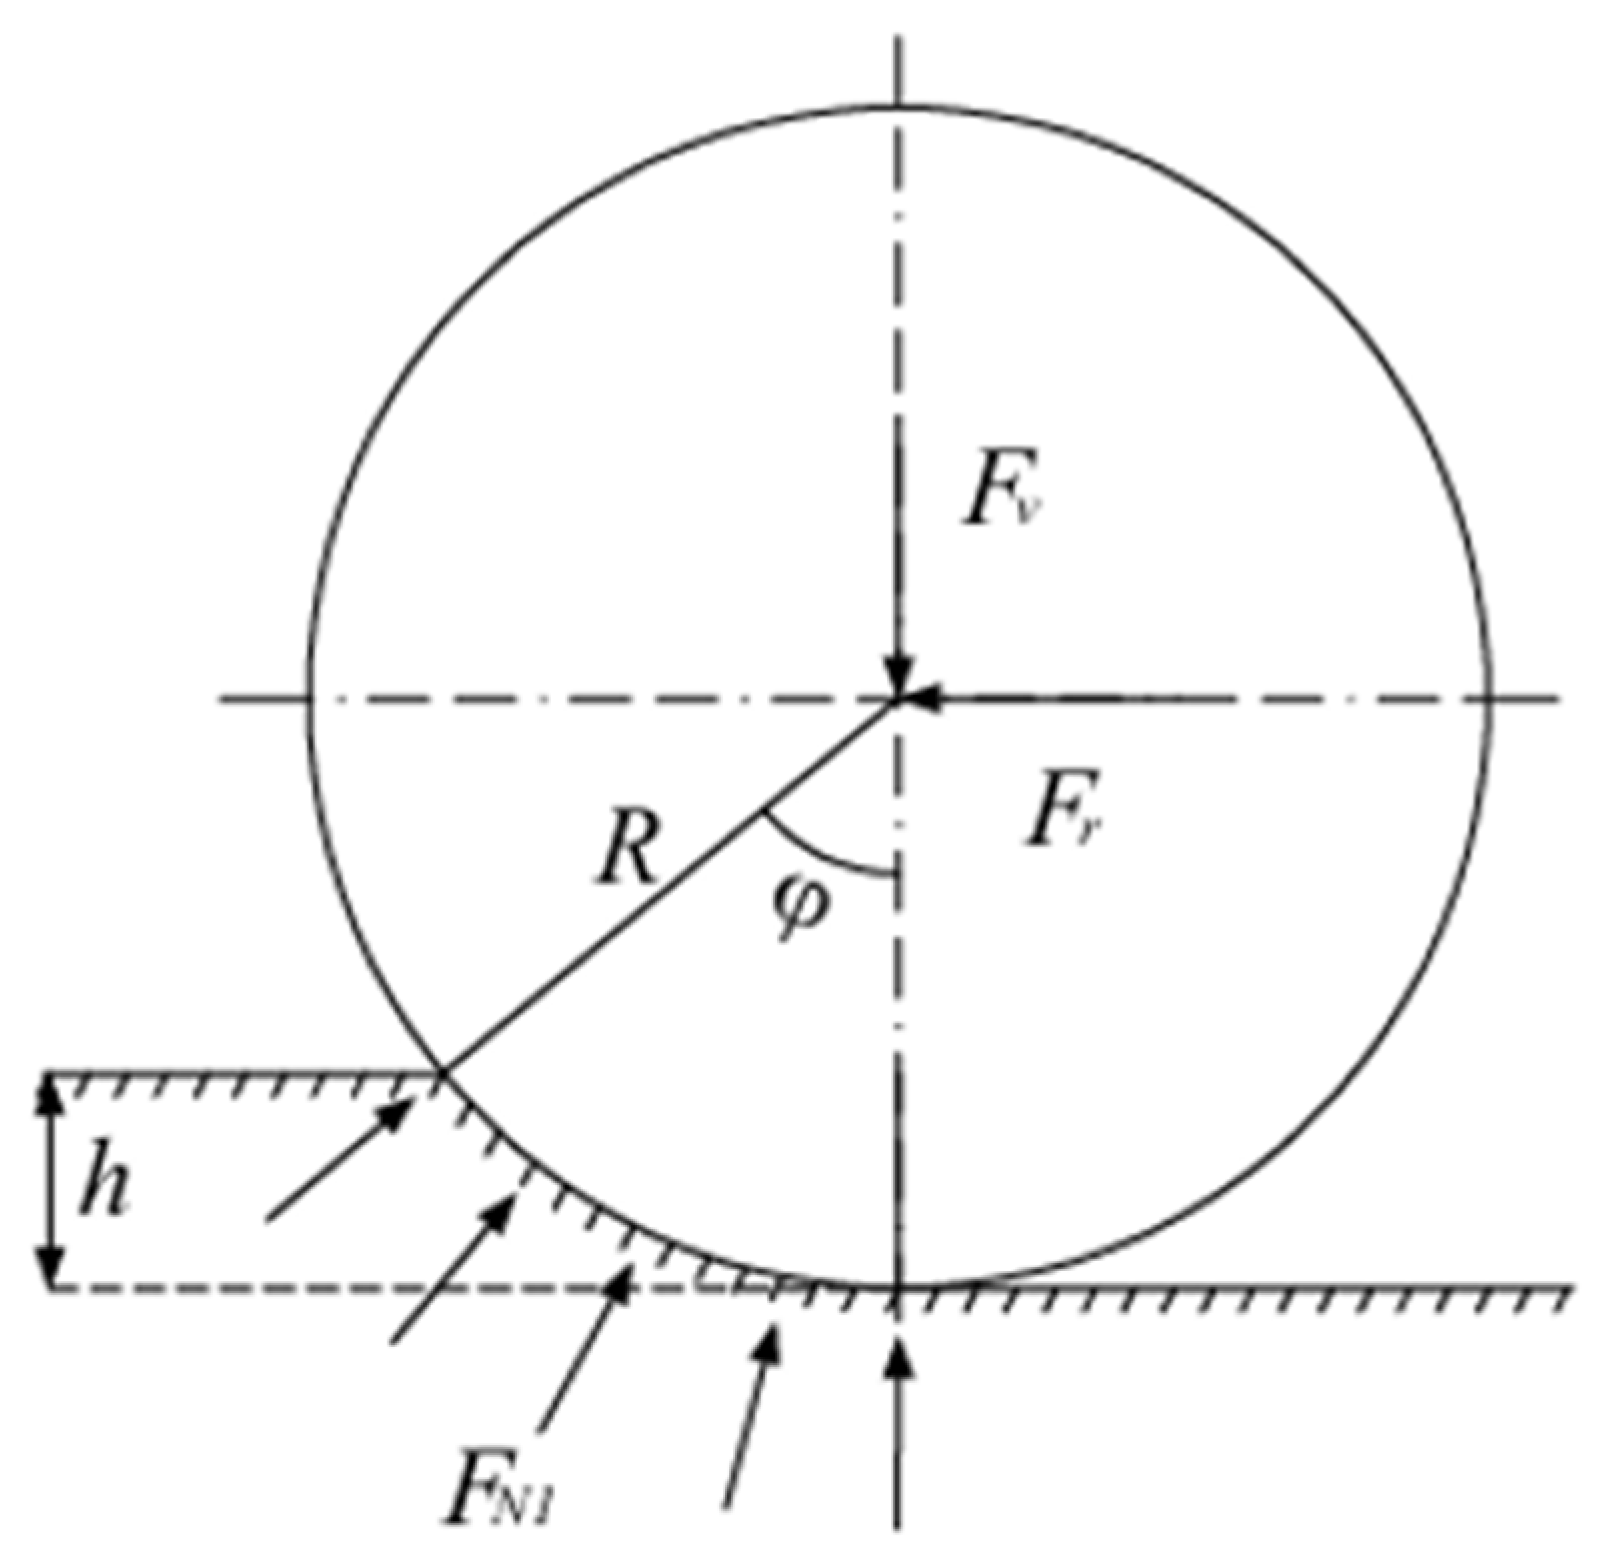
At present, in studies on the force analysis of constant cross-section disc cutters, the CSM model is widely used [15]. The analysis of rock-breaking forces of disc cutters is also based on the CSM model, as illustrated in Figure 1.
The normal force of the disc cutter, F v 1 , can be expressed as:
F v 1 = F N 1 cos φ 2 = T R P 0 φ 1 + ψ cos φ 2
where F N 1 is the resultant force acting on the disc cutter during rock fragmentation; P 0 is the pressure in the crushing zone beneath the disc cutter; φ is the contact angle between the disc cutter and the rock; θ is the edge angle of the disc cutter; T is the edge width of the disc cutter; R is the radius of the disc cutter; and ψ is the tip pressure distribution coefficient.
Schematic drawings and data plots in this study were prepared using AutoCAD 2025 (Autodesk, Inc., San Francisco, CA, USA) and Origin 2024 (OriginLab Corporation, Northampton, MA, USA), respectively.

2.1.2. Force Analysis of the Side Crushing Zones of the Disc Cutter

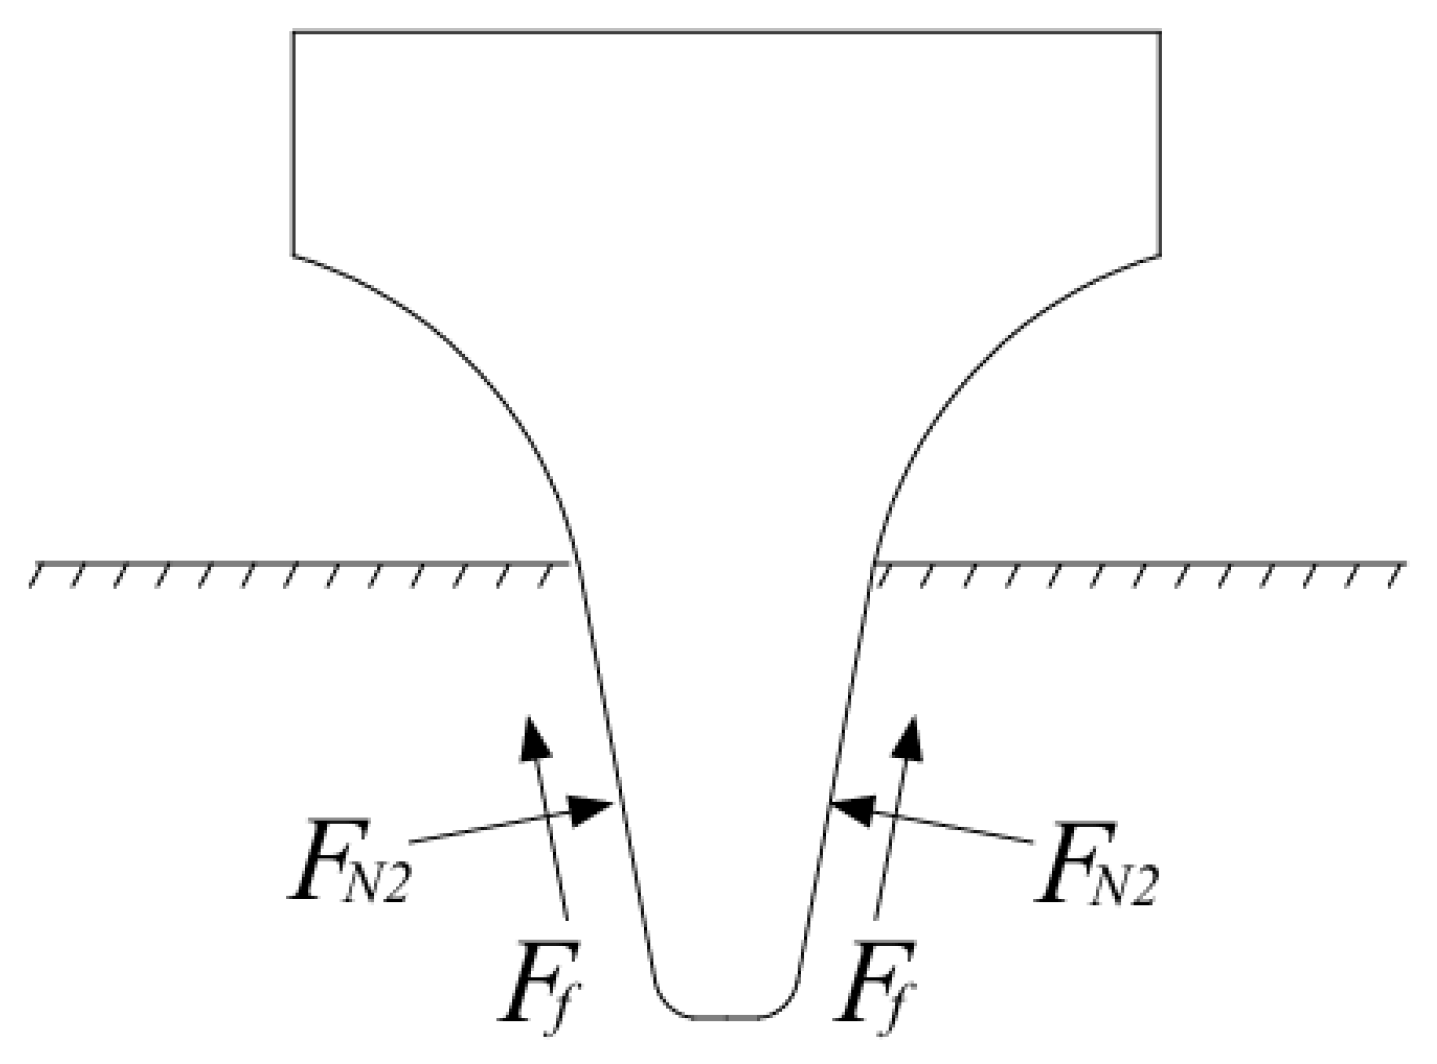
To analyze the normal force acting on the disc cutter induced by the shear crushing zones on both sides, the crushing zones on the sides of the disc cutter are treated as bodies subjected to the combined action of supporting force and friction. As shown in Figure 2, the effect of the shear crushing zones on both sides of the disc cutter is mainly represented by the supporting force F N 2 and the friction force F f . Based on the previously described limit equilibrium condition of the shear-crushed material, together with the Mohr–Coulomb strength criterion and the static friction condition, the supporting force and friction force on the side contact surface of the disc cutter can be obtained as follows:
F N 2 = c R h s i n   φ c o s   ϕ b c o s   β s i n   γ c o s   ( θ + β + γ + ϕ b )
F f = μ F N 2 = c R h s i n   φ c o s   ϕ b s i n   β s i n   γ c o s   ( θ + β + γ + ϕ b )
where c is the cohesion of the rock; R is the radius of the disc cutter; h is the penetration depth of the disc cutter; φ is the contact angle between the disc cutter and the rock; φ b is the internal friction angle of the rock; β is the friction angle between the disc cutter and the rock; γ is the angle between the shear failure plane and the horizontal plane; θ is the edge angle of the disc cutter; and μ = t a n   β .
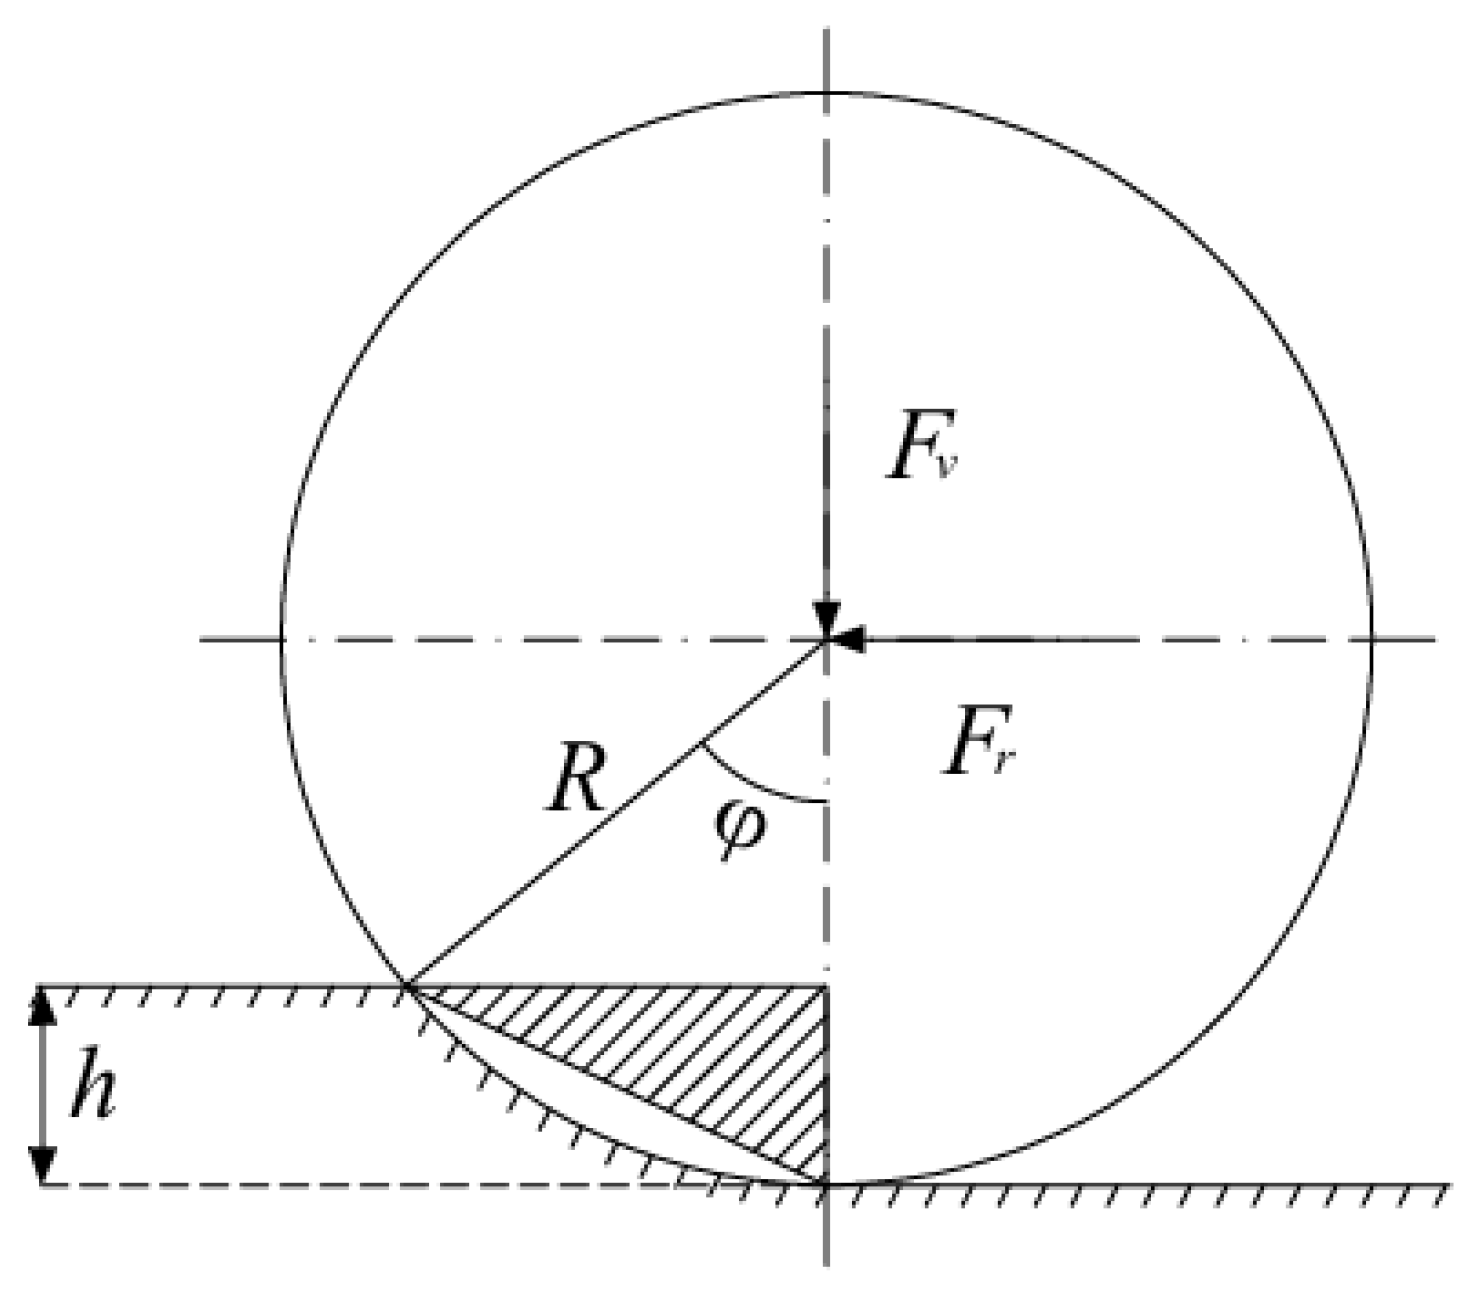
To further determine the vertical components of the forces acting on the side surfaces of the disc cutter, the geometric relationship in the contact zone between the disc cutter and the rock is considered, and the projection of the contact surface onto the horizontal direction is simplified as the shaded area shown in Figure 3. Accordingly, the supporting force F N 2 and the friction force F f can be decomposed into their vertical components, respectively.
For the supporting force F N 2 , the corresponding vertical component can be expressed as:
F v 2 = F N 2 s i n   θ c o s φ 2
Substituting Equation (3) into the above equation yields:
F v 2 = c R h s i n   θ s i n   φ c o s   ϕ b c o s   β c o s φ 2 s i n   γ c o s ( θ + β + γ + ϕ b )
Similarly, for the friction force F f , the corresponding vertical component can be expressed as:
F v 3 = F f c o s   θ c o s φ 2
Substituting Equation (4) into the above equation yields:
F v 3 = c R h s i n   β s i n   φ c o s   θ c o s   ϕ b c o s φ 2 s i n   γ c o s ( θ + β + γ + ϕ b )
Thus, the expressions for the vertical components of the supporting force and friction force in the side shear crushing zones of the disc cutter can be obtained, providing a basis for the subsequent analysis of the normal force acting on the disc cutter.

2.1.3. Cutter Wear Prediction Model

Micro-Mechanism of Abrasive Wear
The cutter wear of disc cutters in shield tunneling is essentially a load-induced surface material removal process, and the contributions of adhesive wear and fatigue wear to the total wear are much smaller than that of three-body abrasive wear, which occurs at the three-phase interface among the disc cutter, rock debris, and rock mass, where mineral particles in the crushing zone induce plastic deformation (dominated by micro-ploughing) or brittle fracture (characterized by microcrack propagation). Accordingly, three-body abrasive wear is taken as the dominant mechanism for constructing the cutter wear prediction model in this study.
Based on the abrasive wear theory proposed by Rabinowicz [27], a conical asperity assumption is adopted, and a calculation formula for the wear volume per unit sliding distance is derived. This formula establishes a quantitative relationship between the wear volume and the normal load, material yield strength, and abrasive characteristics:
V = K n × 1 2 2 r h = K W π r 2 σ s × r 2 tan θ = K W π tan θ σ s
V = K s W π σ s
where σ s is the yield strength of the cutter ring; is the normal load; is the abrasive wear coefficient.
The key to calculating the wear volume is to determine the normal load, namely the normal force of the disc cutter. In this study, the CSM normal force model and the improved normal force model are transformed by trigonometric identity conversion and Taylor series approximation, thereby eliminating the dependence on the contact angle φ , and establishing a direct mapping relationship between the normal force and the penetration depth, for which the simplified power-function expressions are given as:
F v a = 2.43 R 1 2 T 5 6 h 1 3 S 1 3 σ c 2 3 σ t 1 3
F v b = R 1 2 h 3 2 2.43 T 5 6 S 1 3 h 2 9 σ c 2 3 σ t 1 3 + 1.41 c sin θ + β cos ϕ b sin γ cos θ + β + γ + ϕ b
Substituting the simplified normal force models, Equations (10) and (11), into Equation (8) yields:
V a = 0.77 K s R 1 2 T 5 6 h 1 3 S 1 3 σ c 2 3 σ t 1 3 σ s
V b = K s R 1 2 h 3 2 σ s 0.77 T 5 6 S 1 3 h 2 9 σ c 2 3 σ t 1 3 + 0.45 c sin θ + β cos ϕ b sin γ cos θ + β + γ + ϕ b
Analytical Model for Radial Wear
The prediction of radial wear of the disc cutter requires coupling the micro-mechanism of abrasive wear with kinematic characteristics. During the tunneling process, the disc cutter undergoes a combined motion of revolution and rotation, and the geometric characteristics of the resulting trajectory directly control the contact path between the cutter ring and the rock mass as well as the wear distribution.
Based on the kinematic analysis of the disc cutter, a calculation formula for the radial wear per revolution is derived. This formula considers key factors such as the contact arc length, normal load, and material properties:
ξ = V 2 R h 2 π R T
After the cutterhead advances a distance of L , the number of rotations of the disc cutter installed at radius R i can be calculated based on the advance distance, cutterhead rotational speed, and installation radius. By combining the expression for the number of rotations with the wear per revolution formula, the cumulative radial wear can be obtained:
ξ = V L R i 2 R h 2 π h T R 2
Substituting Equations (12) and (13) into Equation (15) yields the cutter wear prediction model:
ξ a = 0.173 K s L R i S 1 3 σ c 2 3 σ t 1 3 σ s R T 1 6 h 1 6
ξ b = K s h L R i R T σ s 0.173 T 5 6 S 1 3 σ c 2 3 σ t 1 3 h 7 6 + 0.1 c sin θ + β cos ϕ b sin γ cos θ + β + γ + ϕ b
where ξ a is the wear prediction model established based on the CSM model and ξ b is the wear prediction model established based on the improved CSM model.
Service Life Prediction Model for Disc Cutter
The service life of the disc cutter is a key factor restricting the excavation efficiency of shield tunneling in rock strata, and its failure process directly determines the frequency of machine downtime for cutter replacement and the controllability of the construction schedule. To establish a quantitative service life prediction model, this section integrates the dynamic evolution equation of radial wear of the disc cutter established above, and, through the mapping mechanism between wear rate and operational parameters, derives an analytical service life prediction model based on the cumulative wear threshold:
According to the wear equation, Equation (15), the radial wear rate of the disc cutter can be obtained as:
ζ = ξ L = V R i 2 R h 2 π h T R 2
The radial wear rate of the disc cutter can thus be expressed as:
ζ a = 0.173 K s R i S 1 3 σ c 2 3 σ t 1 3 σ s R T 1 6 h 1 6
Similarly, the radial wear rate based on the improved model can be expressed as:
ζ b = K s h R i R T σ s 0.173 T 5 6 S 1 3 σ c 2 3 σ t 1 3 h 7 6 + 0.1 c sin θ + β cos ϕ b sin γ cos θ + β + γ + ϕ b
For face disc cutters, the replacement criterion is generally that the maximum wear does not exceed 20 mm, by substituting the maximum allowable wear into Equation (18), the maximum advance distance L before cutter replacement can be obtained as:
L 20 ζ m a x
By combining Equations (19)–(21), the service life prediction model of the disc cutter can be obtained as:
L max a = 115.6 σ s R T 1 6 h 1 6 K s R i S 1 3 σ c 2 3 σ t 1 3
L max b = 20 R T σ s h K s R i 0.173 T 5 6 S 1 3 σ c 2 3 σ t 1 3 h 7 6 + 0.1 c sin θ + β cos ϕ b sin γ cos θ + β + γ + ϕ b
where L max a is the service life prediction model of the disc cutter established based on the CSM model and L max b is the service life prediction model of the disc cutter established based on the improved CSM model.
The wear of the disc cutter is essentially a process in which the material on the cutter ring surface is gradually removed under the combined action of normal load and relative sliding. To establish the cutter wear and service life prediction model, the Rabinowicz abrasive wear theory is adopted, and the wear of the cutter ring surface is regarded as the cumulative result of numerous microscopic cutting actions of abrasive particles. According to this theory, the wear volume per unit sliding distance is closely related to the normal load acting on the abrasive particles, and can be expressed as:
V = K s W π σ s
In the equation, V is the wear volume, W is the normal load, σs is the yield strength of the cutter ring, and Ks is the abrasive wear coefficient. According to Equation (24), the key to predicting disc cutter wear lies in the accurate determination of the normal load. Since the disc cutter is primarily subjected to vertical force during rock fragmentation, the vertical force can be taken as the fundamental load for calculating the wear volume.
For the vertical force modeling, both the CSM model and the previously established cutter normal force model are adopted for analysis. Considering that the penetration depth h of the disc cutter during actual tunneling is much smaller than the cutter radius R, small-angle approximations can be applied to the contact angle and the associated trigonometric relationships, thereby simplifying the original expression of the vertical force into a form more suitable for engineering applications. By substituting the simplified vertical force expression into Equation (24), the corresponding wear volume expression can be obtained.
To further derive the radial wear of the disc cutter from the wear volume, it is necessary to consider the kinematic geometric relationship of the cutter on the rock surface. Assuming that the contact arc length between the cutter and the rock during one full rotation is s, the radial wear per revolution can be expressed as
ξ = V s 2 π R T
where R is the cutter radius, T is the cutter ring width, and Vs is the wear volume corresponding to one revolution of the disc cutter. For small penetration conditions, the contact arc length between the cutter and the rock can be approximately expressed as
s = R φ 2 R h
If the total advance distance of the shield cutterhead is L, and the installation radius of the i-th disc cutter is Rt, then the total number of rotations of the cutter can be expressed as
n t = L R t h R
By combining the wear per revolution with the total number of rotations, a prediction model for the total radial wear of the disc cutter can be established. Based on the CSM normal force model and the vertical force model proposed in this study, the final prediction equations for the radial wear of the disc cutter can be obtained as
ξ a = 0.173 K s L R t S 1 3 σ c 2 3 σ t 1 3 σ s R T 5 6 h 1 6
ξ b = K s h L R t R T σ s 0.173 T 5 6 S 1 3 σ c 2 3 σ t 1 3 h 7 6 0.1 c s i n ( θ + β ) c o s   ϕ b s i n   γ c o s ( θ + β + γ + ϕ b )
where ξ a and ξ b are the radial wear prediction models established based on the CSM model and the proposed vertical force model, respectively; S is the cutter spacing; σ c and σ t are the uniaxial compressive and tensile strengths of the rock, respectively; c is the cohesion; ϕ b is the internal friction angle; θ is the cutter tip angle; β is the friction angle between the cutter and the rock; and γ is the breakage angle.
On this basis, to further evaluate the service performance of the disc cutter, a maximum allowable wear of 20 mm is adopted as the replacement criterion, and the maximum advance distance of the cutter can be expressed as:
L m a x = 20 ζ
By substituting Equations (28) and (29) into Equation (30), the cutter life prediction expressions based on the two vertical force models can be obtained:
L max a = 115.6 σ s R T 5 6 h 1 6 K s R t S 1 3 σ c 2 3 σ t 1 3
L max b = 20 R T σ s h K s R t 0.173 T 5 6 S 1 3 σ c 2 3 σ t 1 3 h 7 6 0.1 c s i n ( θ + β ) c o s   ϕ b s i n   γ c o s ( θ + β + γ + ϕ b )
where L max a is the cutter life prediction model established based on the CSM model, and L max b is the cutter life prediction model established based on the vertical force model.

2.1.4. Qualitative Comparison of Different Wear Mechanisms

Although three-body abrasive wear is adopted as the dominant mechanism in the proposed model, disc cutter wear in actual tunnelling may involve different wear modes. In the investigated conditions, the cutter ring mainly interacts with the tunnel face and crushed rock fragments. Hard mineral particles and rock debris can enter the cutter–rock contact interface, causing repeated scratching, ploughing, and material removal. Therefore, three-body abrasive wear is considered the dominant wear mechanism in this study.
However, adhesive wear and fatigue wear may also occur under specific lithological and operating conditions. Adhesive wear is usually associated with high local contact pressure, local sliding, and direct contact at the cutter–rock interface, while fatigue wear is mainly related to cyclic rolling contact, impact vibration, and repeated loading–unloading. These mechanisms may lead to local adhesion, peeling, microcracks, spalling, or cutter ring chipping. Therefore, their contributions are qualitatively recognized, although they are not explicitly included in the quantitative wear calculation of the present model.
To clarify the applicability of the proposed model, different wear mechanisms are qualitatively compared in Table 1. The proposed model mainly focuses on normal abrasive material loss and is not intended to predict abnormal cutter damage such as severe chipping, large-scale spalling, or cutter ring fracture. Relevant multi-wear-mode studies have also been cited for comparison.

2.2. Cutter Wear Prediction Model Based on Operational Parameters

2.2.1. Project Overview

When theoretical prediction models are applied to practical engineering projects, the prediction results usually show some deviation from the measured values due to factors such as the dispersion of rock parameters, fluctuations in construction parameters, and the complexity of field working conditions. To further improve the prediction accuracy of cutter wear, a regression model considering the influence of operational parameters is established based on the above theoretical model analysis and the cutter wear data together with the operational parameters collected from the shield tunneling site.
The case study is a shield tunnel section of a metro project in Shenyang, China. This section was excavated using an earth pressure balance shield, with a shield diameter of 6280 mm. The geological conditions along the tunnel alignment are relatively complex, mainly involving strongly and moderately weathered slate as well as diabase strata, and local sections are characterized by high quartz particle content, non-uniform hardness, and well-developed fractures, which make cutter wear more prominent. Based on the cutter wear data collected from the project site and the synchronously recorded operational parameters, a regression-model study on cutter wear is carried out.

2.2.2. Analysis of Influencing Factors

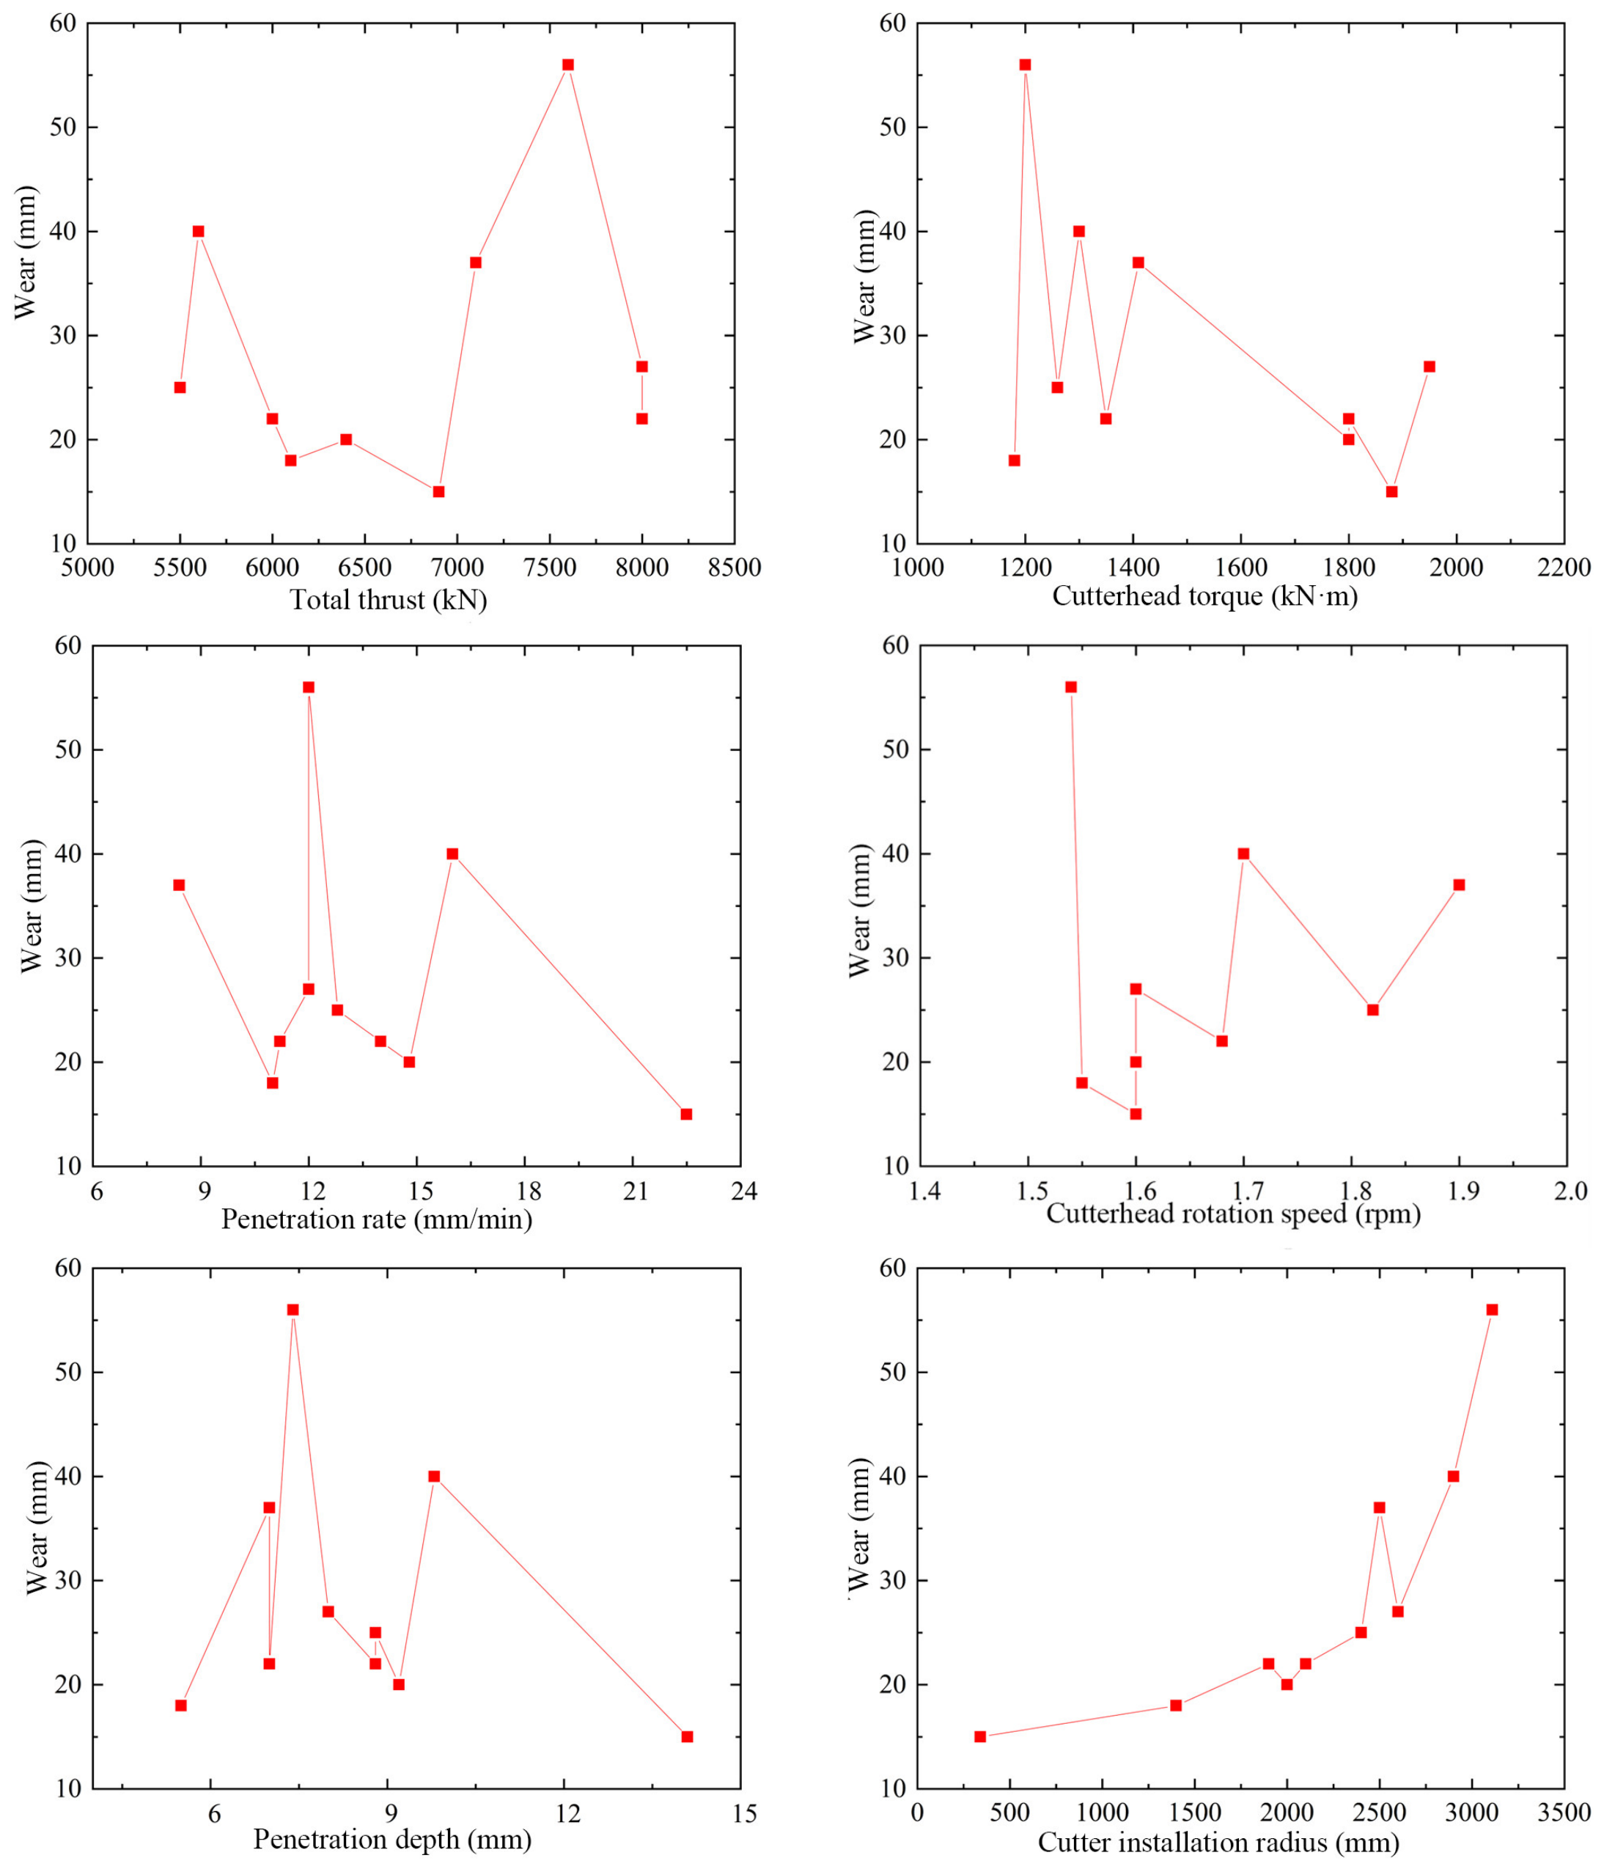
To investigate the effects of operational parameters on cutter wear, total thrust, cutterhead torque, advance rate, cutterhead rotational speed, penetration, and cutter installation radius are selected as candidate influencing factors, and the radial wear measured in the field is taken as the response variable. The relationships between these parameters and cutter wear are shown in Figure 4. As observed, no simple monotonic linear relationship exists between cutter wear and the operational parameters. The effects of total thrust, cutterhead torque, advance rate, cutterhead rotational speed, and penetration exhibit noticeable fluctuations, whereas the cutter installation radius shows a more pronounced increasing trend with wear. This indicates that cutter wear is governed by multiple factors, and it is difficult to accurately characterize its variation using a single parameter alone. Therefore, correlation analysis and multivariate regression methods are required to establish a comprehensive prediction model.
On this basis, the correlations between the candidate variables and cutter wear are further analyzed. The results show that the cutter installation radius has the strongest correlation with wear, followed by penetration. In addition, total thrust, cutterhead torque, advance rate, and cutterhead rotational speed also show strong correlations with wear, indicating that all selected parameters have clear physical significance and can be used as candidate variables for subsequent modeling.
From the mechanical and kinematic perspectives, the strong correlation between cutter installation radius and cutter wear can be physically explained. First, under a given cutterhead rotational speed, the linear velocity of cutters at different installation radii is different and can be expressed as:
v i = ω R i
where v i is the linear velocity of the i -th cutter, ω is the cutterhead angular velocity, and R i is the cutter installation radius. As the installation radius increases, the cutter linear velocity increases accordingly. This leads to a longer relative sliding and rolling distance between the cutter ring, the tunnel face, and the crushed rock fragments per unit time, thereby accelerating the accumulation of frictional wear.
Second, the rock-breaking trajectory length of a cutter during one revolution of the cutterhead can be expressed as:
L i = 2 π R i
Therefore, under the same number of cutterhead revolutions, cutters installed at larger radii have longer rock-breaking arc lengths and contact paths. Compared with inner cutters, outer cutters experience a greater cumulative rolling distance, friction distance, and rock-breaking range, which increases the probability of abrasive interaction between the cutter ring and rock fragments.
Third, the cutter installation radius also affects the radial load distribution on the cutterhead. With increasing installation radius, the cutting trajectory, rock-breaking area, and interaction between adjacent cutters change. Outer cutters are more likely to be affected by larger lateral friction, eccentric loading, and edge effects, which may intensify abrasive wear on the cutter ring surface. Therefore, the installation radius affects cutter wear not only through kinematic factors, such as linear velocity and rock-breaking arc length, but also through mechanical factors, such as radial load redistribution and cutter–rock interaction conditions.
This explanation is also consistent with recent sensitivity analysis studies on disc cutter wear [28,29]. These studies reported that the accumulated wear extent generally increases with the cutter installation radius, and that the relationship between cutter life evaluation indexes and installation radius can often be described by linear or quadratic functions. In addition, previous studies have shown that cutter wear and cutter life are jointly affected by cutter position, wear type, installation angle, cutter spacing, influence width, rock properties, and TBM operational parameters. Therefore, the strong correlation between installation radius and cutter wear observed in this study is consistent with the physical wear mechanism and with the findings of recently published studies.
To further contextualize the present results, a comparison with recent studies on disc cutter wear was added. Recent field-data-based studies have also shown that cutter wear is closely related to cutter position and installation radius. For example, Liu et al. [29]. reported that the accumulated wear extent generally increased with the installation radius for center and face cutters, and that the cutter ring wear rate was sensitive to rock properties and TBM operational parameters such as UCS, CAI, EQC, cutterhead thrust, and rotational speed. This is consistent with the present finding that the installation radius shows the strongest correlation with cutter wear, while penetration, thrust, torque, advance rate, and cutterhead rotation speed also contribute to wear variation. In addition, recent studies on cutter life evaluation have shown that the relationship between cutter life indexes and installation radius can often be described by linear or quadratic functions, further confirming the importance of cutter position in wear assessment. Compared with these studies, the present work not only confirms the significant influence of installation radius, but also combines mechanistic modeling and regression-based prediction to compare cutter wear and service life prediction from both physical and data-driven perspectives [30].

2.2.3. Establishment and Validation of the Cutter Wear Regression Model

To establish the statistical relationship between cutter wear and tunnelling parameters, multiple linear regression was adopted in this study. The cumulative cutter wear ξ was taken as the dependent variable, while total thrust F , cutterhead torque T , cutter installation radius R i , penetration h , advance rate v , and cutterhead rotation speed n were selected as candidate independent variables. The general form of the multiple linear regression model is expressed as:
y = α 0 + α 1 x 1 + α 2 x 2 + + α n x n
where y is the dependent variable, x i represents the candidate independent variable, and α i is the regression coefficient.
To improve the transparency and reproducibility of the variable selection process, quantitative statistical criteria were introduced in the regression modeling. In empirical TBM performance prediction studies, reporting statistical indicators during variable screening is a common practice. For example, Lai et al. [31] developed an empirical penetration prediction model based on the Hydropower Classification (HC) system and field tunnelling data, and reported correlation coefficients and goodness-of-fit indicators to support the variable screening process. Following this practice, the goodness of fit, F-test significance, t-test significance, variance inflation factor (VIF), and partial correlation coefficient were jointly used in this study to evaluate the candidate variables.
Specifically, R 2 and adjusted R 2 were used to evaluate the explanatory ability of the model for cutter wear variation; the F-test was used to assess the overall significance of the regression equation; the t-test was used to evaluate the significance of each individual regression coefficient; VIF was used to identify potential multicollinearity among independent variables; and the partial correlation coefficient was used to evaluate the independent correlation between each variable and cutter wear after controlling for the effects of other variables. In this study, a variable was considered to have a statistically significant independent explanatory contribution when its significance level was lower than 0.05 and its VIF value was lower than 5.
The initial regression model included all six candidate variables. The fitting results showed that the model had an R 2 of 0.952 and an adjusted R 2 of 0.855, and the F-test significance was 0.044, indicating that the overall regression equation was statistically significant. However, the coefficient diagnostics showed that penetration, advance rate, and cutterhead rotation speed had VIF values greater than 5, suggesting severe multicollinearity among these variables. In addition, advance rate and cutterhead rotation speed did not pass the t-test at the 0.05 significance level, and their partial correlation coefficients were relatively low. These results indicate that their independent explanatory contributions were weak under the current variable combination.
Therefore, advance rate was first removed from the regression model. After removing advance rate, the adjusted R 2 increased from 0.855 to 0.889, and all VIF values decreased below 5, indicating that the multicollinearity problem was effectively alleviated. However, cutterhead rotation speed still did not pass the t-test at the 0.05 significance level, and its partial correlation coefficient remained low. Thus, cutterhead rotation speed was further removed from the model.
After removing cutterhead rotation speed, the final regression model achieved an R 2 of 0.947 and an adjusted R 2 of 0.905. The F-test significance was 0.002, indicating that the overall regression equation was statistically significant. In addition, all retained variables passed the t-test at the 0.05 significance level, and all VIF values were lower than 5. The variable selection diagnostics are summarized in Table 2.
In addition to supporting variable selection, the statistical diagnostics in Table 2 were also used to provide a regression-based sensitivity assessment of the candidate parameters. In this study, variables with lower p -values, larger absolute partial correlation coefficients, and acceptable VIF values were considered to have stronger independent effects on cutter wear. As shown in Table 2, after eliminating advance rate and cutterhead rotation speed, all retained variables were statistically significant and had VIF values lower than 5, indicating that they were the key parameters affecting cutter wear within the investigated dataset. Among them, cutter installation radius had the largest absolute partial correlation coefficient in the final model, followed by cutterhead torque, total thrust, and penetration. This indicates that cutter installation radius was the most sensitive parameter in the regression model, while cutterhead torque, total thrust, and penetration also had significant effects on cutter wear.
As shown in Table 2, the removal of advance rate and cutterhead rotation speed was supported by quantitative statistical evidence. In the initial model, advance rate and cutterhead rotation speed had p -values greater than 0.05 and relatively low partial correlation coefficients, indicating weak independent explanatory contributions. Their high VIF values also suggested that they were strongly correlated with other tunnelling parameters, which may lead to unstable regression coefficients. After advance rate was removed, all VIF values decreased below 5, but cutterhead rotation speed remained statistically insignificant. Therefore, cutterhead rotation speed was further removed. In the final model, all retained variables were statistically significant, and all VIF values were lower than 5, indicating that the final model had acceptable statistical reliability and no obvious multicollinearity.
Therefore, total thrust, cutterhead torque, cutter installation radius, and penetration were retained as the final input variables. The cutter wear regression model can be expressed as:
ξ = 32.651 + 0.009 F 0.035 T + 0.011 R i + 3.194 h
where ξ is the cumulative cutter wear, F is the total thrust, T is the cutterhead torque, R i is the cutter installation radius, and h is the penetration. It should be noted that the removal of advance rate and cutterhead rotation speed does not mean that these two parameters have no physical influence on cutter wear. Rather, within the dataset and candidate variable combination used in this study, their independent statistical contributions did not reach the significance level required for inclusion in the final regression equation.

3. Model Validation

3.1. Validation of the Mechanistic Model

In this section, a tunnel project in Guangdong, China, is selected for validation. The tunnel was excavated using a shield machine with a cutterhead diameter of 8230 mm. A total of 55 disc cutters are arranged on the cutterhead, among which 34 single disc cutters with a diameter of 19 inches are installed on the cutterhead face, numbered from No. 9 to No. 42. To facilitate the validation of radial wear and cutter service life, several face cutters are selected for analysis, and their numbering and installation radii are listed in Table 3. The geological conditions and cutter parameters used for model validation are presented in Table 4 and Table 5. The tunneling distance is 1240 m, with an average penetration of 5.5 mm/r, and the abrasive wear coefficient is taken as 0.0006.

3.1.1. Validation of Cutter Wear Prediction Models

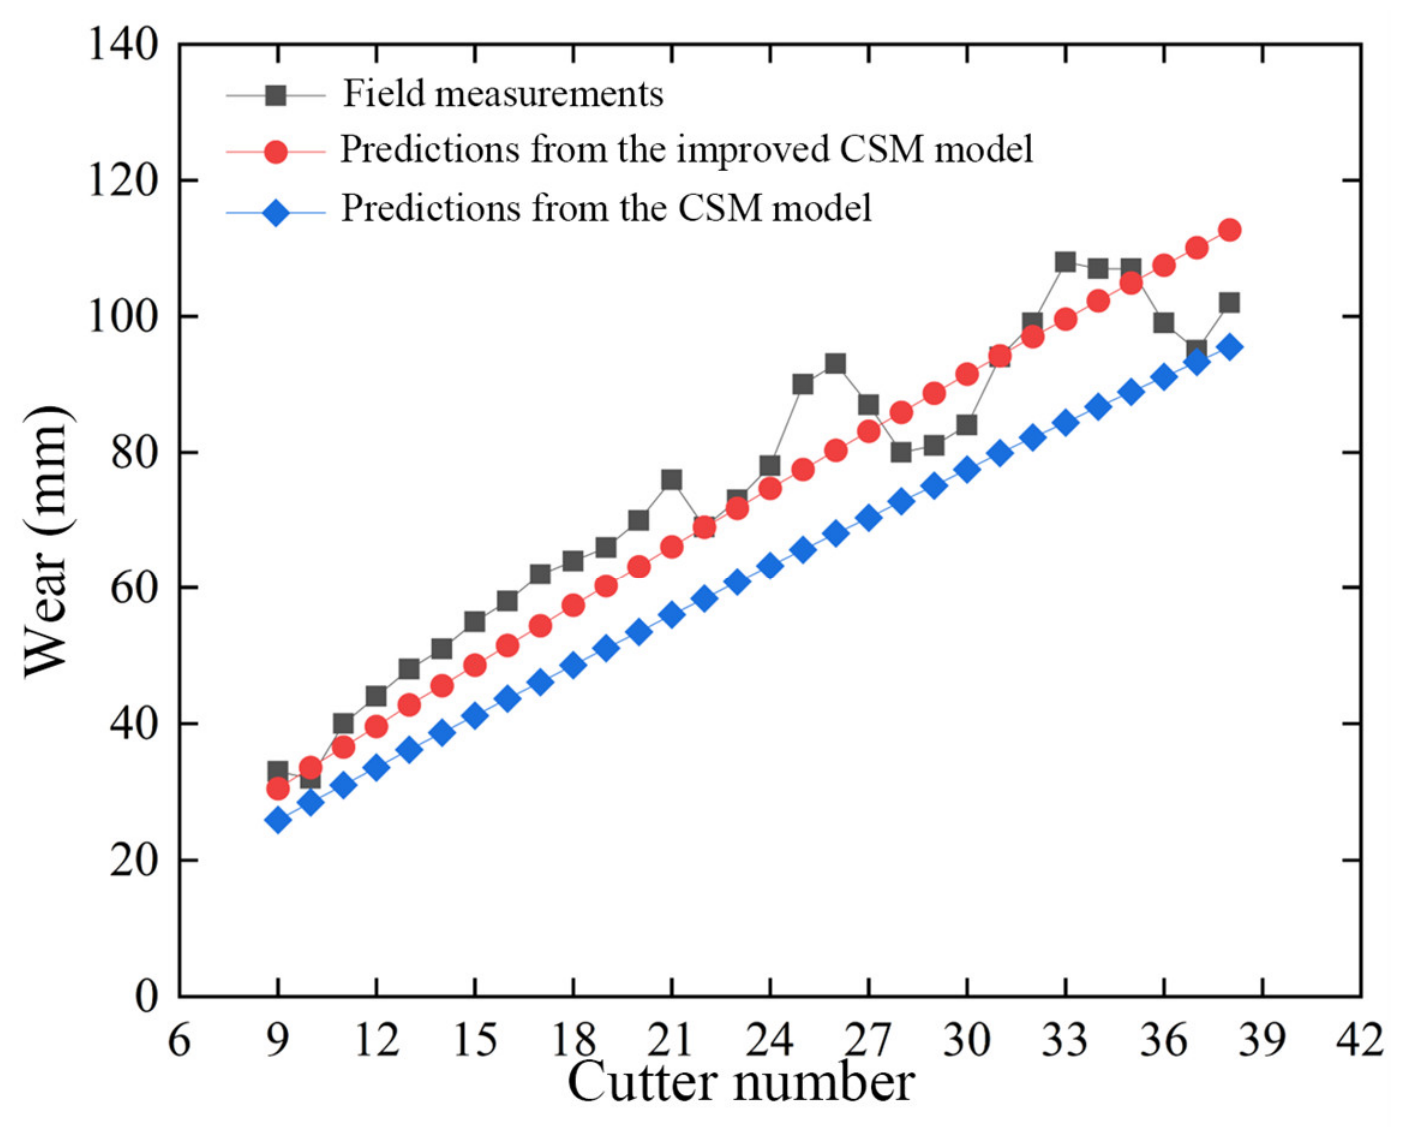
Meanwhile, certain fluctuations are observed in the measured wear values, as shown in Figure 5. These fluctuations may be related to uneven cutter wear, geological differences, locally non-uniform force conditions, and measurement uncertainty during field construction. Therefore, deviations at some local measurement points are reasonable.
To further evaluate the prediction quality and uncertainty of the two wear prediction models, the mean relative error, standard deviation, 95% confidence interval, and error range were calculated based on the relative errors listed in Table 6. The 95% confidence interval was calculated as
e ¯ ± t 0.975 , n 1 s n
where e ¯ is the mean relative error, s is the standard deviation, and n is the number of cutters. The results are summarized in Table 6. The traditional CSM model has a mean relative error of 18.43%, with a standard deviation of 7.18%, a 95% confidence interval of 15.75–21.11%, and an error range of 1.8–27.0%. In contrast, the improved CSM model has a mean relative error of 8.13%, with a standard deviation of 3.72%, a 95% confidence interval of 6.74–9.52%, and an error range of 0.0–13.9%. Compared with the traditional CSM model, the improved model not only reduces the mean prediction error, but also decreases the error dispersion and narrows the confidence interval, indicating better prediction stability and lower uncertainty.
Although the improved CSM model significantly reduces the prediction error, residual errors still exist between the predicted and measured cutter wear values. These residual errors may mainly originate from parameter uncertainty, model structural error, and measurement noise. Parameter uncertainty is associated with the spatial variability of rock mechanical properties and tunnelling conditions. In the model calculation, rock strength parameters, cohesion, internal friction angle, abrasive wear coefficient, and contact-related parameters are generally represented by average or empirical values, whereas the actual geological conditions and cutter–rock contact states may vary along the tunnel alignment.
Model structural error is mainly related to the simplified assumptions adopted in the theoretical formulation. Although the improved model considers the supporting force and friction from the side crushing zones, it still mainly focuses on three-body abrasive wear and does not explicitly quantify adhesive wear, fatigue wear, eccentric wear, chipping, or local spalling. These mechanisms may contribute to cutter damage under certain lithological and operational conditions and may therefore lead to residual prediction errors. Measurement noise may arise from field wear measurement errors, non-uniform wear around the cutter ring, fluctuations in operational parameters, and inconsistencies between the field measurement interval and the model calculation interval. These factors jointly contribute to the remaining prediction uncertainty of the improved model.
Therefore, the cutter wear prediction model established based on the improved normal force model shows superior predictive performance compared with the traditional CSM model. Moreover, the additional uncertainty statistics further demonstrate that the improved model has better stability and reliability for engineering prediction.

3.1.2. Validation of Cutter Service Life Prediction Models

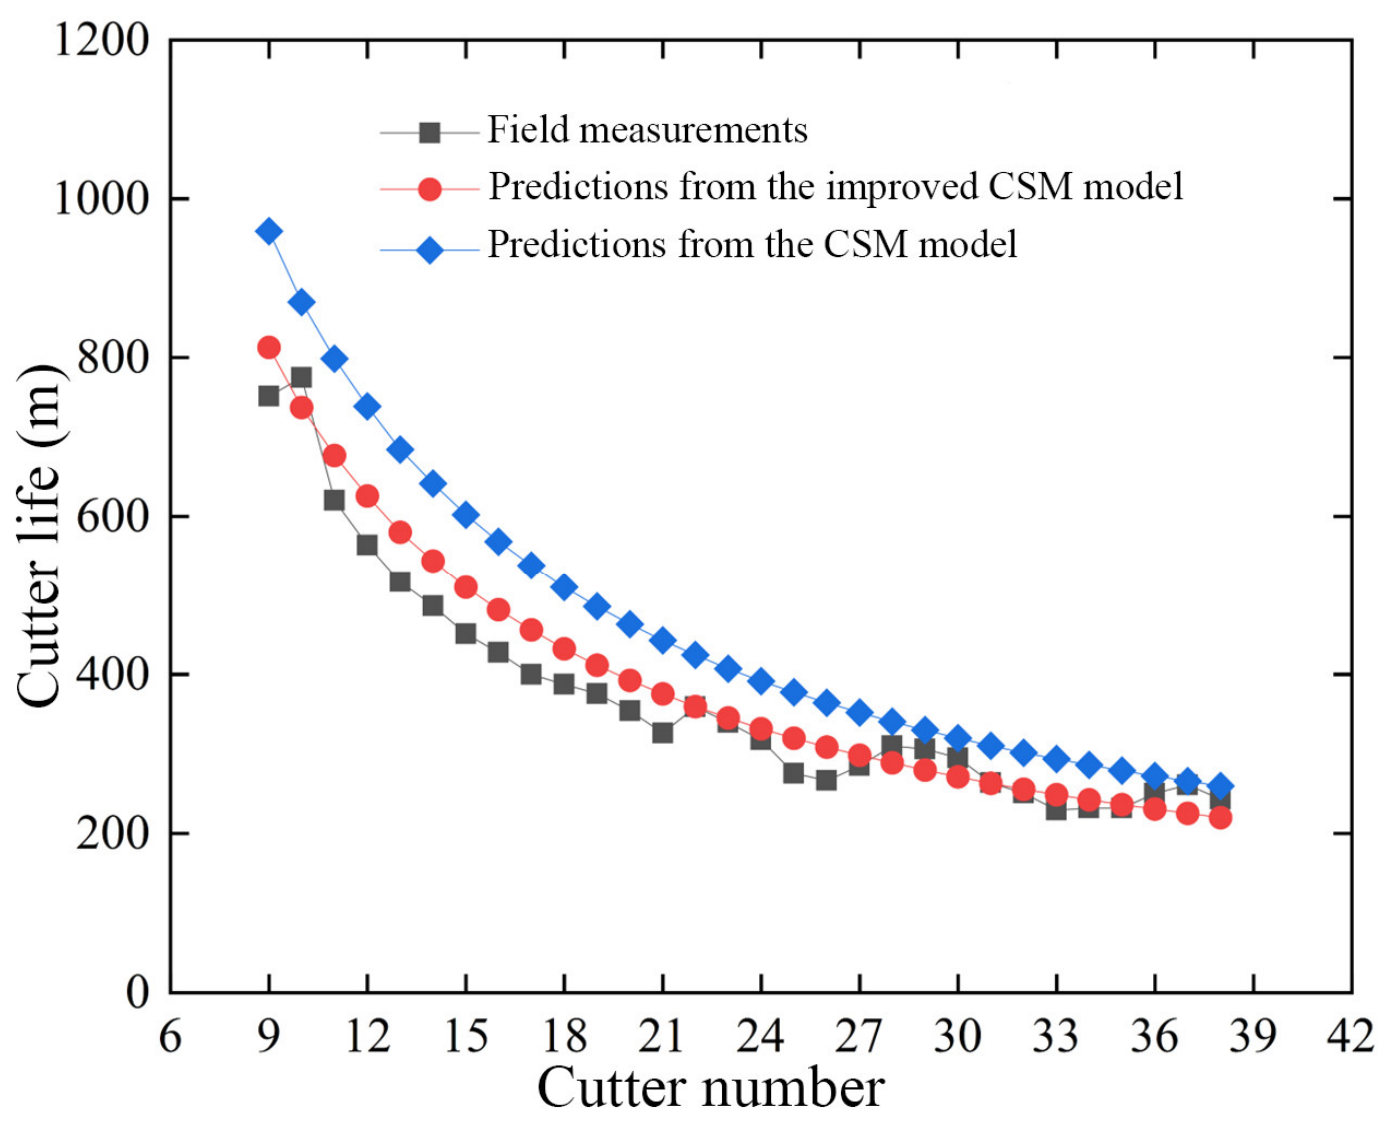
Meanwhile, certain fluctuations are observed in the measured service life at some locations, as shown in Figure 6. These fluctuations are related to geological variations, uneven cutter wear, and changes in construction conditions, and therefore deviations at some local measurement points are reasonable.
To further characterize the uncertainty of the service life prediction results, the mean relative error, standard deviation, 95% confidence interval, and error range were calculated based on the relative errors of the two service life prediction models. The results are summarized in Table 7. The CSM-based service life model has a mean relative error of 23.45%, with a standard deviation of 10.31%, a 95% confidence interval of 19.60–27.30%, and an error range of 1.8–37.0%. In contrast, the improved CSM-based service life model has a mean relative error of 8.85%, with a standard deviation of 4.49%, a 95% confidence interval of 7.17–10.53%, and an error range of 0.1–16.1%.
Compared with the traditional CSM-based model, the improved model not only reduces the mean prediction error, but also decreases the standard deviation and narrows the confidence interval of the prediction errors. This indicates that the improved service life prediction model has better prediction stability, lower uncertainty, and stronger engineering applicability. Similar to the wear prediction results, the remaining deviations in cutter service life prediction may also be attributed to parameter uncertainty, simplified model assumptions, field measurement errors, and fluctuations in construction conditions.

3.2. Validation of the Regression Model

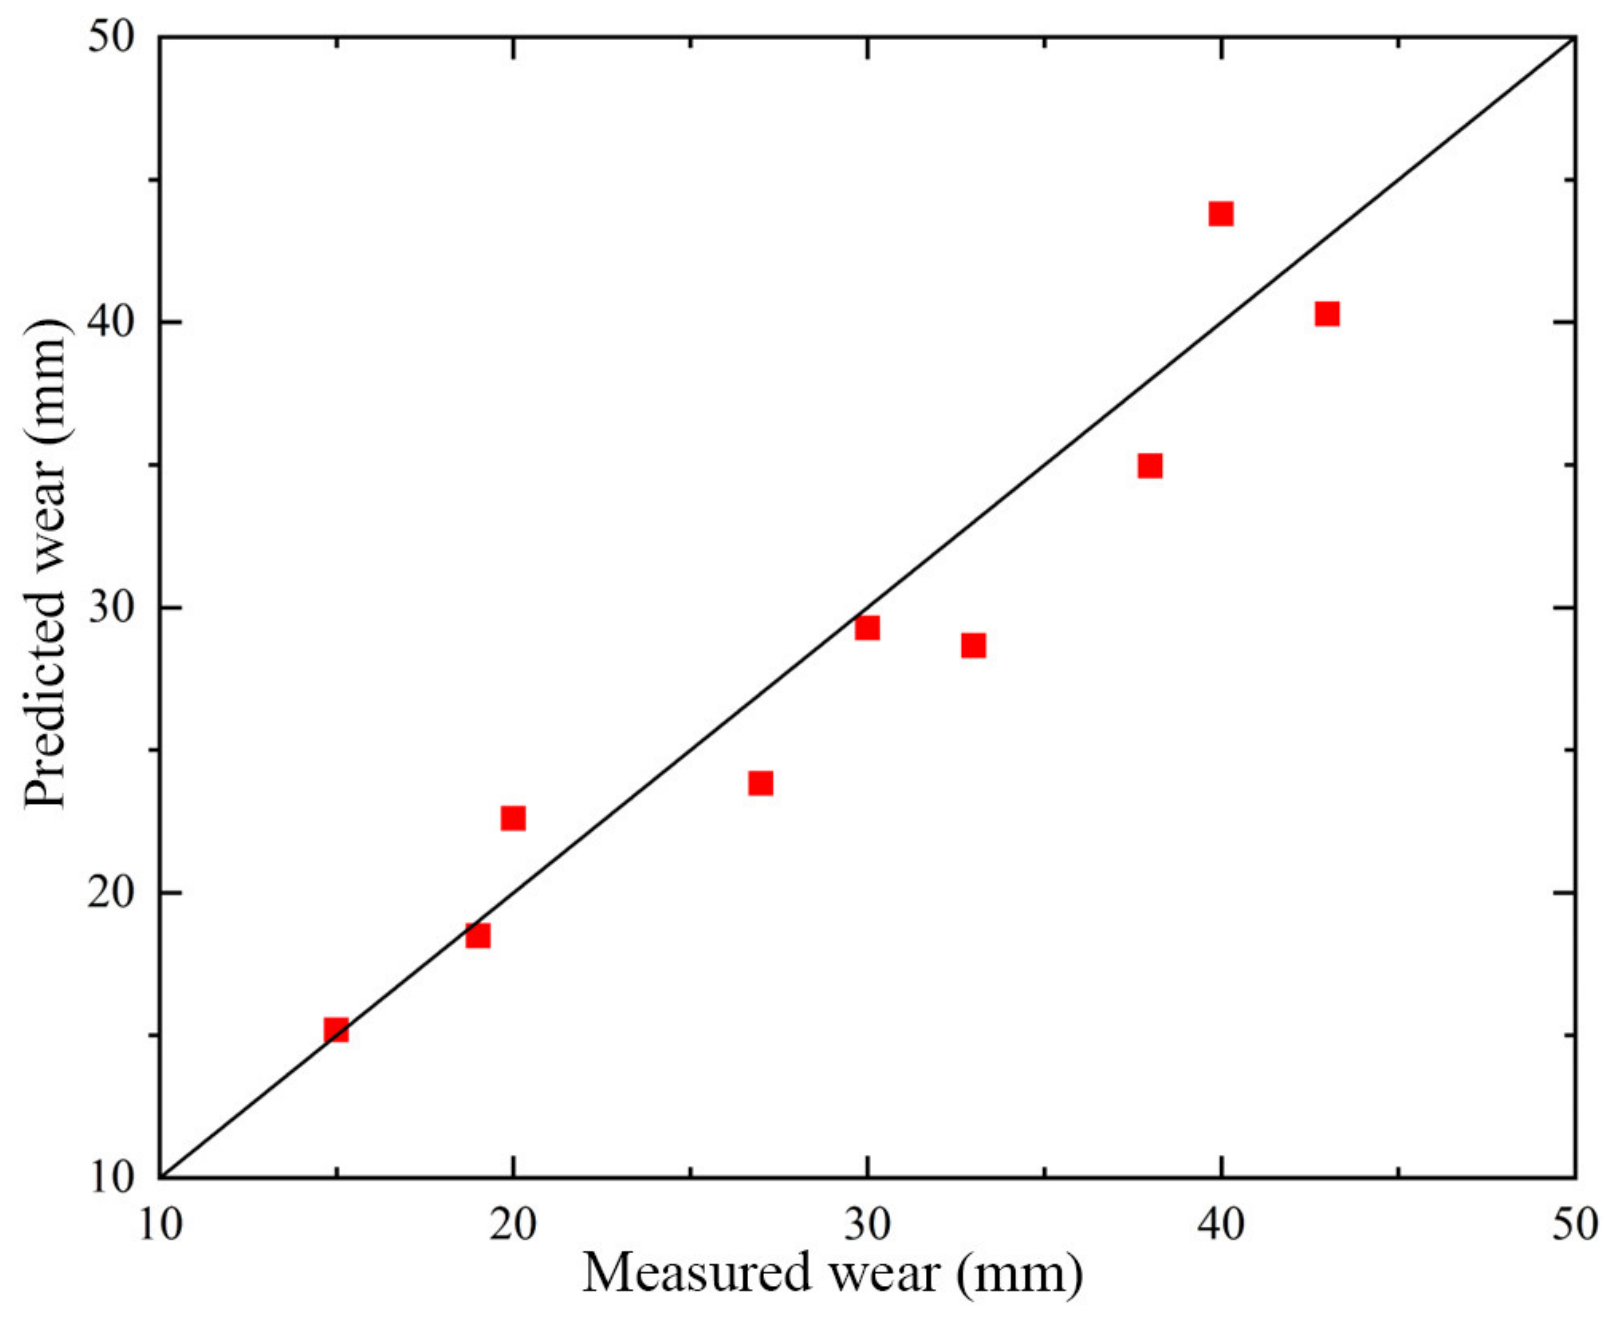
To validate the predictive capability of the proposed regression model, the field-measured cutter wear data were used for comparison, and the fitting relationship between the predicted and measured values is shown in Figure 7. As observed, the predicted values are generally distributed around the line y = x , indicating good agreement between the model predictions and the measured data. Most data points lie close to the ideal fitting line, with only a few showing noticeable deviations. The overall dispersion is relatively small, suggesting that the model can effectively capture the actual variation in cutter wear under field conditions.
Further statistical analysis indicates that the average prediction error of the regression model is approximately 7.6%, demonstrating good prediction accuracy. The regression model established based on operational parameters can reliably predict cutter wear in practical engineering applications. Among the influencing factors, cutter installation radius and penetration have significant impacts on wear, while total thrust and cutterhead torque also play important roles. Therefore, the proposed model can serve as a useful tool for cutter wear evaluation, parameter optimization, and cutter replacement decision-making during shield tunneling operations.
Although nonlinear regression and machine-learning-based models may provide stronger fitting ability, their performance strongly depends on the size and diversity of the training dataset. The cutter wear data used in this study were obtained from a single tunnelling project, and the number of available samples is limited. Under such conditions, complex models may overfit the current dataset and may not provide reliable generalization performance. Therefore, a linear regression model was adopted in this study to balance prediction accuracy, model simplicity, and engineering interpretability. The explicit form of the linear model also facilitates the analysis of the contribution of different tunnelling parameters to cutter wear. It should be noted that the proposed regression model should be regarded as an empirical model applicable mainly to similar geological conditions, shield machine configurations, cutter layouts, and tunnelling parameter ranges. In future work, nonlinear regression and machine-learning-based models will be further investigated when larger datasets from multiple projects become available.

4. Comparison and Applicability Analysis of Two Models

To further compare the predictive performance of the mechanistic model and the regression model in engineering applications, the engineering case introduced above is selected for comparative analysis. The mechanistic model is developed based on the normal force of the disc cutter and the abrasive wear mechanism, whereas the regression model is established using field operational parameters and measured wear data. Since both models are capable of predicting cutter wear and service life, it is necessary to compare their prediction accuracy using the same engineering case so as to evaluate their engineering applicability.

4.1. Comparative Analysis of Cutter Wear

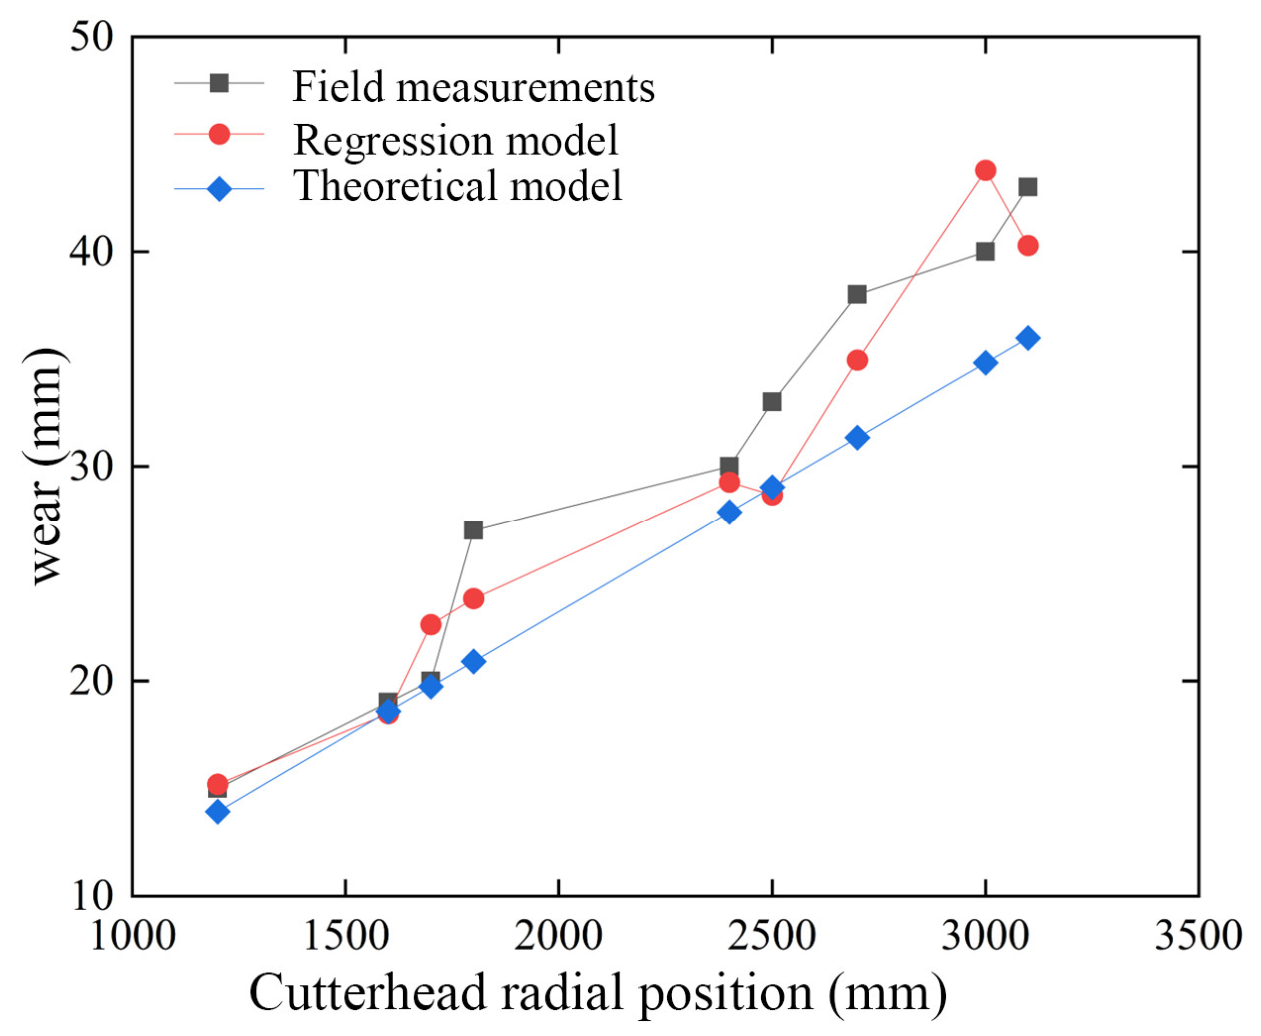
The disc cutter parameters, rock parameters, and construction parameters of the engineering case introduced above were taken as input conditions. Cutter wear was calculated using the mechanistic model and the regression model, respectively, and then compared with the field-measured values, as shown in Figure 8. It can be seen that both the measured wear and the predictions of the two models generally increase with increasing cutter installation radius, indicating that both models can capture the variation trend of cutter wear along the radial direction of the cutterhead. Compared with the mechanistic model, the regression model produces prediction curves that are closer to the measured results and provides better fitting performance at most measurement points. Although the mechanistic model can correctly reflect the overall variation trend, relatively obvious deviations still occur at some locations.
The relative errors of the two models for cutter wear prediction were further analyzed, and the statistical results are summarized in Table 8. The mechanistic model has a mean relative error of 11.00%, with a standard deviation of 7.17%, a 95% confidence interval of 5.49–16.51%, and an error range of 1.3–22.6%. In contrast, the regression model has a lower mean relative error of 7.57%, with a standard deviation of 4.65%, a 95% confidence interval of 3.99–11.14%, and an error range of 1.3–13.1%.
Compared with the mechanistic model, the regression model not only reduces the mean prediction error, but also decreases the error dispersion and narrows the confidence interval. This indicates that the regression model has higher prediction accuracy, better stability, and lower uncertainty in cutter wear prediction under the investigated engineering conditions.
The difference in prediction accuracy and uncertainty between the two models can be explained by their different modeling principles. The main reason for this difference is that the rock mechanical parameters and some contact parameters used in the mechanistic model are usually taken as regional average values or empirical values, which makes it difficult to fully reflect the complex field conditions. By contrast, the regression model is established directly based on field monitoring data and can, to some extent, comprehensively reflect fluctuations in operational parameters and actual engineering characteristics. Therefore, its predictions are closer to the measured values.

4.2. Comparative Analysis of Cutter Service Life

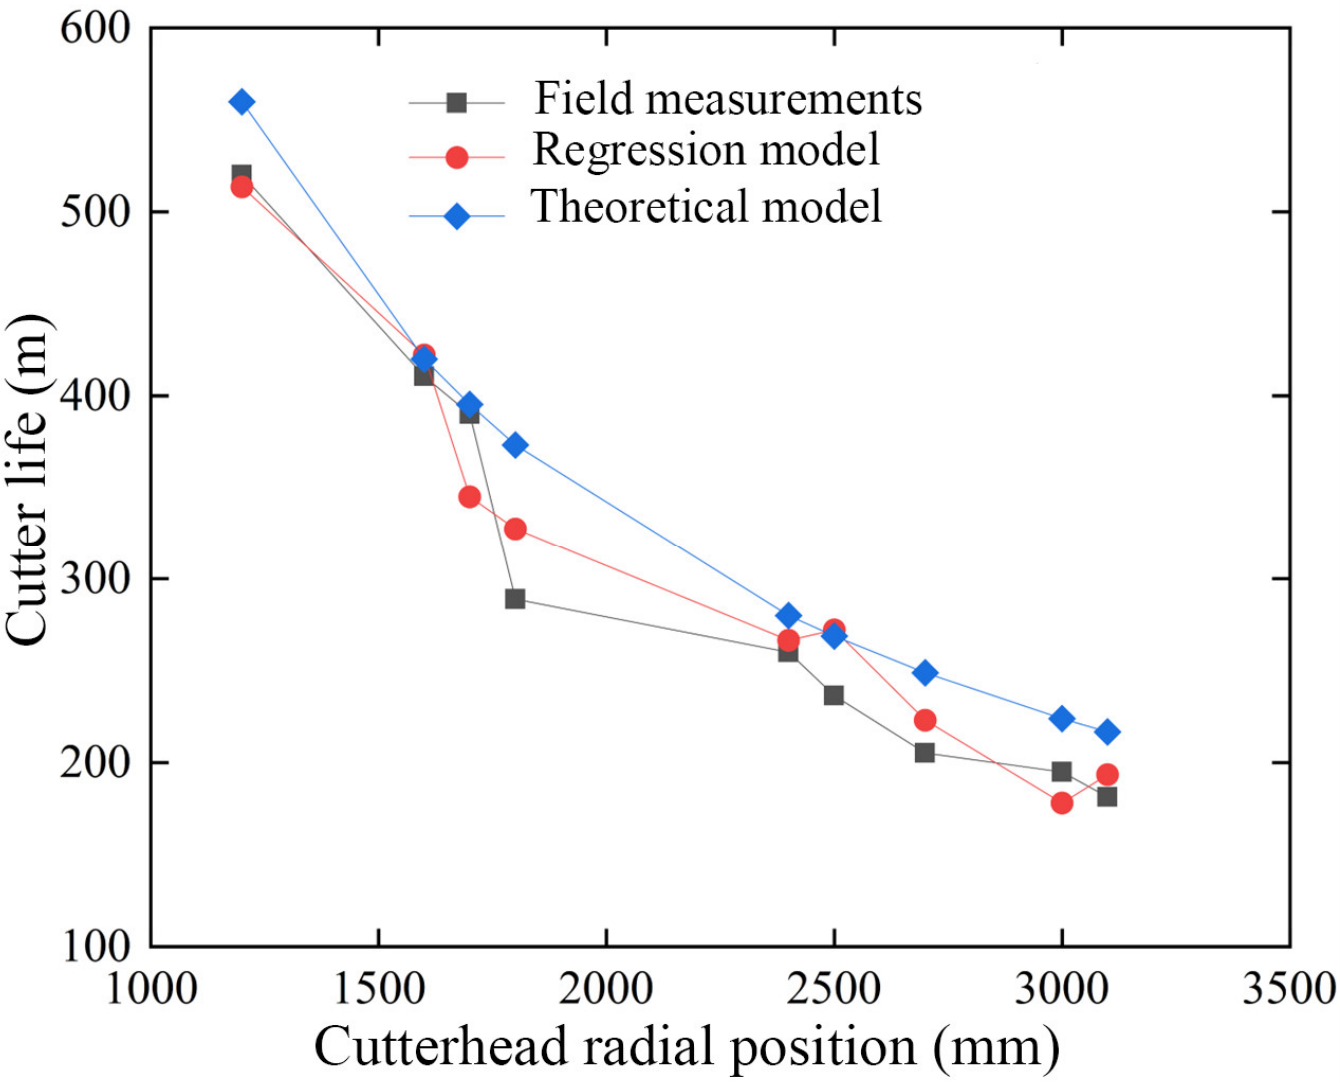
Based on the wear prediction results, the service life of the disc cutter was further calculated using the two models and compared with the measured service life, as shown in Figure 9. It can be seen that both the measured service life and the predictions of the two models generally decrease with increasing cutter installation radius, indicating that both models can capture the basic variation trend of cutter service life along the radial direction of the cutterhead. Similar to the wear prediction results, the service life predicted by the regression model is closer to the measured values, whereas the theoretical model shows obvious overestimation at some measurement points.
The relative errors of the two models for cutter service life prediction were also statistically analyzed, and the results are summarized in Table 9. The mechanistic model has a mean relative error of 13.04%, with a standard deviation of 9.24%, a 95% confidence interval of 5.94–20.15%, and an error range of 1.3–29.2%. In contrast, the regression model has a lower mean relative error of 7.86%, with a standard deviation of 4.96%, a 95% confidence interval of 4.05–11.66%, and an error range of 1.3–15.1%.
Compared with the mechanistic model, the regression model shows a lower mean prediction error, smaller standard deviation, and narrower confidence interval. This indicates that the regression model also outperforms the mechanistic model in cutter service life prediction and exhibits better prediction stability, lower uncertainty, and stronger engineering applicability.
Overall, both models can reflect the overall variation patterns of cutter wear and service life with cutter installation radius. However, the regression model demonstrates higher accuracy and lower uncertainty in both wear and service life prediction. The mechanistic model has a clearer mechanical basis and is suitable for revealing the formation mechanism of cutter wear and the influence of key parameters, whereas the regression model relies more on field data and can more accurately reflect the actual wear level under specific engineering conditions. Therefore, in practical engineering applications, the mechanistic model can be used for mechanism analysis and parameter influence studies, while the regression model can be used for field wear evaluation and service life prediction, thereby achieving complementary application of the two models.

4.3. Applicability and Generalization of the Proposed Models

It should be noted that the regression model developed in this study was trained and validated using field data from a single project. Therefore, the correlations identified between tunnelling parameters and cutter wear mainly reflect the statistical relationships within the geological conditions, cutterhead configuration, and operating parameter range of the investigated project. These correlations should not be directly interpreted as universal laws applicable to all tunnelling projects.
For applications to other geological or operating conditions, the regression model should be recalibrated or retrained using project-specific data. In particular, when the input variables exceed the range covered by the training dataset, model extrapolation may lead to amplified prediction errors because the learned statistical relationships may no longer represent the actual cutter–rock interaction and wear evolution. Therefore, the regression model is mainly applicable to projects with similar geological conditions, cutter configuration, and operating parameter ranges. For projects with significantly different lithology, rock abrasivity, cutterhead layout, or control strategies, additional field data and validation are required before practical application.
In contrast, the mechanistic model is based on cutter–rock interaction and abrasive wear theory, and therefore has relatively better transferability under different geological and operating conditions, provided that the required rock, cutter, and operational parameters are properly determined. However, its prediction accuracy may still be affected by parameter uncertainty and simplified assumptions. Therefore, the mechanistic model and regression model should be regarded as complementary: the former provides a physically interpretable framework, while the latter provides project-specific prediction capability after calibration with field data.

5. Conclusions

This study developed two types of prediction models for TBM disc cutter wear and service life, namely a mechanistic model based on force analysis and an empirical regression model based on field operational parameters. The main conclusions are as follows:
(1)
Based on the traditional CSM model, an improved normal force model for the disc cutter was established by considering the supporting force and friction exerted by the side crushing zones. The contributions of both the crushing zone beneath the cutter edge and the side crushing zones were incorporated. Furthermore, by combining the Rabinowicz abrasive wear theory with the kinematic relationships of the disc cutter, an analytical model for radial wear and a service life prediction model were derived. As a result, a unified framework linking force analysis, wear volume, wear amount, and service life evaluation was established.
(2)
The validation results of the mechanistic model show that considering the forces from the side crushing zones significantly improves the prediction accuracy and stability. Compared with the traditional CSM model, the mean relative error of the improved mechanistic model decreased from 18.43% to 8.13% for cutter wear and from 23.45% to 8.85% for cutter service life. In addition, the standard deviation decreased from 7.18% to 3.72% for cutter wear and from 10.31% to 4.49% for service life, while the corresponding 95% confidence intervals and error ranges were also narrowed. These results indicate that the proposed mechanistic model not only more accurately reflects the actual force state and wear evolution behavior of the disc cutter, but also provides more stable predictions with lower uncertainty.
(3)
The regression model established based on field operational parameters shows that cutter installation radius and penetration have significant effects on cutter wear, while total thrust and cutterhead torque also play non-negligible roles. The predicted values of the regression model are generally distributed close to the ideal fitting line, with an average prediction error of about 7.6% for cutter wear, demonstrating good field prediction capability and engineering applicability.
(4)
The comparison between the two types of models shows that both the mechanistic model and the regression model can capture the overall variation trends of cutter wear and service life with cutter installation radius. For the engineering case considered, the regression model provides higher prediction accuracy and lower uncertainty. For cutter wear prediction, the mean relative error of the regression model is 7.57%, which is lower than that of the mechanistic model at 11.00%; its standard deviation is also reduced from 7.17% to 4.65%, and its 95% confidence interval narrows from 5.49–16.51% to 3.99–11.14%. For cutter service life prediction, the mean relative error of the regression model is 7.86%, which is lower than that of the mechanistic model at 13.04%; its standard deviation decreases from 9.24% to 4.96%, and its 95% confidence interval narrows from 5.94–20.15% to 4.05–11.66%. Overall, the mechanistic model has a clearer mechanical basis and is more suitable for revealing the wear mechanism of the disc cutter and the influence of key parameters, whereas the regression model provides better prediction accuracy and stability under the specific engineering conditions considered. Therefore, the two models can complement each other in practical applications.

6. Outlook

Recent studies have shown that embedding physical constraints into data-driven models or constructing physically meaningful features from mechanistic models can improve model interpretability, robustness, and generalization ability [20,32,33]. Therefore, future work can further explore hybrid modeling strategies that combine mechanistic cutter force models with machine learning methods. For example, physical variables derived from the mechanistic model, such as normal force, rolling force, contact arc length, rolling distance, and specific energy, can be introduced as input features for data-driven cutter wear prediction models. In addition, physical constraints associated with cutter–rock interaction and wear evolution can be incorporated into the model training process to improve prediction reliability under complex geological and operational conditions. Such a hybrid framework may help overcome the limitations of purely mechanistic models and purely empirical regression models, and provide a more robust approach for cutter wear prediction and cutter replacement decision-making.

Author Contributions

Conceptualization, J.Z. and C.L.; methodology, Z.L., K.B. and S.S.; validation, K.B. and C.L.; formal analysis, L.K.; investigation, Z.L.; resources, K.B.; data curation, C.L.; writing—original draft, S.S.; writing—review and editing, J.Z., K.B. and C.L.; visualization, L.K. and S.S.; supervision, L.K. All authors have read and agreed to the published version of the manuscript.

Funding

This research was supported by the Henan Qianping Irrigation District North Trunk Canal Ruyang Water Supply Project (Grant No. QPRY-ZX-2024-01), the 2024 Henan Water Conservancy Science and Technology Project (Grant No. GG202455), and the National Natural Science Foundation of China (Grant No. 52079128).

Data Availability Statement

The data presented in this study are available on request from the corresponding author due to privacy restrictions.

Conflicts of Interest

Author Congshi Li is affiliated with Henan Qianping Reservoir Irrigation District Project Company. This affiliation only indicates the author’s institutional employment and does not imply any vested interest related to this study. The remaining authors declare that the research was conducted in the absence of any commercial or financial relationships that could be construed as a potential conflict of interest.

References

  1. Su, D.; Yang, W.-H.; Lin, X.-T.; Zhang, X.; Zhang, Z.; Chen, X. Soil-carrying effect induced by super-large-diameter shallow-buried shield tunneling and treatment measures: A case study in Zhuhai, China. Tunn. Undergr. Space Technol. 2024, 153, 106037. [Google Scholar] [CrossRef]
  2. Feng, K.; Pan, J.; Xing, W.; Li, M.; Geng, J.; He, C. Experimental study on the high water pressure erosion mechanism and its influence on the submarine shield tunnel concrete segments. Constr. Build. Mater. 2023, 408, 133577. [Google Scholar] [CrossRef]
  3. He, Z.; He, C.; Kang, X.; Huang, X.; Wang, S. Assessment of structural performance of super large cross-section subsea RC shield tunnels: Emphasis on the combined effects of highly hydrostatic pressure and corrosion-induced deterioration. Ocean Eng. 2023, 288, 116134. [Google Scholar] [CrossRef]
  4. Liu, Y.-k.; Wu, Y.; Li, W.-h.; Zhang, Q.-s.; tai Liu, R.; Bai, J.-w.; Li, W. Development of a water leakage model test system and investigation of the water leakage behavior in subsea shield tunnels during operation. Measurement 2024, 233, 114691. [Google Scholar] [CrossRef]
  5. Jemcov, I.; Todorović, M.; Jemcov, A.; Ćuk Đurović, M. Hydraulic impact of pressure transients from water conveyance tunnel on the complex hydrogeological system: A case study HPP Pirot, Serbia. J. Hydrol. 2024, 644, 132068. [Google Scholar] [CrossRef]
  6. Xu, D.; Li, Y.; Yang, X.; Zhong, H.; Li, J.; Li, J.; Huang, Y. Enhancing resilience in urban utility tunnels power transmission systems: Analysing temperature distribution in near-wall cable fires for risk mitigation. Tunn. Undergr. Space Technol. 2024, 152, 105911. [Google Scholar] [CrossRef]
  7. Li, X.; Xue, Y.; Li, Z.; Kong, F.; Li, G.; Zhou, B. Numerical investigation and prediction of the excavation face stability for river-crossing shield tunneling: An intelligent prediction model for limit support pressure. Comput. Geotech. 2023, 160, 105493. [Google Scholar] [CrossRef]
  8. Fang, Y.; Zhuo, B.; Wang, Y.; Luo, H.; Sun, J.; Yao, Y. Metal-soil interface adhesion in clay clogging during shield tunneling: Theoretical model and experimental validation. Undergr. Space 2024, 15, 188–202. [Google Scholar] [CrossRef]
  9. Tang, S.-H.; Zhang, X.-P.; Xie, W.-Q.; Liu, Q.-S.; Wu, J.; Chen, P. A new evaluation method to quantify the wear failure of irregular cutting tool during shield TBM tunneling in abrasive sandy ground. Eng. Fail. Anal. 2023, 146, 107011. [Google Scholar] [CrossRef]
  10. Shen, S.-L.; Zhang, N.; Zhou, A. Investigation of disc cutter wear during shield tunnelling in weathered granite: A case study. Tunn. Undergr. Space Technol. 2023, 140, 105323. [Google Scholar] [CrossRef]
  11. Zhang, J.; Kou, L.; Wang, J.; Xu, J. Load model for shield tunneling in composite strata considering mud build-up effects. Tunn. Undergr. Space Technol. 2025, 165, 106918. [Google Scholar] [CrossRef]
  12. Evans, I. The force required to cut coal with blunt wedges. Int. J. Rock Mech. Min. Sci. Geomech. Abstr. 1965, 2, 1-2, IN1–IN2, 3–12. [Google Scholar] [CrossRef]
  13. Ozdemir, L. Development of Theoretical Equations for Predicting Tunnel. Ph.D. Thesis, Colorado School of Mines, Golden, CO, USA, 1977. Available online: https://repository.mines.edu/entities/publication/284a9e6c-49b3-454d-8ad3-7676199b5768 (accessed on 23 April 2026).
  14. Mao, C.; Liu, C. Indentation test analysis of disc rolling cutter in drifter. Constr. Mach. Equip. 1988, 9–14 + 56. [Google Scholar]
  15. Rostami, J. Development of a Force Estimation Model for Rock Fragmentation with Disc Cutters Through Theoretical Modeling and Physical Measurement of Crushed Zone Pressure; Colorado School of Mines Golden: Golden, CO, USA, 1997; Volume 38. [Google Scholar]
  16. Li, X.; Zhang, Y.; Sun, X. Numerical analysis for rock cutting force prediction in the tunnel boring process. Int. J. Rock Mech. Min. Sci. 2021, 144, 104696. [Google Scholar] [CrossRef]
  17. Bin, S.; Wei, G.; Dianhua, Z.; Liwei, S.; Jianqing, L.; Hongyan, S. The Improvement of TBM Cutter’s Force Formula Based on CSM Model. Mach. Des. Res. 2015, 31, 121–124 + 128. [Google Scholar] [CrossRef]
  18. Yang, Y.; Hong, K.; Sun, Z.; Chen, K.; Li, F.; Zhou, J.; Zhang, B. The Derivation and Validation of TBM Disc Cutter Wear Prediction Model. Geotech. Geol. Eng. 2018, 36, 3391–3398. [Google Scholar] [CrossRef]
  19. Shi-fan, Q.; Chao, W.; Zhi-xin, L.; Jun-kun, T. Life prediction of tunnel boring machine hob based on abrasive wear mechanism. J. Jilin Univ. (Eng. Technol. Ed.) 2020, 50, 2068–2073. [Google Scholar] [CrossRef]
  20. Wang, L.; Kang, Y.; Zhao, X.; Zhang, Q. Disc cutter wear prediction for a hard rock TBM cutterhead based on energy analysis. Tunn. Undergr. Space Technol. 2015, 50, 324–333. [Google Scholar] [CrossRef]
  21. Ren, D.-J.; Shen, S.-L.; Arulrajah, A.; Cheng, W.-C. Prediction Model of TBM Disc Cutter Wear During Tunnelling in Heterogeneous Ground. Rock Mech. Rock Eng. 2018, 51, 3599–3611. [Google Scholar] [CrossRef]
  22. Zejia, G.; Zhihong, Y.; Dingwen, Z.; Shuo, F.; Zhaoguo, L. Practical prediction method and application of shield disc cutter wear in complex formation. J. Archit. Civ. Eng. 2023, 40, 133–141. [Google Scholar] [CrossRef]
  23. Karami, M.; Zare, S.; Rostami, J. Study of common wear prediction models for hard rock TBM disc cutters and comparison with field observation in Kerman water conveyance tunnel. Bull. Eng. Geol. Environ. 2021, 80, 1467–1476. [Google Scholar] [CrossRef]
  24. Li, Y.; Di, H.; Yao, Q.; Fu, L.; Zhou, S. Prediction Model for Disc Cutter Wear of Tunnel Boring Machines in Sandy Cobble Strata. KSCE J. Civ. Eng. 2020, 24, 1010–1019. [Google Scholar] [CrossRef]
  25. Yiwei, S.; Yusheng, J.; Xiaokang, S.; Shoujie, Y.; Chen, L.; Xianlun, F.; Zhenyong, W. Characteristics of Wear and Prediction Model of Face Cutter of Shield Tunneling in Hard Rock. Railw. Stand. Des. 2023, 67, 136–142. [Google Scholar] [CrossRef]
  26. Yukun, C.; Huisheng, G.; Lei, Z.; Cheng, L. Research on the Wear Prediction of Disc Cutters Based on BP Neural Network. Mod. Tunn. Technol. 2021, 58, 78–84. [Google Scholar] [CrossRef]
  27. Rabinowicz, E.; Dunn, L.A.; Russell, P.G. A study of abrasive wear under three-body conditions. Wear 1961, 4, 345–355. [Google Scholar] [CrossRef]
  28. Liu, J.; He, T.; Zhou, Z.; Peng, X.; Pan, Y. Analysis and Enlightenment on the Relationships between Two Kinds of Cutter Life Evaluation Indexes and Installation Radius: A Case Study. Buildings 2024, 14, 1523. [Google Scholar] [CrossRef]
  29. Liu, J.; He, T.; Peng, X.; Pan, Y. Evaluation of TBM Cutter Wear in Granite and Developing a Cutter Life Prediction Model for Face Cutters Based on Field Data: A Case Study. Buildings 2024, 14, 2453. [Google Scholar] [CrossRef]
  30. Shin, Y.J.; Kwon, K.; Bae, A.; Choi, H.; Kim, D. Machine learning-based prediction model for disc cutter life in TBM excavation through hard rock formations. Tunn. Undergr. Space Technol. 2024, 150, 105826. [Google Scholar] [CrossRef]
  31. Lai, H.; Zhou, Z.; Tan, Z.; Li, Z.; Zhao, J. Development of open TBM tunnelling performance prediction model based on Hydropower Classification (HC) system: A case study in Xinjiang. Rock Mech. Bull. 2025, 100264. [Google Scholar] [CrossRef]
  32. Liu, Y.; Huang, S.; Wang, D.; Zhu, G.; Zhang, D. Prediction Model of Tunnel Boring Machine Disc Cutter Replacement Using Kernel Support Vector Machine. Appl. Sci. 2022, 12, 2267. [Google Scholar] [CrossRef]
  33. Yuan, B.; Choo, C.S.; Yeo, L.Y.; Wang, Y.; Yang, Z.; Guan, Q.; Suryasentana, S.; Choo, J.; Shen, H.; Megia, M.; et al. Physics-informed machine learning in geotechnical engineering: A direction paper. Geomech. Geoengin. 2025, 20, 1128–1159. [Google Scholar] [CrossRef]
Figure 1. Force analysis of the CSM model.
Processes 14 01732 g001
Figure 2. Force analysis of the fractured zones on both sides of the disc cutter.
Processes 14 01732 g002
Figure 3. Horizontal projection area of the shear-crushed zone.
Processes 14 01732 g003
Figure 4. Relationship between Tunneling Parameters and Cutter Wear.
Processes 14 01732 g004
Figure 5. Comparison between Predicted and Measured Cutter Wear.
Processes 14 01732 g005
Figure 6. Comparison between Predicted and Measured Cutter Service Life.
Processes 14 01732 g006
Figure 7. Prediction Performance of the Regression Model for Cutter Wear.
Processes 14 01732 g007
Figure 8. Comparison of Predicted Cutter Wear between Two Models.
Processes 14 01732 g008
Figure 9. Comparison of Predicted Cutter Service Life between Two Models.
Processes 14 01732 g009
Table 1. Qualitative comparison of different disc cutter wear mechanisms.
Wear MechanismMain ConditionsTypical ManifestationsRelative Contribution
in This Study
Three-body abrasive wearRock particles, crushed fragments,
repeated cutter–rock contact
Scratching, ploughing,
material removal
Dominant
Adhesive wearHigh local pressure, local sliding,
direct contact
Adhesion, tearing, peelingSecondary
Fatigue wearCyclic loading, impact vibration,
non-uniform hard rock
Microcracks, spalling, chippingPotential/secondary
Table 2. Establishment and sensitivity analysis of the cutter wear regression model.
Model StageVariable(p)-ValueVIFPartial Correlation CoefficientDecision
Initial modelTotal thrust (F)0.0823.8220.830Temporarily retained
Initial modelCutterhead torque (T)0.0272.708−0.920Temporarily retained
Initial modelInstallation radius (R_i)0.0302.1000.915Temporarily retained
Initial modelPenetration (h)0.47760.4580.424Multicollinearity observed
Initial modelAdvance rate (v)0.84278.482−0.124Removed
Initial modelCutterhead rotation speed (n)0.72577.740−0.218Further evaluated
After removing (v)Total thrust (F)0.0172.3400.893Retained
After removing (v)Cutterhead torque (T)0.0102.686−0.919Retained
After removing (v)Installation radius (R_i)0.0061.5990.935Retained
After removing (v)Penetration (h)0.0181.9010.888Retained
After removing (v)Cutterhead rotation speed (n)0.6121.167−0.265Removed
Final modelTotal thrust (F)0.0062.1910.899Retained
Final modelCutterhead torque (T)0.0042.666−0.916Retained
Final modelInstallation radius (R_i)0.0021.4810.932Retained
Final modelPenetration (h)0.0091.9000.881Retained
Table 3. Disc Cutter Number and Installation Radius.
Cutter No.Installation
Radius/mm
Cutter No.Installation
Radius/mm
9876242146
10966252226
111052262306
121138272386
131228282466
141310292546
151396302626
161479312706
171562322786
181648332861
191731342936
201814353011
211897363086
221980373161
232063383236
Table 4. Rock Mechanical Parameters.
Compressive Strength σ c /MPaTensile Strength σ t /MPaCohesion c /MPaInternal Friction Angle ϕ b Breakage Angle
γ
1249.628.13420
Table 5. Disc Cutter Parameters.
Cutter Edge Strength (MPa)Cutter Radius (mm)Edge Width (mm)Cutter Spacing (mm)Edge Angle (°)
1887241.52081.0810
Table 6. Error statistics and uncertainty bounds of cutter wear prediction models.
ModelMean Relative Error/%Standard
Deviation/%
95% Confidence
Interval/%
Error Range/%
CSM model18.437.1815.75–21.111.8–27.0
Improved CSM model8.133.726.74–9.520.0–13.9
Table 7. Error statistics and uncertainty bounds of cutter service life prediction models.
ModelMean Relative Error/%Standard
Deviation/%
95% Confidence
Interval/%
Error Range/%
CSM model23.4510.3119.60–27.301.8–37.0
Improved CSM model8.854.497.17–10.530.1–16.1
Table 8. Error statistics and uncertainty bounds of cutter wear prediction by two models.
ModelMean Relative
Error/%
Standard
Deviation/%
95% Confidence
Interval/%
Error Range/%
Mechanistic model11.007.175.49–16.511.3–22.6
Regression model7.574.653.99–11.141.3–13.1
Table 9. Error statistics and uncertainty bounds of cutter service life prediction by two models.
ModelMean Relative
Error/%
Standard
Deviation/%
95% Confidence
Interval/%
Error Range/%
Mechanistic model13.049.245.94–20.151.3–29.2
Regression model7.864.964.05–11.661.3–15.1
Disclaimer/Publisher’s Note: The statements, opinions and data contained in all publications are solely those of the individual author(s) and contributor(s) and not of MDPI and/or the editor(s). MDPI and/or the editor(s) disclaim responsibility for any injury to people or property resulting from any ideas, methods, instructions or products referred to in the content.