3.1. Molecular Docking
Molecular docking was used as an initial virtual screening approach to evaluate the binding potential of betulinic acid-derived hybrid compounds toward selected anti-apoptotic members of the Bcl-2 protein family. A virtual library comprising 152 betulinic acid-based hybrid molecules was constructed through systematic modification of the parent scaffold in order to explore structural diversity within a synthesizable chemical framework. The library incorporated pharmacologically relevant structures previously reported in the literature. The complete compound library, including the SMILES representations, is provided in the
Supplementary Materials (Table S1).
Molecular docking runs were performed using AutoDock Vina implemented in PyRx, and the resulting docking scores were used for comparative ranking of the hybrid ligands across the investigated protein targets. For the process of identifying potential Bcl-2/Bcl-XL dual inhibitors, three PDB structures were selected for this analysis: 2W3L (chimeric Bcl-2/XL), 2YXJ (Bcl-XL), and 4LVT (Bcl-2). The molecular docking search-space parameters used for these structures are provided in the
Supplementary Materials (Table S3). To assess the reliability of the docking protocol, redocking of the co-crystallized ligands was performed for the three protein structures. The calculated RMSD values were 0.373 Å for 2W3L, 1.569 Å for 2YXJ, and 0.732 Å for 4LVT, indicating a good reproduction of the experimental binding poses for each native ligand (
Table S3).
Based on the obtained docking results, the top 10 ranked hybrids for each protein target, according to their Vina docking scores, are summarized in
Table 1. Because the objective of this study was to identify candidates with potential dual Bcl-2/Bcl-XL inhibitory potential, compound prioritization was based not only on high docking scores for a single structure but also on consistent top-ranking performance across all three models. Hyb.96 and Hyb.112 were chosen in this particular case because they were among the top 10 ranked ligands for the three target proteins (2W3L, 2YXJ, and 4LVT), indicating a greater theoretical potential for inhibiting both Bcl-2 and Bcl-XL. Furthermore, the docking scores of the native ligands were included in
Table S2 as protocol-specific reference values, enabling the comparison of the hybrid library with the co-crystallized compounds under identical docking conditions. Many hybrids exhibited docking scores that were comparable to, and in some cases, even more favorable than, those of the native ligands. Nevertheless, Hyb.96 and Hyb.112 were chosen primarily due to their consistent top-ranking performance across all three protein models, which was considered more suitable for the identification of candidates with potential dual Bcl-2/Bcl-XL inhibitory behavior.
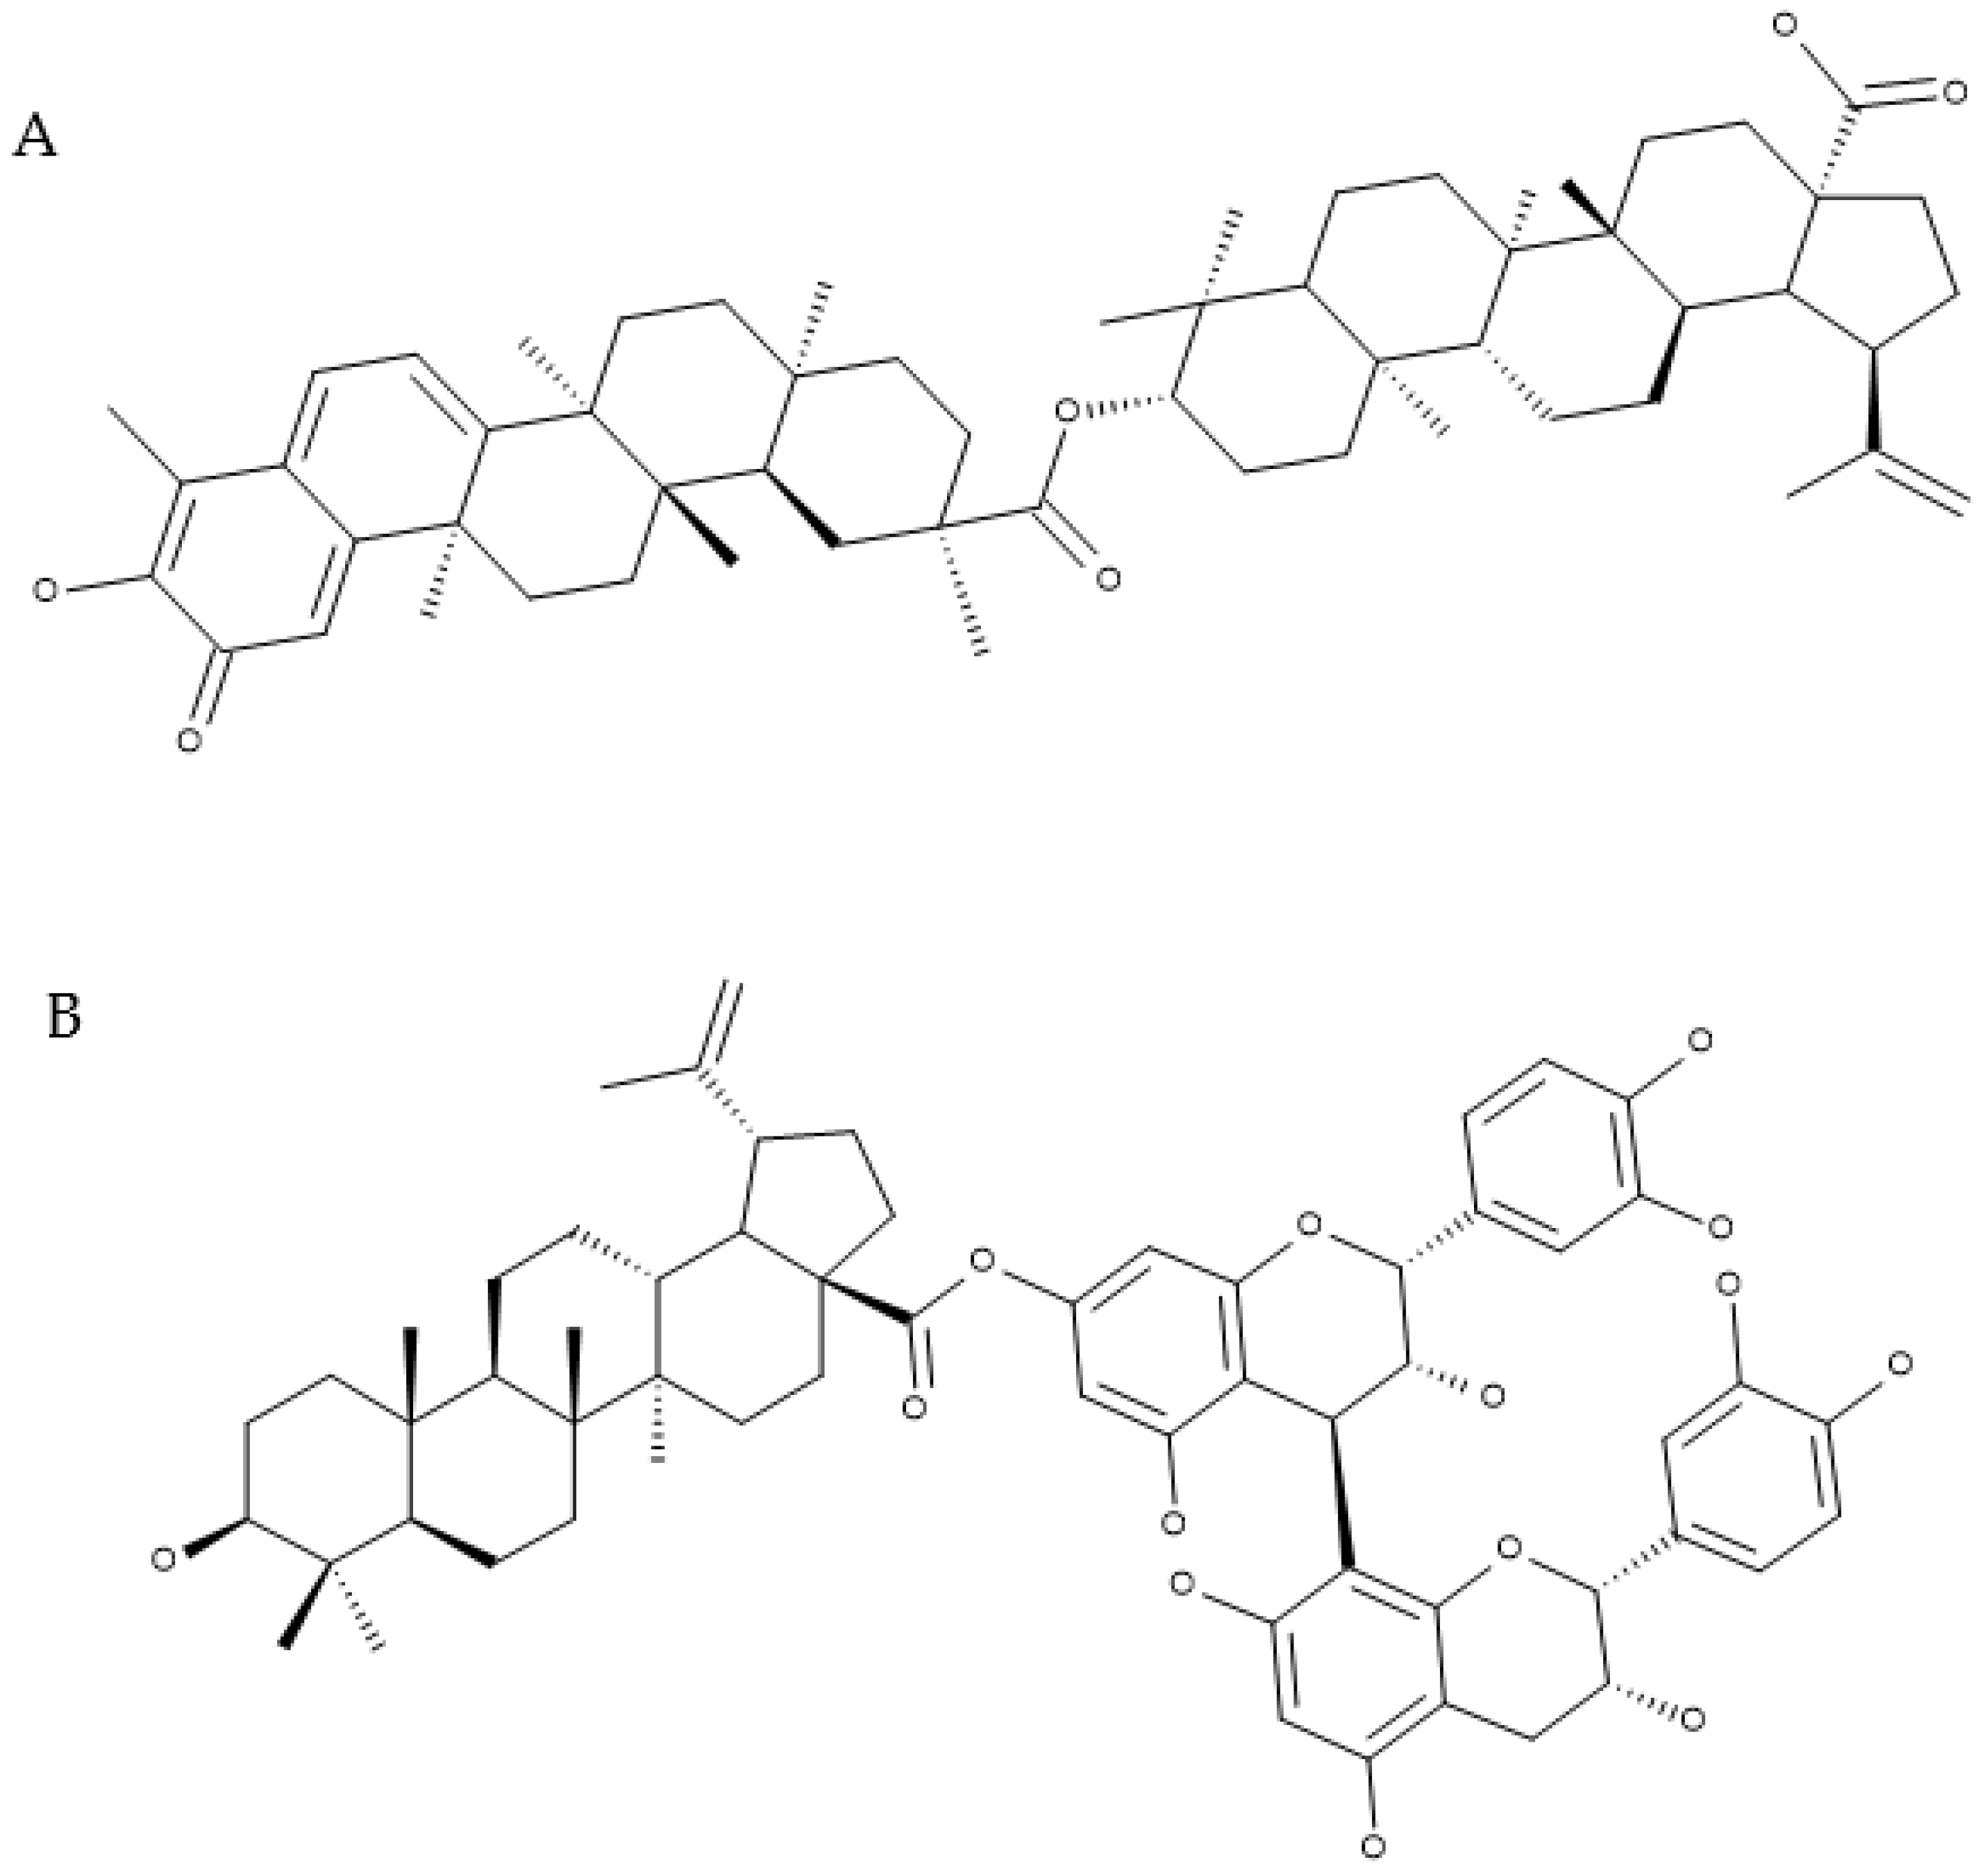
The two-dimensional chemical structures of the selected hybrids, Hyb.96 (BA–Celastrol) and Hyb.112 (BA–Proanthocyanidin B2), are presented in
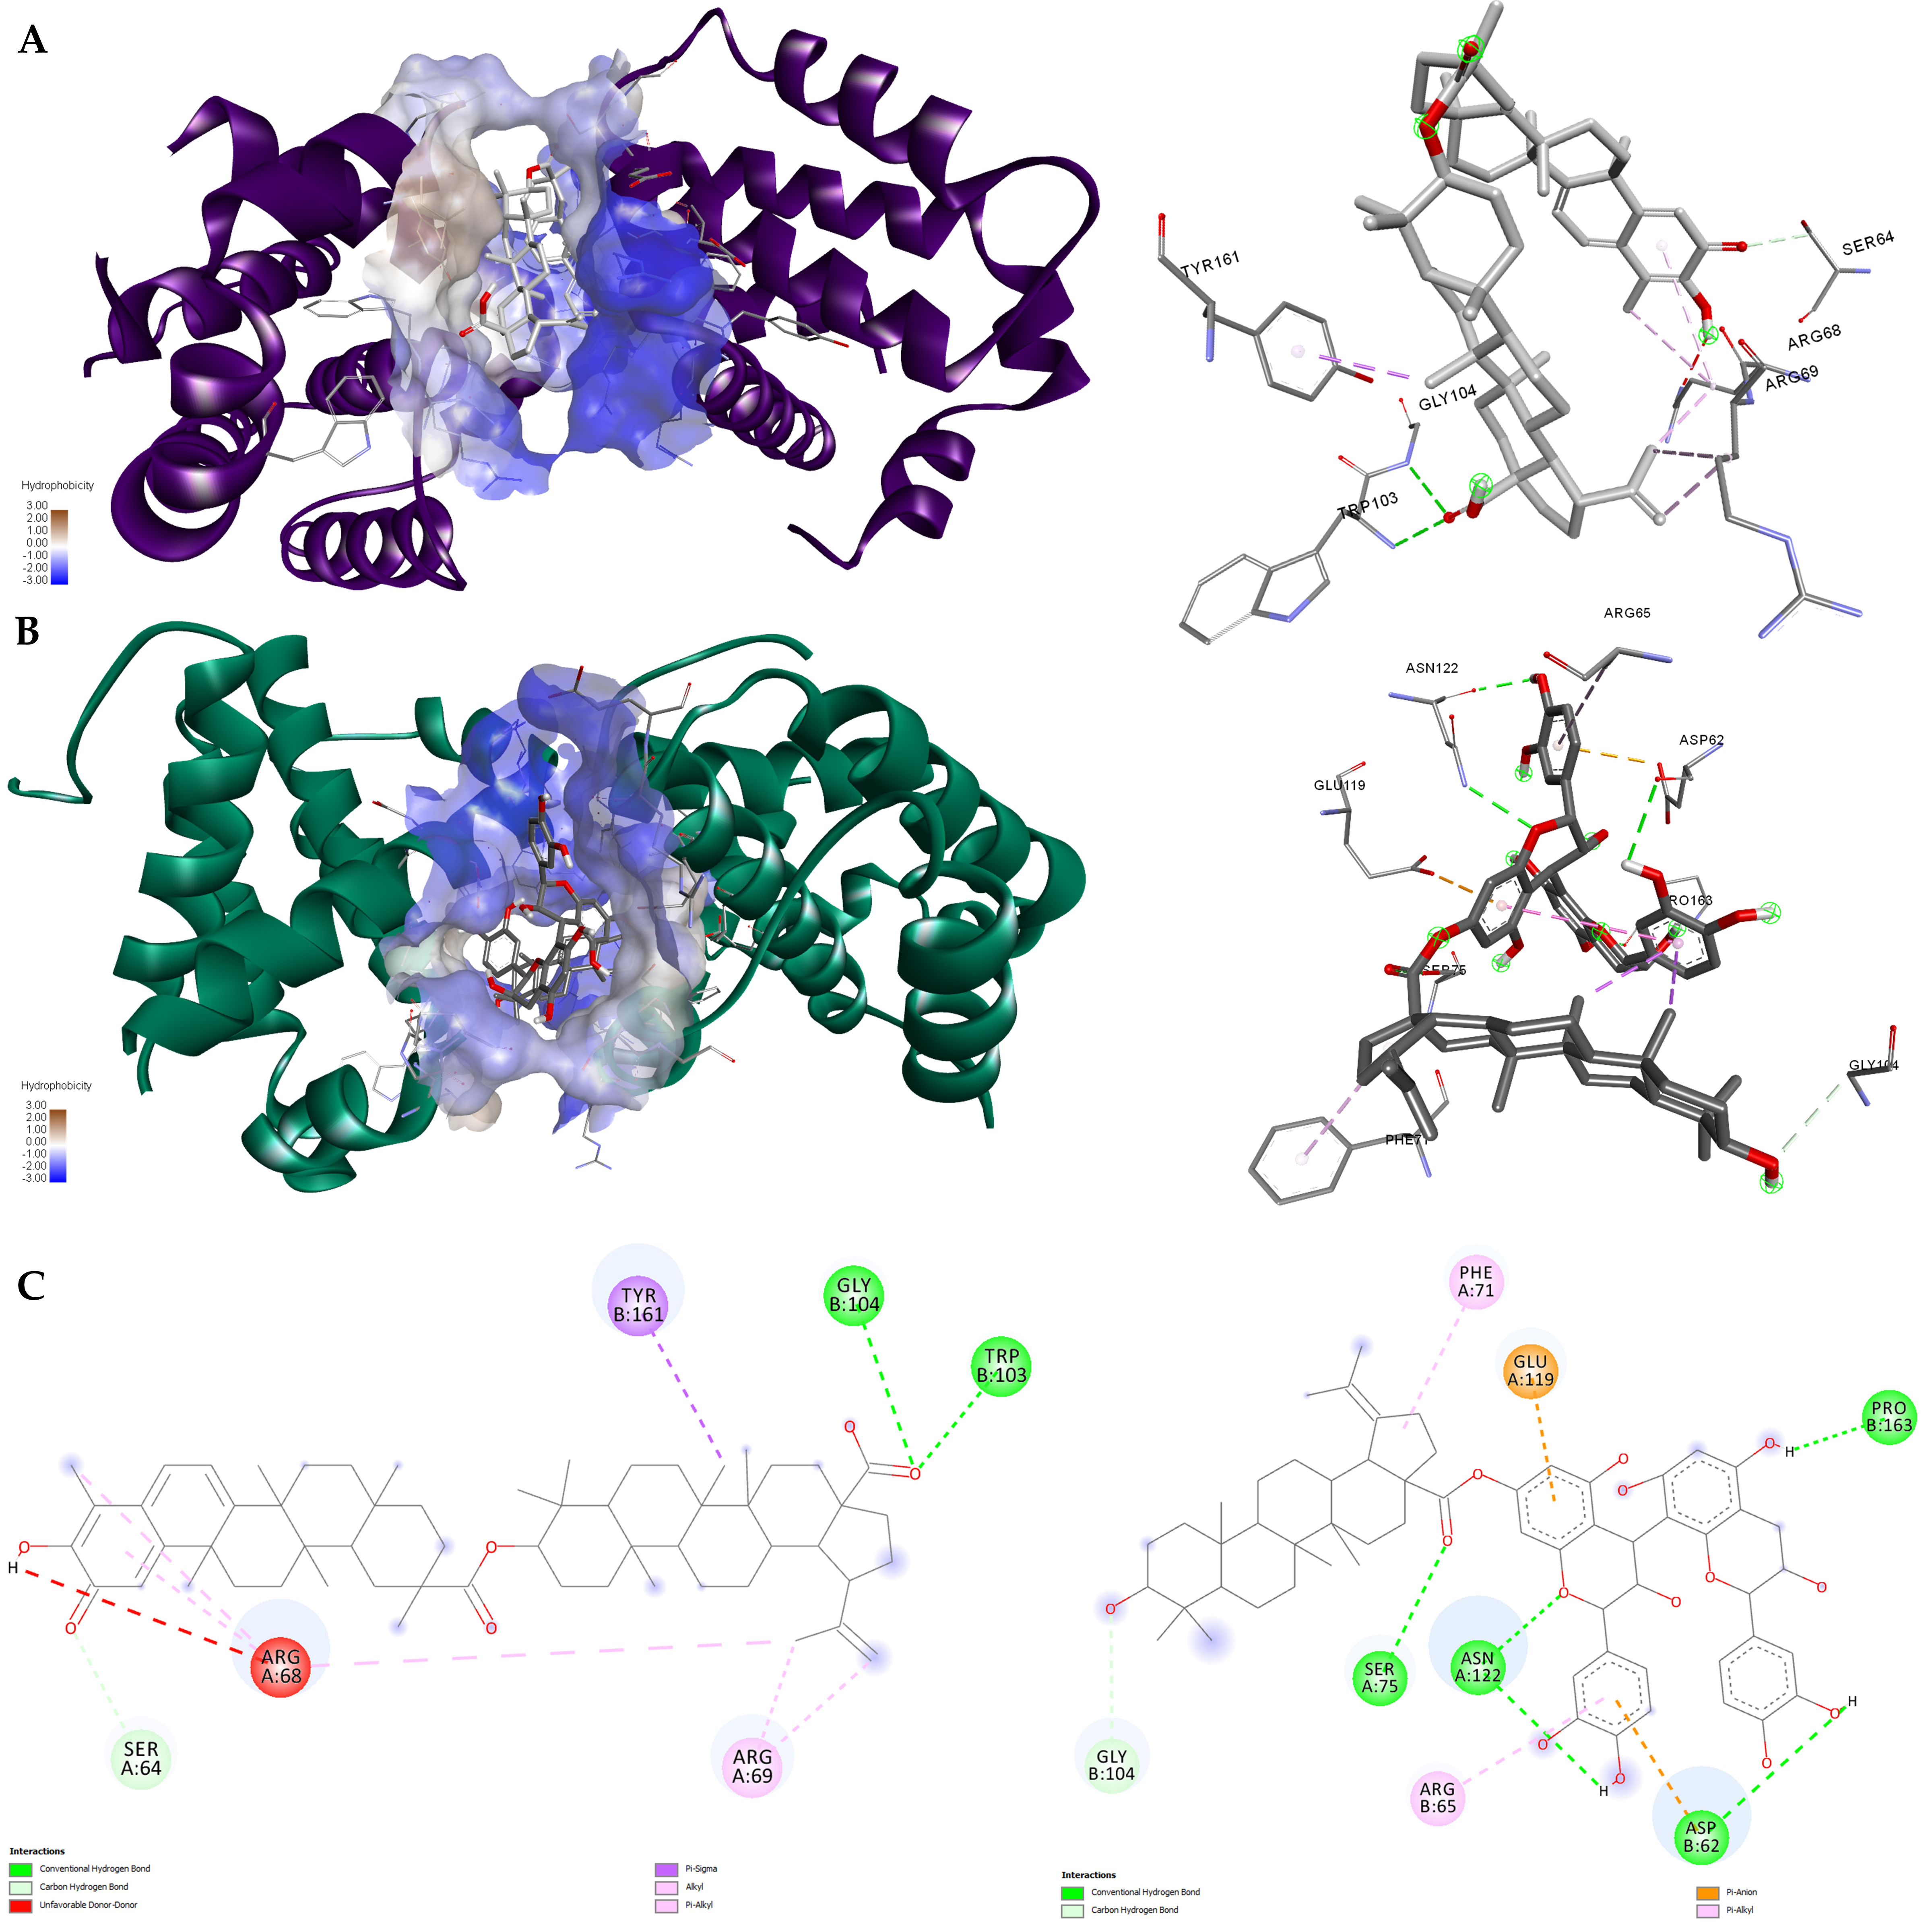
Figure 1 to facilitate compound visualization. Structure-based molecular docking was used to examine the predicted binding poses of Hyb.96 and Hyb.112 in the anti-apoptotic protein Bcl-2 (PDB ID: 2W3L). As shown in
Figure 2, both docked poses were located within the BH3-binding pocket. PLIP (Protein–Ligand Interaction Profiler) analysis indicated that Hyb.96 formed four hydrogen bonds and six major hydrophobic contacts, whereas Hyb.112 formed six hydrogen bonds and eight major hydrophobic contacts in the same binding region (
Table 2). For Hyb.96, the hydrogen-bonding pattern involved ARG68, TRP103, and GLY104, while the principal hydrophobic contacts included ARG66, ARG68, ARG69, ALA72, LEU160, and TYR161. For Hyb.112, hydrogen bonds involved ALA59, SER75, GLY104, ASN122, and PRO163, and the main hydrophobic contacts included ARG65, ARG68, PHE71, ALA72, VAL115, ASN122, and TYR161. These results indicate that both ligands occupied the same binding region in the 2W3L model but differed in the number and distribution of predicted polar and hydrophobic contacts.
These results for the 2W3L protein indicate that although both ligands occupy the same BH3-binding region, Hyb.112 establishes a more extensive hydrogen-bonding network, suggesting a stronger contribution of polar interactions to the binding process. This may enhance electrostatic stabilization within the binding pocket. In contrast, Hyb.96 exhibits a more balanced interaction profile, combining hydrophobic contacts with fewer but persistent hydrogen bonds, which may contribute to a more structurally constrained and stable binding mode within the pocket.
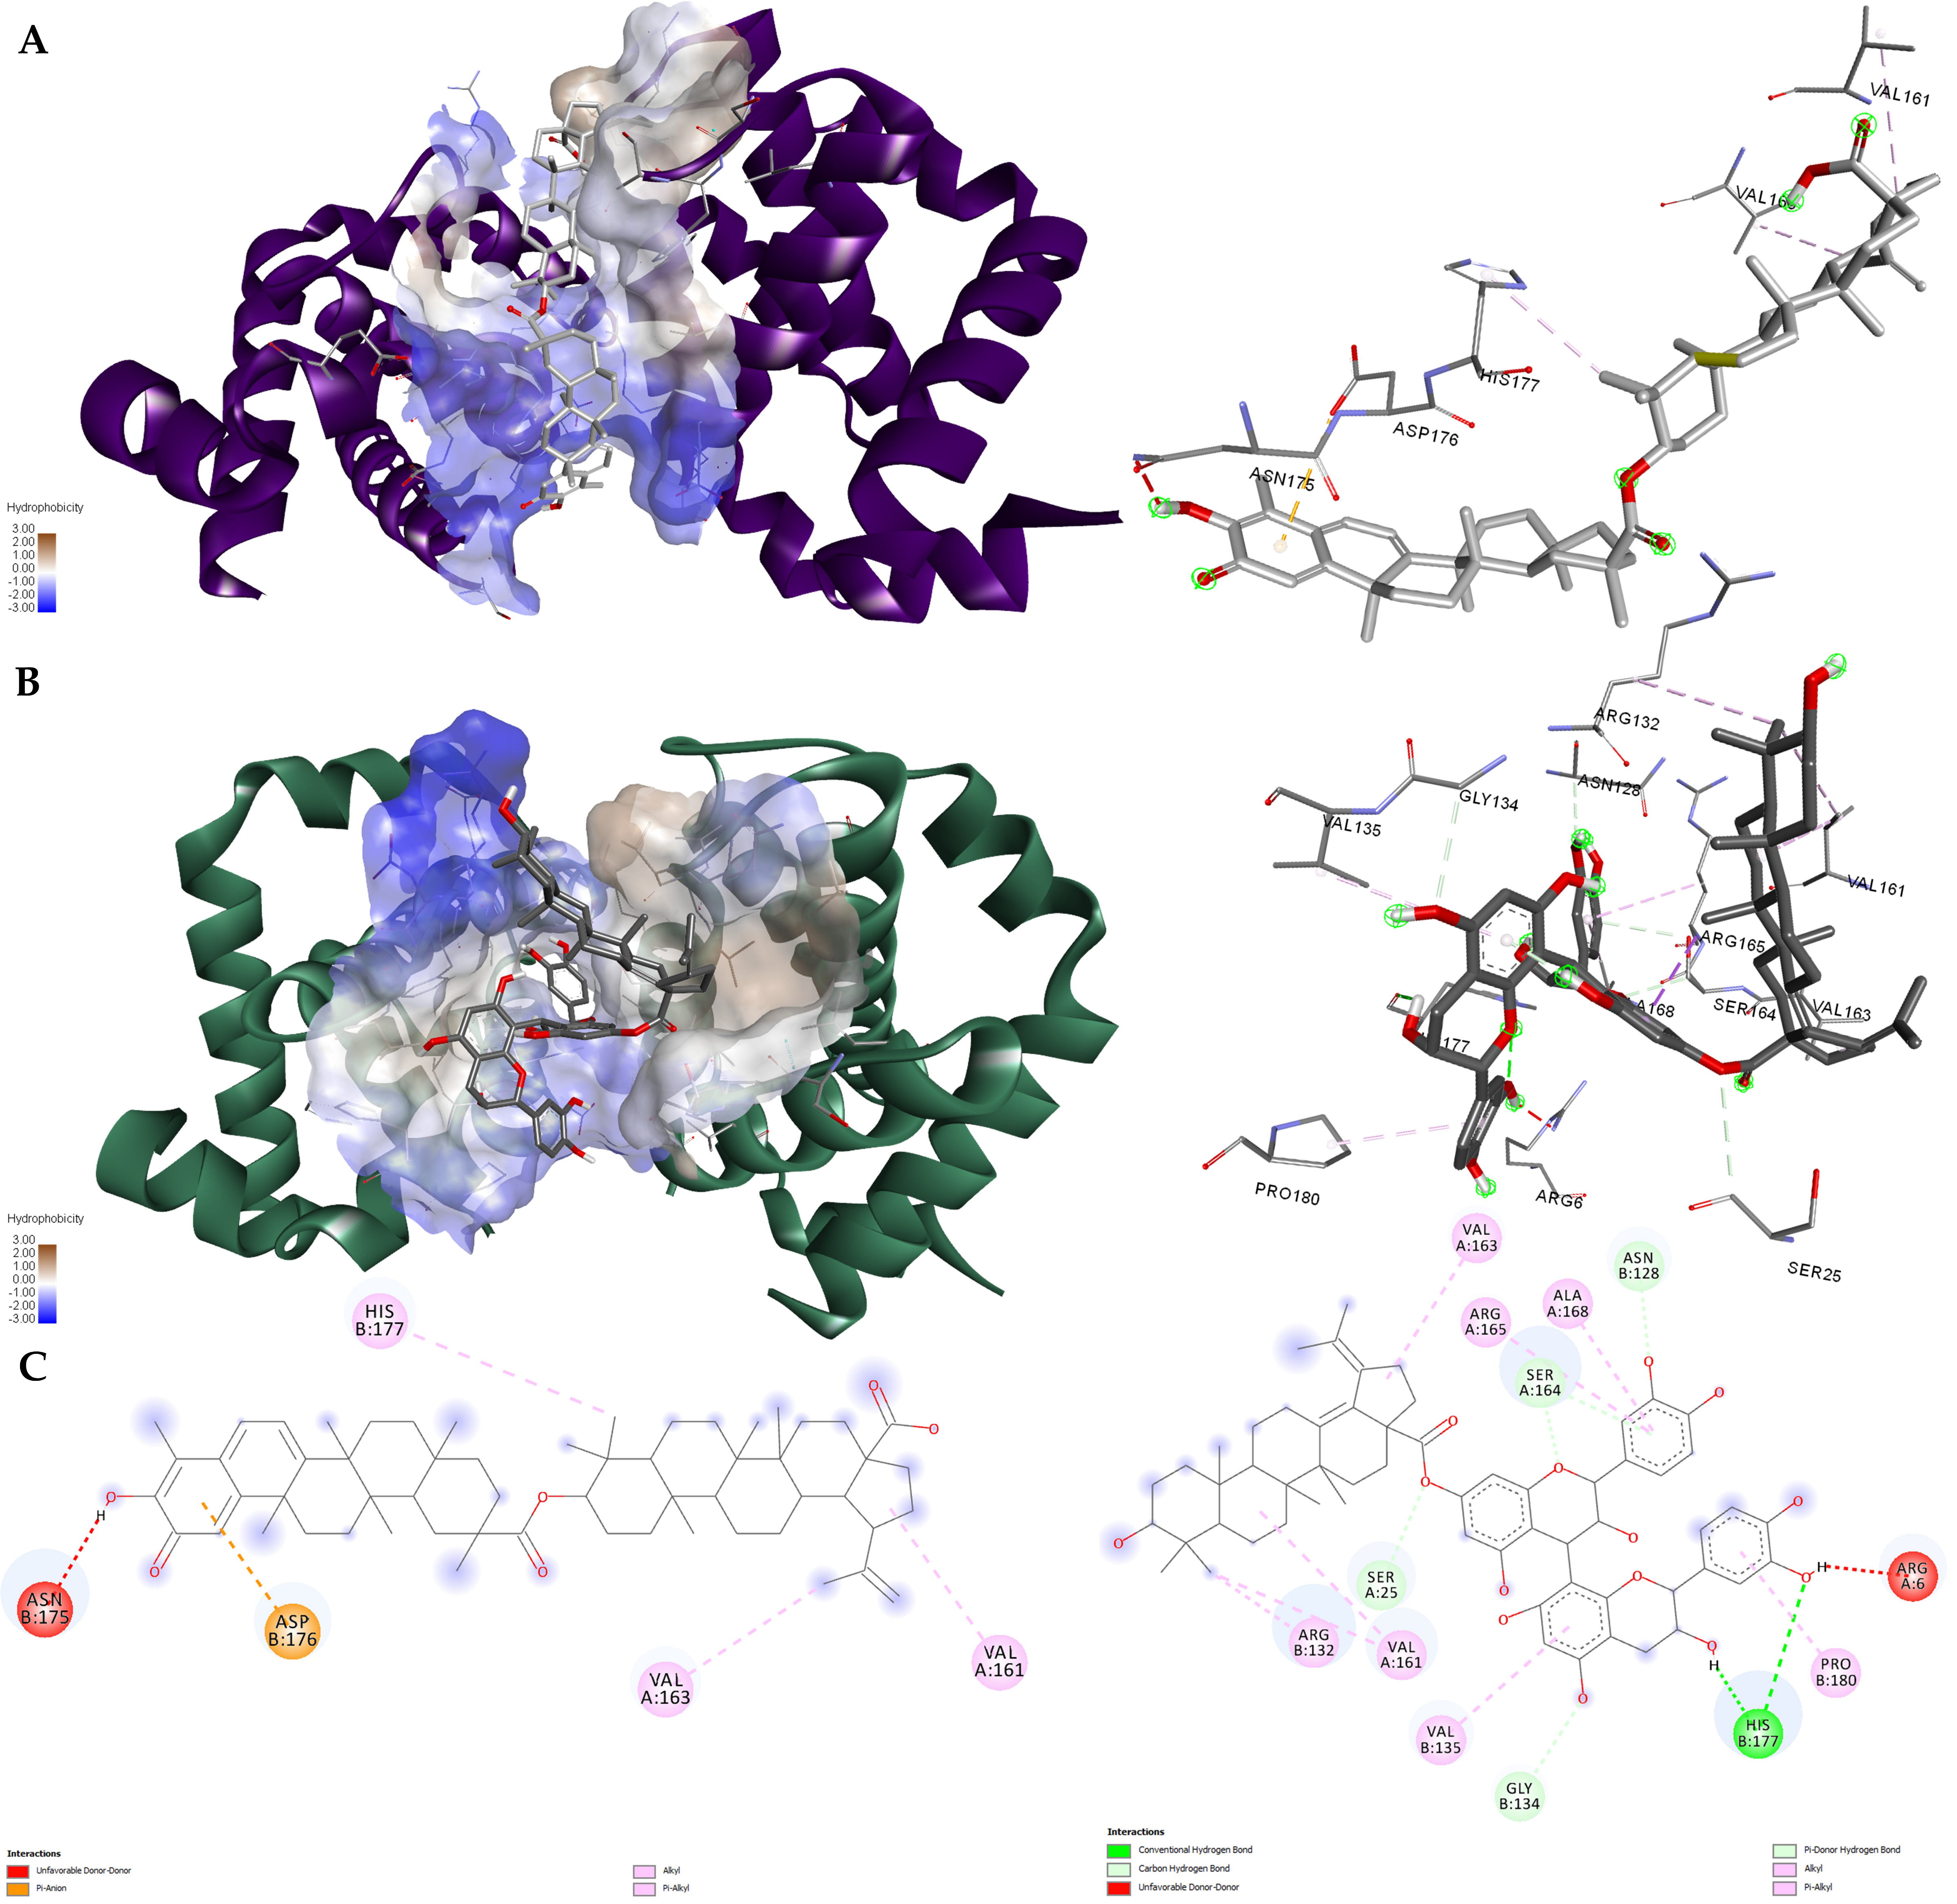
The predicted binding poses of Hyb.96 and Hyb.112 were also examined in Bcl-XL (PDB ID: 2YXJ).
Figure 2 indicates that both docked conformations were positioned within the elongated hydrophobic cavity and formed non-covalent contacts with residues lining the pocket.
The PLIP analysis revealed that Hyb.96 formed three main hydrophobic contacts with TRP24, VAL161, and PRO180, as well as three hydrogen bonds that involve SER164 (two contacts) and ASN175, as summarized in
Table 3 and illustrated in
Figure 3C. Hyb.112 also formed three significant hydrophobic contacts, which involved GLN160, VAL161, and PRO180. However, it also exhibited five hydrogen bonds, which involved ARG6, VAL135, SER164, TYR173, and HIS177. Consequently, the 2YXJ model indicated that both ligands exhibited the same number of significant hydrophobic contacts. However, Hyb.112 exhibited two additional predicted hydrogen bonds in comparison to Hyb.96.
The interaction patterns observed for the 2YXJ model suggest that both ligands retain comparable hydrophobic anchoring within the elongated binding cavity. However, the higher number of hydrogen bonds formed by Hyb.112 indicates an increased contribution of polar interactions, potentially enhancing electrostatic stabilization within the binding site. In contrast, Hyb.96 maintains a more localized and structurally restrained interaction profile, which may favor a more stable and less dynamic binding mode within the pocket.
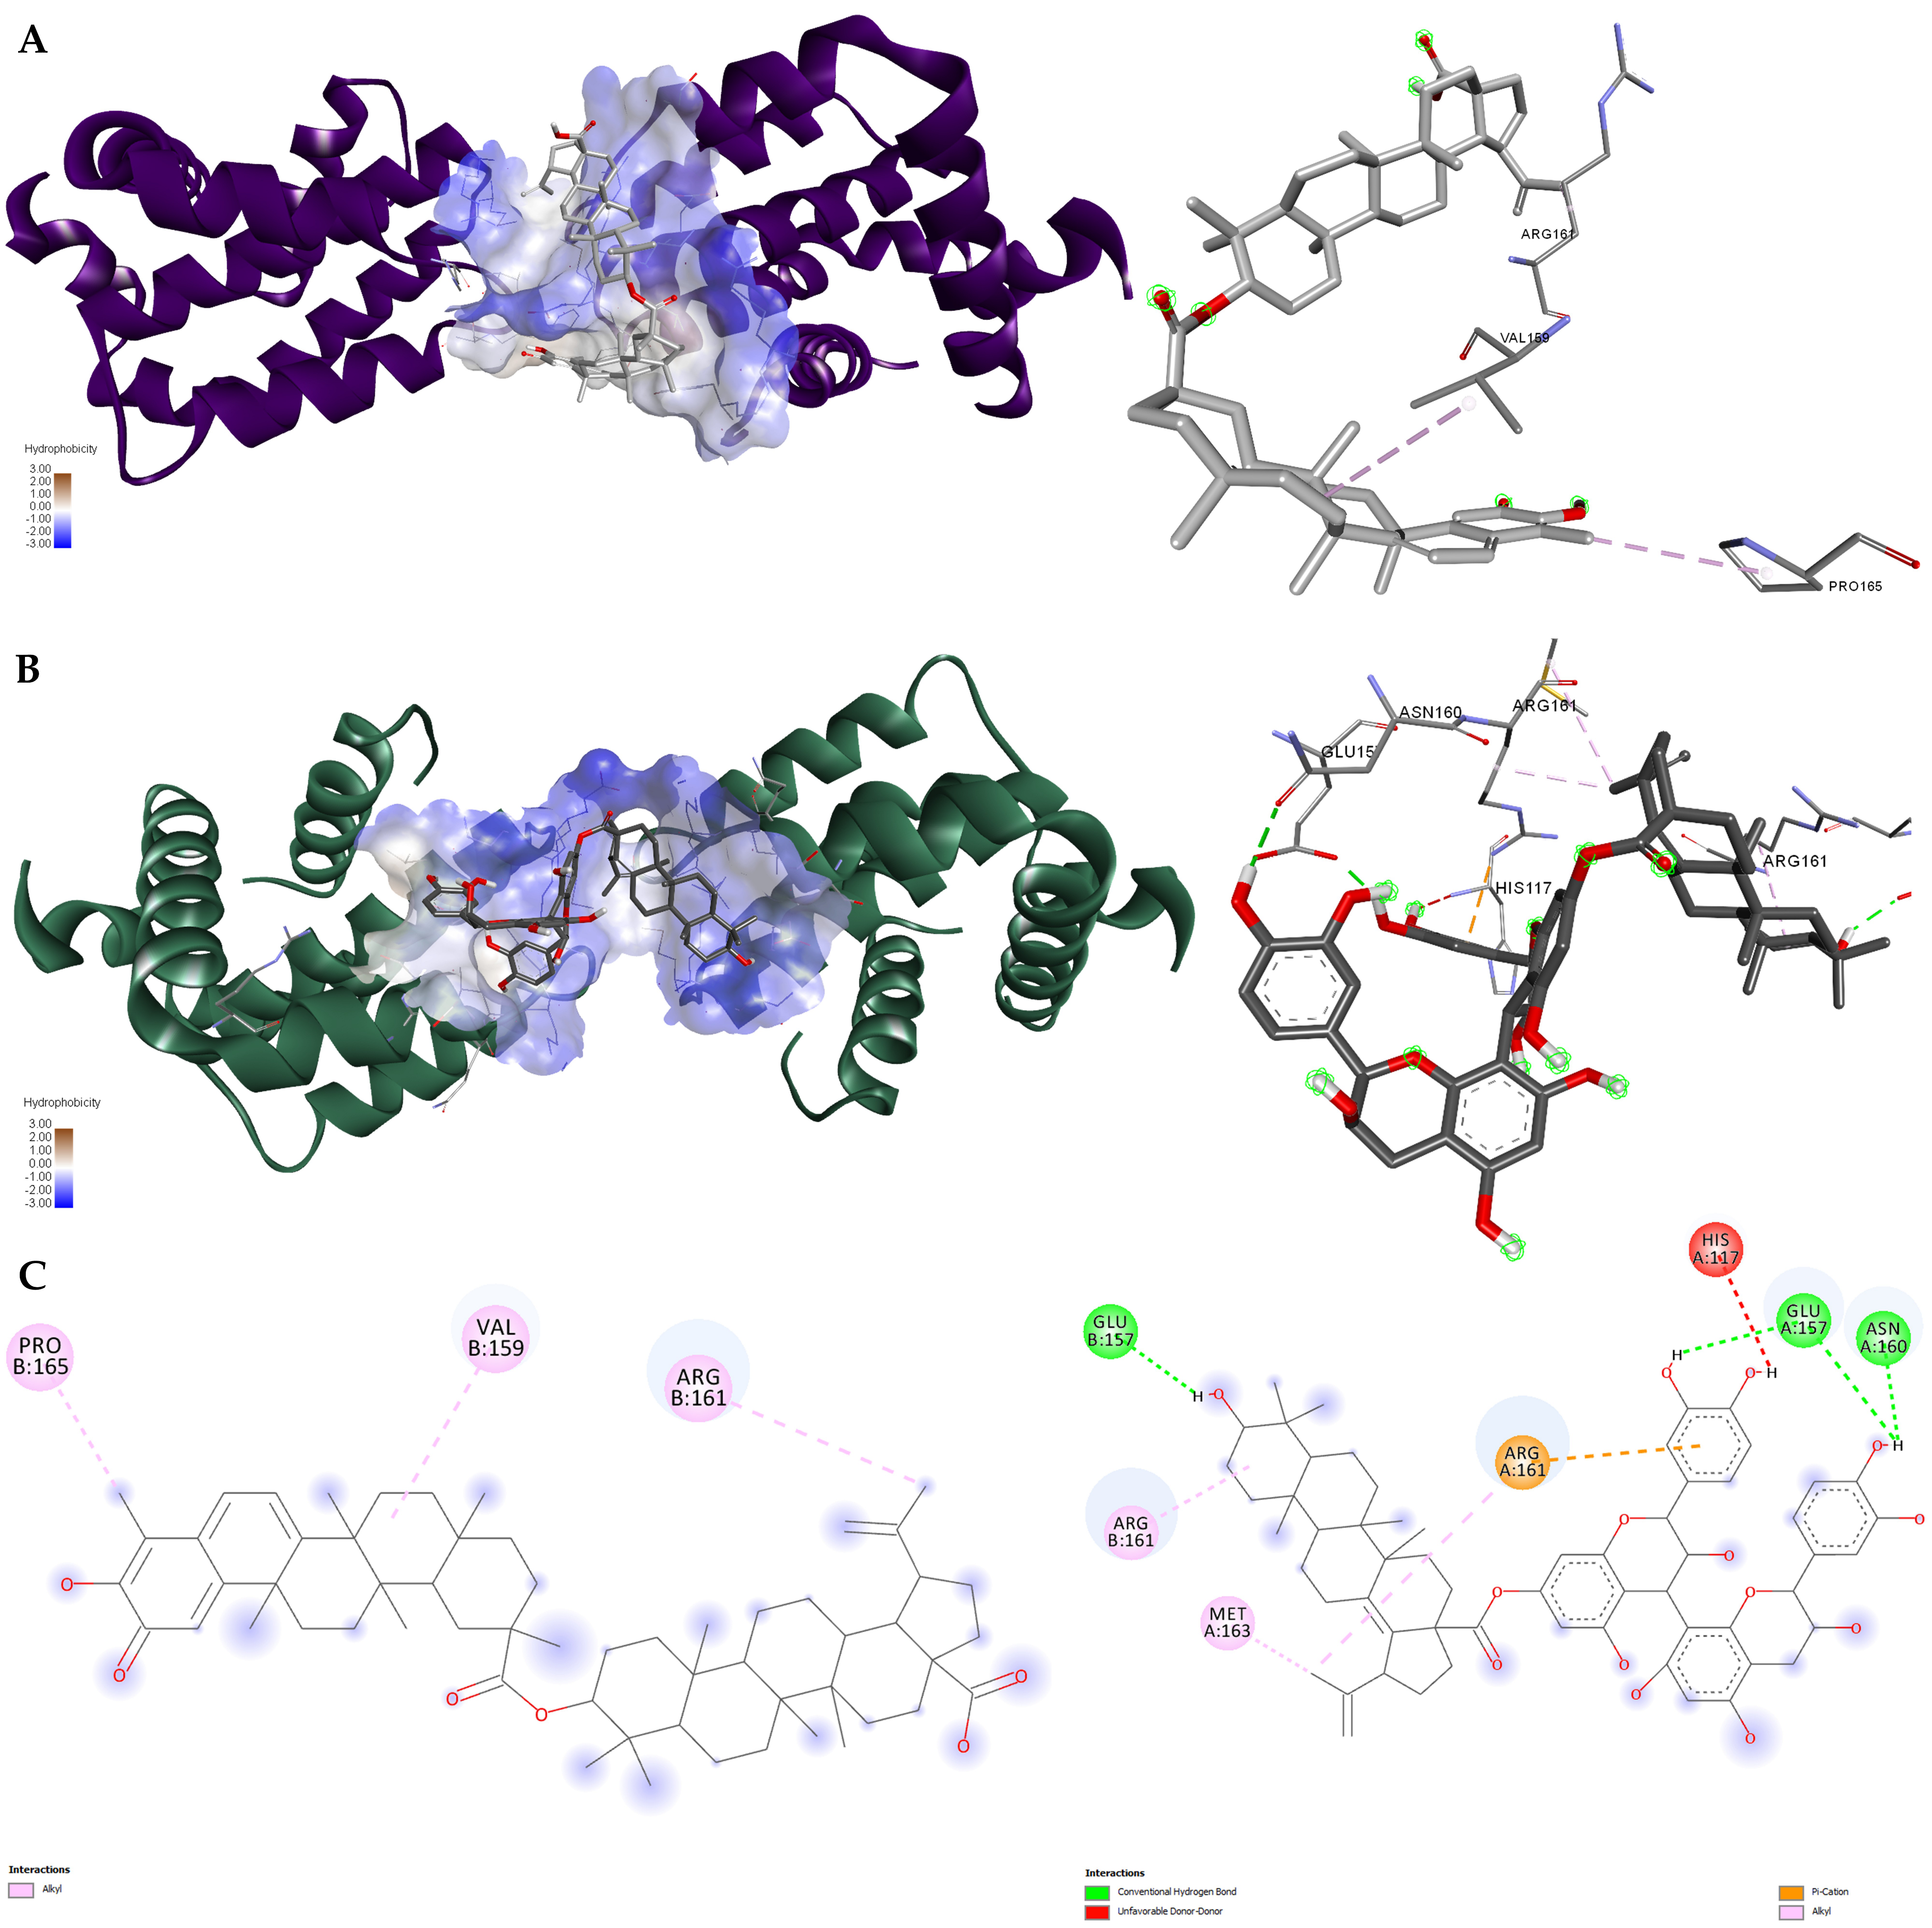
The predicted binding poses of the BA–Celastrol and BA–Proanthocyanidin B2 hybrids in Bcl-2 (PDB ID: 4LVT) are shown in
Figure 4. Both docking poses were located within the surface-defined pocket, where they established non-covalent contacts with residues in the binding region. The interaction panels summarize the predicted contact patterns for the two ligands in the 4LVT model.
For the 4LVT model, the two ligands showed different predicted contact patterns (
Table 4). Hyb.96 formed four hydrophobic contacts involving TYR26, VAL159, ARG161, and GLU162, while no hydrogen bonds were detected in the PLIP analysis. In contrast, Hyb.112 showed three hydrophobic contacts involving THR119, ARG161, and GLU162, together with six hydrogen bonds involving LEU116, HIS117, and GLU157, as well as a predicted π–cation interaction with ARG161. Thus, in the 4LVT docking model, both ligands showed the same number of major hydrophobic contacts, whereas Hyb.112 exhibited a larger number of predicted polar interactions than Hyb.96, six relative to zero hydrogen bonds, plus one π–cation interaction.
In the 4LVT model, the absence of hydrogen bonds for Hyb.96 and its predominantly hydrophobic interaction profile suggests a binding mode driven mainly by dispersion forces. This indicates that ligand stabilization is largely governed by van der Waals interactions within the binding pocket. Conversely, Hyb.112 exhibits a significantly larger number of hydrogen bonds and an additional π–cation interaction, indicating a more complex and polar interaction network. This pattern suggests an increased contribution of electrostatic interactions, which may enhance estimated binding energy but also introduce greater sensitivity to solvation effects.
Overall, the docking analysis indicates that both Hyb.96 and Hyb.112 are able to occupy the BH3-binding groove across all investigated Bcl-2 family structures. Hyb.112 consistently exhibits a more extensive hydrogen-bonding and polar interaction profile, whereas Hyb.96 displays a more balanced interaction pattern characterized by hydrophobic stabilization and fewer but persistent hydrogen bonds. The consistent involvement of key residues such as ARG68, GLY104, and TYR161 supports the biological relevance of the predicted binding modes. Furthermore, the ability of both ligands to maintain top-ranking positions across all three protein models suggests a robust binding behavior that is not dependent on a single receptor conformation. Taken together, these differences indicate distinct binding strategies, with Hyb.112 favoring stronger electrostatic contributions and Hyb.96 exhibiting a more stable and structurally constrained binding mode. This distinction provides a structural basis for the differences observed in the subsequent molecular dynamics simulations.
Hyb.96 (BA–Celastrol hybrid) and Hyb.112 (BA–Proanthocyanidin B2 hybrid) were subsequently submitted to molecular dynamics simulations and binding free-energy calculations.
3.2. Molecular Dynamics Simulation
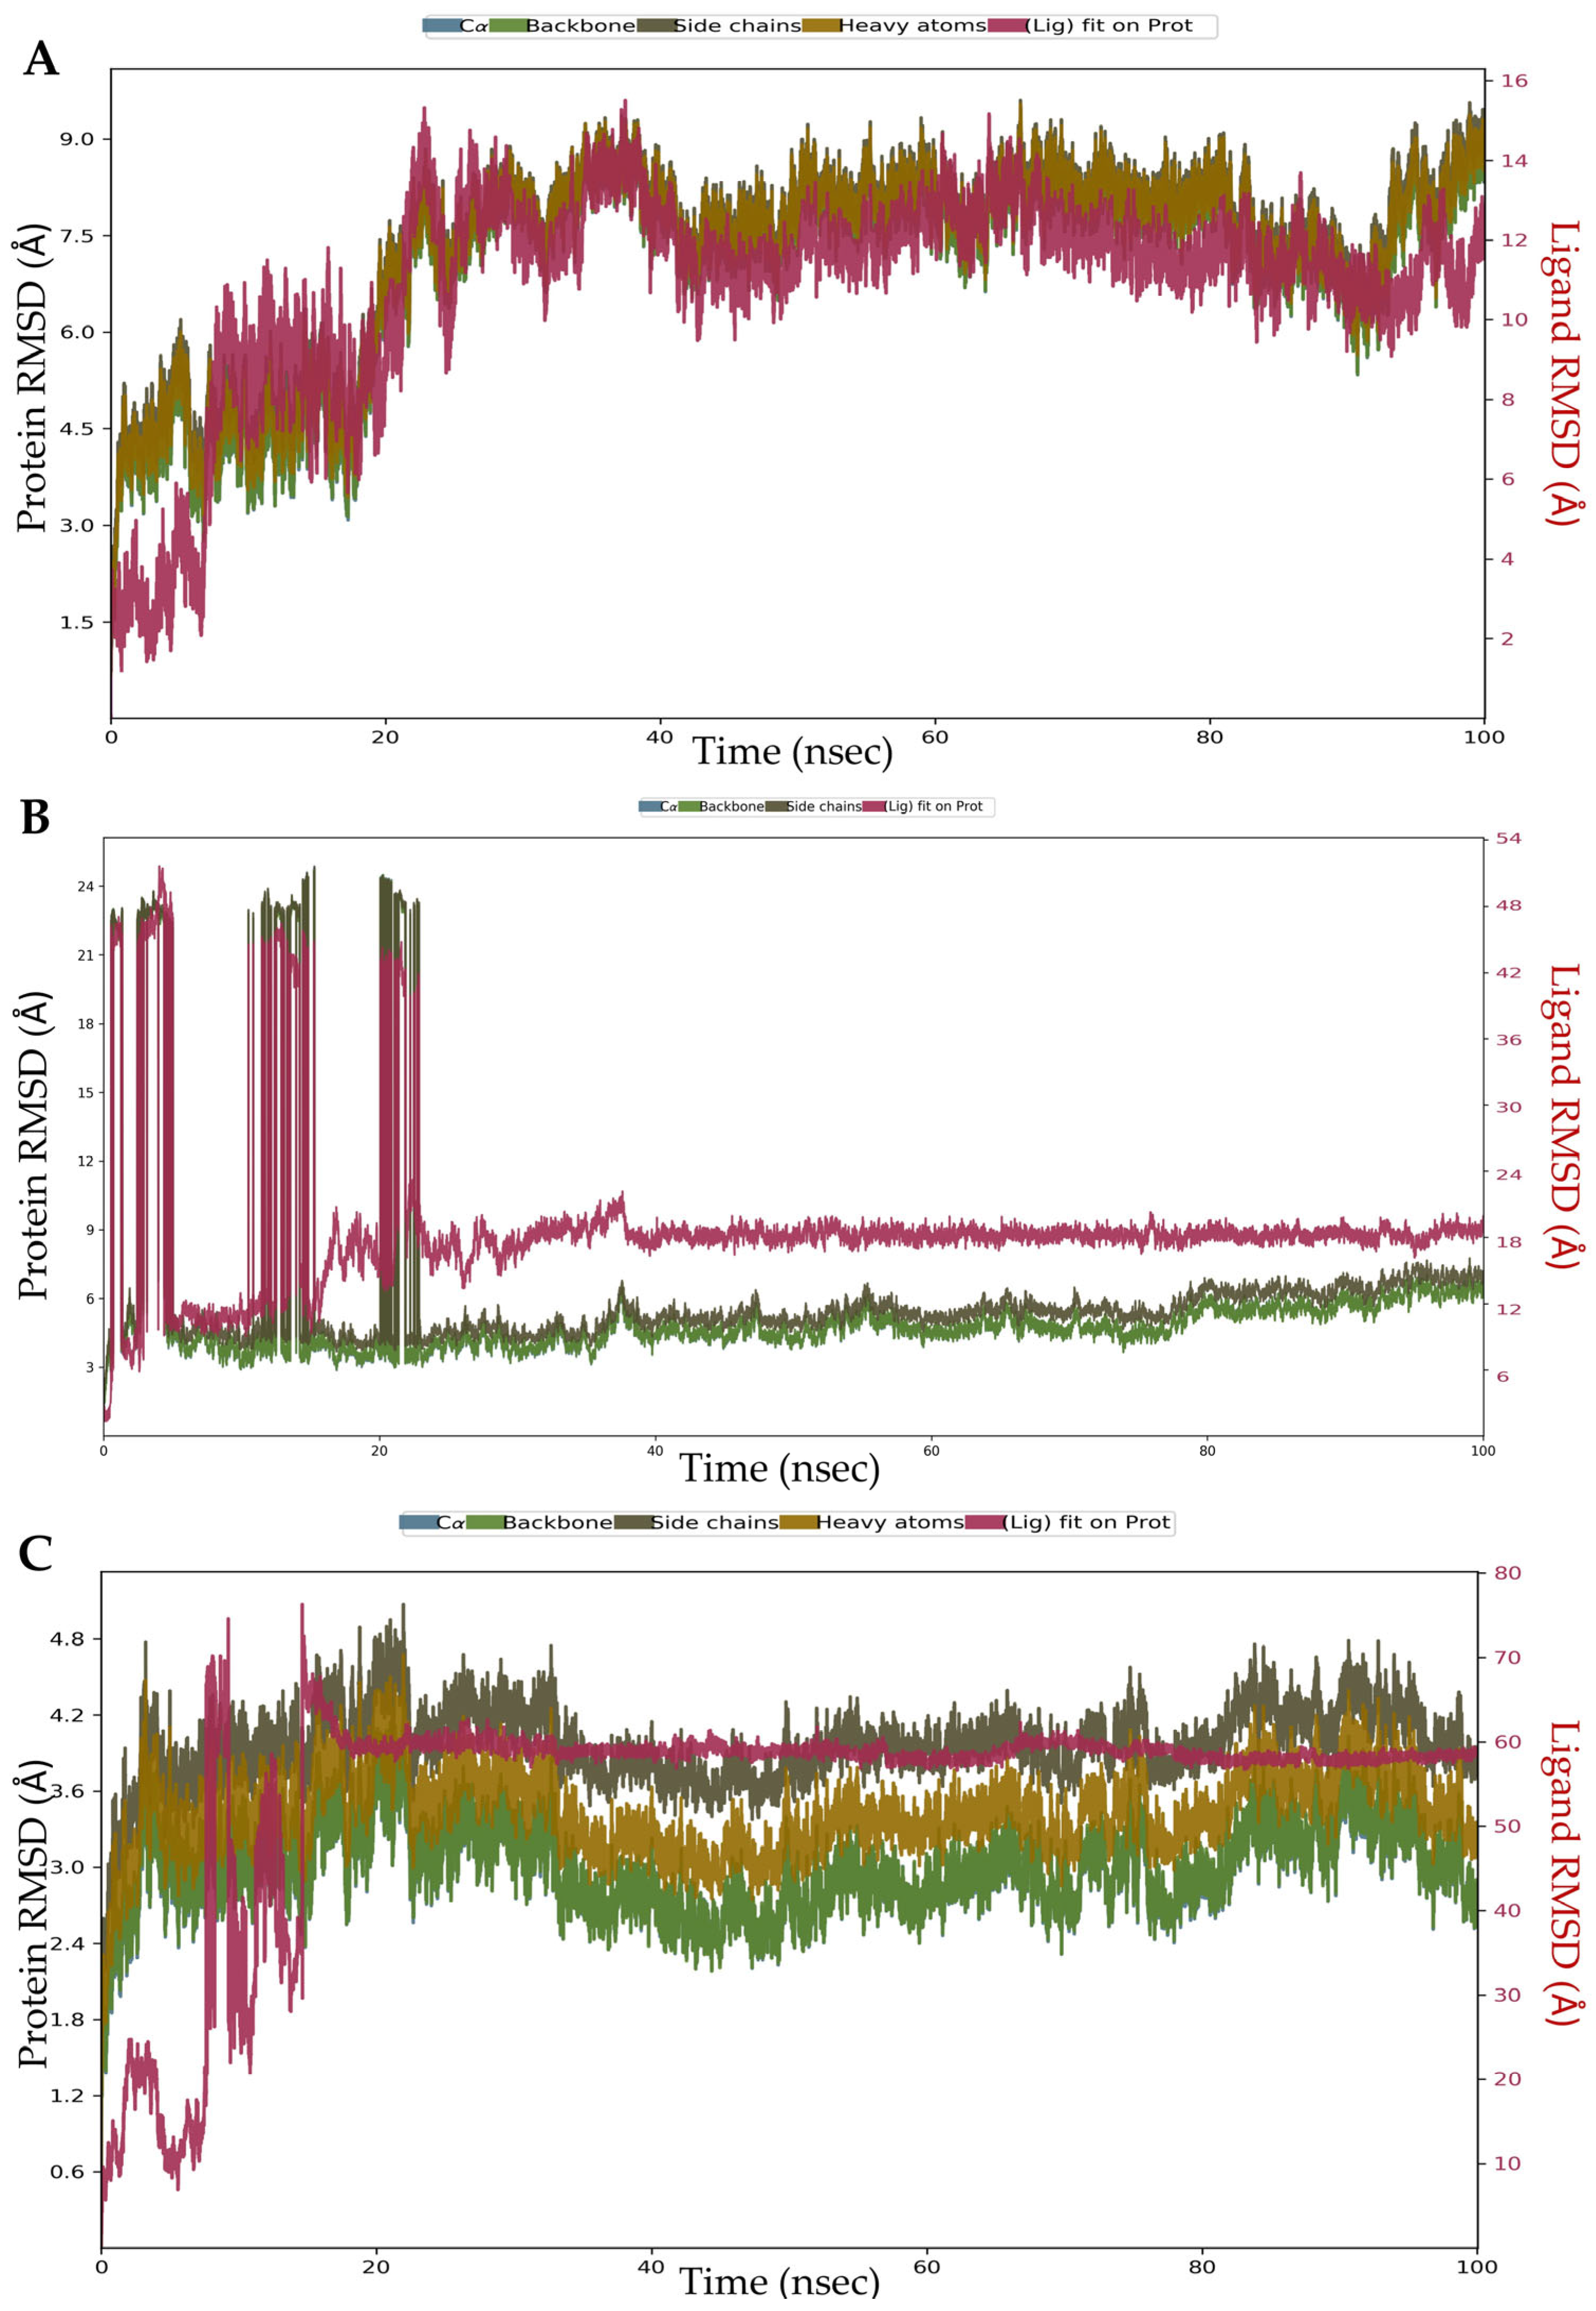
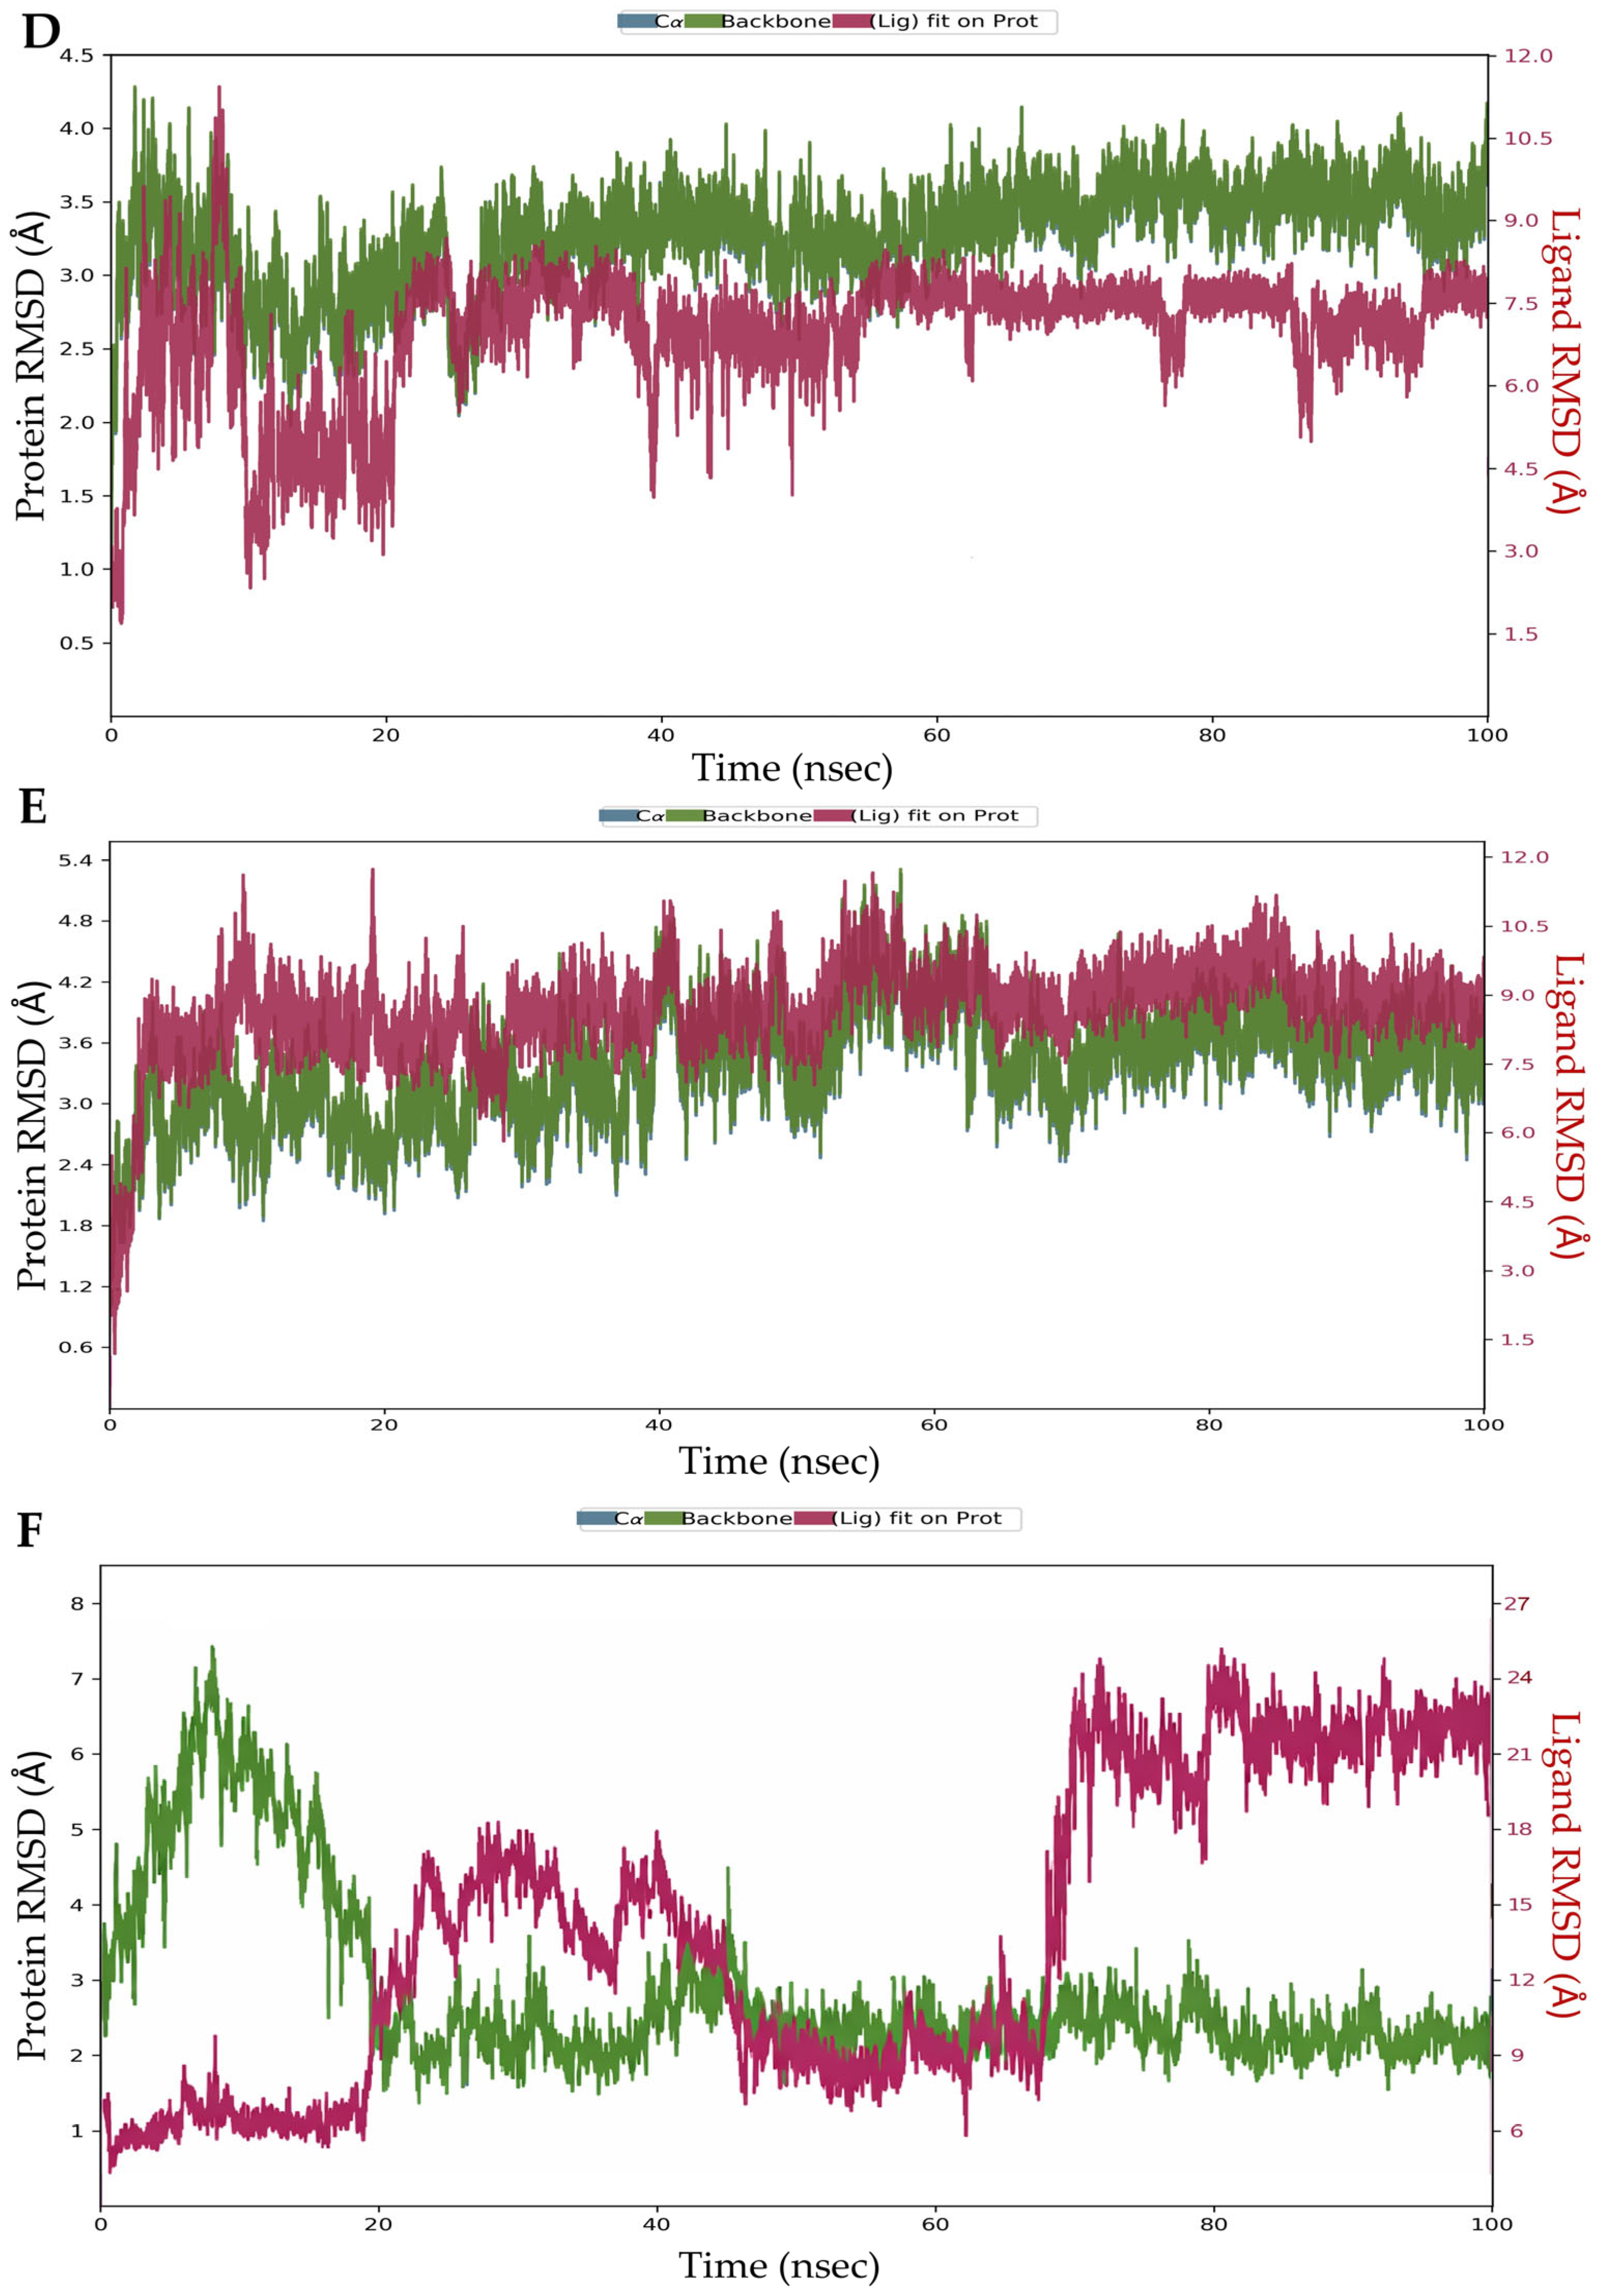
To evaluate the dynamic stability of the six protein–ligand complexes, 100 ns molecular dynamics simulations were performed, and the resulting trajectories were analyzed in terms of protein Cα RMSD (left
Y-axis) and ligand RMSD relative to the protein (right
Y-axis). Panels A–F (
Figure 5) correspond to the complexes 2W3L–Hyb.96, 2W3L–Hyb.112, 2YXJ–Hyb.96, 2YXJ–Hyb.112, 4LVT–Hyb.96, and 4LVT–Hyb.112.
In the 2W3L–Hyb.96 complex, the protein RMSD increases after 20 ns, after which it fluctuates within a range of approximately 7–9 Å. Although relatively high, these values likely reflect global conformational rearrangements of flexible regions rather than structural instability of the protein core. A similar trend is observed in the ligand case, where after fitting the protein, RMSD reaches values between 10 and 14 Å. Overall, the 2W3L–Hyb.96 system appears to undergo coupled protein–ligand rearrangement rather than maintaining its initial binding pose.
The 2W3L–Hyb.112 system exhibits different behavior, characterized by marked structural rearrangement with pronounced RMSD changes during 0–25 ns. The ligand RMSD shows similar behaviour, exhibiting substantial variations in the same interval, indicating major positional changes relative to the initial docked pose. Following this transition phase, the ligand RMSD stabilizes at roughly 8–10 Å, whereas the protein RMSD falls and varies within a smaller range (3–6 Å). This behavior implies that the complex experiences early protein–ligand rearrangement followed by persistence in a rearranged binding state rather than maintaining the original binding orientation. Thus, in the 2W3L system, Hyb.112 seems to adopt a less restricted and more flexible binding mode than Hyb.96.
In the 2YXJ context, the protein dynamic profiles are more moderate than those observed in the 2W3L systems. For the 2YXJ–Hyb.96 complex, the protein RMSD fluctuates within a relatively limited range of approximately 2.5–4.0 Å after the initial phase, indicating moderate structural stability of the protein framework. However, the ligand RMSD calculated after fitting the protein increases sharply and remains very high throughout the trajectory, indicating that the ligand does not preserve its initial docked orientation.
In the 2YXJ–Hyb.112 complex, the protein RMSD remains within a relatively moderate range throughout the simulation, generally around 2.5–4.0 Å, indicating limited structural rearrangement of the Bcl-XL framework. The ligand RMSD calculated after fitting the protein fluctuates within a more moderate interval, approximately 6–8 Å, after the initial phase of the trajectory. This behavior indicates that Hyb.112 does not fully preserve its initial docked orientation but also does not undergo the extensive positional displacement observed for Hyb.96 in the same protein model. Overall, the 2YXJ–Hyb.112 system is consistent with a retained but dynamically adaptable binding mode, in which the ligand remains associated with the binding region while sampling positional adjustments during the simulation.
The protein RMSD in the 4LVT–Hyb.96 complex shows modest rearrangement of the Bcl-2 framework and stays within a reasonably moderate range throughout the simulation, typically around 2.5–4.0 Å after the initial equilibration phase. After fitting the protein, the ligand RMSD changes mostly within 7.5–10 Å, indicating positional fluctuation with respect to the original docked pose but without the large displacement seen in the less stable systems. All of these findings point to a somewhat flexible binding mode in the 4LVT model and ongoing ligand association with the binding region.
The protein RMSD in the 4LVT–Hyb.112 complex exhibits a substantial increase in the early stages of the simulation, reaching values above 6 Å before declining after around 20 ns. For the remainder of the trajectory, it fluctuates within a smaller range of roughly 2–3 Å. This pattern points to a more stable dynamic state after the protein undergoes an initial conformational change. After fitting the protein, the ligand RMSD is computed and it also varies significantly over time. It starts out in a low range, rises to around 12–18 Å over the first half of the simulation, briefly drops at about 45–65 ns, and then rises once more to about 20–24 Å after about 70 ns. These alterations show that Hyb.112 undergoes significant positional rearrangements in relation to the protein rather than maintaining a single binding orientation throughout the trajectory. All things considered, the 4LVT–Hyb.112 system is consistent with a very flexible binding mode that is marked by numerous transitions between different ligand locations throughout the simulation.
Overall, the MD results show that instead of retaining a consistently conserved binding pose throughout all simulations, both Hyb.96 and Hyb.112 experience system-dependent positional rearrangements. In the target-specific models, Hyb.96 exhibited more moderate positional behavior in the 4LVT system, whereas Hyb.112 showed a more retained and dynamically adjustable profile in the 2YXJ system. In the 2W3L chimeric model, on the other hand, both ligands displayed more noticeable protein–ligand rearrangement, which led to a more cautious interpretation.
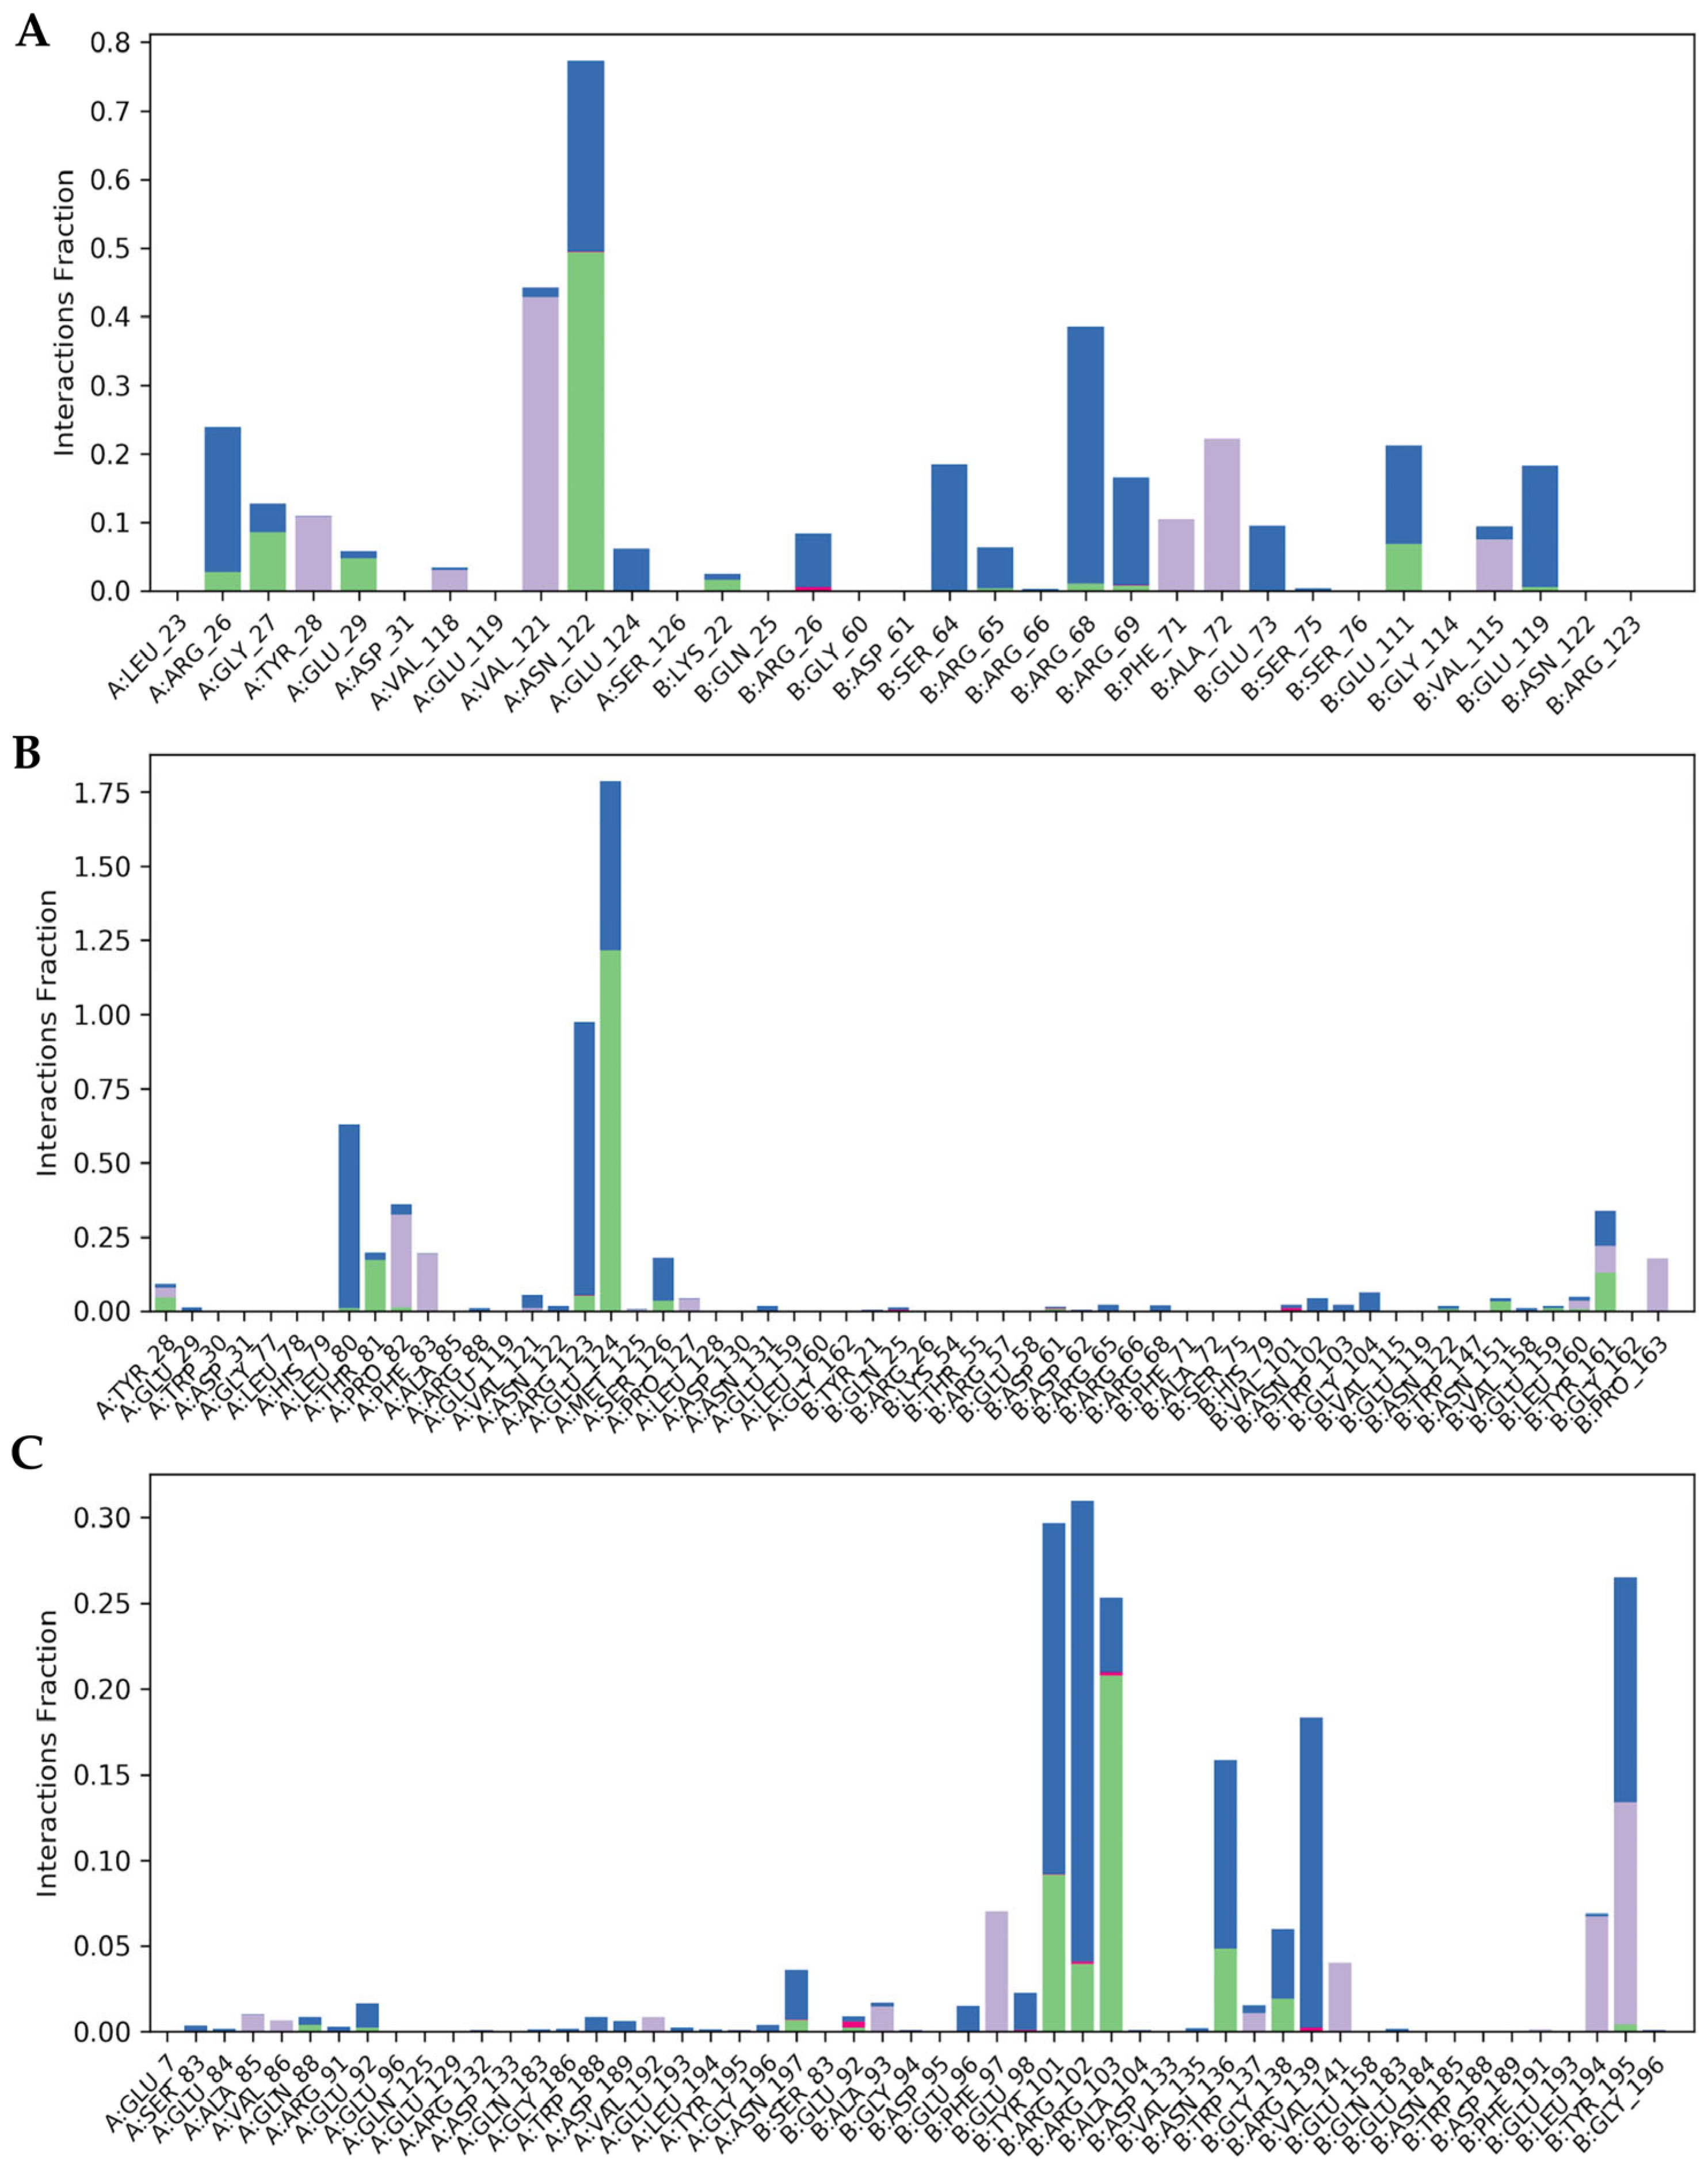
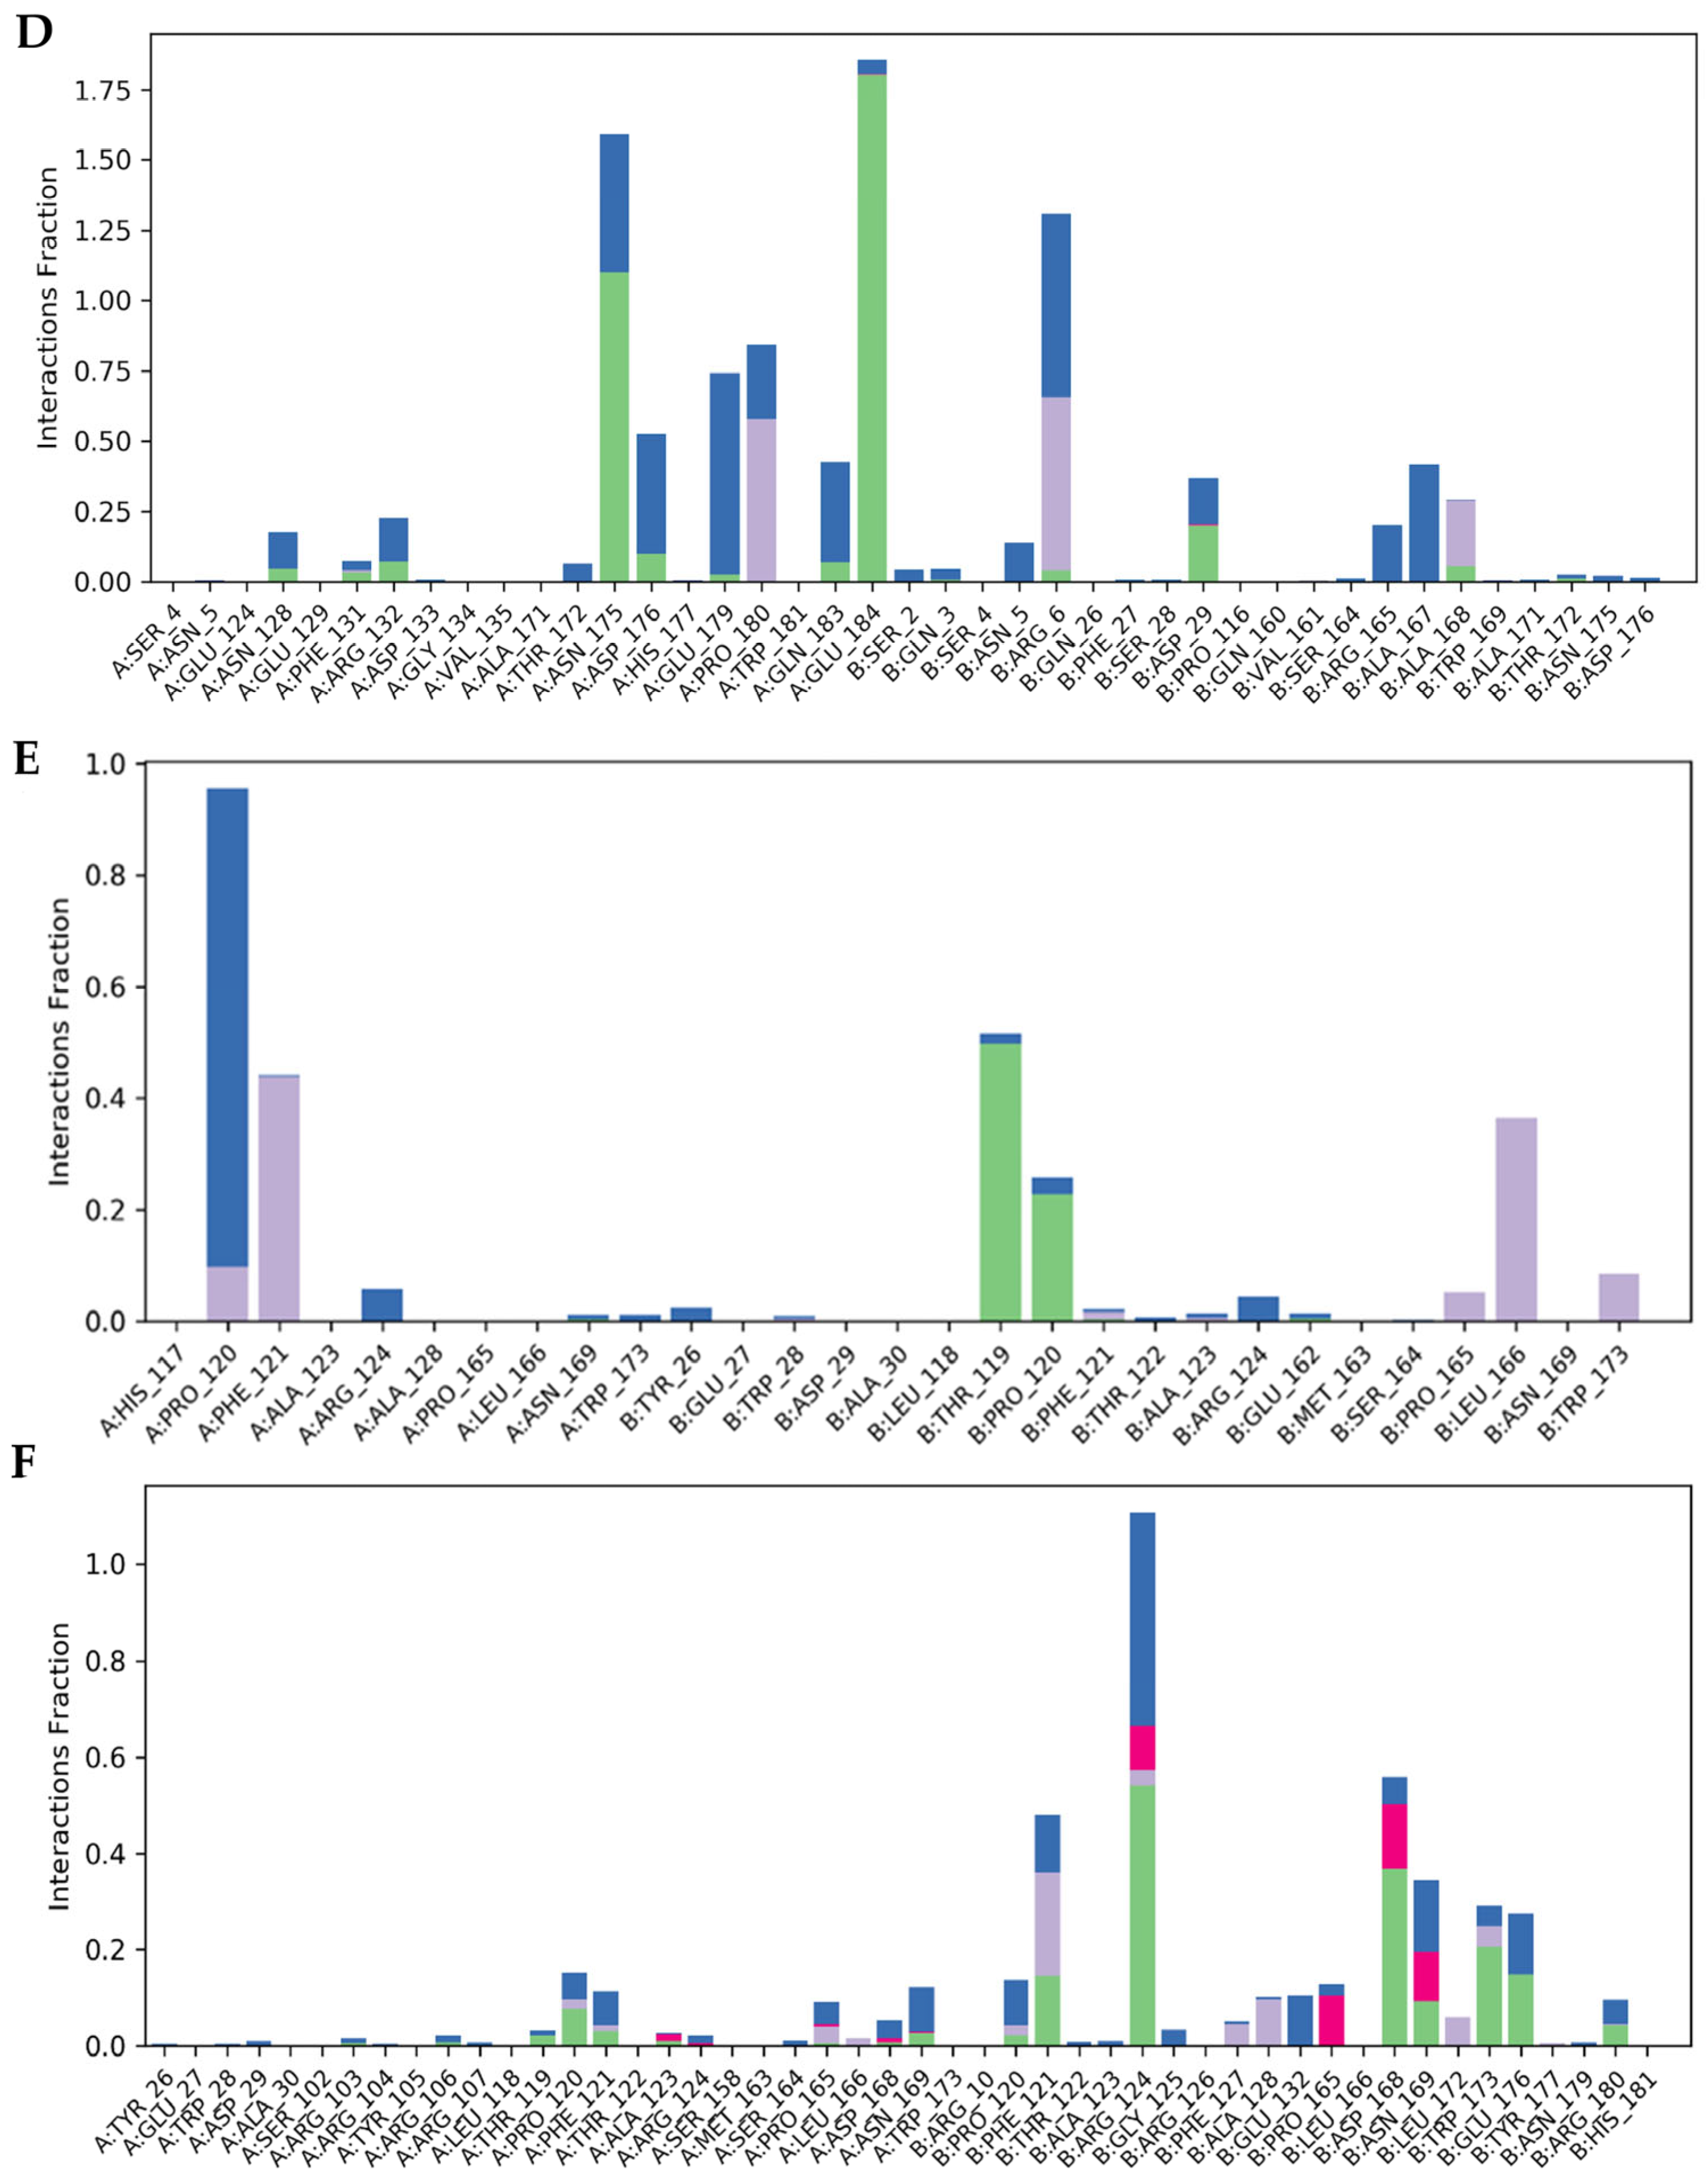
Figure 6 depicts residue interaction histograms that allow direct comparison of binding patterns across all six protein–ligand complexes. The ligand in the 2W3L–Hyb.96 complex (
Figure 6A) mostly interacts with the binding site through water bridges, hydrogen bonds and hydrophobic contacts. The largest interaction fractions are found in the 118–124 residue region, suggesting that Hyb.96 is bound to a specific area of the binding pocket. The high protein RMSD for this system may be attributed to a binding mechanism that allows limited flexibility while preserving persistent connections.
The 2W3L–Hyb.112 complex exhibits a more confined interaction pattern (
Figure 5B). Specifically, GLU124 is the most frequently contacted residue; other residues like PRO82, PHE83, and LEU80 also contribute but with reduced consistency. A greater frequency of solvent-mediated interactions implies a less restricted binding mechanism and enhanced ligand mobility.
The interaction profile for the 2YXJ–Hyb.96 complex (
Figure 6C) is thoroughly dispersed over several residues, with interactions being mostly hydrophobic and water-mediated. The residues TYR101, ARG102, ARG103, ASN136, ARG139, and TYR195 had the most consistent interactions with Hyb.96. These interactions, however, are more consistent with a constantly rearranged binding mode than with rigid retention of the initial docked orientation, given the RMSD behavior.
The 2YXJ–Hyb.112 complex shows a larger interaction network (
Figure 6D). A distributed and permanent contact network is supported by the most notable interaction hotspots, which are ASN175, ASN179, PRO180, GLU 184 and ARG6.
The interaction pattern of the 4LVT–Hyb.96 complex (
Figure 6E) is very confined, with PRO120, PHE121, THR119, and LEU166 being the most notable interactions. While PHE121 and LEU166 also contribute significant contact fractions, suggesting ongoing ligand association within a specific pocket region, water-mediated interactions involving PRO120 are particularly persistent.
The majority of residues in the 4LVT–Hyb.112 complex show interaction percentages between around 0.2 and 0.5, while fewer residues achieve values between 0.6 and 0.8, suggesting a dispersed interaction pattern (
Figure 6F). The dominating interactions are linked to ARG124, PHE121, ASP168, ASN169, and TRP173. This is consistent with a wider interaction network than that seen for Hyb.96 in the same system.
Overall, both ligands retain residue-level connections throughout the simulations, although the distribution of these interactions varies depending on the system. Hyb.112 typically displays a broader and more dynamic interaction network, which supports its higher conformational flexibility seen throughout the simulations. At the same time, Hyb.96 typically displays more confined interaction patterns in certain systems.
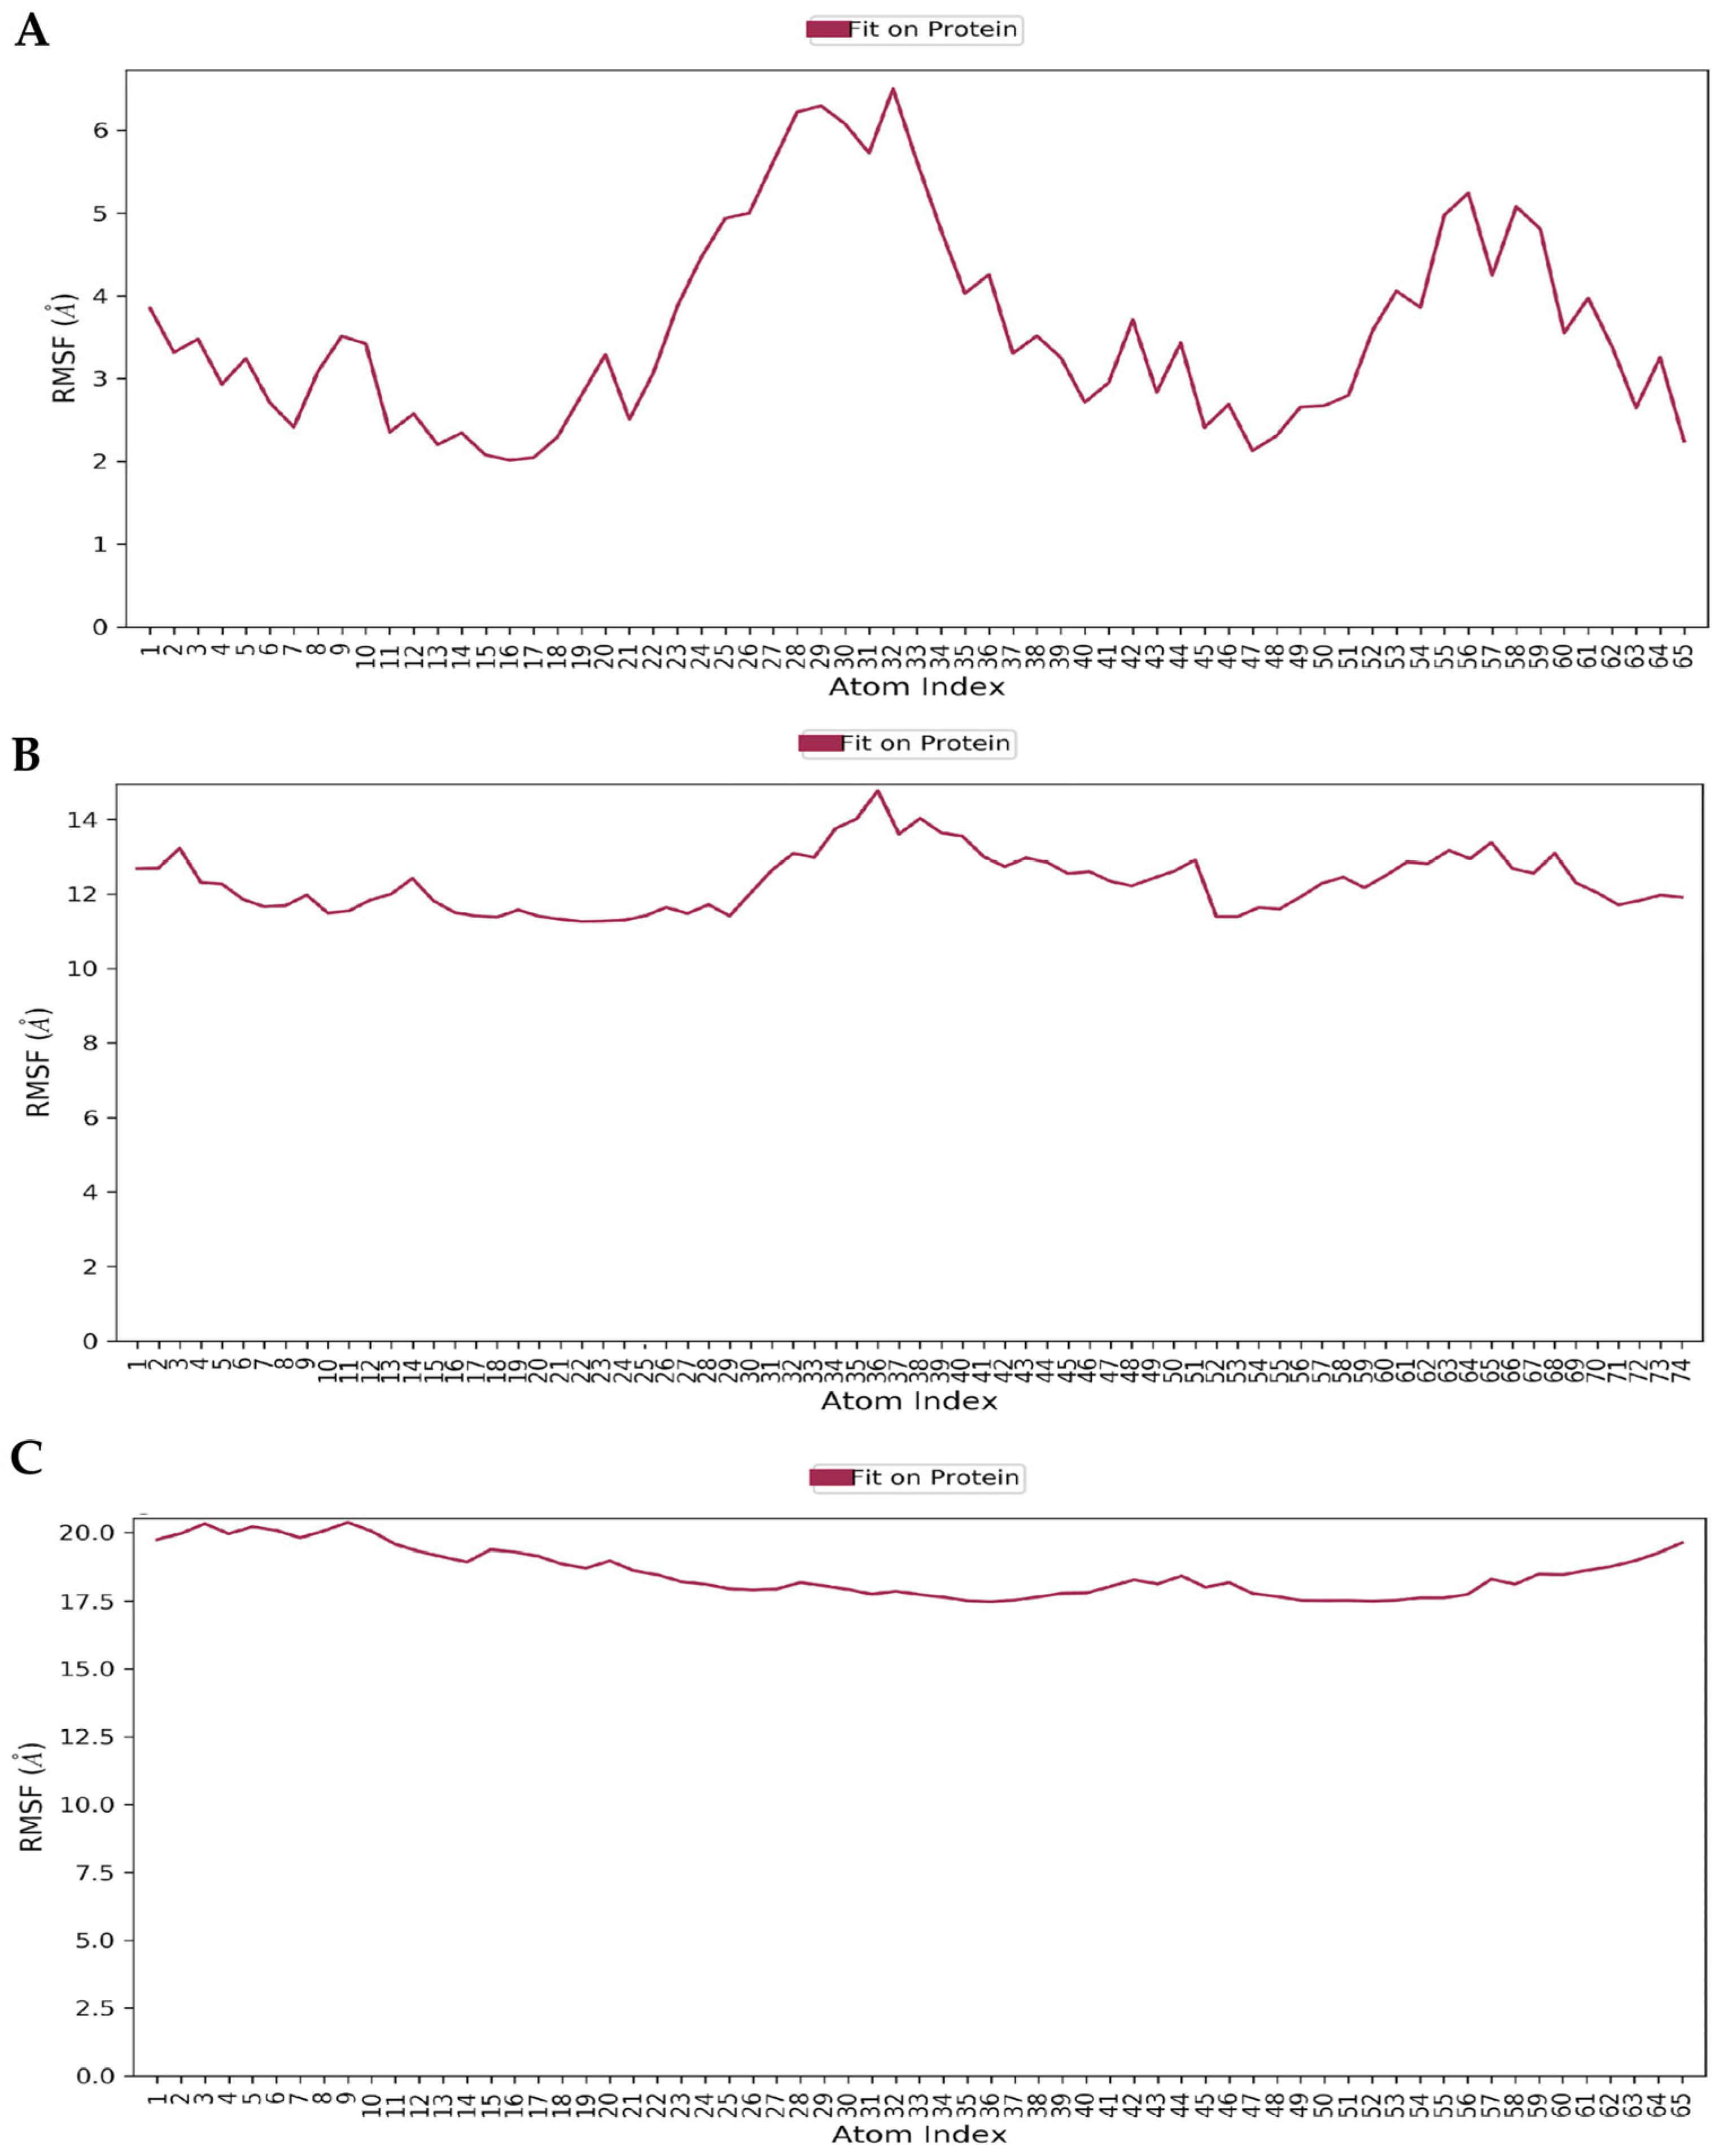
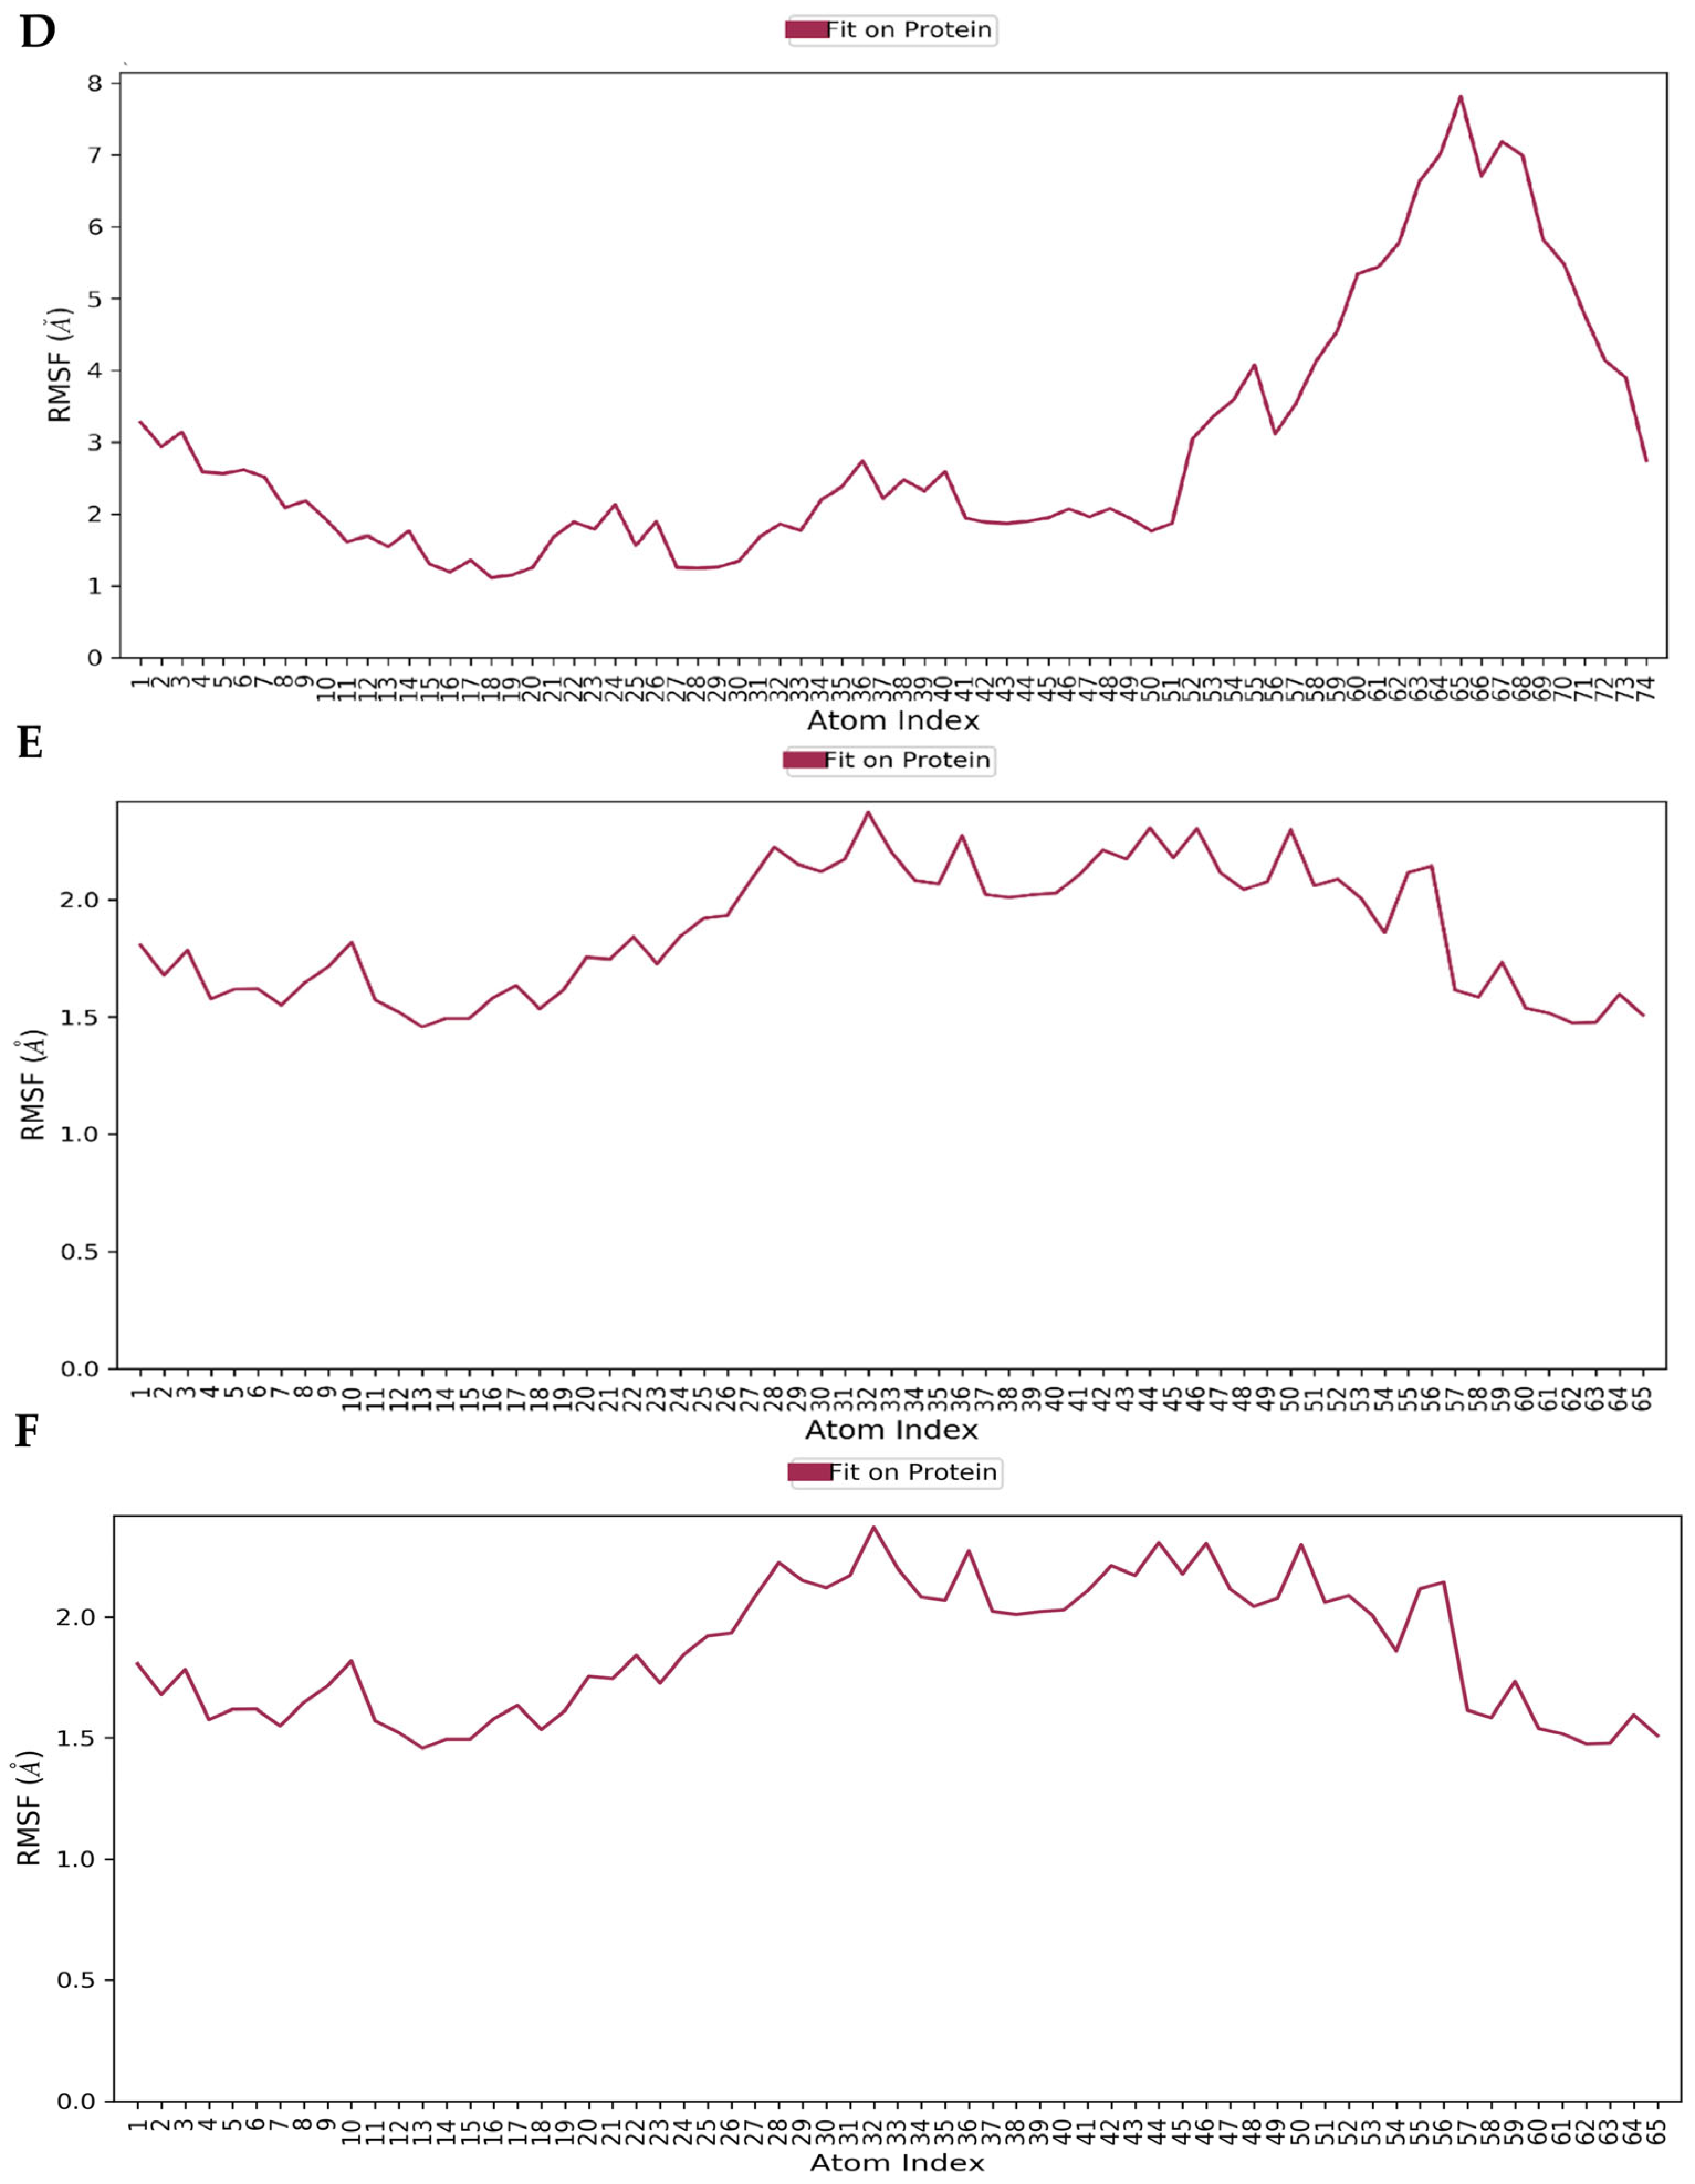
The ligand RMSF profiles (
Figure 7) describe the intramolecular flexibility of Hyb.96 and Hyb.112 in all three protein systems. The 2W3L–Hyb.96 complex (Panel A) has ligand atoms with RMSF values ranging from 2 to 4 Å, with a few peaks reaching 5–6 Å, indicating considerable flexibility without large-amplitude motions. In contrast, the 2W3L–Hyb.112 complex (Panel B) has significantly higher fluctuations, typically between 11 and 13 Å, with peaks approaching 14 Å, indicating improved intramolecular mobility and fewer positional restrictions inside the binding pocket. A similar pattern is seen in the 2YXJ system. RMSF values for 2YXJ–Hyb.96 (Panel C) range between 2 and 4 Å, with localized maxima around 5–6 Å, indicating moderate and spatially restricted flexibility. Hyb.112 (Panel D) exhibits a wider fluctuation interval of 6–10 Å, with peaks reaching 10–12 Å, indicating improved conformational flexibility across numerous ligand segments. In the 4LVT system, Hyb.96 (Panel E) has constant low RMSF values of 1.5–2.2 Å, with only modest increases for certain residues, indicating a well-restricted conformation. Hyb.112 (Panel F) exhibits high fluctuations, with numerous peaks reaching 9–11 Å, indicating higher intramolecular mobility and conformational flexibility inside the binding region.
Considering all of the above, Hyb.96 has overall lower RMSF values across all systems, indicating a less flexible and more structurally constrained ligand conformation than Hyb.112, whereas the latter shows higher intramolecular flexibility, allowing for more dynamic and adaptable conformational behavior. These RMSF differences represent internal ligand mobility and were evaluated alongside the RMSD analysis, which shows system-dependent conformational behaviour relative to the protein.
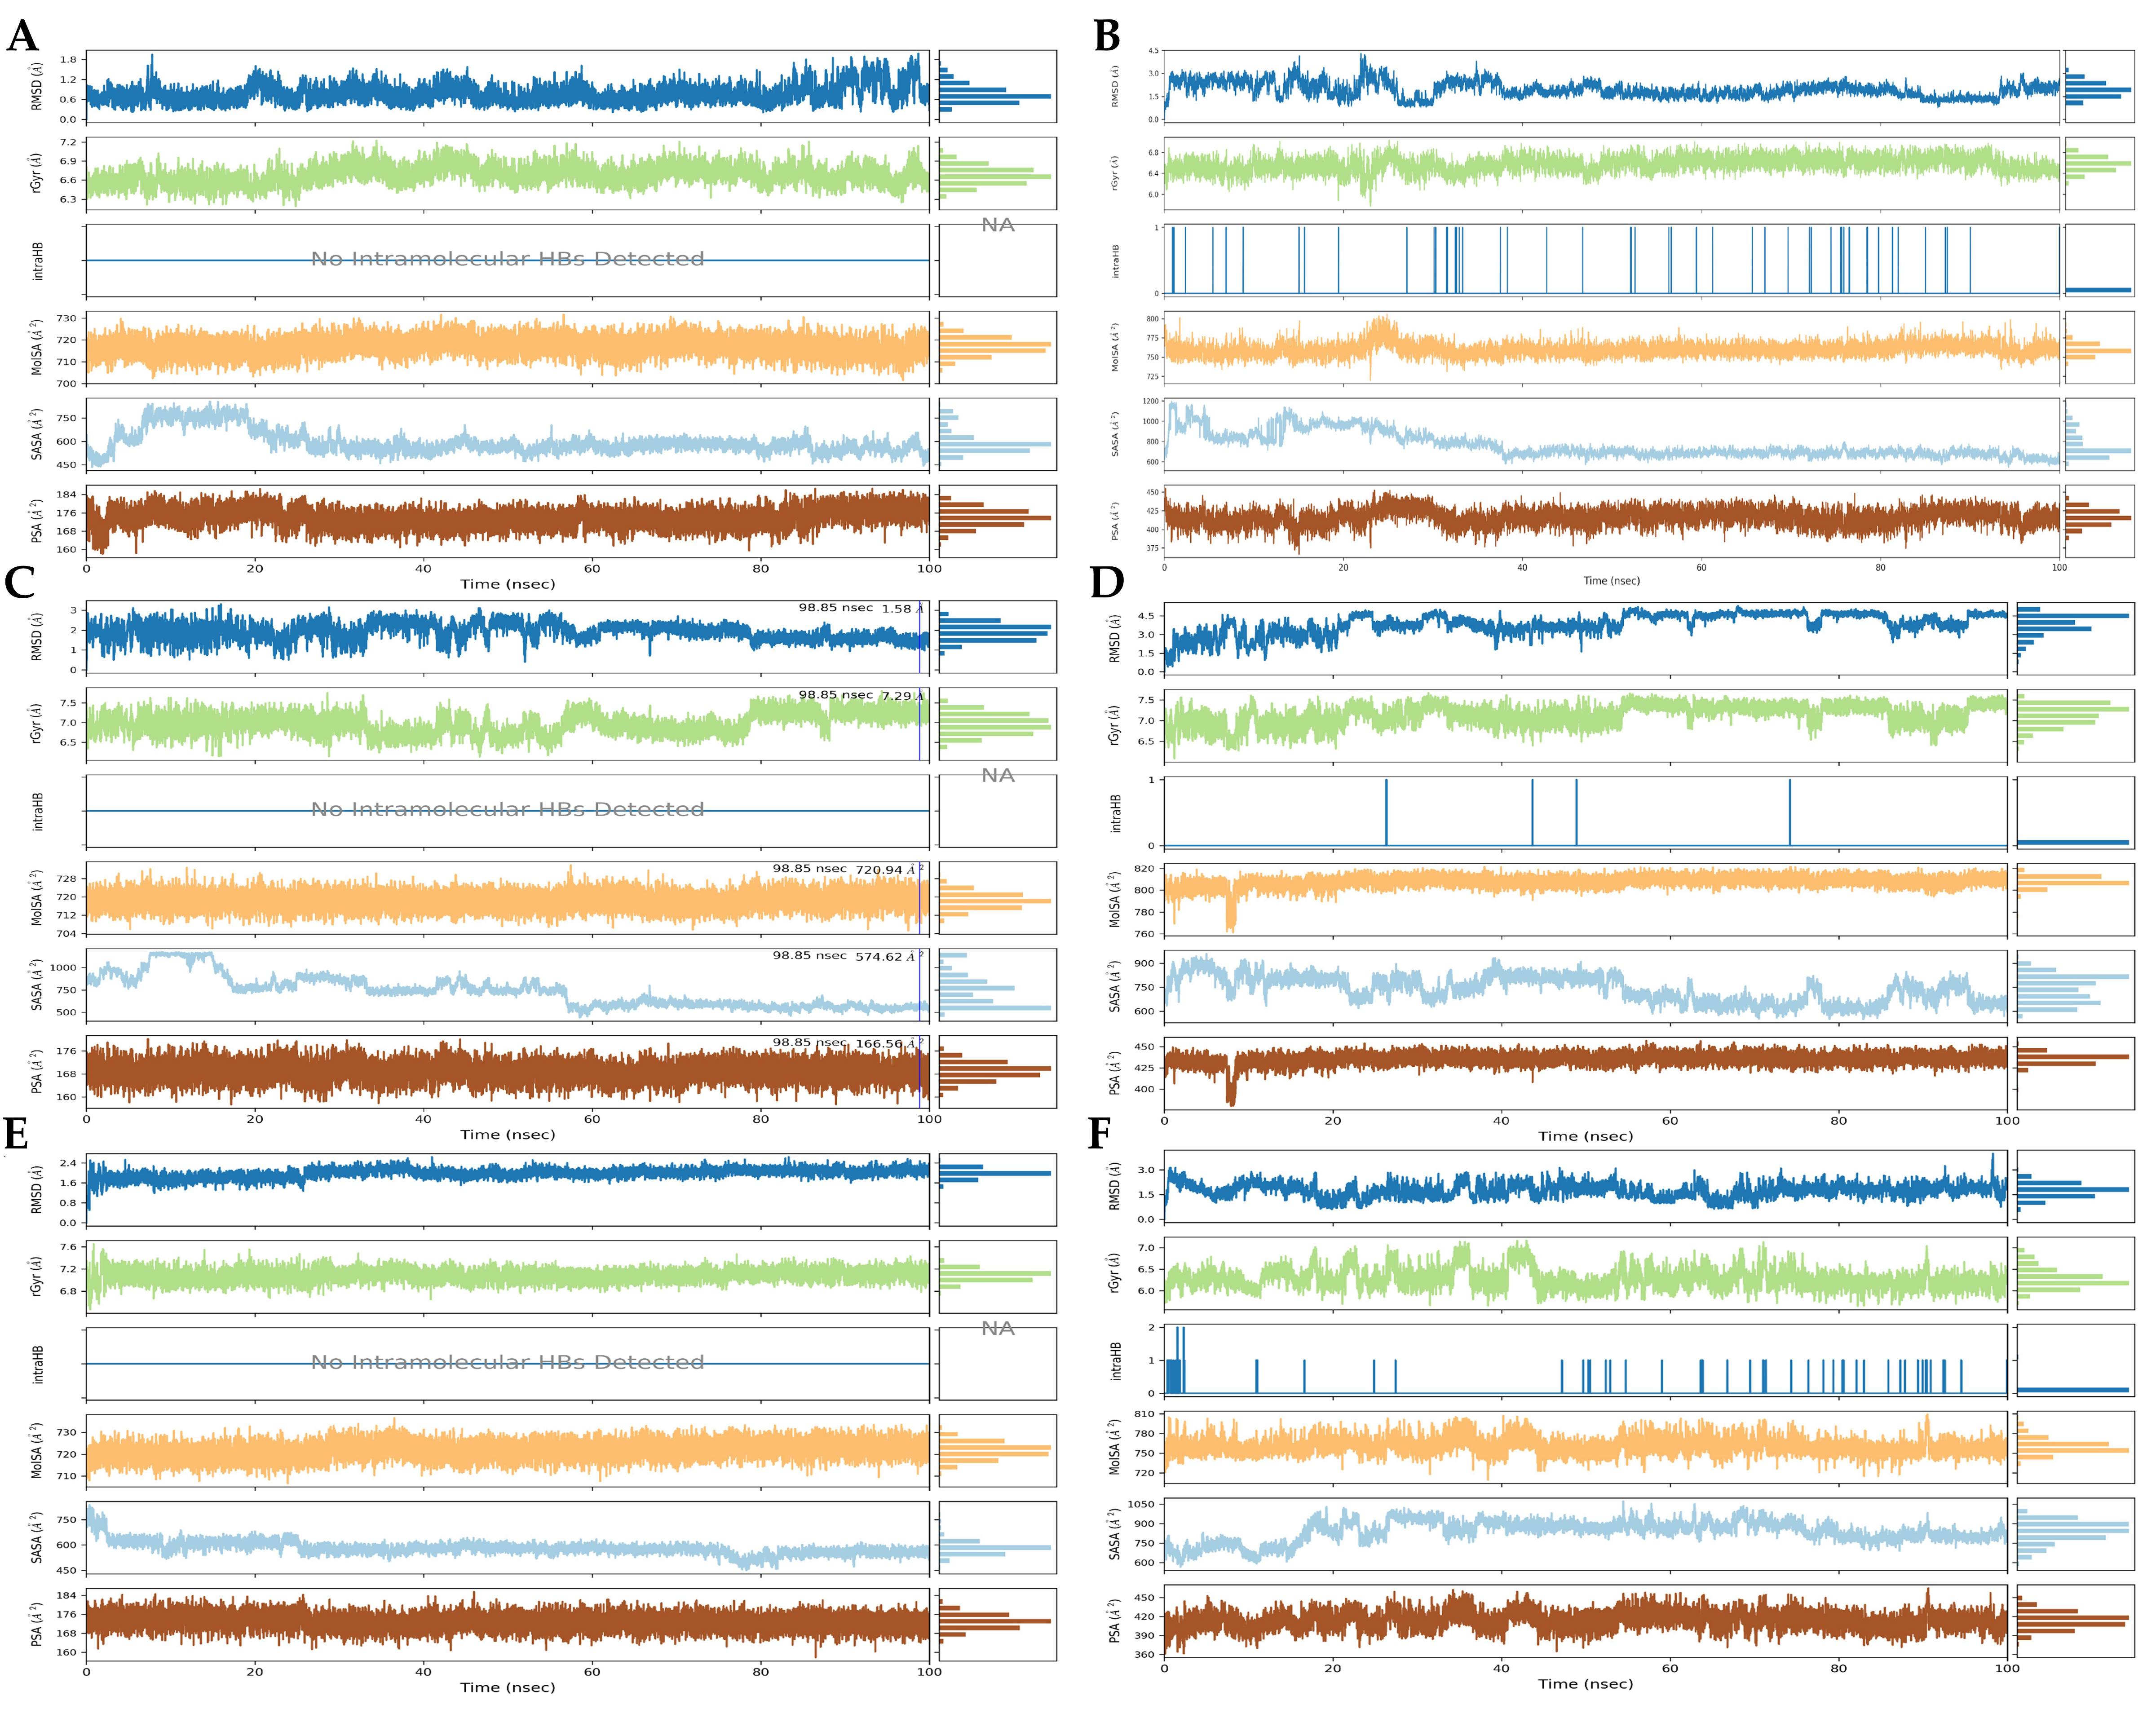
The ligand property profiles (
Figure 8) describe the evolution of Hyb.96 and Hyb.112 within the binding pockets across the three protein systems, integrating RMSD, radius of gyration, surface descriptors, and intramolecular hydrogen bonding to assess positional stability, compactness, and conformational variability.
In the 2W3L system, Hyb.96 (
Figure 8A) exhibits consistently narrow fluctuation ranges across all descriptors, with RMSD values of approximately 1.0–2.0 Å and radius of gyration values around 6.3–7.2 Å, indicating a relatively compact ligand conformation. Surface descriptors show minimal variation, and the absence of intramolecular hydrogen bonds suggests a structurally constrained ligand. In contrast, Hyb.112 (
Figure 8B) displays broader fluctuations, with RMSD values of approximately 1.5–3.5 Å and a wider radius of gyration range of 6.0–7.2 Å, indicating increased conformational variability. The presence of intermittent intramolecular hydrogen bonds and variable surface descriptors suggests dynamic structural rearrangements and changing solvent exposure.
A similar trend is observed in the 2YXJ system. Hyb.96 (
Figure 8C) maintains relatively narrow fluctuation ranges (RMSD 0.8–2.5 Å; Rg 6.5–7.5 Å) consistent with a generally compact ligand conformation. In contrast, Hyb.112 (
Figure 8D) exhibits moderate fluctuations (RMSD 0.5–4.5 Å; Rg 6.5–7.5 Å) with intermittent intramolecular hydrogen bonds and gradual variations in surface descriptors, indicating controlled conformational adaptability.
In the 4LVT system, Hyb.96 (
Figure 8E) again displays limited fluctuations (RMSD 1.5–2.3 Å; Rg 6.8–7.4 Å), with stable surface descriptors and no intramolecular hydrogen bonds, reflecting a constrained conformation. Conversely, Hyb.112 (
Figure 8F) shows broader variability (RMSD 0.7–3.0 Å; Rg 5.5–7.0 Å), accompanied by intermittent intramolecular hydrogen bonding and increased variation in surface descriptors, indicating enhanced conformational flexibility and dynamic solvent exposure.
Overall, these descriptors consistently indicate that Hyb.96 maintains a more compact and less variable conformation across all investigated systems, whereas Hyb.112 undergoes continuous structural adjustments, reflecting a more flexible and adaptable conformational profile.
The comparative assessment of the six hybrid–protein systems, summarized in
Table 5, indicates that both Hyb.96 and Hyb.112 display system-dependent dynamic behavior rather than a uniformly retained binding pose across all complexes. In the 2W3L system, both ligands undergo pronounced protein–ligand rearrangement, with Hyb.96 showing ligand RMSD values of approximately 10–14 Å and Hyb.112 stabilizing at approximately 8–10 Å after an initial transition phase. These trends suggest that neither ligand preserves its initial docked orientation in the chimeric model, although Hyb.112 appears to persist in a rearranged binding state after the early conformational adjustment.
In the 2YXJ and 4LVT systems, the dynamic behavior is more differentiated. In the 2YXJ model, Hyb.112 shows the more retained and dynamically adaptable profile, with ligand RMSD values of approximately 6–8 Å, whereas Hyb.96 undergoes extensive positional displacement relative to the protein. In the 4LVT model, the opposite trend is observed: Hyb.96 shows more moderate positional behavior, while Hyb.112 exhibits broader ligand rearrangements and transitions between multiple positions during the trajectory. Thus, the target-specific structures do not support a single global ranking of ligand stability but instead indicate that the dynamic behavior of each hybrid depends on the protein environment.
Both ligands continue to interact at the residue level throughout the simulations, although the distribution and durability of such interactions vary between systems. While Hyb.96 exhibits more confined interaction patterns in specific complexes, Hyb.112 often interacts through a larger and more dynamic network, including many residues. These results, along with the ligand property profiles, show that Hyb.112 exhibits greater conformational plasticity, whereas Hyb.96 tends to maintain a more compact ligand conformation.
3.3. MM-GBSA Binding Free Energy Analysis
Table 6 depicts the MM-GBSA binding free energy breakdown for the 2W3L–Hyb.96 and 2W3L–Hyb.112 complexes. It provides a quantitative overview of the energetic factors that affect ligand binding in the 2W3L binding pocket. In both systems, van der Waals contributions are the most important intermolecular contacts. The ΔVDWAALS values are −28.41 kcal/mol for Hyb.96 and −30.38 kcal/mol for Hyb.112. This means that the binding site has strong dispersion interactions and is densely packed with hydrophobic molecules.
A marked difference is observed in the electrostatic component, where Hyb.96 exhibits an almost neutral contribution (ΔEEL = −0.13 kcal/mol), whereas Hyb.112 shows a stronger electrostatic stabilization (ΔEEL = −22.21 kcal/mol). This aspect reflects increased involvement of charge-based interactions with residues in the binding pocket. However, the polar solvation term mostly cancels out this electrostatic contribution. This introduces a higher penalty for Hyb.112 (ΔEGB = +34.45 kcal/mol) compared to Hyb.96 (ΔEGB = +12.97 kcal/mol), reflecting the energetic cost associated with desolvation of polar groups upon complex formation.
The nonpolar solvation contribution (ΔESURF = −3.75 kcal/mol) for both ligands yields a similar stabilizing effect, aligning with the entrapment of hydrophobic surface area upon binding. The gas-phase interaction energy is much more favorable for Hyb.112 (ΔGGAS = −52.59 kcal/mol) than for Hyb.96 (ΔGGAS = −28.54 kcal/mol). This shows that intermolecular interactions are stronger when there are no solvent effects.
Still, the overall solvation free energy largely cancels out these gas-phase contributions. For example, Hyb.112 (ΔGSOLV = +30.67 kcal/mol) is much greater than that for Hyb.96 (ΔGSOLV = +9.22 kcal/mol). This balance between intermolecular interactions and solvation effects prevents Hyb.112 from having a net energy advantage.
Consequently, the total binding free energies of the two systems remains comparable. This indicates that although Hyb.112 forms stronger direct interactions within the binding pocket, its calculated binding free energy is influenced by higher desolvation penalties, resulting in a modest overall energetic outperformance of Hyb.96. These findings are consistent with the dynamic MD behavior of Hyb.112, where it showed increased conformational variability, while Hyb.96 maintained a more constrained binding mode.
The MM-GBSA binding free energy breakdown for the 2YXJ–Hyb.96 and 2YXJ–Hyb.112 complexes is provided in
Table 7. A marked difference is observed in the estimated binding free energy of the two ligands, reflected by the total binding free energy values of −4.95 kcal/mol for Hyb.96 and −29.81 kcal/mol for Hyb.112.
The 2YXJ–Hyb.96 complex is characterized by modest stabilization, as indicated by the overall binding free energy. The favorable contributions come from van der Waals interactions (ΔVDWAALS = −6.73 kcal/mol) and electrostatic interactions (ΔEEL = −2.67 kcal/mol), reflecting limited intermolecular contacts within the binding pocket. These interactions are partially offset by the polar solvation term (ΔEGB = +5.37 kcal/mol) and the total solvation free energy (ΔGSOLV = +4.45 kcal/mol). These terms introduce desolvation penalties that reduce the estimated binding free energy. In addition, the large standard errors associated with ΔGGAS and ΔTOTAL suggest sensitivity to conformational sampling, indicating variability in the energetic profile of this system.
The 2YXJ–Hyb.112 complex exhibits a more favorable binding free energy, with a ΔTOTAL value of −29.81 kcal/mol. This difference primarily stems from a dominant van der Waals contribution (ΔVDWAALS = −55.54 kcal/mol) and a significant electrostatic component (ΔEEL = −19.52 kcal/mol). These contributions result in a strongly favorable gas-phase interaction energy (ΔGGAS = −75.07 kcal/mol), substantially larger in magnitude than that observed for Hyb.96.
However, this gas-phase stabilization is accompanied by a significant polar solvation penalty (ΔEGB = +52.81 kcal/mol) and a large total solvation contribution (ΔGSOLV = +45.26 kcal/mol), reflecting the binding energetic cost associated with desolvation of polar and charged groups.
The MM-GBSA binding free energy decomposition for both 4LVT complexes is depicted in
Table 8. The total binding free energy values are very similar for the two systems, with −31.08 kcal/mol and −31.82 kcal/mol for Hyb.96 and Hyb.112, respectively, indicating comparable predicted energetic stabilization.
For the 4LVT–Hyb.96 complex, van der Waals interactions (ΔVDWAALS = −41.35 kcal/mol) induce stabilization, reflecting efficient hydrophobic packing within the binding site. Electrostatic interactions also contribute to binding (ΔEEL = −6.42 kcal/mol), although to a lesser extent. The resulting gas-phase interaction energy (ΔGGAS = −47.77 kcal/mol) indicates favorable intermolecular contacts between the ligand and the protein.
In the 4LVT–Hyb.112 complex, both van der Waals (ΔVDWAALS = −48.27 kcal/mol) and electrostatic contributions (ΔEEL = −14.63 kcal/mol) are more pronounced, leading to a more favorable gas-phase interaction energy (ΔGGAS = −62.90 kcal/mol). These values indicate that Hyb.112 outperforms Hyb.96 in terms of direct intermolecular interactions and more extensive contact formation within the binding pocket.
However, the increased interaction strength in the Hyb.112 complex is accompanied by a substantially larger polar solvation penalty (ΔEGB = +37.12 kcal/mol) and a higher total solvation contribution (ΔGSOLV = +31.08 kcal/mol), compared to +21.87 kcal/mol and +16.69 kcal/mol for Hyb.96, respectively.
The combined structural, dynamical, and energetic analyses reveal that binding behaviors for Hyb.96 and Hyb.112 against the three protein targets differed. The MM-GBSA results showed that binding free energies varied depending on the protein model, with values ranging from −4.95 to −31.82 kcal/mol. This variation was most evident in the case of Hyb.96, which showed modest stabilization in the 2YXJ protein (ΔTOTAL = −4.95 kcal/mol) but clearly more favorable binding in the 4LVT target (ΔTOTAL = −31.08 kcal/mol). This difference is consistent with Hyb.96’s behaviour during MD analysis, where marked conformational displacement occurred in the 2YXJ model, whereas in the 4LVT system its behaviour was more moderate. In contrast, Hyb.112 showed more favorable MM-GBSA values across all three protein targets, particularly in 2YXJ (ΔTOTAL = −29.81 kcal/mol) and 4LVT (ΔTOTAL = −31.82 kcal/mol). Nevertheless, these values were accompanied by large polar solvation penalties, especially in the 2YXJ complex. The presented results show that the predicted binding energy values are influenced by the specific protein environment and by the balance between favorable van der Waals/electrostatic interactions and opposing solvation contributions. Therefore, the MM-GBSA values should be interpreted as comparative energetic estimates rather than absolute measures of binding affinity.
Beyond the computational results obtained in the present study, the hybrid design of Hyb.96 and Hyb.112 is supported by previous reports describing betulinic acid- or lupane-type triterpenoid hybrids with other natural-product fragments.
A particularly relevant example is represented by betulinic acid–brosimine B hybrids, in which BA was conjugated with a natural polyphenolic/flavonoid-type moiety. These hybrids were investigated as anticancer candidates [
49], and a related BA–brosimine B hybrid later showed cytotoxic activity in imatinib-sensitive and imatinib-resistant chronic myeloid leukemia cells, inducing intrinsic apoptosis through caspase-3/caspase-9 activation [
50]. This provides a useful precedent for the BA–Proanthocyanidin B2 hybrid evaluated here because both designs combine BA with a polyphenolic natural-product fragment. In addition, lupane–coumarin conjugates, such as betulin esters with coumarin-3-carboxylic acid [
51], and other triterpene–coumarin conjugates have been reported, supporting the broader feasibility of linking pentacyclic triterpenoid scaffolds to aromatic/phenolic bioactive fragments [
52].
For the BA–Celastrol hybrid, direct experimental evidence for a covalent BA–celastrol derivative appears limited; however, BA and celastrol have been investigated in combination and co-delivery systems, where celastrol was reported to sensitize tumor-associated stromal components and enhance the anticancer efficacy of BA [
53]. Taken together, these studies do not demonstrate direct Bcl-2/Bcl-xL inhibition by the specific hybrids evaluated in the present work, but they support the medicinal-chemistry rationale for exploring BA-based hybrids with polyphenolic or triterpenoid fragments as apoptosis-oriented anticancer candidates. It should also be noted that MM-GBSA calculations have intrinsic methodological limitations. The method provides an approximate post-processing estimate of binding free energy and does not fully account for conformational entropy, receptor flexibility, explicit solvent effects, or the complete range of ligand-binding states sampled during molecular dynamics simulations. In addition, the results may depend on the selected trajectory snapshots and on the conformational state of the protein–ligand complex. For this reason, the MM-GBSA values reported here were used to support comparative prioritization of the selected hybrids rather than to provide definitive quantitative binding free energy estimates.



 ,
,