Article

Study on Wellbore Pressure Distribution Characteristics in Double-Wall Drill Pipe Reverse Circulation Drilling

1
College of Petroleum Engineering, China University of Petroleum, Beijing 102249, China
2
Petroleum Institute, China University of Petroleum at Karamay, Karamay 834000, China
*
Author to whom correspondence should be addressed.
Processes 2026, 14(11), 1695; https://doi.org/10.3390/pr14111695
Submission received: 12 April 2026 / Revised: 15 May 2026 / Accepted: 20 May 2026 / Published: 24 May 2026
(This article belongs to the Section Petroleum and Low-Carbon Energy Process Engineering)

Abstract

Double-wall drill pipe reverse circulation drilling is expected to alleviate cutting-transport difficulties and the high risk of lost circulation during the shallow-section drilling of ultra-deep wells. Based on wellbore hydraulics theory and a transient solid–liquid two-phase flow model in the wellbore, considering the flow path transition effect at the reverse circulation converter near the bit, a corrected pressure loss method for the inner pipe accounting for cuttings influence is proposed, and a correlation for calculating the converter pressure loss is derived. A wellbore pressure calculation model for reverse circulation drilling using a double-wall drill pipe is then established. Furthermore, the influencing factors are investigated through sensitivity analysis, and a pump pressure selection chart is developed. Field-case calculations indicate that, under identical operating conditions, the bottomhole pressure in double-wall drill pipe reverse circulation drilling is reduced by approximately 6.31 MPa compared with conventional drilling. For shallow sections (well depth of about 1200 m) under flow rates of 20–40 L/s and drilling-fluid densities of 1200–1400 kg/m3, the maximum total circulating wellbore pressure loss, after incorporating surface flowline pressure losses, is approximately 10.91 MPa. In this case, a single pump can satisfy the circulation requirement, demonstrating the advantages of simplified equipment configuration and improved field adaptability for shallow-section operations. The proposed model and charts can provide a reference for parameter optimization and pressure-control design in double-wall drill pipe reverse circulation drilling.

1. Introduction

According to the latest data from the National Energy Administration, the newly added proven reserves of crude oil and natural gas in 2024 reached 1.3 billion tons and 1.5 trillion cubic meters, respectively. During the same period, the oil and gas equivalent production surpassed 400 million tons for the first time, comprising 213 million tons of crude oil and 246.4 billion cubic meters of natural gas [1,2]. Among the newly added reserves, deep and ultra-deep oil and gas resources contributed to over 50%. For instance, the Huizhou 19-6 deep and ultra-deep oilfield alone added over 100 million tons of oil equivalent. In terms of production growth, deep and ultra-deep resources accounted for approximately 20% to 30%, with the proportion of ultra-deep production in the Tarim Basin exceeding 40%. Furthermore, a total of 1467 onshore deep and ultra-deep oil and gas fields have been discovered globally to date, including 169 large and medium-sized fields. These deep and ultra-deep reserves are primarily distributed in the Americas, the Middle East, and the Asia–Pacific region, accounting for 34.81%, 26.80%, and 24.95% of the total globally discovered oil and gas reserves, respectively [3]. The aforementioned data indicate that deep and ultra-deep oil and gas resources are abundant and possess immense potential, making them a crucial strategic replacement domain for oil and gas development in China [4]. However, as drilling depth increases, the geological environments and engineering conditions become increasingly severe, leading to a series of technical challenges during the drilling process.
In ultra-deep wells, the large size of the surface hole results in a low annular return velocity during the drilling process. Compounded by the predominantly unconsolidated nature of the surface formations, drill cuttings settle at an accelerated rate due to gravity, making cutting transport highly difficult. Consequently, the cuttings are repeatedly crushed, leading to severe damage to the drill bit cutters, a low rate of penetration (ROP), short footage per bit, a high risk of pipe sticking, and prolonged drilling cycles. Furthermore, as ultra-deep formations have undergone long-term high-temperature and high-pressure (HTHP) metamorphism, drilling operations frequently encounter strata with well-developed fractures and caverns, posing a high risk of lost circulation. Severe lost circulation can make it impossible to establish fluid circulation. Treating these fluid loss events not only consumes a significant amount of time but, in extreme cases, can even lead to wellbore abandonment [5]. According to statistical data, from 2019 to 2020, the non-productive time (NPT) caused by lost circulation accounted for two-thirds of the total NPT attributed to drilling complications in the domestic drilling operations of China National Petroleum Corporation (CNPC), making it one of the primary factors contributing to drilling complications [6]. For formations with a narrow safe density window encountered during the development of deep shale gas, controlling wellbore pressure is exceedingly challenging. This makes the drilling operations highly susceptible to downhole complications such as kicks, lost circulation, and wellbore instability [7].
The aforementioned challenges severely constrain the efficient development of deep and ultra-deep oil and gas resources. By virtue of its inherent technical merits, double-wall drill pipe reverse circulation drilling can effectively mitigate or even circumvent these difficulties. Compared to conventional forward circulation drilling, double-wall drill pipe reverse circulation drilling exhibits significant advantages, including highly efficient cutting transport, the redistribution of formation-exposed annular pressure loss, the reduction in bottomhole pressure, and the mitigation of lost circulation and wellbore collapse. Furthermore, due to the relatively small cross-sectional area of the inner pipe, the strong shear force generated by the high-velocity drilling fluid can effectively suspend and rapidly transport large-sized cuttings, thereby minimizing cutting deposition and ensuring optimal hole cleaning. Additionally, this technology is highly conducive to penetrating complex formations. It enables a closed-loop circulation of the drilling fluid—meaning that the fluid completes its circulation entirely within the double-wall drill pipe. This mechanism prevents direct contact between the fluid and the formation, thereby effectively reducing the risk of lost circulation.
In recent years, double-wall drill pipe (DWDP) reverse circulation drilling has gained significant attention as an effective technology for improving cutting transport and managing downhole pressures. Numerous scholars have conducted extensive research on the tools and processes involved in this technology. The first group of studies focuses on the structural design and operational feasibility of DWDP systems. Liu et al. [8] and Yang et al. [9] provided comprehensive overviews of DWDP tools and their technical merits, demonstrating their potential over conventional methods. Specialized processes, such as gas-lift and aerated reverse circulation, have also been developed [10,11] and dynamically simulated under managed pressure drilling (MPD) schemes [12], with some variations validated through field trials [13,14]. However, while these studies confirm the technical feasibility of DWDP, they primarily provide qualitative assessments or preliminary adaptations, often lacking a precise characterization of the complex hydraulics within the unique DWDP flow path incorporating the specialized structure of the bottomhole reverse circulation converter.
A second group of studies addresses the mechanisms of flow field and cutting transport using numerical and analytical methods. Wu et al. [15] and Kong et al. [16] investigated the velocity and pressure characteristics within the DWDP annulus and converter, identifying flow rate and diameter variations as critical factors for pressure loss. Considering the complex dynamics of the drillstring, Liu et al. [17] utilized numerical simulations to explore how drillstring rotation and lateral vibration induce secondary vortices and pressure fluctuations in the annulus. To achieve more refined predictions, scholars have increasingly adopted multi-phase flow models. The Euler–Euler approach has been widely used to simulate cutting transport in reverse circulation bits and tool joints [18,19], while the Euler–Lagrange approach and Discrete Element Method (DEM) have been employed to characterize refined fluid–particle interactions and the influence of rock heterogeneity [20,21]. Furthermore, extending beyond pure hydraulics, Zhang et al. [22] developed a transient heat transfer model for dual-channel drill pipes to evaluate thermal interactions and fluid mass flow variations at the valves. Notably, Huang et al. [23] and Zhang et al. [24] utilized DEM to highlight the mechanical behavior of discontinuous media and the interaction between fractures and particle assembly, providing a theoretical foundation for multiscale numerical modeling.
Despite these advancements, a critical research gap remains. Most of the existing literature focuses on cutting transport in the wider annulus of conventional drilling or the local flow field near the bit. In DWDP reverse circulation, the fluid carrying high concentrations of cuttings must flow upward through a relatively small cross-sectional area of the inner pipe. The dynamic coupling between the high cutting concentration and the circulating pressure drop in this confined space remains insufficiently investigated. Furthermore, most transient models [25,26,27] do not fully account for the pressure loss singularities caused by the flow path transition at the bottomhole reverse circulation converter.
To address these limitations, this study proposes a comprehensive wellbore pressure calculation model specifically for DWDP reverse circulation. Based on wellbore hydraulics theory and a transient solid–liquid two-phase flow formulation, the model utilizes a solid–liquid two-phase pressure loss formula and accounts for the flow path transition at the bottomhole reverse circulation converter. Case studies and sensitivity analyses using the comparative variation coefficient (Cr) are conducted to identify primary controlling factors. This work aims to provide a high-precision theoretical reference for drilling pump pressure selection and operational safety in DWDP engineering applications.

2. Calculation Model for Wellbore Pressure in Double-Wall Drill Pipe Reverse Circulation Drilling

2.1. Operational Process and Flow Mechanism

The technical equipment for double-wall drill pipe reverse circulation drilling primarily consists of a top drive adapter, a rotating control device (RCD), conventional double-wall drill pipes, a reverse circulation converter, a bottomhole assembly (BHA), and PDC bits. The conventional double-wall drill pipe features a dual-concentric tube structure. In this configuration, the passive drilling fluid within the wellbore annulus remains stationary and does not participate in the circulation. Instead, the active drilling fluid is transported to the bottom of the hole through the annular space between the inner and outer tubes of the double-wall drill pipe, while the inner tube serves as the discharge channel for the cutting-laden fluid, as illustrated in Figure 1. Specifically, the drilling fluid is pumped from the wellhead into the system via a high-pressure manifold. It is injected into the annulus of the double-wall drill pipe and travels downward to the bottomhole reverse circulation converter, where it enters the BHA. Subsequently, the fluid is discharged through the drill bit nozzles into the wellbore annulus, entrains the drill cuttings, and flows upward to the converter. At this point, the mixture enters the inner tube of the double-wall drill pipe and finally returns to the wellhead.
The reverse circulation converter performs multiple functions in the double-wall drill pipe reverse circulation drilling process, including flow diversion, cutting transport, and pressure control. Based on its operating principle, the fluid domain within the converter can be divided into two stages. The first-stage fluid domain refers to the path where the drilling fluid flows from the annulus between the inner and outer pipes of the double-wall drill pipe and is delivered to the bottom of the hole via the converter. The second-stage fluid domain involves the cutting-laden drilling fluid entering the inner pipe from the wellbore annulus through the nozzles of the converter, and subsequently being transported to the surface. In this study, the first-stage fluid domain is defined as the inner annulus, while the second-stage fluid domain is defined as the outer annulus. The overall cross-sectional structure of the physical model for the reverse circulation converter is illustrated in Figure 1.
The circulation system of double-wall drill pipe reverse circulation drilling differs significantly from conventional drilling processes by employing a dual-fluid system, where the bottomhole reverse circulation converter serves as the physical boundary between the two fluids. Within this framework, the passive drilling fluid, which remains static in the annulus above the converter, is utilized to maintain wellbore stability and typically consists of a KCl–polymer system. Its density is typically selected based on the formation pore pressure and collapse pressure to provide sufficient hydrostatic support. In contrast, the active drilling fluid, which circulates through the inner pipe and the region below the converter, can utilize a lower-density clear water or bentonite slurry system. The density of the active drilling fluid can be selected to be lower than that of the passive fluid. This separation prevents the high-velocity circulating fluid from directly scouring the formation, effectively mitigating the risk of lost circulation while allowing for independent optimization of both stability and drilling efficiency.

2.2. Mathematical Model

Aiming at the operational process of double-wall drill pipe reverse circulation drilling, a wellbore pressure calculation model is established based on the theoretical framework of wellbore hydraulics, accounting for the flow path transition at the bottomhole reverse circulation converter. In this study, the circulation process of the drilling fluid within the wellbore is divided into two core stages: the downward injection stage and the upward return stage.
The annulus of the double-wall drill pipe serves as the injection channel for the drilling fluid. The pressure within this annulus is composed of the drilling pump pressure, the wellbore pressure loss within the double-wall drill pipe annulus, and the hydrostatic pressure of the drilling fluid. The calculation formula for the double-wall drill pipe annular pressure is expressed as follows:
p a = p p Δ p a + ρ m g h cos θ
where Pp is the drilling pump pressure, MPa; Δ P a is the wellbore pressure loss in the double-wall drill pipe annulus, MPa; ρm is the drilling fluid density, kg/m3; θ is the inclination angle, °.
The inner pipe of the double-wall drill pipe serves as the return channel for the drilling fluid, drill cuttings, and formation fluids. The pressure within this channel is composed of the standpipe pressure, the wellbore pressure loss in the double-wall drill pipe inner pipe, the pressure loss of the fluid exiting the converter, and the hydrostatic pressure of the drilling fluid. Furthermore, the pressure within the inner pipe of the bottomhole assembly (BHA) below the converter also accounts for the pressure loss of the fluid entering the converter and the pressure drop across the drill bit. The calculation formulas for the inner pipe pressure are expressed as follows:
p t = p s + Δ p p + ρ m g h cos θ Δ p o u t                             h < H p t = p s + Δ p b + ρ m g h cos θ Δ p s Δ p i n Δ p o u t           h H
where Ps is the standpipe pressure, MPa; Δ P p is the wellbore pressure loss in the inner pipe of the double-wall drill pipe, MPa; Δ P b is the wellbore pressure loss in the inner pipe of the bottomhole assembly (BHA), MPa; Δ P i n is the pressure loss of the fluid entering the converter, MPa; Δ P o u t is the pressure loss of the fluid exiting the converter, MPa; Δ P s is the pressure drop across the drill bit, MPa; H is the vertical depth of the reverse circulation converter, m.
The drilling fluid entrains the drill cuttings and flows upward through the wellbore annulus between the bottomhole assembly (BHA) and the wellbore wall to the downhole converter. The calculation formula for the wellbore annular pressure is expressed as follows:
p w = ρ m g h m sin θ + ρ s g h s sin θ + Δ p w
where ρs is the solid (cutting) density, kg/m3; Δ P w is the wellbore pressure loss in the wellbore annulus, MPa.
The bottomhole pressure (BHP) is composed of the standpipe pressure, the total circulation pressure loss of the drilling fluid, the pressure loss within the bottomhole assembly (BHA), and the hydrostatic pressure of the drilling fluid. The calculation formula for the BHP is expressed as follows:
p b = p s + Δ p e + ρ m g h cos θ Δ p s + Δ p i n Δ p o u t
where Δ P e is the total circulation pressure loss of the drilling fluid, MPa.
In this study, the Bingham plastic model is employed to characterize the non-linear rheological behavior of the drilling fluid [28]. The selection of this model is based on its balance between computational efficiency and accuracy. In wellbore hydraulic calculations, the Bingham model is structurally straightforward and its parameters are easily obtained from field measurements. Furthermore, it provides sufficient predictive accuracy under the high-velocity flow conditions typical of the inner pipe in reverse circulation drilling. Based on the aforementioned breakdown and analysis of the wellbore pressure during the double-wall drill pipe reverse circulation drilling process, the pressure loss for each component is calculated individually. Both the double-wall drill pipe annular flow domain and the bottomhole assembly (BHA) inner pipe flow domain are considered single-phase flows. Consequently, the conventional single-phase wellbore pressure loss calculation formulas based on the generalized flow index method can be utilized for the solution [29,30].
The wellbore annular flow domain and the double-wall drill pipe inner pipe flow domain are characterized as cutting-drilling fluid solid–liquid two-phase flows [31]. The set of governing equations for the transient solid–liquid two-phase flow in the wellbore includes the liquid-phase continuity equation, the solid-phase continuity equation, and the momentum equation for the mixed phase (drilling fluid and cuttings). The continuity equations for the liquid and solid phases are expressed as follows:
α l ρ l t + α l ρ l v l x = 0
α s ρ s t + α s ρ s v s x = 0
The momentum equation for the mixed phase is obtained by summing the individual momentum equations of the solid and liquid phases, and is expressed as:
t ( α l ρ l v l + α s ρ s v s ) + x ( α l ρ l v l 2 + α s ρ s v s 2 ) + P x = Δ p w x g ( α l ρ l + α s ρ s ) cos θ
where αl and αs are the volume fractions of the drilling fluid and drill cuttings, respectively, which are dimensionless; ρl and ρs are the densities of the drilling fluid and drill cuttings, respectively, kg/m3; vs and vl are the transport velocities of the drilling fluid and drill cuttings, m/s; p is the pressure, MPa; g is the gravitational acceleration, m/s2; Δ p w is the annular wellbore pressure loss generated by the solid–liquid two-phase flow, MPa.
Therefore, the Euler–Euler two-phase flow theory is adopted in this study, as both the solid and liquid phases are treated as independent and continuous media. This approach is particularly suitable for drilling hydraulics where the solid phase (cutting) concentration is significant, as it provides a computationally efficient way to account for phase coupling and interphase momentum transfer compared to particle-tracking methods. Accordingly, this study proposes a calculation formula for the annular wellbore pressure loss suitable for the solid–liquid two-phase flow within the wellbore annulus of double-wall drill pipe drilling.
Δ p w = f a L ρ m v a 2 2 ( D w D p o )
where Δ p w is the annular wellbore pressure loss, MPa; fa is the annular friction factor, which is dimensionless; L is the length of the bottomhole assembly (BHA), m; ρm is the density of the solid–liquid mixed phase, kg/m3; va is the average flow velocity of the mixed phase in the annulus, m/s; Dw is the wellbore diameter, m; Dpo is the outer diameter of the bottomhole assembly (BHA), m.
The expressions for the annular mixed-phase friction factor, fa, and the Reynolds number, NRef, are given as follows [32,33]:
f a = 16 N R e f 1                               N R e f 2300   0.016 N R e f 0.2                 N R e f > 2300  
N R e f = ρ m v a 2 n ( D w D p o ) n 8 n 1 K
The mixture velocity of the solid–liquid phase, va, and the mixture density, ρm, are defined respectively as:
v a = α s v s + α l v l
ρ m = α s ρ s + α l ρ l
The wellbore pressure loss within the inner pipe of the double-wall drill pipe can also be solved using the generalized flow index method. The calculation formula is expressed as follows:
Δ p p = 2 f p L ρ m v p 2 D i , i
where Δ p p is the wellbore pressure loss within the inner pipe of the double-wall drill pipe, MPa; fp is the friction factor of the inner pipe, which is dimensionless; L is the length of the double-wall drill pipe, m; vp is the flow velocity within the inner pipe, m/s; Di_i is the inner diameter of the inner pipe of the double-wall drill pipe, m.
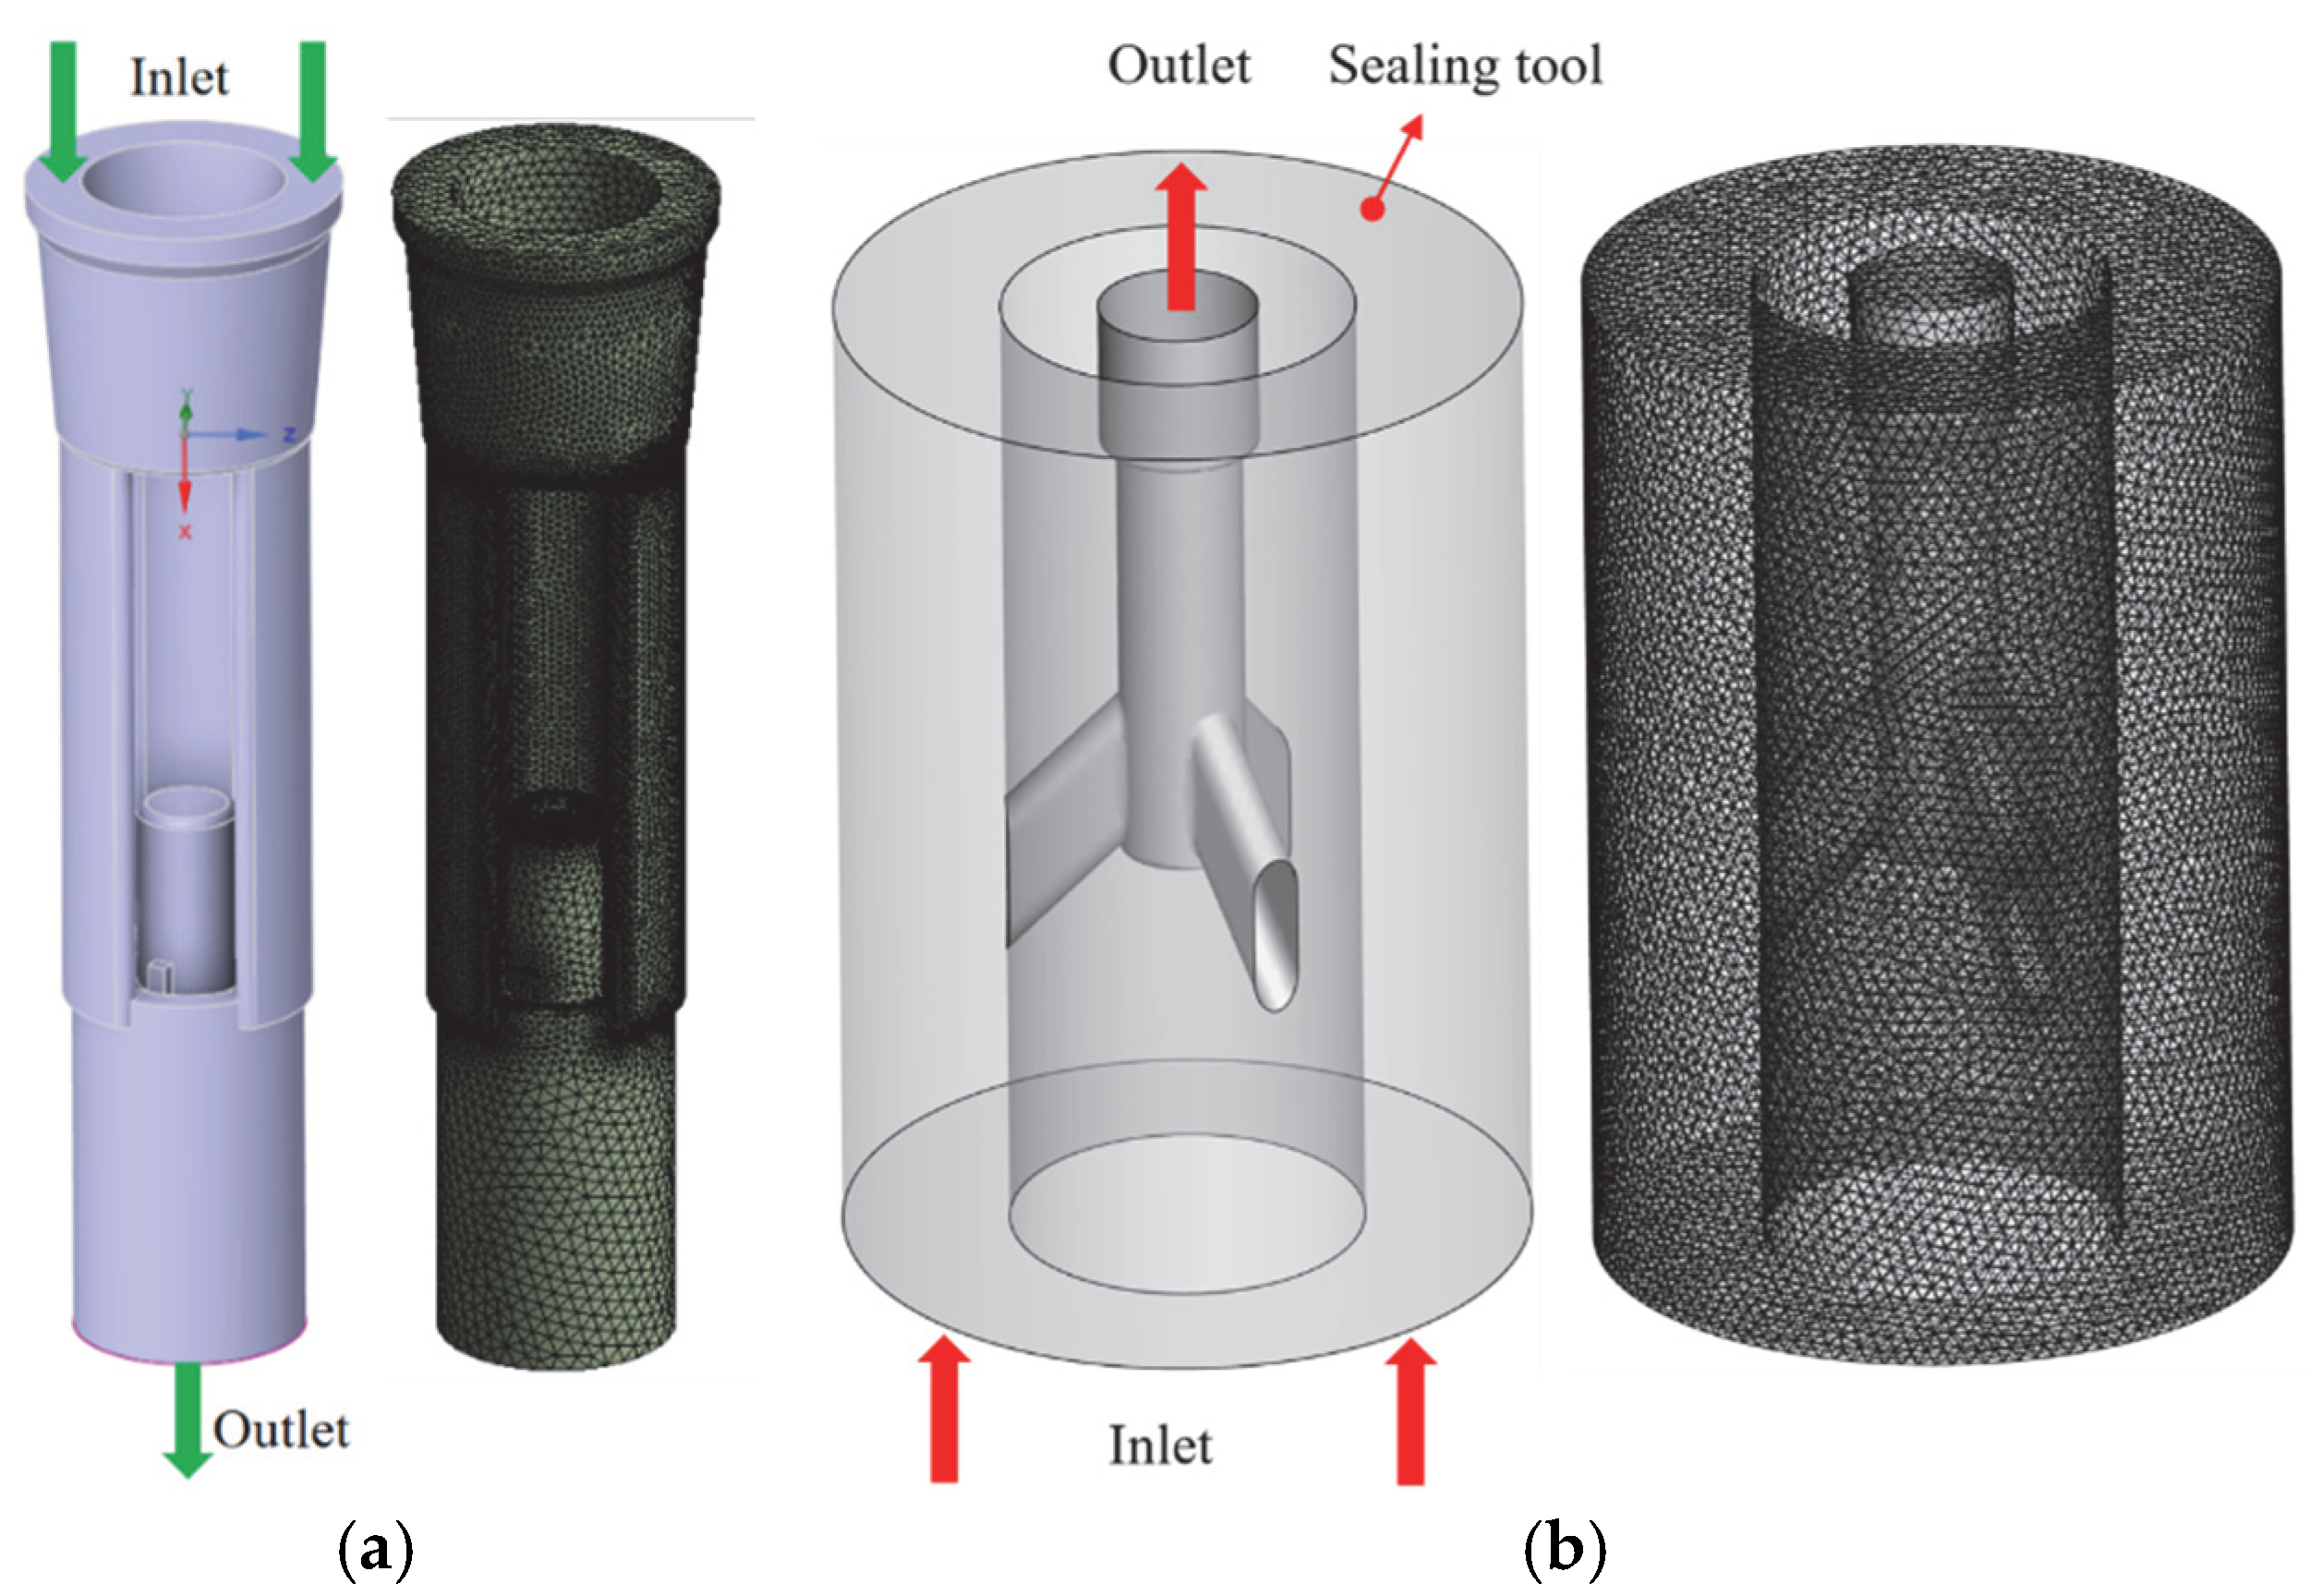
As a critical component of double-wall drill pipe (DWDP) reverse circulation technology, the converter is a primary factor in wellbore pressure loss calculations, necessitating rigorous analysis of its hydraulic characteristics. Based on the three-dimensional structural characteristics and operational mechanism of the reverse circulation converter, the fluid domains of the inner and outer annuli were extracted and modeled independently. Both fluid domains were discretized using tetrahedral meshes, with a total grid count of 1.2 million to ensure grid independence, as shown in Figure 2. Regarding boundary conditions, the inlets for both the inner and outer annuli were configured as velocity inlets with vertical injection, while the outlets were set as pressure-free outflows. All other boundaries were defined as walls with a no-slip condition applied. During the numerical solution process, the pressure–velocity coupling was implemented using the Coupled algorithm.
This study established pressure loss models for both the internal and external annuli of the converter. Utilizing a single-factor experimental design, CFD numerical simulations were performed via Fluent to systematically evaluate the effects of drilling fluid flow rate, density, and rheological parameters on the pressure drop across these internal and external annuli. The simulation operational parameters for this study are presented in Table 1.
Based on the numerical results, Response Surface Methodology (RSM) was employed to perform regression analysis, ultimately yielding empirical formulas for converter pressure loss under diverse operational conditions. According to the calculations, the formula for the pressure loss across the converter’s internal annulus during the downward drilling fluid injection stage is expressed as:
Δ P i n = 12416.92362 97920.45526 v + 156.54895 ρ 2.13745 × 10 6 μ + 74.36236 v ρ + 1.44987 × 10 5 v μ + 2198.11415 ρ μ + 23073.50211 v 2 0.118910 ρ 2 1.08587 × 10 7 μ 2
The calculation formula for the pressure loss across the converter’s external annulus during the drilling fluid return stage is expressed as:
Δ P o u t = 26193.08175 1.66518 × 10 5 v 19.83084 ρ 36366.20994 μ + 144.03224 v ρ + 1.56715 × 10 3 v μ + 25.28900 ρ μ + 2.69619 × 10 3 v 2 0.001166 ρ 2 3.71019 × 10 5 μ 2

3. Model Validation

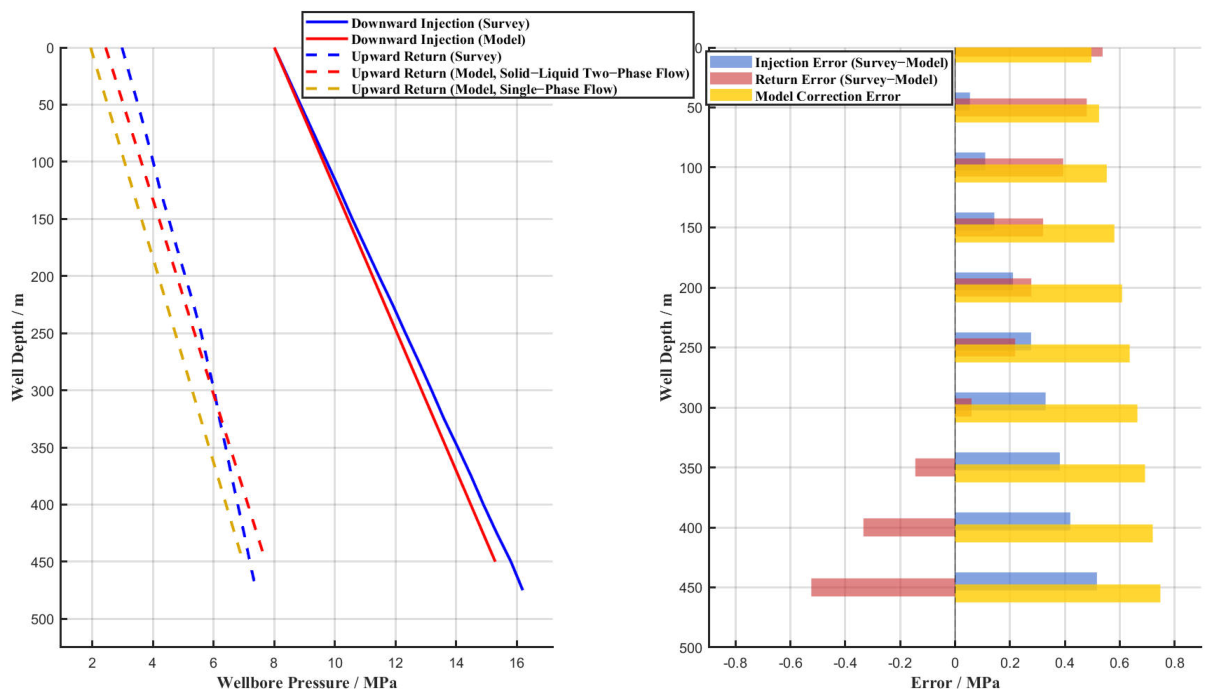
To validate the model, pressure gradient data recorded at the driller’s console during drilling operations from the 0–500 m section of an onshore test well in Alberta, Canada, were utilized [34]. This well employs a dual-gradient design utilizing a double-wall drill pipe (DWDP). The field data from the test well were compared with the calculated results derived from the proposed wellbore pressure model for DWDP reverse circulation drilling. As illustrated in Figure 3, the model’s predictions closely align with the field measurements, exhibiting an average error of approximately 2.58%. Due to the fact that the wellbore pressure calculation model does not fully account for the dynamic effects of complex temperature fields on fluid properties, and incorporates simplified assumptions regarding the slip mechanism in solid–liquid two-phase flow, there exist certain discrepancies between the theoretical calculations and the field-measured data. This deviation falls well within the acceptable engineering error margin, providing a preliminary validation of the accuracy of the established wellbore pressure calculation model under these specific conditions.
Furthermore, based on this model, the inner pipe pressure during the drilling fluid return stage was calculated under a single-phase flow assumption (depicted by the yellow line in Figure 3). These results show a significant discrepancy compared to those calculated when considering the presence of cuttings (the red line), with the single-phase predictions being consistently underestimated. Consequently, the solid–liquid two-phase flow model (red line) appears more capable of capturing the actual circulation pressure loss, suggesting its potential reliability, particularly under conditions such as deep wells, high flow rates, or high cutting concentrations.

4. Case Study

4.1. Wellbore Pressure Distribution Characteristics

To conduct the wellbore pressure simulation calculations, a deep shale gas test well from an engineering field site was selected as a case study. The target well is a vertical well with a depth of 1200 m. The specifications of the double-wall drill pipe (DWDP) follow the dimensions used in the aforementioned numerical simulation. The conventional downhole motor assembly at the bottom of the drill string has a total length of approximately 25 m, and other specific drilling parameters are detailed in Table 2.
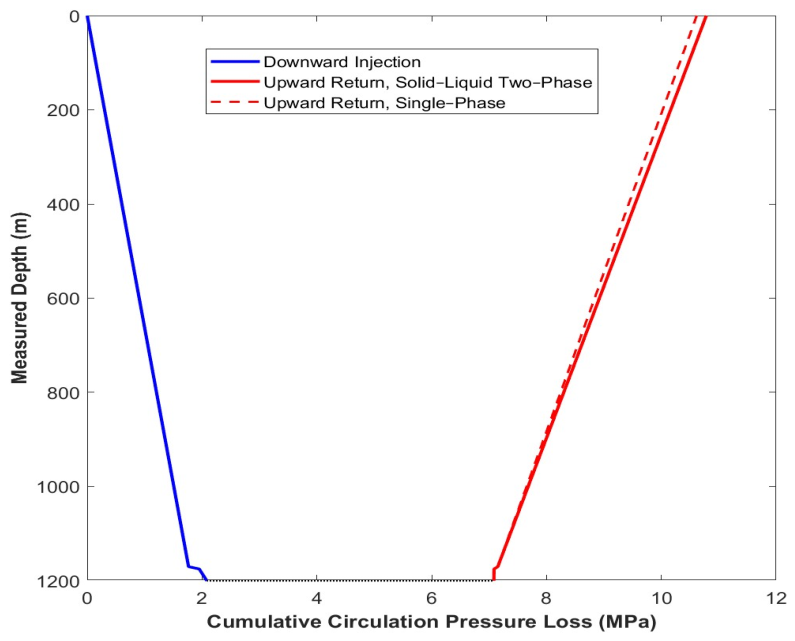
During the downward injection phase of the drilling fluid, the flow domain is characterized by single-phase flow; thus, conventional single-phase pressure loss formulas are applied for the wellbore circulation pressure loss calculation. Conversely, for the upward return phase, the solid–liquid two-phase flow formula provided in the previous section is employed. The resulting wellbore pressure profile is plotted in Figure 4.
Analysis of the results in Figure 4 indicates that the cumulative circulation pressure loss during the injection phase is approximately 2.08 MPa, while the cumulative loss during the return phase (solid–liquid two-phase flow) is approximately 3.70 MPa. Furthermore, under these operating conditions, the wellbore pressure calculated by the two-phase formula is consistently higher than that calculated by the single-phase formula at the same depth. The total circulation pressure loss for the entire wellbore increases by approximately 0.17 MPa compared to the conventional model. Since cuttings only affect pressure loss during the upward return phase, a specific analysis shows that the pressure loss in the return domain increases by 4.73%. This demonstrates that considering cuttings is of significant engineering value for the accurate prediction of wellbore pressure in reverse circulation drilling.
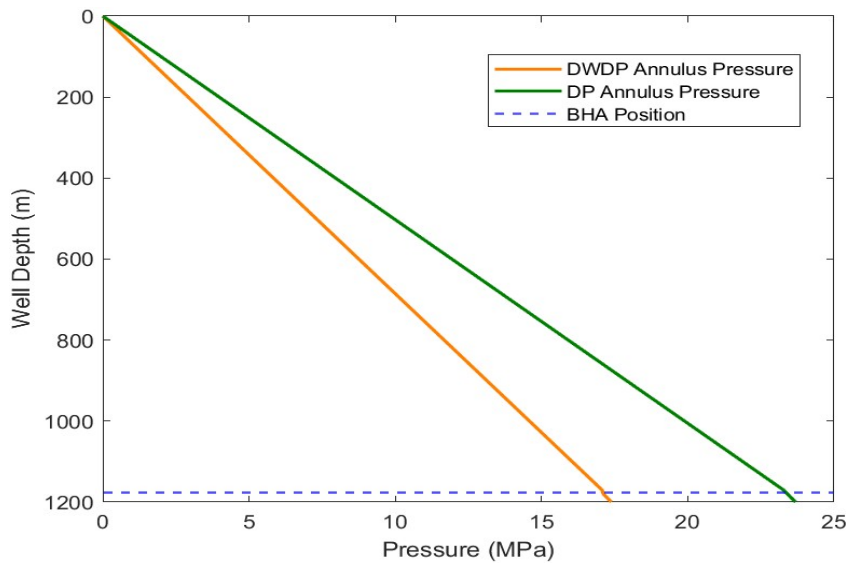
Figure 5 illustrates the calculated formation annulus pressure profiles along the well depth during the drilling fluid return stage, comparing the double-wall drill pipe (DWDP) reverse circulation bottomhole assembly (BHA) with the conventional drill pipe forward circulation BHA. For a rigorous comparison, the hydraulic parameters used for the conventional drilling simulation were kept identical to those of the DWDP system. Additionally, the dimensions of the conventional drill pipe were selected to ensure that the cross-sectional areas of both the wellbore annulus and the internal flow path remained consistent with the DWDP model, thereby eliminating the influence of geometric variations on hydraulic performance. As observed from the figure, the formation annulus pressure gradually decreases as the well depth decreases (moving towards the surface) during the return stage. Notably, the pressure profile of the DWDP reverse circulation BHA remains consistently lower than that of the conventional forward circulation BHA. At the well bottom (depth of 1200 m), the bottomhole pressure (BHP) for the DWDP assembly is recorded at 17.38 MPa, whereas the BHP for the conventional forward circulation assembly reaches 23.69 MPa. This comparative analysis demonstrates that the DWDP reverse circulation drilling technology can effectively mitigate bottomhole pressure, achieving a significant reduction of approximately 6.31 MPa compared to conventional drilling operations.
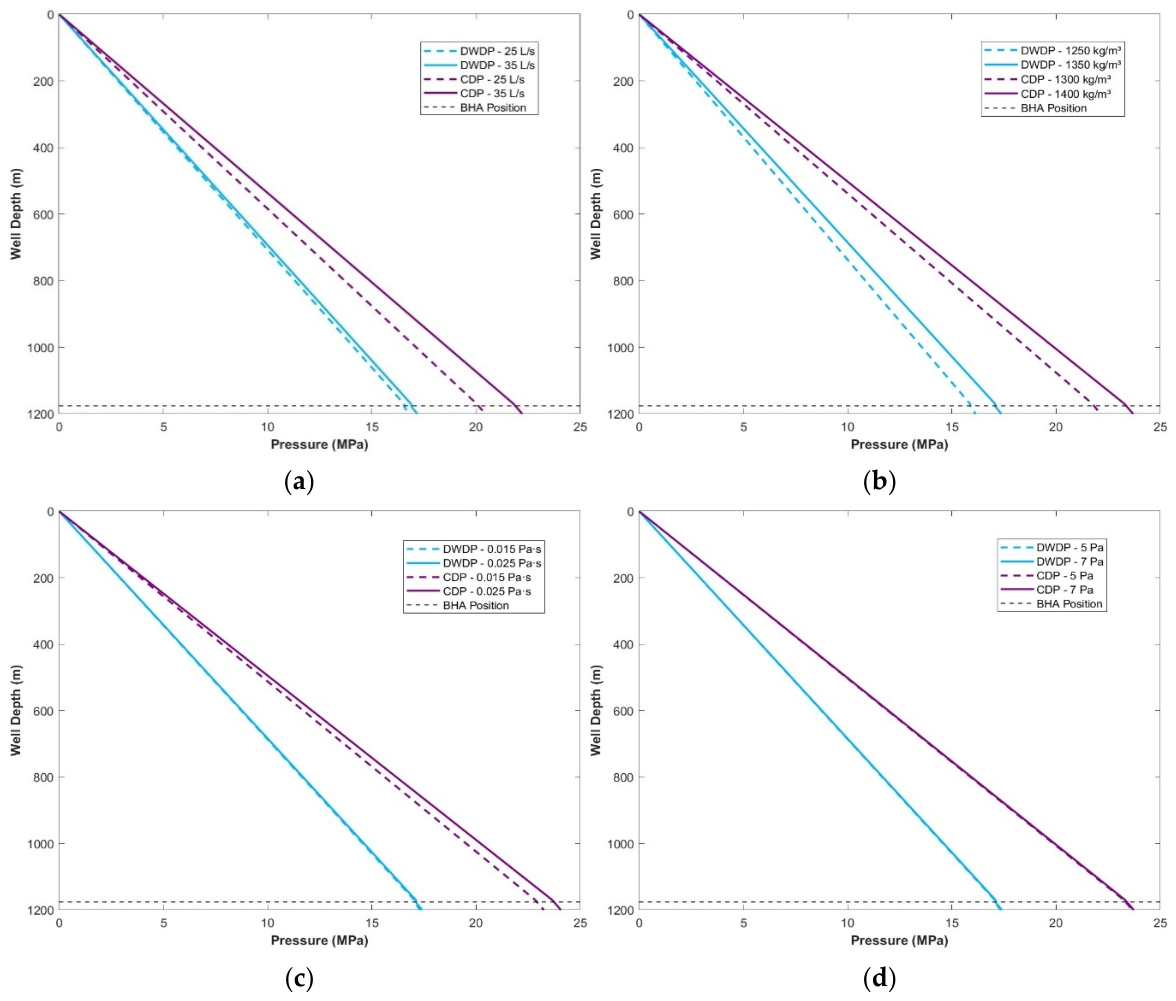
To further quantify the advantages of the double-wall drill pipe (DWDP) technology, a parametric analysis was conducted by varying the hydraulic parameters. The formation annulus pressure profiles for both DWDP reverse circulation and conventional forward circulation under various hydraulic conditions were calculated, as presented in Figure 4. As depicted in the figure, regardless of the variations in hydraulic parameters, the formation pressure associated with the DWDP technology remains consistently lower than that of the conventional drill pipe.
As detailed in Figure 4, the specific reductions in bottomhole pressure achieved by the DWDP technology compared to conventional drill pipes under various conditions are as follows:
According to Figure 6a, the BHP is reduced by approximately 3.62 MPa at a flow rate of 25 L/s, and this reduction increases to 5.03 MPa at 35 L/s. As shown in Figure 6b, assuming the circulating fluid density in the conventional method equals the passive fluid density in the DWDP process, the BHP decreases by about 5.98 MPa with an active fluid density of 1250 kg/m3, and by 6.31 MPa at 1350 kg/m3. Furthermore, Figure 6c indicates that under a plastic viscosity (PV) of 0.015 Pa·s, the BHP drops by approximately 5.91 MPa, with the reduction extending to 6.65 MPa at a PV of 0.025 Pa·s. Finally, Figure 6d demonstrates that at a yield point (YP) of 5 Pa, the BHP is mitigated by about 6.31 MPa, and similarly by 6.32 MPa at a YP of 7 Pa.
Furthermore, it can be deduced from Figure 4 that, compared to conventional drill strings, the DWDP technology exhibits significantly smaller fluctuations in bottomhole pressure (BHP) when subjected to variations in hydraulic parameters. Specifically, when the flow rate increases from 25 L/s to 35 L/s (Figure 6a), the BHP of conventional drilling increases by 1.77 MPa, while the DWDP system only shows an increase of 0.36 MPa, indicating a 79.7% reduction in flow-rate sensitivity. Similarly, as shown in Figure 6b, for a consistent density increment of 100 kg/m3, the BHP increment of the DWDP system (1.23 MPa) is significantly lower than that of the conventional system (1.57 MPa). These quantitative comparisons demonstrate that the DWDP hydraulic system possesses greater robustness and resilience to parameter adjustments. Consequently, it is highly conducive to maintaining stable conditions for near-balanced drilling (NBD) operations, thereby effectively mitigating the risks of lost circulation and blowouts induced by drastic pressure swings. In conclusion, the DWDP demonstrates superior BHP stability and broader operational adaptability, allowing for safe and efficient drilling across a wider hydraulic parameter window.

4.2. Analysis of Influencing Factors on Wellbore Pressure

To further investigate the distribution characteristics of wellbore pressure and pressure loss in double-wall drill pipe (DWDP) reverse circulation drilling, a single-factor analysis method was employed in this study. This approach systematically evaluates the effects of various factors—namely, circulation flow rate, rate of penetration (ROP), and drilling fluid properties—on the circulation pressure loss, while maintaining all other operational parameters consistent with those established in the preceding sections.

4.2.1. Well Depth

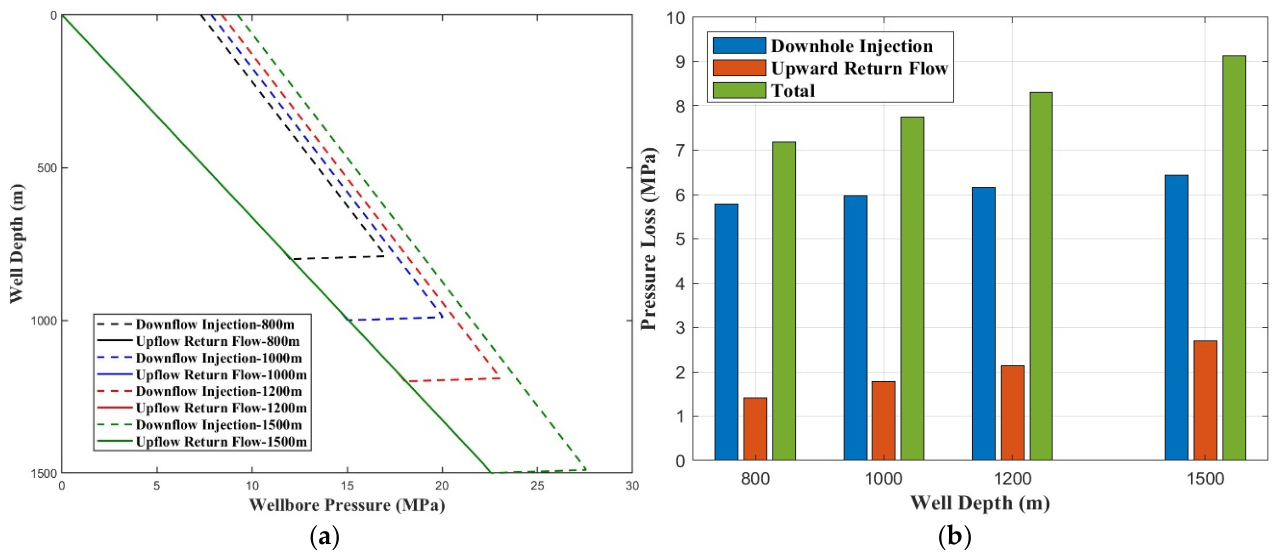
The variation patterns of wellbore pressure and circulation pressure loss at different well depths are illustrated in Figure 7.
As analyzed in Figure 7a, the wellbore pressure increases with the increment of well depth. When the depth increases from 800 m to 1200 m, the bottomhole pressure (BHP) increases by approximately 5.98 MPa, while the wellhead pressure increases by about 1.10 MPa. Notably, the pressure profiles for the upflow return stage across all well depths are perfectly coincident. This overlapping phenomenon occurs because the fluid in the return flow channel (the inner pipe) discharges at the wellhead under atmospheric conditions (0 MPa). For any given depth, the upflow pressure is uniquely determined by the hydrostatic head and the cumulative frictional pressure drop of the fluid column between that specific depth and the surface. Since the fluid properties, flow rate, and pipe geometry remain identical across all cases, the upflow pressure distribution is independent of the total well depth, resulting in the overlapping curves. Furthermore, the analysis of Figure 7b reveals that the circulation pressure loss increases with well depth. As the depth increases from 800 m to 1500 m, the pressure loss during the drilling fluid injection stage increases by approximately 0.65 MPa, and the loss during the return stage increases by about 1.28 MPa, leading to a total increase in circulation pressure loss of 1.93 MPa. This phenomenon occurs because the increased well depth elevates the height of the drilling fluid column, thereby increasing the hydrostatic pressure. Simultaneously, the longer flow paths in both the inner pipe and the annulus result in a cumulative increase in frictional resistance, which subsequently raises the circulation pressure loss during both the injection and return stages.

4.2.2. Flow Rate

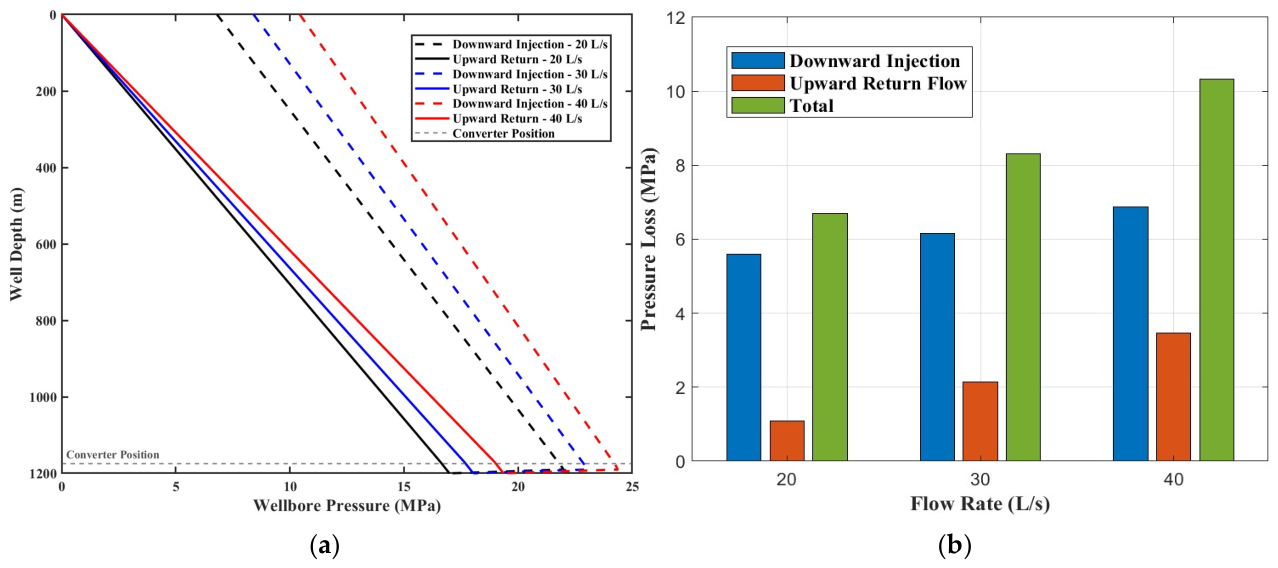
The variation patterns of wellbore pressure and circulation pressure loss under different drilling fluid flow rates are illustrated in Figure 8.
As analyzed from Figure 8a, the wellbore pressure increases with the increment of the circulation flow rate. When the flow rate increases from 20 L/s to 40 L/s, the bottomhole pressure (BHP) increases by approximately 2.37 MPa, and the wellhead pressure increases by about 3.63 MPa. Furthermore, the analysis of Figure 8b reveals that the circulation pressure loss also grows as the flow rate rises. Within the same flow rate increment (from 20 L/s to 40 L/s), the circulation pressure loss during the drilling fluid injection stage increases by approximately 1.28 MPa, while the loss during the return stage increases by about 2.37 MPa. Consequently, the total wellbore circulation pressure loss experiences an overall increase of 3.65 MPa. This phenomenon can be attributed to the fact that an increased circulation flow rate directly elevates the fluid velocity. According to wellbore hydraulics, the higher fluid velocity leads to a significant increase in the frictional pressure loss, as the energy dissipation caused by internal fluid friction and wall shear stress intensifies with the rising flow velocity. Consequently, the frictional resistance along the fluid paths within both the annulus and the inner pipe is magnified. Simultaneously, the vortex energy dissipation at abrupt cross-sectional changes in the flow passages increases synchronously, ultimately manifesting as a significant surge in the overall pressure loss.

4.2.3. Drilling Fluid Density

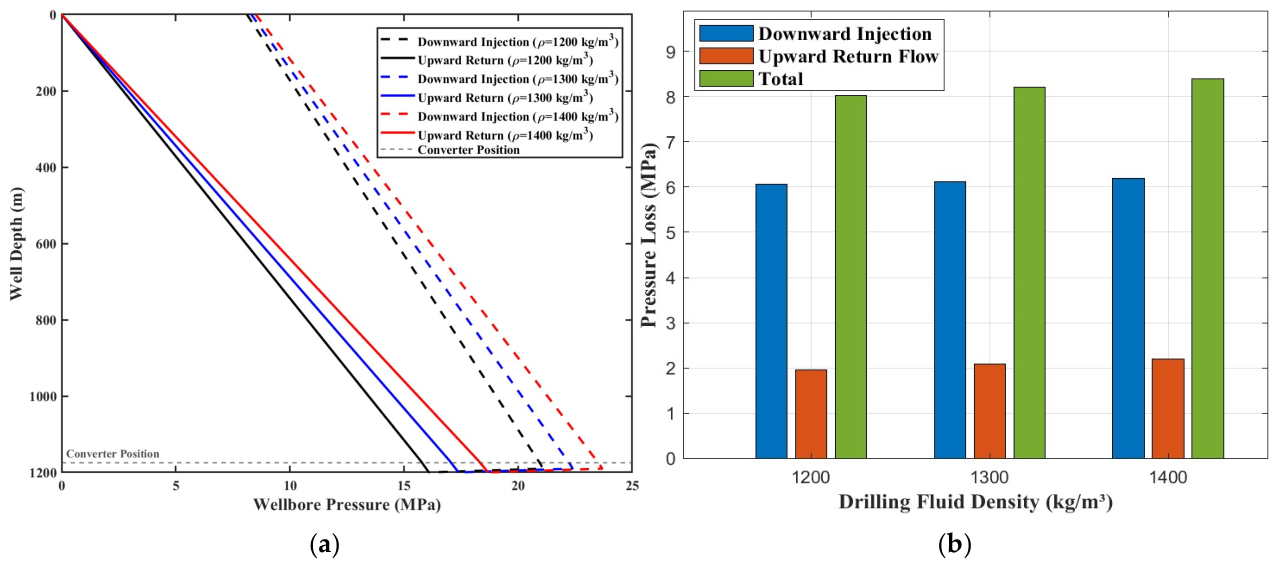
The variation patterns of wellbore pressure and circulation pressure loss under different drilling fluid densities are illustrated in Figure 9.
As analyzed from Figure 9a, the wellbore pressure increases with the increment of drilling fluid density. When the drilling fluid density increases from 1200 kg/m3 to 1400 kg/m3, the bottomhole pressure (BHP) increases by approximately 2.59 MPa, and the wellhead pressure increases by about 0.39 MPa. Furthermore, the analysis of Figure 9b reveals that the circulation pressure loss also grows as the drilling fluid density increases. For the same density increment (from 1200 kg/m3 to 1400 kg/m3), the circulation pressure loss during the drilling fluid injection stage increases by approximately 0.13 MPa, while the loss during the return stage increases by about 0.24 MPa. Consequently, the total wellbore circulation pressure loss experiences an overall increase of 0.37 MPa. This phenomenon is driven by two main mechanisms. First, the increased drilling fluid density directly elevates the hydrostatic pressure, which is the dominant factor governing the overall wellbore pressure, thereby manifesting as a significant surge in BHP. Second, the higher density increases the Reynolds number, facilitating the transition of the flow regime from laminar to turbulent flow. Simultaneously, it increases the kinetic energy of the flowing fluid, which ultimately results in the elevation of circulation pressure loss.

4.2.4. Drilling Fluid Plastic Viscosity

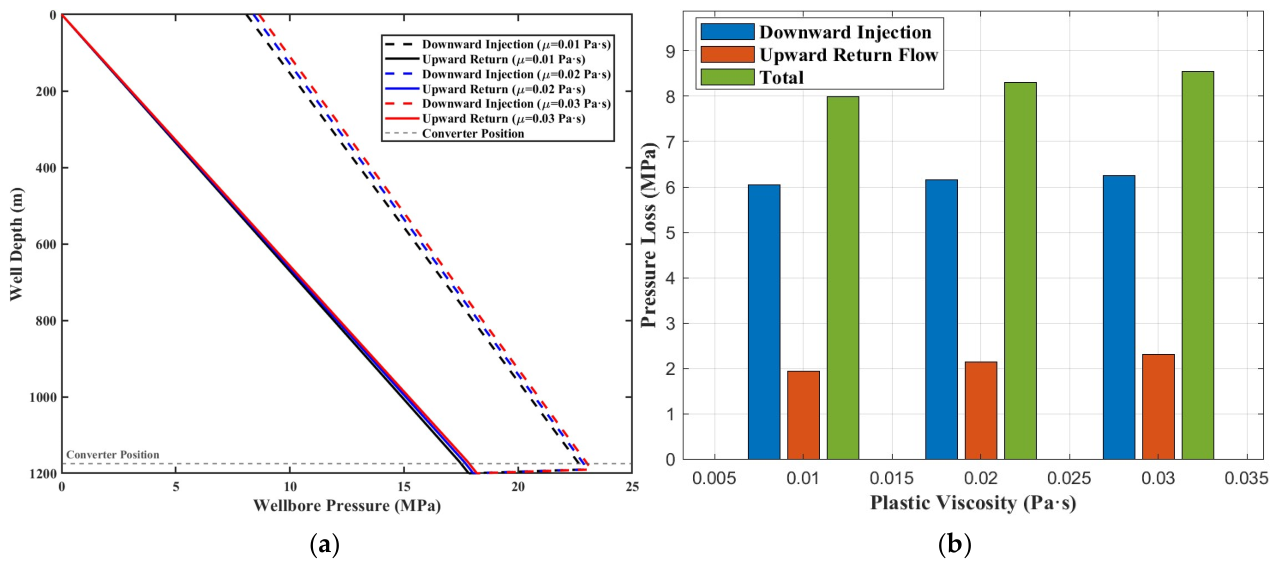
The variation patterns of wellbore pressure and circulation pressure loss under different drilling fluid plastic viscosities are illustrated in Figure 10.
As analyzed from Figure 10a, the wellbore pressure increases with the increment in drilling fluid plastic viscosity. When the plastic viscosity (PV) increases from 0.01 Pa·s to 0.03 Pa·s, the bottomhole pressure (BHP) increases by approximately 0.36 MPa, and the wellhead pressure increases by about 0.56 MPa. Furthermore, the analysis of Figure 10b reveals that the circulation pressure loss also grows as the plastic viscosity increases. For the same PV increment (from 0.01 Pa·s to 0.03 Pa·s), the circulation pressure loss during the drilling fluid injection stage increases by approximately 0.20 MPa, while the loss during the return stage increases by about 0.36 MPa. Consequently, the total wellbore circulation pressure loss experiences an overall increase of 0.56 MPa. Mechanistically, an increase in the plastic viscosity of the drilling fluid signifies a higher degree of fluid viscousness, which directly intensifies the internal friction between fluid layers. Consequently, a greater amount of energy is dissipated to overcome this flow resistance, which ultimately manifests as an elevation in the circulation pressure loss. From a practical design perspective, these findings suggest that controlling the plastic viscosity is crucial for managing the parasitic pressure losses in DWDP systems. Since the return flow occurs within the narrow inner pipe at high velocities, even a small increase in PV can lead to a disproportionate rise in wellhead pressure. Therefore, in DWDP reverse circulation operations, drilling fluid additives should be selected to optimize the solid phase content and minimize PV to prevent excessive surface pump pressure.

4.2.5. Drilling Fluid Yield Point

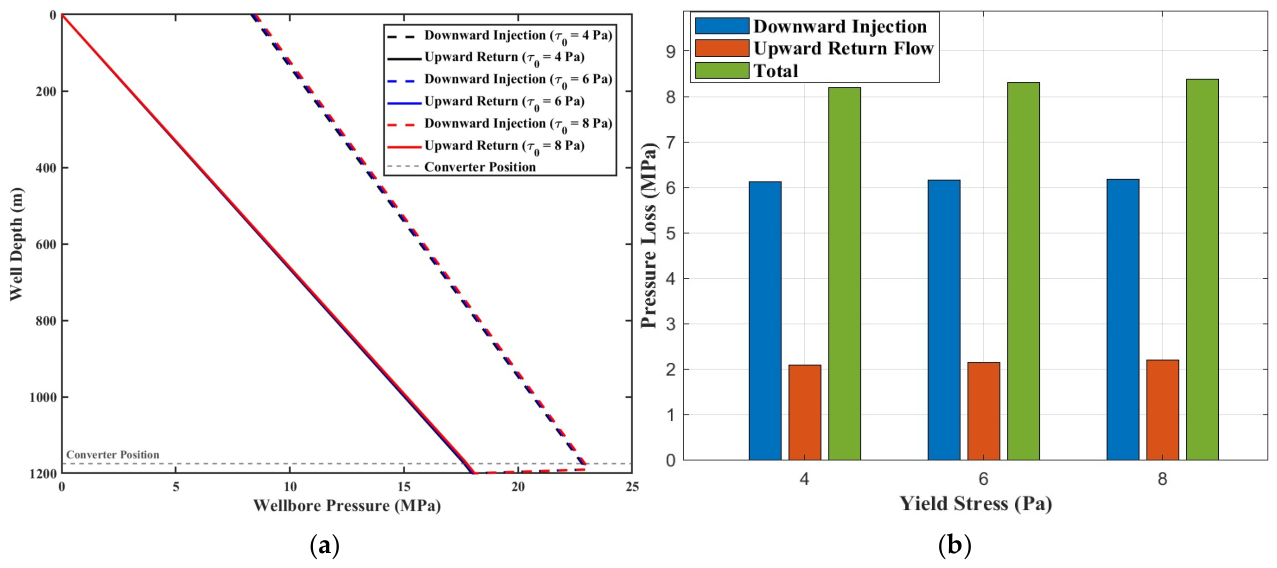
The variation patterns of wellbore pressure and circulation pressure loss under different drilling fluid yield points (YPs) are illustrated in Figure 11.
As analyzed from Figure 11a, the wellbore pressure increases with the increment of the drilling fluid yield point (YP). When the YP increases from 4 Pa to 8 Pa, the bottomhole pressure (BHP) increases by approximately 0.12 MPa, while the wellhead pressure increases by about 0.18 MPa. According to Figure 11b, the circulation pressure loss also grows as the YP rises. Within the same increment (from 4 Pa to 8 Pa), the pressure loss during the drilling fluid injection stage increases by about 0.06 MPa, and the loss during the return stage increases by approximately 0.12 MPa, resulting in a total increase in wellbore circulation pressure loss of 0.19 MPa. The analysis of the aforementioned data indicates that despite the increase in YP, both the wellbore pressure and circulation pressure loss remain largely stable without significant variations. This marginal influence can be attributed to the high-shear conditions characteristic of the DWDP reverse circulation process. The yield point primarily characterizes the initial resistance to flow at low shear rates; however, the high-velocity flow in the confined inner pipe subjects the fluid to high shear rates where the plastic viscosity dominates the flow resistance according to the Bingham plastic model. Practically, this implies that within the common engineering range (4–8 Pa), the YP can be maintained at a level sufficient for effective cutting suspension without significantly penalizing the hydraulic efficiency of the system.
Based on a comprehensive analysis of the wellbore pressure loss results, within the double-wall drill pipe (DWDP) section, the pressure loss incurred during the return stage (inner pipe flow path) is significantly higher than that during the injection stage (annular flow path between the inner and outer pipes). According to the calculations, the average fluid velocity during downward injection is 3.79 m/s, whereas it reaches 7.76 m/s during upward return. Combined with the numerical simulation results from the previously established transient solid–liquid two-phase flow model, this disparity arises because the cross-sectional area of the inner pipe is substantially smaller than that of the annulus. This restricted flow area leads to elevated flow velocities and increased cutting concentration, which in turn intensifies frictional losses, ultimately resulting in a more pronounced pressure drop during the return stage.

4.3. Sensitivity Analysis

To eliminate the discrepancies arising from differing units of measurement, this study employs the Min-Max normalization method to process the influencing factors. This method ensures that all factors are scaled into a dimensionless range of [0, 1]. The normalization equation is expressed as:
x j = x j min ( x 1 , x 2 , , x m ) max ( x 1 , x 2 , , x m ) min ( x 1 , x 2 , , x m )
where x j is the normalized, dimensionless result of the j-th level of factor x; xj is the j-th level of factor x; m is the total number of levels for each factor.
This study introduces a comparative variation coefficient (Cr) to quantitatively and accurately characterize the relative impact of various hydraulic factors on circulation pressure loss on a uniform, dimensionless scale [35].
C r = σ p x i f a σ x P a n a
σ p = i = 1 m ( P i P a n a ) 2 m σ x = i = 1 m ( X i μ 2 ) 2 m
where Cr is the comparative variation coefficient; σ p is the standard deviation of the circulation pressure loss; σ x is the standard deviation of the variation values of factor x; xifa is the mean value of the variations in factor x; Pana is the mean value of the circulation pressure loss, MPa; Pi is the i-th value of the circulation pressure loss, MPa; Xi is the i-th variation value of the sensitivity factor x; μ2 is the mean of the variation values for the sensitivity factor.
The comparative variation coefficient Cr is a dimensionless quantity that effectively addresses the challenge of comparing the sensitivity of different influencing factors with varying physical units. Fundamentally, Cr represents the ratio of the response fluctuation rate to the factor fluctuation rate. In Equation (13), the numerator signifies the relative degree of fluctuation in circulating pressure loss, while the denominator represents the relative range of change in the value of the sensitivity factor. Therefore, the magnitude of Cr reflects the intensity of the change in circulating pressure loss triggered by a unit proportional change in the influencing factor. A higher value of Cr indicates a more significant impact of that factor on the circulating pressure loss. In this study, a threshold of Cr > 0.5 is established to identify highly sensitive factors; a higher value of Cr indicates a more significant impact of that factor on the circulating pressure loss.
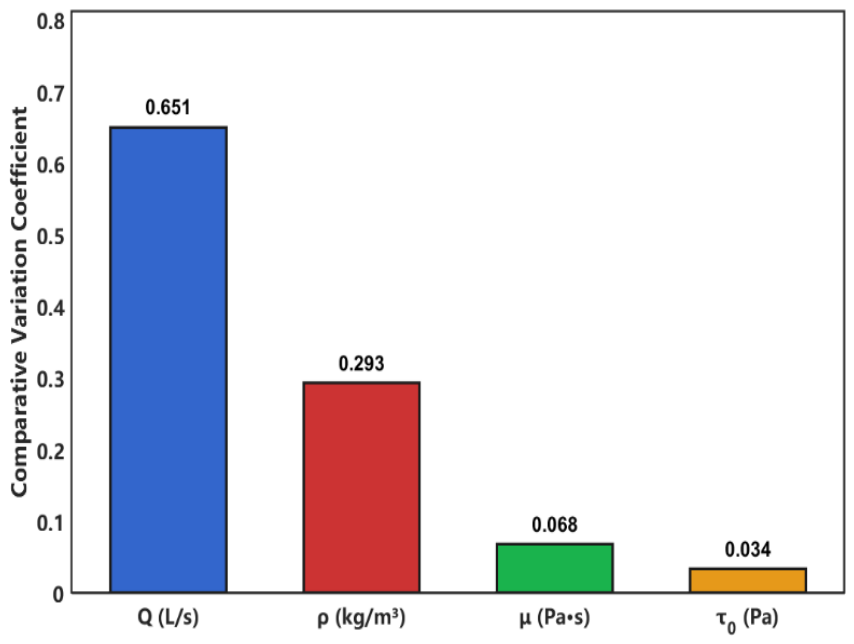
Based on the results of the factor analysis and the calculated comparative variation coefficients, the sensitivity levels of different influencing factors to the circulation pressure loss are illustrated in Figure 12.

4.4. Selection Chart of Pump Pressure for Double-Wall Drill Pipe Reverse Circulation Drilling

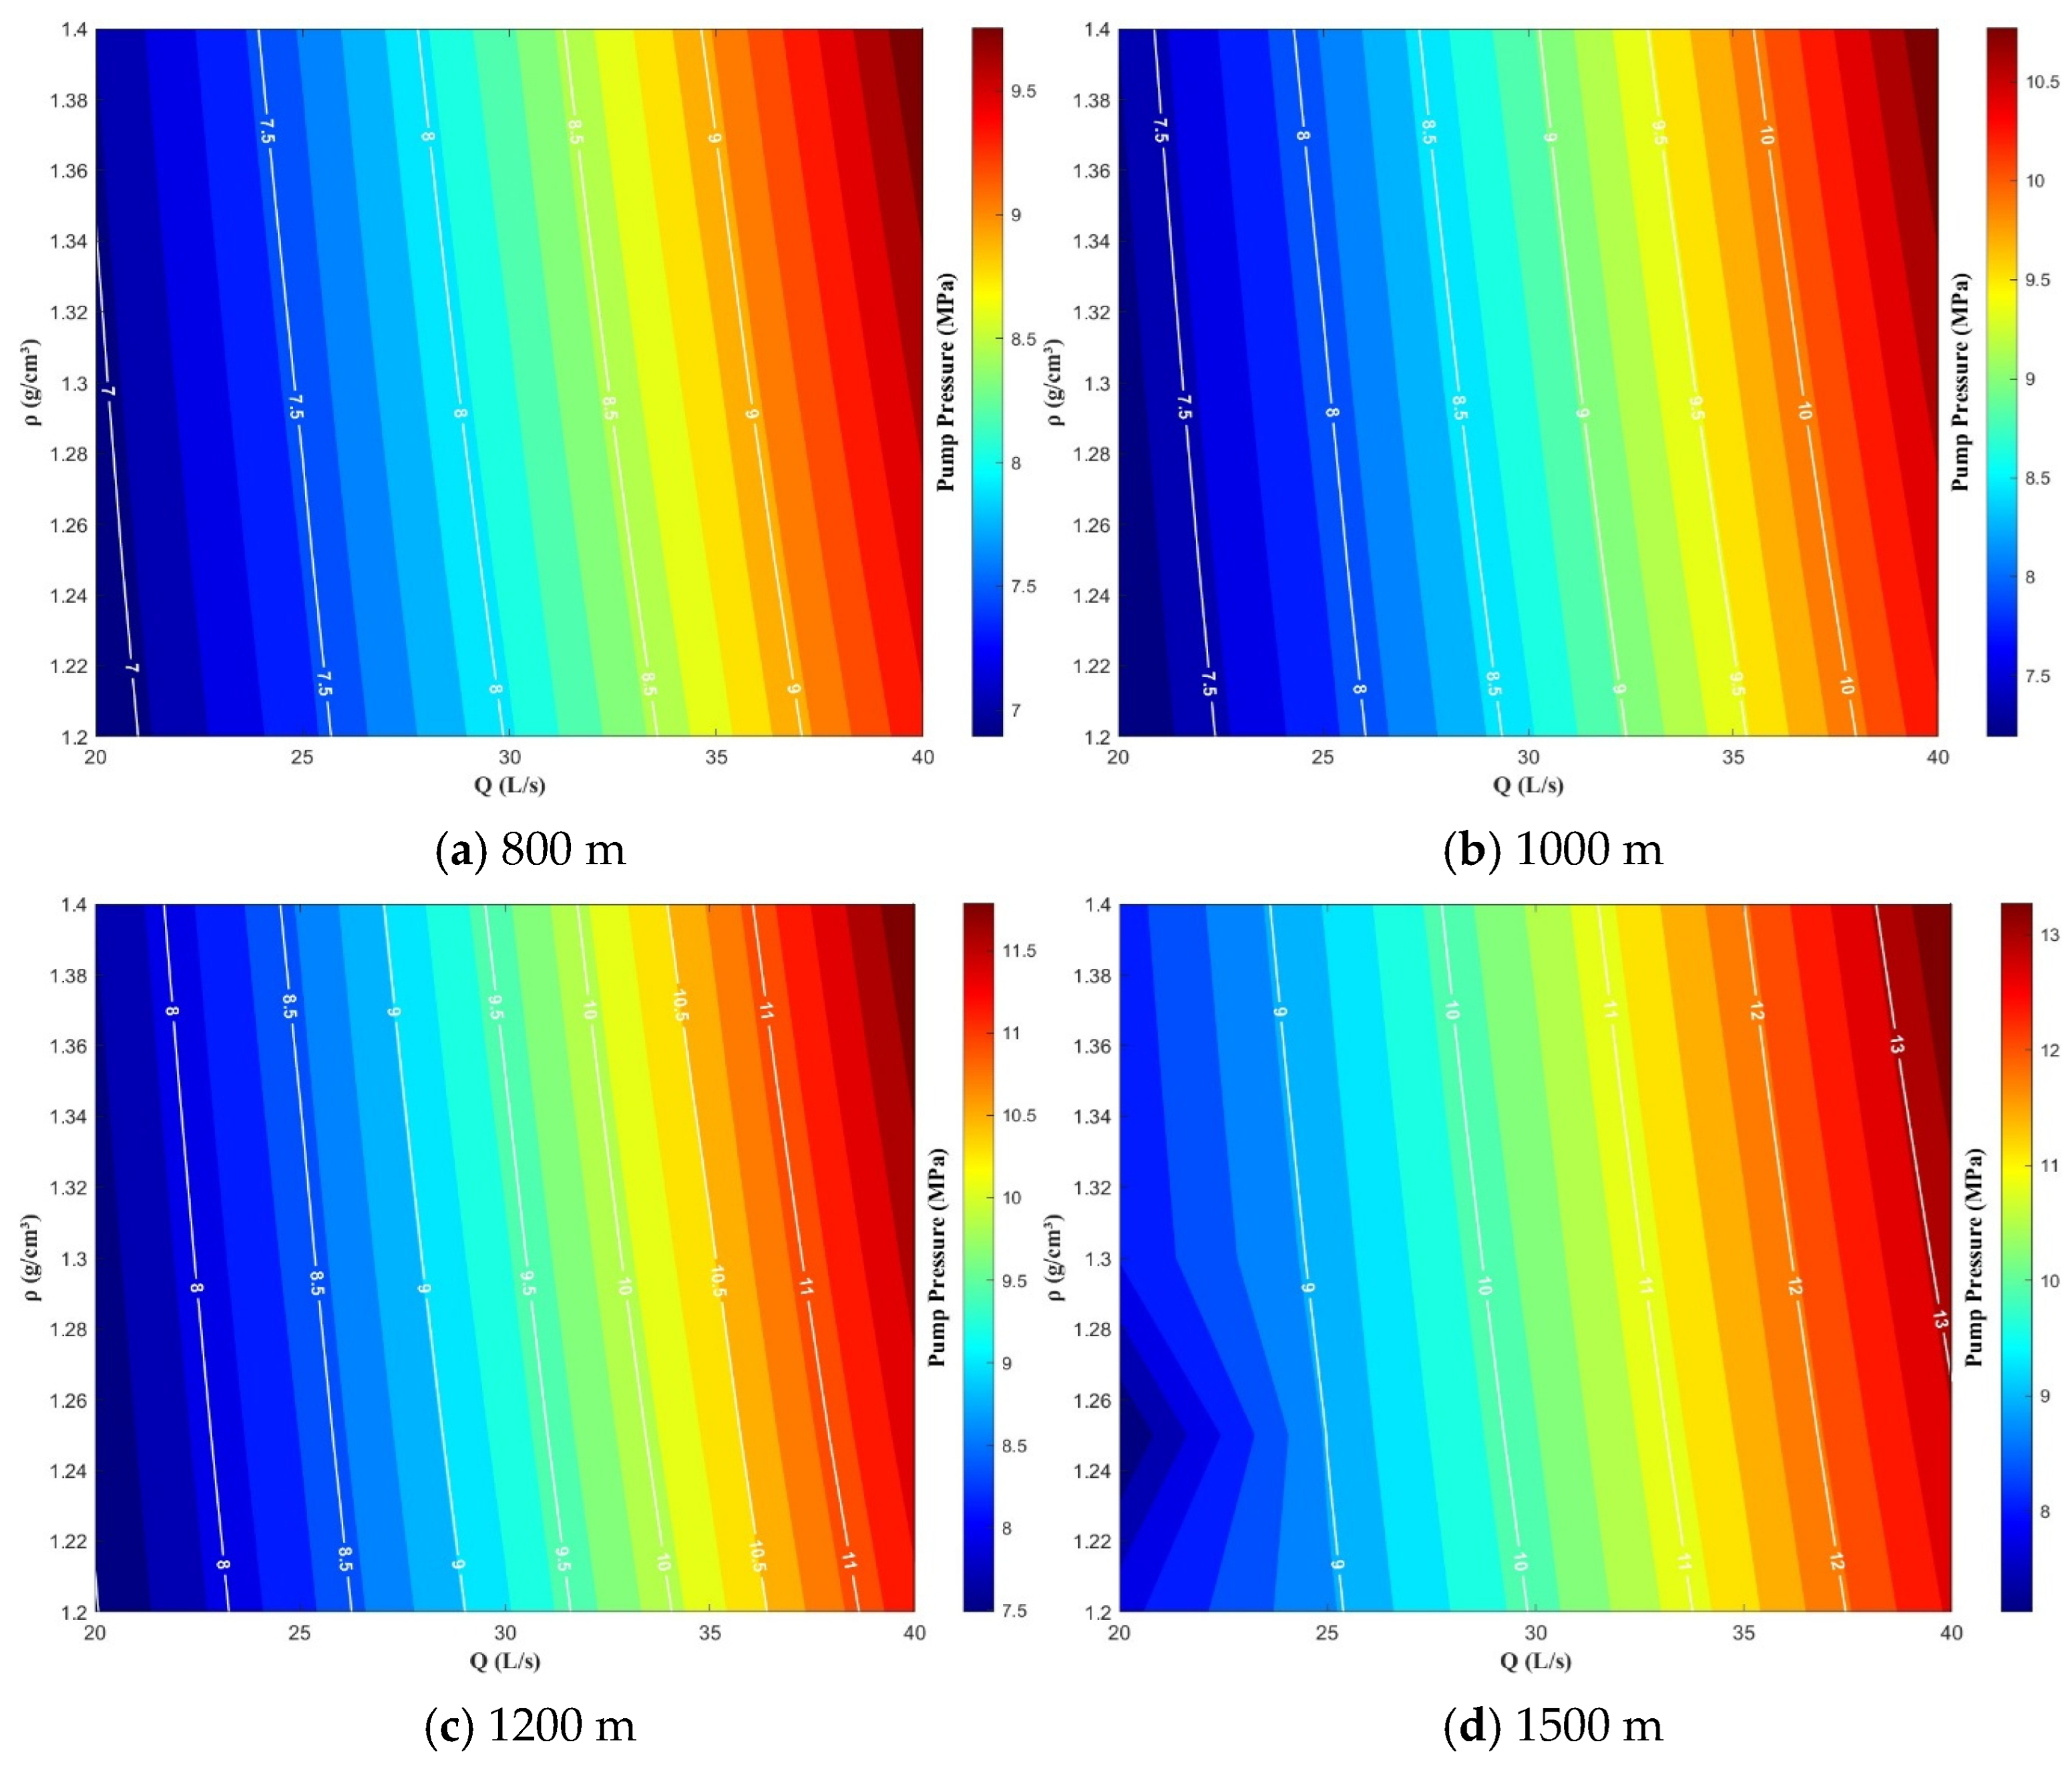
Summarizing the aforementioned analyses, it can be concluded that the circulation pressure loss increases with the increment of flow rate, density, plastic viscosity, and yield point. The degree of influence, ranked from highest to lowest, follows the order flow rate (Cr = 0.651) > density (Cr = 0.293) > plastic viscosity (Cr = 0.068) > yield point (Cr = 0.034). To effectively ensure drilling power transmission and cutting removal, priority should be given to the reasonable selection of drilling fluid flow rate and density, as they represent the most sensitive controlling factors for wellbore hydraulics. Based on the calculation results for the specific case study with a designed well depth of 1200 m, a flow rate of 20–40 L/s, and a drilling fluid density of 1200–1400 kg/m3, the estimated maximum total circulation pressure loss (including surface manifold losses) is approximately 10.91 MPa. Under these specific conditions, given a drilling pump with a maximum rated pressure of 20 MPa and a 10% safety margin [36], the calculated pressure loss remains within the equipment’s operational capacity. This indicates that for the parameters modeled in this study, the circulation system can ensure safe drilling to the target depth. Accordingly, pump pressure selection charts can be developed for different well depths, using circulation flow rate and density as the primary reference factors, as illustrated in Figure 13. Accordingly, drilling pump pressure selection charts are developed for various well depths—namely 800 m, 1000 m, 1200 m, and 1500 m—using the circulation flow rate and drilling fluid density as the primary reference factors, as illustrated in Figure 13. A comparative analysis of Figure 13a–d reveals several critical trends for engineering applications. Firstly, across all investigated well depths, the required pump pressure is exceptionally sensitive to changes in the circulation flow rate, as evidenced by the densely spaced, nearly vertical contour lines. For instance, at a depth of 800 m (Figure 13a), keeping the density constant while increasing the flow rate from 20 L/s to 40 L/s causes the required pump pressure to rise sharply from approximately 7.0 MPa to nearly 9.8 MPa. This dominant influence occurs because frictional pressure loss inside both the annulus and the inner pipe scales exponentially with fluid velocity. Conversely, the influence of drilling fluid density is relatively minor but still observable, causing a subtle leftward tilt in the contours as density increases, which reflects the additional hydrostatic load. Secondly, as the well depth increases from 800 m to 1500 m, the entire operating pump pressure window shifts significantly upward. The maximum required pump pressure located at the upper-right operating limit elevates from approximately 9.8 MPa at 800 m (Figure 13a) to over 13.5 MPa at 1500 m (Figure 13d). This substantial pressure escalation is primarily driven by the cumulative frictional resistance over the extended flow path lengths at greater depths. Notably, in the 1500 m chart (Figure 13d), a distinct deflection or ‘kink’ in the contour lines emerges under low flow rate conditions combined with lower fluid densities. This localized non-linear behavior represents a critical threshold where insufficient flow rates at greater depths lead to localized cuttings accumulation or flow regime transitions within the confined inner pipe, thereby altering the conventional pressure gradient. Consequently, these charts provide a highly intuitive and rigorous multi-parameter visualization tool for field engineers to optimize pump displacement and fluid property selection across different drilling stages.
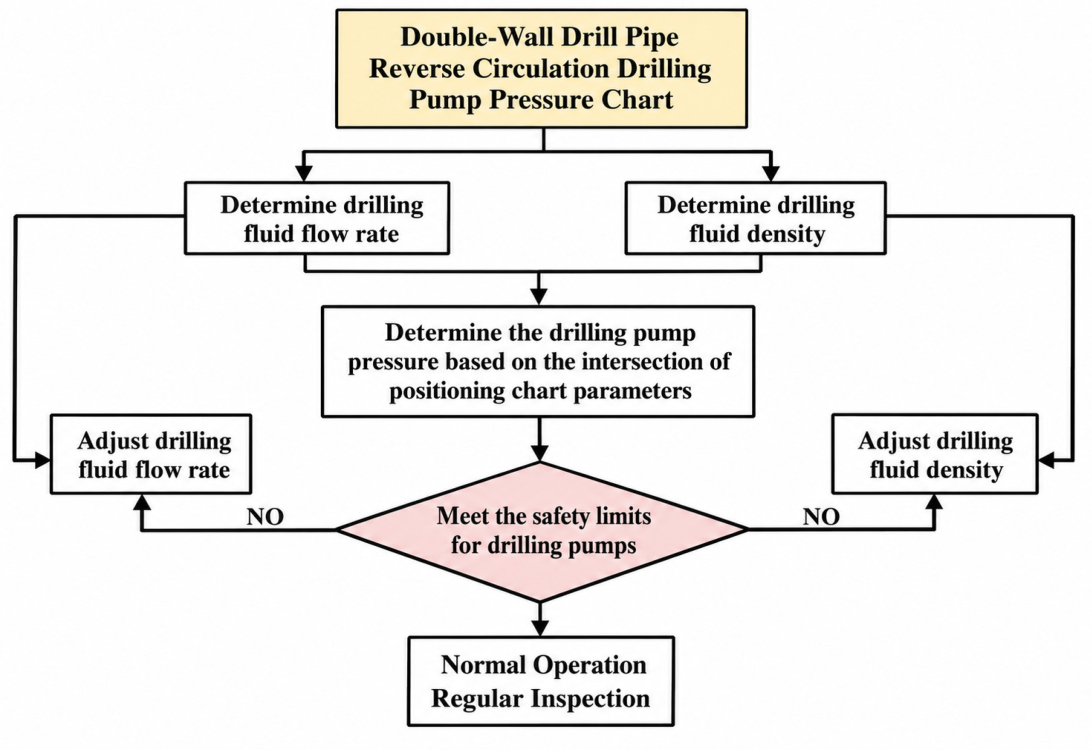
Figure 14 illustrates the operational flowchart for utilizing the pump pressure selection charts in double-wall drill pipe (DWDP) reverse circulation drilling. Initially, key operational parameters, including circulation flow rate and drilling fluid density, are determined based on actual drilling conditions. Subsequently, the intersection of these parameters is located within the charts to identify the required pump pressure for the current state. Provided the pump pressure remains within the safety range, the system continues normal operation, during which periodic monitoring and data logging must be performed to ensure safety and efficiency. Ultimately, this selection chart provides a practical reference for determining drilling parameters in field engineering operations.

5. Conclusions

(1)
A comprehensive calculation model for wellbore pressure distribution and circulation pressure loss in double-wall drill pipe (DWDP) reverse circulation drilling was developed based on wellbore hydraulics and solid–liquid two-phase flow theories. Specifically, the model incorporates the flow channel transition effects at the bottomhole reverse circulation converter. Validation against pressure gradient data from the Alberta test well in Canada (0–500 m) shows that the model results are in good agreement with field measurements. The average error is approximately 2.58%, demonstrating that the model is robust and meets the accuracy requirements for practical engineering applications.
(2)
The calculation results demonstrate that wellbore pressure changes in DWDP reverse circulation drilling exhibit distinct segmented characteristics: pressure increases with well depth during the injection stage and decreases as depth reduces during the return stage. Within the DWDP section, the pressure loss during the return flow is generally higher than that in the injection stage; this disparity is primarily attributed to the smaller cross-sectional area of the inner pipe, which leads to higher flow velocities and elevated cutting concentrations. Sensitivity analysis reveals that both wellbore pressure and circulation pressure loss increase with the increment of flow rate, density, plastic viscosity (PV), and yield point (YP). The sensitivity is ranked as follows: flow rate > density > PV > YP. Consequently, field operations for pressure control and loss reduction should prioritize the coordinated matching and optimization of flow rate and drilling fluid density.
(3)
The calculations for a field-case well indicate that, under equivalent operating conditions, the bottomhole pressure (BHP) in DWDP reverse circulation drilling can be reduced by approximately 6.31 MPa compared to conventional drilling. This underscores a significant advantage in lowering BHP and enhancing adaptability for narrow pressure margins in shallow surface formations. Based on the case well parameters (depth ~1200 m) and surface manifold/flowline specifications, within a flow rate range of 20–40 L/s and drilling fluid densities of 1200–1400 kg/m3, the maximum total circulation pressure loss is estimated at 10.91 MPa. These results confirm that a single drilling pump is sufficient to meet circulation requirements for this instance. Consequently, the pump pressure selection charts developed for four distinct well depths provide a rapid and reliable reference for parameter optimization and pressure control design in similar shallow surface well sections.

Author Contributions

All the authors conceived and designed the study. Conceptualization, M.G.; validation, L.C.; data curation, B.W. and Y.H.; writing—original draft preparation, Y.M.; writing—review and editing, G.Z.; supervision, H.Z. All authors have read and agreed to the published version of the manuscript.

Funding

This work is supported by the National Natural Science Foundation of China under the research project “Research on prediction and control methods of extension limit for dual-wall drill pipe reverse circulation drilling” (No. 52574017).

Data Availability Statement

The original contributions presented in this study are included in the article. Further inquiries can be directed to the corresponding author.

Conflicts of Interest

The authors declare no conflicts of interest.

References

  1. National Energy Administration. Top ten iconic achievements of China’s oil and gas exploration and development in 2024. World Pet. Ind. 2025, 32, 119. (In Chinese) [Google Scholar]
  2. China Mineral Resources Report. 2024. Available online: http://news.chinatungsten.com/pdf/China-Mineral-Resources-2024-en.pdf (accessed on 12 April 2026). (In Chinese)
  3. Sun, L.D.; Ma, F.; Jiang, H.; Jing, Z.H.; Yu, H.; Gao, B.; Dong, H.K.; Zeng, F.D.; Shan, Y.P.; Yang, Y.C. Progress and prospects of onshore deep to ultra-deep oil and gas exploration and development. Deep-Undergr. Energy Sci. Technol. 2025, 1, 14–26. (In Chinese) [Google Scholar]
  4. Liu, Y.S.; Zhang, J.W.; Huang, H.C. Key technologies and development directions of deep and ultra-deep drilling and completion in China. Acta Pet. Sin. 2024, 45, 312–324. (In Chinese) [Google Scholar]
  5. Zhang, G.Y.; Ma, F.; Liang, Y.B.; Zhao, Z.; Qin, Y.Q.; Liu, X.B.; Zhang, K.B.; Ke, W.L. Global deep oil and gas exploration fields and progress in theories and technologies. Acta Pet. Sin. 2015, 36, 1156–1166. (In Chinese) [Google Scholar]
  6. Deng, H.; Fan, L.M.; Xu, Q.C. Development status and prospects of multi-process reverse circulation drilling technology. Drill. Prod. Technol. 2024, 47, 60–72. (In Chinese) [Google Scholar]
  7. Fan, Y.; Zhou, J.H.; Song, Y. Innovations and practices of key technologies for deep shale gas drilling and reservoir stimulation in the Sichuan Basin. Nat. Gas Ind. 2025, 45, 167–178. (In Chinese) [Google Scholar]
  8. Liu, Y.B.; Guo, X.W.; Ji, X.N.; Dong, Z.P.; Tian, X.Y.; Wang, X.N. Research and application of reverse circulation double-wall drilling tools. Oil Field Equip. 2014, 43, 18–21. (In Chinese) [Google Scholar]
  9. Yang, G.; Ji, S.L.; Bai, L.Y.; Cao, J.F.; Zhang, G.B. Drilling technology of double-wall drill pipe and its applicability analysis. West-China Explor. Eng. 2013, 25, 80–82. (In Chinese) [Google Scholar]
  10. Wang, Z.S.; Liao, B. Analysis and calculation of circulation parameters for double-wall drill pipe reverse circulation air drilling. Drill. Prod. Technol. 2008, 31, 149. (In Chinese) [Google Scholar]
  11. Li, W.Z.; Dai, F.; Li, Z.T.; Fu, D.; Gao, D.W.; Zhang, X.L. Research and test on aerated reverse circulation drilling technology with conventional drilling tools. Drill. Prod. Technol. 2021, 44, 31–34. (In Chinese) [Google Scholar]
  12. Kang, B.; Fan, H.; Liu, J.; Wen, Z.; Deng, S.; Wang, S.; Chen, Y.; Zhou, Y.; Feng, G.; Li, Z.; et al. An efficient gas-lift MPD based on dual-channel drillpipe. In Proceedings of the IADC/SPE Asia Pacific Drilling Technology Conference and Exhibition, Bangkok, Thailand, 27–29 August 2018. [Google Scholar]
  13. Li, B.M.; Hou, S.G.; Yang, G.S.; Zhang, J.H.; Wang, H.W.; Gong, Y. Adaptability analysis of drilling parameters for gas-lift reverse circulation anti-lost drilling. Fault-Block Oil Gas Field 2016, 23, 838–841. (In Chinese) [Google Scholar]
  14. Breivik, D.H.; Rørvik, H.; Vestavik, O.M. Improving horizontal well MPD by using a dual-channel drillstring. In Proceedings of the SPE/IADC Managed Pressure Drilling and Underbalanced Operations Conference and Exhibition, Denver, CO, USA, 29–30 October 2020. [Google Scholar]
  15. Wu, X.L.; Feng, Y.Q.; Du, Y.S.; Gao, P.J.; Zhao, Y.; Wang, X.S.; Tang, X.R.; Wang, Q.X. Simulation analysis of flow field in gas-lift reverse circulation double-wall drilling tools. Drill. Eng. 2022, 49, 83–91. (In Chinese) [Google Scholar]
  16. Kong, L.; Wang, Y.; Wu, B.; Wang, Z. Simulation and experimental study on cuttings-carrying for reverse circulation horizontal directional drilling with dual drill pipes. Adv. Civ. Eng. 2019, 2019, 6262308. [Google Scholar] [CrossRef]
  17. Liu, C.; Zhu, L.; Wu, X.; Liang, J.; Li, Z. Numerical characterization of the annular flow behavior and pressure loss in deepwater drilling riser. Comput. Model. Eng. Sci. 2020, 124, 561–572. [Google Scholar] [CrossRef]
  18. Cui, G.; Cao, P.; Wang, M.; Wang, X.; Chen, D.; Qi, B. Investigation of cuttings transport in a reverse circulation drill bit during direction drilling using two-phase flow simulation. ACS Omega 2025, 10, 30295–30312. [Google Scholar] [CrossRef] [PubMed]
  19. Zhu, N.; Ding, S.-D.; Shi, X.-L.; Huang, W.-J.; Gao, D.-L. Cuttings transport: Back reaming analysis based on a coupled layering-sliding mesh method via CFD. Pet. Sci. 2023, 20, 3673–3686. [Google Scholar] [CrossRef]
  20. Epelle, E.I.; Gerogiorgis, D.I. CFD modelling and simulation of drill cuttings transport efficiency in annular bends: Effect of particle sphericity. J. Pet. Sci. Eng. 2018, 170, 992–1004. [Google Scholar] [CrossRef]
  21. Zhao, R.; Zhou, Y.; Zhang, D.; Gao, X. Numerical investigation of the hydraulic transport of coarse particles in a vertical pipe based on a fully-coupled numerical model. Int. J. Multiph. Flow 2022, 155, 104094. [Google Scholar] [CrossRef]
  22. Zhang, G.; Yang, H.; Li, J.; Liu, G.; Huang, H.; Chen, Y.; Wu, T.; Wang, W. Research on thermal behavior of ultra-deep horizontal well drilling with dual-channel drillpipe. Appl. Therm. Eng. 2023, 224, 120095. [Google Scholar] [CrossRef]
  23. Huang, L.; Liu, J.; Zhang, F.; Dontsov, E.; Damjanac, B. Exploring the influence of rock inherent heterogeneity and grain size on hydraulic fracturing using discrete element modeling. Int. J. Solids Struct. 2019, 176–177, 207–220. [Google Scholar] [CrossRef]
  24. Zhang, F.; Damjanac, B.; Maxwell, S. Investigating hydraulic fracturing complexity in naturally fractured rock masses using fully coupled multiscale numerical modeling. Rock Mech. Rock Eng. 2019, 52, 5137–5160. [Google Scholar] [CrossRef]
  25. Zhang, F.; Miska, S.; Yu, M.; Ozbayoglu, E. A unified transient solid-liquid two-phase flow model for cuttings transport- modelling part. J. Pet. Sci. Eng. 2018, 166, 146–156. [Google Scholar] [CrossRef]
  26. Wang, G.; Lv, Z.; Zhong, L.; Li, Z.; Fu, Q.; Li, Y.; He, Y.; Liu, H. Hydraulic modeling study and control algorithm design of double-layer pipe dual-gradient drilling. Geoenergy Sci. Eng. 2024, 240, 212926. [Google Scholar] [CrossRef]
  27. Wang, Q.; Zhang, F.F.; Li, X.B.; Yang, G.; Wang, Y.D.; Wang, Y.Z. A transient general solid-liquid two-phase flow model and its application in dynamic borehole cleaning simulation. Chin. J. Appl. Mech. 2021, 38, 1113–1123. (In Chinese) [Google Scholar]
  28. Li, Y.; Wang, L.; Zhao, Y.; Wang, H.; Li, S.; Jia, J. Numerical investigation of the flow characteristics of bingham fluid on a slope with corrected smooth particle hydrodynamics. Front. Environ. Sci. 2022, 10, 1060703. [Google Scholar] [CrossRef]
  29. Zhou, H.B.; Fan, H.H.; Zhai, Y.H.; Peng, Q. General generalized flow behavior index method for pressure drop calculation of non-Newtonian fluid in pipe flow. Sci. Technol. Eng. 2014, 14, 1–6. (In Chinese) [Google Scholar]
  30. Jiang, W.L. Study on the variation law of generalized flow behavior index in pipe laminar flow. Neijiang Sci. Technol. 2025, 46, 73–76+152. (In Chinese) [Google Scholar]
  31. Yao, D. Research on Transient Solid-Liquid Two-Phase Flow Model and Application of Cuttings Transport in Horizontal Wells. Ph.D. Thesis, Northeast Petroleum University, Daqing, China, 2025. Available online: https://kns.cnki.net (accessed on 12 April 2026). (In Chinese)
  32. Millheim, K.K.; Tulga, S.S. Simulation of the wellbore hydraulics while drilling, including the effects of fluid influxes and losses and pipe washouts. In Proceedings of the SPE Annual Technical Conference and Exhibition, New Orleans, LA, USA, 26–29 September 1982. [Google Scholar]
  33. Fan, H.H. Practical Drilling Fluid Mechanics; Petroleum Industry Press: Beijing, China, 2014. (In Chinese) [Google Scholar]
  34. Vestavik, O.M.; Thorogood, J.; Bourdelet, E.; Schmalhorst, B.; Roed, J.P. Horizontal drilling with dual channel drill pipe. In Proceedings of the SPE/IADC Drilling Conference and Exhibition, Fort Worth, TX, USA, 14–16 March 2017. [Google Scholar]
  35. Yu, G.M.; Huo, H.B.; Xie, T.; Song, C.; Li, J. Prediction of open-hole extension limit and analysis of influencing factors for the horizontal section of extended reach wells in Bohai Bay. Fault-Block Oil Gas Field 2023, 30, 337–346. (In Chinese) [Google Scholar]
  36. Luo, W.; Fu, J.H.; Song, K.X.; Xu, C. Research on prediction of the ultimate extension length for horizontal sections in extended reach wells. Sci. Technol. Eng. 2013, 13, 10623–10627. (In Chinese) [Google Scholar]
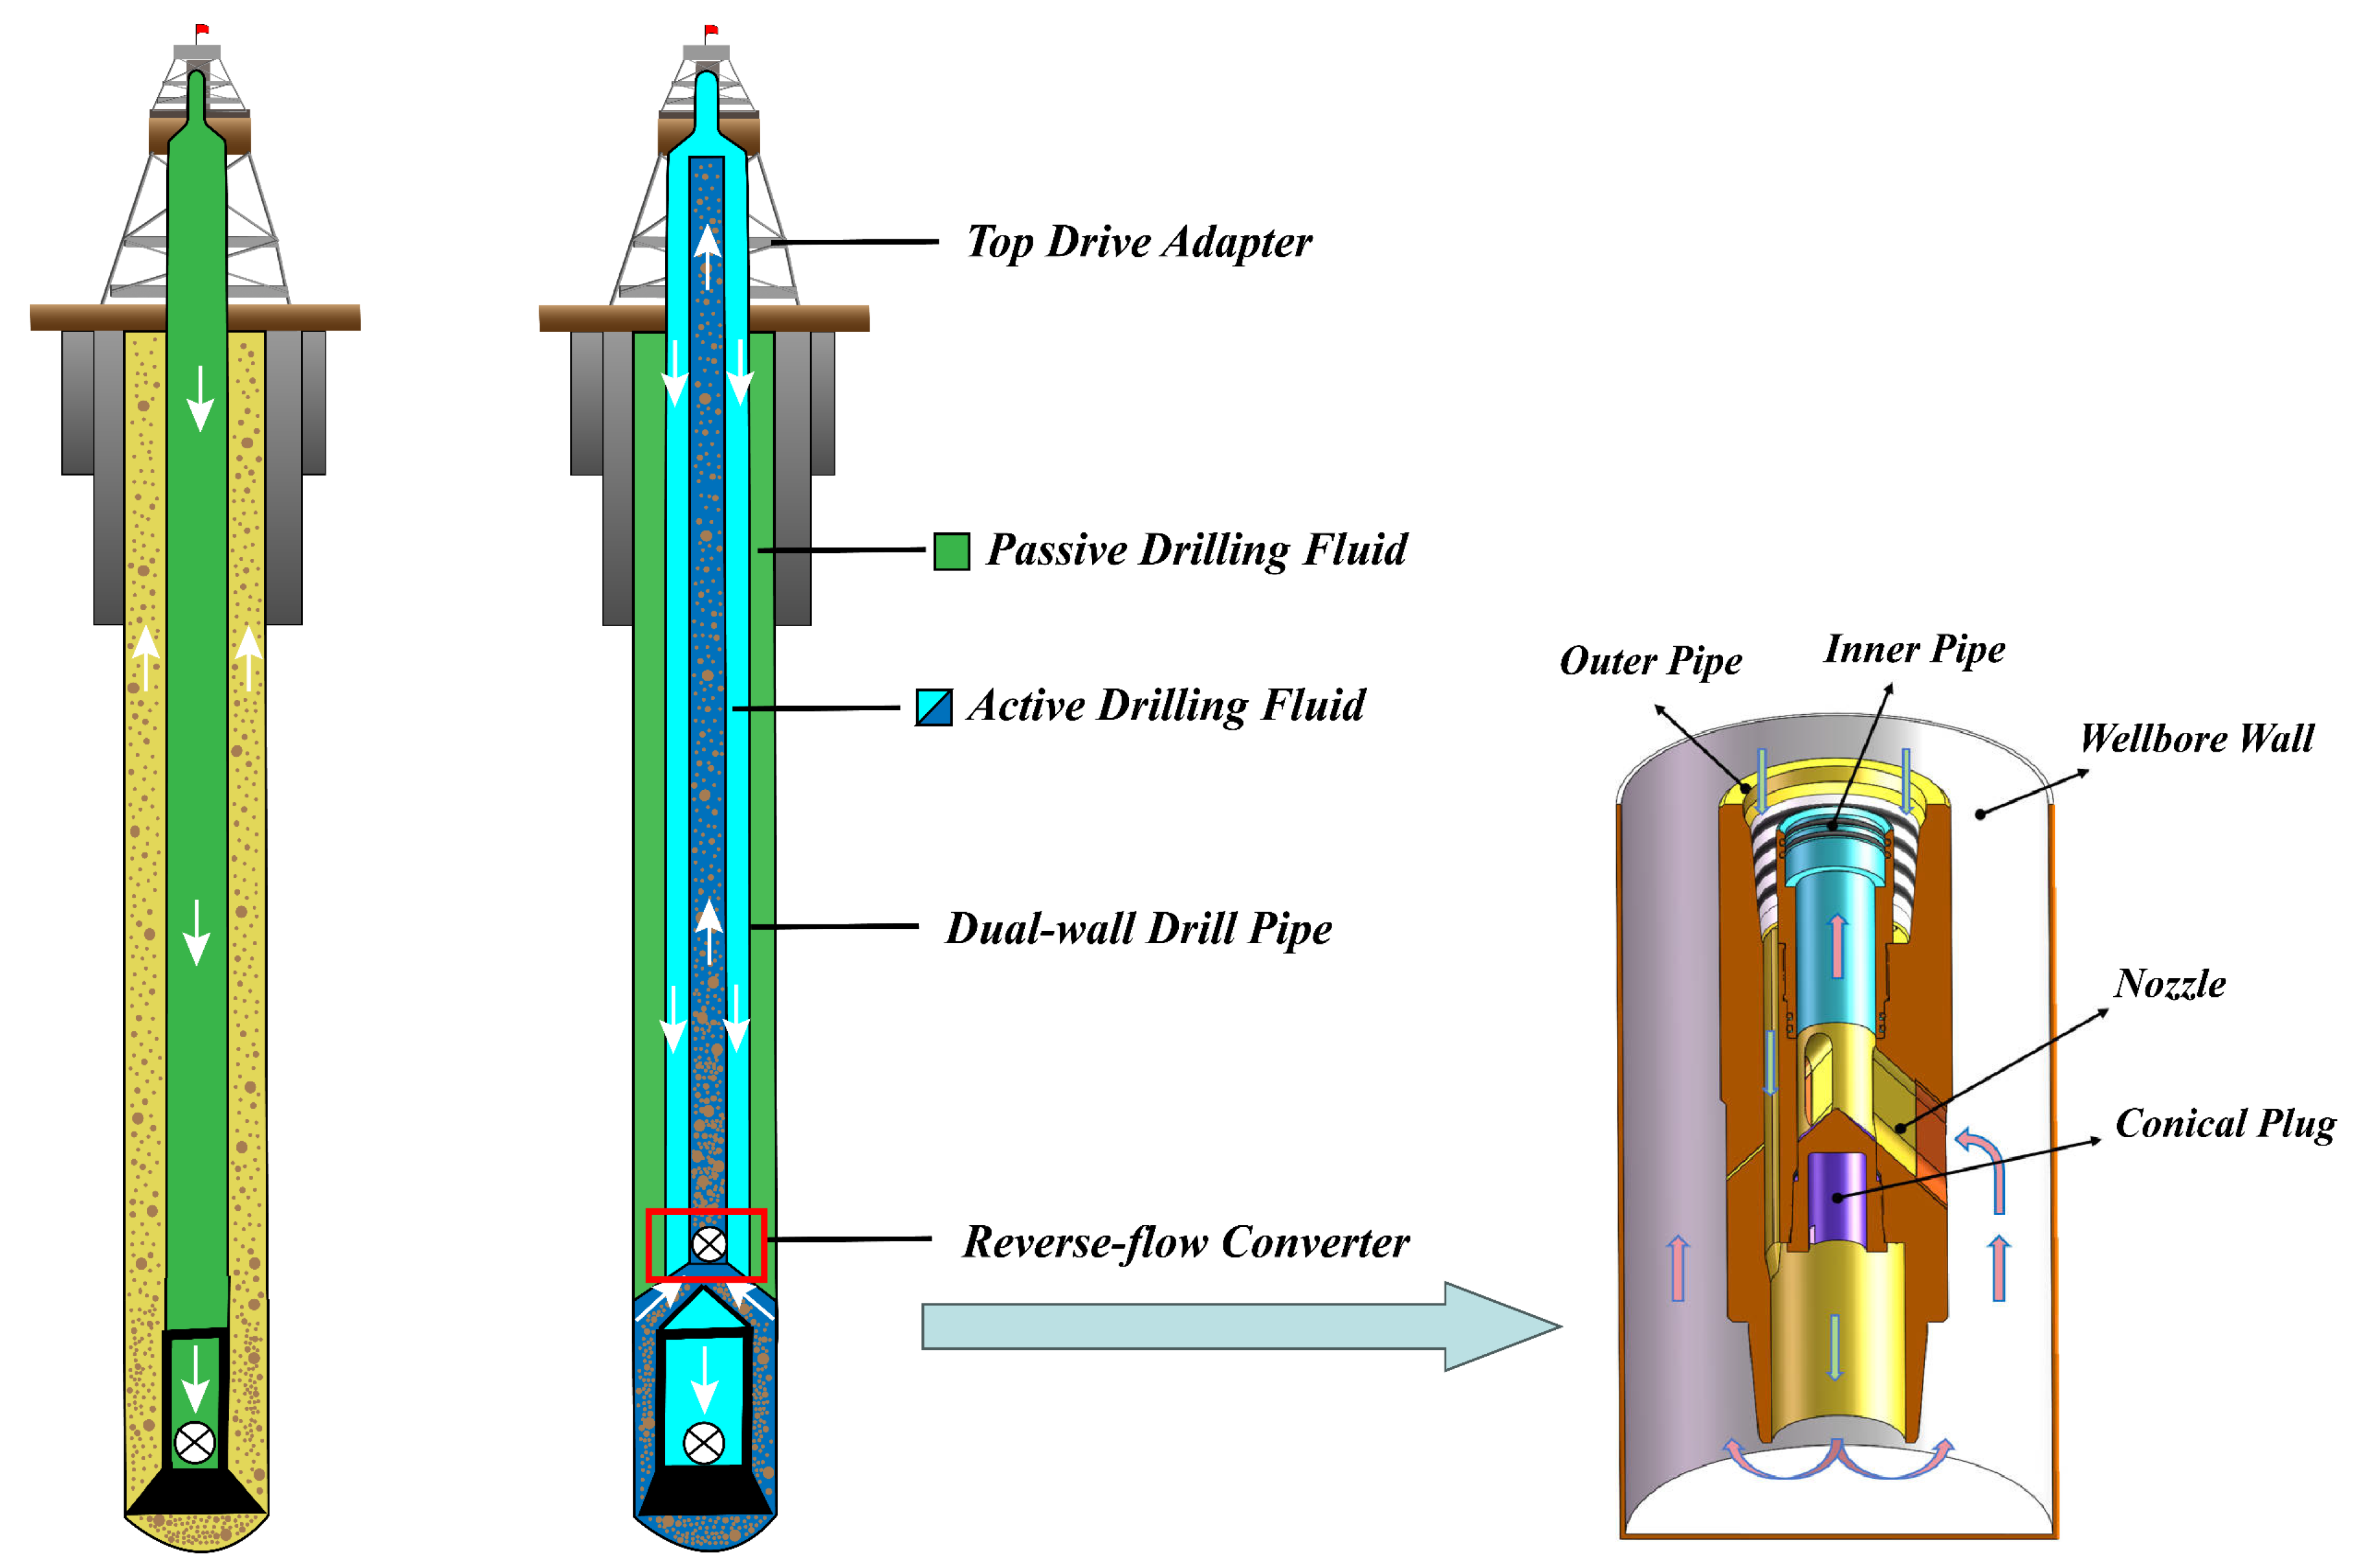
Figure 1. Working principle of double-wall drill pipe reverse circulation drilling technology.
Processes 14 01695 g001
Figure 2. Schematic of the mesh generation for the inner and outer annuli of the reverse circulation converter. (a) Fluid domain of the inner annulus. (b) Fluid domain of the outer annulus.
Processes 14 01695 g002
Figure 3. Comparison of results and error analysis.
Processes 14 01695 g003
Figure 4. Variation in formation annulus pressure with well depth.
Processes 14 01695 g004
Figure 5. Variation in formation annulus pressure with well depth.
Processes 14 01695 g005
Figure 6. Formation annulus pressure profiles of double-wall and conventional drill pipes under different parameters. (a) Flow rate. (b) Drilling fluid density. (c) Drilling fluid plastic viscosity. (d) Drilling fluid yield point.
Processes 14 01695 g006
Figure 7. Effect of well depth on wellbore pressure and circulation pressure loss. (a) Wellbore pressure profiles at different well depths. (b) Circulation pressure loss at different well depths.
Processes 14 01695 g007
Figure 8. Effect of different flow rates on wellbore pressure and circulation pressure loss. (a) Wellbore pressure profiles at different flow rates. (b) Circulation pressure loss at different flow rates.
Processes 14 01695 g008
Figure 9. Effect of different drilling fluid densities on wellbore pressure and circulation pressure loss. (a) Wellbore pressure profiles at different drilling fluid densities. (b) Circulation pressure loss at different drilling fluid densities.
Processes 14 01695 g009
Figure 10. Effect of different plastic viscosities on wellbore pressure and circulation pressure loss. (a) Wellbore pressure profiles at different plastic viscosities. (b) Circulation pressure loss at different plastic viscosities.
Processes 14 01695 g010
Figure 11. Effect of different yield points on wellbore pressure and circulation pressure loss. (a) Wellbore pressure profiles at different yield points. (b) Circulation pressure loss at different yield points.
Processes 14 01695 g011
Figure 12. Sensitivity analysis results of influencing factors.
Processes 14 01695 g012
Figure 13. Drilling pump pressure selection chart for double-wall drill pipe.
Processes 14 01695 g013
Figure 14. Flowchart of the usage procedure for double-wall drill pipe reverse circulation drilling pump pressure selection chart.
Processes 14 01695 g014
Table 1. Operational parameter settings.
Parameter NameValueUnit
Outer diameter of DWDP outer pipe168.3mm
Inner diameter of DWDP outer pipe149.92mm
Outer diameter of DWDP inner pipe95mm
Inner diameter of DWDP inner pipe81mm
Outer diameter of DWDP converter220mm
Inner pipe diameter of DWDP converter105mm
Wellbore diameter406.4mm
Flow rate20–40L/s
Active drilling fluid density1200–1400kg/m3
Rate of penetration10–50m/h
Cutting particle size1–5mm
Drilling fluid plastic viscosity0.01–0.03Pa·s
Drilling fluid yield point2–8Pa
Table 2. Drilling parameter data.
Parameter NameValueUnit
Outer diameter of non-magnetic drill collar228.6mm
Inner diameter of non-magnetic drill collar71.4mm
Wellbore diameter406.4mm
Flow rate40L/s
Active drilling fluid density1350kg/m3
Passive drilling fluid density1400kg/m3
Drilling fluid plastic viscosity0.02Pa·s
Drilling fluid yield point6Pa
Disclaimer/Publisher’s Note: The statements, opinions and data contained in all publications are solely those of the individual author(s) and contributor(s) and not of MDPI and/or the editor(s). MDPI and/or the editor(s) disclaim responsibility for any injury to people or property resulting from any ideas, methods, instructions or products referred to in the content.