1. Introduction
The current transformation of power systems is driven by the growing penetration of renewable sources, the electrification of demand, and the incorporation of new loads with highly dynamic behavior. Among these, state-of-the-art data centers are playing an increasingly significant role due to their rapid expansion, high energy intensity, and close relationship with artificial intelligence, cloud computing, and big data processing applications. Far from behaving like conventional static loads, these systems exhibit consumption profiles with rapid, random, and nonlinear variations, capable of altering the grid’s operating conditions and introducing new challenges for stability and power quality [
1,
2].
In particular, modern data centers—and especially those associated with AI loads—exhibit significant power fluctuations associated with different operating modes, such as training, inference, and idle states. These variations can occur on short time scales and generate effects on the distribution grid, such as voltage oscillations, phase imbalances, capacity constraints, and reduced operating margins. Consequently, representing them using simplified or static models is insufficient to adequately describe their interaction with the power system, especially when studying transient events and their impact on grid operation [
1,
2].
At the same time, the transition to power systems dominated by electronic power converters has increased the system’s sensitivity to short-duration disturbances and non-stationary phenomena. The increased presence of power electronics, distributed generation, and loads with high temporal variability alters the system’s dynamic response and requires analysis tools capable of simultaneously capturing the temporal and frequency evolution of disturbances. In this context, short-duration disturbances, such as sags, swells, interruptions, and transient oscillations, can no longer be addressed solely with classical approaches oriented toward stationary signals, reinforcing the need for more robust methodologies for the analysis of real dynamic events [
3].
Under these conditions, the development of dynamic and reduced-order models takes on strategic importance. In complex systems, the high dimensionality of the data and the computational complexity of full-order models hinder the analysis, simulation, and physical interpretation of transient phenomena. Order-reduction techniques, such as POD/PCA and their modern extensions, allow for the extraction of dominant dynamics from complex systems and the construction of compact representations capable of preserving essential behavior at a lower computational cost [
4,
5]. Complementarily, recent approaches to representation learning for multivariate time series have demonstrated that it is possible to obtain compact and informative latent spaces from unlabeled data, facilitating subsequent tasks of reconstruction, regression, classification, and forecasting [
3].
In this context, the research challenge lies not only in reducing the dimensionality of complex electrical signals, but also in determining whether it is possible to construct useful, physically consistent low-order models from a limited set of real transient events measured in a data center, while preserving their capacity for representation, reconstruction, and dynamic interpretation. The recent literature has made significant progress in the dynamic modelling of data centers and the development of dimensionality reduction and representation learning methods. However, there remains a paucity of evidence regarding the specific application of these methods to real, multivariate, high-resolution electrical disturbances in this type of critical infrastructure [
3,
4,
5,
6]. This study proposes a data-driven methodology for the identification, characterization and modelling of transient events in a data center, employing dimensionality reduction techniques to achieve a reduced representation. The present study focuses on an analysis and comparison of the PCA/POD, Kernel PCA, and Autoencoder approaches with a view to evaluating their ability to capture the dominant dynamics of the events, adequately reconstruct the signals, and establish a methodological foundation for future applications in the monitoring, dynamic analysis, and operation of electrical systems in critical infrastructure.
2. Methodology and Characterization
This section describes the proposed methodological framework for the characterization and modeling of transient events in data centers, based on high-resolution measurements. The approach is based on a data-driven scheme that integrates stages of acquisition, temporal segmentation, multivariate representation, and dimensionality reduction, with the aim of capturing the dominant dynamics of the system using reduced-order models. Given the highly variable and non-stationary nature of loads in modern data centers, particularly those associated with computationally intensive applications, a methodology is proposed that preserves both the temporal structure and the energy characteristics of the signals. This process enables the construction of compact and generalizable representations suitable for the analysis, comparison, and modeling of dynamic events in complex electrical systems.
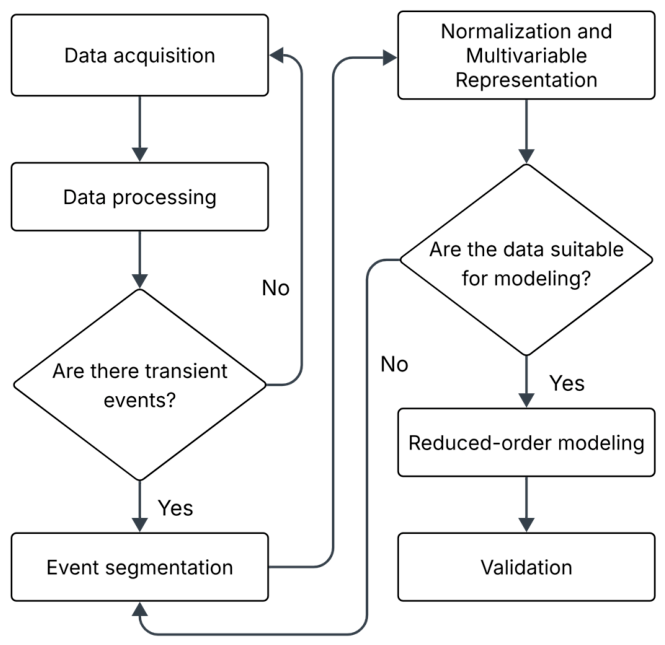
Figure 1 shows a flowchart of the methodology. All data processing, event segmentation, dimensionality reduction, model training, reconstruction, and graphical analysis were performed using Python 3.11 in Google Colab (Google LLC, Mountain View, CA, USA). The computational implementation used NumPy, pandas, scikit-learn, Matplotlib, and TensorFlow/Keras.
2.1. Event Identification and Extraction
The data used in this study come from high-resolution electrical measurements acquired at a data center, where three-phase voltage and current variables were recorded in the time domain. The signals correspond to RMS values with sufficient temporal resolution to capture short-duration transient disturbances, which is essential in environments where power quality and the system’s dynamic response are particularly relevant, as is the case in modern high-criticality infrastructures such as data centers [
7].
Based on the original dataset, a process of temporal exploration and signal analysis was carried out to identify relevant transient events. In this work, a transient event is defined as a time interval
in which at least one of the electrical variables exhibits a significant deviation from its previous steady-state regime, manifested by an abrupt change in magnitude followed by a recovery phase toward a new steady state. This definition is consistent with the general treatment of transient disturbances in power quality studies, where transients are recognized as short-duration disturbances capable of significantly altering the temporal shape of electrical signals and the behavior of connected equipment [
8].
Events were identified through a combination of visual inspection of the signals and detection of abrupt changes in their temporal behavior, primarily associated with rapid variations in amplitude. This approach allowed for the capture of real disturbances present in the system without imposing restrictive assumptions regarding their shape, duration, or temporal location. The adoption of this criterion is appropriate in real-world operating scenarios, where transients do not necessarily follow idealized patterns and may exhibit heterogeneous behavior in terms of amplitude, duration, and recovery dynamics [
8].
Based on this procedure, eight representative events were selected that simultaneously meet the following conditions: (i) the presence of a clearly identifiable disturbance in at least one of the current or voltage variables; (ii) the existence of a sufficiently defined preceding steady-state regime; (iii) evidence of a dynamic transition followed by a recovery phase; and (iv) adequate data quality, without discontinuities or loss of information within the analyzed window.
The event selection process was not intended to construct a statistically exhaustive dataset, but rather to obtain a representative set of disturbances with sufficient signal quality and clearly identifiable transient dynamics for methodological evaluation. Although the identification procedure included visual inspection, the selection criteria were consistently applied across the dataset and prioritized events exhibiting complete transient evolution, including pre-disturbance, transition, and recovery stages. Consequently, the analyzed dataset should be interpreted as a structured case-study subset rather than as a statistically unbiased sample of all possible disturbances occurring in the infrastructure.
For each identified event, a time window for analysis was defined, consisting of three stages: a preceding interval associated with the initial steady state, a transition interval during which the disturbance occurs, and a subsequent interval corresponding to the system’s recovery. The windows were extracted directly from the original dataset and stored as independent subsets, preserving the multivariate structure of three-phase voltages and currents. Additionally, each event was plotted on a relative time axis to facilitate direct comparison between events with different time scales.
Table 1 summarizes the eight selected events and their main temporal and qualitative characteristics. In general, it is observed that most cases correspond to sags dominated by the current variable, although with differences in the shape of the transition and in the recovery dynamics. In particular, event E4 exhibits a simultaneous impact on both current and voltage, making it a particularly representative case for subsequent analysis.
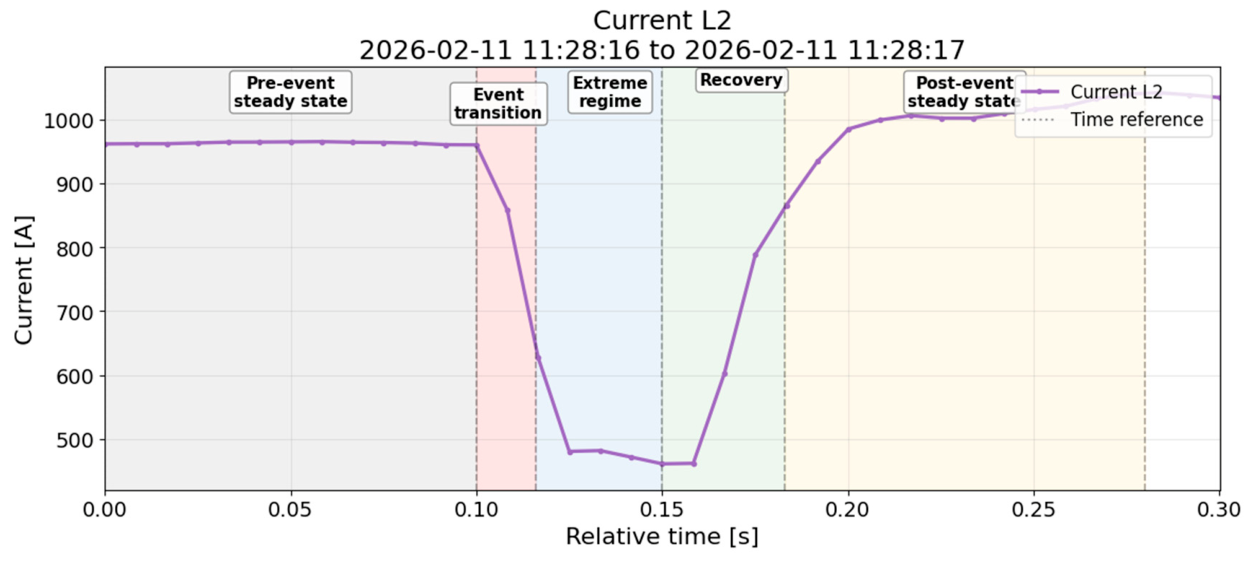
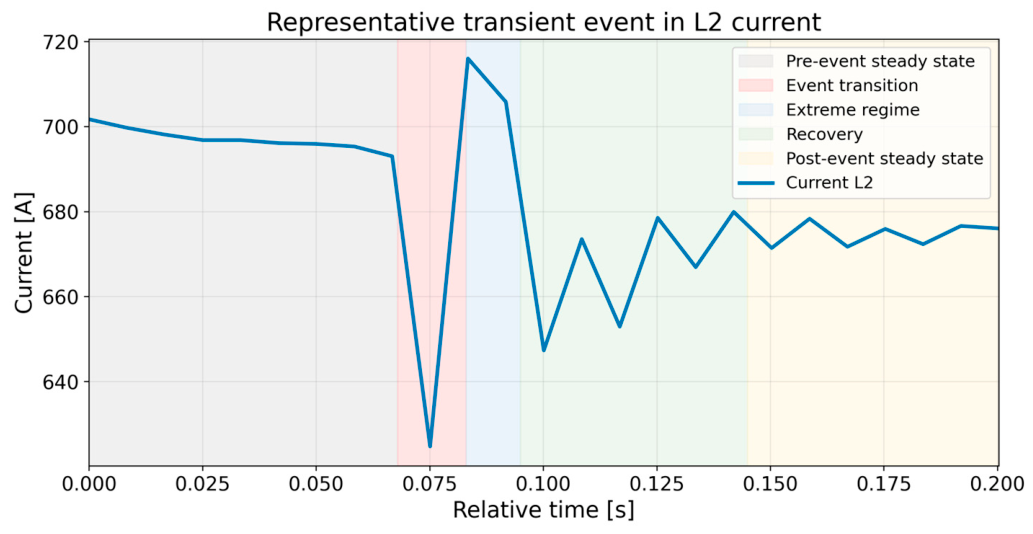
Figure 2 and
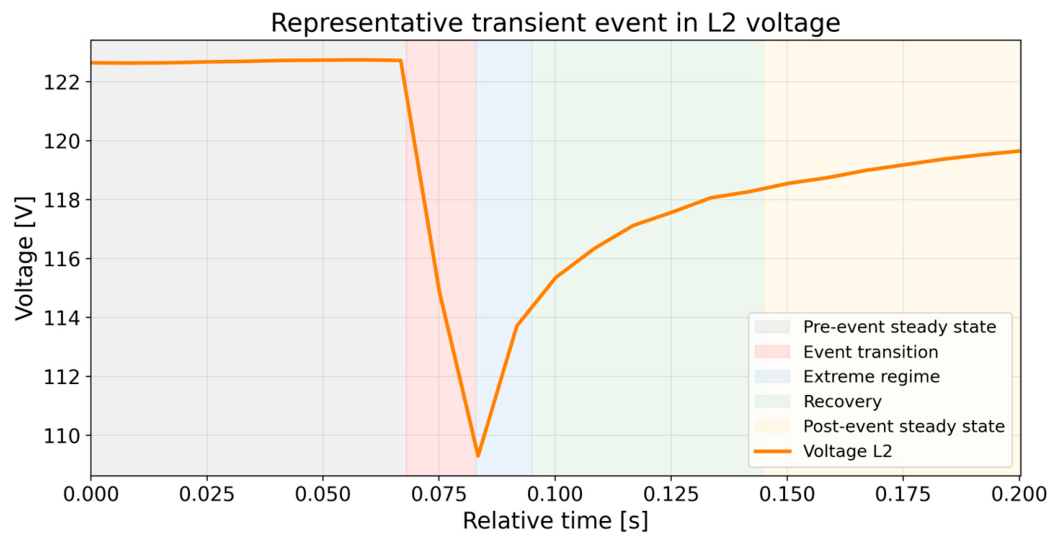
Figure 3 show precisely this representative event for the L2 phase. In
Figure 2, corresponding to the current, an approximately steady-state pre-event regime can be distinguished, followed by an abrupt drop and a damped oscillatory recovery until a new stable behavior is reached. In
Figure 3, corresponding to the voltage, a similar temporal structure is observed: a stable initial state, a pronounced drop during the disturbance, and a phase of progressive recovery. These two representations clearly illustrate the segmentation logic adopted in this work and justify the temporal decomposition used for the subsequent analysis.
This procedure allowed us to construct a structured dataset consisting of eight transient events, which form the basis for the dimensionality reduction analysis and the development of reduced-order dynamic models presented in the following sections. It is important to note that, due to the operational nature of the system under study, the analyzed events correspond to actual uncontrolled disturbances. Although this introduces variability in duration and magnitude, it also provides a study context that is more representative of actual operating conditions, which is particularly valuable when evaluating the generalization capability of the proposed models.
2.2. Preprocessing
To ensure comparability among the identified events and facilitate subsequent analysis, a structured process of preprocessing and temporal segmentation of the signals was carried out. This type of processing is fundamental in the analysis of electrical time series, where variability in scale, duration, and operating conditions can significantly affect the interpretation of events [
9,
10].
First, a relative time axis was defined for each event, using the initial instant of the analysis window as a reference. In this way, each signal was re-expressed as , where , which allows for the comparison of events occurring at different absolute instants and facilitates the joint analysis of their temporal dynamics.
Subsequently, each event was divided into different dynamic stages based on the temporal behavior of the signal. Five main regions were defined: pre-steady state, event transition, extreme state (minimum or maximum), recovery, and post-steady state. This segmentation addresses the need to characterize the temporal evolution of disturbances in a structured manner, in line with approaches used in the analysis of power quality events, where the identification of duration and amplitude is key to their characterization [
10].
It is important to note that, due to the inherent variability of real disturbances, not all stages are clearly distinguishable in every event. In particular, some phases may overlap or be compressed in time, making it difficult to explicitly delineate them. This behavior is consistent with observations reported in real power quality events, where the duration and shape of transients can vary significantly depending on system conditions [
10].
These stages were identified automatically by analyzing discrete derivatives of the signal and applying adaptive thresholds. In particular, significant changes in the slope were identified using Equation (1):
which allowed the detection of the start and end points of each dynamic stage. This approach is consistent with methodologies based on the detection of abrupt changes in time signals, widely used in the analysis of electrical transients using thresholds and magnitude variations [
10].
Additionally, the signals were normalized with respect to their average value in the preceding steady-state regime, according to Equation (2):
where
corresponds to the average value of the signal in the interval prior to the event. This process allows for highlighting relative variations and reducing the influence of scale differences between events, which is a standard practice in time series processing to ensure consistency in the analysis and in subsequent stages such as dimensionality reduction [
9]. Similarly, in power quality studies, normalization to per-unit (pu) values is widely used to compare transient amplitudes under different operating conditions [
10].
This procedure transforms the original data into structured and comparable representations, where each event is described as a time sequence segmented into homogeneous dynamic stages. This representation forms the basis for the dimensionality reduction and aggregate modeling processes developed in the subsequent sections.
Figure 2 and
Figure 3 illustrate the temporal segmentation process applied to current and voltage signals, respectively, showing the dynamic stages identified by the automatic procedure described.
2.3. Segmentation of the Event into Stages
The temporal segmentation introduced in the previous section is formalized by defining five dynamic stages: pre-event, transition, extreme, recovery, and post-event. Each of these stages corresponds to a subset of the relative time domain τ.
The detection of these stages is based on the analysis of the temporal variation in the signal x(τ), using criteria derived from the magnitude of the slope and relative changes with respect to the reference value prior to the event. In particular, adaptive thresholds on the discrete derivative are used to identify abrupt transitions, while stationary regions are determined based on conditions of low variability in the signal [
11].
Due to the nature of the analyzed disturbances, this partition is not strictly uniform across events. Some stages may be reduced to very short intervals or may not even be clearly distinguishable, implying that the segmentation should be interpreted as a structured approximation of the observed dynamics.
Beyond its descriptive nature, this segmentation defines a common temporal reference frame that allows for the alignment and comparison of events with different durations and dynamic shapes. In particular, it facilitates the construction of aggregated representations where each event can be analyzed in terms of its relative evolution within each stage, which is fundamental for the dimensionality reduction and dynamic modeling processes developed subsequently.
Quantitative Segmentation Criteria
In order to improve the reproducibility of the segmentation procedure, quantitative criteria were defined for the identification and validation of transient events. The detection of abrupt transitions was based on the discrete derivative of the signal and adaptive thresholds derived from the statistical properties of each event window.
The adaptive threshold used for transient detection was defined according to Equation (3):
where
is the adaptive threshold,
is the mean value of the discrete derivative,
is its standard deviation, and
is a scaling factor used to adjust the sensitivity of the detection process. In this work, a value of
was adopted empirically to provide a balance between sensitivity to transient variations and robustness against measurement noise.
A sample was considered part of the transient region when the condition where represents the discrete derivative of the signal at sample i.
In addition to the derivative-based detection, complementary criteria related to signal continuity, minimum duration, recovery visibility, and steady-state stability were incorporated to ensure the quality and consistency of the selected events.
Table 2 summarizes the quantitative criteria adopted in this work.
The complete segmentation logic is summarized in Algorithm 1, which describes the sequential procedure used for event identification and stage definition.
| Algorithm 1. Event segmentation and validation procedure |
1. Compute the discrete derivative Δx(i) of the signal.
2. Estimate the adaptive threshold:
3. Detect samples satisfying:
4. Define the transient interval around detected transitions.
5. Identify:
- pre-event steady state,
- transition region,
- recovery stage,
- post-event regime.
6. Validate the event according to:
- minimum duration,
- signal continuity,
- visible recovery,
- stable pre-event behavior.
|
2.4. Normalization and Multivariate Representation of Events
To enable comparison between events of different magnitudes and durations, normalized representations were defined in both the time and amplitude domains, as well as a unified multivariate structure for each event.
In the time domain, each event is expressed in terms of a relative time axis τ, defined relative to the start of the analysis window. This allows events occurring at different absolute times to be aligned and facilitates their joint analysis.
In terms of amplitude, the signals were normalized with respect to their average value in the pre-event regime, thus obtaining dimensionless representations that highlight the relative variations induced by the disturbance.
Following this preprocessing, each event is represented as a set of multivariable signals that include three-phase voltages and currents. This information is organized in matrix form as , where n corresponds to the number of time samples and m to the number of variables considered (voltages and currents in the three phases). This representation allows us to capture both the temporal evolution and the correlations among the system’s variables.
Under this formulation, the modeling problem is framed as the identification of low-dimensional structures capable of describing the dynamics of transient events based on the matrix .
There are different approaches to addressing this problem, which differ in their ability to capture spatial correlations, temporal dynamics, and structures embedded in the data. The following subsections present the methods considered in this work, as well as the criteria used for their comparison and selection.
2.5. Selection and Comparison of Dimensionality Reduction Methods
Dimensionality reduction is a fundamental step in constructing reduced-order dynamic models of complex electrical systems, especially when working with high-resolution data from measurements such as microPMUs. In this context, the selection of an appropriate method must consider not only the reduction capacity but also the preservation of the system’s relevant dynamics, including transient behaviors, dominant modes, and possible nonlinear relationships between variables.
Various techniques have been developed in the literature for order reduction in power systems. In particular, singular perturbation-based methods allow systems to be reduced by distinguishing between fast and slow dynamics, while preserving key transient characteristics of the system [
12]. On the other hand, approaches based on the Koopman operator allow nonlinear systems to be represented in low-dimensional spaces via spectral decomposition, capturing dominant dynamics without the need for explicit linearization [
13].
In the frequency domain, adaptive parametric reduction methods, such as those proposed for multi-converter systems, allow for the construction of reduced models that preserve oscillatory stability characteristics, although their performance depends on the quality of the frequency approximation and the selection of interpolation points [
14]. Likewise, classical order-reduction approaches in electrical systems, such as those used in small-signal stability analysis in systems with distributed generation, employ projection and truncation techniques that seek to preserve structural properties of the system, although they may have limitations when dealing with highly nonlinear dynamics or dynamics dependent on the operating point [
15].
Within this context, methods based on singular value decomposition (SVD) have proven particularly effective for identifying dominant structures in dynamic systems. In particular, the use of Hankel matrices combined with SVD allows for the incorporation of temporal information through embedding techniques, facilitating the capture of dynamic patterns in the data.
On the other hand, approaches based on Principal Component Analysis (PCA) or Proper Orthogonal Decomposition (POD) offer an optimal representation in terms of signal energy, allowing the most representative modes of the system to be identified efficiently. This type of approach is particularly well-suited for data-driven scenarios, such as the analysis of transient events in data centers.
Additionally, in the context of data analysis and machine learning, nonlinear dimensionality reduction methods have emerged that allow for the capture of more complex relationships between variables. In particular, Kernel PCA extends the classical PCA approach by using kernel functions, which allows for the representation of nonlinear structures in higher-dimensional transformed spaces. Complementarily, autoencoders, based on neural networks, allow for the learning of compact latent representations directly from the data, implicitly integrating both linear and nonlinear relationships.
Based on these criteria,
Table 3 presents a comparison of the main dimensionality reduction methods applicable to the dynamic modeling of power grids in data centers, including both classical approaches and modern data-driven techniques [
16,
17,
18,
19].
Based on this comparison, the approaches based on PCA/POD, Kernel PCA, and autoencoders are selected as the primary analysis methods. This selection is driven by their ability to efficiently represent event dynamics in a data-driven context without requiring explicit physical models of the system.
The PCA/POD method is used as a baseline due to its energy-optimality, robustness, and interpretability. Kernel PCA is incorporated as a nonlinear extension that allows for capturing more complex relationships between variables, while the autoencoder introduces a learning-based approach that enables flexible and adaptive latent representations.
Additionally, the Hankel matrix method with singular value decomposition (Hankel–SVD) is considered as a reference for analyzing the temporal structure of the data. However, its performance in terms of reconstruction is evaluated comparatively against the selected methods.
Together, this selection allows for the analysis of event dynamics from different perspectives—linear, nonlinear kernel-based, and nonlinear learning-based—providing a comprehensive framework for evaluating dimensionality reduction in complex electrical systems.
2.6. Kernel PCA Method
Kernel-based Principal Component Analysis (Kernel PCA, KPCA) constitutes a nonlinear extension of the traditional PCA method, designed to capture complex structures in data that cannot be adequately represented by linear combinations of the original variables. While conventional PCA projects the data onto a lower-dimensional linear subspace by maximizing variance, Kernel PCA performs an implicit projection onto a higher-dimensional feature space, where nonlinear relationships can be represented as linear structures [
20].
This approach is based on the application of the so-called kernel trick, which avoids the explicit calculation of the nonlinear transformation. Instead, a similarity matrix (kernel matrix) is constructed from a kernel function defined over the original data. Among the most commonly used kernel functions are the Gaussian (RBF), polynomial, and sigmoid kernels, the selection of which depends on the nature of the data and the type of nonlinearity present in the system.
Once the kernel matrix is constructed, the dimensionality reduction problem is reformulated as a spectral decomposition in the feature space, analogous to classical PCA. In this way, the obtained eigenvalues and eigenvectors allow for the identification of the principal directions of nonlinear variability in the data, generating a low-dimensional representation that preserves complex relationships between the variables.
In the context of electrical systems and multivariate signal analysis, the use of Kernel PCA is particularly relevant due to the presence of inherently nonlinear phenomena, such as transient events, couplings between electrical variables, and dynamics dependent on the operating point. Recent studies have shown that, although PCA is effective for extracting dominant features, its ability to capture nonlinear patterns is limited, which motivates the use of extensions such as Kernel PCA to improve the representation of the data.
In particular, the work presented in [
20] demonstrates the usefulness of dimensionality reduction techniques in processing complex data from dynamic systems, highlighting the need for methods capable of capturing nonlinear relationships when analyzing behavioral patterns in multivariate signals. Although that study uses PCA as its primary tool, its results highlight the limitations of the linear approach, which supports the incorporation of Kernel PCA as a more robust alternative for this type of application.
In this work, Kernel PCA is used as a complementary technique to PCA/POD with the aim of evaluating the ability of nonlinear methods to represent transient events in data centers. Its performance is analyzed in terms of the number of components required for reconstruction and the associated error, allowing for direct comparisons with linear and deep learning-based approaches. However, it is acknowledged that this method may have higher computational requirements and significant sensitivity to the selection of the kernel function and its parameters, which directly influences the quality of the representation obtained.
In this work, Kernel PCA was implemented in Python 3.11 using the KernelPCA module from scikit-learn, with a Gaussian radial basis function (RBF) kernel due to its suitability for representing smooth nonlinear relationships in multivariate electrical signals. The kernel width parameter γ was selected empirically through exploratory analysis, seeking a balance between reconstruction quality and numerical stability across the analyzed events.
The dimensionality of the reduced space was selected consistently with the PCA/POD-based approach, using the minimum number of components required to preserve approximately 95% of the cumulative variance in the transformed feature space.
For signal reconstruction, an approximate preimage reconstruction strategy based on inverse transformation methods available in the scikit-learn implementation framework was employed. Although Kernel PCA does not provide an exact analytical inverse mapping, the adopted approximation allowed the reconstruction of the dominant temporal structure of the transient events with satisfactory accuracy.
2.7. Autoencoder-Based Method
Autoencoders constitute a class of deep learning models designed for dimensionality reduction and feature extraction from high-dimensional data. Unlike linear methods such as PCA/POD, autoencoders allow for the modeling of complex nonlinear relationships using artificial neural networks, making them particularly well-suited for the analysis of dynamic systems with transient behaviors and nonlinear couplings.
A typical autoencoder consists of two main blocks: an encoder and a decoder. The encoder transforms the input data into a low-dimensional representation, known as the latent space, while the decoder reconstructs the original signal from that representation. The model is trained by minimizing the reconstruction error between the input and the output, which allows the latent space to capture the most relevant features of the data.
From a mathematical perspective, this process can be interpreted as a nonlinear generalization of PCA, where the projection and reconstruction are not restricted to linear transformations. Consequently, autoencoders have the ability to represent complex dynamics that cannot be adequately captured using traditional dimensionality reduction methods.
In the context of signal analysis and physical systems, various studies have demonstrated the effectiveness of autoencoders for extracting relevant patterns in multivariate data. In particular, the work presented in [
21,
22] highlights the use of deep learning-based architectures for the processing and analysis of signals from sensory systems, demonstrating their ability to identify latent structures in complex data. Complementarily, bio-inspired and deep learning approaches are explored for the efficient representation of information in dynamic systems, highlighting the potential of autoencoders in data compression and reconstruction tasks.
Applied to the case study of this work, the use of autoencoders allows for the evaluation of the ability of neural network-based models to capture the dynamics of transient events in data centers. In particular, a fully connected architecture is employed, where the size of the latent space is selected to be comparable to the number of modes used in PCA/POD and Kernel PCA methods, in order to establish a fair comparison between approaches.
The results obtained allow for an analysis of the autoencoder’s performance in terms of reconstruction error and cross-event generalization capability. While this type of model offers significant advantages in representing nonlinearities, it also presents challenges associated with the training process, such as hyperparameter selection, the need for greater computational capacity, and the potential loss of physical interpretability of the latent variables.
In this regard, the use of autoencoders in this work is proposed as a complementary tool to classical dimensionality reduction methods, allowing for the exploration of the trade-off between representational capacity, interpretability, and computational efficiency in the modeling of transient events in complex electrical systems. The autoencoder model was implemented in Python 3.11 using TensorFlow/Keras.
The autoencoder architecture employed in this work corresponds to a fully connected feedforward neural network composed of an encoder, a latent space, and a symmetric decoder structure. Rectified Linear Unit (ReLU) activation functions were used in the hidden layers, while a linear activation function was employed in the output layer to preserve the continuous nature of the electrical signals.
The latent space dimension was selected to be comparable to the number of dominant modes retained in the PCA/POD and Kernel PCA approaches, enabling a consistent comparison among methods. The network was trained using the mean squared reconstruction error as the loss function and the Adam optimization algorithm.
To reduce overfitting under limited-data conditions, a simple architecture with moderate depth was adopted, avoiding excessively large networks. Training was performed for a fixed number of epochs with normalized input signals, using the same preprocessing procedure applied to the other dimensionality reduction methods.
2.8. PCA/POD-Based Method
Principal Component Analysis (PCA) is used as the reference method for dimensionality reduction, equivalent to Eigenorthogonal Decomposition (POD) in the context of dynamic systems. This approach allows for the identification of dominant directions of variability in the data, providing a reduced-order representation based on linear combinations of the original variables [
23]. The PCA/POD implementation was performed in Python 3.11 using NumPy and scikit-learn.
Starting from the multivariate data matrix
, where each row represents a time instant and each column a measured variable, a centering process with respect to the mean is performed first. Subsequently, singular value decomposition is applied. Dimensionality reduction is performed by projecting the original data onto a subset of dominant modes, selected based on accumulated energy. Analogous to the Hankel-based method, a retention threshold of 95% of the total energy is defined to determine the optimal number of components [
24].
This method provides a compact representation of the system and is particularly efficient for data compression and the identification of global variation patterns. However, since it operates directly on the original data matrix, PCA/POD does not explicitly incorporate the temporal structure of the signals, which may limit its ability to capture short-lived transient dynamics.
In the context of this work, PCA/POD is applied to the multivariate representation of events, taking into account the available electrical signals simultaneously. The results will be compared with those obtained using the Hankel matrix-based approach and dynamic methods, in order to evaluate their performance in terms of reconstruction capability, compressibility, and representation of the system’s dynamics [
25].
2.9. Formulation of the Common Reduced Model
In order to establish a uniform basis for comparison among the dimensionality reduction methods considered in this work, a common reduced model is defined based on a low-dimensional latent coordinate representation. This formulation allows each transient event to be described using a reduced set of internal variables that preserve the dominant information contained in the original multivariate representation, thereby facilitating the comparison between linear, nonlinear, and learning-based approaches.
Let X be the data matrix of the event, previously preprocessed, normalized, and organized in multivariate form. Depending on the method considered, this matrix may correspond directly to the multivariate representation of the event, as in PCA/POD, or to implicit transformations into higher-dimensional spaces, as in Kernel PCA, or even to latent representations learned via neural networks, as in the case of autoencoders. Complementarily, the Hankel matrix-based approach is included as a reference, which introduces a temporal embedding structure onto the data. In all cases, the objective is to identify a reduced basis capable of capturing the dominant structure of the system from a limited number of components. This idea is consistent with modern order-reduction approaches, in which a high-dimensional system is approximated by a compact structure that preserves its most relevant features [
26,
27].
Under this formulation, the reduced model is expressed as the projection of the original data onto an r-dimensional subspace, where r is significantly smaller than the dimension of the original space. In the case of PCA/POD, this projection is performed onto an orthogonal basis that maximizes the explained variance; in Kernel PCA, the projection is carried out in a nonlinear feature space defined by a kernel function; whereas, in autoencoders, the reduced representation corresponds to the latent space learned by the neural network. In all cases, the reduced coordinates describe the evolution of the event within that subspace, transforming the modeling problem into the characterization of the dynamics in a lower-dimensional space. This principle is consistent with recent formulations in which the reduced representation is constructed as a combination of dominant components that preserve the essential structure of the data [
26].
From this representation, the reconstruction of the event is obtained via the inverse projection from the reduced space back to the original space. In linear methods, this reconstruction is performed directly using the modal basis; in Kernel PCA, through preimage approximations; and in autoencoders, via the trained decoder. Consequently, both compressibility and reconstruction fidelity can be evaluated within a common framework, regardless of the nature of the method used. This unified formulation allows for a direct comparison of the performance of different approaches in terms of reconstruction error, the number of components required, and the ability to preserve the dominant structure of the event. In this sense, the use of a common reduced space prevents the comparison from depending on implementation details and focuses the analysis on the effective representational capacity of each method [
27].
From a comparative perspective, the methods considered differ in the type of structure they prioritize. PCA/POD emphasizes capturing the global energy of the signal through optimal linear combinations; Kernel PCA extends this capability by allowing the representation of nonlinear relationships in the data; while autoencoders offer an even more flexible approach by learning latent representations from neural architectures. For its part, the Hankel matrix-based approach explicitly incorporates the temporal dimension through the use of delays, favoring the preservation of the system’s internal dynamic dependencies. This distinction is consistent with recent work in which the construction of reduced representations depends on how the dominant features of the measured data are integrated, transformed, or learned [
27,
28].
Under this framework, the common reduced-order model adopted in this work does not impose a specific parametric dynamics, but rather defines a general projection and reconstruction structure over a low-dimensional subspace. This approach is particularly well-suited for the analysis of transient events in data centers, where real-world, short-duration measurements with variability between events are available, but not necessarily a detailed physical model of the system. Furthermore, this formulation allows for the natural integration of evaluation criteria such as reconstruction error, retained energy, and the ability to generalize across events. The value of constructing unified reduced-representation frameworks from data and evaluating them using consistent metrics has been highlighted in recent studies focused on both matrix decomposition and the integration of multiscale features [
26,
28].
Consequently, for the purposes of this work, the common reduced model is understood as the representation of each event in a latent space defined by a reduced set of dominant components, from which it is possible to reconstruct an approximation of the original event and quantify the information loss associated with the reduction. This formulation will serve as the basis for the methodological comparison developed in the Results section, in which the PCA/POD, Kernel PCA, and Autoencoder methods are analyzed as the main approaches, while maintaining the Hankel matrix-based method as a structural reference within the analysis.
2.10. Comparison of PCA/POD, Kernel PCA, and Autoencoders for the Representation of Transient Dynamics
In order to establish a comparative framework among the dimensionality reduction approaches considered in this work, we analyze the conceptual and operational differences between the PCA/POD-based method, its nonlinear extension via Kernel PCA, and the autoencoder-based approach, particularly in the context of multivariate signals associated with transient events.
The PCA/POD method is based on identifying directions of maximum variance within the data space, which allows for a compact representation through linear combinations of the original variables. This approach has been widely used in time series analysis, primarily as a preprocessing step for prediction and classification tasks, where it helps improve computational efficiency and the generalization ability of models [
29]. However, its linear formulation implies that the representation of dynamics is limited to linear relationships between variables, which can restrict its ability to capture complex behaviors present in transient events.
As an extension of this approach, Kernel PCA introduces an implicit transformation into a higher-dimensional feature space using kernel functions, allowing for the representation of nonlinear relationships in the data. This property is particularly relevant in the analysis of electrical systems, where interactions between variables can exhibit highly nonlinear behavior, particularly during disturbances and transients. In this sense, Kernel PCA maintains the conceptual structure of PCA but expands its representational capacity by incorporating nonlinearities, making it an intermediate tool between classical linear methods and deep learning-based approaches.
Autoencoders, on the other hand, constitute a fully data-driven approach based on neural networks, capable of learning latent representations directly from the data through a process of optimization. Unlike PCA/POD and Kernel PCA, where the projection is defined by an explicit mathematical basis, in autoencoders the transformation is learned through an optimization process that minimizes the reconstruction error. This allows them to capture highly complex and nonlinear structures, flexibly adapting to the dynamics of the data. In recent applications, these types of models have demonstrated high performance in tasks such as compression, feature extraction, and signal reconstruction in dynamic systems [
30].
From a comparative perspective, a fundamental difference between the methods lies in the type of structure each is capable of representing. While PCA/POD maximizes the global variance of the data and provides an optimal solution in terms of energy under linear assumptions, Kernel PCA allows for the capture of nonlinear structures through the use of kernel functions, and autoencoders offer an even more flexible representation by modeling complex relationships through neural architectures. Consequently, there is a trade-off between interpretability, computational complexity, and representational capacity: PCA/POD is highly interpretable and efficient, Kernel PCA introduces greater nonlinear modeling capacity at the cost of greater parameter dependence, and autoencoders offer the greatest flexibility, albeit with lower physical interpretability and greater training requirements.
Additionally, recent studies have shown that the choice of dimensionality reduction method has a significant impact on the preservation of relevant information and on the performance of subsequent models, especially in multivariate time series contexts. In this regard, linear techniques such as PCA are effective when the data exhibit simple dominant structures, but may require nonlinear extensions or learning-based approaches when the dynamics are highly complex or context-dependent [
31].
In the specific context of this work, the three approaches will be evaluated under a single methodological framework, considering their ability to represent transient events in data center electrical systems. The comparison is conducted in terms of compressibility, reconstruction error, and the ability to capture the dominant dynamics of the events, with the aim of identifying the advantages and limitations of each method and supporting the selection of the most appropriate reduced model for characterizing the system.
Table 4 presents the advantages and limitations of the methods discussed.
3. Results
This section presents the results obtained from the analysis of transient events identified in the data center’s electrical system, as well as the evaluation of the dimensionality reduction methods considered in this work. First, the set of selected events is described, and their common temporal structure is analyzed, highlighting shared dynamic patterns. Subsequently, the results of the low-dimensionality analysis are presented, including the identification of dominant modes and their energy contribution.
Based on this, the ability of the PCA/POD, Kernel PCA, and Autoencoder methods to represent and reconstruct the events is evaluated, considering metrics related to compressibility, reconstruction error, and the preservation of temporal dynamics. These approaches allow for the comparison of linear and nonlinear representations, as well as the analysis of the trade-off between model simplicity, fitting ability, and robustness against event variability.
Finally, a comparison is made between the methods in terms of consistency across events, variability in reconstruction, and generalization ability, in order to identify their main advantages and limitations in the context of aggregate modeling of transient events in data centers.
3.1. Set of Identified Events
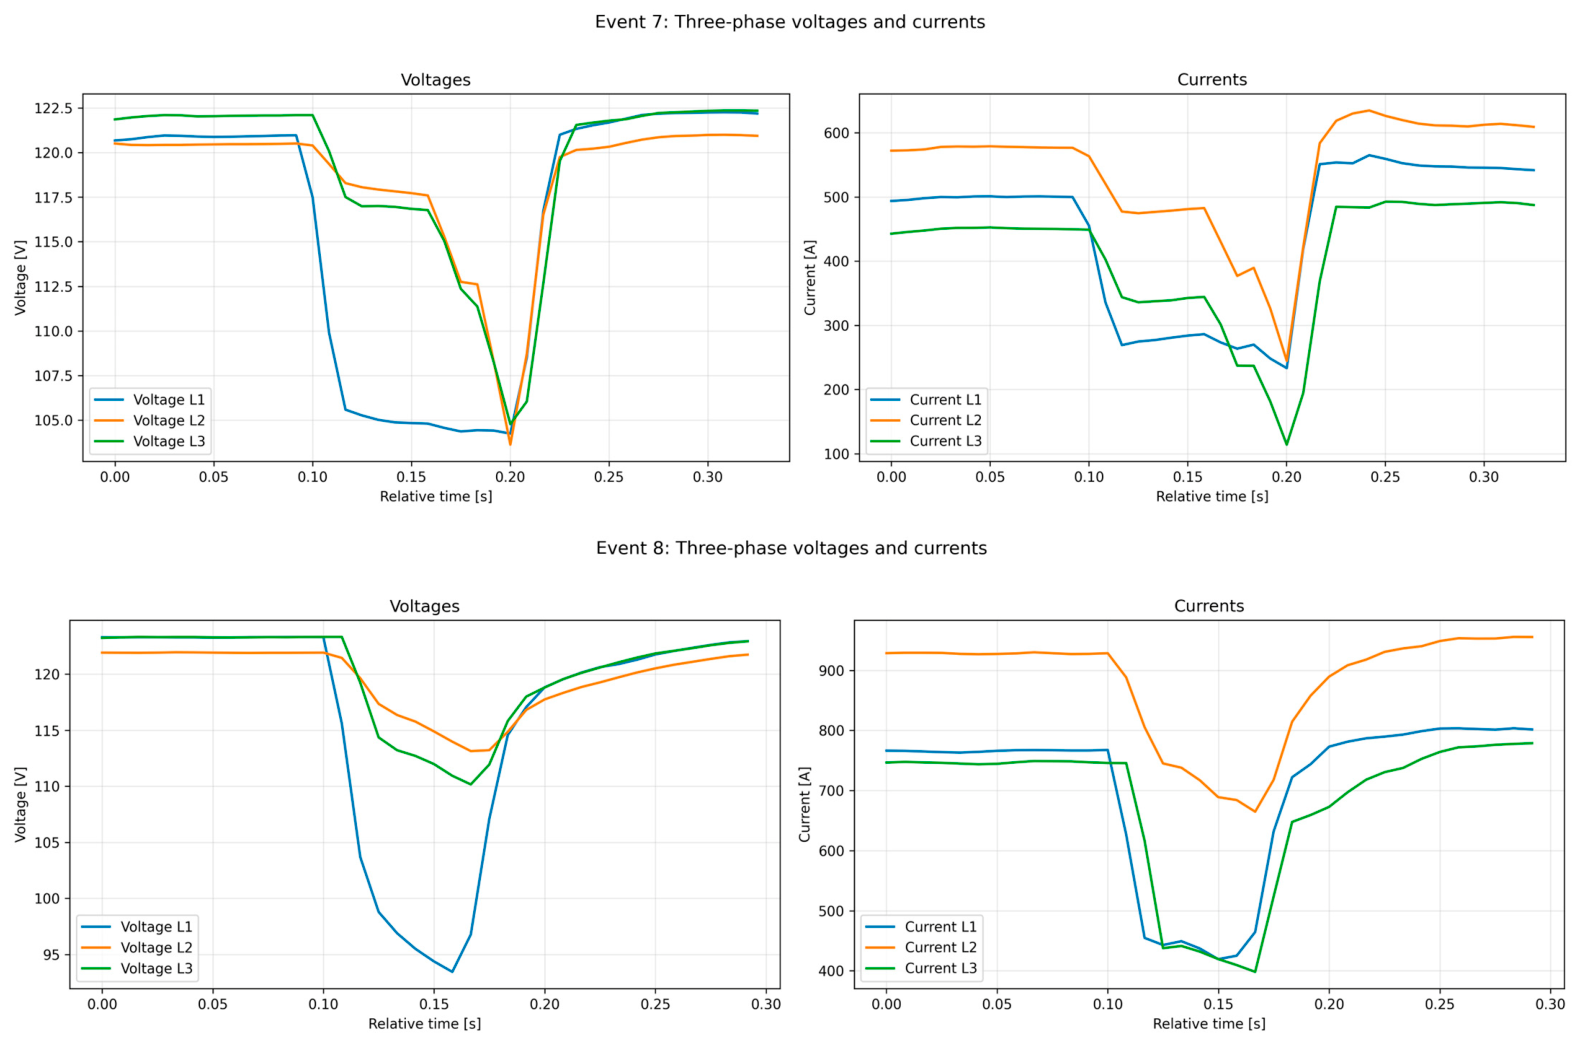
Based on the analysis of high-resolution measurements recorded in the system under study, a set of eight transient events was identified, characterized by abrupt variations in electrical quantities, particularly in phase voltages and currents. These events were selected due to their representativeness in terms of dynamic behavior and their recording quality, which allows for a detailed analysis of their temporal evolution.
Each event corresponds to a short time window, on the order of milliseconds, in which a disturbance clearly distinguishable from the steady-state regime is observed. These events were selected to ensure they contained sufficient information for all the fast variables considered, thus enabling subsequent multivariate analysis.
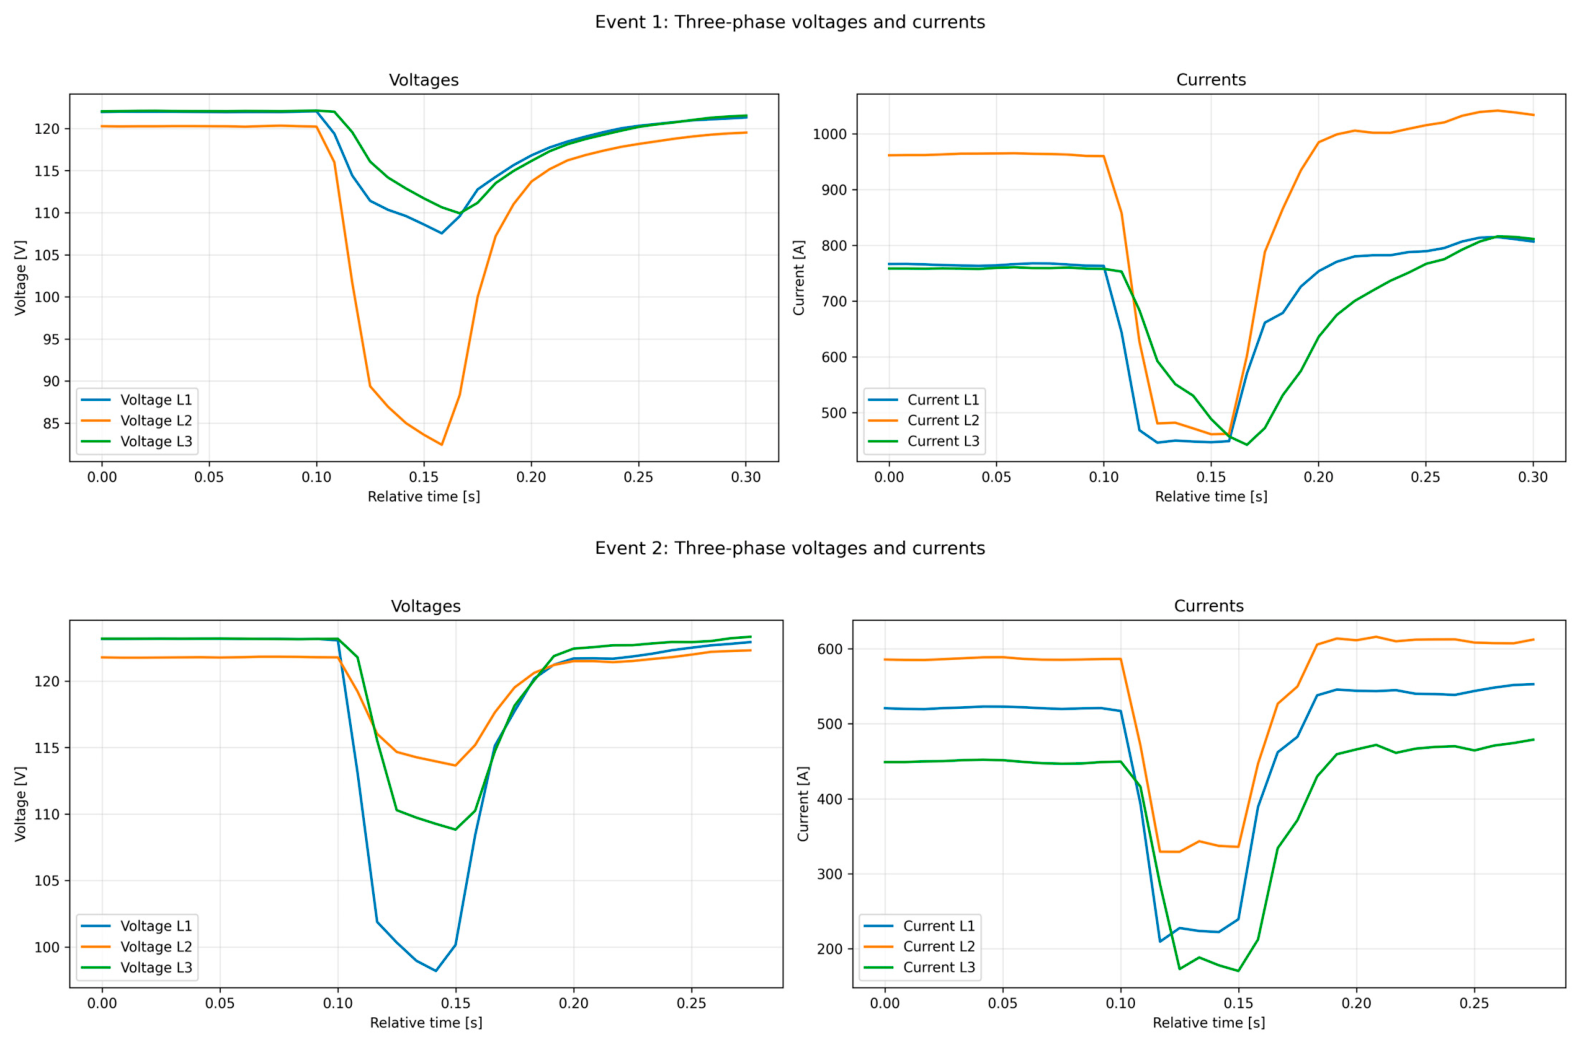
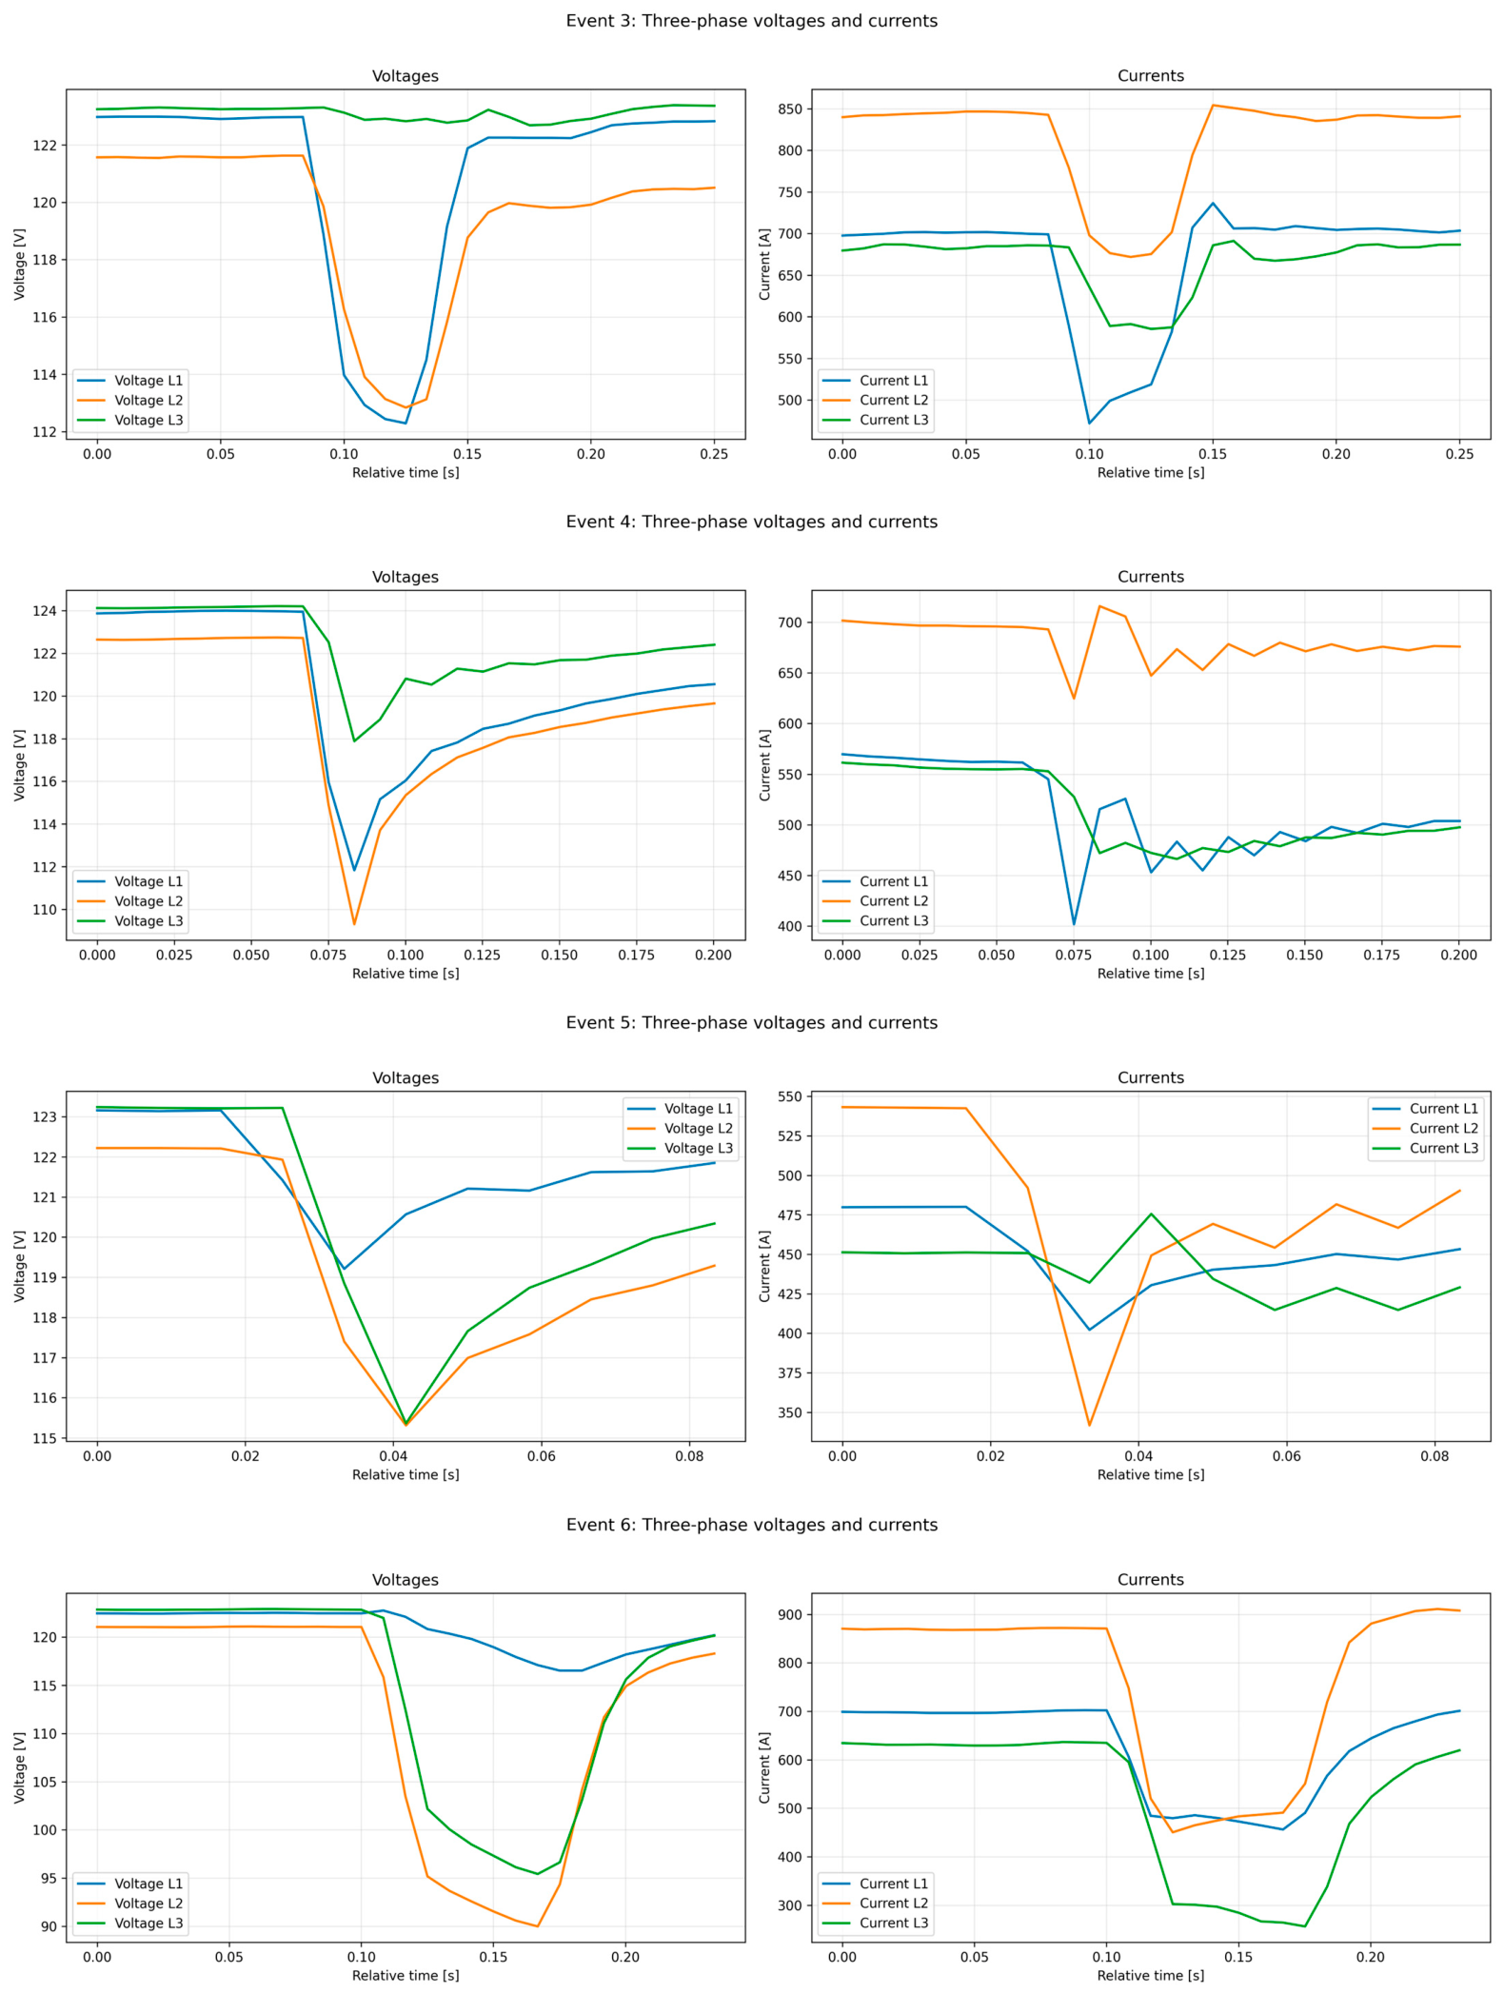
Figure 4 presents an overview of the eight identified events, showing the temporal evolution of the three-phase voltages for each case. In all events, a sudden reduction in voltage magnitude is observed, followed by a gradual recovery toward values close to the initial state. However, the depth of the dip and the duration of the event vary between cases, suggesting differences in the internal dynamics associated with each disturbance.
Table 5 summarizes the main characteristics of the analyzed events, including the event identifier, the source file, the number of valid samples, and basic metrics associated with the disturbance.
Taken together, this set of events constitutes the experimental basis upon which the temporal segmentation, dynamic characterization, and reduced-order modeling analyses presented in the following sections are developed.
The observed differences in the depth and duration of the events suggest the presence of non-trivial internal dynamics, which will be analyzed in detail in the following sections.
It is important to clarify that the durations reported in
Table 1 correspond to the total data window extracted for each event, which is defined uniformly to ensure a consistent representation of the system’s pre-disturbance regime, transition, and recovery. On the other hand, the durations presented in
Table 5 refer to the effective duration of the transient, that is, the time interval in which the main dynamics of the disturbance are concentrated. This distinction allows us to differentiate between the observation window used for the analysis and the actual time scale of the transient phenomenon.
The approximate duration of each event was estimated based on the number of valid samples and the sampling interval of the measurement system.
3.2. Common Temporal Architecture of the Events
Analysis of the identified transient events reveals the existence of a common temporal structure in the evolution of disturbances, regardless of differences in their magnitude or duration. This structure can be described by a sequence of characteristic stages, which reflect the internal dynamics of the system in response to a disturbance [
32,
33].
In general terms, each event can be broken down into five stages: (i) pre-event steady state, (ii) initial transition, (iii) extreme regime, (iv) recovery, and (v) post-event steady state. These stages were defined in
Section 2.3 and constitute a conceptual framework for the temporal analysis of the events.
However, from the perspective of the measured signals, not all of these stages are clearly distinguishable independently in all cases. In particular, the initial transition and entry into the extreme regime stages may appear as a single region of abrupt change, while recovery and final establishment may overlap into a single region of return to steady state. As a result, in some graphical representations, events may be perceived as composed of three main regions: pre-event, disturbance, and post-event.
Despite this apparent visual simplification, the five-stage model remains valid as a reference framework, as it allows for a more detailed and interpretation of the system’s internal dynamics, especially when analyzing multiple variables together.
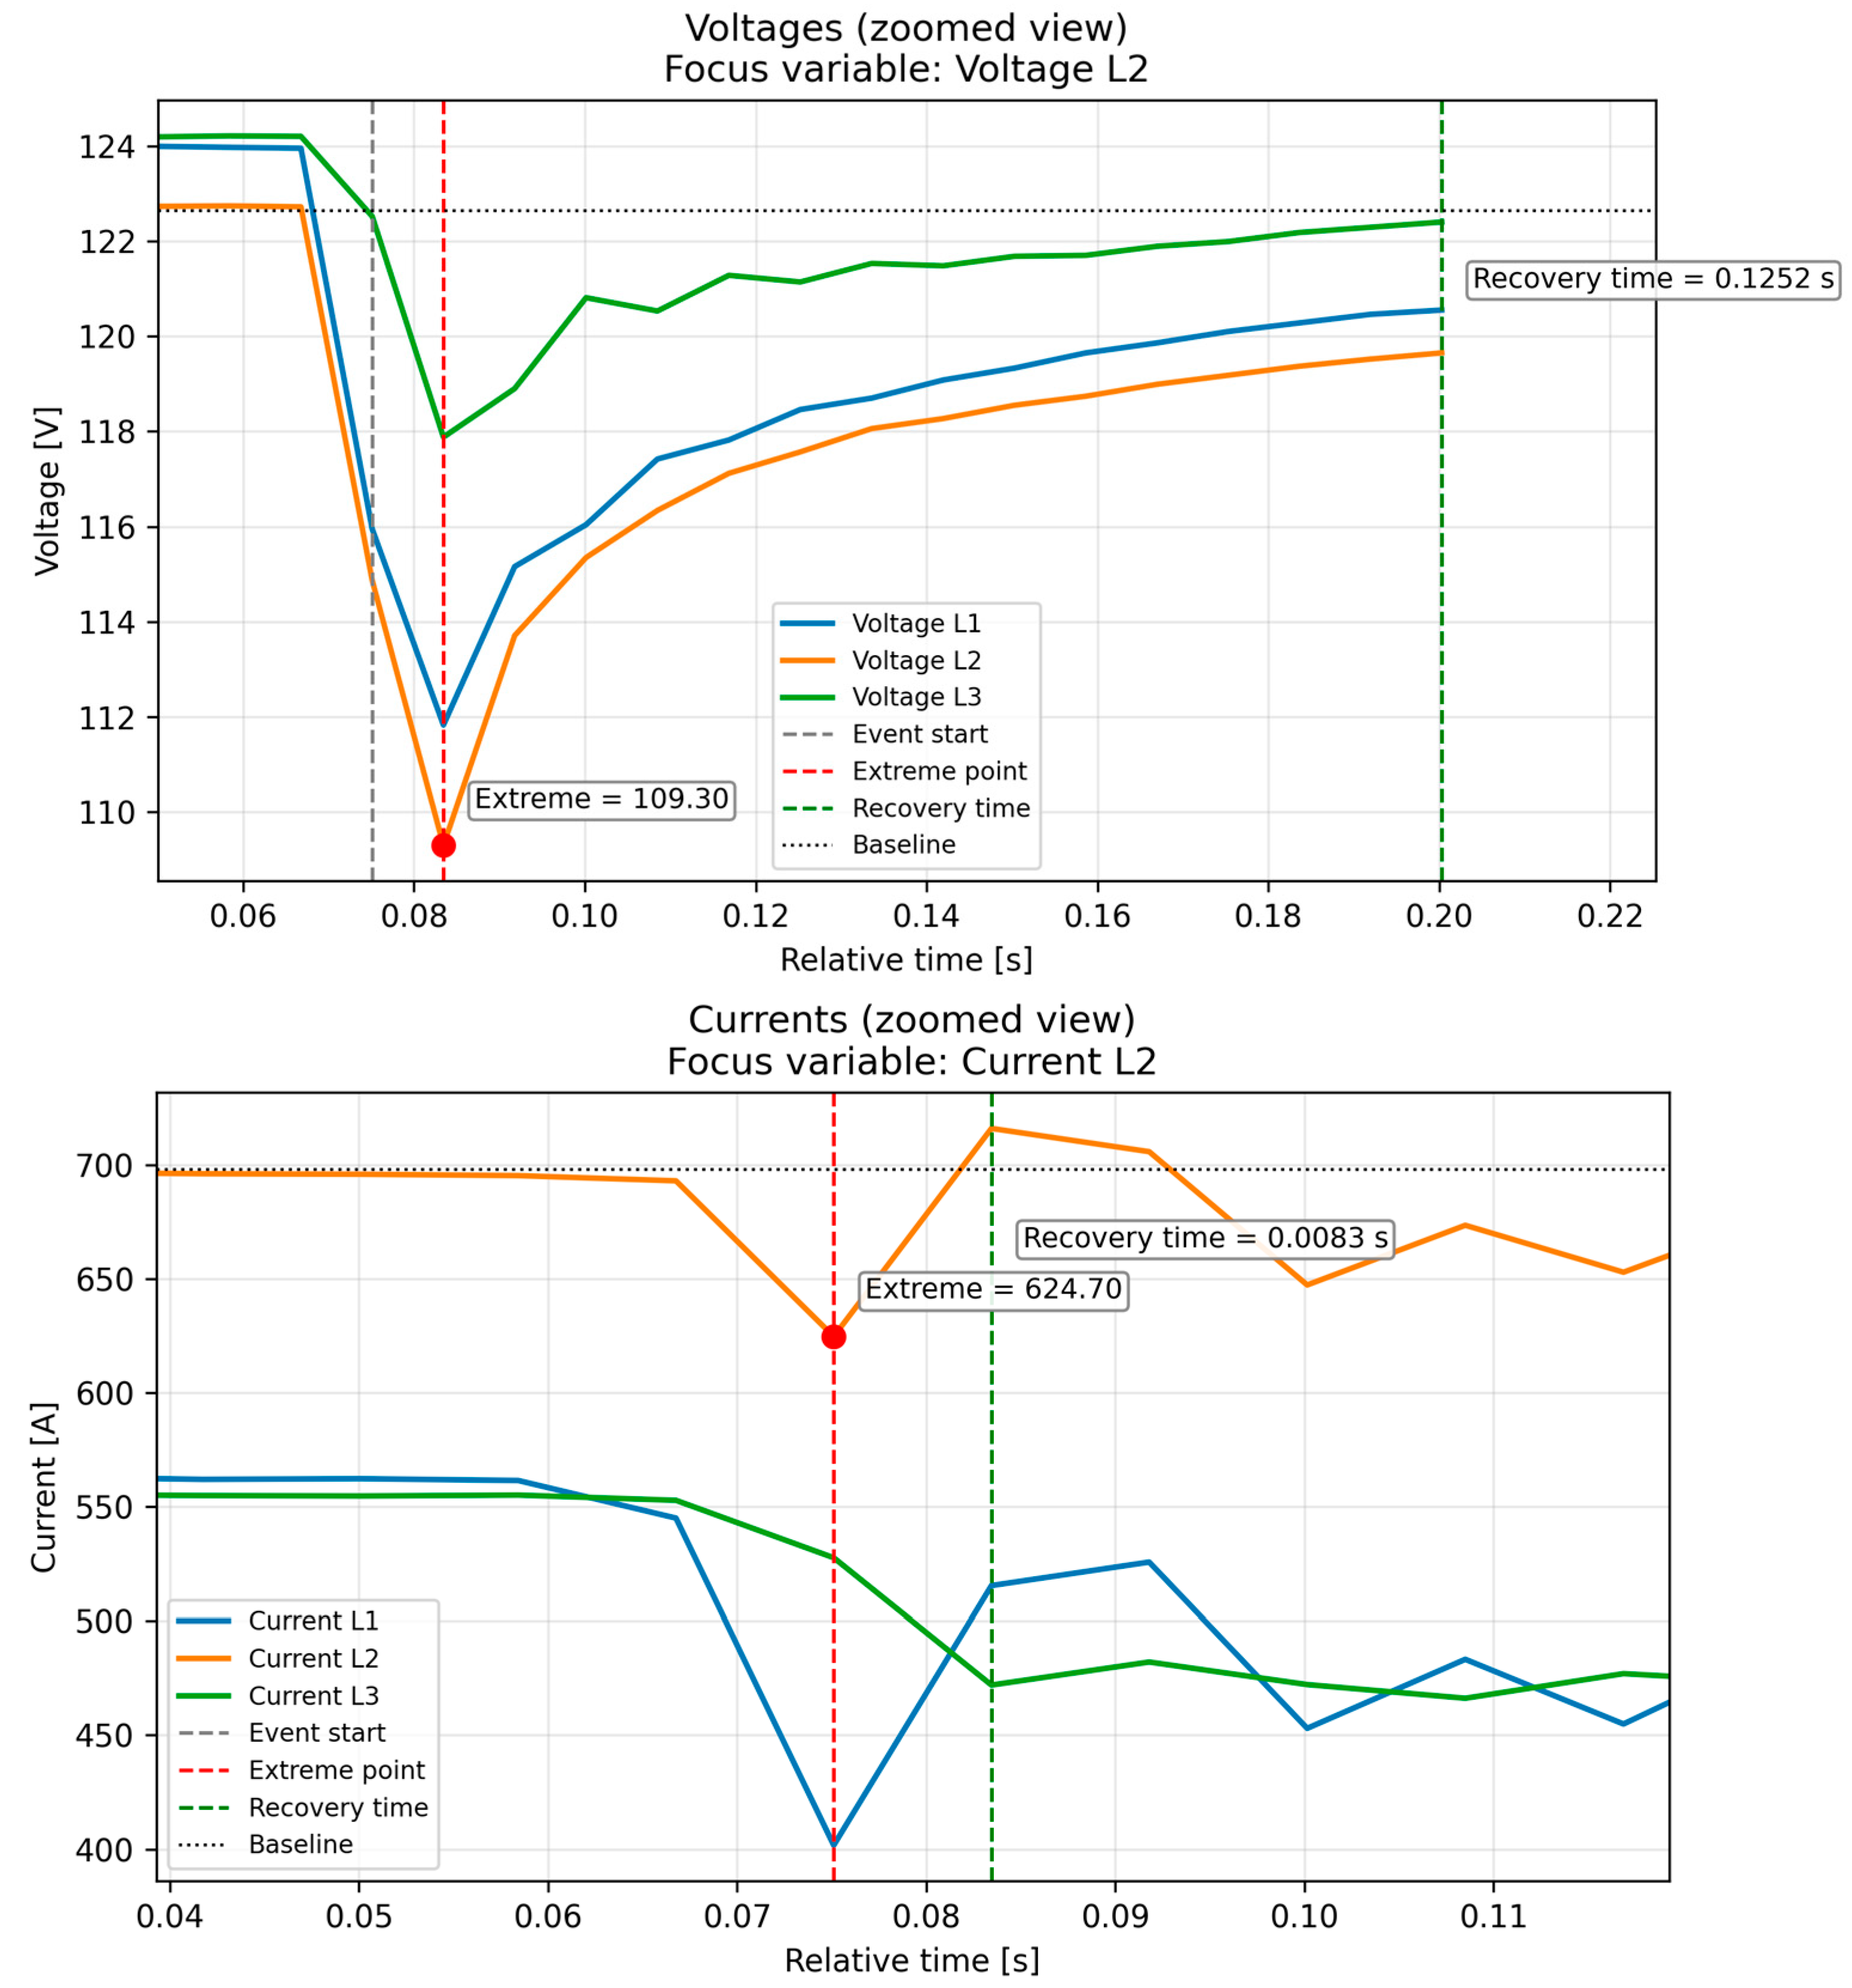
Figure 5 illustrates the temporal segmentation of a representative event, in which the different stages of the process are identified.
Taken together, these results show that, although events vary in duration and depth, they share a consistent temporal architecture, suggesting the existence of underlying common dynamic mechanisms.
3.3. Evidence of Internal Dynamics
Detailed analysis of the current signals during transient events provides clear evidence of the existence of non-trivial internal dynamics in the system. Unlike voltages, which exhibit a smoother and more global response, currents display more abrupt variations and more complex temporal structures during the development of the disturbance.
In particular, during the transient stage, it is observed that the currents do not remain constant or follow a monotonic trajectory, but rather exhibit short-lived fluctuations and changes in slope that suggest the presence of internal dynamic processes. This behavior is consistent with the response of nonlinear loads or power electronic systems, which adjust their operation in response to variations in the supply voltage.
Likewise, during the recovery phase, the currents do not return instantly to their initial value, but rather follow a progressive trajectory that may include small oscillations or changes in slope before reaching the steady state again. This phenomenon indicates that the system exhibits transient dynamics with memory, in which the evolution depends not only on the current state but also on the conditions preceding the event.
Figure 6 presents a temporal analysis of one of the events studied, highlighting the variations in phase currents during the disturbance. This figure shows that the extreme regime does not correspond to a simple steady state, but rather to a region of active dynamic behavior.
Taken together, these results suggest that the analyzed transient events cannot be adequately described by static or purely algebraic models, but rather require dynamic representations capable of capturing the temporal evolution of the electrical variables.
3.4. Low-Dimensional Analysis of the Events
The low-dimensional analysis is based on singular value decomposition (SVD) applied to univariate and multivariate representations of the transient events.
The accumulated energy is defined in Equation (4) as:
and the number of relevant modes
k is selected as the minimum value such that
.
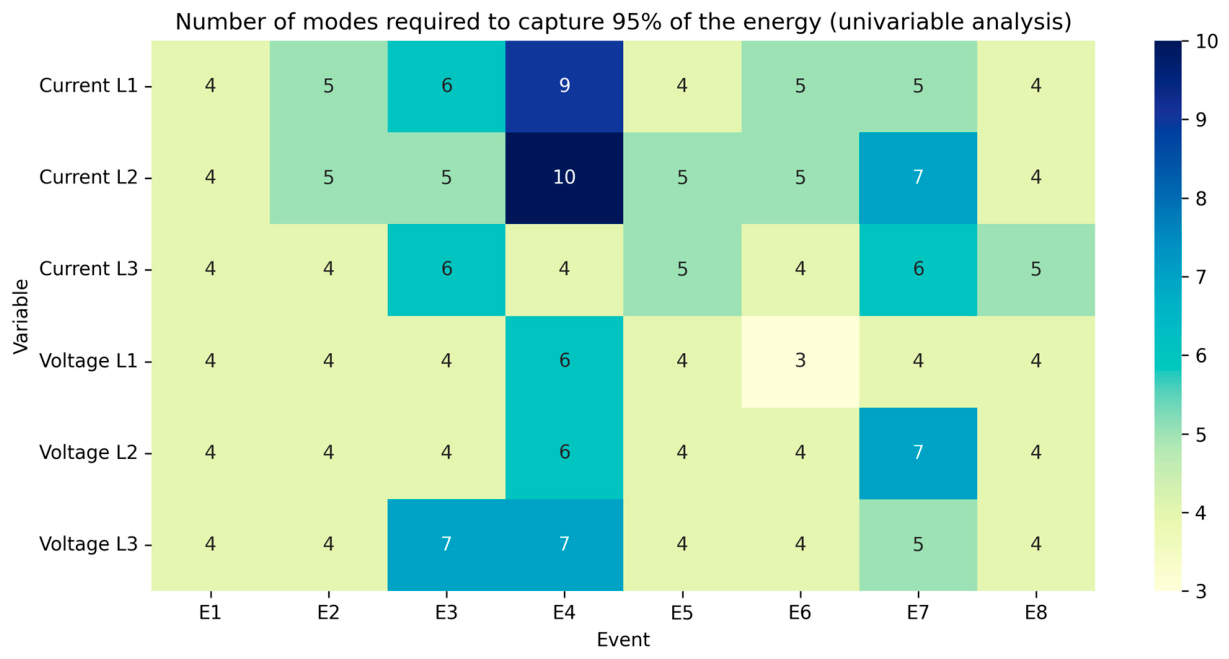
In the univariate analysis, most signals required between four and seven modes to retain 95% of the energy. However, the required number of modes varied across variables and events. This indicates that currents contain richer temporal structures and higher dynamic variability during the disturbance and recovery stages.
A multivariate representation was then constructed by jointly integrating the six fast electrical signals, including three-phase voltages and currents. In this representation, each row corresponds to an electrical variable and each column to a time sample. The results are summarized in
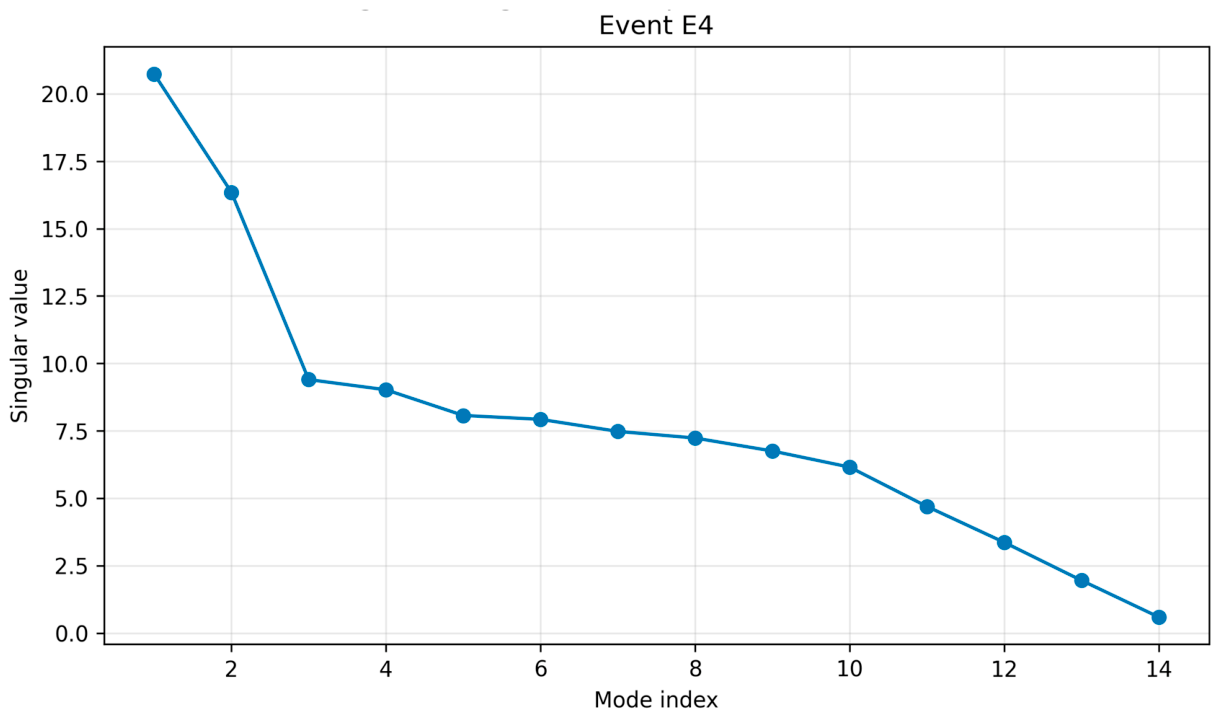
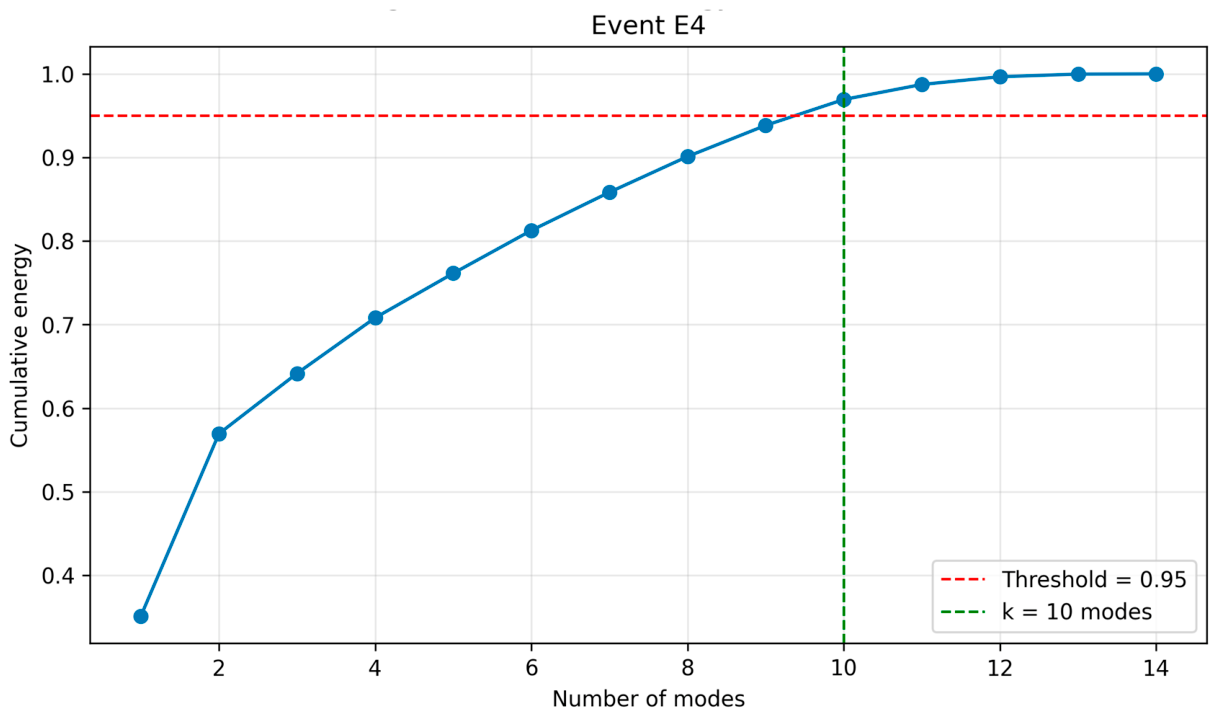
Table 6. Four events required only four modes to retain 95% of the energy, while three events required six modes. Event E4 required ten modes, making it the case with the highest effective dimensionality.
Figure 7 shows the singular value spectrum of Event E4. The gradual decay of the singular values indicates that the event energy is distributed among several components rather than concentrated in one dominant mode.
Figure 8 confirms this behavior, showing that ten modes are needed to reach the 95% accumulated energy threshold.
As shown in
Figure 9, current signals generally required more modes than voltage signals, indicating higher dynamic complexity during the transient and recovery stages.
The analyzed transient events are compressible and can be represented in a low-dimensional space. However, their effective dimensionality is not uniform. Current-dominated events require more modes than voltage signals, and Event E4 shows the highest dynamic complexity due to its simultaneous voltage and current disturbance.
3.5. Evaluation of the Reduced Representation of Events
This section evaluates the ability of PCA/POD, Kernel PCA, and Autoencoder models to reconstruct the transient events using compact representations. The comparison considers three aspects: reconstruction quality, reconstruction error, and reduced-space complexity. The analysis focuses on the methods that provided the best representational performance. Hankel–SVD was explored as a temporal-embedding reference, but it did not provide competitive reconstruction results for the available events.
3.5.1. Reconstruction Performance
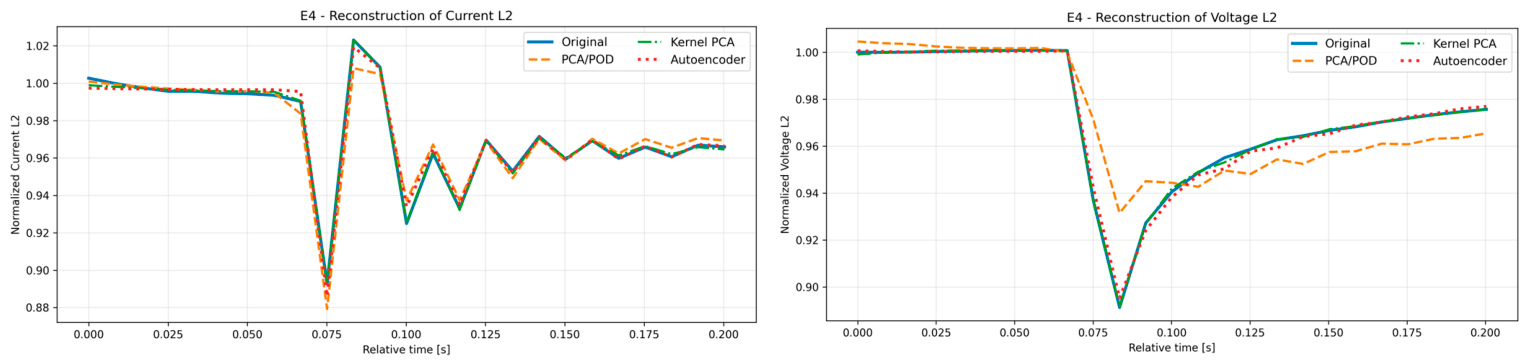
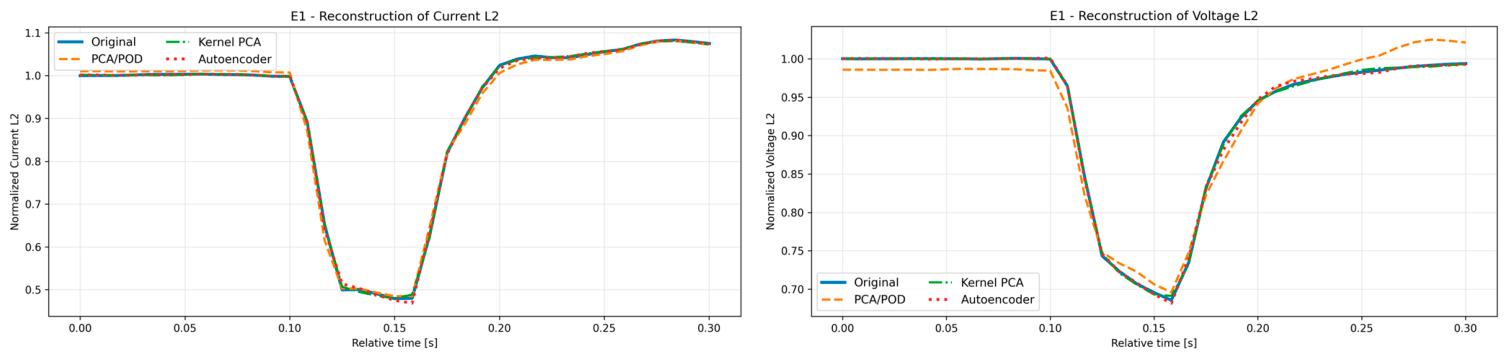
Figure 10 and
Figure 11 show the reconstruction of representative events using PCA/POD, Kernel PCA, and Autoencoder models. The three methods reproduce the general shape of the signals, including the pre-event condition, the disturbance, and the recovery stage.
PCA/POD provides smooth reconstructions and captures the dominant global trend of the events. Kernel PCA improves the fitting in regions with nonlinear behavior, especially during transition and recovery intervals. The Autoencoder also provides accurate reconstructions and adapts well to local variations in the signal.
All three methods reconstruct the main transient dynamics with high fidelity. PCA/POD is more stable and interpretable, while Kernel PCA and Autoencoder provide additional flexibility in nonlinear regions.
3.5.2. Reconstruction Error Analysis
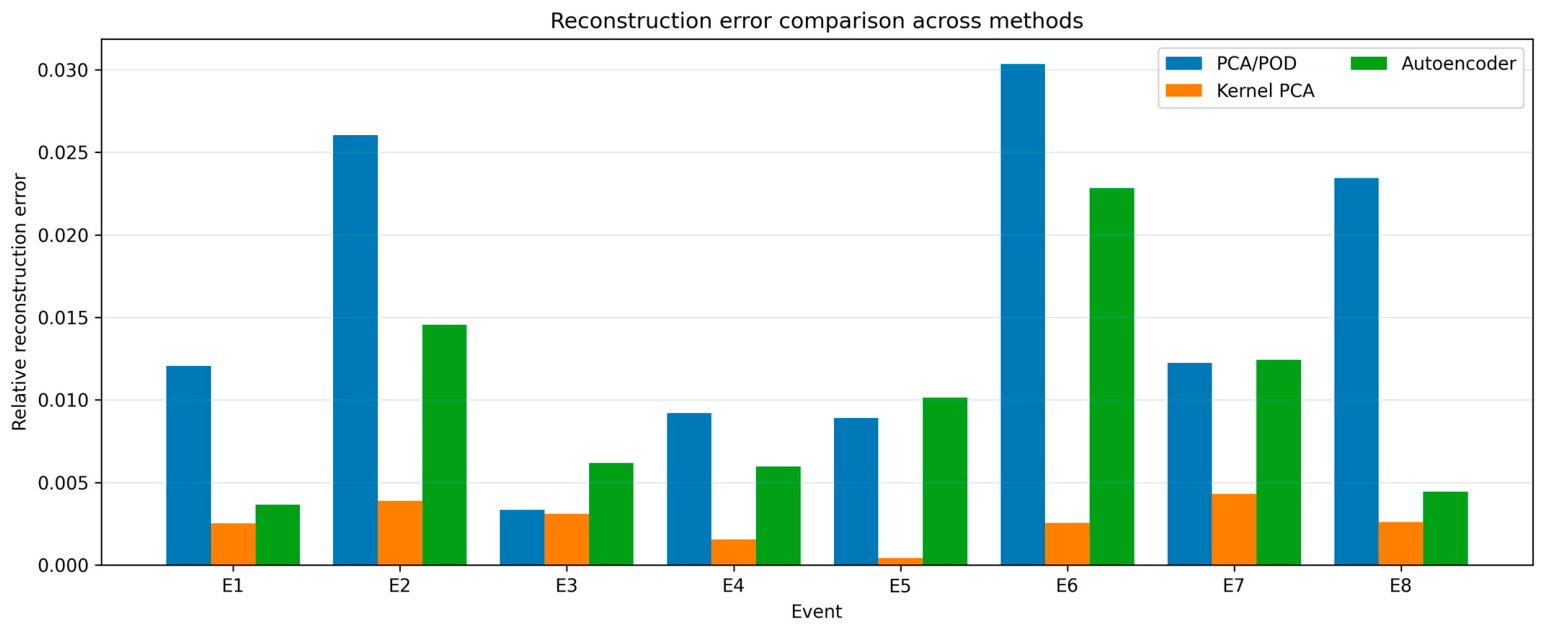
Figure 12 compares the reconstruction errors obtained with the evaluated methods. In general, all methods achieved low error values, confirming that the events contain a compact latent structure.
PCA/POD presented stable and competitive reconstruction errors across most events, while Kernel PCA achieved the lowest average reconstruction error overall. This result is consistent with its optimal variance-preserving formulation. Kernel PCA showed stable errors across events, suggesting that the nonlinear kernel representation captures relevant structures without large performance variations. The Autoencoder produced comparable errors, although with slightly higher variability in some cases due to its learning-based nature.
The reconstruction errors support the hypothesis that the transient events can be accurately represented using a limited number of components. PCA/POD provided the most consistent error behavior, while Kernel PCA and Autoencoder remained within a comparable performance range.
3.5.3. Quantitative Comparison of the Methods
Table 7 and
Table 8 summarize the quantitative comparison of the evaluated dimensionality reduction methods in terms of reconstruction performance and computational cost.
Table 7 shows that Kernel PCA achieved the lowest mean reconstruction error across the analyzed events, indicating a superior capability for capturing nonlinear relationships in the transient dynamics. However, this method consistently required a larger number of components, reducing its overall compression efficiency. In contrast, PCA/POD achieved the highest compression capability, requiring an average of only 1.62 modes while retaining approximately 97.6% of the cumulative variance contained in the signals. Although its reconstruction error was higher than that of Kernel PCA, the method maintained stable and physically interpretable representations. The Autoencoder provided intermediate reconstruction performance with a compact latent representation of two dimensions.
From a computational perspective,
Table 8 indicates that PCA/POD exhibited the lowest execution times, remaining in the millisecond range for all analyzed events. Kernel PCA increased the computational cost due to the nonlinear mapping and inverse reconstruction procedures, although the required times remained relatively low. In contrast, the Autoencoder presented significantly higher computational requirements because of the neural-network training process, even under limited-data conditions.
These results indicate that the selection of the dimensionality reduction method depends on the intended application. Kernel PCA provides improved reconstruction accuracy, PCA/POD offers superior compactness and computational efficiency, and Autoencoders provide flexible nonlinear representations at the expense of higher computational cost and lower interpretability.
N/A indicates “Not Applicable”. For Kernel PCA and Autoencoder, the retained-information metric based on cumulative explained variance is not directly defined due to the nonlinear nature of their latent-space representations. Therefore, reconstruction performance was evaluated using reconstruction error metrics instead.
Computational times correspond to offline execution under the adopted implementation conditions and are intended for relative comparison only.
3.5.4. Complexity of the Reduced Representation
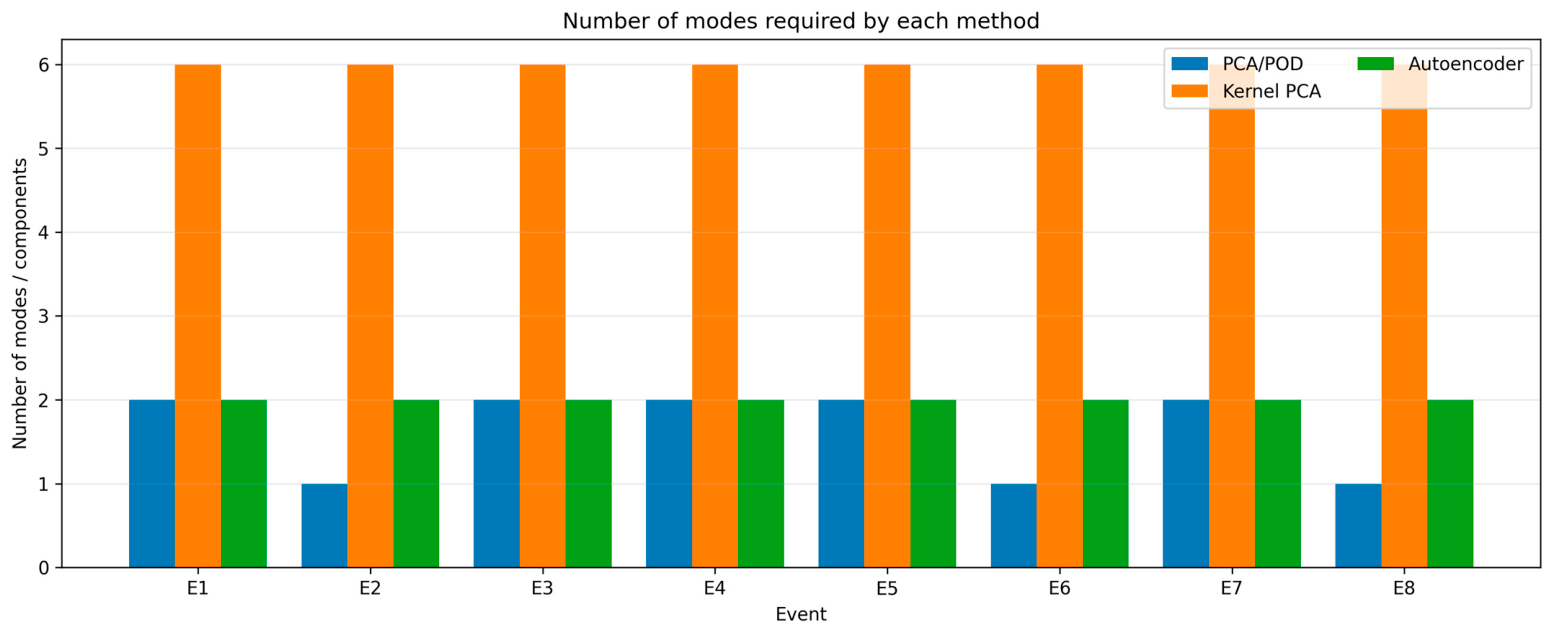
Figure 13 shows the number of modes or components required by each method. This metric evaluates the compression capability of each reduced representation.
PCA/POD required a small number of components, typically one or two, to capture the dominant structure of the events. This confirms its high compression efficiency. The Autoencoder also used a compact latent representation and achieved reconstruction with a limited number of internal variables. Kernel PCA required more components, reaching the maximum number of dimensions considered in several cases. This behavior is expected because the nonlinear feature space does not necessarily order information according to accumulated variance in the same way as PCA/POD.
PCA/POD offered the best balance between compression and reconstruction accuracy. The Autoencoder achieved similar compactness, while Kernel PCA required a larger reduced space to obtain comparable reconstruction performance.
3.5.5. Representation in Low-Dimensional Space
The projection of the events into a reduced space provides insight into the internal structure of the transient dynamics. In PCA/POD, the first components capture most of the global variance, producing compact and interpretable trajectories.
Kernel PCA organizes the data in a nonlinear feature space. This allows curved or nonlinear relationships among the electrical variables to be represented more flexibly. The Autoencoder generates latent variables learned directly from the data. These variables do not have an explicit physical meaning, but they preserve information needed for accurate reconstruction.
PCA/POD provides the clearest reduced-space interpretation. Kernel PCA and Autoencoder are less directly interpretable, but they offer greater flexibility for representing nonlinear transient behavior.
The dominant PCA/POD modes provide additional insight into the physical interpretation of the transient dynamics.
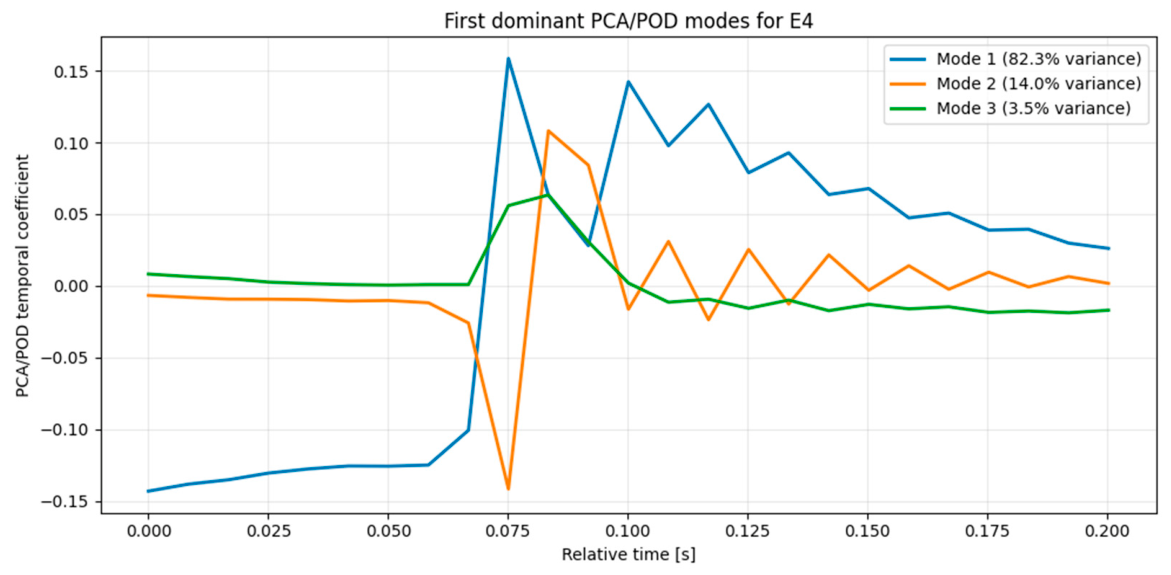
Figure 14 presents the first three temporal modes obtained for Event E4, which correspond to the most representative structures of the disturbance.
The first mode captures the dominant global variation associated with the main voltage and current disturbance, representing approximately 82.3% of the total variance. This mode reflects the principal transient evolution, including the abrupt transition and the subsequent recovery stage.
The second mode represents faster variations associated with local transient dynamics and oscillatory recovery behavior. This type of response is consistent with converter-related regulation effects and dynamic load adaptation processes.
The third mode captures smaller high-frequency variations and localized deviations, which may be associated with switching effects, nonlinear load interactions, or phase-dependent transient behavior.
These results suggest that the dominant PCA/POD components preserve physically meaningful structures of the transient events, facilitating the interpretation of the reduced representation in terms of identifiable electrical phenomena.
Table 9 summarizes the physical interpretation associated with the dominant PCA/POD modes and their relationship with observable electrical behaviors during the transient event.
These results reinforce the suitability of PCA/POD for reduced-order modeling in electrical transient analysis, since the dominant modes preserve both the compactness of the representation and an interpretable relationship with the observed physical dynamics.
3.6. Comparison of Dimensionality Reduction Methods
This section presents a comprehensive comparison of the evaluated dimension reduction methods, considering their performance across multiple events and their ability to consistently represent the system’s dynamics. The analysis focuses on three key aspects: consistency across events, variability in the reconstruction, and the robustness of the methods in the face of different dynamic characteristics.
3.6.1. Consistency Across Events
The consistency analysis allows us to evaluate the behavior of each method across the various events considered. In general, it is observed that PCA/POD exhibits highly consistent performance, maintaining low error levels and a small number of components in most cases.
Kernel PCA also exhibits stable performance across events, with comparable reconstruction errors and a consistent response to different dynamic patterns. This result suggests that incorporating nonlinearities the use of kernel functions enables a robust representation of the underlying data structure without relying heavily on event-specific features.
The autoencoder, although it performs adequately overall, shows greater variability across events. This variation can be attributed to its learning-based nature, where the quality of the representation depends on the model’s ability to adapt to the particularities of each dataset.
Taken together, these results indicate that all three methods are capable of consistently representing event dynamics, with greater stability in PCA-based approaches.
3.6.2. Variability in Reconstruction
Variability in reconstruction is analyzed in terms of the dynamic characteristics of the events, particularly in the presence of abrupt transitions and nonlinear changes.
The results show that PCA/POD tends to offer smoother reconstructions, adequately capturing the global structure of the event, but with slight limitations in regions of rapid change. Kernel PCA improves representation in these regions, demonstrating a greater ability to adapt to curvatures and nonlinear behaviors in the signals.
The autoencoder exhibits high adaptability, achieving accurate reconstructions in both smooth regions and sharp transitions. However, its performance may vary depending on the complexity of the event and the quality of the training, which is reflected in differences in error across events.
These results demonstrate that nonlinear methods offer advantages in representing complex dynamics, while PCA/POD maintains robust performance in terms of global stability.
3.6.3. Generalization Ability
Evaluating the methods across multiple events allows us to analyze their robustness to variations in system dynamics, including differences in the magnitude, duration, and shape of the disturbances.
The results show that all evaluated methods maintain adequate performance across the various scenarios considered, suggesting that the dynamics of the events share a common low-dimensional underlying structure.
PCA/POD stands out for its efficiency and stability, while Kernel PCA and the autoencoder provide additional flexibility to capture nonlinear relationships. This combination of results indicates that the representation of events does not critically depend on a single approach but can be achieved through different dimension reduction strategies.
In this context, the evaluated methods show significant potential for use in the analysis, compression, and modeling of transient events in electrical systems.
3.7. Validation and Generalization Across Events
The validation of the dimensionality reduction methods was performed by consistently applying them to a diverse set of transient events, with the aim of analyzing their behavior in the face of variations in system dynamics.
The results obtained show that the evaluated methods are capable of adequately reconstructing the events using a reduced number of components, regardless of differences in the magnitude, duration, or shape of the disturbances. This consistent behavior suggests the existence of a common underlying low-dimensional structure in the analyzed events.
In particular, PCA/POD exhibits robust and stable performance across all events, maintaining low reconstruction errors and a compact representation. Kernel PCA, on the other hand, demonstrates an additional ability to capture nonlinear relationships, maintaining consistent behavior across different types of events. The autoencoder, although it introduces greater flexibility in the representation, maintains a comparable level of performance, demonstrating its ability to adapt to data variability.
Although the methods were applied independently to each event, the consistency observed in the results suggests the presence of common structural patterns across the analyzed disturbances. However, due to the limited number of available events, these observations should be interpreted as preliminary evidence rather than as a definitive validation of generalization capability.
In this regard, no explicit cross-event training or validation procedure was performed, and the available dataset is limited to eight representative events from a single infrastructure. Consequently, the present study does not provide sufficient statistical evidence to claim robust generalization to unseen events or broader operating conditions. Instead, the results indicate that the evaluated methods can consistently represent the dynamics within the analyzed case-study dataset, which motivates future validation using larger and more diverse event collections.
Taken together, these results support the feasibility of describing the analyzed transient events using low-dimensional models under limited-data conditions. Nevertheless, additional studies involving larger datasets, unseen disturbances, and multiple infrastructures are required to rigorously evaluate the variability and generalization capabilities of the proposed approaches.
4. Discussion
The findings of the present study demonstrate the feasibility of constructing useful reduced representations of real transient events in a data center, even in circumstances where disturbances are limited in availability. The identification of a mere eight high-quality events is indicative of two things. Firstly, it highlights the practical difficulty of capturing them. Secondly, it demonstrates the system’s high reliability. This scenario, typified by brief transient phenomena of moderate intensity, poses a considerable challenge to dynamic characterization. It underscores the importance of deriving compact models from limited data.
In this context, PCA/POD, Kernel PCA, and Autoencoder were found to adequately represent the dynamics, with subtle differences between methods. PCA/POD demonstrated the lowest error rates, Kernel PCA exhibited consistent performance, and the autoencoder displayed enhanced flexibility with minor reliance on the event. This finding serves to substantiate the hypothesis that the transients in question are characterized by a compressible latent structure, a notion that can be effectively captured by employing both linear and nonlinear methodologies. Moreover, the minimal number of components necessitated lends further credence to the hypothesis that the predominant dynamics are low-dimensional in nature.
Conversely, approaches with explicit temporal structure, such as Hankel–SVD, were not competitive in this scenario. This finding indicates that, in the presence of limited data and moderate perturbations, the robustness and compression capacity of a model are more significant than its temporal complexity.
From an engineering perspective, these findings have direct implications. The increasing integration of converters and distributed resources is a contributing factor to the elevated dynamic complexity of power systems. This necessitates the development of models that can effectively balance accuracy and computational efficiency [
34,
35]. In this regard, the proposal demonstrates the viability of capturing relevant dynamics without the necessity of detailed physical models, a process which is particularly valuable for fast simulations, online analysis, and real-time applications [
36].
It is evident that these reduced representations offer significant opportunities in the domains of dynamic power flow and stability analysis. This is particularly advantageous in scenarios where the utilization of full models is computationally intractable. A low-dimensional model facilitates rapid evaluation of the system’s response to disturbances, thereby enabling transient stability studies, sensitivity analysis, and contingency assessment in critical infrastructure such as data centers.
Furthermore, the approach has implications for power system planning, especially in scenarios where fast dynamics and interaction with power electronics are relevant. The capacity to maintain the coupled behavior of electrical variables indicates that these models have the potential to enhance traditional studies, circumventing simplifications that neglect crucial phenomena such as reactive power, whose significance has been extensively substantiated in the extant literature.
Another key aspect is its potential in the development of digital twins. The capacity to construct dynamic models based on real measurements, without reliance on complete system information, facilitates the creation of digital representations that evolve in tandem with operational processes. The aforementioned factors may facilitate future applications in advanced monitoring, diagnostics, and behavior prediction under partially observed operating conditions.
From an operational perspective, the work also complements extant literature on monitoring and state estimation. As demonstrated in [
37], measurement location and reliability are indeed fundamental. However, the results of this study indicate that the value lies not only in the measurement process itself, but also in the subsequent transformation of these measurements into useful, dynamic knowledge. Despite the paucity of events, it is possible to extract relevant information for the purpose of system characterization and reconstruction.
It is evident that these results are of particular pertinence in the context of contemporary electrical systems, which are characterized by a significant presence of power electronics. In scenarios where inertia is minimal and dynamics are rapid, the employment of data-driven reduced-order models can facilitate the analysis of microgrids, storage systems and advanced control schemes. This is advantageous in situations where data availability is limited but dynamic understanding is critical.
The work demonstrates that dimensionality reduction applied to real measurements enables data compression and facilitates a new form of aggregated dynamic modelling. This capability is of particular value in data centers, where the low frequency of severe events increases the value of each available measurement and demands efficient tools for its exploitation.
Limitations and Future Research Directions
Despite the promising results obtained in this work, several limitations should be acknowledged. First, the study was conducted using a limited dataset composed of only eight transient events from a single data center. Although the selected events were representative and exhibited adequate signal quality, they do not cover the full range of possible operating conditions or severe disturbances. Therefore, the results should be interpreted as case-study evidence rather than as a general validation of the proposed methodology.
Additionally, the evaluated methods were applied independently to each event, without a formal cross-event validation procedure. Consequently, the generalization capability of the models to unseen events remains an open research question. Kernel PCA and Autoencoder approaches also introduce dependencies related to kernel selection, hyperparameter tuning, and network architecture, which may affect reproducibility and performance under different datasets.
Furthermore, the proposed framework is entirely data-driven and does not incorporate explicit physical models of the electrical infrastructure. While this enables flexible representations from measurements alone, it limits the direct physical interpretability of some latent variables. Finally, the study focused on offline reconstruction and analysis. Real-time implementation, online adaptation, and deployment in operational digital-twin environments were not evaluated and should be addressed in future work.
Nevertheless, the objective of this work was not to establish a statistically comprehensive benchmark, but rather to evaluate the feasibility of constructing reduced-order representations from real transient measurements under sparse-data conditions. In this sense, the selected events were sufficient to compare the behavior, reconstruction capability, and representational consistency of the evaluated dimensionality reduction methods within a controlled case-study framework.
5. Conclusions
This study provides case-study evidence that reduced-order modelling can be useful for representing transient electrical dynamics in a data center under limited-data conditions. The analyzed events were short-lived and moderate in magnitude, which is consistent with the high-reliability nature of this type of infrastructure. Therefore, the results should be interpreted as evidence of methodological feasibility rather than as a general validation for all data center operating conditions.
For the eight events analyzed, the results show that the measured transient responses can be reconstructed with low error using a limited number of components. This suggests the presence of a low-dimensional structure within the available dataset. PCA/POD provided the most favorable balance between reconstruction accuracy, compactness, and interpretability. Kernel PCA and Autoencoder models offered additional flexibility for representing nonlinear behavior, although with lower physical interpretability and greater dependence on model configuration.
From an applied perspective, the proposed methodology may support future tools for monitoring, event compression, and exploratory dynamic analysis in critical electrical infrastructures. However, its use in dynamic power flow, stability studies, planning, or digital-twin environments requires additional validation with larger datasets, different operating conditions, and unseen events. In this sense, the present work should be understood as an initial step toward data-driven reduced representations, rather than a complete operational deployment framework.
The selection of the dimensionality reduction method should therefore consider not only reconstruction accuracy, but also interpretability, data availability, model complexity, and the intended application. In this case study, compact and robust approaches such as PCA/POD showed practical advantages under sparse-data conditions. More complex nonlinear models may become more advantageous when larger and more diverse datasets are available.
Future work should extend the proposed methodology to larger datasets, additional data centers, and other electrical systems with a high penetration of power electronics, such as microgrids, storage systems, and active distribution networks. Further developments should also include additional electrical variables, such as reactive power and frequency-related indicators, as well as explicit validation under unseen events and operating constraints.