1. Introduction
The paper industry is one of the capital- and technology-intensive sectors of the processing industry. Production efficiency is related to the optimization of material flows, waste minimization, and stability of product quality parameters. The production process includes producing a paper web, longitudinal cutting, and finally winding it into final rolls. Given the high investment costs, energy requirements, and continuous nature of production, process stability is a decisive factor in enterprise competitiveness.
Pulp and paper production is a complex operation that involves many resources, each with a specific role in creating the finished product. It must include quality settings and, last but not least, the processing machine’s capacity constraints. Production planning and management require the optimal configuration of material flows to minimize production inventory costs while respecting equipment capacity constraints and customer requirements. Paper product slitting and winding stands play a key role in processing. With their efficient, precise cutting capabilities, they provide strong support for the production and processing of paper products. Controlling moisture levels is crucial; excessive moisture weakens the paper, while insufficient moisture can cause cracking. The basic characteristics of machines important for the production of paper materials, including automation with control of individual parts for cutting and winding paper, are described by Ravrathi Priya and Mukunth and the team of Mushiri et al. [
1,
2]. The increase in demand for paper products is forcing companies to modernize winding and cutting machines and increase productivity and quality. A cutting and winding machine is highly complex, with many control elements. The elasticity and density, which determine the consistency of the rolls, must be precise and measurable. It must also be taken into account that at high machine speeds, the material on the roll moves.
In the field of production optimization in the paper industry, two problems are primarily studied: the lot-sizing problem and the cutting-stock problem. Authors Jans and Degraeve [
3] and Brahimi et al. [
4] address the lot-sizing problem and the modeling of various industrial production extensions in their works. The cutting stock problem consists of selecting the best cutting patterns and determining the quantities to use to minimize material waste and storage costs. This problem has been extensively studied by Carvalho and Poltroniere et al. [
5,
6], and a relationship between the two problems has been established [
7]. As shown, it is important to optimize manufacturing and cutting processes, as evidenced by cost reviews of individual companies [
8,
9]. An integrated process for optimizing cutting stock has been published by Arbib and Marinelli [
10], where they achieved a reduction in total costs of approximately 43%. Similar economic benefits have been reported by other authors, such as Malik et al. [
11], who reported a reduction in total costs of approximately 25%.
The production of filter papers is one of the technologically demanding processes in the paper industry, in which achieving stable product quality is closely linked to the efficient use of material, energy, and operating resources. Due to the continuous nature of production, the use of cutting machines, and the high demands on the accuracy of technological parameters, it is not possible to completely eliminate variability in production conditions or the associated fluctuations in production costs. This variability can be caused by random influences or by attributable factors, such as changes in raw materials, the setting of technological parameters, equipment energy efficiency, or production line downtime. Although random influences are a natural part of the process, attributable causes of increased costs can be identified and systematically reduced through the appropriate use of analytical, statistical, and optimization methods [
12,
13,
14].
The specific challenges related to the use of SPC in the paper industry have not been as widely published or promoted by authors and companies because there are no external market pressures, as there are, for example, in the automotive industry [
15]. Statistical process control (SPC) in multi-stage manufacturing has attracted attention. The application of conventional SPC methods in multi-stage environments may not be effective because these methods do not account for the process structure or the interrelationships between manufacturing stages. Jin and Tsung proposed a strategy for properly assigning control charts in a multi-stage process to improve the rapid detection of uncontrolled behavior [
16]. By merging business strategies, using qualitative methods to measure efficiency, and supplementing these with management programs, companies have a greater chance of success in improving quality and reducing costs [
17,
18,
19]. Mandahawi et al. present in their work the Lean Six Sigma process for improving the performance of cutting equipment, achieving a significant increase in process efficiency at a paper company. Following the DMAIC process, they propose and implement improvements, resulting in a significant increase in the equipment’s overall efficiency [
14].
Shewhart charts are used for scientific and statistically based monitoring of process stability. Their core is the distinction between normal (random) and special (attributable) variability in the process. The Shewhart
-chart is widely used to monitor the mean of the quality characteristic x. This chart is effective for detecting large mean shifts [
20,
21]. Rantamäki et al. [
17] summarized the critical factors for successful SPC implementation. At the same time, the use of EWMA-type control charts in paper production is described by Ramesh and Vasu [
22].
Also, the Quick Response Quality Control (QRQC) methodology has been widely used in the automotive and industrial sectors [
23,
24], but not in the paper industry.
Despite the existing literature focused on optimizing cutting plans and costs, less attention has been paid to spatial (positional) variability in multi-stream winding processes, where individual strips are processed in parallel at nominally the same machine settings.
In such systems, positional heterogeneity—arising from uneven tension, vibrations, and mechanical tolerances—can accumulate across parallel streams, leading to systematic differences between cutting positions. This results in non-uniform strip widths, increased material waste, higher energy consumption, and more frequent machine adjustments.
Traditional optimization approaches, such as lot-sizing and cutting-stock models, typically assume homogeneous inputs and do not capture these dynamic interdependencies, highlighting the need for more advanced, data-driven analytical approaches.
This study addresses this gap by investigating position-dependent variability in the multi-position cutting and winding process for cellulose paper rolls under industrial conditions, identifying possible systematic deviations, and assessing their impact on overall process performance.
The study combines descriptive statistical methods, control charts, and process performance indices (Pp and Ppk) with root cause identification tools (5 Whys). Based on these analyses, practically implementable improvement measures are proposed using the QRQC methodology and the 4M approach to enhance process stability and performance.
This study presents an integrated data-driven approach to analyzing spatial variability in multi-stream winding processes, combining a non-standard spatial application of SPC tools with process performance analysis and root cause analysis. Unlike conventional approaches based on global indicators, the proposed method reveals position-dependent systematic deviations that remain hidden in aggregated evaluations and supports targeted process improvement in the investigated industrial production of filtration paper.
2. Materials and Methods
This section focuses on the analyzed industrial process of cutting and winding filter paper, the data collection procedure, and the statistical methods used to evaluate the spatial variability and process performance of the multi-stream process. The methodology was designed to ensure full reproducibility and allow an objective assessment of both the positional variability and the overall stability of the process under real operating conditions.
2.1. Process Description
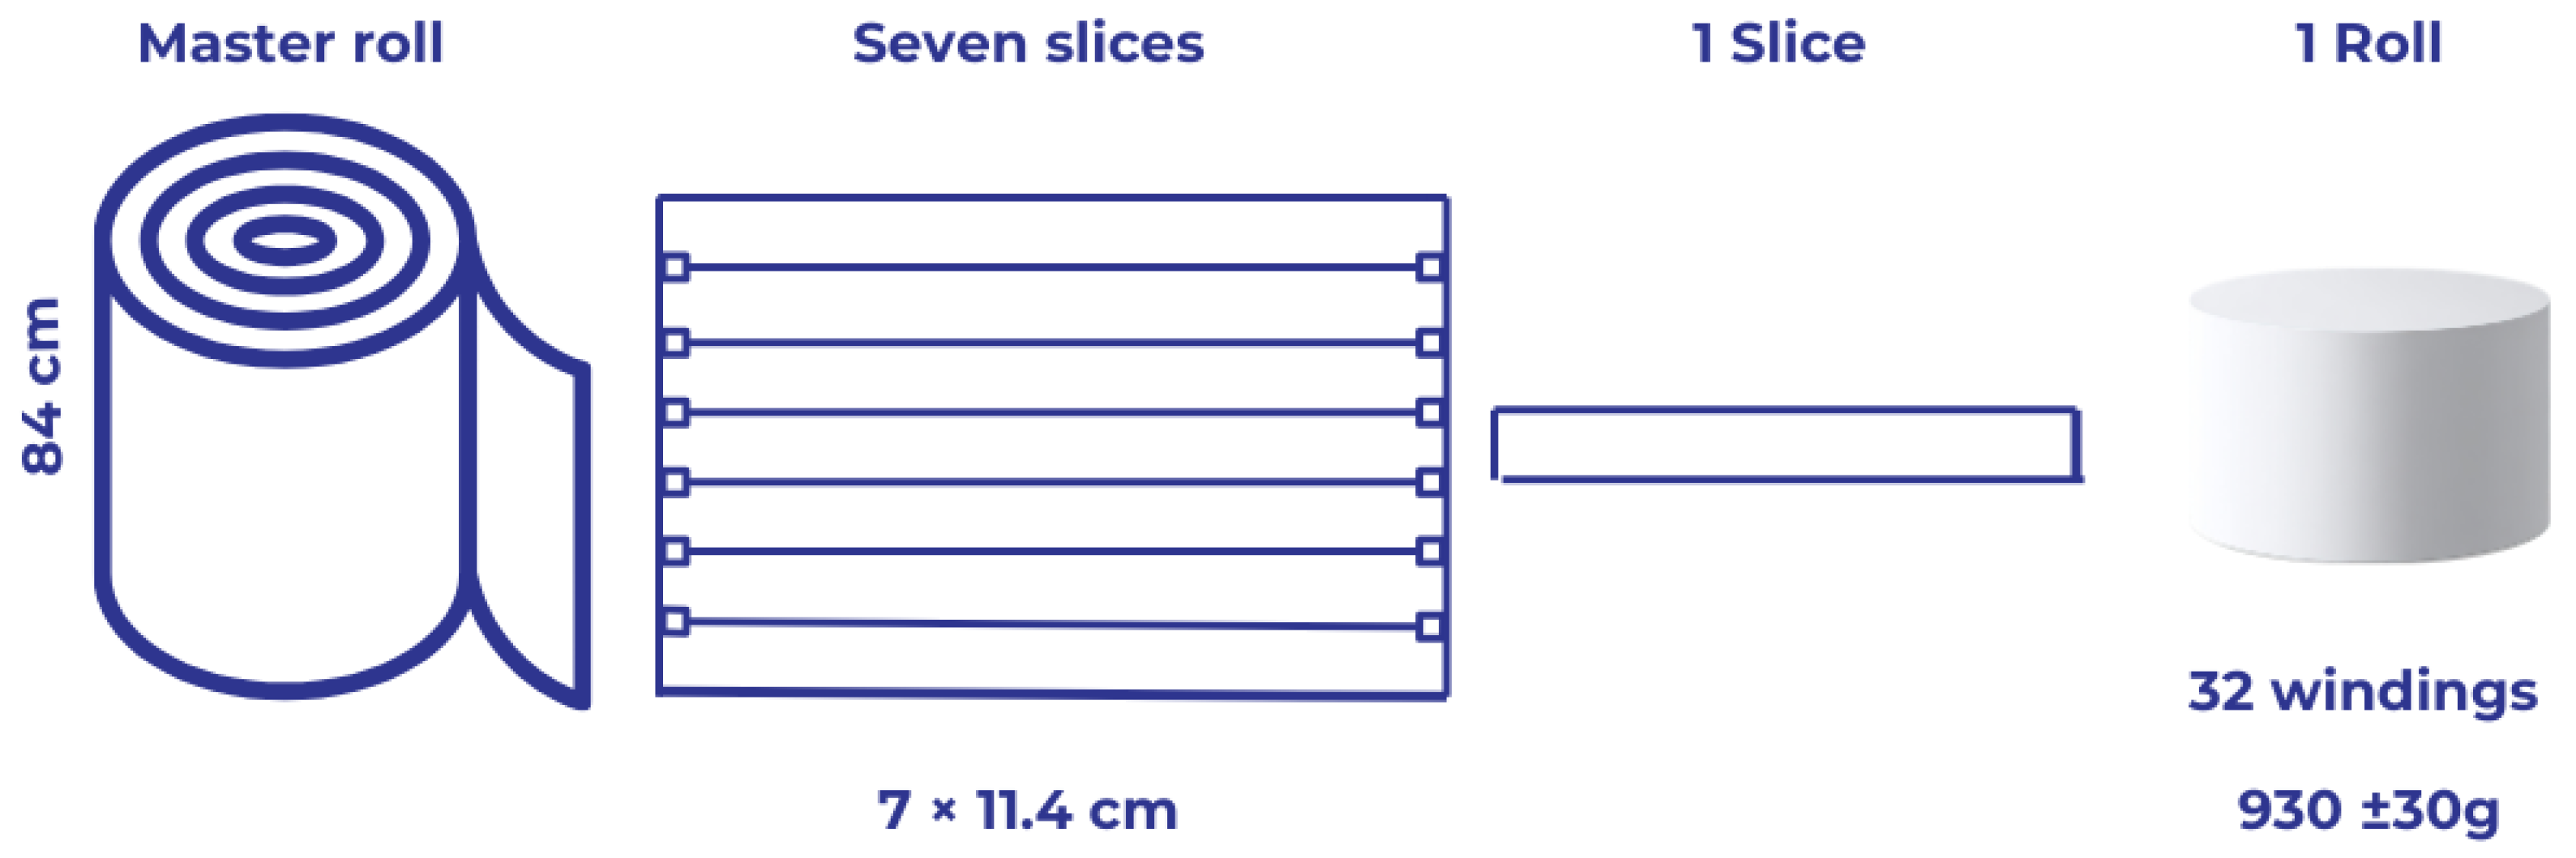
The study analyzes the production process of cutting and rewinding cellulose paper. The input material is supplied as a master roll with a nominal width of 84 cm. The cellulose paper used in this process is a technical filtration material designed to separate solid particles from fluids (liquids or gases). It is characterized by higher fiber density, controlled porosity, and specific absorption properties, which distinguish it from conventional paper grades and influence its behavior during slitting and rewinding.
These master rolls were processed on a continuous production line, where they were slit lengthwise and then wound. The master roll was cut into seven slices, each with a nominal width of 11.4 cm, using a disc slitting system. The individual slices were then wound separately into smaller rolls.
From each master roll, 30 to 35 resulting rolls were created, depending on the length of the input material. The target (nominal) weight of one roll is set at 930 ± 30 g.
The technological scheme of the slitting and winding process is shown in
Figure 1.
The described technological arrangement represents a typical multi-stream winding process, in which the individual slitting positions are processed simultaneously using identical minimum machine settings. Such an arrangement allows analysis of spatial (position-dependent) variability within a single production system.
The machine parameter settings were as follows:
Pressure in the pneumatic circuit of the pressure arms: 4.0–4.2 bar;
Web tension: Start: 65 N/m, End: 55 N/m;
Rewind tension: Start: 45 N/m, End: 30 N/m;
Slitter knife pressure (slitter pressure): 2.8–3.0 bar;
Rewinding speed: 200 m/min.
2.2. Data Collection—Roll Weight Measurement
The data analyzed in this study were obtained from industrial practice from a manufacturer of filtration materials. The measurements were performed under the manufacturer’s standard operating conditions in accordance with its internal working procedures.
To minimize the most significant sources of variability, both the baseline (initial state—before) and validation (post-intervention—after) production series were processed using the same batch of filtration paper. All operations and measurements were performed by the same operator team. Environmental conditions—particularly temperature and humidity—were maintained within the standard operating range of the production facility, which reflects typical industrial practice and accounts for the hygroscopic behavior of the material.
A total of 448 rolls from two production series (224 pieces each) were included in the experiment. Each series consisted of seven cut positions and 32 consecutive windings. The first run represented the process’s initial state; the second run was obtained after implementing corrective actions.
2.3. Statistical Analysis
The statistical analysis aimed to evaluate the spatial variability of roll weight across individual slitting positions and to assess overall process performance, with particular emphasis on identifying position-dependent effects in the winding process under industrial conditions.
Basic descriptive characteristics were calculated from the measured values—Mean (xp), Standard Deviation (SD), Minimum and Maximum (Min, Max), Range (R), Median (M), and Percentage of Nonconforming Pieces (NOK).
Box plots were used to assess variability in roll weight across individual slitting positions. They allow graphical visualization of the median, intra-group variability (
IQR), and identification of outliers. After the specification limits (
LSL,
USL) are added to the graphs, they serve as an effective tool for assessing the uniformity of material distribution across the entire width of the master roll [
25,
26,
27,
28].
To statistically evaluate differences between individual slitting positions, a non-parametric Kruskal–Wallis test was applied, as the data did not meet the assumption of normality and involved comparison of more than two independent groups [
29]. When statistically significant differences were identified, post hoc Dunn’s test with Bonferroni correction was used to determine which specific pairs of cutting positions differed [
29].
Statistical Process Control (SPC) tools were applied to monitor the stability of the winding process. Although Shewhart control charts are primarily intended for the analysis of time-series data, in this study, they are used as a diagnostic tool to assess the spatial variability of a multi-stream production process with parallel slitting positions.
In a system with parallel slitting positions, multiple streams operate simultaneously under nominally identical conditions. This setup allows spatial variation across cutting positions to be interpreted analogously to within-subgroup variability in classical SPC. This approach assumes comparable operating conditions at all positions and a quasi-stationary process during each production cycle. Variability within a subgroup reflects differences between parallel positions rather than temporal shifts. Consequently, the control charts are therefore used to assess spatial consistency and identify position-dependent causes rather than time-related process changes.
The chart was used to monitor changes in the average weight of rolls and to detect systematic shifts, trends, or other process deviations. The chart was used to assess variability within individual subgroups. Each subgroup consisted of samples collected simultaneously from seven slitting positions (n = 7) across the width of the master roll. The within-subgroup variability, therefore, represents differences between parallel slitting positions rather than purely random variation. This approach facilitates the evaluation of the position-dependent variability in roll weight across the width of the master roll.
This approach represents a non-standard application of SPC tools and is used as a diagnostic method to identify position-dependent variability. Consequently, the interpretation of control limits and signals differs from classical SPC, as the charts do not reflect temporal process stability but rather spatial consistency across parallel production streams.
This adaptation has limitations, particularly the potential dependence between positions and the absence of explicit time dynamics. Therefore, the results should be interpreted as a diagnostic extension of SPC tools rather than a standard application of control charts. Control limits (
UCL and
LCL) were calculated in accordance with ISO 7870-2:2023, Part 2: Shewhart control charts [
12,
26,
30,
31].
Process performance was assessed using the indices
Pp and
Ppk, which are commonly used indicators of overall process quality when statistical process stability is not ensured. These compare the width of the specification tolerance interval with the observed process dispersion and provide information on how the process performs relative to the defined requirements. The
Pp index expresses the ratio of the tolerance band width to the process variability, without accounting for centering. The
Ppk index additionally accounts for the actual centering of the process with respect to the specification limits. By definition,
Ppk ≤
Pp, while their significant difference indicates an uncentered process. A
Ppk ≥ 1.33 serves as a common benchmark here, indicating acceptable performance (though not true long-term capability). The values below suggest optimization needs, prioritizing centering and reducing variability. Low
Pp/
Ppk values (<1.33) typically signal excessive dispersion or off-centering, requiring root cause analysis and process adjustments before transitioning to capability analysis (
Cp/
Cpk). Monitoring over time helps track improvements in overall performance [
12,
28,
32].
In this study, the Pp and Ppk indices were calculated from the complete set of measured data, including all cut positions, to assess the overall performance of the winding system. This approach allows capturing the impact of systematic positional variability on the global process behavior and distinguishing spatially induced performance degradation from random variability within individual positions.
It is important to distinguish between spatial consistency within parallel slitting positions and true long-term temporal statistical stability. In this study, the X-bar and R control charts were applied as diagnostic tools to evaluate spatial variability across simultaneously operating slitting streams rather than for classical time-based SPC monitoring.
Therefore, the observed in-control behavior of subgroup variation should not be interpreted as evidence of full statistical process control over time. A formal process capability assessment using
Cp and
Cpk would require verified long-term temporal stability under repeated production conditions. Since this condition was not established in the present study, only process performance indices (
Pp and
Ppk) were used to evaluate the overall system performance. Data processing and statistical calculations were performed using Microsoft Excel. The calculations were validated using standard SPC formulas in accordance with ISO 7870-2 [
30]. The methodology used was designed to be fully reproducible for subsequent production runs or similar manufacturing processes.
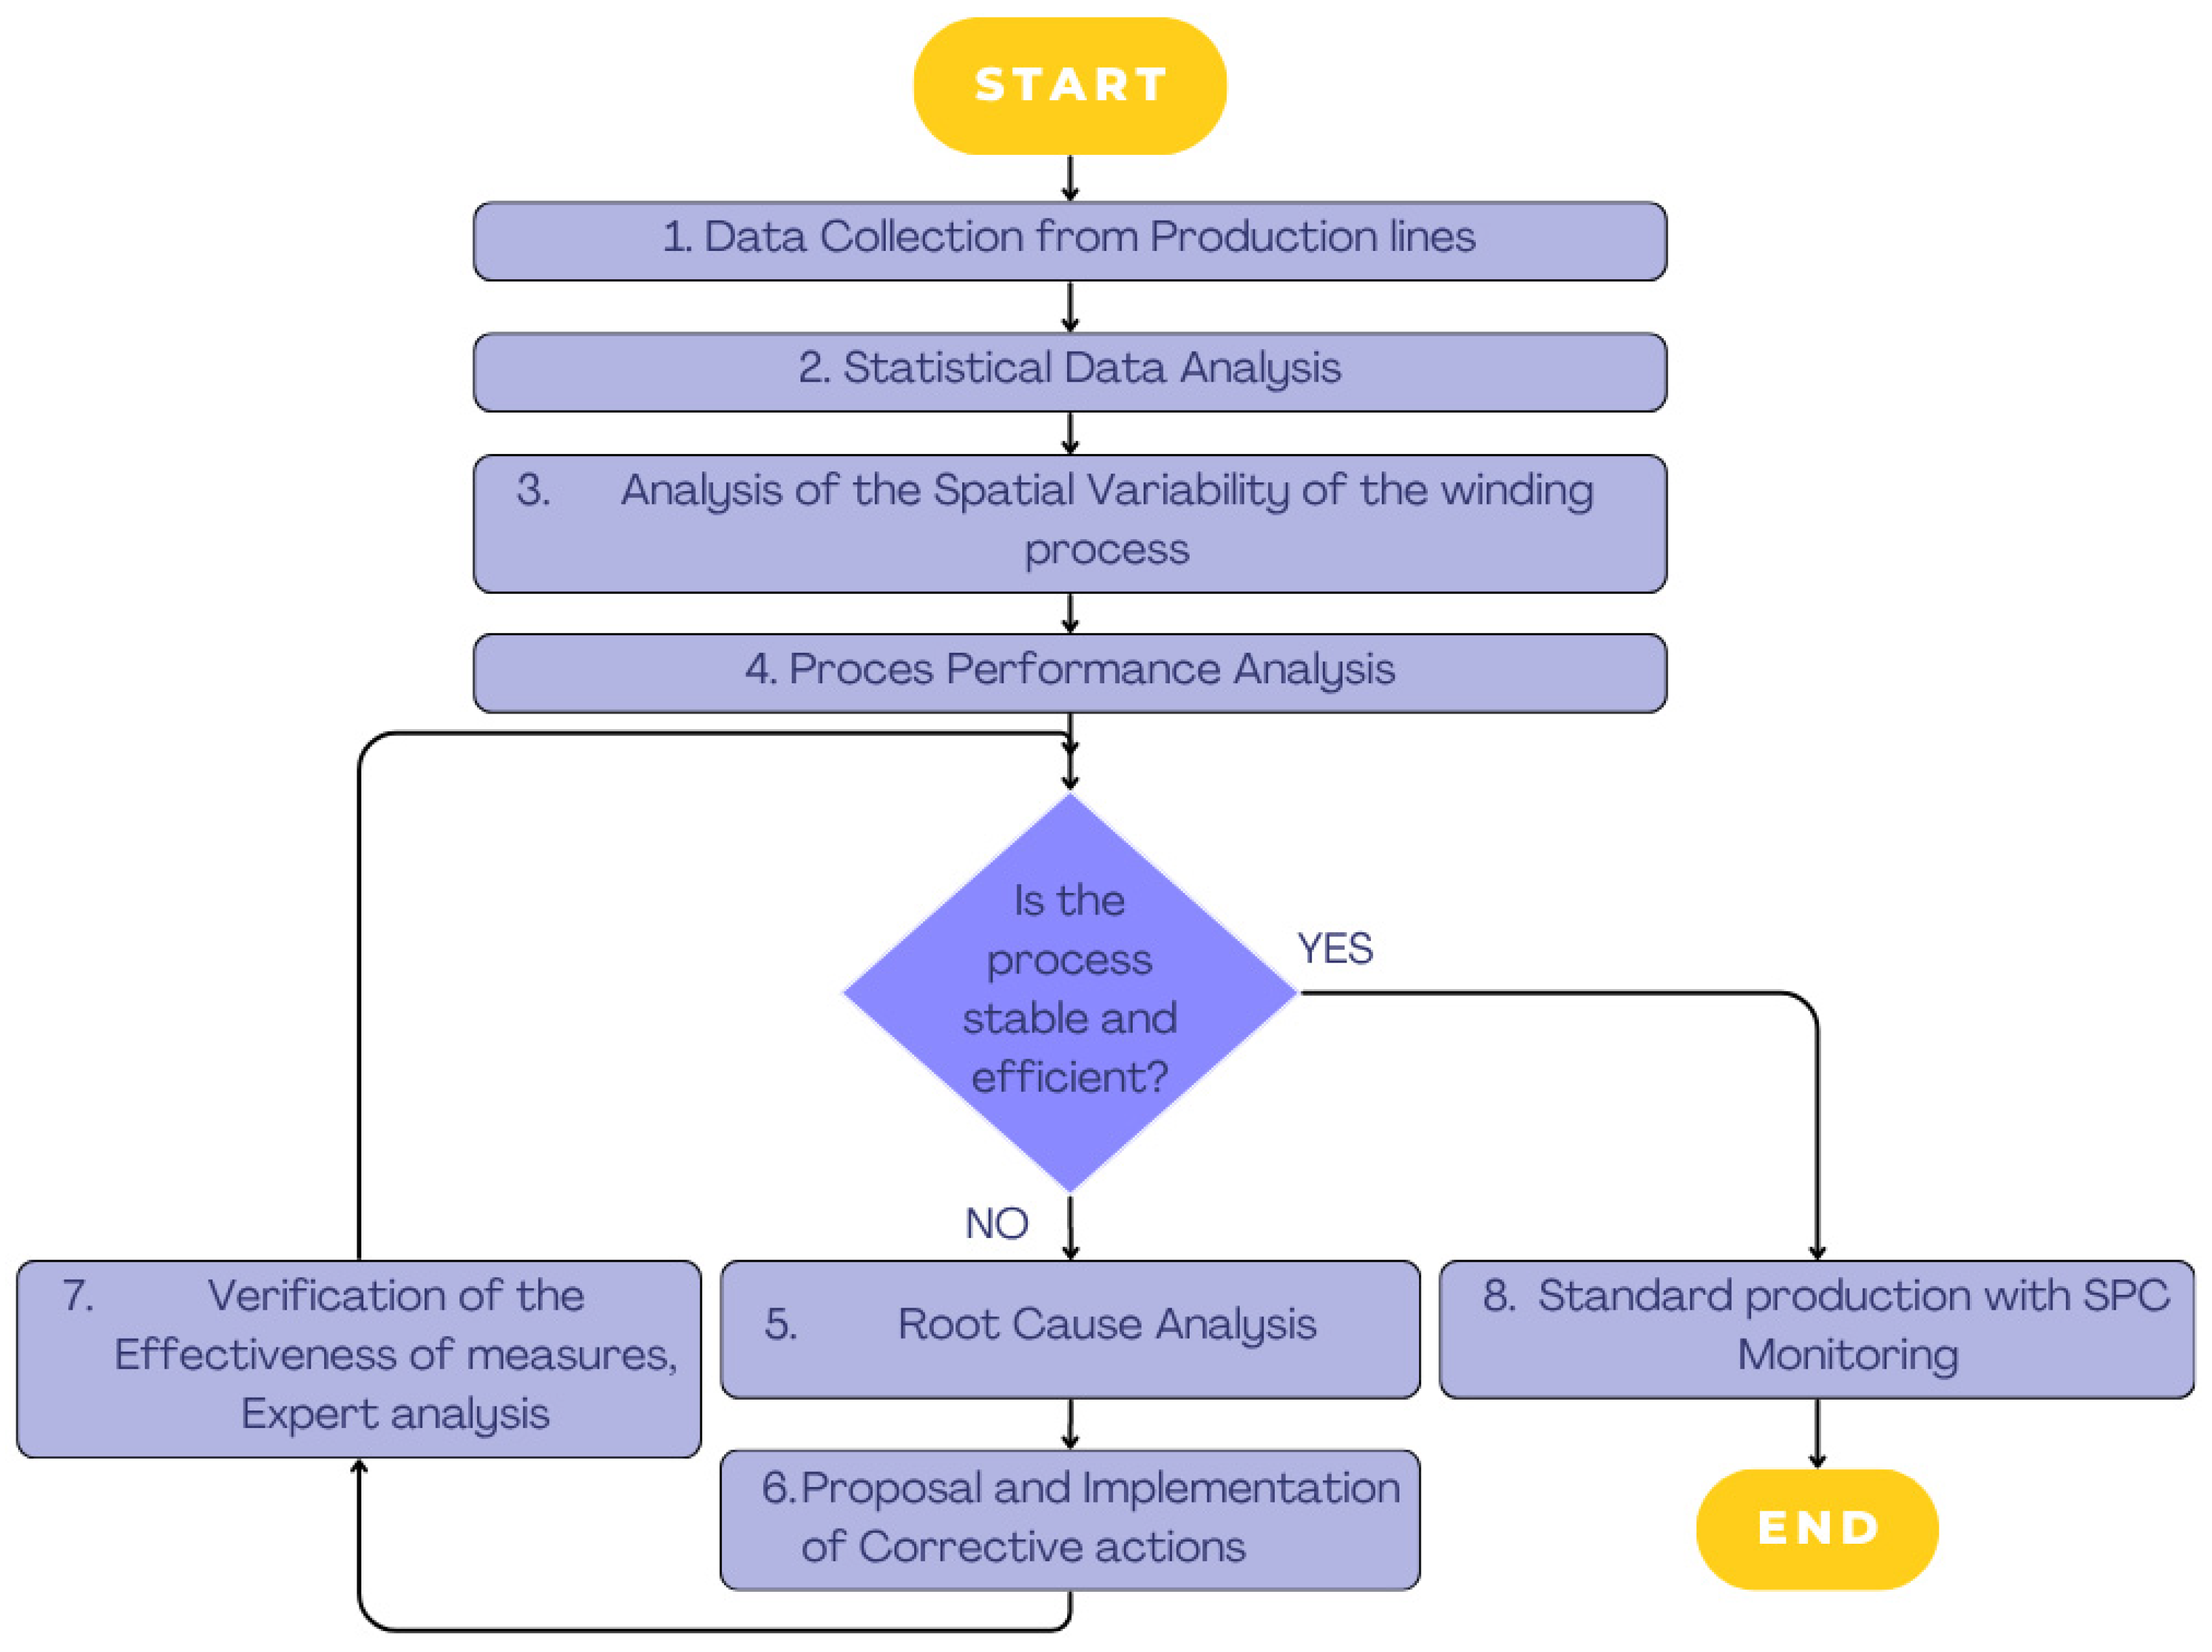
2.4. Proposal for a Methodical Procedure for Managing and Improving the Production Process
The main objective of the proposed methodology is to eliminate systematic deviations and stabilize processes with multi-position variability by combining statistical tools and Root Cause Analysis. This procedure provides a systematic, reproducible framework for analyzing, stabilizing, and improving the production process for slitting and winding rolls.
The methodological framework consists of the following interconnected phases (
Figure 2):
Phase 1—Data collection from production lines: Data collection occurred in two stages: the input group (n = 224), used to assess process instability, and the control group (n = 224), used to verify the effectiveness of corrective measures.
Phase 2—Statistical data analysis: Basic descriptive statistical characteristics (mean, median, standard deviation, range, NOK) were calculated. Boxplots with specified limits were used to visualize the distribution and identify potential outliers or deviations from expected behavior. Differences between individual slitting positions were assessed using the Kruskal–Wallis test.
Phase 3—Analysis of spatial variability of the winding process:
control charts were employed to assess process variability. Rather than tracking temporal changes, the charts evaluate variation within spatially defined subgroups across the width of the master roll, with data plotted against control limits (UCL and LCL) to identify local or systematic instabilities. In this context, control charts serve as a diagnostic and exploratory tool for revealing variability patterns in a multi-stream process, enabling visualization of both between-subgroup variability (differences between windings) and within-subgroup variability (differences between slitting positions).
Phase 4—Process performance analysis: Process performance indices (Pp, Ppk) were calculated at the global process level to assess the winding process’s ability to meet the specified weight limits. In this study, the Pp and Ppk indices were calculated from the complete dataset, encompassing all slit positions, to assess the overall performance of the winding system. This approach captures the impact of systematic positional variability (differences between individual streams) alongside random process noise. By evaluating the process as a whole, it is possible to identify performance limitations arising from spatial imbalance, in which individual streams may exhibit low internal variability but are not aligned with a common mean. Such systematic deviations would remain concealed if only within-stream variability were considered.
Phase 5—Root Cause Analysis: The 5 Whys method was used to identify the root causes of the identified nonconformities within the Quick Response Quality Control (QRQC) methodology.
Phase 6—Proposal and implementation of corrective actions: This phase focuses on the design and implementation of immediate measures using the QRQC methodology and permanent system measures according to the 4M approach.
Phase 7—Verification of the effectiveness of measures, expert analysis: In this phase, the process performance state is re-evaluated to confirm that the identified positional bias has been eliminated. The verification involves a multi-layered statistical comparison of the Before and After states. A Mann–Whitney U test is performed on the full dataset, followed by a differentiated analysis of the steady-state phase (excluding transient start-up effects). Performance metrics (Pp, Ppk, and NOK rate) are verified alongside a Brown-Forsythe test to confirm variance stabilization. If significant spatial differences or performance deficits persist during control collection, the process returns to phase 5 (Analysis 5 Whys). Otherwise, standard production is initiated.
Phase 8—Standard Production with SPC Monitoring: Based on the knowledge gained about the parameters, the processing procedures are maintained and improved, with an emphasis on a proactive approach. This final phase represents standard production with continuous SPC monitoring, which helps detect problems early and supports collaboration between individual production sections.
3. Results
3.1. Statistical Data Analysis
This subsection presents the results of the descriptive statistical analysis of the roll weight and the identification of position-dependent variability. A total of 224 rolls originating from seven slitting positions of the master roll and from 32 consecutive windings were analyzed.
For each slitting position, basic descriptive statistics were calculated, and a summary is given in
Table 1. The average weight of the entire series is 941.7 g, which represents a deviation of +11.7 g from the specified target value
T = 930 g. The overall standard deviation is 11.2 g, indicating moderate variability in the winding process that, in combination with the positional shift, affects overall process performance.
As shown in
Table 1, it is clear that the highest values of both the average and the proportion of Nonconforming Pieces are at slitting position 6, which indicates the existence of a local deviation.
Within the analyzed set (n = 224 pcs), 33 Nonconforming (NOK) Pieces of rolls were identified, which represents 14.7% of the total number of measurements. The occurrence of Nonconforming Pieces shows a significant positional dependence. The highest number of non-conformities was recorded at position 6, where up to 75% of the rolls exceeded the Upper Specification Limit, USL = 960 g. This result is the first statistical evidence suggesting the presence of a dominant special cause of variability associated with a specific position of the slitting mechanism.
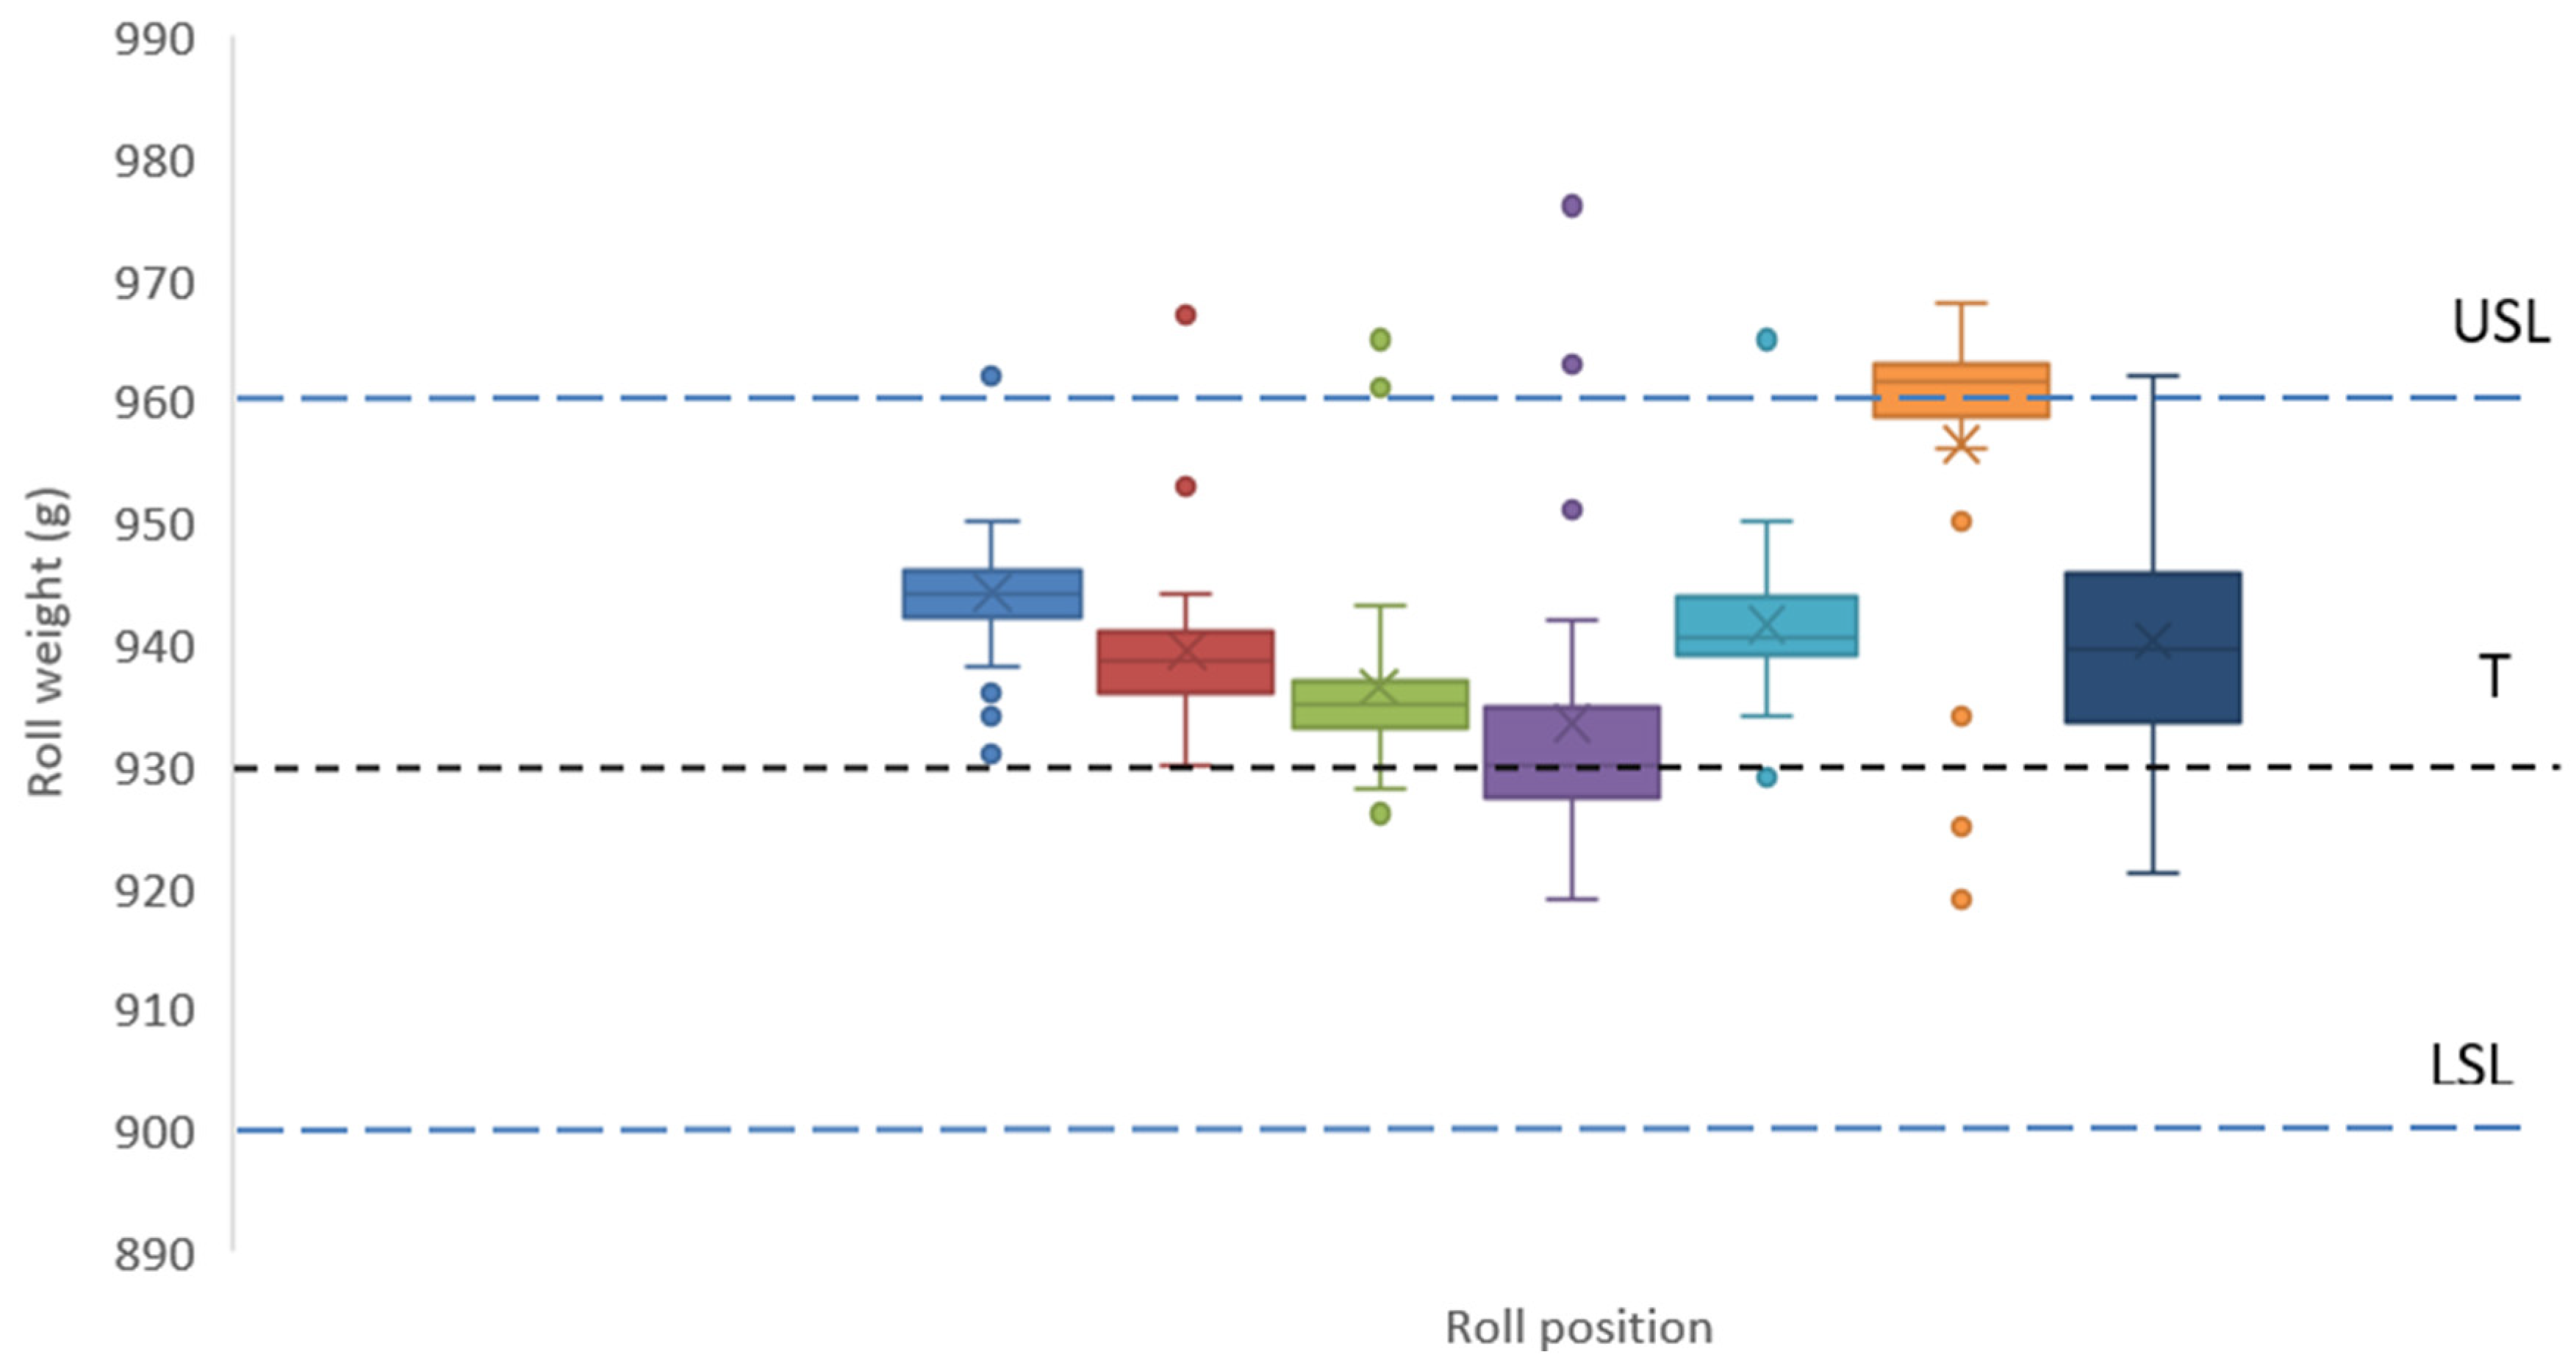
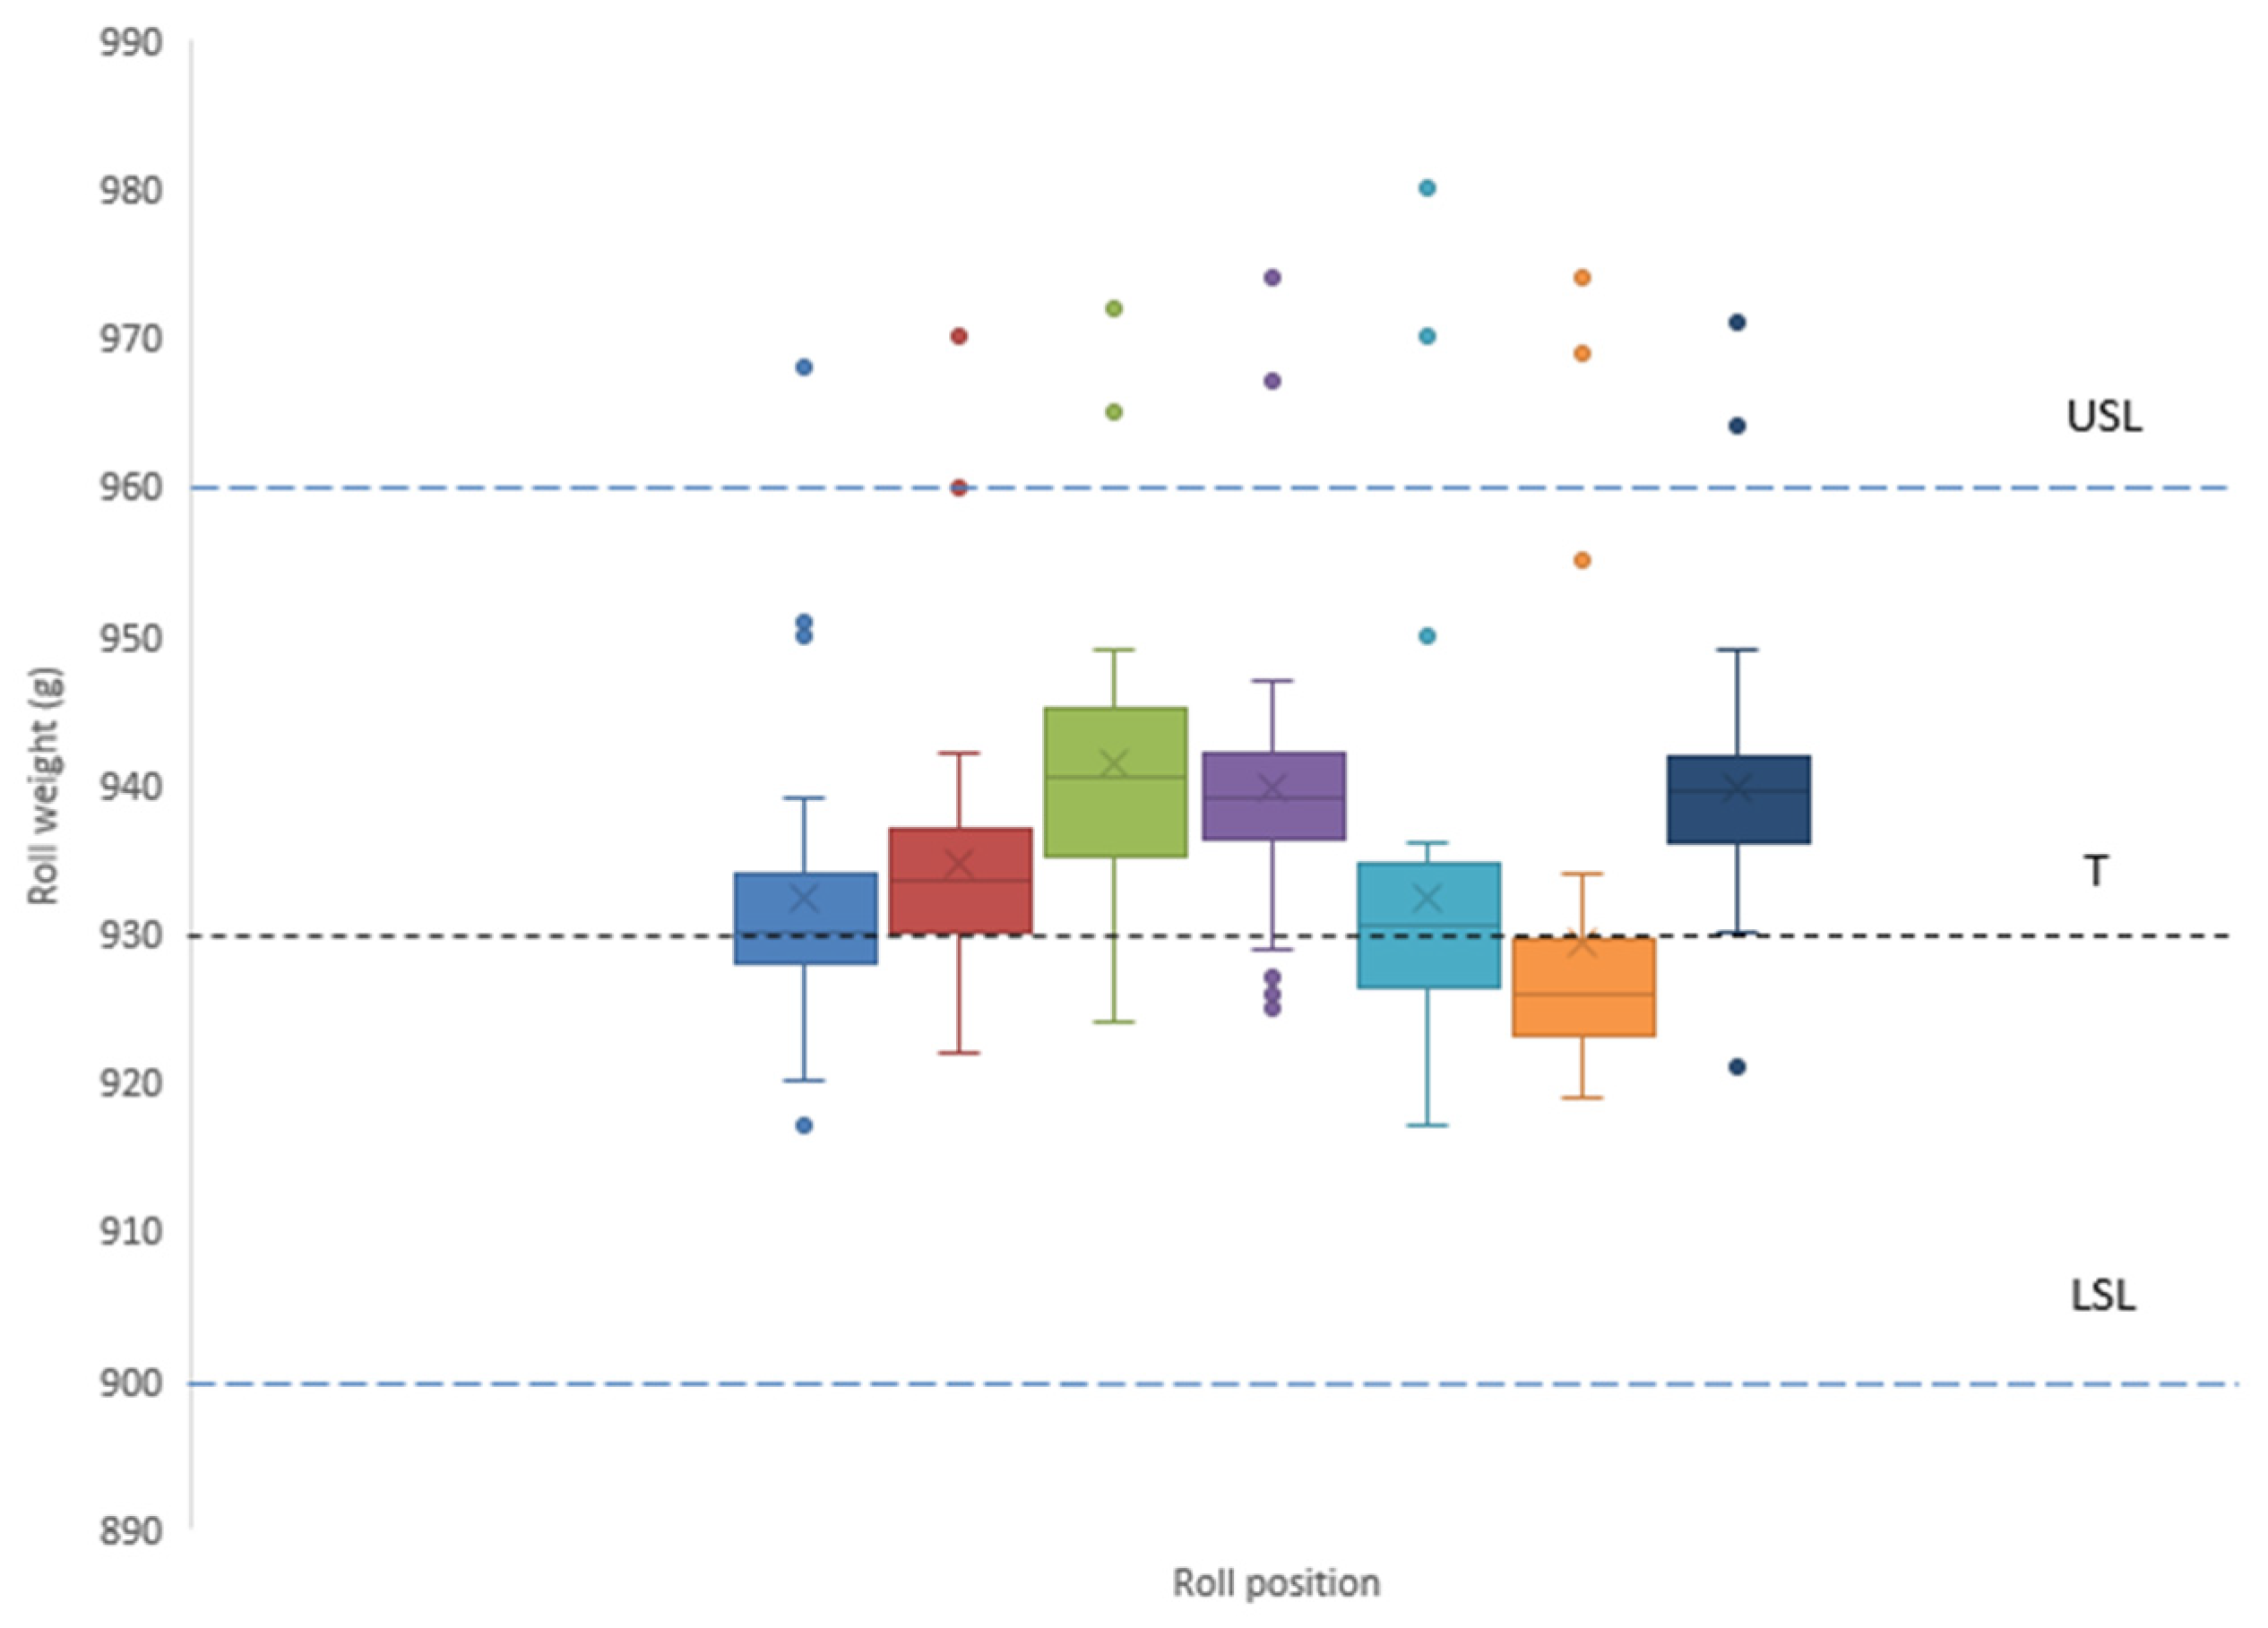
The differences between individual cutting positions were analyzed using box plots (
Figure 3). The different positions of the medians and the width of the interquartile range between the positions confirm that the process variability is not evenly distributed across the width of the master roll.
Most of the median values are located in the upper part of the tolerance band, above the target value of T = 930 g. A decreasing trend in the median is observed in the first four slitting positions, followed by a significant increase at position 6. The median at this position exceeds the Upper Specification Limit (USL) and is 961.5 g. Position 7 at the edge of the master rolls shows higher variability (a wider IQR) compared to the other positions.
Outliers are shown as individual points in the box plots. Their occurrence, especially in the right slitting positions, indicates an uneven distribution of material across the master roll’s width. The differences observed between positions are consistent with a systematic process shift towards higher weights, which is most pronounced on the right side of the master roll.
Statistical differences between slitting and winding positions (slitting streams) were tested using the Kruskal–Wallis test and post hoc Dunn’s test. The Kruskal–Wallis test revealed statistically significant differences between the individual slitting streams (H = 76.42, df = 6, p < 0.001), indicating that the distributions of measured values are not homogeneous across the process. The effect size was large (η2 = 0.31), confirming that the differences are practically relevant.
Post hoc Dunn’s tests with Bonferroni correction identified several significantly different stream pairs (x1–x3, x1–x4, x2–x6, x3–x5, x3–x6, x4–x5, x4–x6, x4–x7, x6–x7), demonstrating that the observed variability is systematic and related to the spatial position within the multi-stream slitting and winding process.
3.2. Analysis of the Spatial Variability of the Winding Process
This subsection presents the results of the evaluation of the variability of the winding process using
control charts, applied in accordance with the methodology described in
Section 2.4.
The data for these control charts were collected sequentially during the processing of a single master roll. Individual subgroups correspond to consecutive windings, each consisting of samples from seven slitting positions (n = 7). The horizontal axis of the control charts, therefore, reflects the production order (winding sequence) rather than explicitly measured time.
The rationale for this approach is that the studied process exhibits position-dependent variability, with different parallel streams (slitting positions) behaving differently within the same production run.
Table 2 shows the calculated parameters used in the control charts. The factors A2, D3, and D4 were determined for the range
n = 7 in accordance with ISO 7870-2.
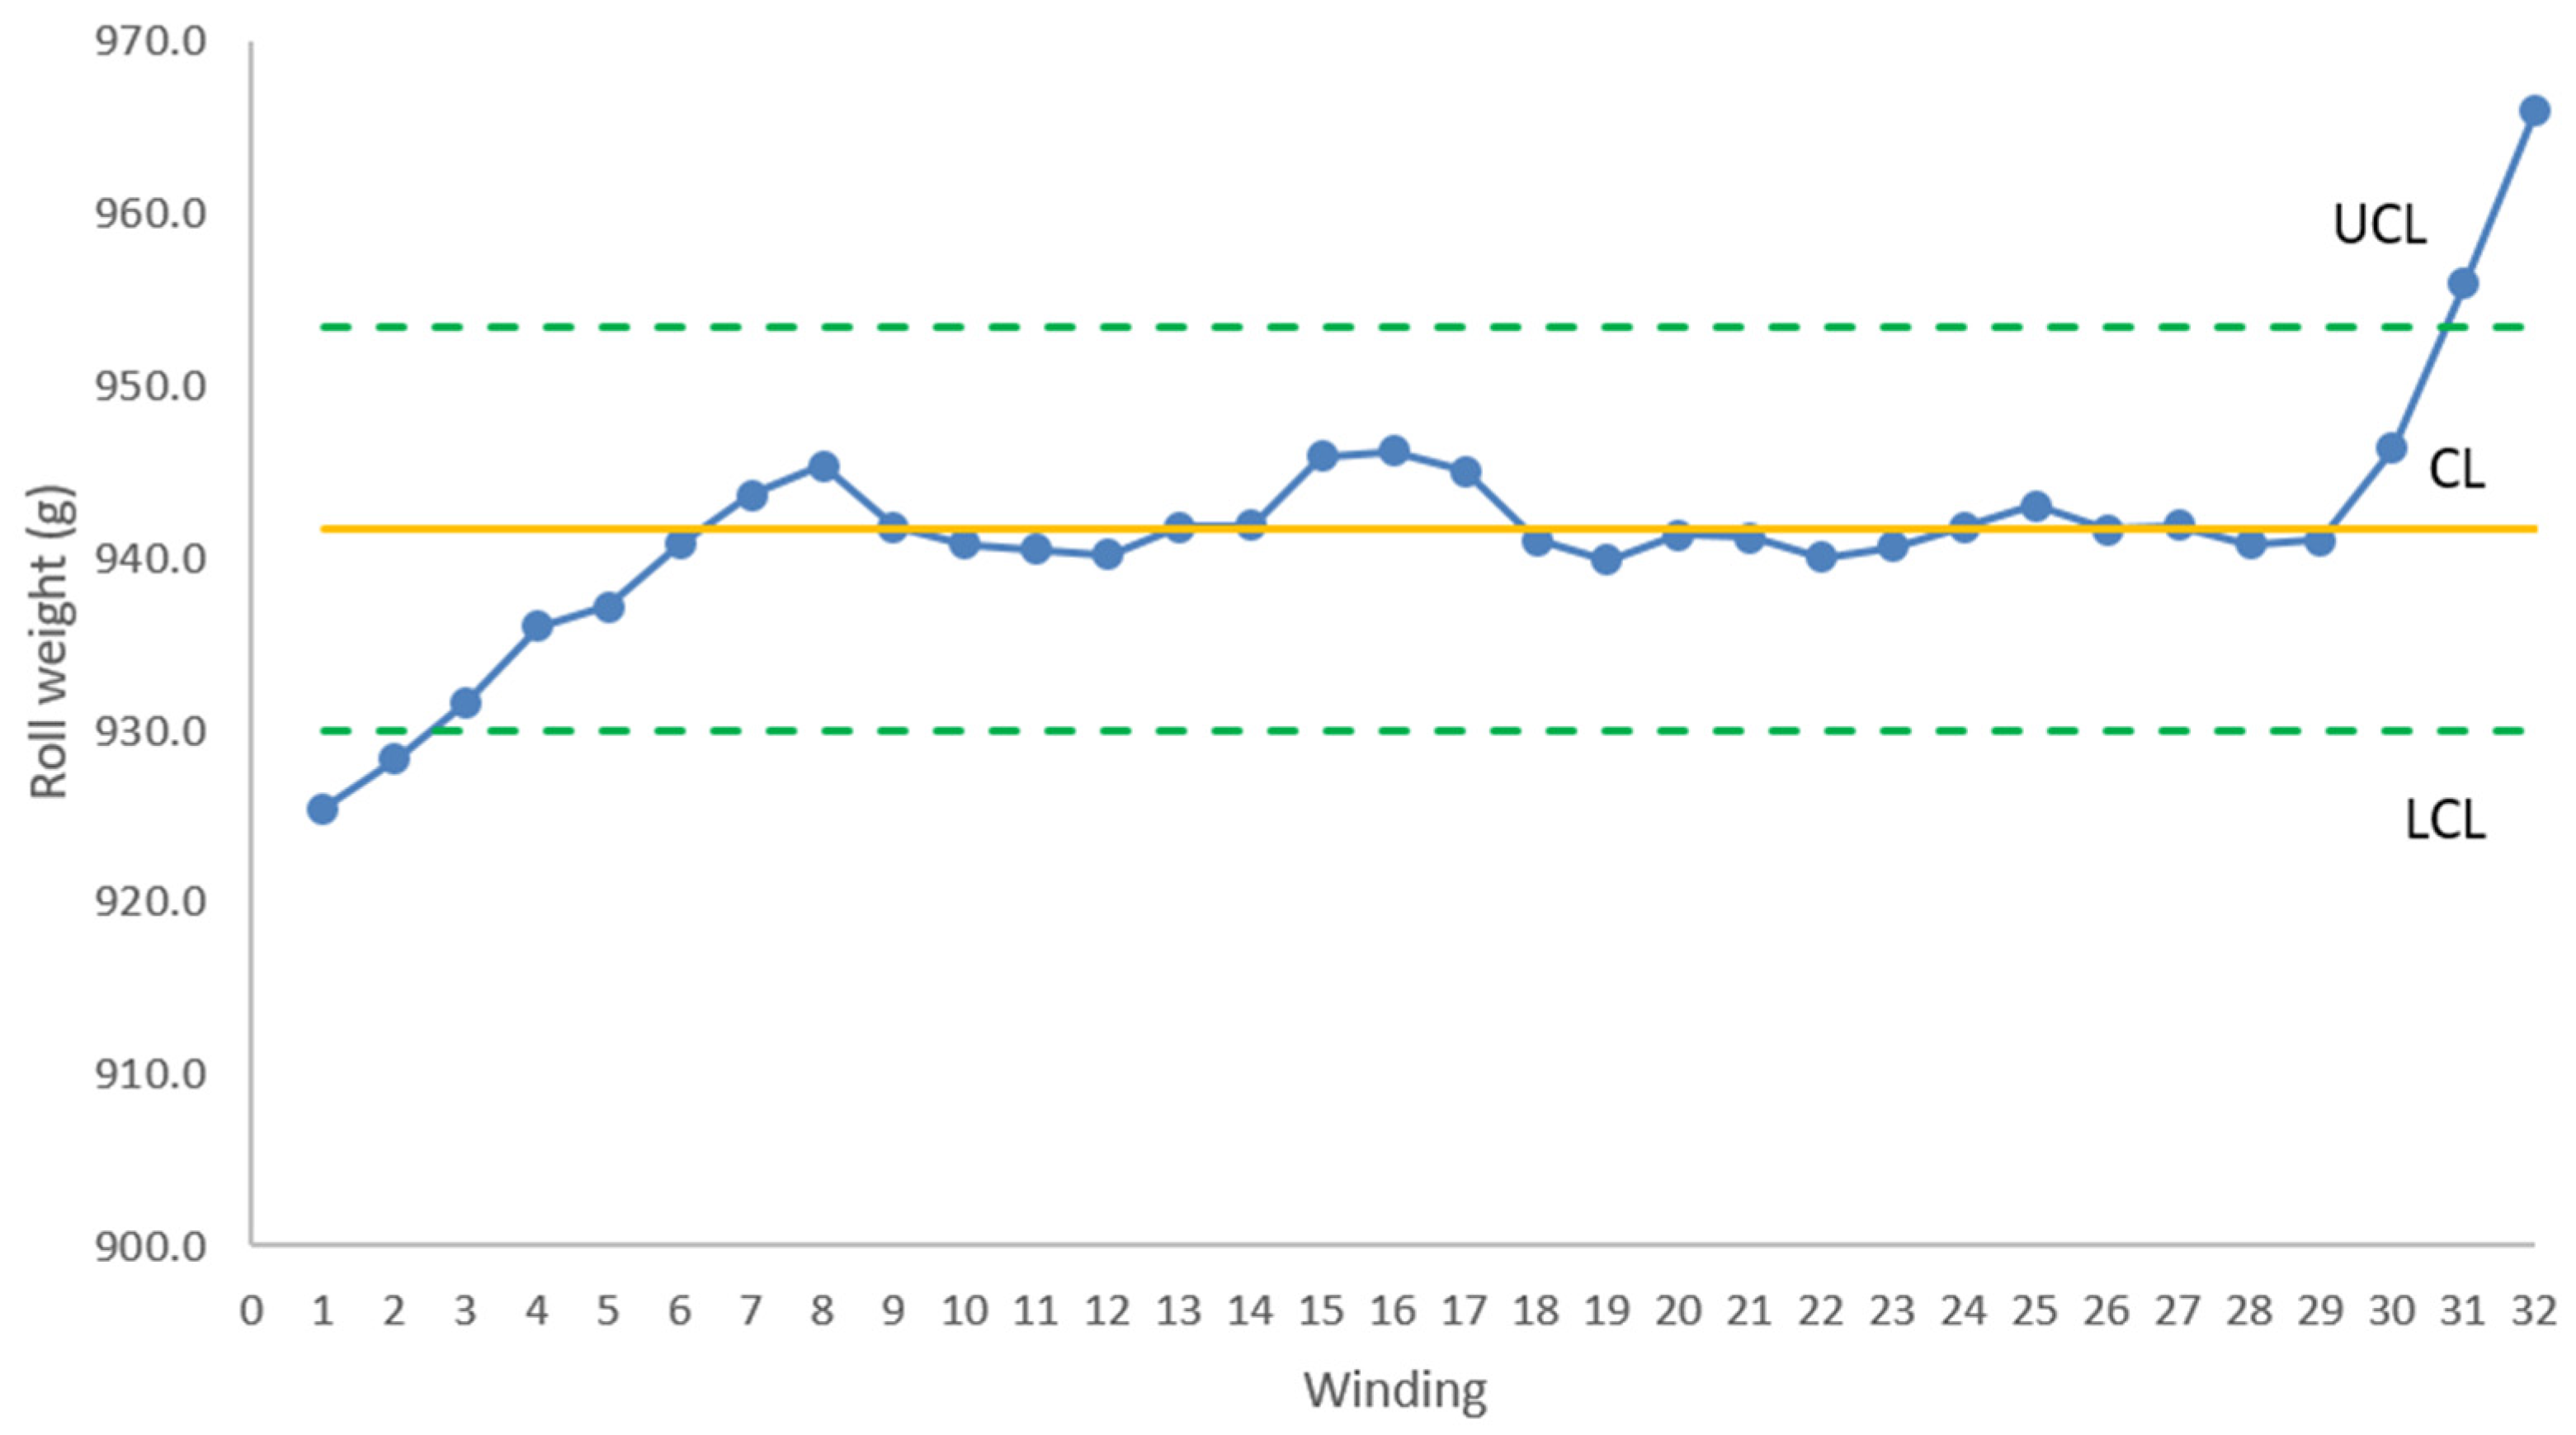
The control chart
(
Figure 4) shows that most of the monitored values are within the control limits (
UCL and
LCL). Towards the end of the monitored process (windings 29 to 32), there is an increase in weight, which may indicate a systematic deviation or a change in process conditions. The control chart
(
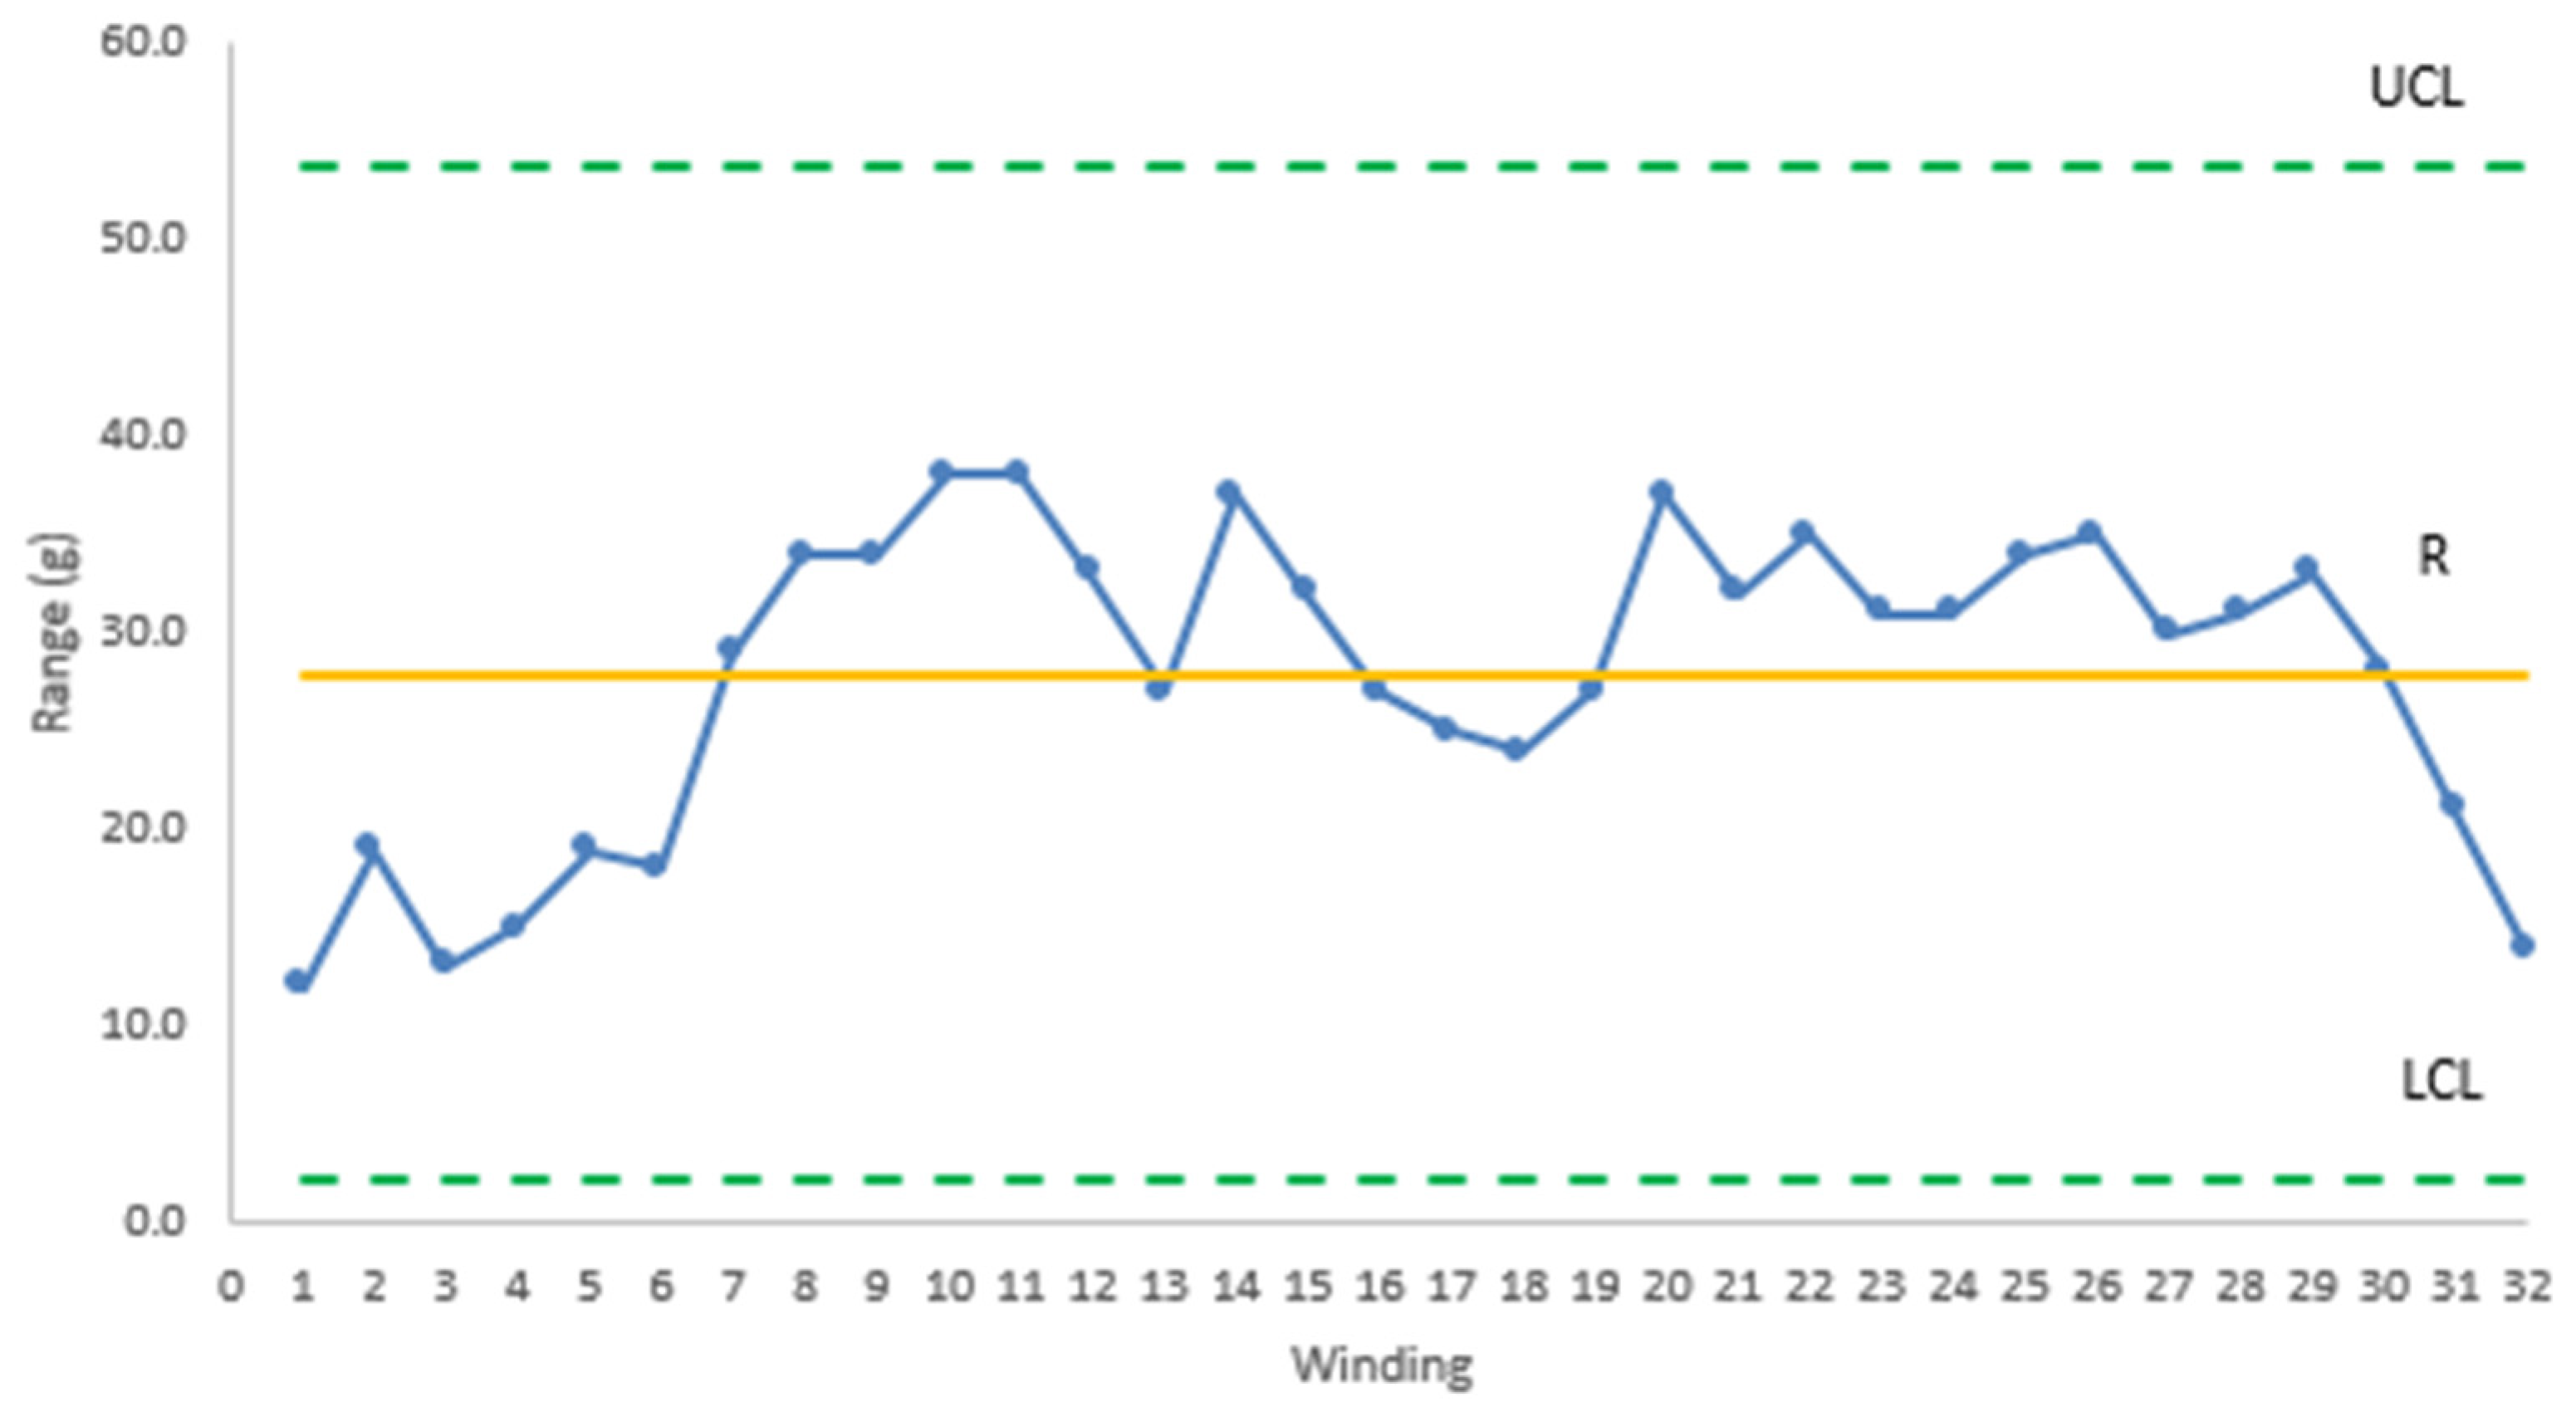
Figure 5) monitors the process variability between seven cut positions within individual windings. All range values are below the Upper Control Limit, and no sudden jumps in variability were recorded. The
indicates consistent within-subgroup variability across windings; however, it does not capture systematic differences between individual slitting positions.
The points exceeding the control limits are associated with non-stationary conditions (start-up/end phase) rather than random process instability. Therefore, the control charts should be interpreted as a diagnostic position-dependent variability and spatial consistency across the master roll width, rather than as evidence of long-term statistical process control.
3.3. Process Performance Analysis
Because formal long-term statistical control over time was not demonstrated, process capability indices Cp and Cpk were not considered appropriate. Instead, process performance indices Pp and Ppk were used to evaluate the overall behavior of the winding system under actual operating conditions, including both within-position variability and systematic differences between slitting positions.
The indices Pp and Ppk were calculated from an aggregated set of measured datasets, including all cut positions, to reflect the overall performance of the winding system as a whole. The resulting indices therefore reflect overall system performance rather than uniform behavior at individual slitting positions.
The calculated process performance index,
Pp = 0.89, indicates that the process variability exceeds the specified tolerance interval, as shown in the Boxplot (
Figure 3). A value below 1.00 indicates that the process is not technologically capable of maintaining the required quality in the long term and requires correction.
The performance index Ppk = 0.55, calculated relative to the Upper Specification Limit (USL), is significantly lower than Pp, indicating that the process is not centered. This difference suggests the presence of a systematic process shift towards higher weights. The process performance against the Lower Specification Limit (LSL) is satisfactory (Ppkl = 1.24), so the problem does not lie in excessive random variability but in a one-sided process shift.
A detailed analysis of the individual slitting positions showed that the overall unsuitability is caused by cut position 6. This position shows an average weight of 956.4 g, resulting in an extremely high incidence of nonconforming rate (75% NOK at this position). This result suggests that the low global values of the Pp and Ppk indices are due to significant local systematic deviation rather than a uniformly increased variability across all positions.
Based on the results, the process does not meet the required performance satisfactorily in its initial state, primarily due to significant process-centering issues and position-dependent variability.
3.4. Root Cause Analysis
Based on the identified discrepancies—higher average weight, an increase in weight towards the right position, and a high proportion of NOKs at position 6—the Quick Response Quality Control (QRQC) method was applied. The objective was to immediately identify and eliminate process variability associated with a specific slitting position and prevent the propagation of deviations into subsequent production stages.
The QRQC process consists of four standard phases:
Immediate containment of the deviation to prevent nonconforming pieces from reaching the customer or proceeding to subsequent production stages.
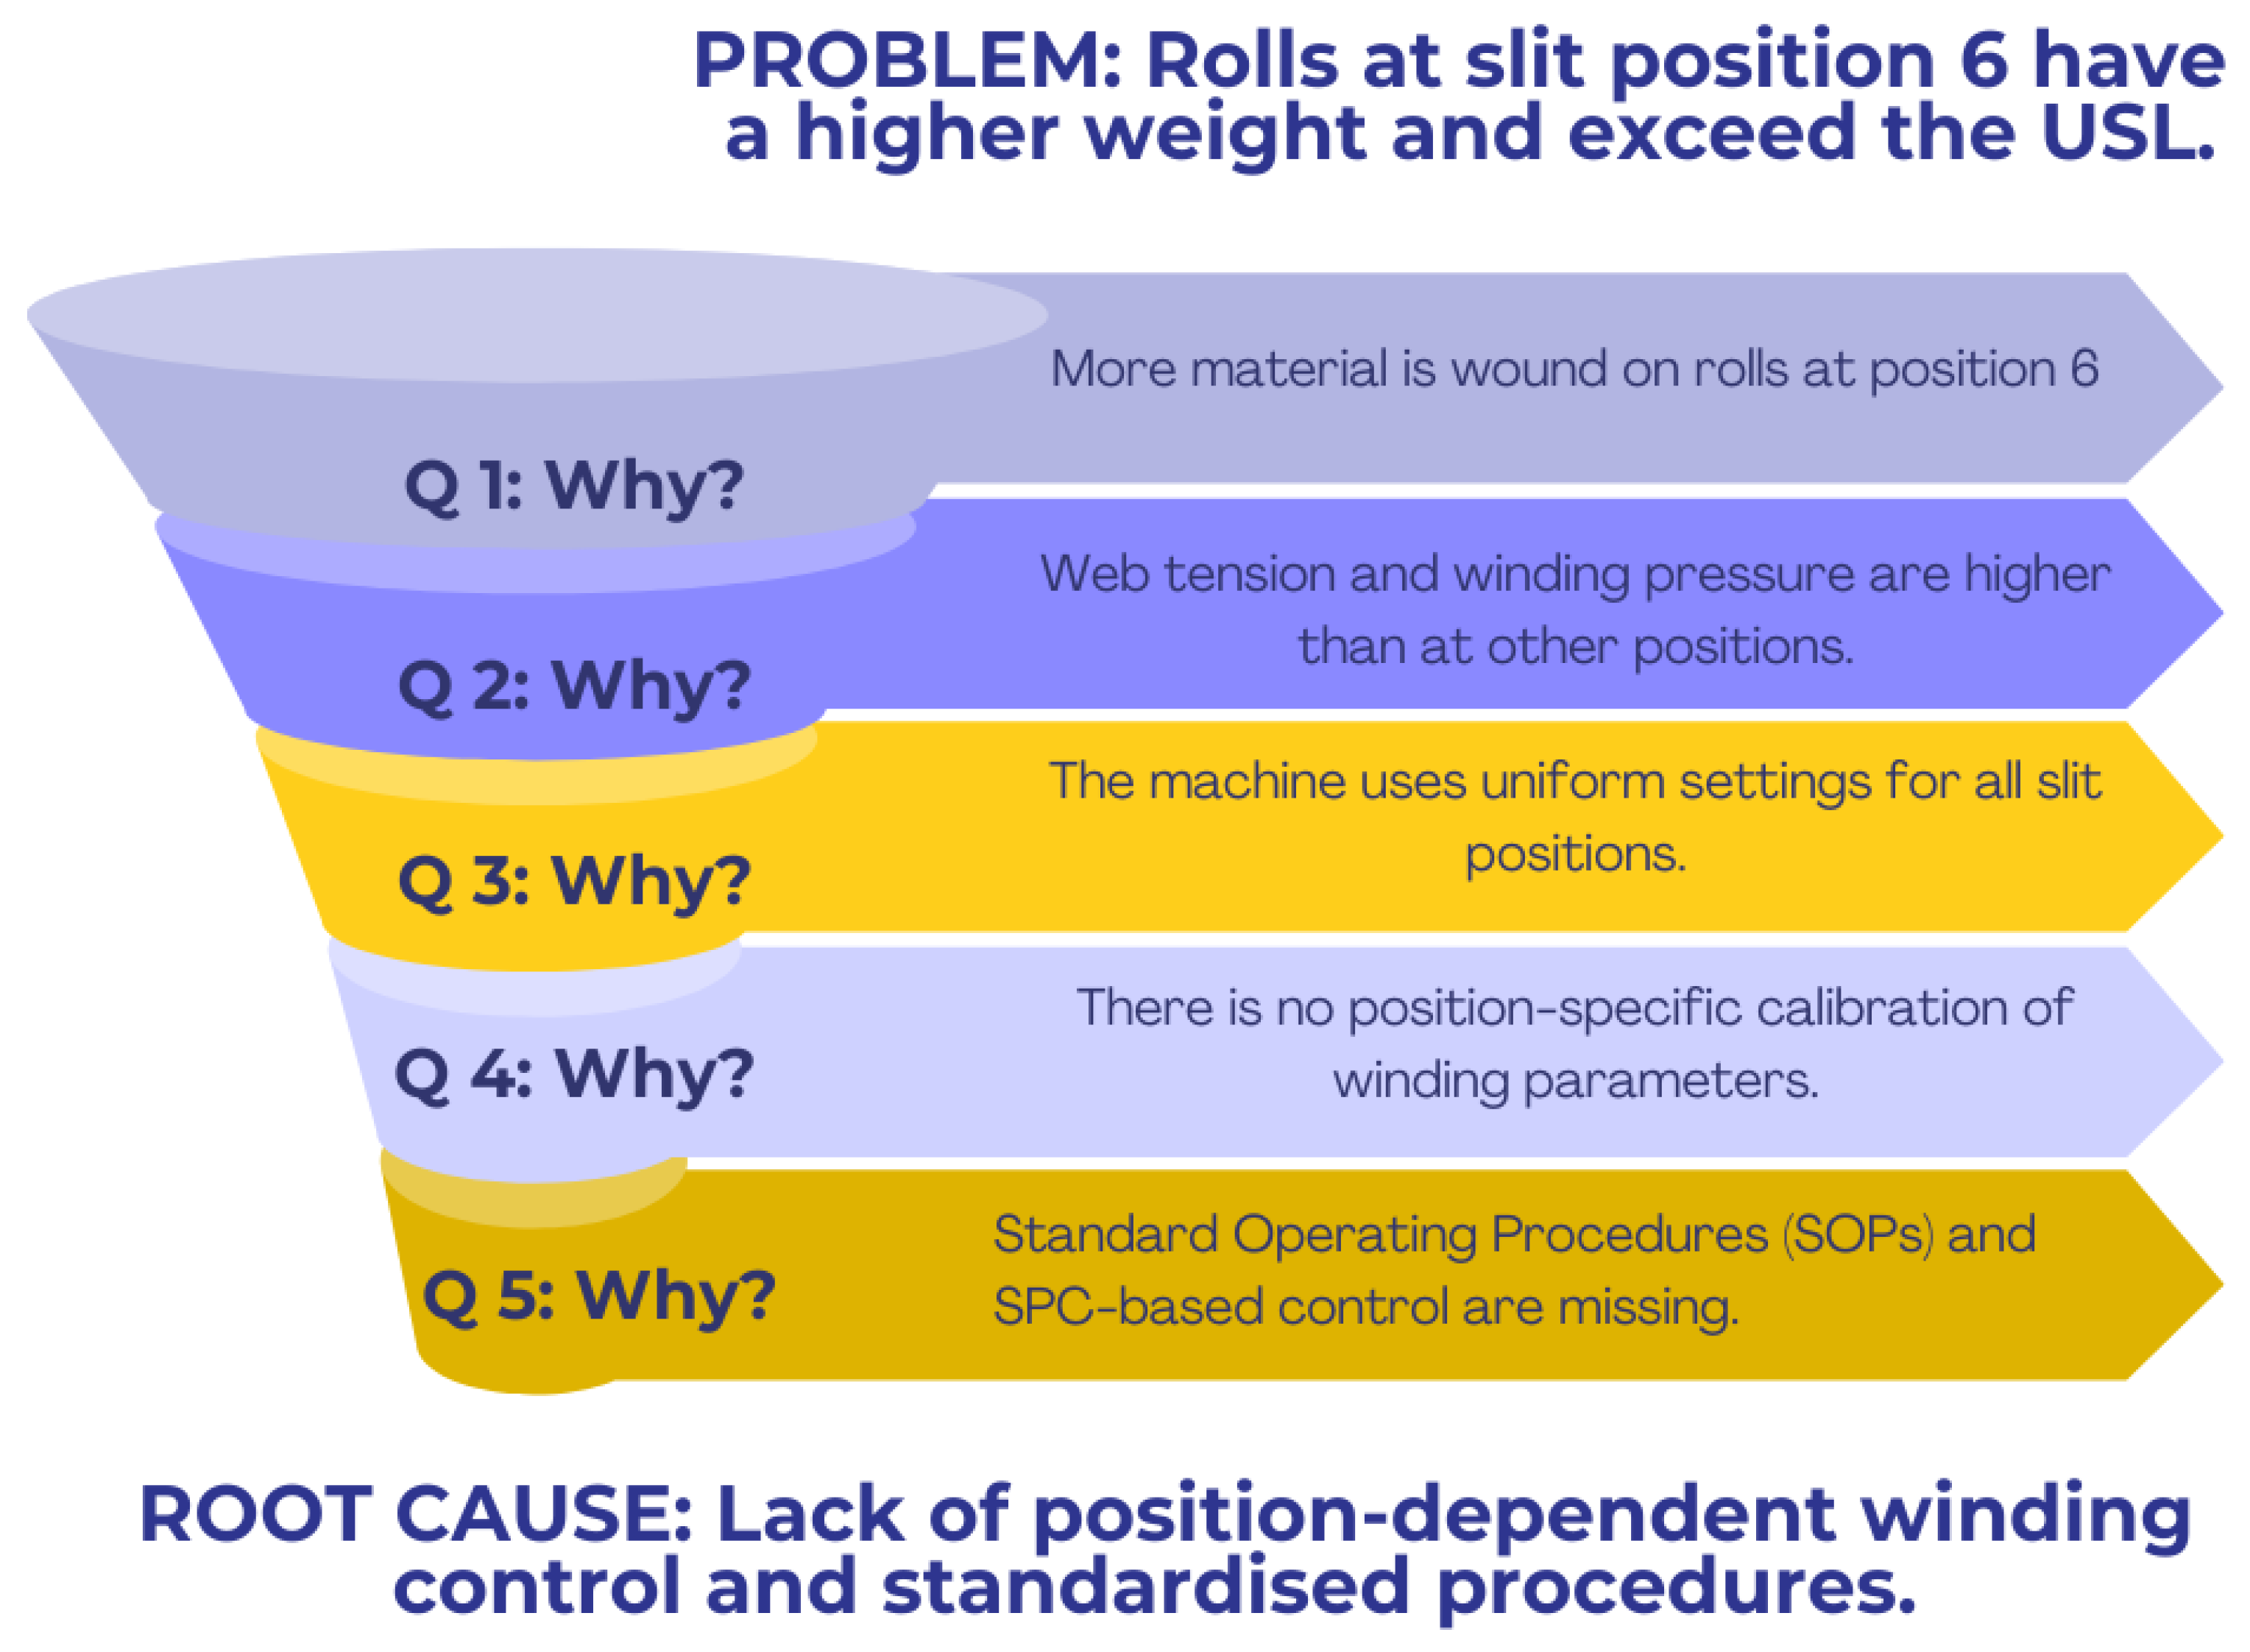
Root cause analysis using the 5 Whys technique to identify the underlying issue (
Figure 6).
Definition and implementation of corrective actions according to the 4M approach.
Verification of effectiveness.
The 5 Whys analysis suggests that the weight deviations, which were systematic rather than random, are likely associated with insufficient process control. The primary issue was observed at winding position 6, where increased effective pressure and web tension are likely associated with higher material compaction and, consequently, increased roll weight. Since direct engineering measurements via local force sensors were not feasible under standard operating conditions, these factors were identified through inferential analysis and a process of elimination. The probable root causes can be summarized as follows:
Absence of position-dependent winding control.
Lack of a Standard Operating Procedure (SOP) for weight balancing.
Insufficiently defined reaction plan for SPC deviations.
Uneven force distribution, possibly due to shared pneumatic circuit and mechanical factors.
In addition to these probable causes, several contributing factors were identified that may further influence the observed variability. The non-uniformity of the mass distribution across the width of the master roll can be partially explained by the orthotropic nature of cellulose filter paper, which is manifested as differing mechanical behavior in the longitudinal and transverse directions of the fibers [
33]. As a result, the material responds differently to tensile and compressive loads depending on the direction of the applied forces.
Furthermore, local differences in web tension between central and edge zones during slitting and rewinding may contribute to uneven material compaction. Another potential factor is a minor inaccuracy in the pressure settings of spreader rollers. Improper adjustment of these rollers may locally increase web tension, leading to non-uniform winding density. Finally, the condition of the slitting knives, particularly reduced sharpness or wear at position 6, can increase slitting resistance, locally affecting web tension and material behavior during rewinding. This effect can further promote higher material compaction and increased roll weight at the affected position.
It should be noted that the proposed explanations have not been directly validated through engineering measurements. As a result, the interpretation of the underlying mechanisms remains inferential.
3.5. Proposal and Implementation of Corrective Actions
Due to the weight limits being exceeded at position 6, a structured reaction plan based on the QRQC (Quick Response Quality Control) methodology was implemented. This approach ensures that any deviation from the specification is addressed through a standardized sequence of technical interventions, as shown in
Figure 7.
Based on the analysis, immediate corrective actions were proposed and implemented as part of the QRQC process to reduce variability in roll weight across individual slitting positions, eliminate winding irregularities, and achieve a more stable weight distribution in the finished rolls.
QRQC is activated in the following cases:
In addition to the reaction plan, immediate corrective actions were implemented to stabilize the process. These actions included:
Reduction of the pressure in the pneumatic circuit of the pressure arms by 0.3 bar, with the target operating range set at 2.3–2.8 bar.
Adjustment of the winding tension:
- -
start tension reduced from 45 N/m to 35 N/m,
- -
end tension reduced from 30 N/m to 25 N/m.
Verify the parallelism of the slitting knives.
Visual inspection and correction of material distribution across the master roll.
These actions were selected based on their expected impact on the most probable sources of variability and their feasibility within existing process constraints. The effectiveness of these actions was subsequently evaluated using a comparative analysis and statistical testing of production data, the results of which are presented in the following
Section 3.6.
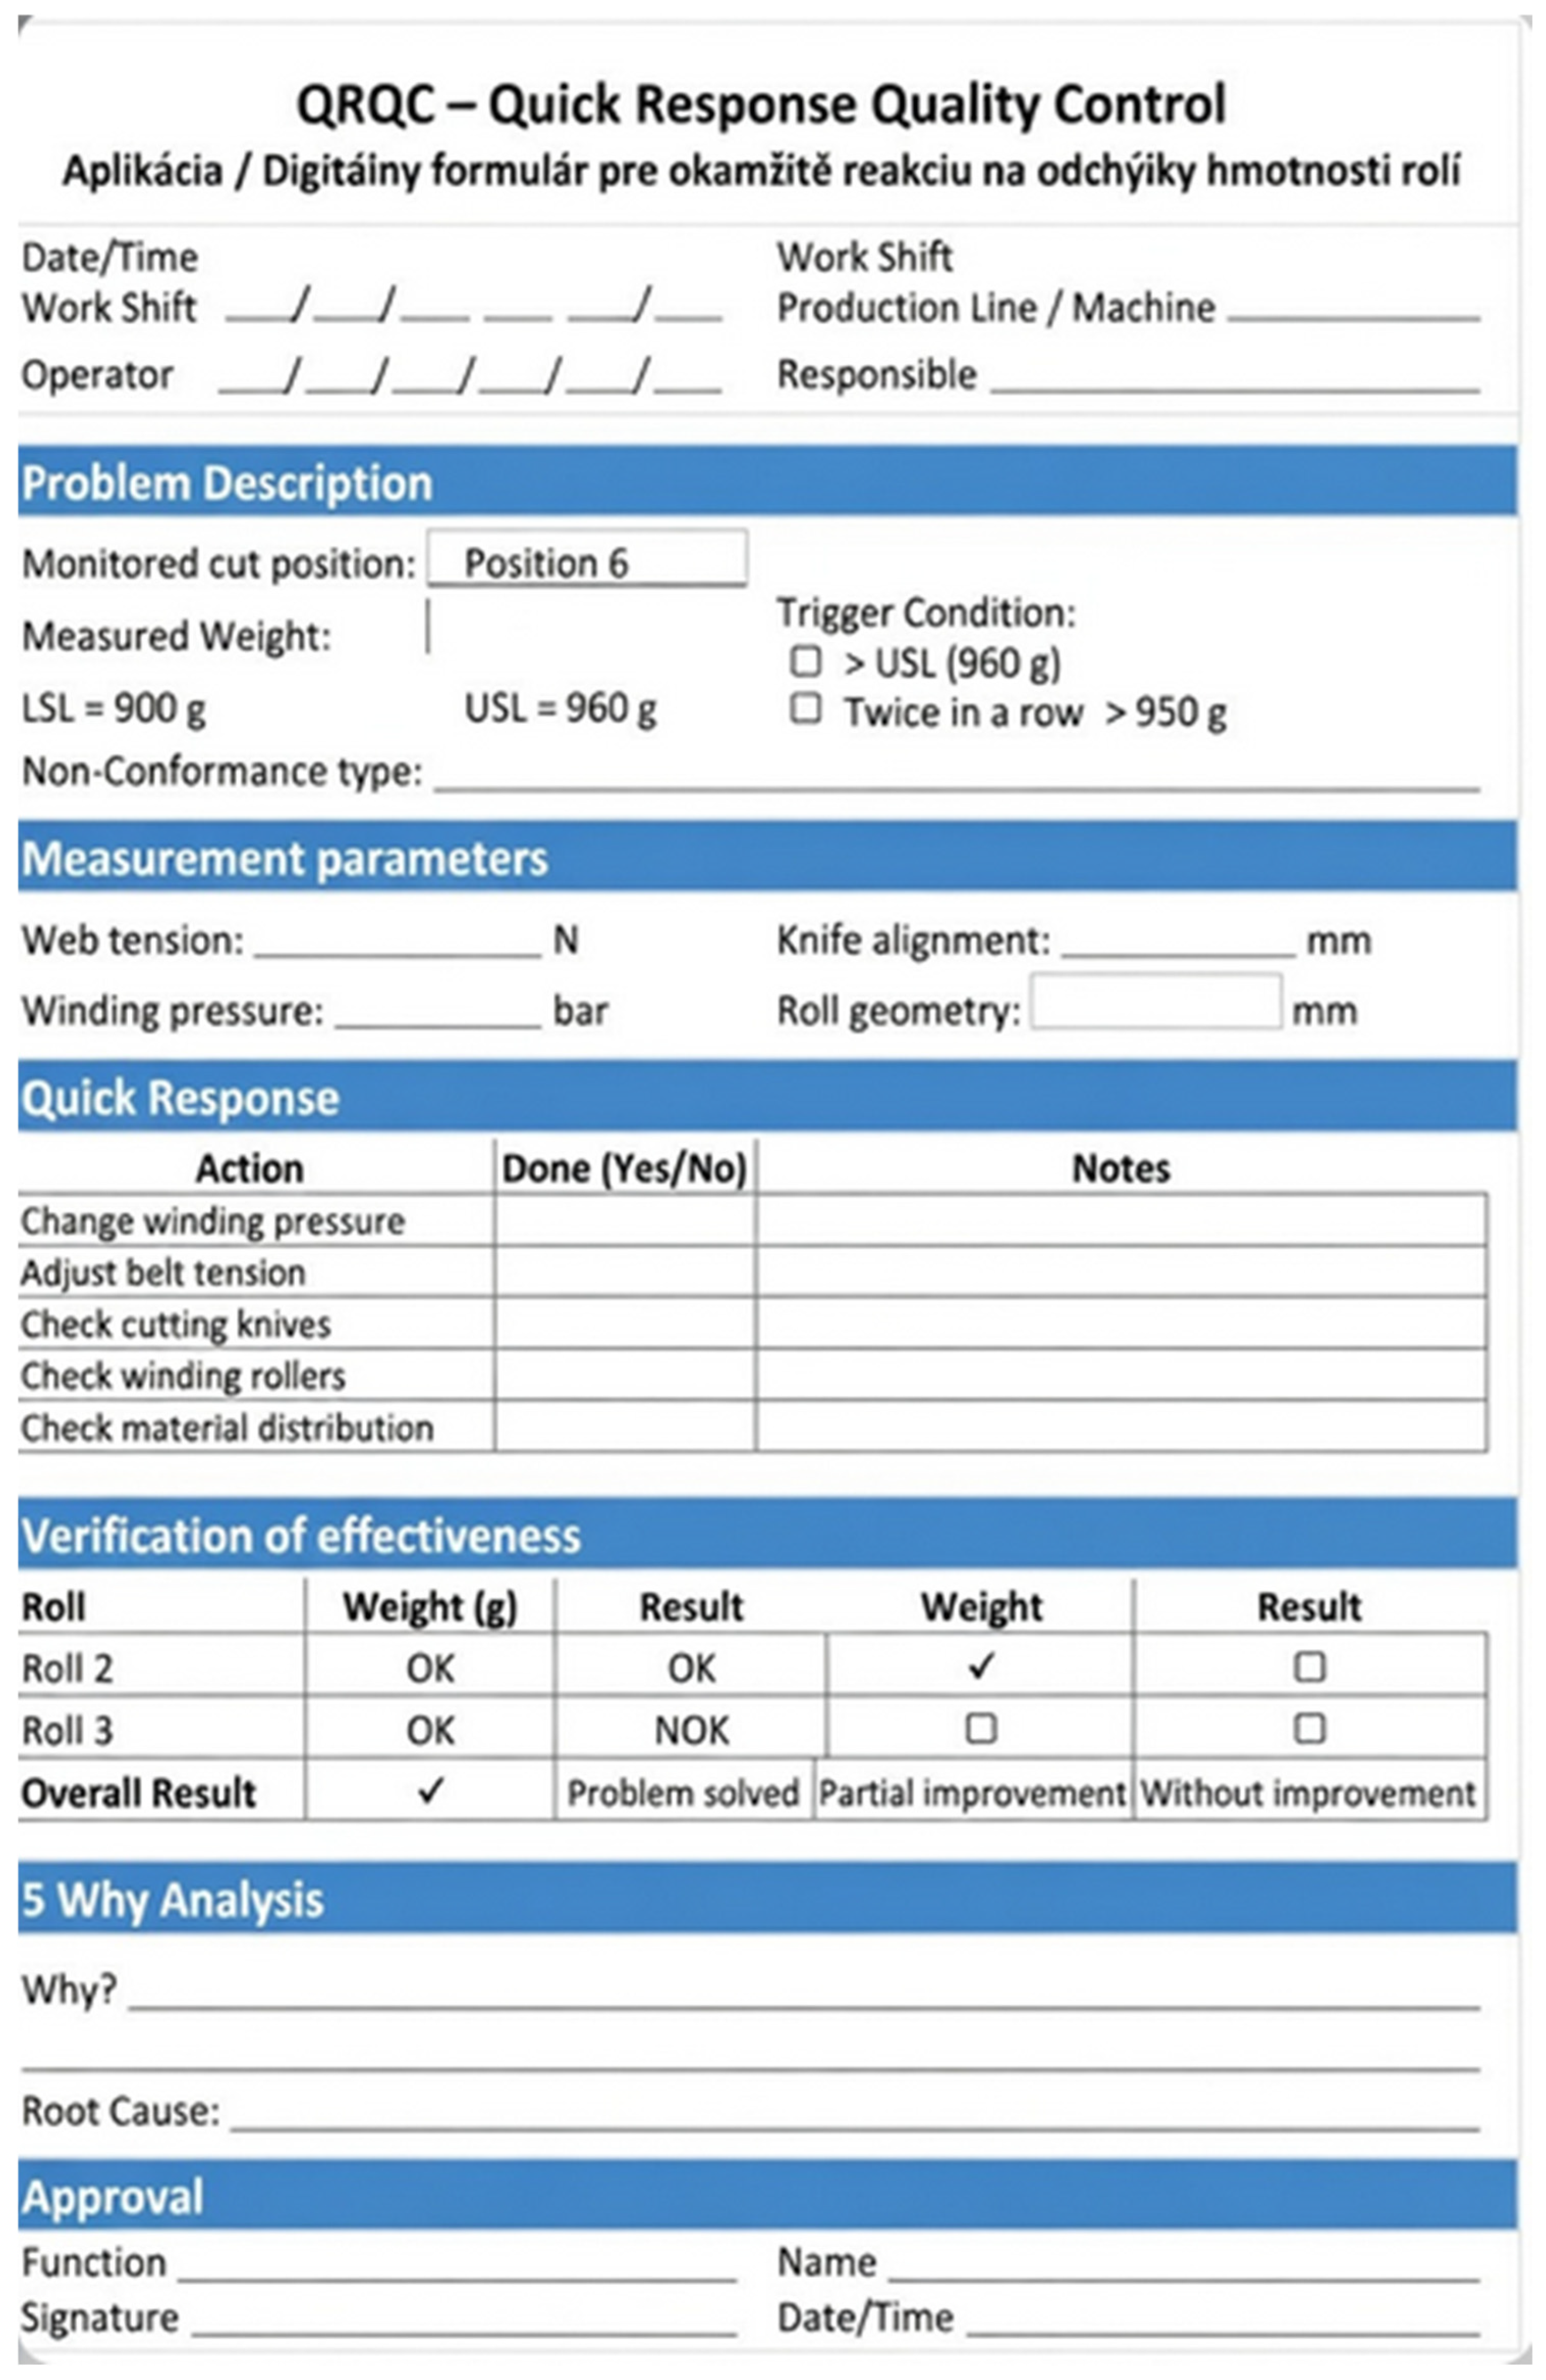
A standardized QRQC form was developed to document deviations, implemented actions, and verification results. The proposed QRQC form (
Figure 8) serves to document the identified problem, record the implemented measures, and subsequently verify their effectiveness. The form includes the cut position identification, the measured weight, the trigger condition for QRQC activation, the technical interventions performed, and the process verification results for three consecutive rolls.
The implementation of the QRQC system thus creates an operational mechanism for immediate response to identified local deviations and, at the same time, provides a basis for subsequent systematic improvement and standardization of the process.
In parallel with the immediate actions, permanent system-level corrective actions were designed based on the root cause analysis results and operational experience. The proposed actions aim to:
Reduce the weight differences between individual slitting positions.
Eliminate systematic weight drift towards the upper limit of the specification.
Reduce process variability.
Support improved process consistency and provide a basis for long-term stabilization.
The proposed measures have been systematically divided into the 4M categories (Machine, Methods, Measurement, and Man):
Machine—The winding system uses a shared pneumatic circuit for all seven pressure arms mounted on a single shaft. To compensate for mechanical losses and uneven force distribution, position and phase-dependent parameter adjustments were introduced. The nip pressure and the winding tension were optimized, as summarized in
Table 3.
These optimized settings account for mechanical differences in the master roll width, helping to achieve more uniform material winding.
- 2.
Method—A new Standard Operating Procedure (SOP) was developed and implemented within three days. The SOP was designed to stabilize the winding process and includes the following elements:
A dynamic plan for setting the pneumatic arm pressure and rewinding tension for each phase of the winding process.
A defined start-up procedure (first 5 min) and mandatory weighing of the first two rolls in each position.
Clear decision rules for activating QRQC and immediate corrective actions.
An additional measure involves in-process (inter-operational) weighing of rolls during winding, providing operators with immediate feedback on process behavior and enabling early intervention in the event of deviations.
- 3.
Measurement—To ensure reliable monitoring and control of the process performance, a comprehensive measurement and evaluation system was established. The implemented measures include:
SPC monitoring of roll weight by slitting position using control charts based on the sequence of windings.
In-process roll weighing with recording of key parameters (web tension, winding pressure).
Visual inspection of roll geometry (flatness of roll faces, edge parallelism), including detection of diameter non-uniformity and edge misalignment, which are direct consequences of uneven tension and pressure distribution across the web width.
Regular checks of the parallelism of the slitting knives, the pressure of the winding rollers, and the uniformity of the web tension are necessary to maintain stable process conditions during production.
Monitoring ambient humidity levels, as the hygroscopic nature of cellulose filter paper can cause fluctuations in the weight of the master rolls.
These actions enable rapid detection of local deviations before they result in nonconforming products.
- 4.
Man—Operators and shift leaders received targeted training focused on:
Understanding the effect of the shared pneumatic circuit and position-dependent variability.
Reading and interpreting the new position-specific charts.
Correct execution of QRQC procedures and manual fine-tuning of parameters.
Accurate documentation of measured values in the updated QRQC form.
Daily audits were introduced during the first two weeks after implementation to ensure consistent application of the new SOP.
The implementation of both immediate and system-level corrective actions created conditions for improved process control, better centering of the roll weight around the target value, and a reduction in the incidence of nonconforming products.
3.6. Verification of the Effectiveness of Measures: Expert Analysis
This subsection aims to evaluate the effectiveness of the implemented corrective measures by comparing statistical indicators of the process before and after their implementation. The descriptive characteristics of the roll weight, the proportion of Nonconforming pieces (NOK), the process performance indices Pp and Ppk, and the process behavior during production start-up were evaluated. In addition to descriptive statistics, the Mann–Whitney U test was applied to the full dataset to statistically compare the weight distributions before and after the corrective actions. Subsequently, the Brown–Forsythe test was utilized to evaluate the homogeneity of variances, specifically to determine whether the corrective actions led to a statistically significant stabilization of the process by reducing its variability during steady-state operation.
Box plots of the roll weight after the implementation of corrective measures for individual slitting positions are shown in
Figure 9. It is clear from the plots that outliers above the Upper Specification Limit,
USL = 960 g, occur at all slitting positions.
Based on data analysis and production records, it was found that these outliers occurred in the first two windings (start-up phase rolls) after the start of the process. These outliers occur due to unstable conditions during production start-up, especially when adjusting the winding pressure, strip tension, and machine speed. The exclusion of these start-up phase data points is justified because they reflect a non-representative transient state rather than a failure of the corrective actions themselves.
From a technical perspective, this initial variability is primarily caused by the pneumatic system’s latency in reaching the calibrated pressure of 2.3–2.8 bar across all six slitting positions and the mechanical inertia of the paper web before reaching the steady-state speed of 200 m/min. Specifically, the pressure stabilization delay leads to inconsistent contact between the winding drum and the paper roll, which momentarily affects the material density and, consequently, the roll weight. In the initial phase of the process, the technological parameters are not yet stabilized, leading to a temporary increase in the rolls’ weight. According to industry practice, defective initial rolls during the start-up of a multi-web slitting and rewinding process for cellulose paper are considered a common occurrence.
To verify the effectiveness of the corrective actions beyond the two series presented in this study, the process was further monitored over an extended period. This validation indicated that no further systematic deviations similar to those observed in the analyzed post-implementation series were identified during these subsequent production runs. These results suggest that the implemented corrective actions are effective during the process steady state, ensuring long-term consistency under standard operating conditions. After stabilization of the process conditions, the remaining roll weights are within specification limits and do not exhibit systematic exceedance of the USL.
The main statistical indicators of the process and the indices performance are listed in
Table 4 before and after the implementation of corrective actions. The table compares the calculated data before and after the implementation of corrective actions, as well as after the additional exclusion of the first two rolls corresponding to the non-stationary start-up phase.
The results show that, following the implementation of corrective actions, the average weight slightly decreased from 941.7 g to 935.4 g. After excluding the first two non-compliant start-up windings in all slitting positions, the average weight further decreased to 933.5 g. A similar trend was observed for the median, which stabilized at 934.0 g after the corrective measures and remained unchanged after the start-up windings were excluded.
The standard deviation decreased slightly from 11.2 g to 11.1 g after the implementation of corrective measures, and then substantially to 7.3 g after the exclusion of the first two windings. This reduction indicates a significant decrease in process variability.
The nonconforming product (NOK) rate decreased from the initial 14.7% to 6.0% following corrective actions. After excluding the two windings, it reached zero, indicating that non-conformities were eliminated under the evaluated conditions.
To validate the impact of the implemented corrective actions, a Mann–Whitney U test was conducted to compare the weight distributions before and after the corrective actions. The test confirmed a statistically significant difference between the Before and After datasets (U = 16,274.5, Z = 6.44, p < 0.001). The calculated effect size indicates a medium practical impact (r = 0.32), suggesting that the results are not attributable to random variation. To assess differences in variability between the Before and After datasets, the Brown–Forsythe test was applied. No statistically significant differences in variability were observed between the groups (W = 0.4380, p = 0.5085), indicating homoscedasticity under the original data conditions. However, after excluding the initial start-up rolls from the analysis, the Brown–Forsythe test revealed a statistically significant difference in variability (W = 5.9462, p = 0.0028), indicating the presence of heteroscedasticity between the compared datasets and confirming the impact of the stabilization phase.
In terms of process performance, the Pp and Ppk indices showed a modest improvement following the implementation of corrective actions, with more pronounced changes observed after the exclusion of the first two rolls. The exclusion of the first two windings was performed to eliminate the non-stationary phase, which previously contributed to increased variability and nonconforming outputs.
Before implementing corrective actions, the process exhibited insufficient performance, with Pp = 0.89 and Ppk = 0.55, indicating both high variability and poor process centering relative to specification limits. After the implementation of corrective actions, both indices improved moderately, with Pp increasing to 0.90 and Ppk to 0.73. This indicates a positive effect of the corrective measures, mainly reflected in improved process cantering, although the process still remained statistically incapable (Ppk < 1.0).
Overall, the results indicate that while corrective actions led to a measurable improvement in process centering, performance (Ppk = 1.21) is acceptable primarily under steady-state conditions, although it remains below the more stringent industrial target of 1.33. This suggests that the excessive initial variability is largely inherent to the start-up phase rather than the core process parameters.
Additional Corrective Action for the Start-Up Phase
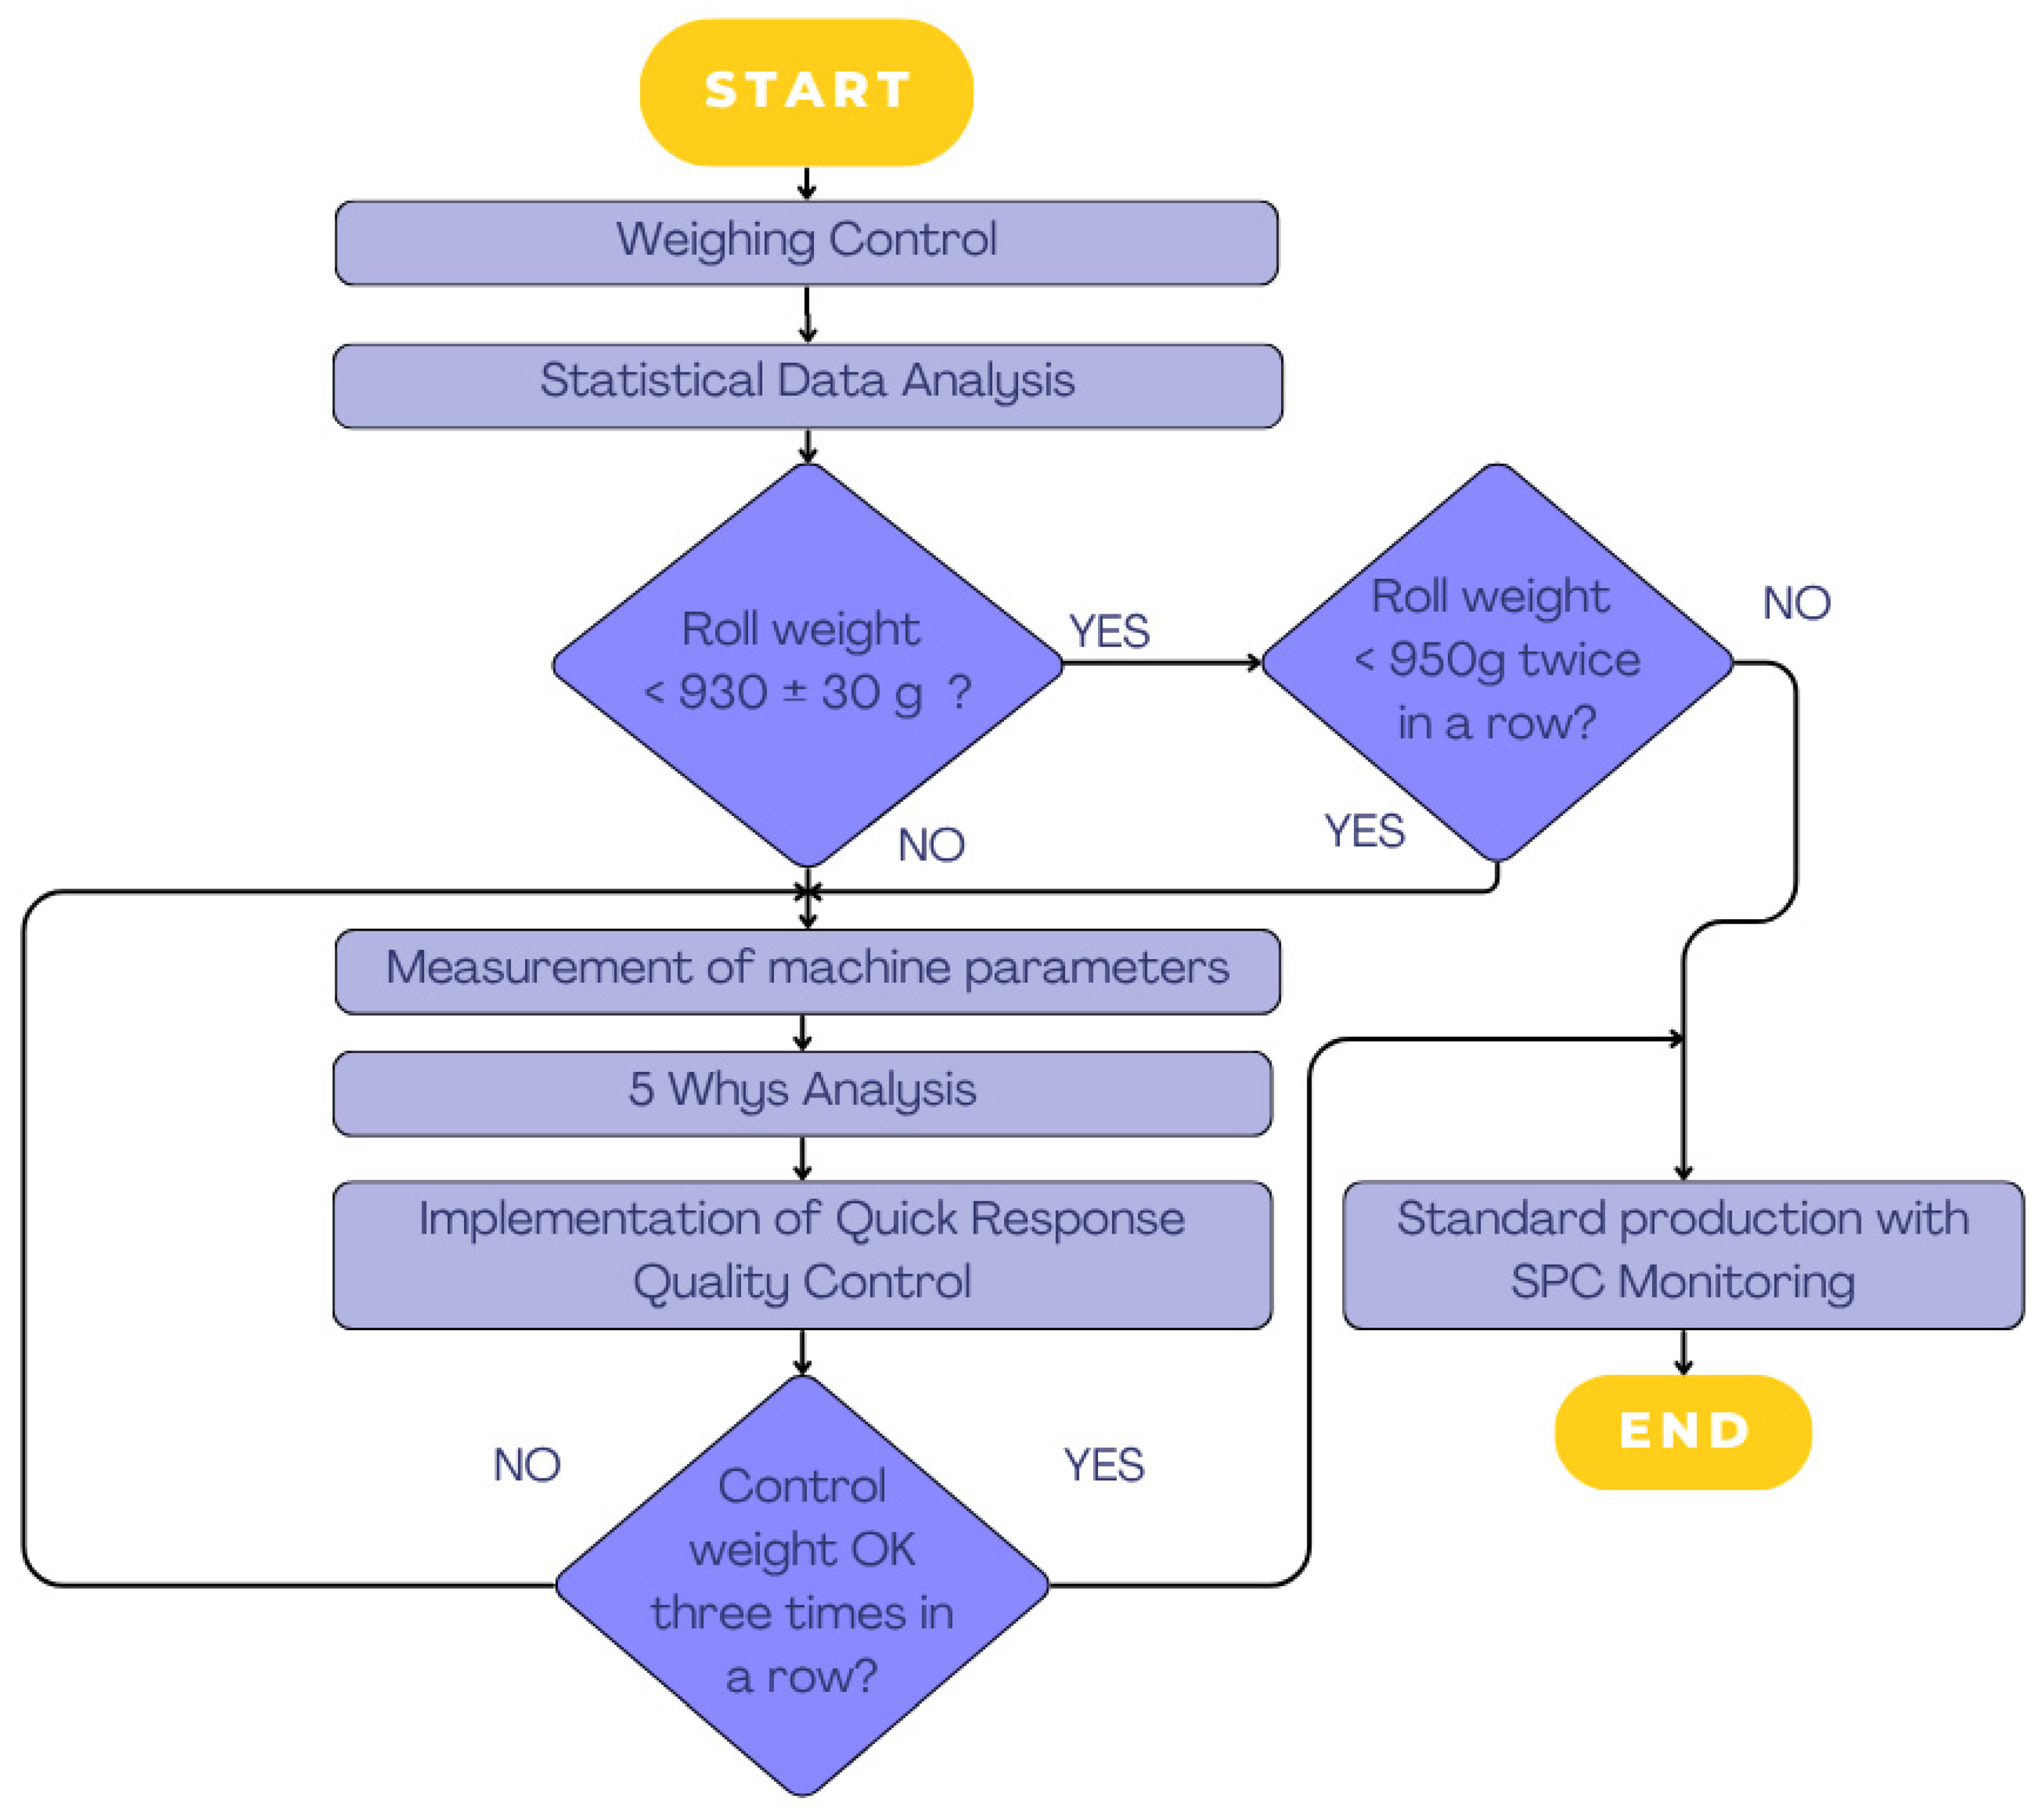
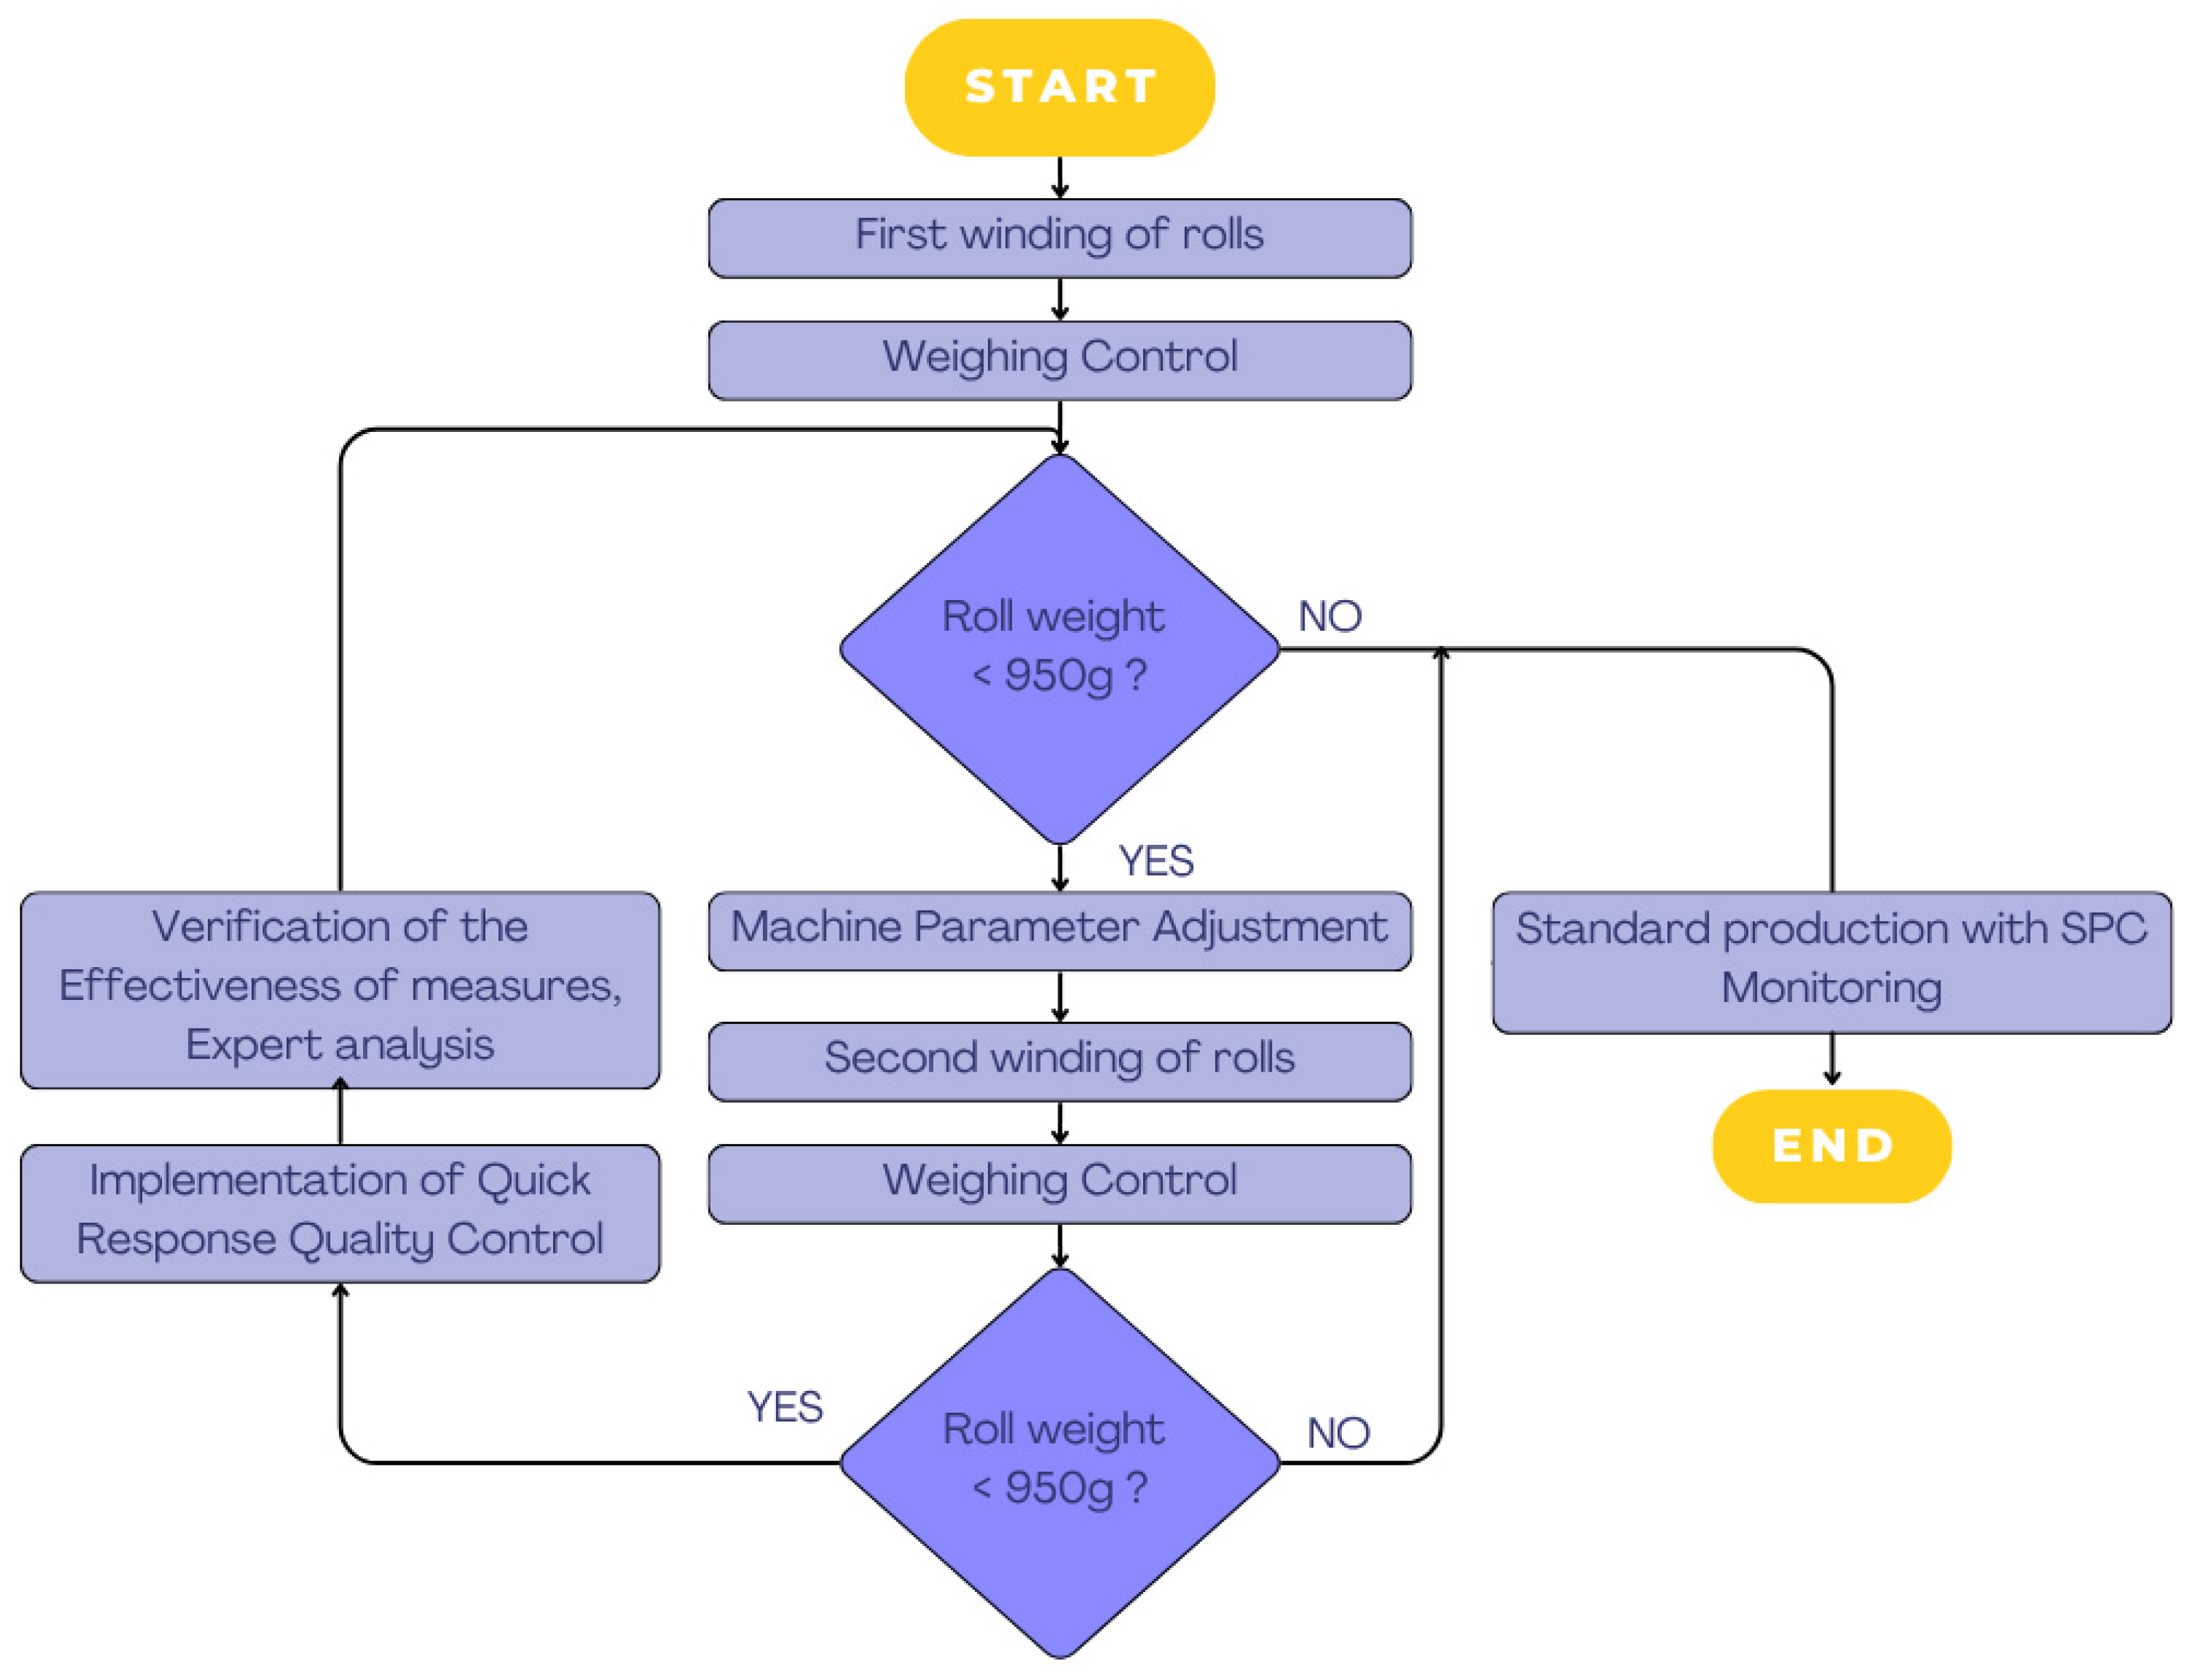
Based on identified outliers during the start-up phase, a specific start-up mode has been added to the SOP to stabilize parameters during the initial production phase. This mode is activated only if the weight of the rolls during the first two windings exceeds the warning or specification limits.
In start-up mode, the rolls must be weighed at all slitting positions for the first two windings. If the 950 g warning limit is exceeded, the process settings are corrected immediately. If the specification weight limit is exceeded, the winding pressure is reduced, and the web tension is gradually increased during the first 5 min of production.
To support the implementation of this measure, a specific procedure has been developed for the start-up phase of production, as shown in
Figure 10. This procedure defines the gradual adjustment of the winding pressure, the control of the roll weight during the first two windings, and the decision steps when the warning or specification limits are exceeded. The aim of this measure is to stabilize the production process from the initial phase and minimize the occurrence of outliers and nonconforming pieces.
3.7. Standard Production with SPC Monitoring
Following the evaluation of statistical parameters, control charts, and process performance, corrective actions were implemented based on the 5 Whys cause analysis. Subsequently, standard production was established with continuous process monitoring.
The process operates under standardized conditions defined by the implemented SOP, with position-dependent control of key parameters, including winding pressure and web tension. Continuous monitoring is ensured through Statistical Process Control (SPC), combining the applied spatial analysis with standard SPC approaches, including position-specific control charts for individual slitting streams.
A QRQC-based reaction plan remains active, ensuring timely corrective actions and supporting stable and consistent production performance.
4. Discussion
The results of the study suggest that the weight of the wound rolls is not evenly distributed across the width of the master roll but shows a significant position effect. The most critical deviation was observed in slitting position 6, where the Upper Specification Limit was frequently exceeded.
This systematic deviation may be attributed to uneven force distribution caused by the shared pneumatic circuit and the absence of position-specific control elements. As a result, global machine settings were insufficient to ensure uniform process behavior across all slitting positions. In addition, the observed non-uniformity can be partially explained by the orthotropic nature of cellulose filter paper and minor variations in winding tension between central and edge positions. The presence of position-dependent variability was further confirmed by the Kruskal–Wallis test (p < 0.001), indicating that the differences between slitting positions are statistically significant and cannot be attributed to random variation.
It should be noted that, in this study, the
control charts were applied to spatially structured data. Subgroups represent parallel slitting positions rather than time-ordered observations. Therefore, the observed stability should be interpreted as consistency of within-winding (spatial) variability rather than strict temporal statistical control. This result is consistent with the theoretical assumptions [
34,
35] that a statistically stable process can still produce nonconforming products if the target value is not reached or if special sources of variability are present.
The low values of the
Ppk index in the initial state confirmed that the problem was not only variability, but mainly a systematic shift of the process towards the upper specification limit. This finding highlights a key limitation of global process performance indices (
Pp and
Ppk) when applied to multi-position systems. Global assessment can mask local systematic deviations, which, in our case, were confirmed by the significant lack of capability of one slitting position alongside relatively acceptable parameters for the other positions. These findings are consistent with existing knowledge published in the fields of statistical process control and quality management, which highlights the risk of using global indicators in processes with parallel or multi-stream material flows [
12,
31]. Similar conclusions have been presented in works focused on multi-stream SPC, which emphasize the need for differentiated monitoring of individual process streams [
36].
Through the QRQC framework, the identified probable causes were addressed by updating the Standard Operating Procedures (SOP) to include mandatory manual checks and fine-tuning of the winding tension for critical positions during the start-up phase. This pragmatic approach mitigated the systemic flaw (shared pneumatics) without requiring a complete mechanical redesign of the slitting line. The proposed explanations have not been directly verified by technical measurements. As a result, the interpretation of the underlying mechanisms remains inferential.
The effectiveness of the implemented measures was evaluated through a comparative analysis of production data. A positive upward trend was observed in the performance indices. After operating conditions stabilized, the Ppk value reached 1.21, indicating that the process is conditionally capable. The proportion of nonconforming products (NOK) decreased significantly from 14.7% to 6.0%. After excluding the start-up windings, no nonconforming units were observed in the evaluated dataset. This improvement is attributed to the elimination of outliers that occurred during the start-up phase, whereas the process remained stable once it reached steady-state operation. The Mann–Whitney U test (U = 16,274.5, Z = 6.4364, p < 0.001) confirmed a statistically significant difference in roll weight before and after the implementation of corrective measures. Furthermore, the Brown–Forsythe test confirmed (p = 0.0028) that the corrective measures led to a statistically significant stabilization of the process, reducing its variability once steady state was achieved.
Concurrently, an upward trend was observed in the performance indices. After the corrective actions, Pp increased from 0.90 to 0.73, with a further increase to Pp = 1.36 and Ppk = 1.21 after the exclusion of the initial windings. The observed difference between Pp and Ppk suggests that, despite the reduction in process variability, the process was not fully centered within the specification limits during the initial monitoring period. However, the stabilization of the Ppk index at 1.21 under steady-state conditions indicates that the core process parameters are capable of meeting specification requirements once the inherent start-up variability is managed.
Despite the observed improvements, the validation of corrective actions is based on a comparison of only two production series, limiting the statistical robustness of the conclusions. As a result, the observed improvements cannot be attributed exclusively to the implemented corrective actions with full causal certainty. Additionally, although non-parametric testing was applied, the study relies primarily on observational industrial data rather than controlled experimental validation. For these reasons, the findings should be interpreted as those of a data-driven industrial case study rather than as a universally applicable quality assurance model.
Nevertheless, from a methodological perspective, the study provides a structured approach to integrating spatially adapted SPC analysis, position-resolved statistical testing, and QRQC-based corrective action mechanisms. This integration offers a systematic means of identifying and addressing position-dependent sources of variability in multi-stream processes, while also highlighting the need to distinguish between diagnostic, spatial SPC applications and conventional temporal SPC interpretations used for formal process capability assessment.
From an industrial perspective, the results suggest that effective process control in multi-stream manufacturing systems requires a combination of global performance indicators and localized monitoring. The integration of SPC tools with rapid-response methodologies such as QRQC enables early detection and elimination of position-dependent deviations without interrupting production. While further experimental validation is required to confirm broader efficacy, the proposed approach presents a scalable methodology potentially applicable to other continuous manufacturing processes involving parallel material flows, such as in the paper, textile, or film industries, where spatial variability plays a critical role in product quality.
5. Conclusions
This study analyzed the effect of cut position on the weight variability of wound rolls of cellulose paper under industrial conditions. The results confirmed the presence of a statistically significant systematic spatial effect, with the largest deviations and the highest proportion of nonconforming products observed at cut position 6.
The application of descriptive statistics, non-parametric testing, and adapted SPC tools enabled the identification of systematic between-position variability that is not observable using aggregated process indicators alone. The use of global process performance indices (Pp and Ppk) further demonstrated that overall process performance was negatively affected by local imbalances between parallel streams.
Corrective actions based on the QRQC system, updates to the SOP, and technical adjustments according to the 4M approach led to a measurable reduction in nonconforming products and improved process centering. While the results indicate improved process performance and reduced spatial inconsistency, the study highlights the necessity of a transparent reporting approach. By distinguishing between the transient start-up phase and steady-state conditions, it is possible to ensure that inherent physical latencies, such as pneumatic pressure stabilization and mechanical inertia, do not mask the actual effectiveness of the corrective interventions.
From a methodological perspective, the study outlines a structured framework for integrating spatial variability analysis with operational quality management tools in multi-stream processes. This framework links statistical analysis with structured corrective action mechanisms, enabling more targeted process control in industrial practice. Furthermore, the results support the hypothesis that in a multi-stream process, a differentiated approach to controlling individual streams is necessary. The classic global capability assessment proved insufficient, as it revealed a systematic error at a specific position. Future research should focus on integrating these findings into automated control systems (APC) capable of correcting downforce on individual winding arms in real time.