Article

A Predictive Diffusion Model for Designing a Desensitization Heat Treatment in Steels with Cu Impurities

by
Ruthvik Gandra
1,*,
Pranav Acharya
2,
Tetiana Shyrokykh
1,
Charlotte Mayer
3,
Sebastien Hollinger
4,
Narayanan Neithalath
2 and
Seetharaman Sridhar
1
1
Materials Science and Engineering, Fulton Schools of Engineering, Arizona State University, 699 S Mill Avenue, Tempe, AZ 85281, USA
2
School of Sustainable Engineering and the Built Environment, Arizona State University, 660 S College Avenue, Tempe, AZ 85281, USA
3
Michelin de Cataroux, 8 Rue de la Grolière, 63100 Clermont-Ferrand, France
4
Michelin North America, 1 Parkway S, Greenville, SC 29615, USA
*
Author to whom correspondence should be addressed.
Processes 2026, 14(10), 1603; https://doi.org/10.3390/pr14101603
Submission received: 20 April 2026 / Revised: 12 May 2026 / Accepted: 13 May 2026 / Published: 15 May 2026
(This article belongs to the Special Issue Metal Extraction and Recovery Technologies from E-Waste)

Abstract

The high-rate recycling of scrap steel introduces persistent residual copper (Cu), which accumulates at prior austenite grain boundaries at the surface, during high-temperature reheating, leading to Cu-induced sensitization and deleterious “hot shortness”. To address this, a predictive analytical framework was derived using Fick’s Second Law and the Sekerka, Jeanfils, and Heckel (SJH) approach to model the dissolution of Cu-rich films as a 1D planar moving boundary problem. The validity of this analytical framework was first established through experimentation on controlled Cu-coated steel wire rods, where theoretical concentration profiles showed strong agreement with empirical depth profiles. When applied to a 0.21 wt.% Cu steel at 1000 °C, the model predicted a critical extinction time (t*) of approximately 8.57 min for the complete dissolution of a 20 nm sensitized film. Experimental trials on sensitized wire rods confirmed this prediction, demonstrating an 89% reduction in the frequency of detectable sensitized zones and a significant decrease in zone width following a 10 min thermal dwell. The approach provides a standardized, scalable, and composition-adaptable methodology, grounded in a 1D planar approximation, for optimizing desensitization heat treatments across a range of Cu contents, offering a practical strategy to increase scrap steel utilization while mitigating hot shortness.

1. Introduction

The global push for sustainability in the iron and steel sector has accelerated the transition toward secondary steel production via the electric arc furnace (EAF) route, which uses recycled scrap as its primary metallic input and can significantly lower CO2 emissions relative to blast furnace-basic oxygen furnace (BF-BOF) production. However, the high-rate recycling of scrap steel of about 97.34% in 2021 [1,2] introduces persistent residual elements, most notably copper (Cu), which cannot be removed through conventional oxidative melting and refining practices and tends to accumulate over repeated scrap recycling loops [3]. Moreover, increasing electrification could result, in time, in more Cu being interred with steel scrap. During the high-temperature reheating stages (900–1200 °C) essential for rod rolling, iron is preferentially oxidized at the surface, leading to unoxidized Cu accumulation at the metal–oxide interface. When the local Cu concentration exceeds its solubility limit in austenite, a metallic Cu phase forms and accumulates along the prior austenite grain boundaries [4]. This phenomenon, Cu-induced sensitization, leads to “hot shortness,” creating brittle intergranular zones that serve as primary crack initiation sites, severely compromising the ductility and toughness required for the high plastic deformation involved in drawing wire rods into fine tire cords [4,5].
To mitigate these deleterious effects, a desensitization heat treatment has been proposed as a post-processing intervention. The fundamental principle of this strategy is to leverage solid-state back-diffusion to redistribute Cu atoms away from the enriched grain boundaries and back into the austenite matrix. By implementing a controlled thermal dwell in a non-oxidizing environment, the concentration gradient that drives hot shortness is reversed, without requiring changes to the steel’s bulk chemistry and microstructure [4].
The current literature reveals that most attempts to address hot shortness have focused on alloying modifications. Strategies such as adding nickel (Ni) to increase Cu solubility, or silicon (Si) and tin (Sn) to alter oxidation kinetics, have shown varying degrees of success in laboratory settings [5,6,7]. However, these methods introduce significant cost burdens and chemical complexities that are difficult to manage within the highly variable scrap streams typical of industrial EAF production [7,8]. Furthermore, current industrial practices often rely on passive mitigation—limiting recycled content to approximately 20% to maintain Cu levels below a safe threshold—which fundamentally caps the industry’s recycling potential [1,4].
Despite these advancements, there remains a critical need for a generic, industry-fitting framework that can standardize desensitization kinetics. While specific experimental successful cases have been documented [4,5,7], a predictive analytical approach is necessary to streamline the transition from laboratory proof-of-concept to industrial-scale implementation. Recent studies have further underscored this challenge: copper contamination is projected to increasingly constrain global steel recycling beyond 2030 [3,9], while comprehensive reviews of Cu behavior in steels [10,11] and computational approaches including phase-field fracture modeling [12] and grain boundary diffusion algorithms [13] have emerged as complementary tools, yet an experimentally validated analytical framework for industrial process design has remained absent. By establishing a robust model grounded in diffusion theory, potential thermal desensitization processes can be optimized for various product geometries and Cu concentrations.

2. Methodology and Mathematical Formulation

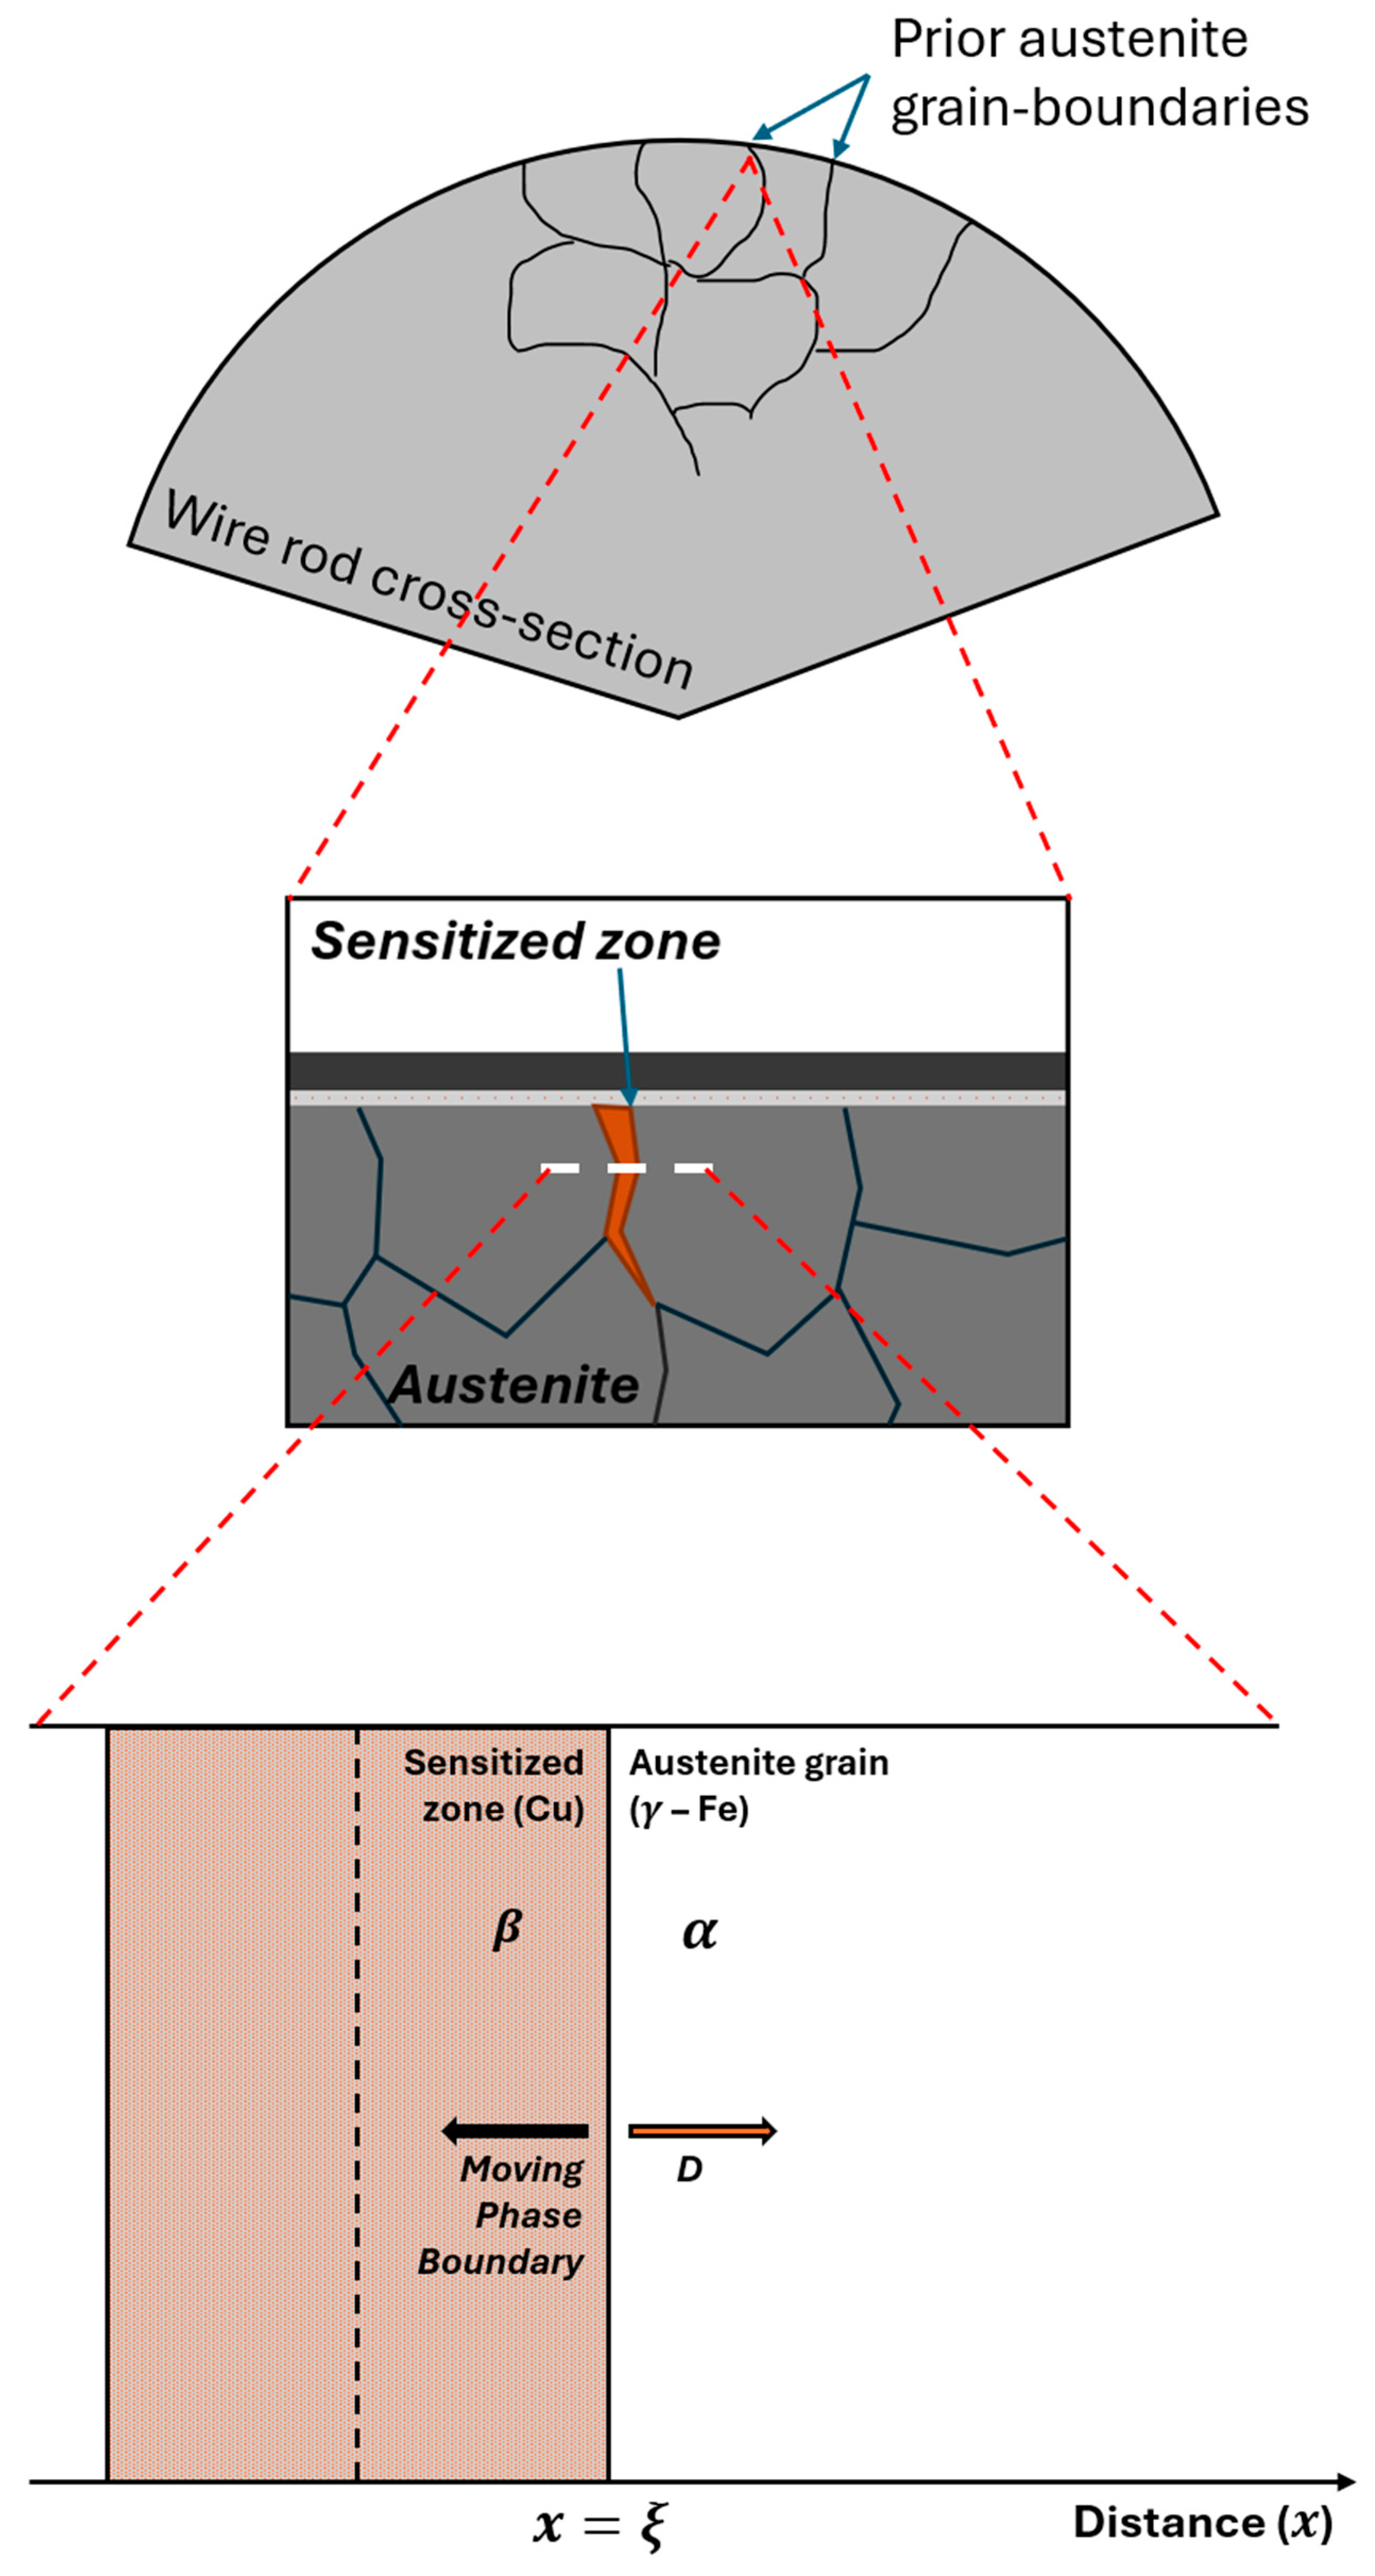
The moving boundary (Stefan) problem has been widely applied to phase transformation kinetics in metals [14,15]. Physically, a sensitized zone containing precipitated copper can be framed as a one-dimensional diffusion problem when the domain is defined by a cross-section perpendicular to the grain boundary interface. To formally derive the analytical solution for the concentration profile during the dissolution of a 1D planar grain boundary film, we follow the principles of mass conservation and diffusion kinetics [8,16]. The derivation moves from the governing differential equation to the mathematical expression used to simulate the diffusion of Cu away from sensitized zones. Figure 1 illustrates this framework by overlaying the 1D diffusion schematic onto a representative sensitized zone observed in a steel wire rod. This framework utilizes the mathematical approach of Sekerka, Jeanfils, and Heckel (SJH) to solve the moving boundary problem [17].

2.1. The Governing Differential Equation

The Cu-redistribution process is governed by the one-dimensional form of Fick’s Second Law for a semi-infinite medium [16,17,18]. We assume that the diffusion of the solute (Copper) occurs primarily within the matrix (Austenite):
c t = D 2 c x 2
where c ( x , t ) is the concentration of Cu, D is the interdiffusion coefficient of Cu in γ F e , x is the distance from the centerline, and t is time.

2.2. Boundary and Initial Conditions

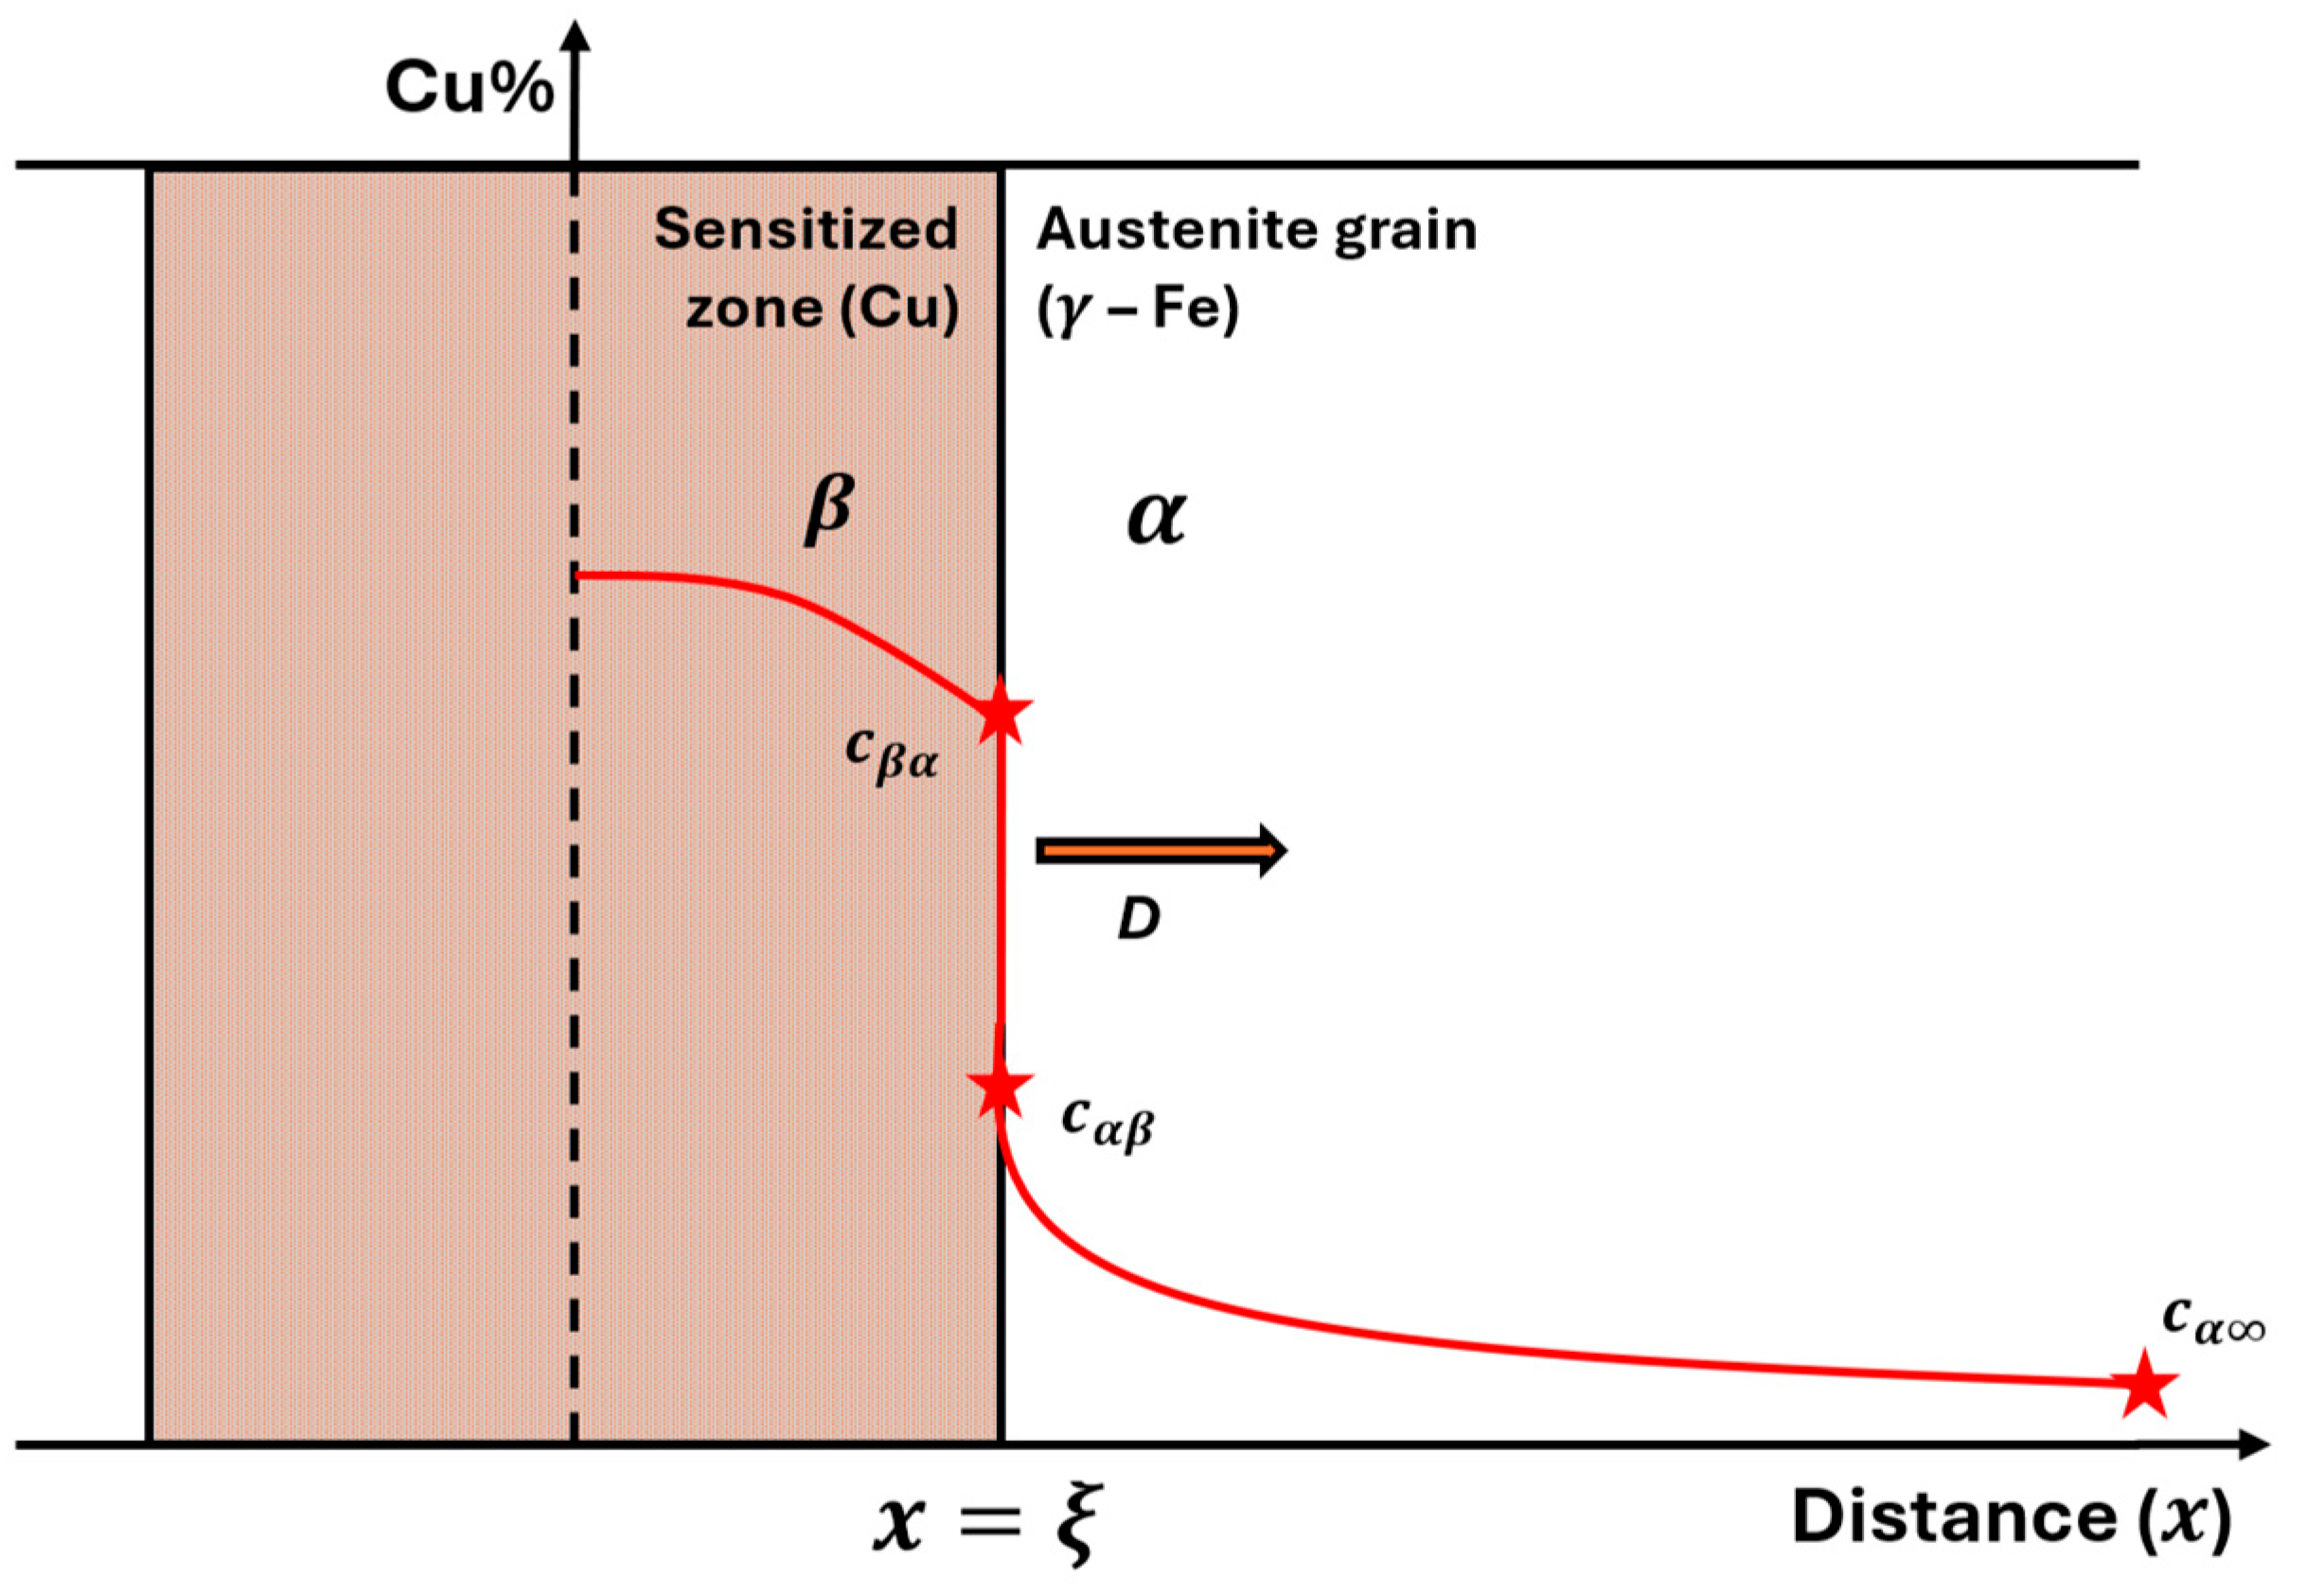
The schematic of a Cu concentration across the sensitized zone and adjacent austenite grain with illustration of variables defined in this section are shown in Figure 2. We define a moving interface at position ξ ( t ) . To solve the second-order partial differential equation, we establish the following conditions based on local equilibrium:
  • Initial Condition: At t   =   0 , the matrix has a uniform background concentration c .
  • Far-field Condition: As x     , the concentration remains at the background level, c ( , t ) = c .
  • Interface Condition: At the contact point between the two phases ( x   =   ξ ) , the concentration in the matrix is fixed by the solubility limit, c ( ξ ,   t ) =   c α β .

2.3. Change in Variables (Similarity Transformation)

To convert the partial differential equation into an ordinary differential equation, we introduce a dimensionless similarity variable, z :
z   =   x 4 D t
The concentration c ( x , t ) can then be expressed as a function of z [17]. Substituting z into Equation (1) yields the general solution involving the complementary error function:
c ( z ) =   c + A · e r f c ( z )
where A is a constant determined by the boundary conditions.

2.4. Determination of the Interface Kinetic Constant (K)

The interface position ξ ( t ) follows a parabolic trend during dissolution [17]:
ξ ( t ) = | K | 4 D t
where K is the dimensionless kinetic constant. At the interface ( x = ξ ) , our similarity variable becomes constant: z ξ = K . Applying the interface condition c ( z ξ ) = c α β to Equation (3):
c α β =   c + A · e r f c ( K )   A   =   c α β c e r f c ( K )

2.5. Formulation of the Flux Balance

The interface moves because atoms are transferred from the solute-rich phase ( β ) to the matrix ( α ) . The conservation of mass at the interface dictates that the rate of solute released by the moving boundary must equal the diffusion flux into the matrix:
( c β α c α β ) d ξ d t   =   J = D ( c x ) x = ξ
where c β α is the concentration within the dissolving phase at the interface.

2.6. Solving the Flux Balance for K

Differentiating the concentration profile c ( x , t ) with respect to x to find the gradient at the interface:
( c x ) x = ξ   =   c α β c   e r f c ( K ) 2 π 4 D t e K 2
Substituting the interface velocity d ξ d t = K D t derived from Equation (4) into the flux balance equation and simplifying yields the transcendental Equation used to find K :
K π e K 2 e r f c ( K )   =   c α β c c β α c α β

2.7. Expression for the Concentration Profile

Once K is determined numerically, the concentration profile at any position x and time t in the matrix during the dissolution of the Cu-rich zone is obtained from
c ( x , t ) = c + ( c α β c ) e r f c ( x 4 D t ) e r f c ( K )
This analytical framework allows for the prediction of the kinetics governing the diffusion of Cu away from the grain boundaries.

2.8. Expression for Interface Velocity

Following the derivation of the concentration profile and the kinetic constant K , the physical evolution of the grain boundary film thickness can be quantified. From the similarity transformation, the position of the interface ξ ( t ) relative to the fixed centerline ( x = 0 ) is defined as
ξ ( t ) = w 0 | K | 4 D t
where w 0 is the initial half-width of the Cu-rich film. The velocity of the retreating interface ( v ) is obtained by differentiating this expression with respect to time:
v = d ξ d t = | K | D t
This result demonstrates that the dissolution rate is inversely proportional to the square root of time. Consequently, the film shrinks rapidly at the onset of the heat treatment and decelerates as the concentration gradient in the austenite matrix flattens, reducing the chemical potential driving force.

2.9. Derivation of the Extinction Time ( t * )

The extinction time, t * , represents the critical duration required for the metallic β phase to be completely consumed by the matrix. By setting the interface position to zero ( ξ ( t * ) = 0 ) in Equation (10), the time to extinction is derived as
t * = w 0 2 4 D K 2
In a metallurgical context, this expression is fundamental for process design. It allows for the calculation of the minimum dwell time required at a specific temperature to ensure the complete dissolution of a sensitized zone of a known initial thickness, provided the interdiffusion coefficient D and the kinetic constant K are established.

2.10. Shrinkage of Film Thickness (W) with Time (t)

While ξ ( t ) denotes the half-width, the total film thickness W ( t ) is defined as 2 ξ ( t ) . By substituting the expression for t * (Equation (12)) into the thickness equation, the shrinking width can be expressed as a function of its initial state and the fraction of time elapsed:
W ( t ) = 2 w 0 ( 1 t t * )
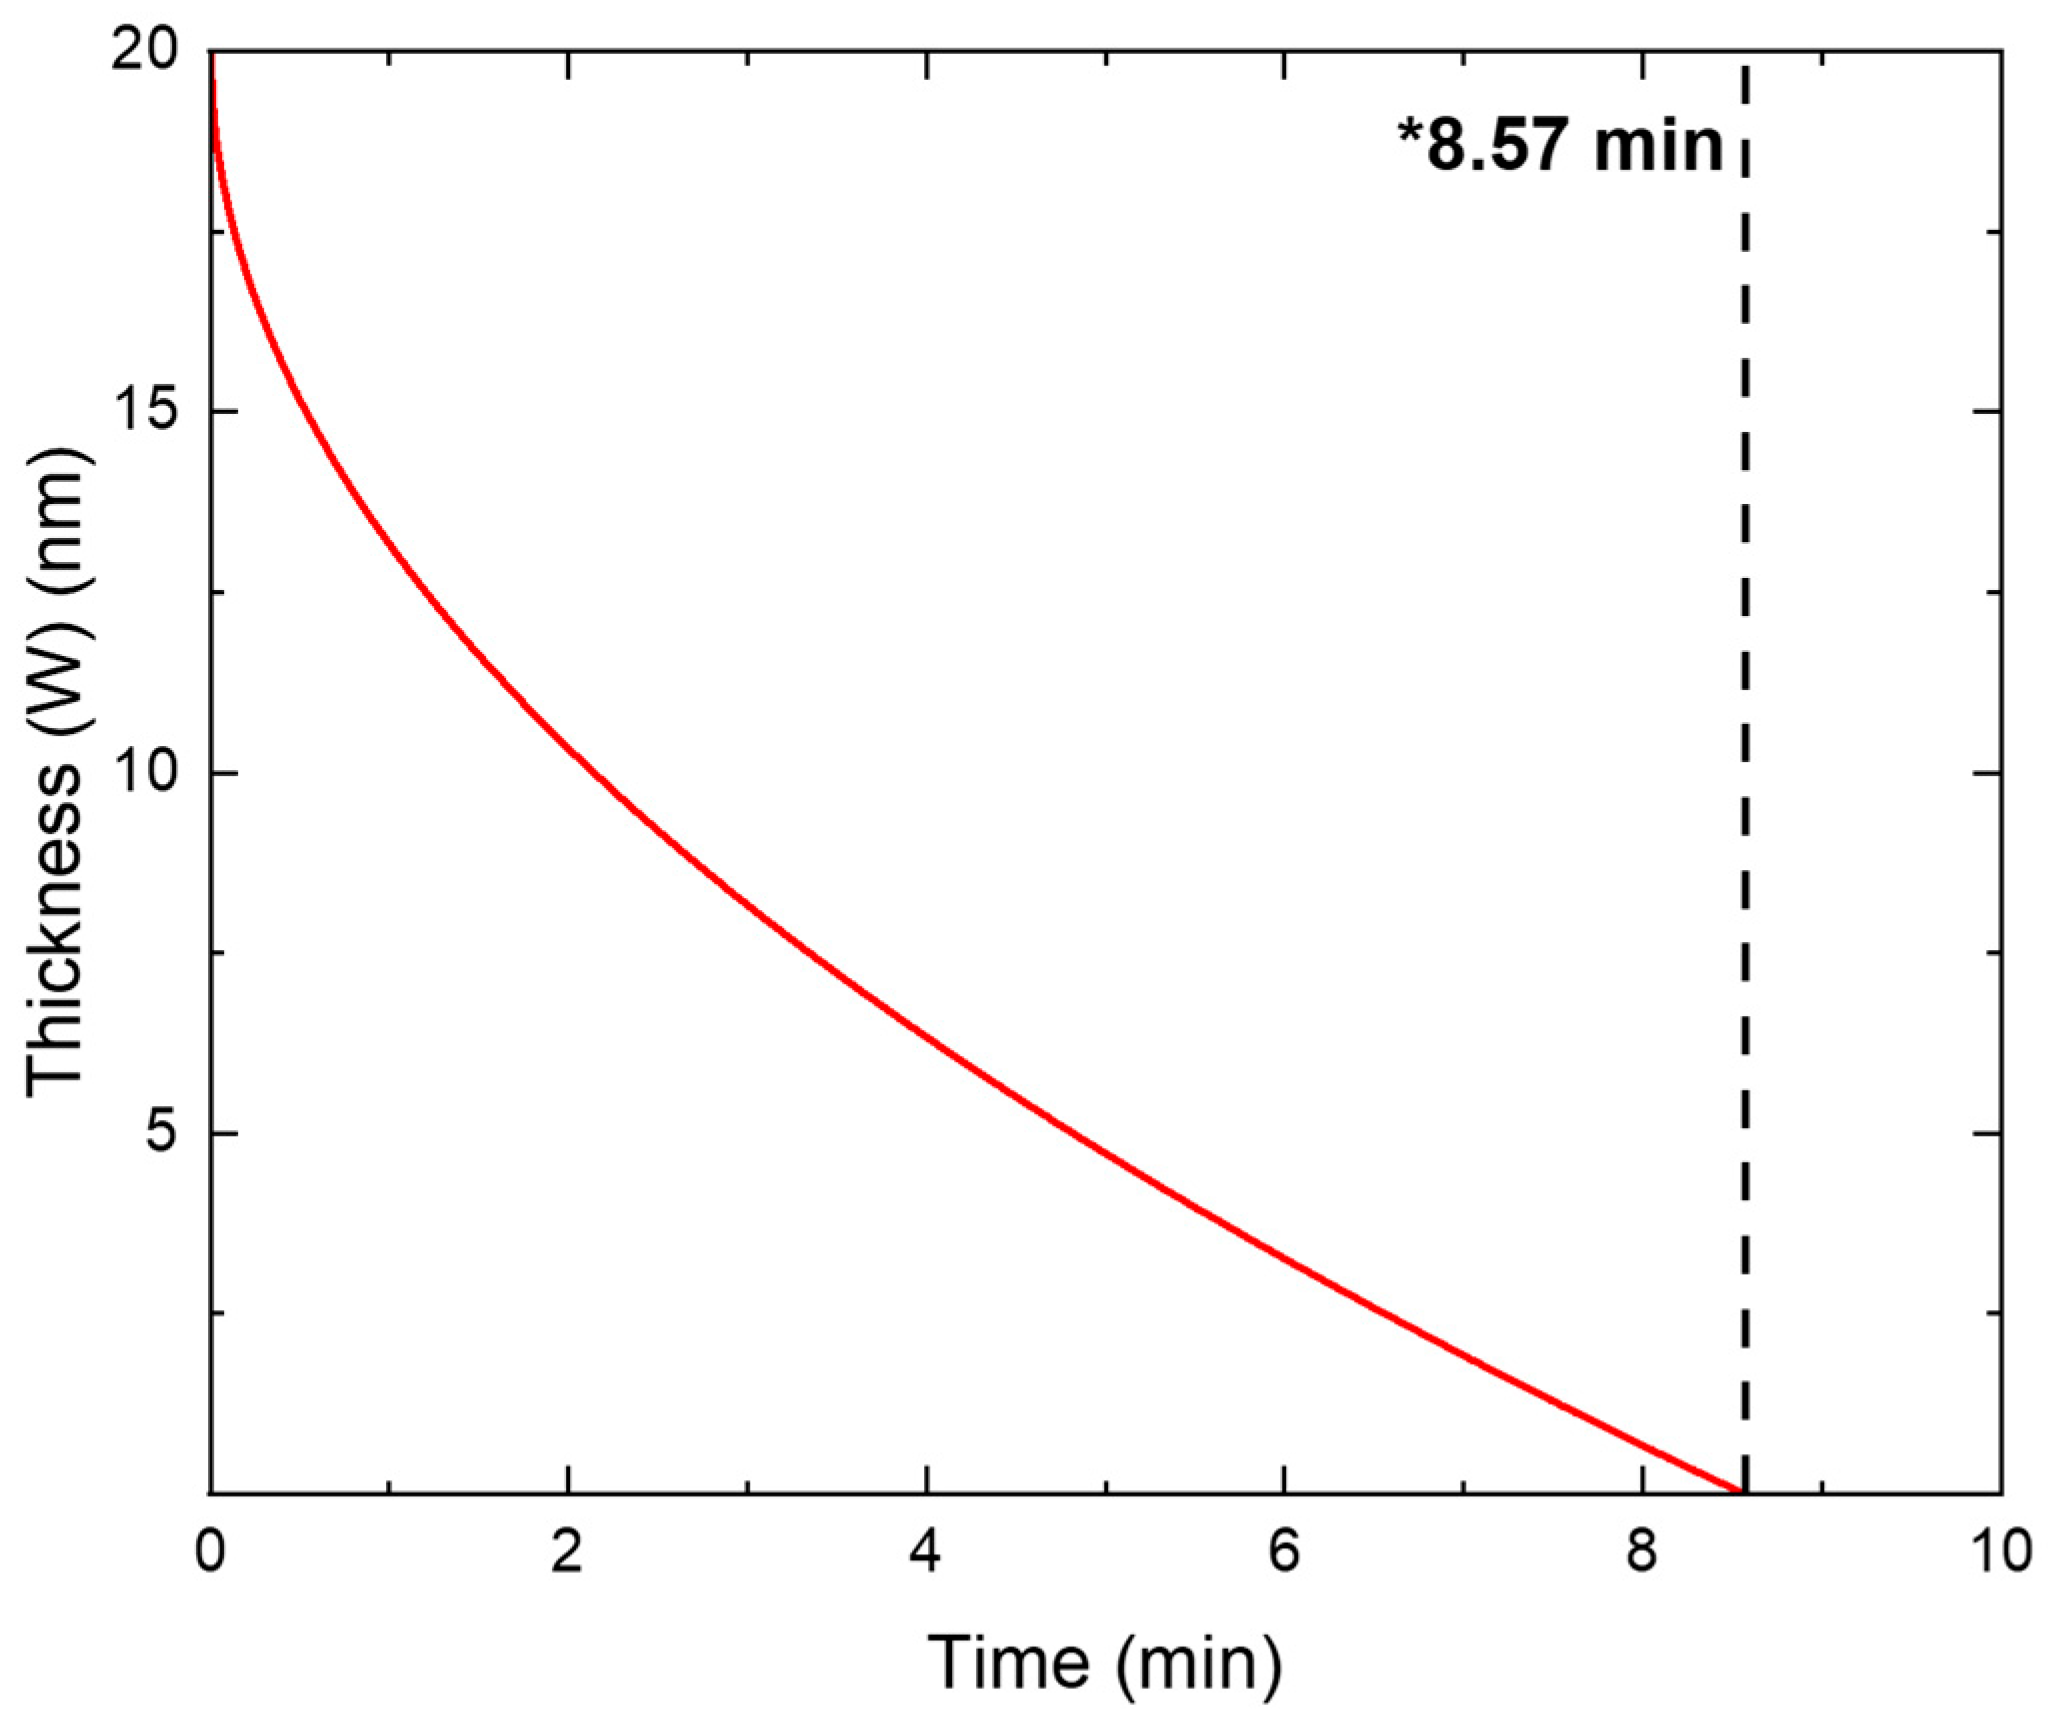
As illustrated by this relationship, the film thickness does not decrease linearly; rather, it follows a curved trajectory where the most significant portion of the dissolution occurs during the initial stages of the thermal dwell. This kinetic behavior underscores the efficiency of short, high-temperature desensitization treatments in mitigating Cu-induced damage.

3. Analytical Solution and Experimental Validation (Case—1)

To experimentally validate the analytical solution derived in Section 2, we engineered a controlled material system that physically replicates the ideal assumptions of the mathematical model. Rather than contending with the geometric irregularities of natural precipitates, this study utilizes a designed diffusion couple representative of a fundamental 1D planar problem: a finite copper reservoir dissolving into a semi-infinite steel bulk. This simplified configuration allows for a precise, variable-dependent correlation between the theoretical diffusion kinetics and physical observation. The specific chemical composition and geometric parameters of this engineered sample are detailed in the following subsection.

3.1. Material Composition and Geometry

The material assumed for this validation case consists of high-residual steel wire rods with a copper (Cu) content of 0.21 wt.%, the same kind used in the work by Gandra et al. [4], focused on desensitization (Table 1).
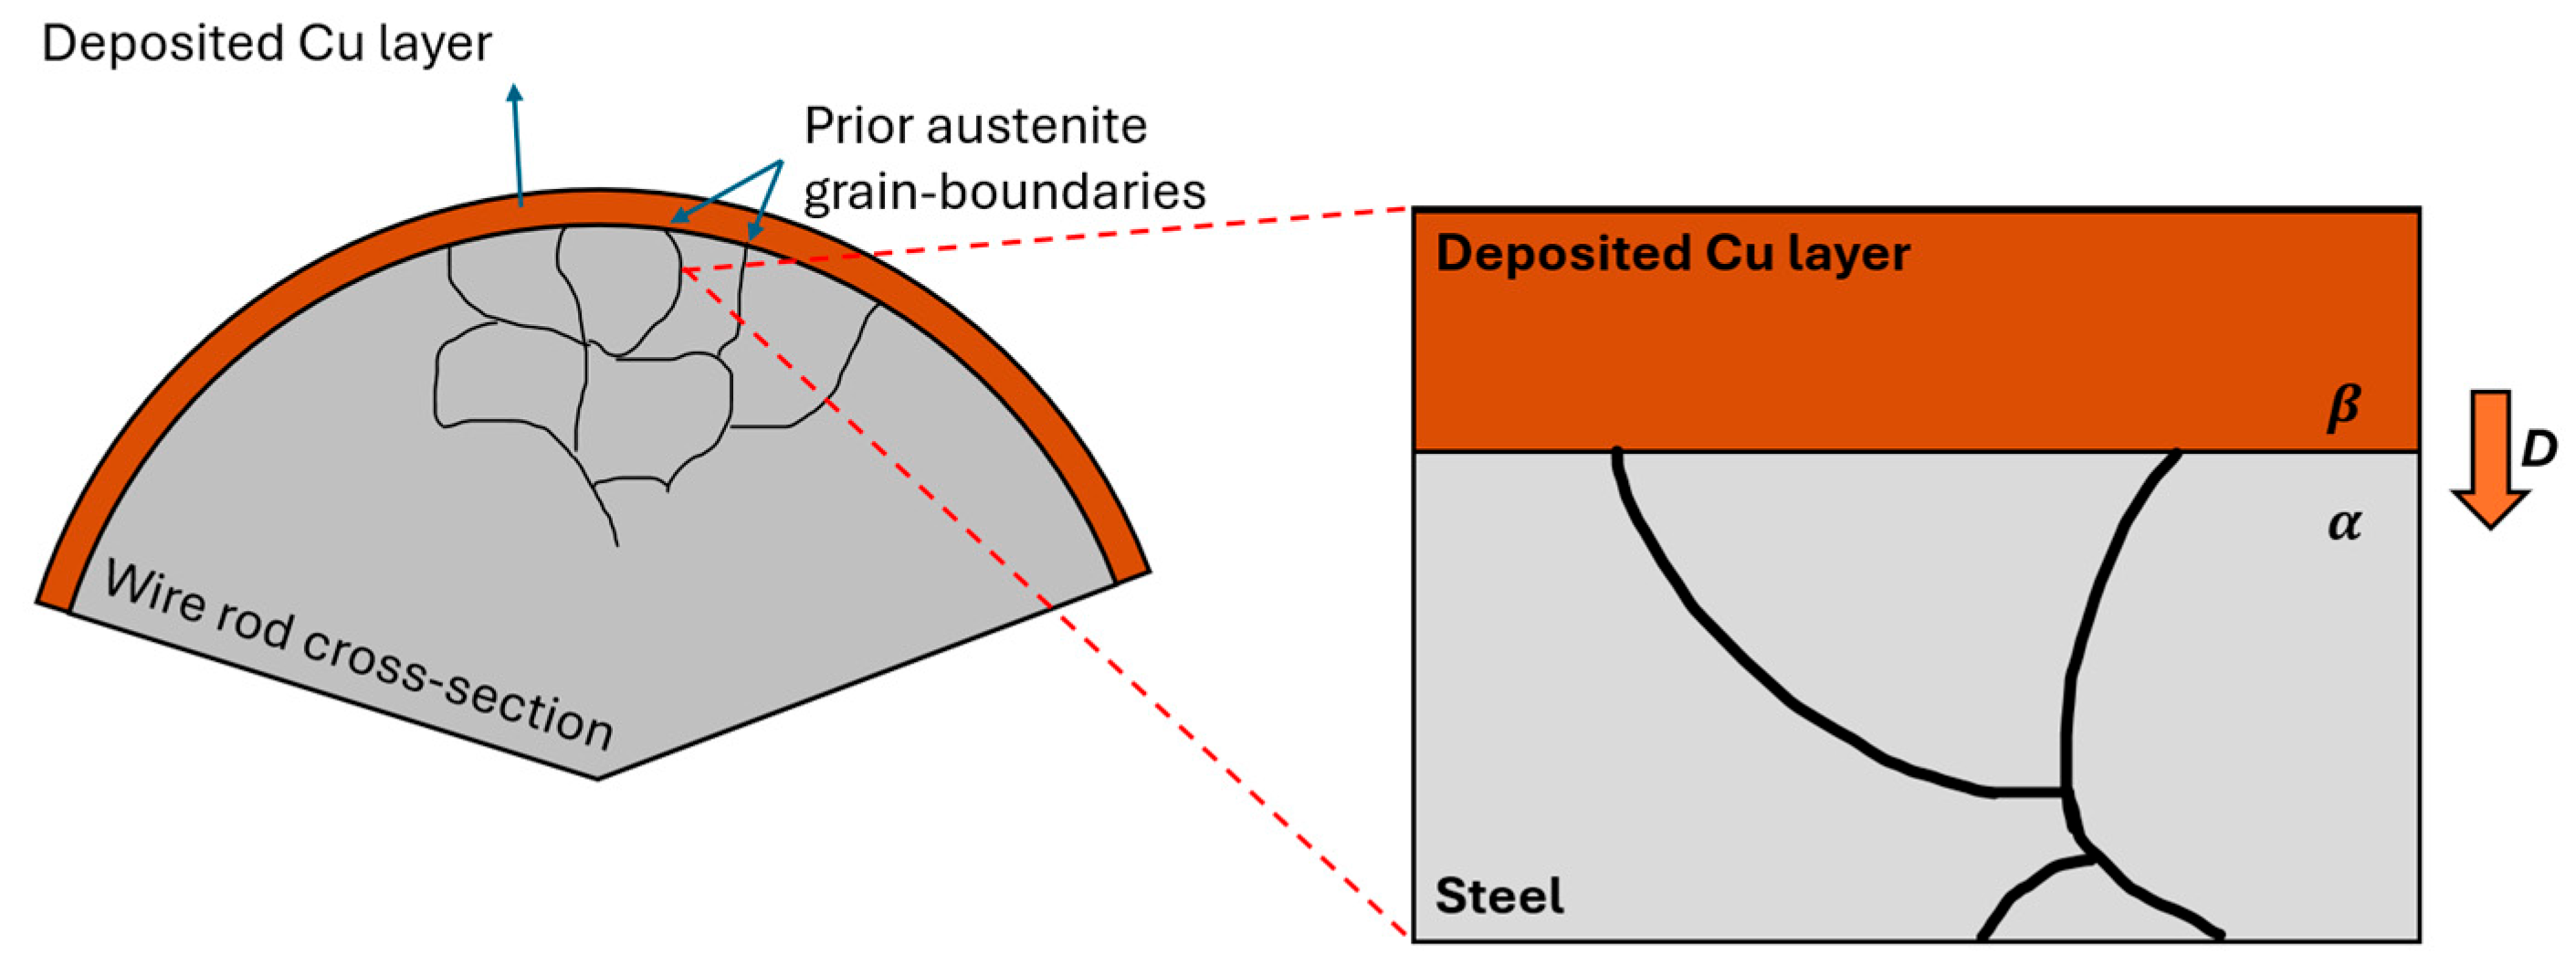
To construct the idealized diffusion couple required for model validation, a pure copper layer was applied to the surface of the 21Cu steel wire rod via electrochemical deposition. The substrate consists of the standard 5.5 mm diameter wire rod defined above, which serves as the semi-infinite steel matrix in the diffusion problem. The deposited coating forms a uniform, finite Cu reservoir with a controlled thickness of 3 μ m. This specific configuration, illustrating the concentric arrangement of the pure Cu layer around the steel core, along with the actual wire rod sample, is depicted in Figure 3.

3.2. Analytical Solution

The implementation of the analytical model requires thermodynamic and kinetic parameters derived specifically for the high-carbon (0.65 wt.%C) steel wire rod system described in Section 3.1. While the macroscopic geometry of the engineered sample represents a 1D planar diffusion couple, the microscopic transport mechanism is governed by the polycrystalline nature of the austenite matrix. At the desensitization temperature of 1000 °C, the contribution of grain boundaries as “short-circuit” diffusion paths cannot be neglected. Consequently, rather than relying solely on lattice diffusivity, this study utilizes an effective diffusion coefficient ( D eff ). This parameter homogenizes the flux contributions from both the bulk lattice and the grain boundaries, providing a more accurate kinetic input for the SJH moving boundary solution.

3.2.1. Determination of Effective Diffusion Coefficient ( D eff )

To accurately quantify the diffusion kinetics within the polycrystalline wire rod at 1000 °C, we utilize the Hart equation. This model homogenizes the competing transport mechanisms by expressing the effective diffusivity ( D eff ) as a weighted average of the lattice and grain boundary diffusion coefficients, governed by the volume fraction of the grain boundaries, and has been validated through Monte Carlo simulation and finite element analysis for polycrystalline systems [13,19,20]:
D eff = f D gb + ( 1 f ) D bulk
  • Lattice Diffusivity (Dbulk): for the 0.21 wt.% Cu system is calculated using the standard Arrhenius parameters for copper in γ -iron ( D 0 = 1.29 × 10 4   m 2 / s ,   Q = 295   kJ / mol ) [21,22]. At 1273.15   K , this yields
    D = D 0 exp ( Q R T )
    D b u l k = ( 1.29 × 10 4 ) exp ( 295,000   J / mol 8.314   J / ( m o l K ) × 1273.15   K ) 1.0 × 10 16 m 2 / s
  • Grain boundary diffusivity ( D gb ) is determined using the parameters for short-circuit diffusion ( δ D 0 = 1.6 × 10 10   m 3 / s , Q = 178   kJ / mol ) [22] and a boundary width ( δ ) of 1 nm.
    D g b = ( 1.6 × 10 1 ) exp ( 178,000   J / mol 8.314 J / ( m o l K ) × 1273.15   K ) 7.96 × 10 9 m 2 / s
  • Next, the volume fraction of grain boundaries ( f ) is derived geometrically from the initial mean grain size ( d ) of the wire rod, which is approximately 37   μ m [4]. Using the relationship f   3 δ / d ,
    f = 3 × ( 1 × 10 9   m ) 37 × 10 6   m     8.11 × 10 5
Finally, substituting these components into the Hart equation reveals that the grain boundary network dominates the macroscopic diffusion behavior. The contribution of the lattice is negligible compared to the high-flux boundaries, resulting in an effective diffusivity of:
D eff = ( 8.11 × 10 5 7.96 × 10 9 ) + ( 0.9999 1.0 × 10 16 )
D eff     6.45 × 10 13   m 2 / s

3.2.2. Modeling Kinetics and Concentration Profiles

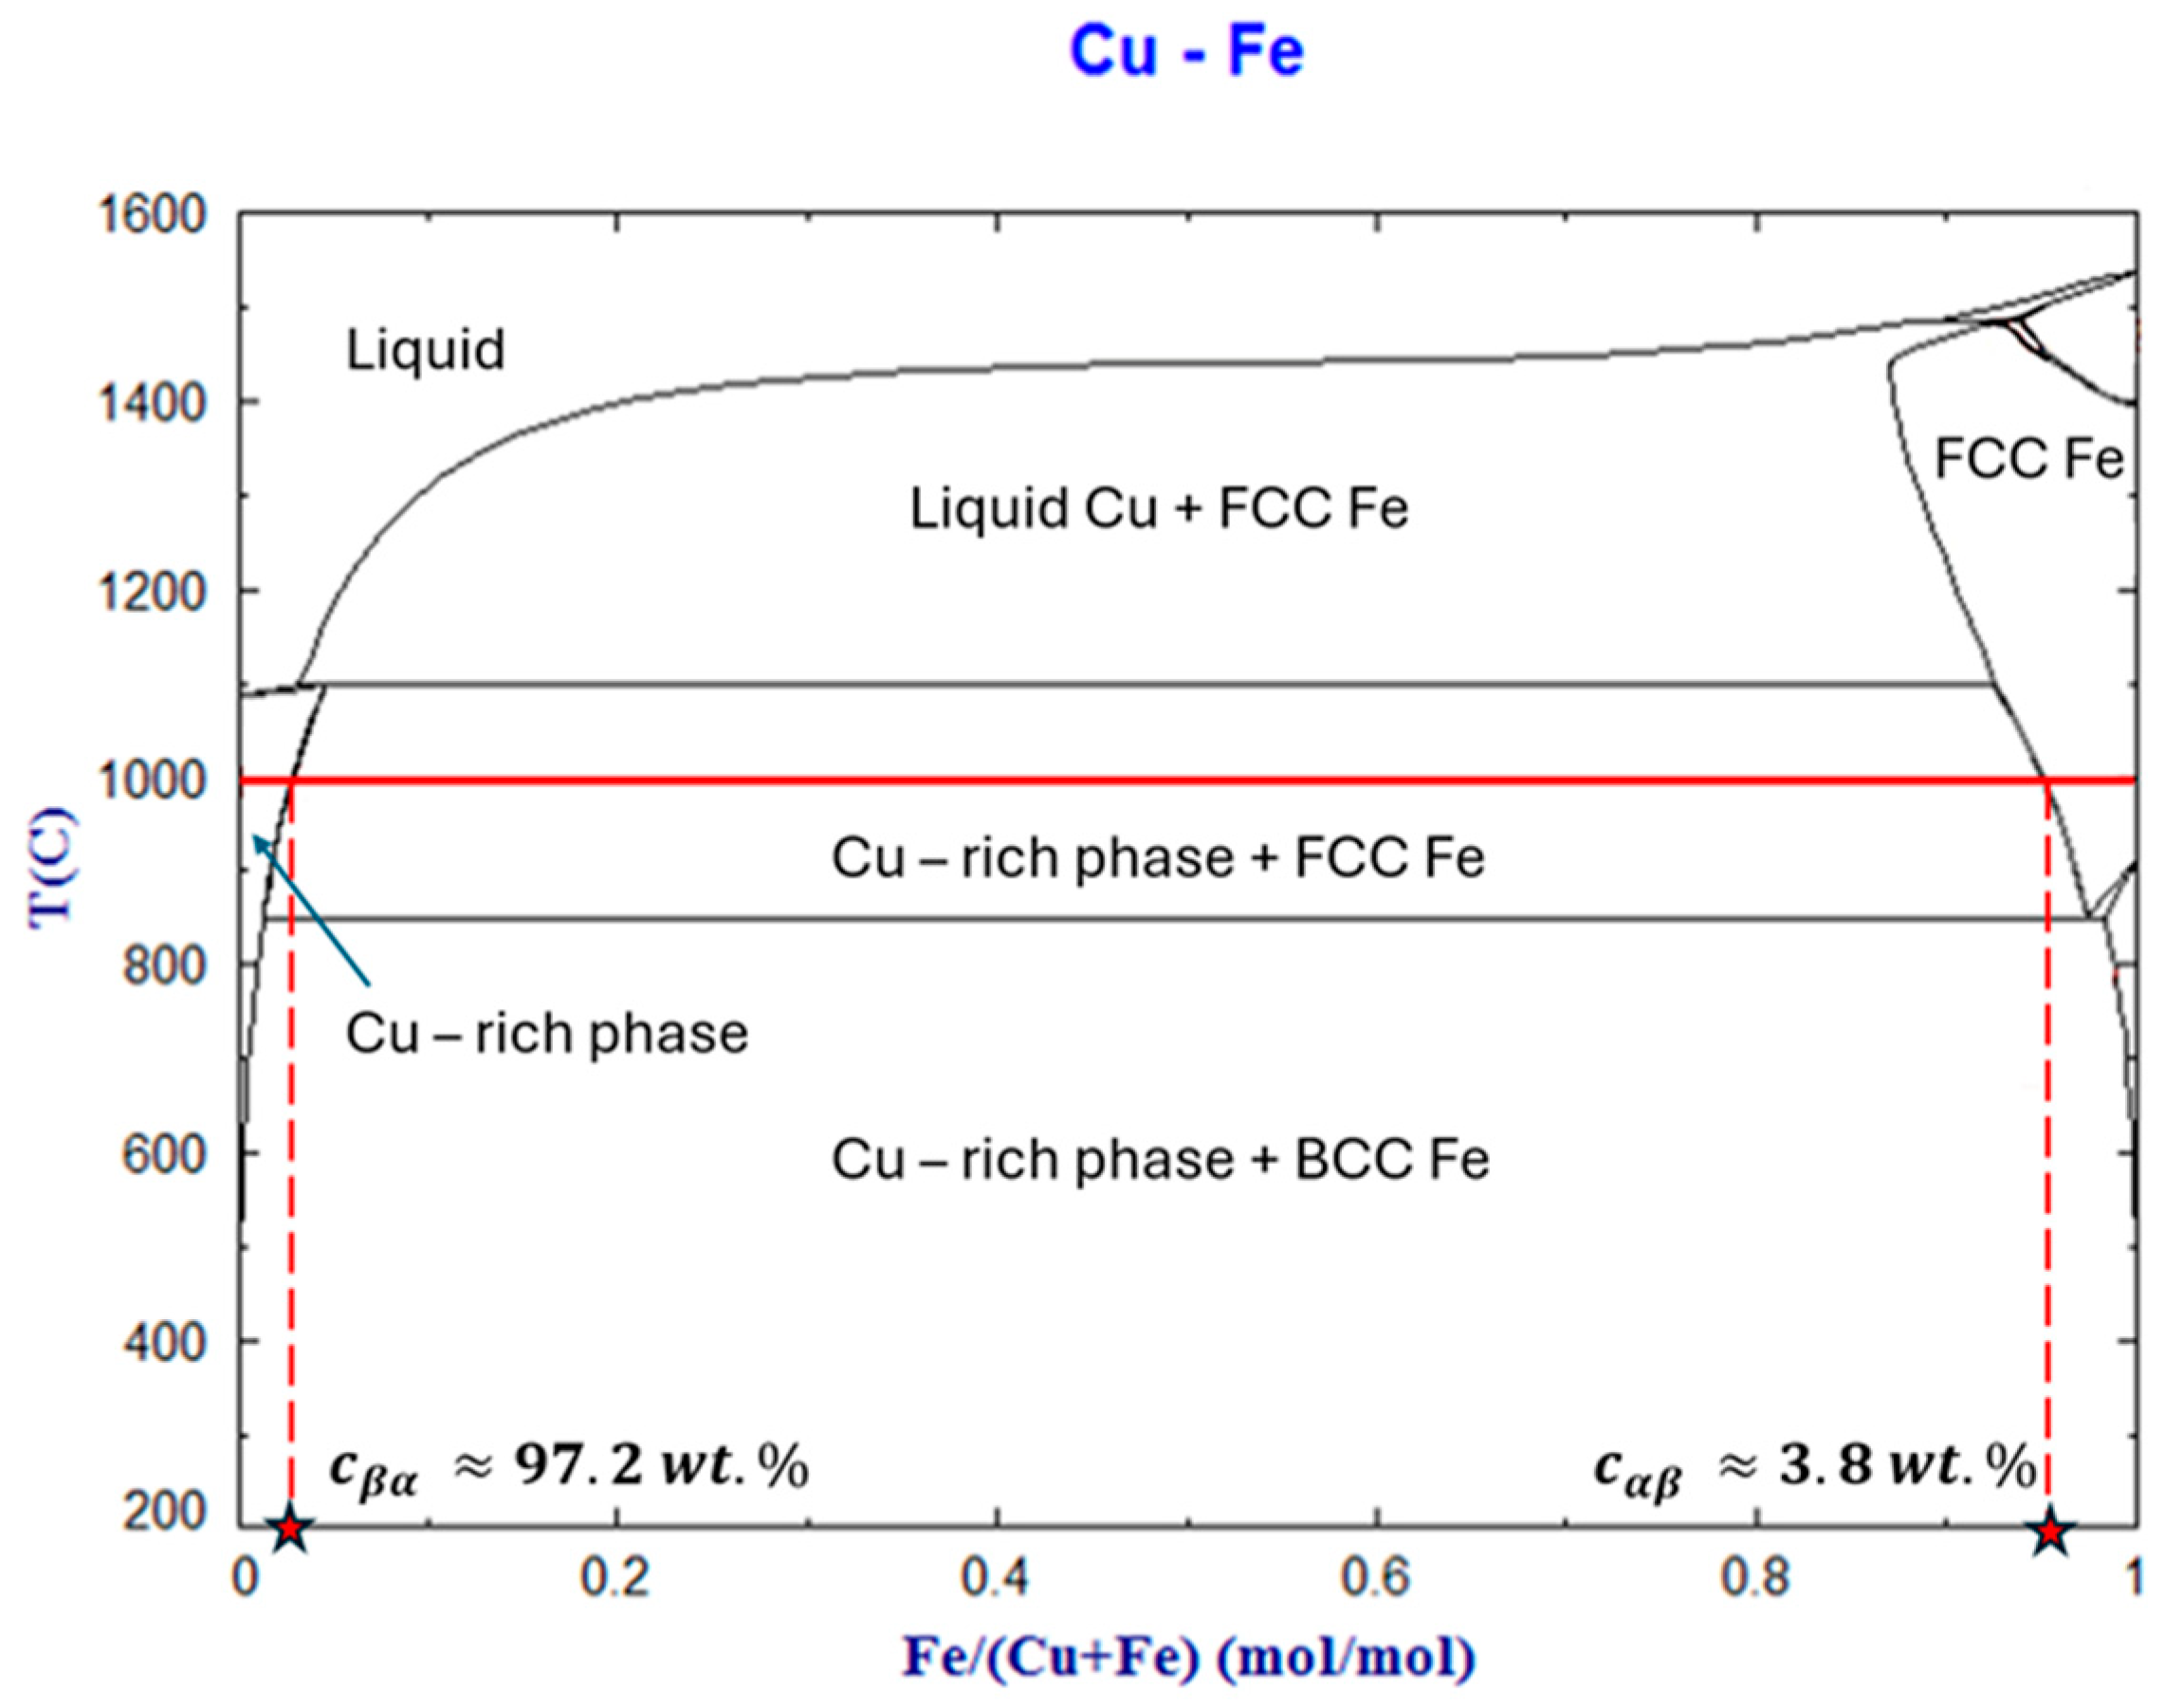
With the effective diffusivity established at D eff   =   6.45   ×   10 13   m 2 / s , the SJH moving boundary framework was implemented for the engineered diffusion couple. The model assumes a finite Cu reservoir with an initial half-width w 0 = 3   μ m ( 3 × 10 6   m ), governed by the thermodynamic constraints of the Fe-Cu system at 1000 °C (Figure 4).
Thermodynamic Boundary Conditions: The interfacial concentrations driving the diffusion flux are defined by the local equilibrium from the phase diagram, computed using the FactSage 8.1 thermochemical software (FScopp database).
  • α -phase Concentration: The solubility limit in the austenite matrix ( c α β ) is fixed at 3.8   w t . % , and the background residual concentration ( c ) is set at 0.21   wt . %
  • β -phase Concentration ( c β α ): To account for internal gradients within the Cu-film, the effective concentration of the dissolving phase is calculated as the average of the centerline ( 100   wt . % ) and interface ( 97.2   wt . % ) values, yielding c β α   98.6   w t . % .
The initial step in the implementation involves solving for the dimensionless kinetic constant (K) by substituting these values into the transcendental flux balance (Equation (8)). The right-hand side of the equation, representing the supersaturation ratio (S), is calculated as
S = K π e K 2 e r f c ( K ) = c α β c c β α c α β = 3.8 0.21 98.6 3.8   0.038  
Numerical solution of this transcendental expression results in a kinetic constant of K   0.02205 . This constant defines the rate at which the interphase boundary retreats as Cu diffuses away from the grain boundary. The transcendental equation was solved numerically using a bracketed root-finding algorithm (Brent’s method) over the interval [0, 1], with a convergence tolerance of |f(K)| < 10−12. The solution K ≈ 0.02205 was verified to be unique within this domain and stable across different initial bracket selections, confirming the robustness of the numerical procedure.
With the kinetic constant K established, the Cu concentration profile with respect to distance and time within the matrix is determined by Equation (9). By substituting the specific values for c , c α β , and K, the concentration c ( x ,   t ) at any distance x from the centerline is expressed as
c ( x , t ) = 0.21 + ( 3.8 0.21 ) erfc ( x 4 D e f f t ) erfc ( 0.02205 )
The critical dwell duration required for the complete dissolution of the metallic β -phase, or the extinction time ( t * ) , is subsequently calculated by substituting the initial width ( w 0 = 3   μ m ) and the system parameters into Equation (12):
t * = ( 3 × 10 6 ) 2 4 × ( 6.45 × 10 13 ) × ( 0.02205 ) 2 119.58   m i n

3.2.3. Modeling Results

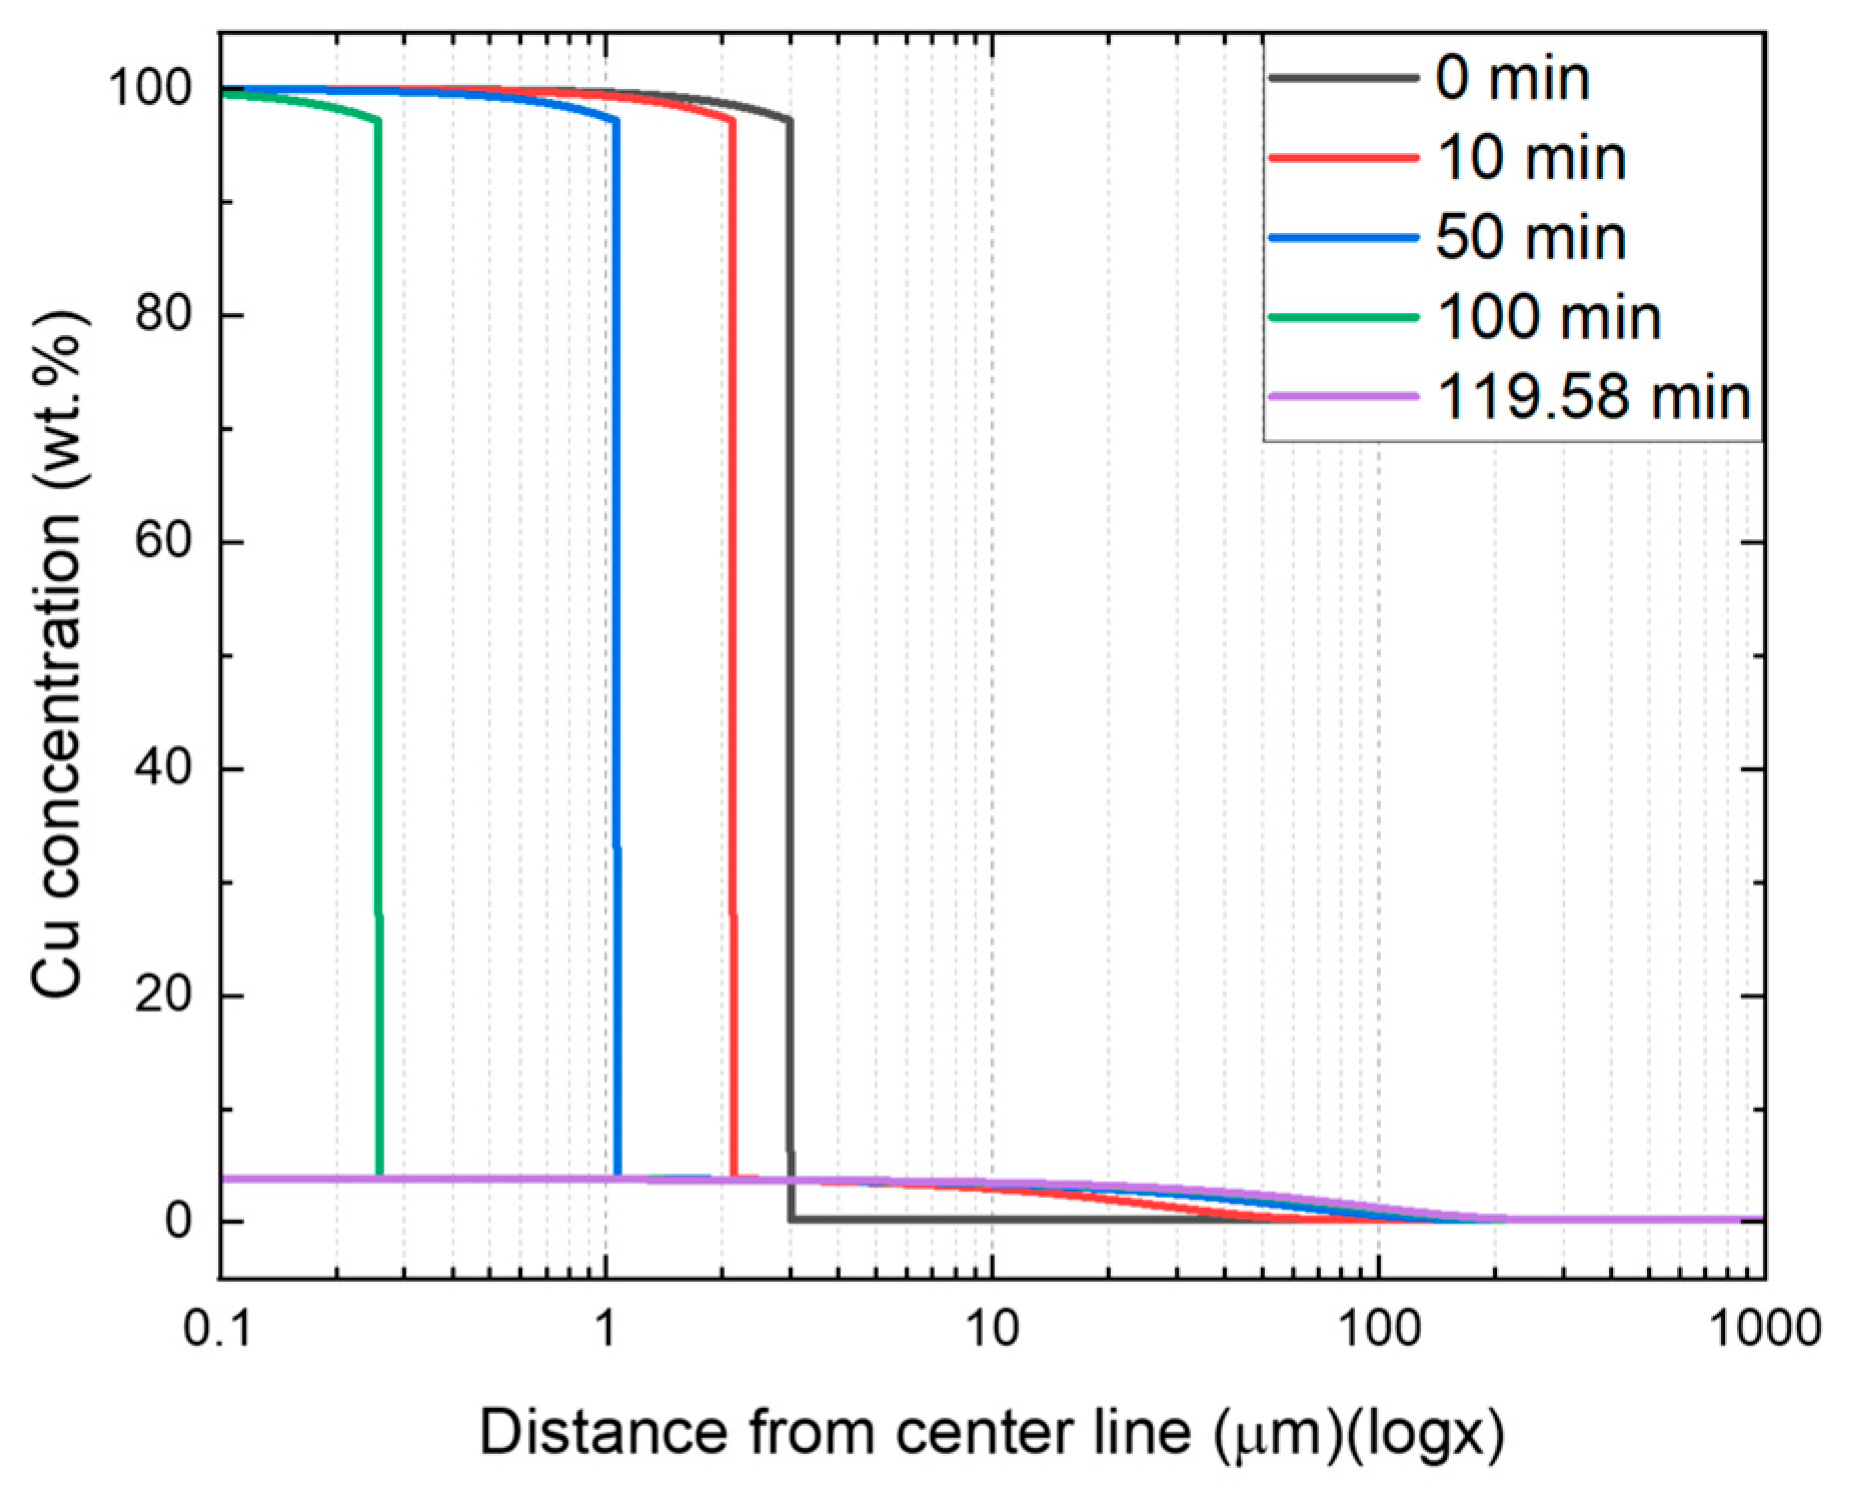
The solution for the copper concentration profile, as defined by Equation (14) in Section 3.2.2, is graphically represented in Figure 5. The plot illustrates the concentration of Cu relative to the distance (x) from the centerline at various time intervals (t) across the austenite grain boundary and into the matrix, emphasizing the moving phase boundary with time.

3.3. Experimental Validation

To corroborate the predictive accuracy of the SJH moving boundary model and the calculated effective diffusivity, experimental trials were conducted on the engineered wire rod described in Section 3.1. The objective of this validation phase is to physically replicate the simulated diffusion process and quantify the actual copper redistribution kinetics. By comparing the empirically measured concentration profiles against the theoretical curves generated in Section 3.2.3, the robustness of the analytical framework can be assessed, particularly regarding its ability to predict the interface recession rate and the penetration depth of copper into the steel matrix.

3.3.1. Experimentation and Characterization

Heat Treatment
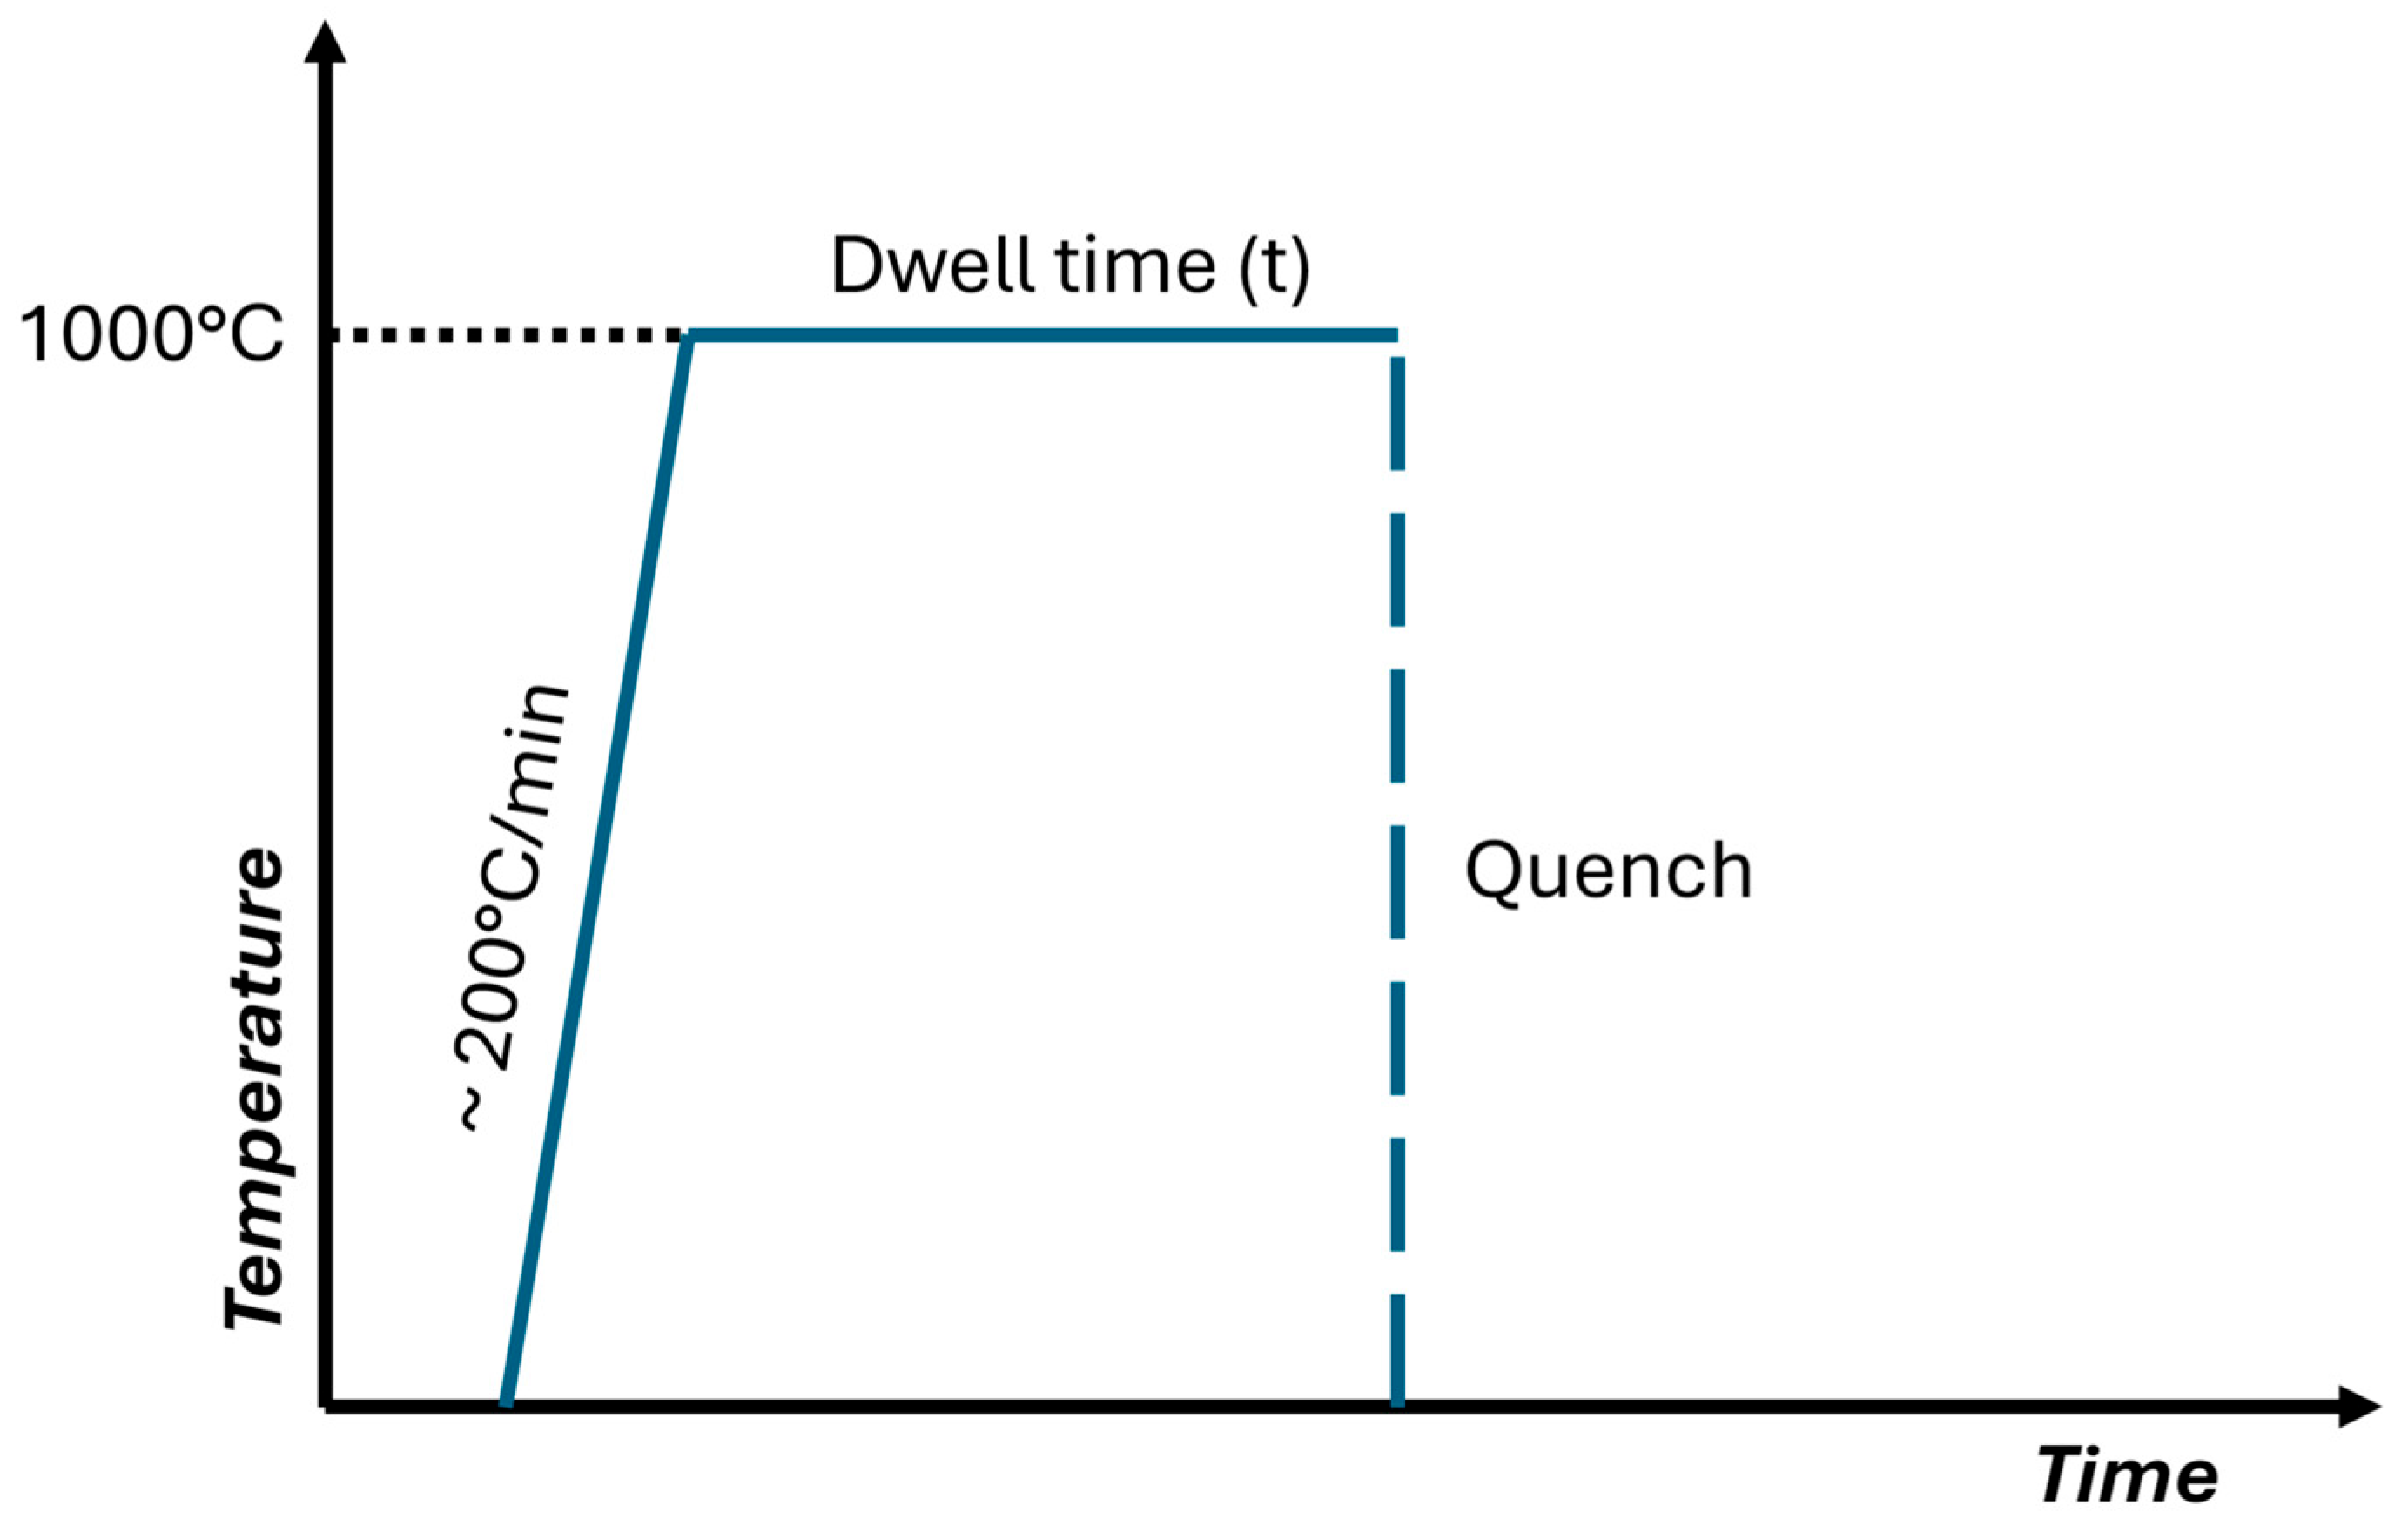
The Cu-coated wire rod samples were subjected to isothermal annealing in a halogen infrared heating chamber for steep heating and cooling rates and to induce solid-state diffusion. The heat treatment was performed at 1000 °C, matching the thermodynamic temperature of the model. To prevent surface oxidation of the copper coating and decarburization of the steel substrate, both of which would alter the boundary conditions, a reducing atmosphere consisting of 5% H 2 and 95% Ar was maintained throughout the thermal dwell. Samples were treated for varying durations to capture different stages of the dissolution process. Following the dwell, the samples were rapidly air-cooled to preserve the Cu precipitates (Figure 6).
Depth Profiling (GDOES)
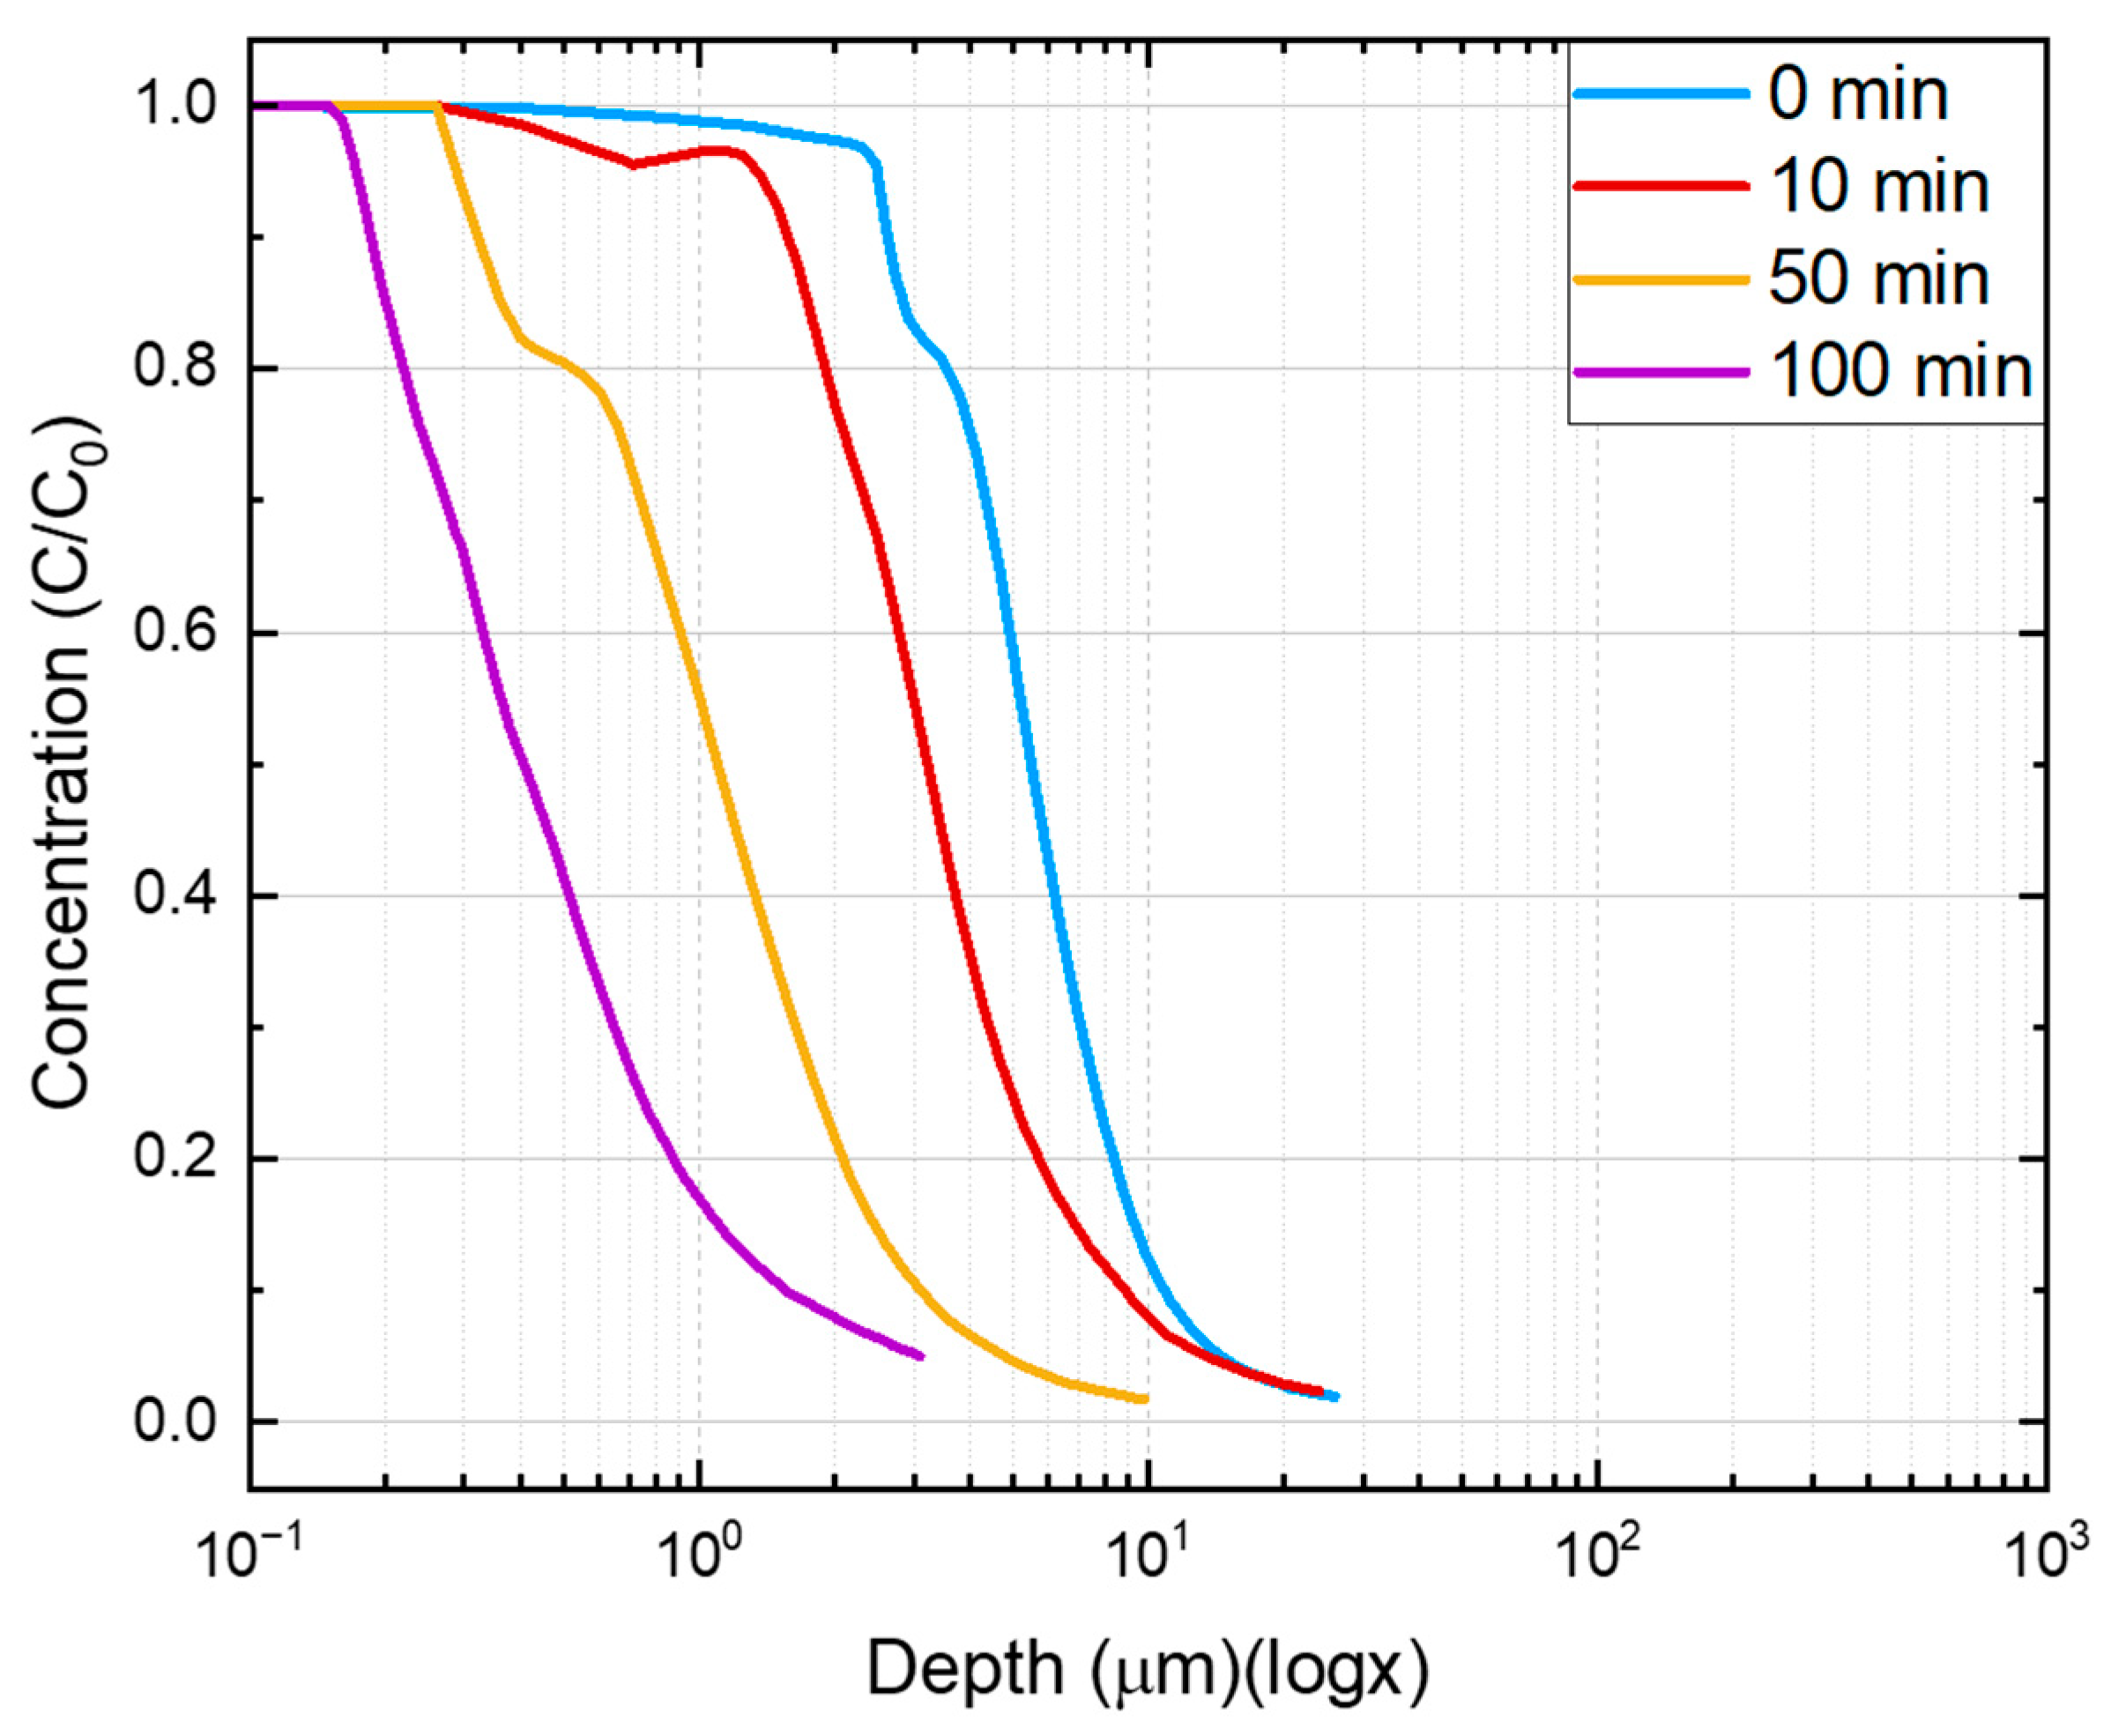
Unlike standard cross-sectional microscopy, which provides 2D visual data, validating the continuous concentration function c ( x , t ) requires precise elemental quantification as a function of depth. Therefore, the heat-treated samples were analyzed using Glow Discharge Optical Emission Spectrometry (GDOES; GD-Profiler 2, Horiba Scientific, Kyoto, Japan). This technique was selected for its high depth resolution and ability to rapidly sputter through surface layers. The analysis was conducted radially inward from the coating surface into the steel core, generating a quantitative depth profile of copper concentration vs. distance ( x ). These empirical profiles provide the direct dataset necessary for one-to-one comparison with the analytical model predictions.

3.3.2. Results

The quantitative depth profiles of copper concentration obtained via GDOES for the as-deposited ( t = 0 ) and heat-treated ( t = 10 , 50 and 100 min, respectively) samples are presented in Figure 7.

4. Discussion and Industrial Application

4.1. Experimental Validation of the Diffusion Model

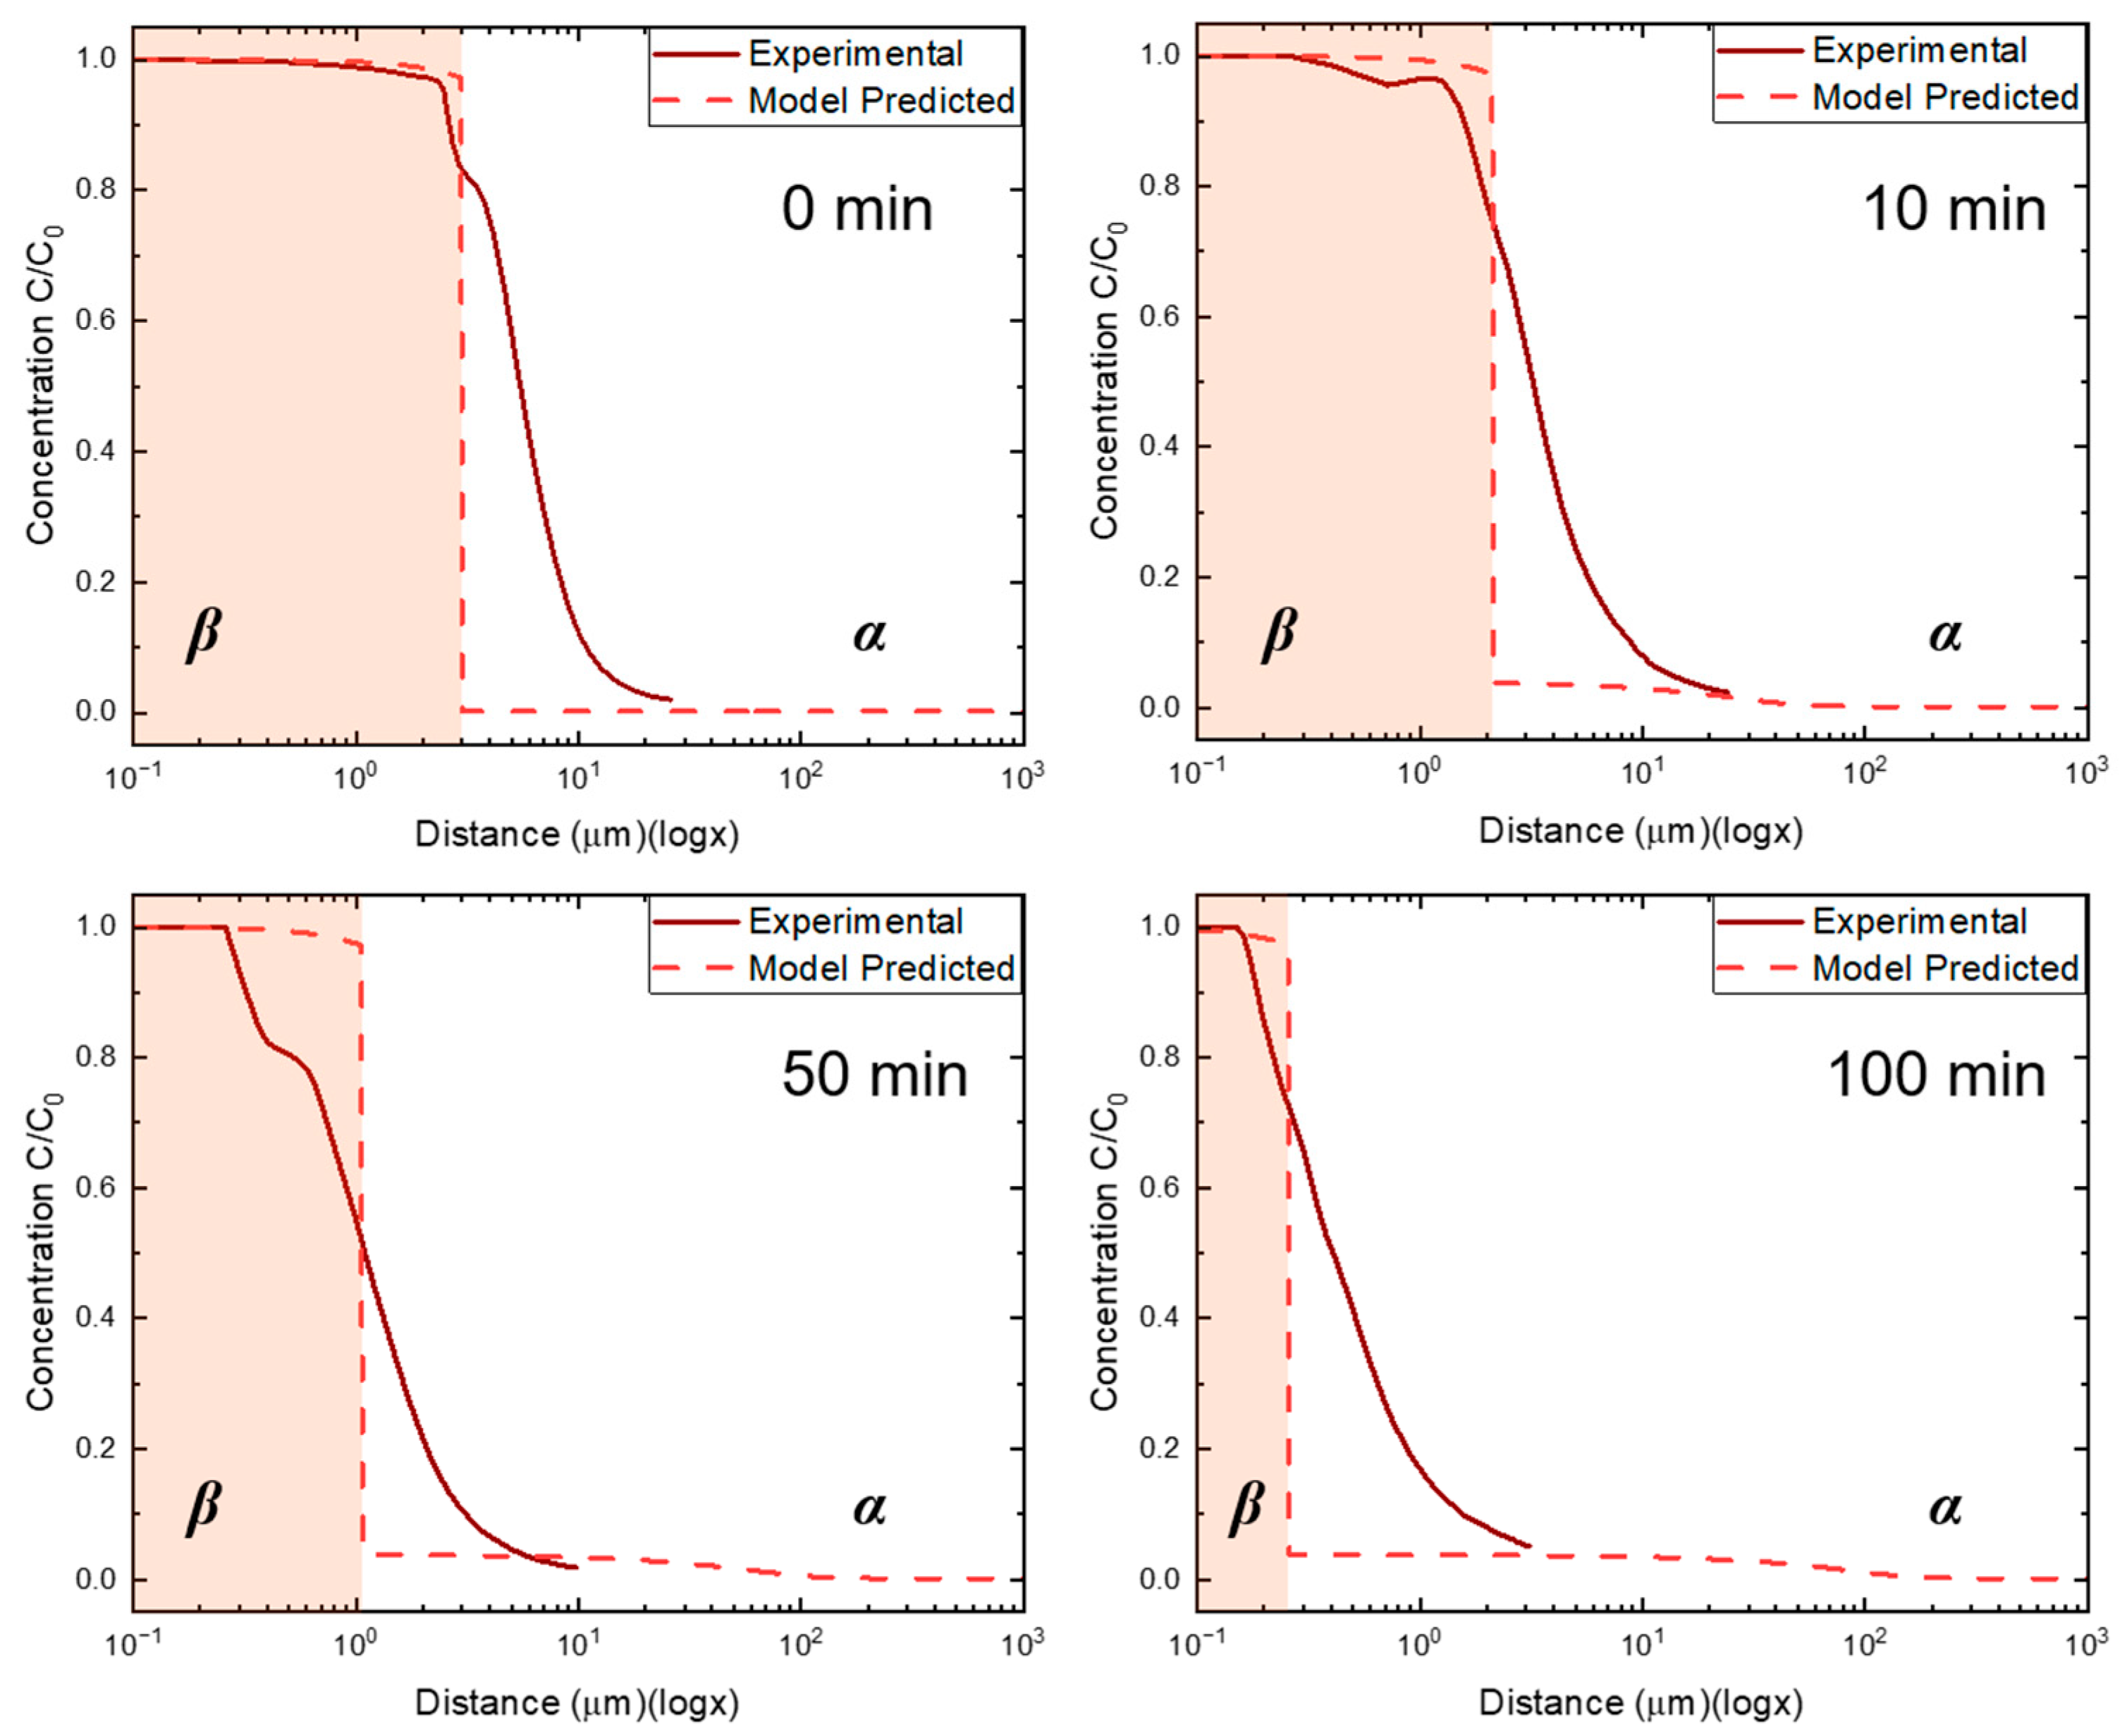
To validate the predictive accuracy of the SJH moving boundary framework, the analytical concentration profiles derived in Section 3.2 were superimposed onto the experimental GDOES depth profiles across different dwell times of the heat treatment. Figure 8 presents this comparative matrix, illustrating the evolution of the copper distribution at t = 0 ,   10 ,   50 ,   a n d   100 min.
The comparison between the empirical GDS depth profiles (solid lines) and the theoretical predictions (dashed curves) shown in Figure 8 indicates that the model captures the diffusion behavior of the system. To quantify this agreement, the mean absolute percentage error (MAPE) between the analytical curves and the experimental GDOES data was evaluated across dwell times of 10, 50, and 100 min. The MAPE values for the concentration profiles in the austenite matrix ranged between 8 and 15%, with the closest agreement observed at t = 100 min, confirming that the model provides a quantitatively reasonable prediction of the Cu redistribution kinetics.
In the β -phase (Cu coating), Figure 8, the experimental data shows a constant concentration plateau. This aligns with the model’s boundary condition for a finite Cu reservoir ( w 0 ).
In the α -phase (steel substrate), the theoretical curves track the copper penetration depth into the iron matrix. This indicates that the calculated effective diffusion coefficient ( D e f f ) approximates the atomic mobility of Cu within the microstructure at 1000 °C.
A characteristic slant or gradient is observed at the interface between the two phases in the GDS profile. This gradient arises because the GDS analysis was performed on a cylindrical wire rod sample rather than a flat standard. The curvature of the sample surface causes the sputtering area to average across slightly different depths at the interface, resulting in the observed slope.
Regarding the thermodynamic boundary conditions, the concentration profiles drop to the solubility limit ( C α / β ) at the interface and decay to the far-field concentration ( C ) of 0.21 wt.%. The agreement at these points confirms that local equilibrium conditions were met at the moving boundary. It is worth noting that GDOES was specifically selected as the validation tool because the analytical model outputs a continuous concentration field c(x,t), and depth profiling provides the most direct quantitative comparison with this prediction. While complementary microstructural imaging techniques (e.g., SEM, TEM) could provide morphological information about the Cu-rich phases, they are less suited for validating concentration-versus-depth predictions. The metallographic quantification of sensitized zone frequency and geometry reported in Table 2, conducted using SEM-based image analysis in prior work [4], serves as an independent corroboration of the model’s predictive capability.
The analytical framework derived in Section 2 rests on several simplifications whose physical implications merit discussion. First, the 1D planar geometry assumes that the Cu-rich film is laterally uniform and that curvature effects at the dissolving interface are negligible. This is justified when the film thickness (~20 nm) is orders of magnitude smaller than the grain boundary radius of curvature associated with a mean grain size of ~37 µm, ensuring that the local dissolution kinetics are well approximated by a planar front. Second, the semi-infinite medium assumption requires that the diffusion penetration depth remains small relative to the grain diameter. At the predicted extinction time (t* ≈ 8.57 min), the characteristic diffusion length √(4Dt*) is on the order of tens of nanometers, which is negligible compared to the grain size, validating this assumption. Third, the model treats each grain boundary film independently and does not capture interactions between neighboring boundaries, triple junction geometry, or global microstructural heterogeneity; it therefore provides a local, per-boundary kinetic prediction rather than a spatially resolved microstructural simulation. These simplifications are appropriate for the present system but may require relaxation for alloys with significantly higher Cu content, finer grain sizes, or non-equiaxed grain morphologies.
Regarding the morphology of the Cu-rich phase at grain boundaries, during the sensitization stage at 1200 °C, the local temperature exceeds the melting point of Cu (1085 °C), and the resulting Cu-rich liquid phase exhibits a low dihedral angle in contact with austenite, promoting continuous wetting along grain boundaries rather than discrete accumulation at triple junctions [4,5,24]. Upon cooling to the desensitization temperature of 1000 °C, the solidified Cu retains this film-like morphology, as supported by the elongated sensitized zones observed in the metallographic analysis of [4]. This provides metallurgical justification for the planar film assumption adopted in the present model, though it is acknowledged that in systems with lower Cu content or different grain boundary character distributions, the Cu-rich phase may preferentially localize at triple junctions, which would require a modified geometric treatment [10,12].

4.2. Industrial Application (Case—2)

The high-performance requirements of the automotive tire industry necessitate steel wire rods with exceptional ductility and tensile integrity for the cold-drawing process. In this context, the localized accumulation of residual copper (Cu) at grain boundaries represents a critical manufacturing bottleneck, often leading to premature failure during extreme plastic deformation. Having validated the mathematical framework on a macroscopic controlled sample, this section scales the model parameters to address these specific microscopic heterogeneities. The objective is to define a precise thermal desensitization window that ensures the complete dissolution of these deleterious films [4].
The 21Cu wire rods discussed in Section 3.1 were initially subjected to a high-temperature reheating simulation at 1200 °C to intentionally induce a “sensitized” state characterized by the formation of Cu-rich films along prior austenite grain boundaries. This specific chemistry and microstructural state serve as the baseline for the implementation of the analytical model, providing a direct link between the physical dimensions of the sensitized zones and the kinetic constants required for the following dissolution analysis [4].
It is important to distinguish between two characteristic length scales in the sensitized microstructure. The Cu-rich β-phase film, which forms when the local Cu concentration exceeds the solubility limit in austenite, has a maximum thickness on the order of 20 nm; its half-width (w0 = 10 nm) defines the initial condition for the moving boundary model and governs the extinction time. In contrast, the “sensitized zone” quantified in Table 2 (width ≈ 2.04 µm) represents the broader Cu-enriched region surrounding the film, where Cu concentration is elevated above the bulk level but remains below the solubility limit. The model predicts the dissolution of the β-phase film specifically; once this film is consumed at t*, the residual Cu enrichment in the surrounding zone continues to homogenize via lattice diffusion, which accounts for the reduced but non-zero zone dimensions observed after the 10 min treatment (Table 2).

Model Implementation

For the case of sensitized zones in 21Cu steel wire rods, the following parameters are considered,
  • Geometry ( w 0 ): In contrast to the 3 μ m coating used for validation, the sensitized zones in the 0.21 wt.% Cu steel wire rods are observed along the prior austenite grain boundaries. The maximum thickness of the Cu film can be approximately 20 nm. Consequently, the initial half-width for the model is set to w 0   =   10   nm ( 10 8   m ).
  • Diffusivity ( D ): While the macroscopic transport in Section 3 was averaged over a polycrystalline network ( D e f f ), the dissolution of a discrete film into an adjacent austenite grain is locally governed by lattice diffusion. Because the dissolution flux is directed perpendicular to the grain boundary—from the Cu-rich film into the interior of the adjacent austenite grain—the relevant transport mechanism is lattice diffusion rather than short-circuit grain boundary diffusion. This is in contrast to Case 1 (Section 3.2.1), where the macroscopic diffusion across a polycrystalline network necessitated the use of an effective diffusion coefficient via the Hart equation. Therefore, the interdiffusion coefficient for Cu in γ -Fe at 1000°C is applied as D     1.0   ×   10 16   m 2 / s , calculated via the standard Arrhenius parameters ( D 0 = 1.29 × 10 4 , Q = 295   kJ / mol ) [21,22].
By substituting the specific values for c , c α β , and K in Equation (9), the concentration c ( x ,   t ) at any distance x from the centerline is expressed as
c ( x , t ) = 0.21 + ( 3.8 0.21 ) erfc ( x 4 D t ) erfc ( 0.02205 )
The critical dwell duration required for the complete dissolution of the metallic β -phase, or the extinction time ( t * ) , is subsequently calculated by substituting the initial half-width ( w 0 = 10   nm ) and the system parameters into Equation (12):
t * = ( 10 × 10 9 ) 2 4 × ( 1 × 10 16 ) × ( 0.02205 ) 2 514.19   s
Finally, the non-linear reduction in the total sensitized film thickness ( W ) as a function of time is quantified by the Parabolic Shrinkage Law (Equation (13)), where W ( t ) for this specific case is defined as
W ( t ) = 20 ( 1 t 514.19 )   nm
The evolution of the Cu-rich film width (W) with respect to time (t) along the grain boundary during desensitization is plotted in Figure 9. This graph displays the film thickness on the y-axis against time (t) on the x-axis, with the computed extinction time ( t * ) clearly identified at the x-intercept, representing the point of complete dissolution.
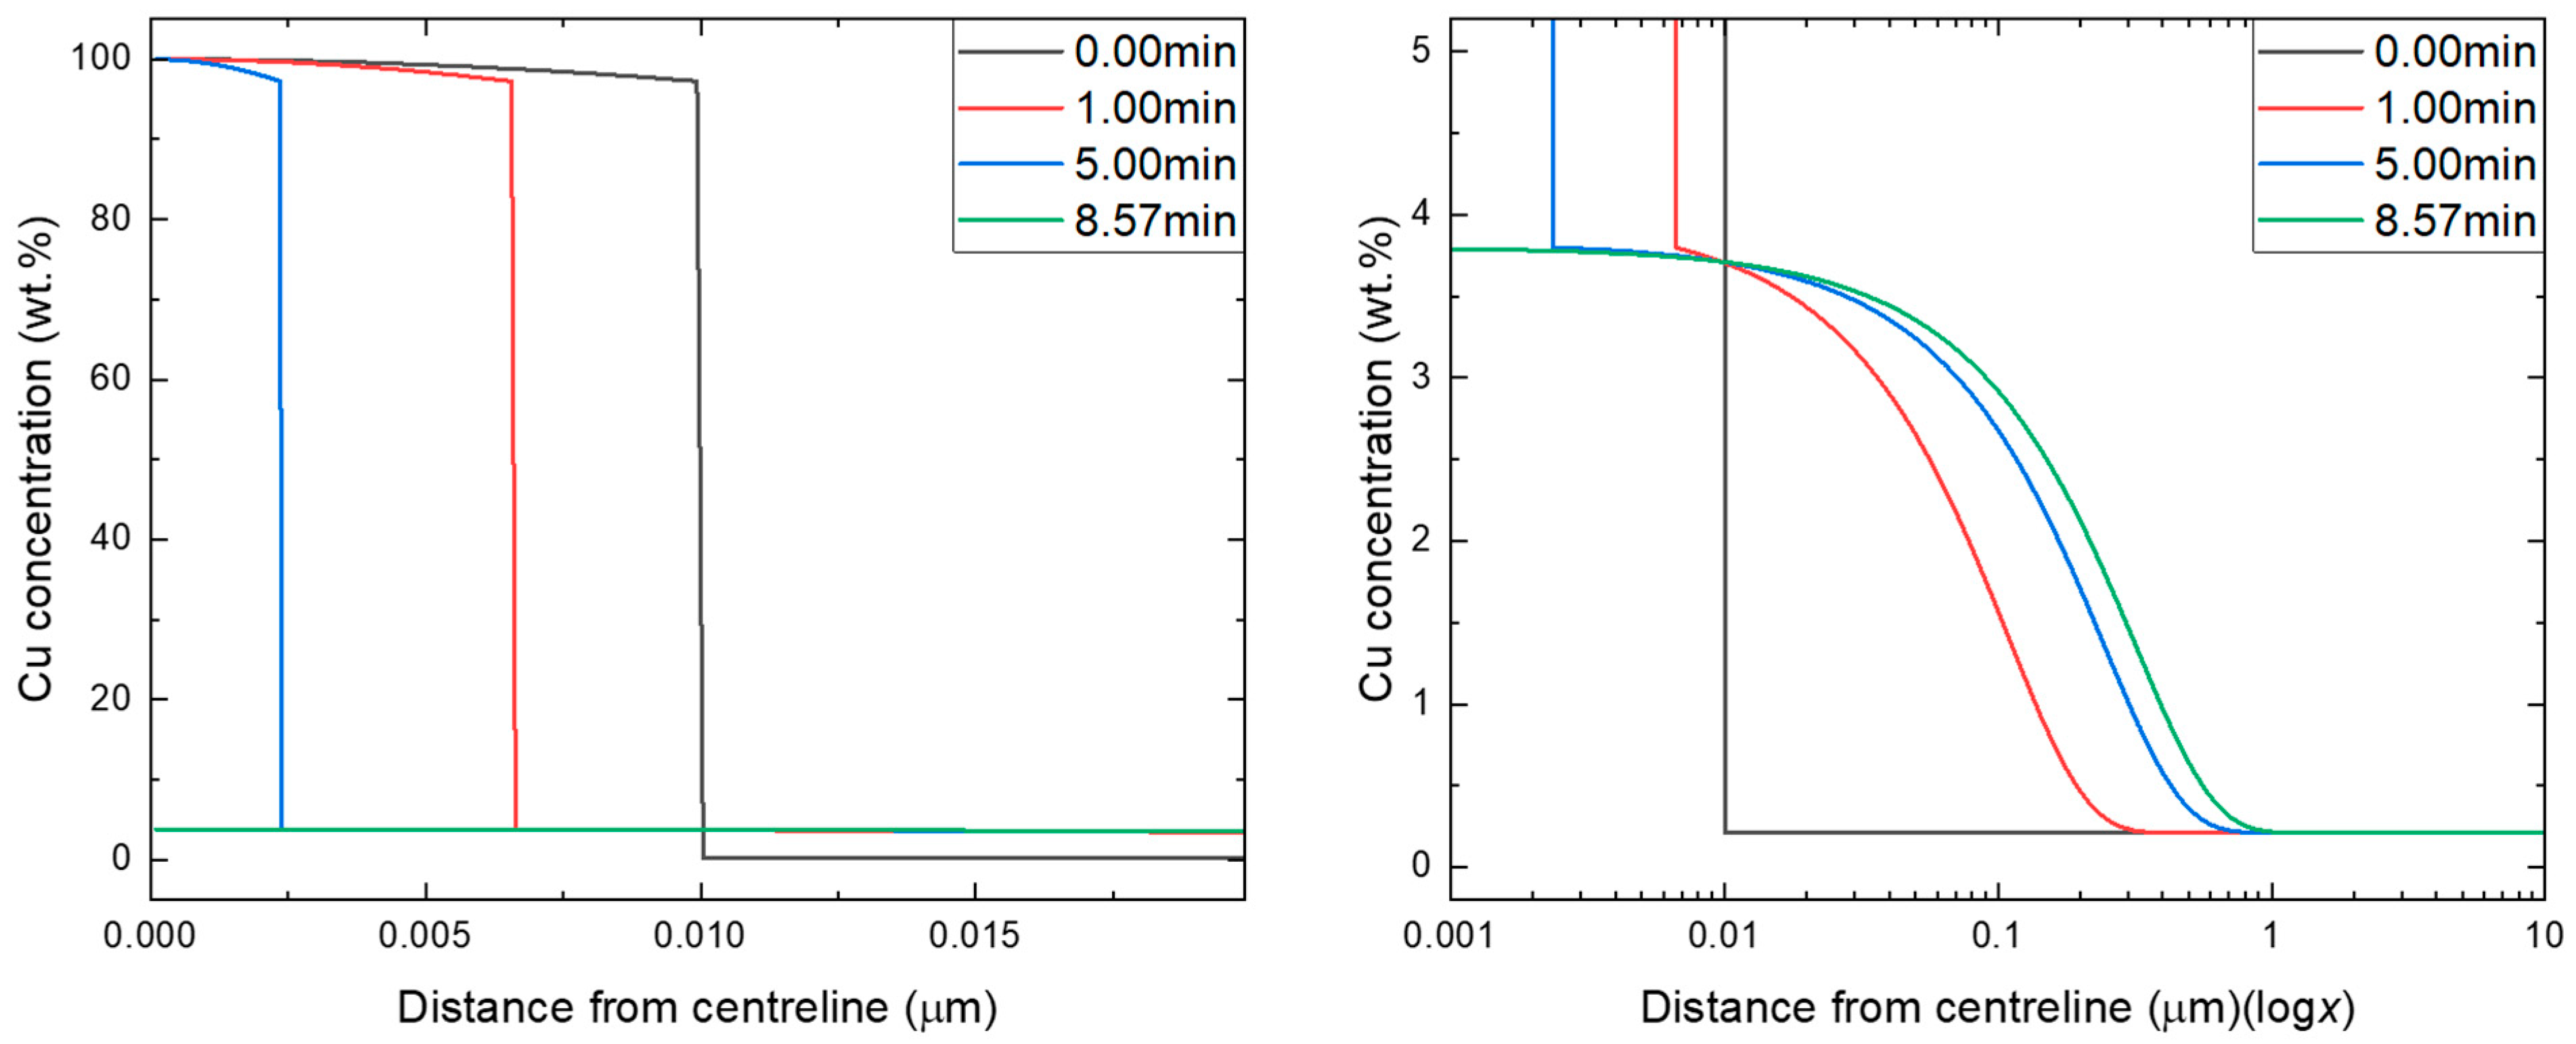
The solution for the copper concentration profile, as defined by Equation (15) in Section 3.2, is graphically represented in Figure 10. These plots illustrate the computed Cu concentration profile relative to the distance (x) from the centerline at various time intervals (t) across the austenite grain boundary and into the matrix.
The model, applying the calculated effective lattice diffusion parameters for γ -Fe at 1000 °C, predicted a critical extinction time ( t * ) of approximately 8.57 min for the complete dissolution of a Cu-rich grain boundary film of 0.21 wt.% Cu steel wire rod with an initial half-width ( w 0 ) of 10 nm.
To verify this, sensitized samples were subjected to a thermal dwell of 10 min, a conservative duration selected to slightly exceed the predicted extinction time to ensure robustness. The effectiveness of the model-designed heat treatment was evaluated by quantifying the frequency and geometry of residual Cu-rich zones before and after the 10 min dwell. The comparative results are summarized in Table 2.
The experimental data demonstrates an alignment with analytical prediction. Following the 10 min treatment at 1000 °C in a reducing atmosphere, the frequency of detectable sensitized zones per unit length decreased from 7.65   ± 2.29   m m 1 to 0.86   ± 0.40   m m 1 . This represents an approximate 89% reduction in the population of sensitized grain boundaries, confirming that the majority of the Cu-rich β -phase films were successfully dissolved into the austenite matrix as predicted by the interface velocity equation (Equation (11)).
Furthermore, the geometry of the few remaining detectable zones indicates significant diffusion has occurred. The average width of these zones was reduced from 2.04   ± 0.58   μ m to approximately 0.9   ± 0.2   μ m . It is important to emphasize that the validation of the analytical model is primarily evidenced by the drastic reduction in the population of sensitized zones, along with changes in their geometry.
These results validate the diffusion-based model as a viable tool for industrial process design. By accurately predicting the time scale required to redistribute Cu below critical thresholds, the model allows for the optimization of reheating furnace schedules. The successful reduction in both the size and frequency of sensitized zones transforms the microstructure from a brittle, sensitized state to a homogenized state, thereby restoring the ductility required for high-performance applications such as tire cord manufacturing.

5. Conclusions

The transition toward a circular steel economy is currently hindered by the accumulation of residual copper in scrap streams, which compromises the thermo-mechanical integrity of high-value products through the phenomenon of hot shortness. This study addressed this critical challenge by establishing a fundamental, diffusion-based analytical framework designed to predict the kinetics required to dissolve deleterious copper-rich phases back into the steel matrix. Rather than relying on costly alloying additions or empirical trial-and-error, this work demonstrates that the desensitization of grain boundaries can be rationally designed using thermodynamic and kinetic principles to restore material performance. The key findings and validatory outcomes of this study are summarized as follows:
  • A mathematical model based on Fick’s Second Law and the Sekerka, Jeanfils, and Heckel (SJH) moving boundary approach was successfully adapted to quantify the redistribution of Cu from sensitized grain boundaries into the austenite matrix.
  • The analytical solution was validated through an experimentation plan utilizing controlled, Cu-coated wire rod samples, where theoretical model outcomes showed an agreement with empirically measured Cu–depth profiles.
  • For a 0.21 wt.% Cu steel system processed at 1000 °C, the model predicted a critical extinction time ( t * ) of approximately 8.57 min for the complete dissolution of a 20 nm sensitized film.
  • The theoretical prediction was corroborated by experimental trials, where a 10 min thermal dwell resulted in an approximately 89% reduction in the frequency of detectable sensitized zones.
Ultimately, the effectiveness of this approach lies in its distinct move away from site-specific empiricism toward a standardized, physics-based methodology. By providing a generalized predictive tool that relies on fundamental diffusion coefficients, this framework is composition-adaptable and inherently scalable within the 1D planar approximation. This allows industrial steelmakers to optimize reheating schedules for varying scrap compositions and product dimensions mathematically, offering a practical and economically viable strategy to increase the utilization of high-residual scrap in premium applications significantly.

Author Contributions

Conceptualization, R.G.; Methodology, R.G.; Validation, P.A.; Investigation, R.G. and P.A.; Writing—original draft, R.G.; Writing—review & editing, P.A., T.S., C.M., S.H., N.N. and S.S.; Supervision, T.S., C.M., S.H., N.N. and S.S.; Project administration, T.S., C.M., S.H., N.N. and S.S.; Funding acquisition, S.H., N.N. and S.S. All authors have read and agreed to the published version of the manuscript.

Funding

This material is based upon work supported by the U.S. Department of Energy’s Office of Energy Efficiency and Renewable Energy (EERE) under the Advanced Manufacturing Office Award Number DE-EE0007897 awarded to the REMADE Institute, a division of Sustainable Manufacturing Innovation Alliance Corp.

Data Availability Statement

The original contributions presented in this study are included in the article. Further inquiries can be directed to the corresponding author.

Conflicts of Interest

The author Charlotte Mayer was employed by the company Michelin de Cataroux, 8 Rue de la Grolière, 63100 Clermont, Ferrand, France; C. Mayer. The author Sebastien Hollinger was employed by the company Michelin North America, 1 Parkway S, Greenville, SC, 29615, USA; S. Hollinger. The remaining authors declare that the research was conducted in the absence of any commercial or financial relationships that could be construed as a potential conflict of interest.

References

  1. Worldsteel Association. Circular Economy Principles in the Steel Industry. Available online: https://worldsteel.org/wider-sustainability/circular-economy/ (accessed on 14 January 2026).
  2. Bureau of International Recycling (BIR). World Steel Recycling in Figures: January–June 2024 Update. Available online: https://www.bir.org/en/members-area/world-mirrors/mirrors-ferrous/1000035987-world-steel-recycling-in-figures-january-june-2024-update (accessed on 14 January 2026).
  3. Daehn, K.E.; Cabrera Serrenho, A.; Allwood, J.M. How Will Copper Contamination Constrain Future Global Steel Recycling? Environ. Sci. Technol. 2017, 51, 6599–6606. [Google Scholar] [CrossRef] [PubMed]
  4. Gandra, R.; Acharya, P.; Shyrokykh, T.; Mayer, C.; Hollinger, S.; Neithalath, N.; Sridhar, S. Mitigation of Cu-Induced Grain Boundary Sensitization in Steel Wire Rods Through a Desensitization Heat Treatment. Processes 2026, 14, 195. [Google Scholar] [CrossRef]
  5. Melford, D.A. The Influence of Residual and Trace Elements on Hot Shortness and High Temperature Embrittlement. Philos. Trans. R. Soc. Lond. Ser. A Math. Phys. Sci. 1997, 295, 89–103. [Google Scholar] [CrossRef]
  6. Webler, B.; Yin, L.; Sridhar, S. Effects of Small Additions of Copper and Copper + Nickel on the Oxidation Behavior of Iron. Metall. Mater. Trans. B 2008, 39, 725–737. [Google Scholar] [CrossRef]
  7. Shibata, K.; Seo, S.-J.; Kaga, M.; Uchino, H.; Sasanuma, A.; Asakura, K.; Nagasaki, C. Suppression of Surface Hot Shortness Due to Cu in Recycled Steels. Mater. Trans. 2002, 43, 292–300. [Google Scholar] [CrossRef]
  8. Eastop, T.D.; McConkey, A. Applied Thermodynamics for Engineering Technologists, 5th ed.; Pearson Education: Upper Harlow, UK, 1993. [Google Scholar]
  9. Daehn, K.E.; Serrenho, A.C.; Allwood, J.M. Circular Steel: How Information and Actor Incentives Impact the Recyclability of Scrap. J. Sustain. Metall. 2021, 7, 436. [Google Scholar] [CrossRef]
  10. Kalhor, A.; Khodabakhshi, F.; Amirabdollahian, S. Copper in Steels: From Residual Contamination to a Functional Alloying Element. Steel Res. Int. 2025, 2501329. [Google Scholar] [CrossRef]
  11. Thermo-History-Dependent Copper Enrichment During High-Temperature Oxidation of Recycled Steels. Materials 2024, 19, 595. [CrossRef]
  12. Peehal, A.; Belrhiti, Y.; Hu, D.; Yan, W.; Grilli, N. Modeling of Hot Shortness in Steel with Copper Impurities: Diffusion, Crystal Plasticity, and Phase-Field Fracture for Hot Rolling. SSRN 2025, 5713694. [Google Scholar]
  13. Divinski, S.V.; Pokoev, A.V.; Esakkiraja, N.; Paul, A. The Algorithm to Predict the Grain Boundary Diffusion in Non-Dilute Metallic Systems. Metals 2023, 13, 393. [Google Scholar] [CrossRef]
  14. Leblond, J.B.; Aouafi, A.; Devaux, J. Analytical Modeling of the Mixed-Mode Growth and Dissolution of Precipitates in a Finite System. Metals 2019, 9, 889. [Google Scholar] [CrossRef]
  15. Kumosa, C.; Summers, R. Numerical Solution of the Diffusion Equation with Moving Boundary Applied to Modelling of the Austenite–Ferrite Phase Transformation. Comput. Mater. Sci. 2008, 44, 783–791. [Google Scholar] [CrossRef]
  16. Callister, W.D., Jr.; Rethwisch, D.G. Materials Science and Engineering: An Introduction, 10th ed.; Wiley: Hoboken, NJ, USA, 2018. [Google Scholar]
  17. Aaronson, H.I. Lectures on the Theory of Phase Transformations, 2nd ed.; TMS (The Minerals, Metals & Materials Society): Warrendale, PA, USA, 1999. [Google Scholar]
  18. Crank, J. The Mathematics of Diffusion, 2nd ed.; Oxford University Press: Oxford, NY, USA, 1980; ISBN 978-0-19-853411-2. [Google Scholar]
  19. Belova, I.V.; Murch, G.E. Kinetic Modeling of Grain Boundary Diffusion: The Influence of Grain Size and Surface Processes. Metals 2020, 10, 321. [Google Scholar] [CrossRef]
  20. Zhu, J.; Chen, L.Q.; Shen, J. Finite Element Analysis of the Grain Size Effect on Diffusion in Polycrystalline Materials. Comput. Mater. Sci. 2014, 93, 191–197. [Google Scholar] [CrossRef]
  21. Butrymowicz, D.B.; Manning, J.R.; Read, M.E. Diffusion in Copper and Copper Alloys Part IV. Diffusion in Systems Involving Elements of Group VIII. J. Phys. Chem. Ref. Data 1976, 5, 103–200. [Google Scholar] [CrossRef]
  22. Salje, G.; Feller-Kniepmeier, M. The Diffusion and Solubility of Copper in Iron. J. Appl. Phys. 1977, 48, 1833–1839. [Google Scholar] [CrossRef]
  23. Bale, C.W.; Bélisle, E.; Chartrand, P.; Decterov, S.A.; Eriksson, G.; Gheribi, A.E.; Hack, K.; Jung, I.-H.; Kang, Y.-B.; Melançon, J.; et al. FactSage Thermochemical Software and Databases—2010–2016. Calphad 2016, 54, 35–53. [Google Scholar] [CrossRef]
  24. Study on the Embrittlement of Steel Grain Boundaries Caused by Penetration and Diffusion of Liquid Copper. Coatings 2025, 15, 408. [CrossRef]
Figure 1. Schematic of the 1D planar moving boundary diffusion model overlaid on a sensitized zone observed in a steel wire rod.
Processes 14 01603 g001
Figure 2. Illustration of variables along a predicted Cu concentration profile curve, overlaid on Figure 1.
Processes 14 01603 g002
Figure 3. Schematic illustration and physical macrograph of the engineered diffusion couple, consisting of 21Cu steel wire rod bulk with a uniform 3 μ m electrodeposited copper coating.
Processes 14 01603 g003
Figure 4. Fe-Cu Phase diagram [23].
Processes 14 01603 g004
Figure 5. Cu–concentration profiles with respect to distance and time, emphasizing the position of α β phase boundary.
Processes 14 01603 g005
Figure 6. Temperature profile.
Processes 14 01603 g006
Figure 7. Cu–depth profiles, for varying dwell times.
Processes 14 01603 g007
Figure 8. Comparison of analytical model predictions (dashed lines) with experimental GDOES depth profiles (solid lines) for Cu concentration at varying dwell times ( t = 0 ,   10 ,   50 ,   and   100   min ).
Processes 14 01603 g008
Figure 9. Change in width (W) of the β -phase with respect to time (t). The asterisk (*) denotes the extinction time (t*), at which the β-phase is completely dissolved.
Processes 14 01603 g009
Figure 10. Cu–concentration profiles with respect to distance and time, emphasizing the position of α β phase boundary (left) and α –phase Cu–concentration profile (right).
Processes 14 01603 g010
Table 1. Chemical composition of the high residual 21Cu steel wire rod, used for desensitization.
Sample
ID
Elemental Composition (wt.%)
CMnPSSiCuNiCrMoN
21Cu0.6500.700 0.011 0.014 0.20 0.2100.07 0.13 0.017 0.008
Table 2. Experimentally obtained quantification values of sensitized zones, pre- and post-desensitization [4].
Parameter21Cu Desensitized21Cu Sensitized
Length (μm)2.67 ± 1.0223.75 ± 4.64
Width (μm)~0.9 ± 0.22.04 ± 0.58
Number of zones per unit length (#/mm)0.86 ± 0.407.65 ± 2.29
Disclaimer/Publisher’s Note: The statements, opinions and data contained in all publications are solely those of the individual author(s) and contributor(s) and not of MDPI and/or the editor(s). MDPI and/or the editor(s) disclaim responsibility for any injury to people or property resulting from any ideas, methods, instructions or products referred to in the content.