Review

Powder-Gas Jet Stream Characterisation Techniques in Laser Directed Energy Deposition: A Systematic Review

by
João Pedro Madeira Araujo
1,2,*,
Jhonattan Gutjahr
2,
Qingping Yang
1 and
Diane Mynors
1
1
Department of Mechanical and Aerospace Engineering, Brunel University London, Uxbridge UB8 3PH, UK
2
TWI Technology Centre, Wallis Way, Catcliffe, Rotherham S60 5TZ, UK
*
Author to whom correspondence should be addressed.
Processes 2025, 13(9), 2995; https://doi.org/10.3390/pr13092995
Submission received: 31 July 2025 / Revised: 12 September 2025 / Accepted: 17 September 2025 / Published: 19 September 2025

Abstract

This work presents a systematic literature review of powder-gas jet stream (PGJS) characterisation techniques for coaxial nozzles in the laser directed energy deposition process (L-DEDp). The analysis includes thirty-four camera-based and four weight-based techniques. In weight-based techniques, the mapping of powder concentration is made by measuring the powder flow rate in certain areas within the PGJS. Despite being cost-effective, these methods are time-consuming, invasive, and less suitable for real-time monitoring. Camera-based techniques use laser light and a camera to capture particle intensities, allowing for the non-intrusive measurement of powder distribution. Despite its advantage, limitations are reported in the literature regarding the techniques. Detecting dense or fine powder flows accurately is challenging. Two-dimensional images cannot fully represent the jet’s three-dimensional structure, relying on image processing algorithms for the results. However, the non-existence of a common standard metric for evaluating and comparing results across various setups is a significant gap, as each characterisation often needs to be performed on a case-by-case basis. To address these challenges, a basic reporting structure is suggested to enable a standardised assessment of PGJS measurements, thereby supporting process control and quality assurance in L-DEDp applications.

1. Introduction

The laser directed energy deposition process (L-DEDp) is a laser additive manufacturing (LAM) technology. In this process, a laser is used as a thermal source to melt fine metal powder as it is deposited into a metal substrate [1]. Layers are created by superimposing single tracks, which produce three-dimensional (3D) structures. The powder is injected into the laser spot through nozzles specifically designed to align the laser beam with the metal powder flow [2]. Depending on the design of the nozzle, both speed and direction of the powder flows change, affecting the stability of the process and the quality of the deposited layers [3]. The literature categorises the nozzles as either off-axis or coaxial based on the feed orientation relative to the laser beam, as illustrated in Figure 1.
According to Kumar [3], among the available arrangements, the continuous coaxial and discrete coaxial nozzle types (see Figure 1b,c) are the most used configurations, as they have the freedom to deposit the desired structure in any direction of movement of the substrate or processing head, making them suitable for producing and repairing 3D parts. In a continuous nozzle design (Figure 1b), the powder exits through a ring-shaped cavity, forming a hollow powder jet cone that encloses the laser beam. In contrast, a discrete nozzle design (Figure 1c) has multiple ejectors, or inlays, distributed around the nozzle to deliver the metal powder to the laser beam.
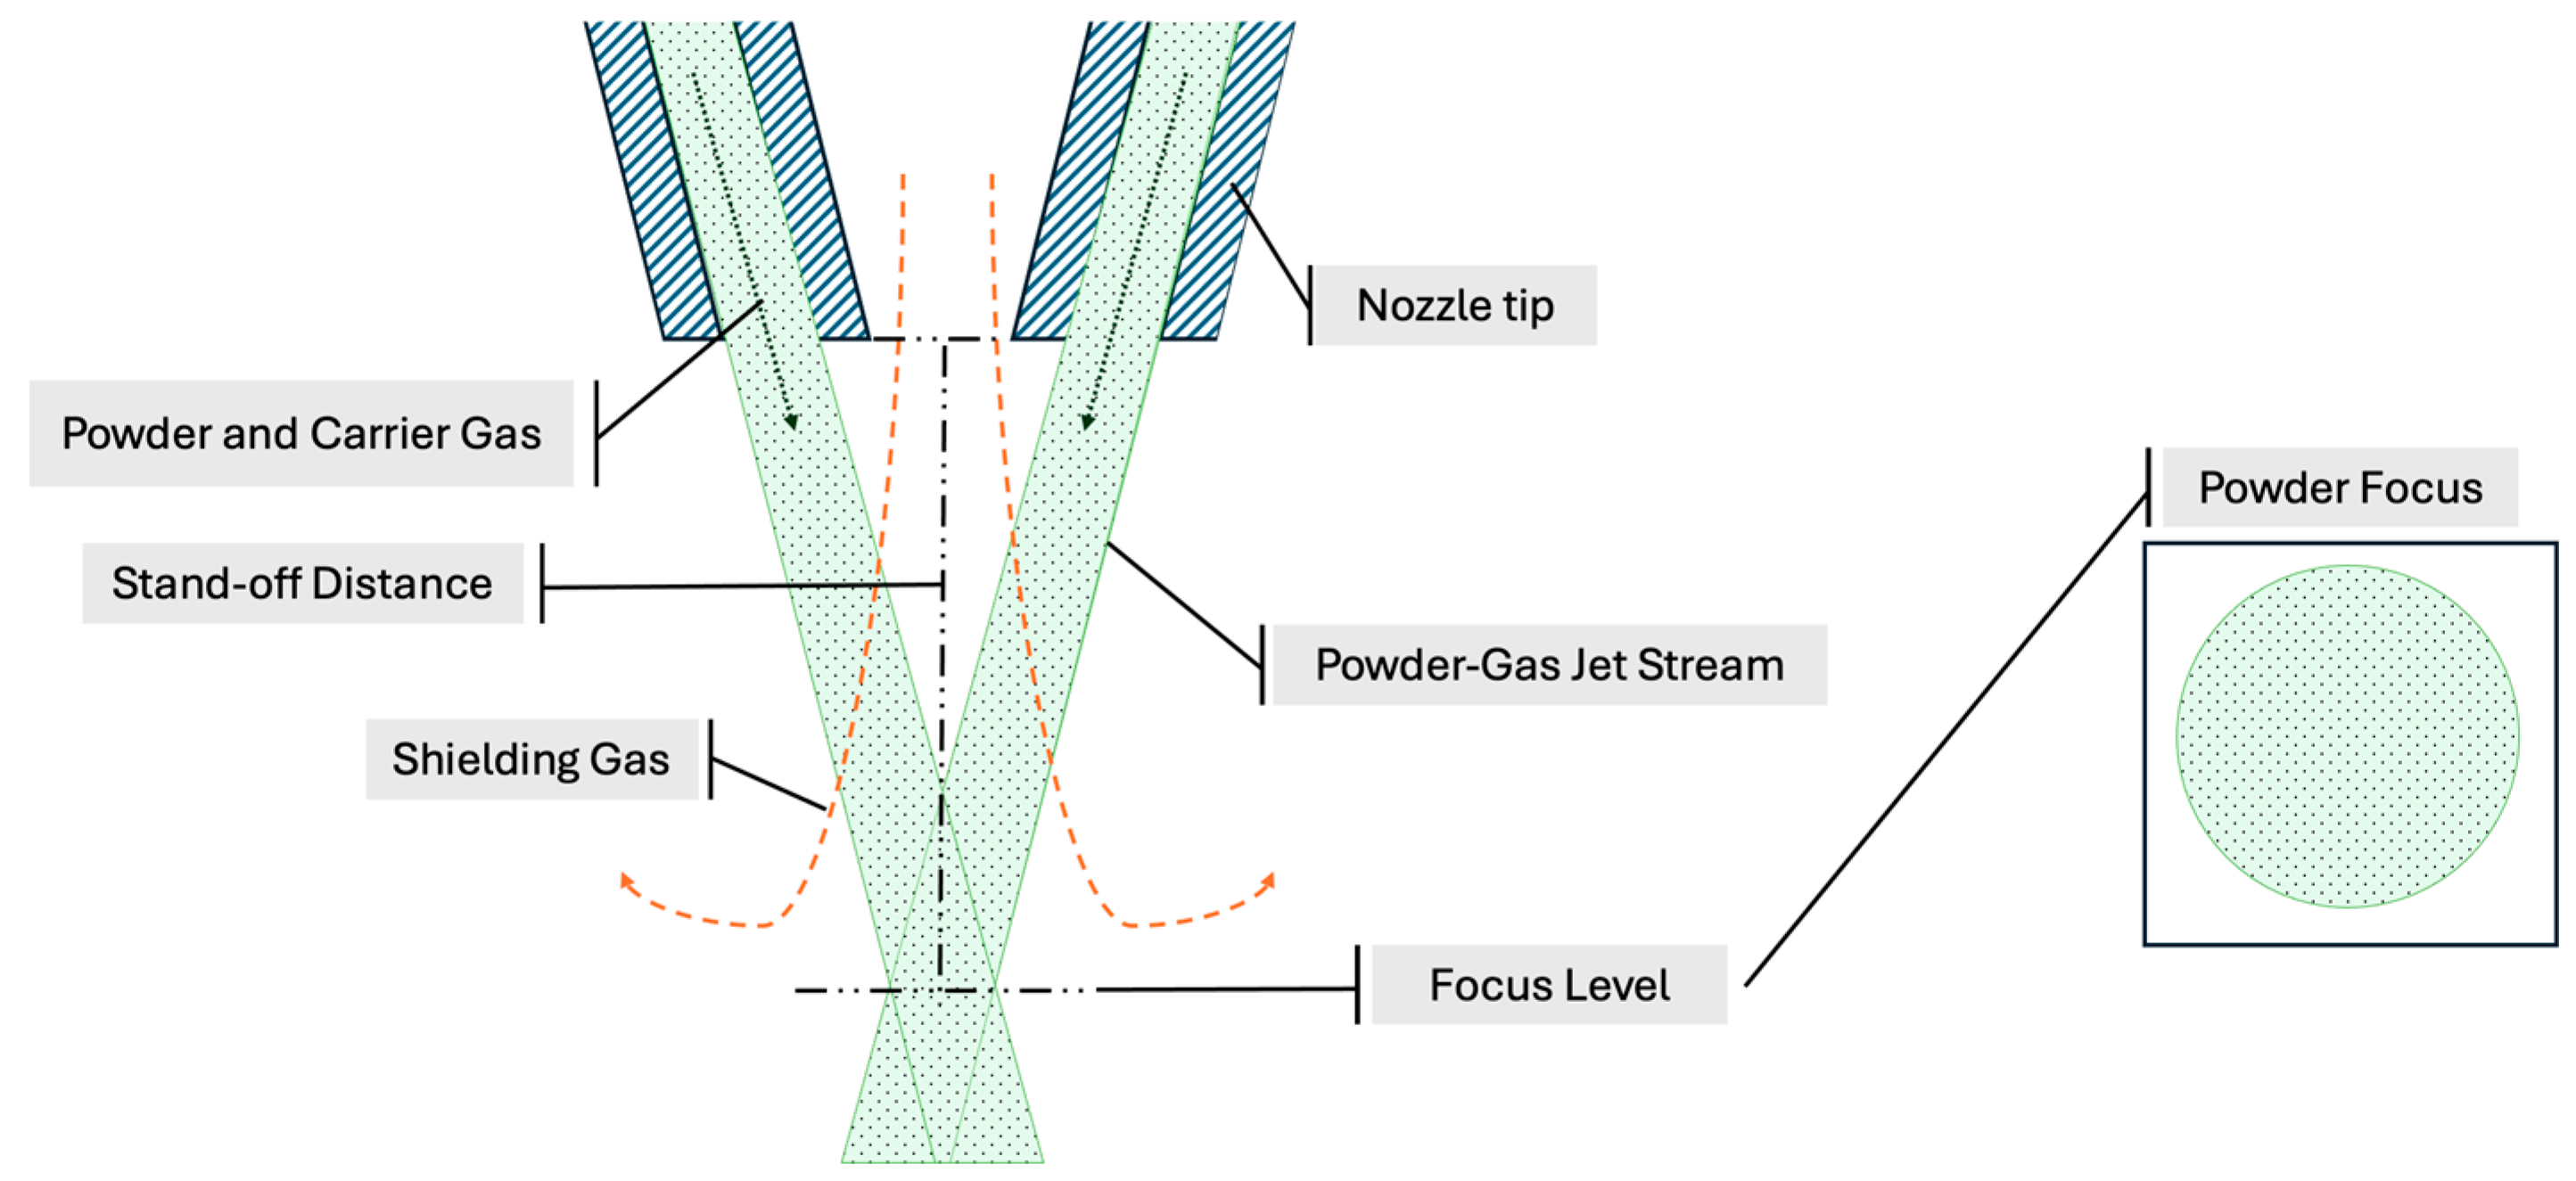
The powder is mixed with an inert gas, such as argon, inside the powder hopper before being sent to the nozzle. This gas flow acts as a carrier for the powder particles, dragging them through the pipes until they exit the nozzle tip [4]. Due to the conical geometry of coaxial nozzles, when the mixture of powder and gas leaves the tip, it creates a tapered powder jet that follows a convergent trajectory until it reaches a focal point. The focus of the nozzle is formed at a certain distance from the tip, known as the ‘stand-off distance’ (SOD), and is estimated during the nozzle production. This powder jet, also called the powder-gas jet stream (PGJS) [5], is a key element of L-DEDp, and it is responsible for introducing the powder metal into the interaction zone with the laser beam, impacting the process’s quality and stability [6].
Adding shielding gas (SG) at the centre of the nozzle helps prevent oxidation of the workpiece during the deposition and protects the optical system of the processing head from possible damage caused by ricocheting heated metal particles [6]. The flow of SG can also change the PGJS’s behaviour by creating turbulence beneath the nozzle, which alters the particles’ velocity. A schematic of the PGJS is provided in Figure 2.
Variations in the powder feeding parameters, including the nozzle type and geometry [7,8], carrier gas (CG) and SG [9,10], powder type and powder mass flow (PMF) [11], affect the geometric characteristics of the PGJS by changing the powder focus’s diameter and location (see Figure 2: stand-off distance), the powder jet symmetry, and the powder distribution along the PGJS. Currently, measurements are performed by monitoring the particles along the jet laterally and coaxially using camera-based devices to observe and calculate the parameters’ effects on the PGJS’s characteristics [6,10]. However, despite the established methodologies, no benchmarks were found in the available literature that compare those measurement techniques and analyse the generated powder jet to characterise and qualify the PGJS based on the process parameters, creating solutions that can be easily transferred from one machine or nozzle to another.
This systematic literature review focuses on the experimental characterisation methods used to measure the geometric properties of PGJS in L-DEDp. To investigate the state of the art, an initial database query was conducted to identify publications discussing powder and gas flow behaviour in laser deposition processes. Subsequently, a series of targeted filters were applied to gradually refine the focus towards studies that specifically investigate the experimental measurement techniques for analysing PGJS characteristics. The review concentrates on works that employ camera-based systems, both lateral and coaxial, as the primary tool for analysing powder jet geometry in coaxial nozzles.
The primary objective of this review is to critically analyse the available experimental methodologies for PGJS characterisation, with a focus on identifying their strengths, limitations, and applicability. By consolidating this knowledge, the review aims to support the future development of standardised measurement protocols, thereby contributing to the advancement and maturity of L-DEDp technology, both in scientific understanding and industrial implementation.

2. Methodology

The structure involves selecting databases, constructing search strings, and filtering to extract the final subset of reports. The included studies were limited to articles and conference papers, assessed by the authors based on the completeness of experimental details. Specifically, it was recorded whether the authors provided (i) a clear description of the setup and (ii) details regarding calibration or validation of measurements. Studies with insufficient methodological detail were not excluded, but this was noted during synthesis.
The following criteria and methodological considerations guided the review process and are summarised below:
  • This review was not preregistered, which may introduce selection bias. To mitigate this, the search strategy, inclusion and exclusion criteria, and screening procedures were applied systematically and transparently described in this section.
  • The literature search was conducted exclusively in the Scopus database, potentially limiting the inclusion of relevant studies indexed elsewhere.
  • Publications in English were included, while grey literature and non-peer-reviewed sources were excluded.
  • Additionally, studies based solely on numerical simulations were omitted unless experimental validation constituted a primary component.
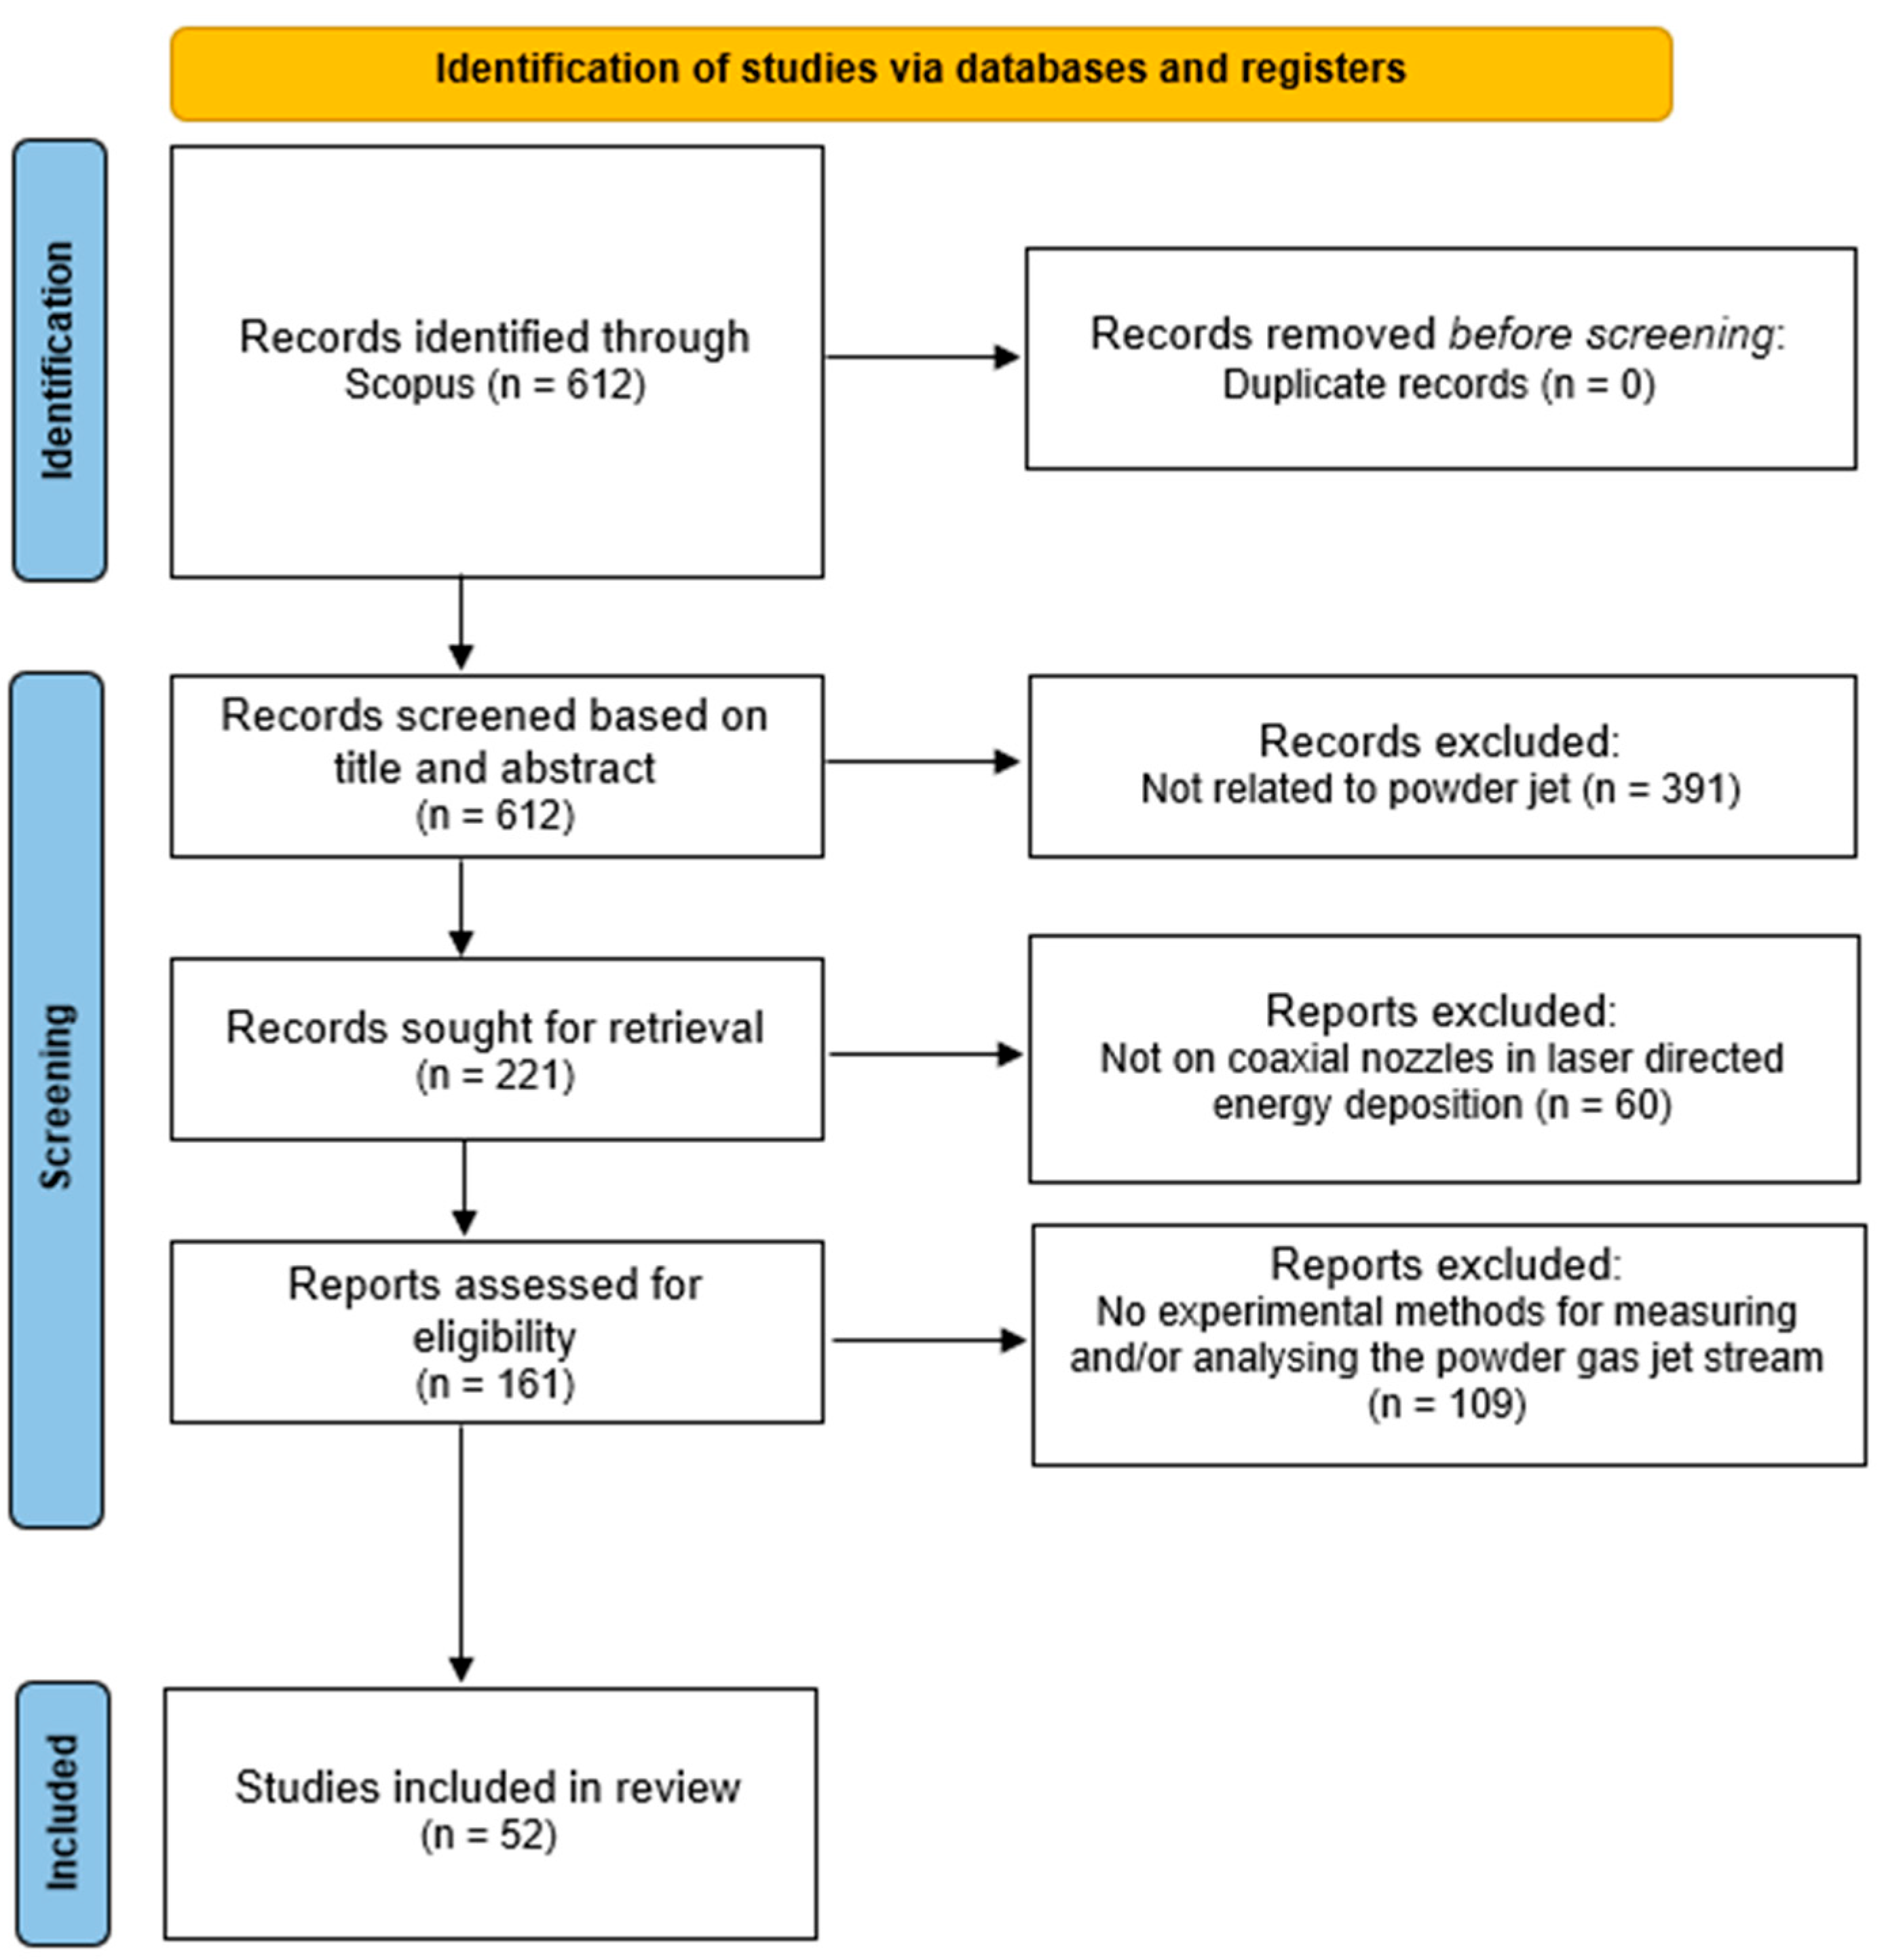
The selection process, represented in a PRISMA-style flow diagram in Figure 3, provides a visual summary of the methodology.
The systematic literature review began with an extensive search for papers on laser-based additive manufacturing processes related to gas and powder flow published in the last 20 years. The Scopus database was used to perform the search, with the following string: (TITLE-ABS-KEY((laser W/5 direct W/5 deposit)) OR TITLE-ABS-KEY((laser W/5 metal W/5 deposit)) OR TITLE-ABS-KEY((laser W/5 clad)) OR TITLE-ABS-KEY(laser W/5 material W/5 deposit) OR TITLE-ABS-KEY(laser W/5 engineer W/5 shape)) AND TITLE-ABS-KEY(flow W/5 (gas OR powder))) AND PUBYEAR > 2004 AND PUBYEAR < 2026 AND (LIMIT-TO(DOCTYPE, “ar”) OR LIMIT-TO(DOCTYPE, “cp”)) AND (LIMIT-TO(LANGUAGE, “English”))*, which resulted in a set of 612 documents. The search was performed on 13 June 2025.
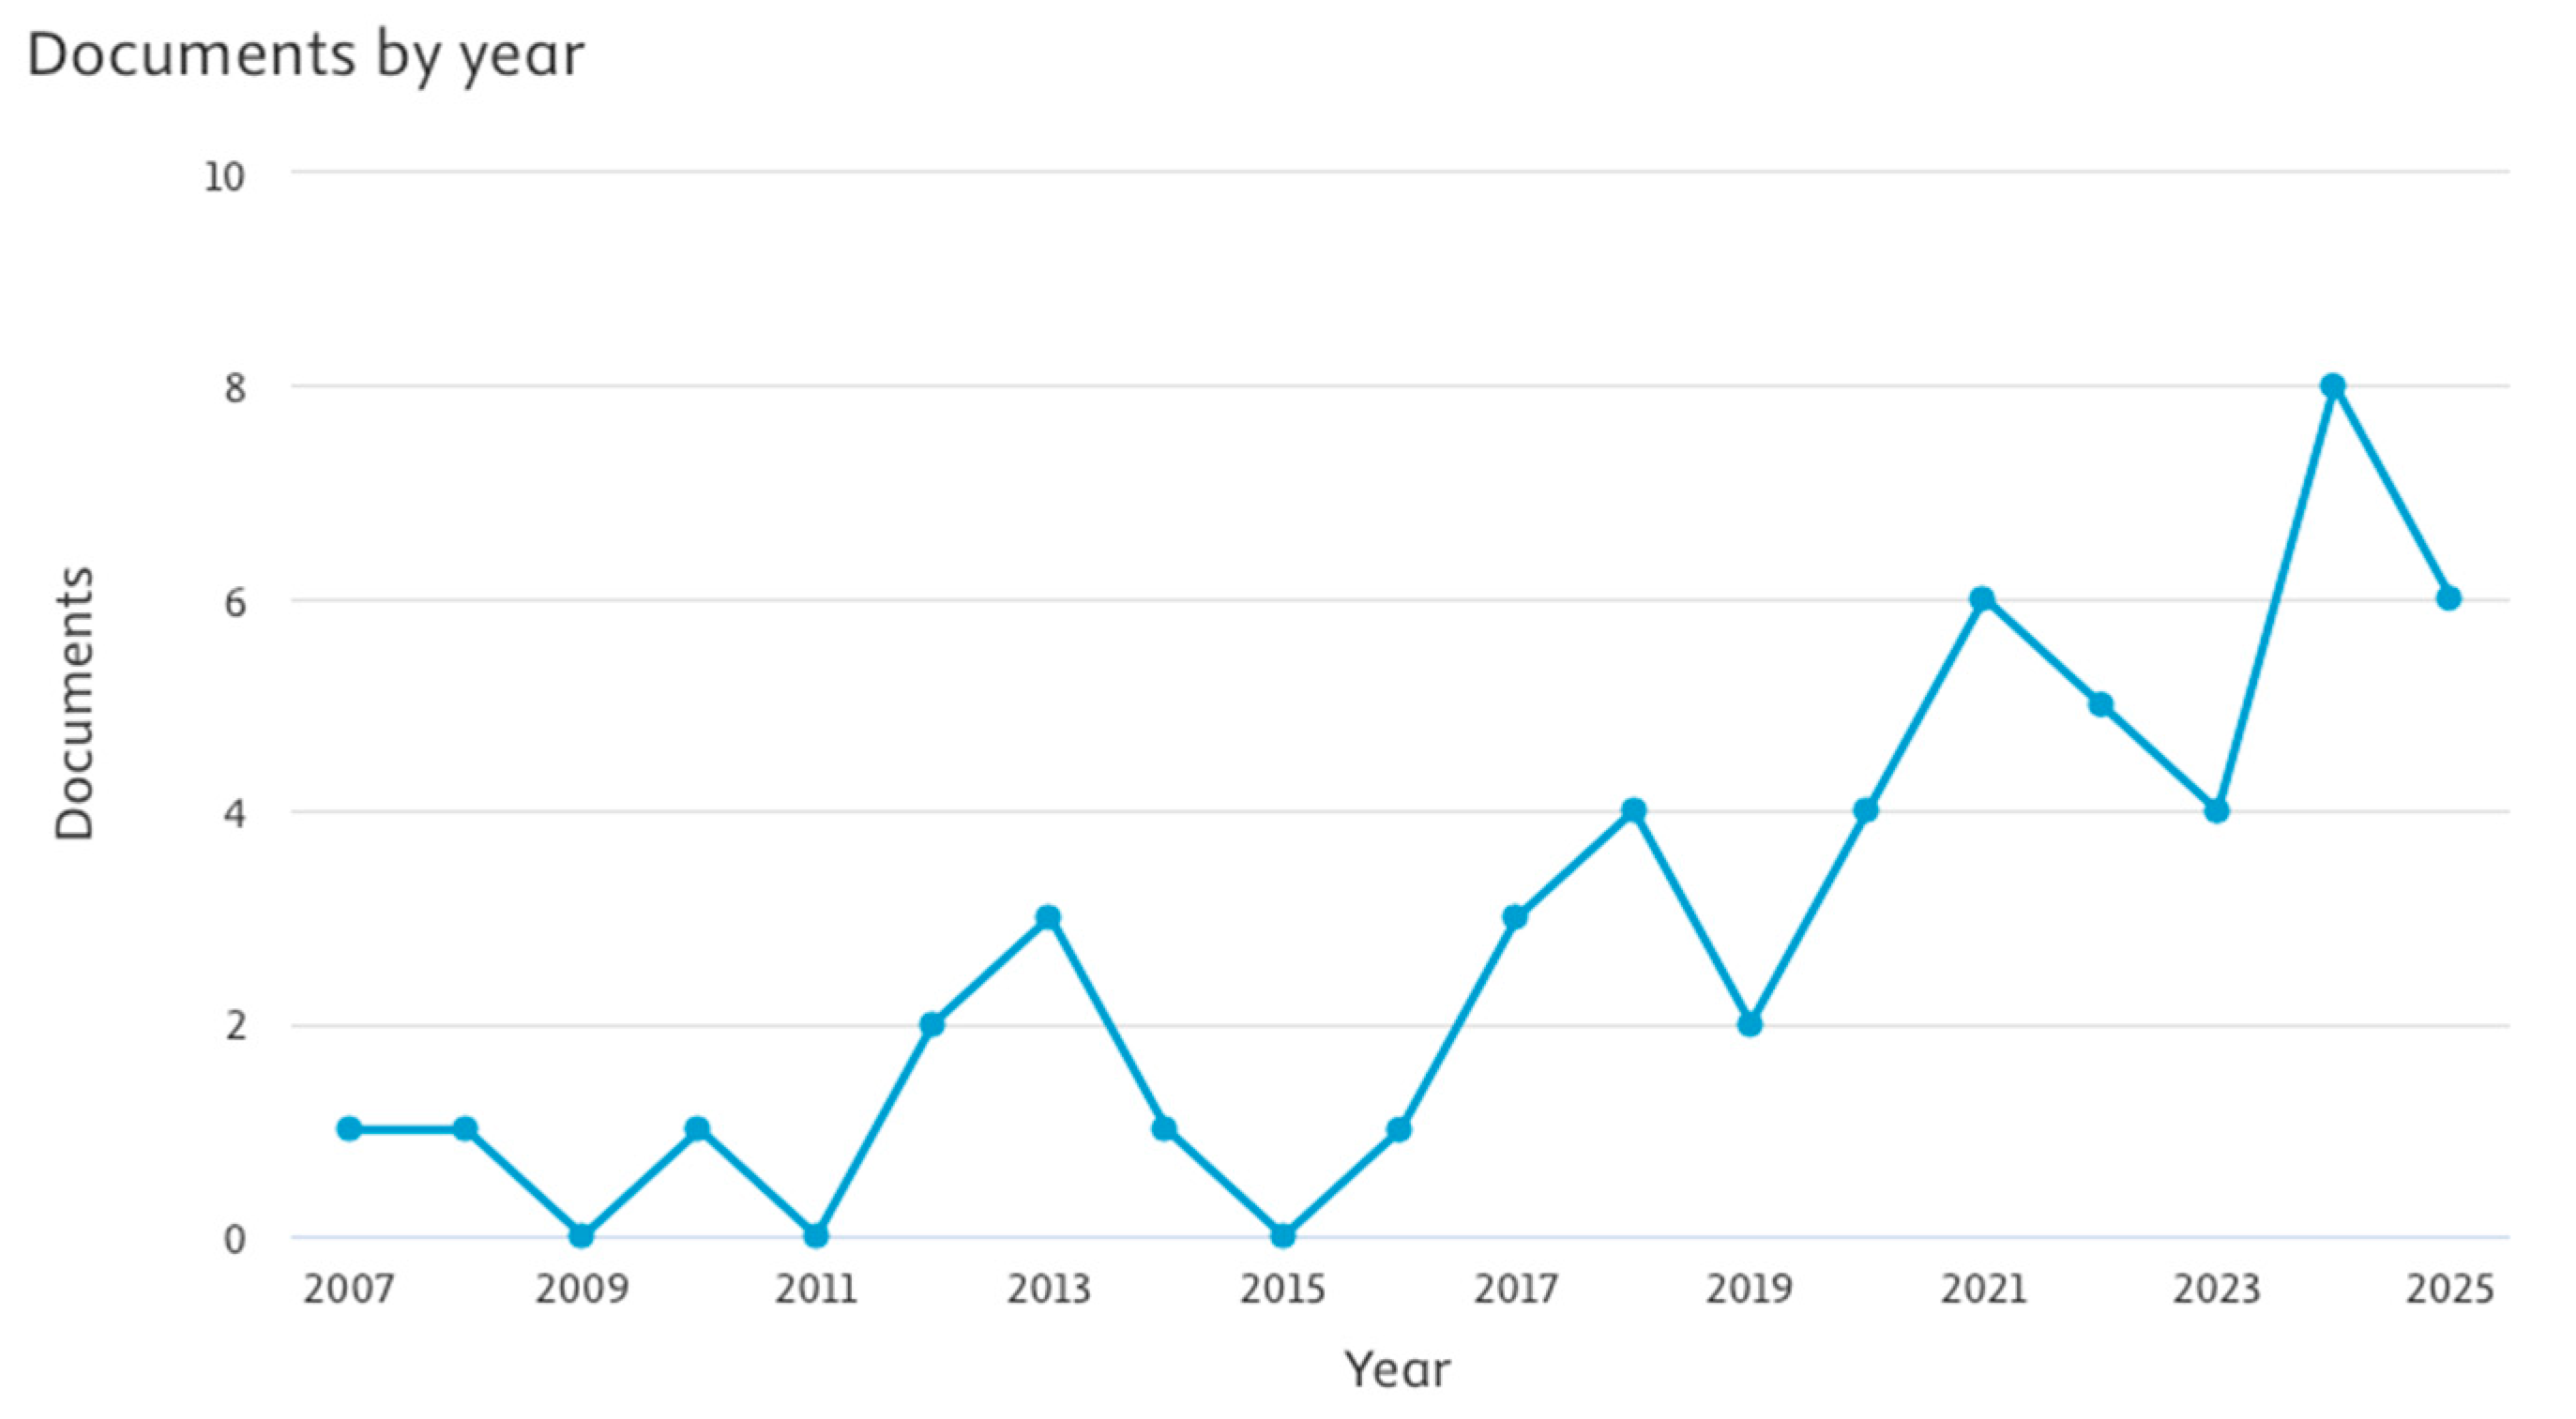
After that, a filtering process was then applied to refine the results, focusing on publications that addressed specifically the effects of process parameters on the characteristics of the flow of gases, including numerical modelling, simulation, and experimental investigation. After this step, 221 documents remained. Figure 4 illustrates the increasing number of publications per year within this refined set, emphasising the growing importance of research on powder jet exploration.
From this subset, a second filter was applied to exclude papers involving the use of lateral nozzles or processes which are not L-DEDp, as these are beyond the objective of this work, resulting in 161 studies that investigate the influence of process parameters on PGJS characteristics, specifically for coaxial nozzles used in L-DEDp.
A third filter was applied to remove purely theoretical or numerical studies, including works that employed experimental setups only for validation. The publications retained at this stage are those that experimentally explored the effects of process parameters on the characteristics of the PGJS, aligning with the focus of this review. This left 52 papers for detailed consideration. Within this group, two primary types of experimental validation emerged in the literature for measuring PGJS characteristics: optical and weight-based methods.
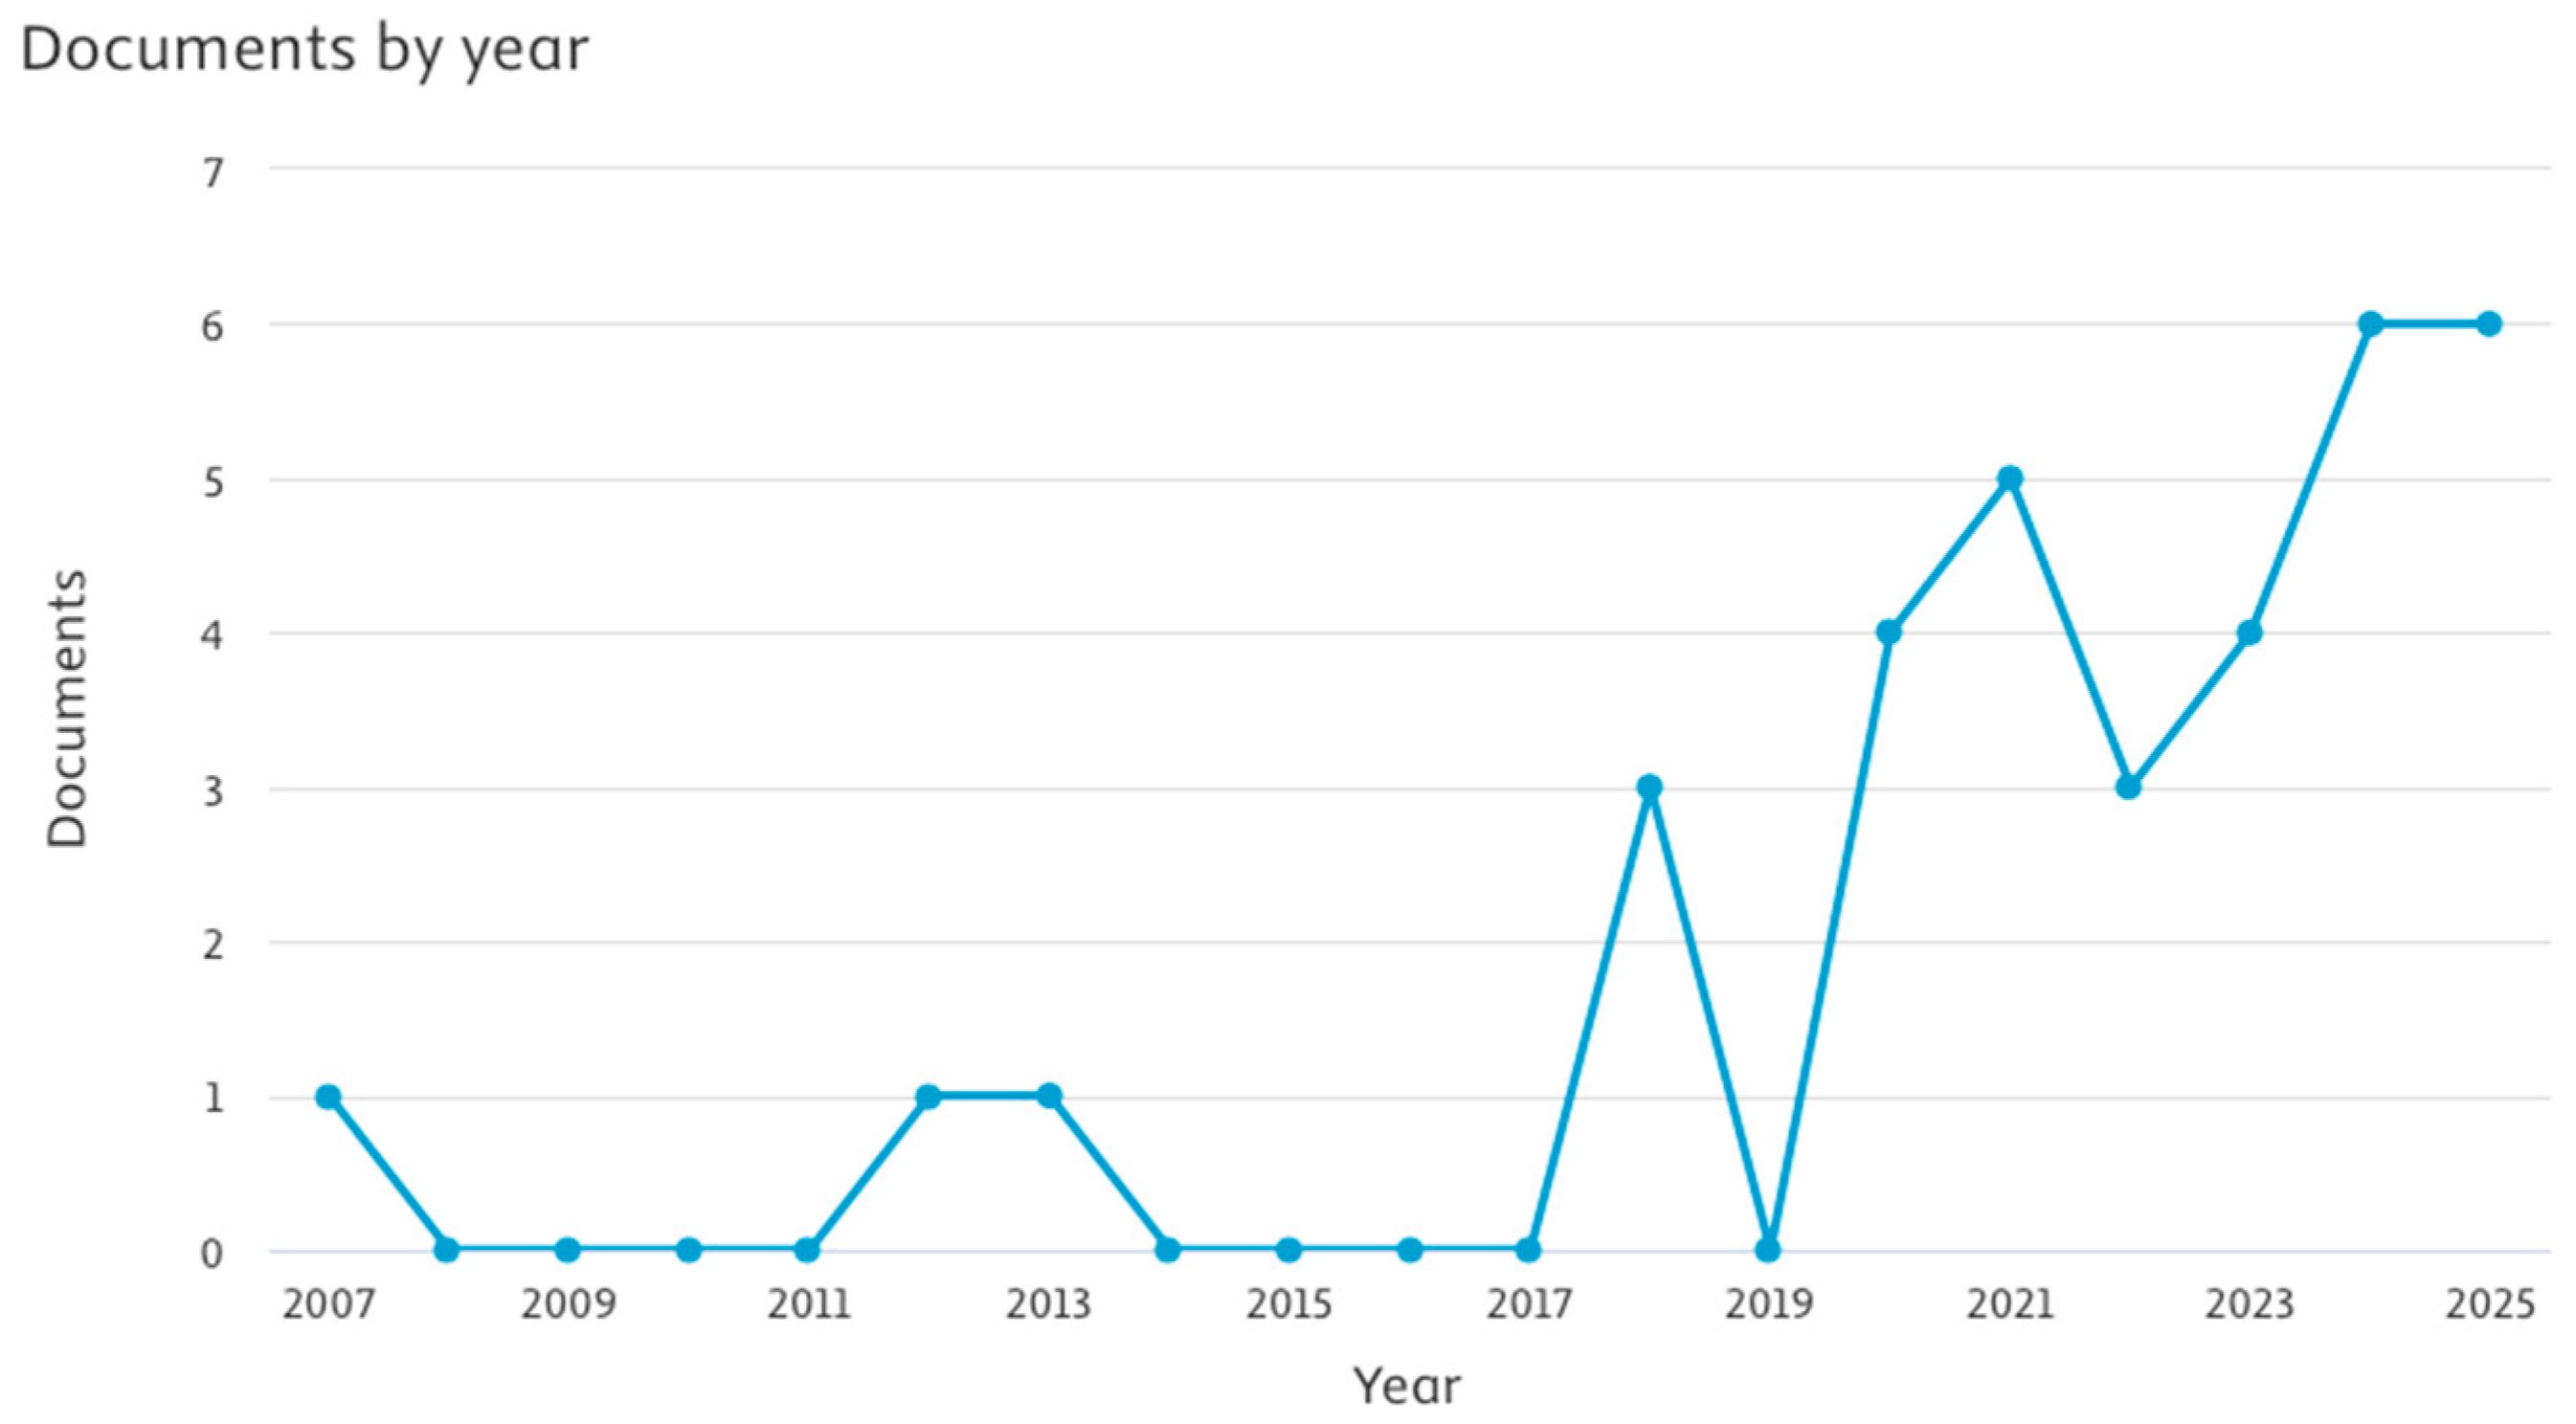
The final subset was selected based on studies that used camera-based systems as the primary experimental method for PGJS characterisation, including 34 reports. Figure 5 shows the number of such publications per year, demonstrating a noticeable increase in research on this topic over the past five years, highlighting the relevance of this topic. This selection criterion ensured a focus on image-based diagnostic techniques, including backlight, vertical and horizontal illumination, as well as lateral and coaxial camera setups, which are explored in detail in the following sections.

3. Experimental Characterisation Techniques

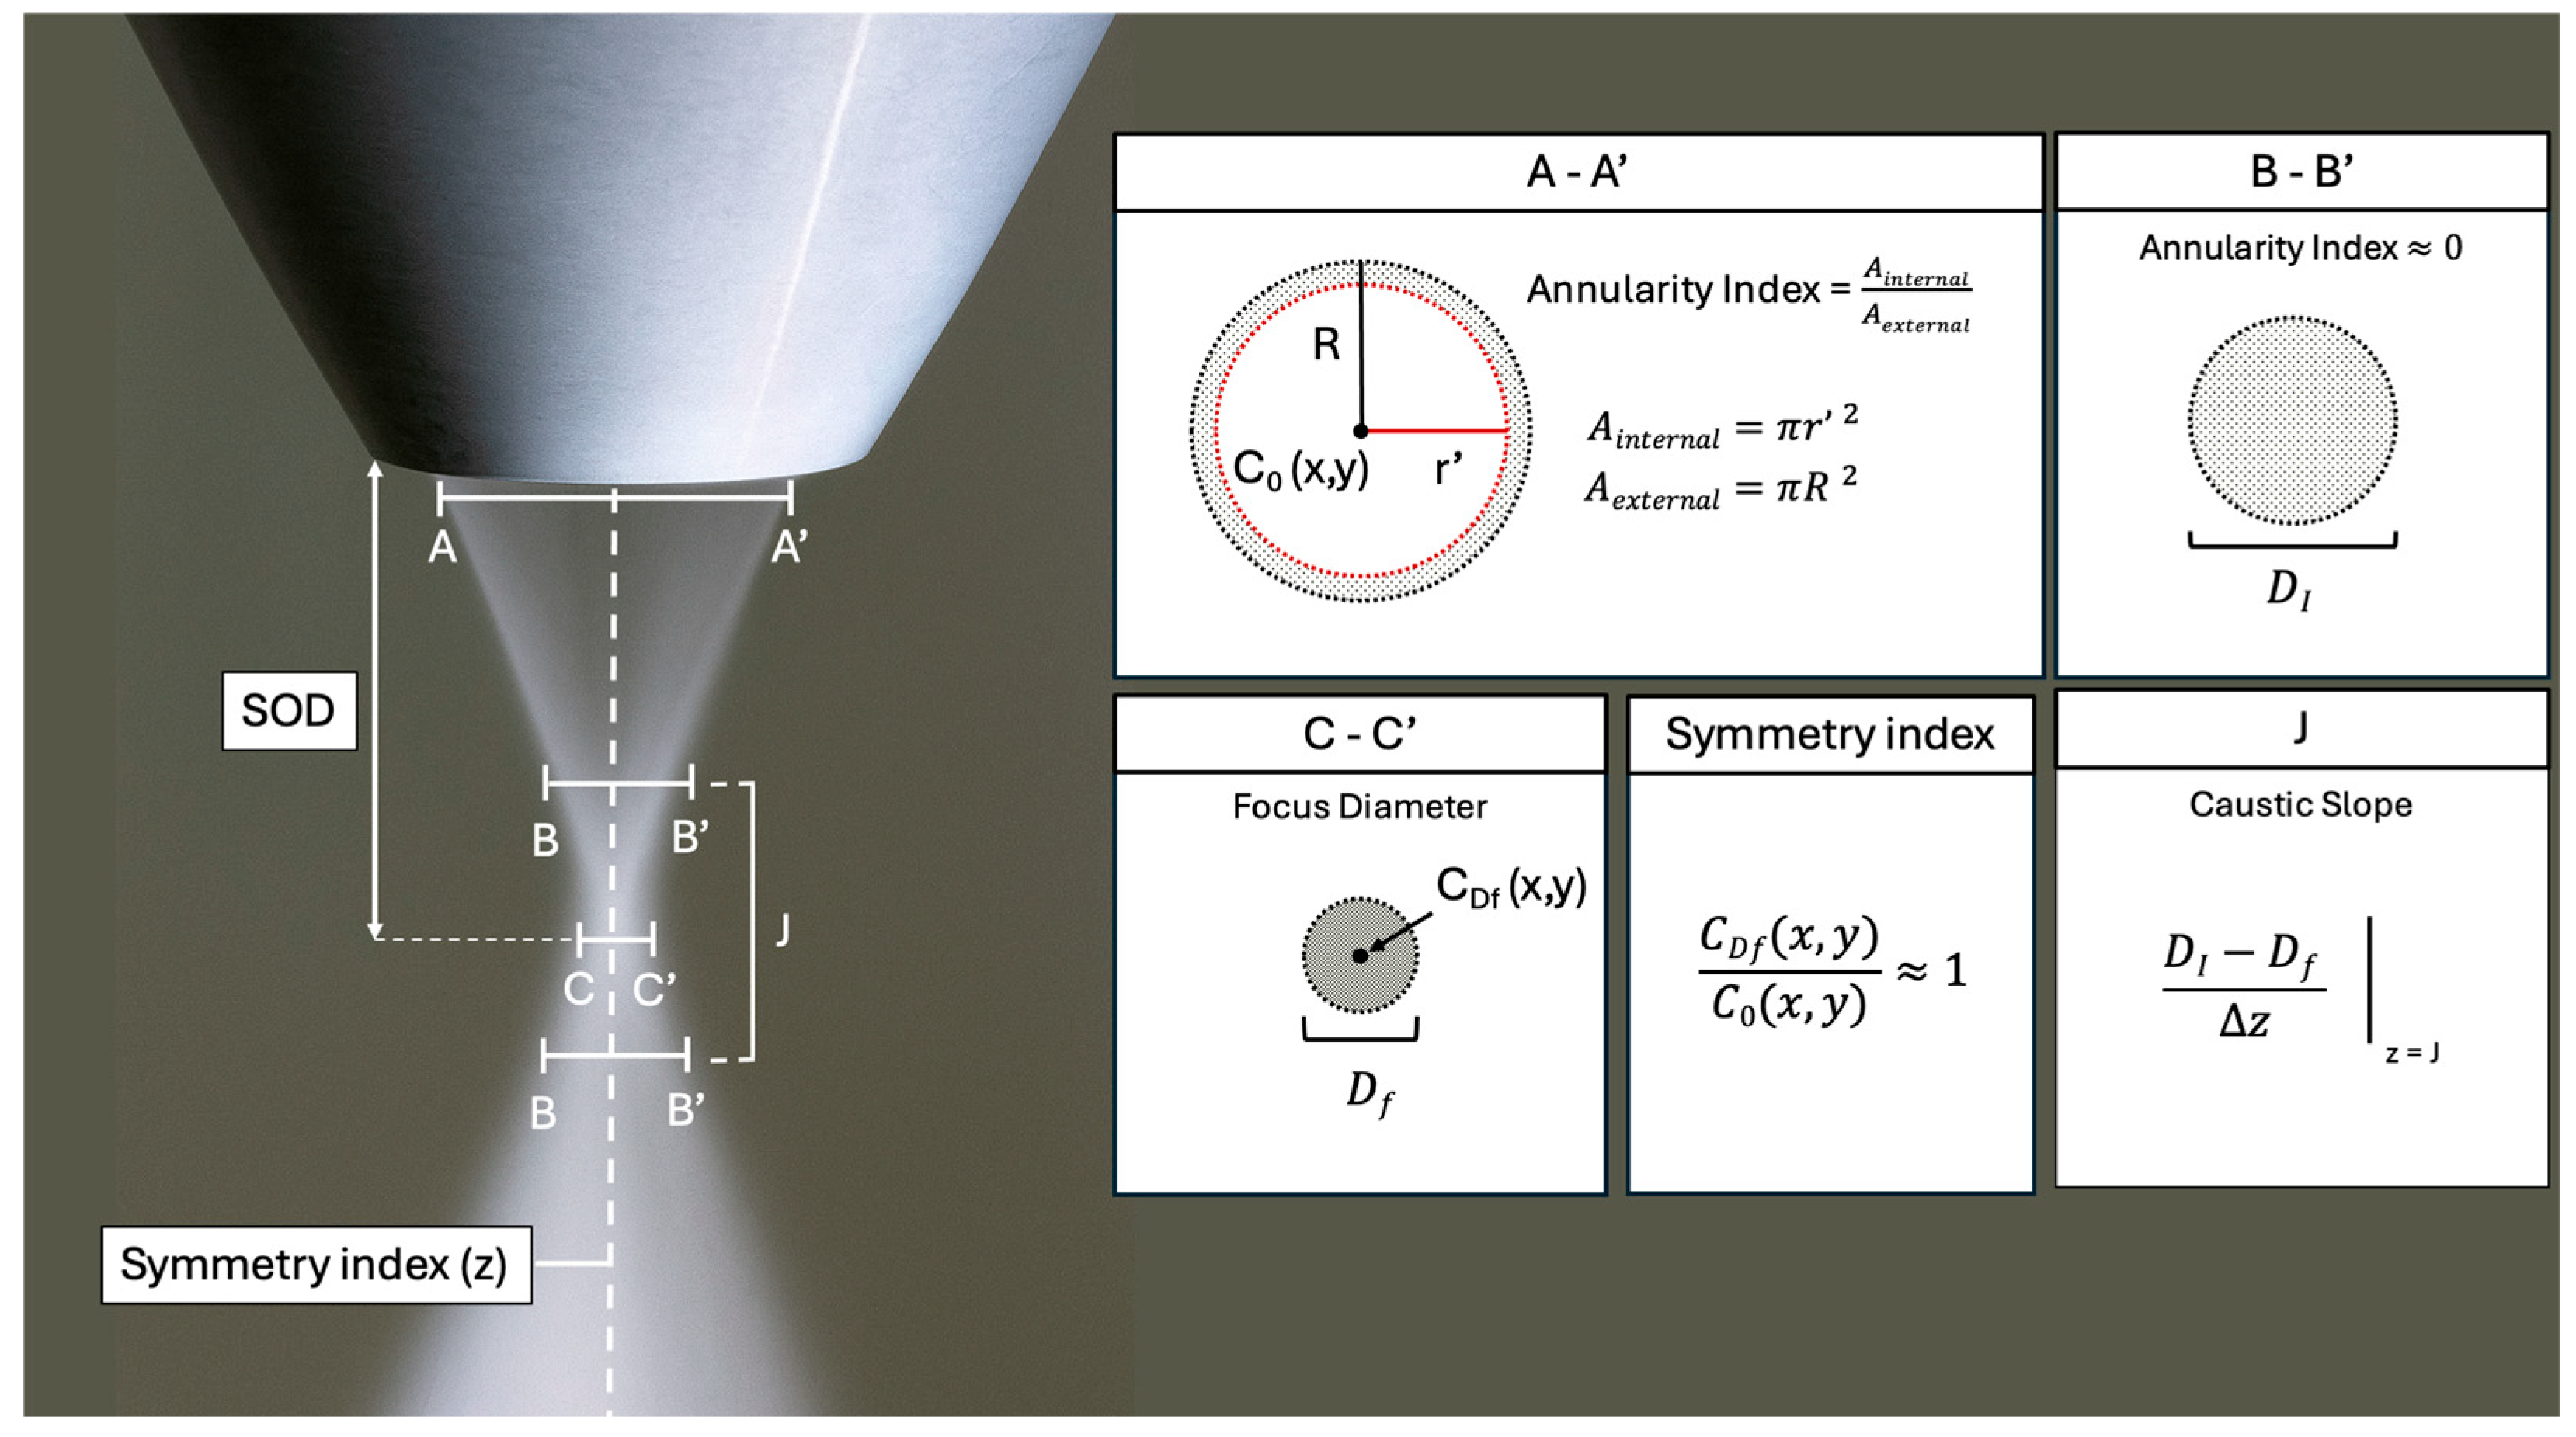
The characteristics of PGJS have been described in the literature using different terminologies and definitions. To ensure clarity and consistency throughout this paper, the following standardised definitions are used, drawing on analogies with optical beam characterisation standards such as ISO 11146 (formerly ASTM E1465) [12], which define beam widths, caustics, and waist location. As illustrated in Figure 6, the focus diameter (Df) is defined as the cross-section with smaller diameter and higher particle concentration within the PGJS, and may be interpreted either as a second-moment diameter (analogous to the D4σ width in ISO 11146) or as a percent-enclosed diameter (e.g., D86 or 1/e2), depending on the measurement method. The SOD represents the axial position where the Df is found, corresponding to the waist location in beam profiling. The annularity index describes the ratio between the external and internal areas of the PGJS cross section, with the axial position where this index approaches zero denoting the intersection zone, analogous to the collapse of annular beam modes. The caustic slope [(DI − Df)/Δz] quantifies the rate of change of jet width with distance around the focus, similar to beam divergence determined from optical caustics; large values indicate rapid convergence and divergence, while small values indicate gradual variation. Finally, the symmetry index represents the ratio between the centroid of the PGJS near the nozzle and at the Df, quantifying offset in a manner comparable to centroid stability and pointing accuracy in laser beam profiling.
In the literature, two main categories are explored for the experimental characterisation of PGJS: weight-based and camera-based methods. In weight-based techniques, a scale coupled with a powder collection device is used to capture the powder particles positioned at specific locations beneath the nozzle. This setup enables the determination of the spatial powder distribution along the jet by measuring the PMF. Camera-based techniques, on the other hand, employ an illumination source to illuminate the powder particles, while a camera captures the frames. These images are analysed via image processing algorithms to assess the powder density distribution within the PGJS and determine the characteristics of the PGJS.
The following subsections discuss specific methodologies and their applicability in different experimental setups.

3.1. Weight-Based Methods

These methods assess the spatial distribution of particles on the PGJS by measuring the mass of powder delivered on the zones of the powder jet with a scale. It is found in the literature that there are three different weight-based approaches, differing in the strategy to trap the particles of the PGJS, as shown on Table 1.
A common procedure reported across all studies, before performing the measurement, involves the calibration of the powder feeder to ensure accurate and stable delivery of powder to the nozzle. The control of PMF (or powder feed rate) is often linked to the rotation speed (RPM) of a metering disc within the powder feeder. The calibration procedure reported by Liu [15] and Tabernero [16] consists of measuring the total mass of powder injected over a specific period (e.g., 1 min) at various disc rotation speeds. Consequently, the PMF is calculated as a function of RPM, as shown in Figure 7. The results indicate a significant linear correlation between PMF and the disc rotation speed, ensuring the accurate reflection of the injected mass by the programmed powder mass and facilitating the measurement setup.
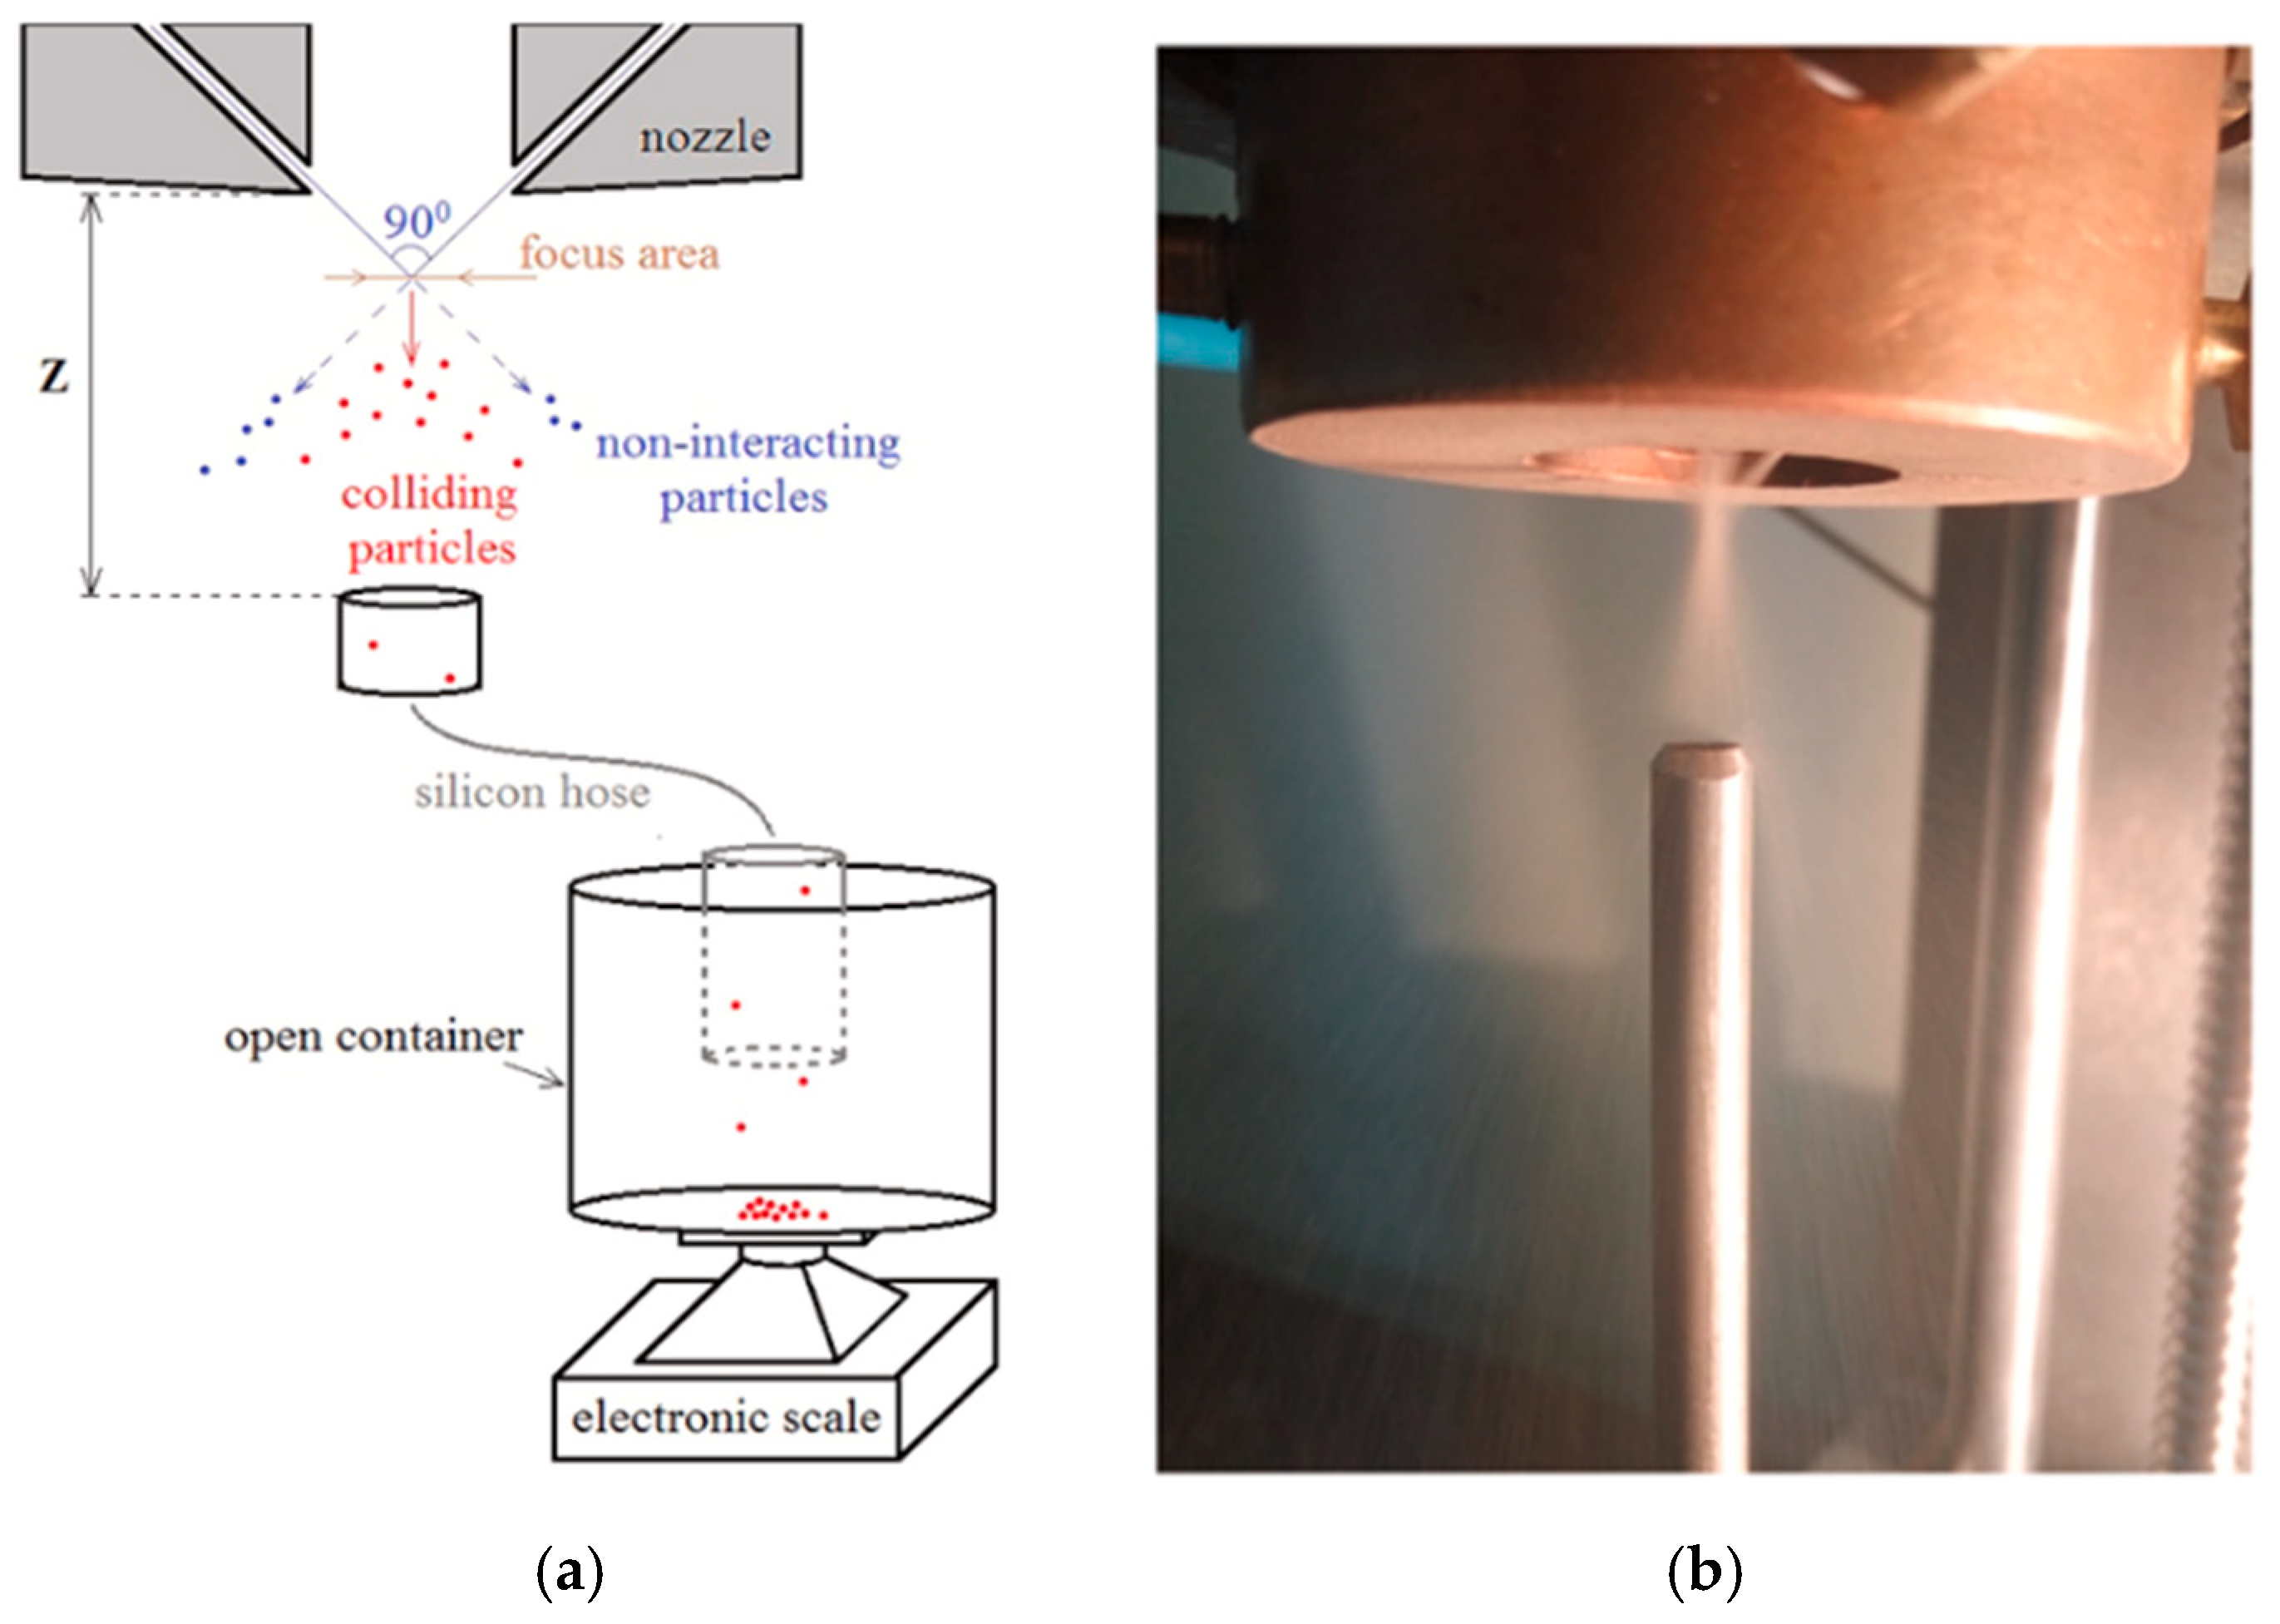
The approach reported by Bedenko [13] involves trapping powder with a sharp-edged tube connected to an open container via a flexible hose, as illustrated in Figure 8. The tube is centrally aligned with the nozzle exit and remains stationary for a set time (e.g., 1 min) before being shifted along the z-axis to measure at different distances. The evaluation of the influence of process parameters on particle collisions and their effect on the PGJS shape is conducted by moving the tube along the z-axis within the PGJS zone and measuring the amount of powder captured at each plane.
The method is a simple and cost-effective approach for measuring powder flux at specific planes; however, inserting an intrusive collection device into the flow of particles disrupts the particles’ natural movement, which can lead to inaccurate or unrepresentative data. In addition, it lacks spatial and temporal resolution, as it measures the PGJS in discrete points at specific intervals, rather than providing a continuous profile of the particle distribution across a given area at a certain time.
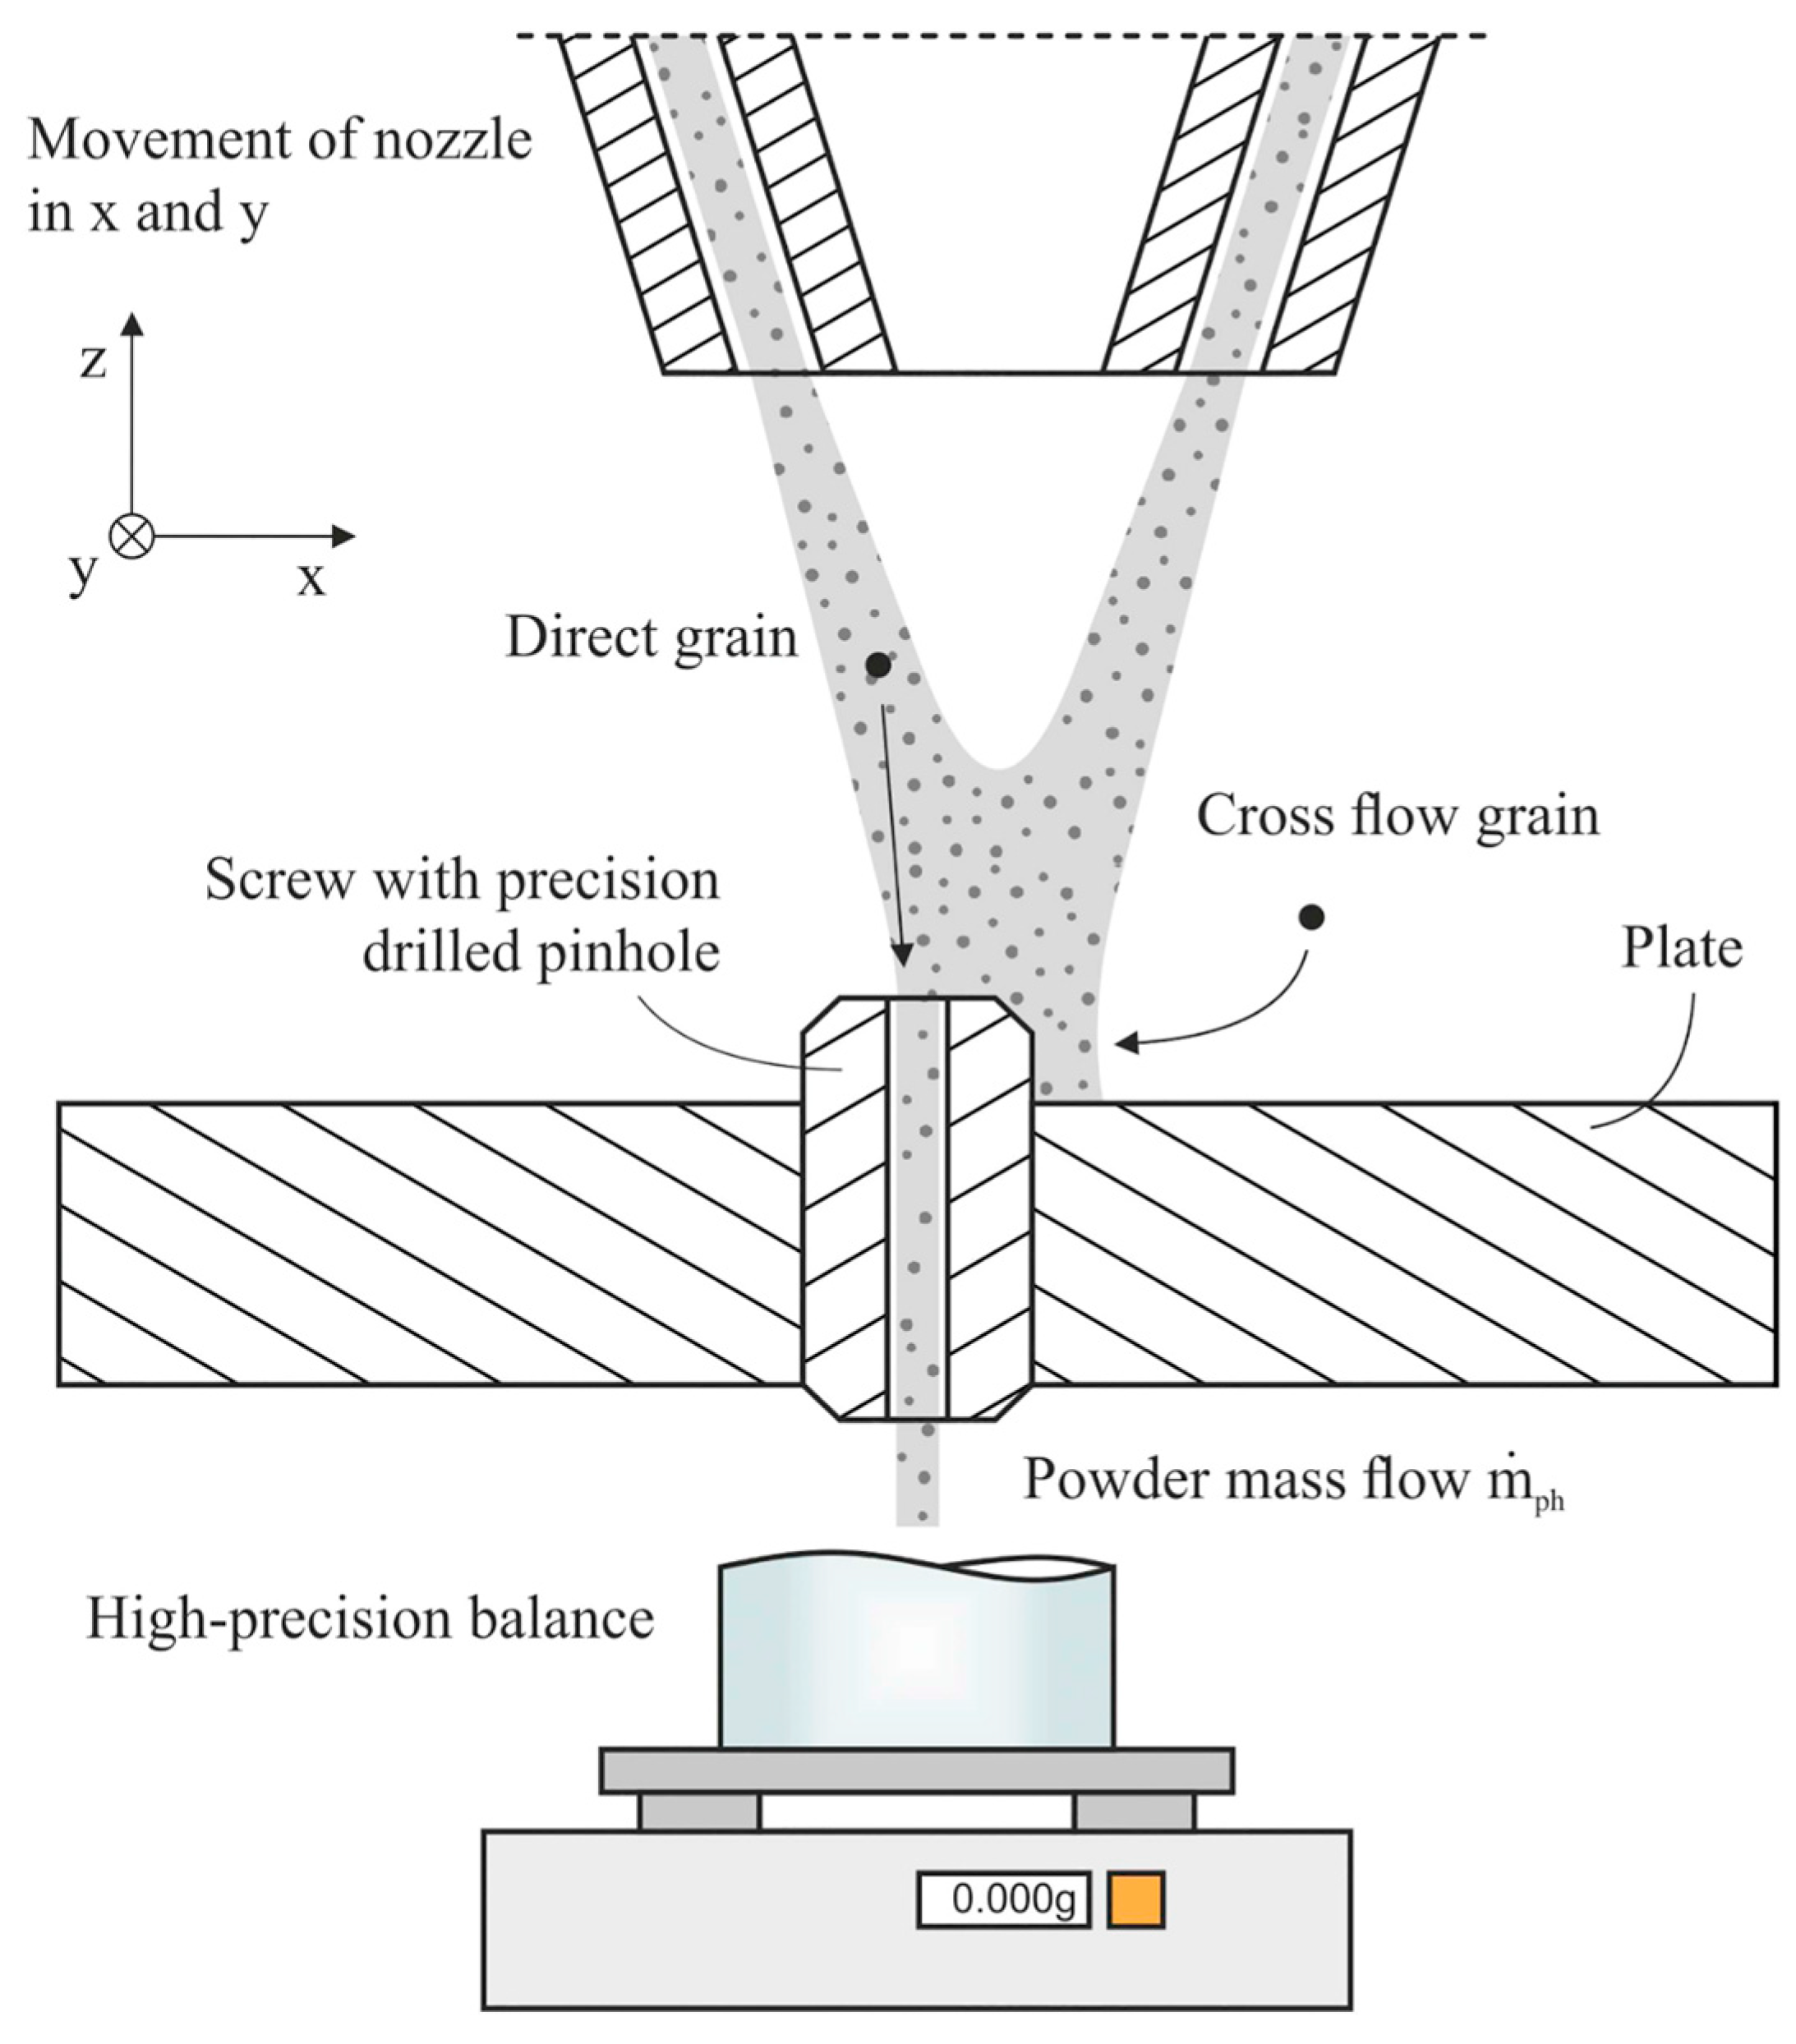
Another solution explored by Eisenbarth [14] relies on the use of a plate with a pinhole to collect the particles. In this technique, the plate acts as a substrate, simulating the real condition of deposition, deflecting both powder and gas flow. During the measurement, the processing head is moved above the pinhole, resulting in a portion of PGJS passing through, as shown in Figure 9. The spatial distribution of the powder jet can be constructed by measuring multiple lateral offsets in different axial distances.
This method offers the advantage of measuring the PGJS in the real condition of movement during the deposition. However, it relies on a time-consuming and position-dependent sampling to measure the characteristics of the powder jet. For the measurement, it is necessary to move the processing head numerous times around the pinhole to capture data from different angles and positions for a comprehensive analysis. This can lead to increased complexity in data collection and potential variability in results due to changes in environmental conditions or equipment alignment issues.
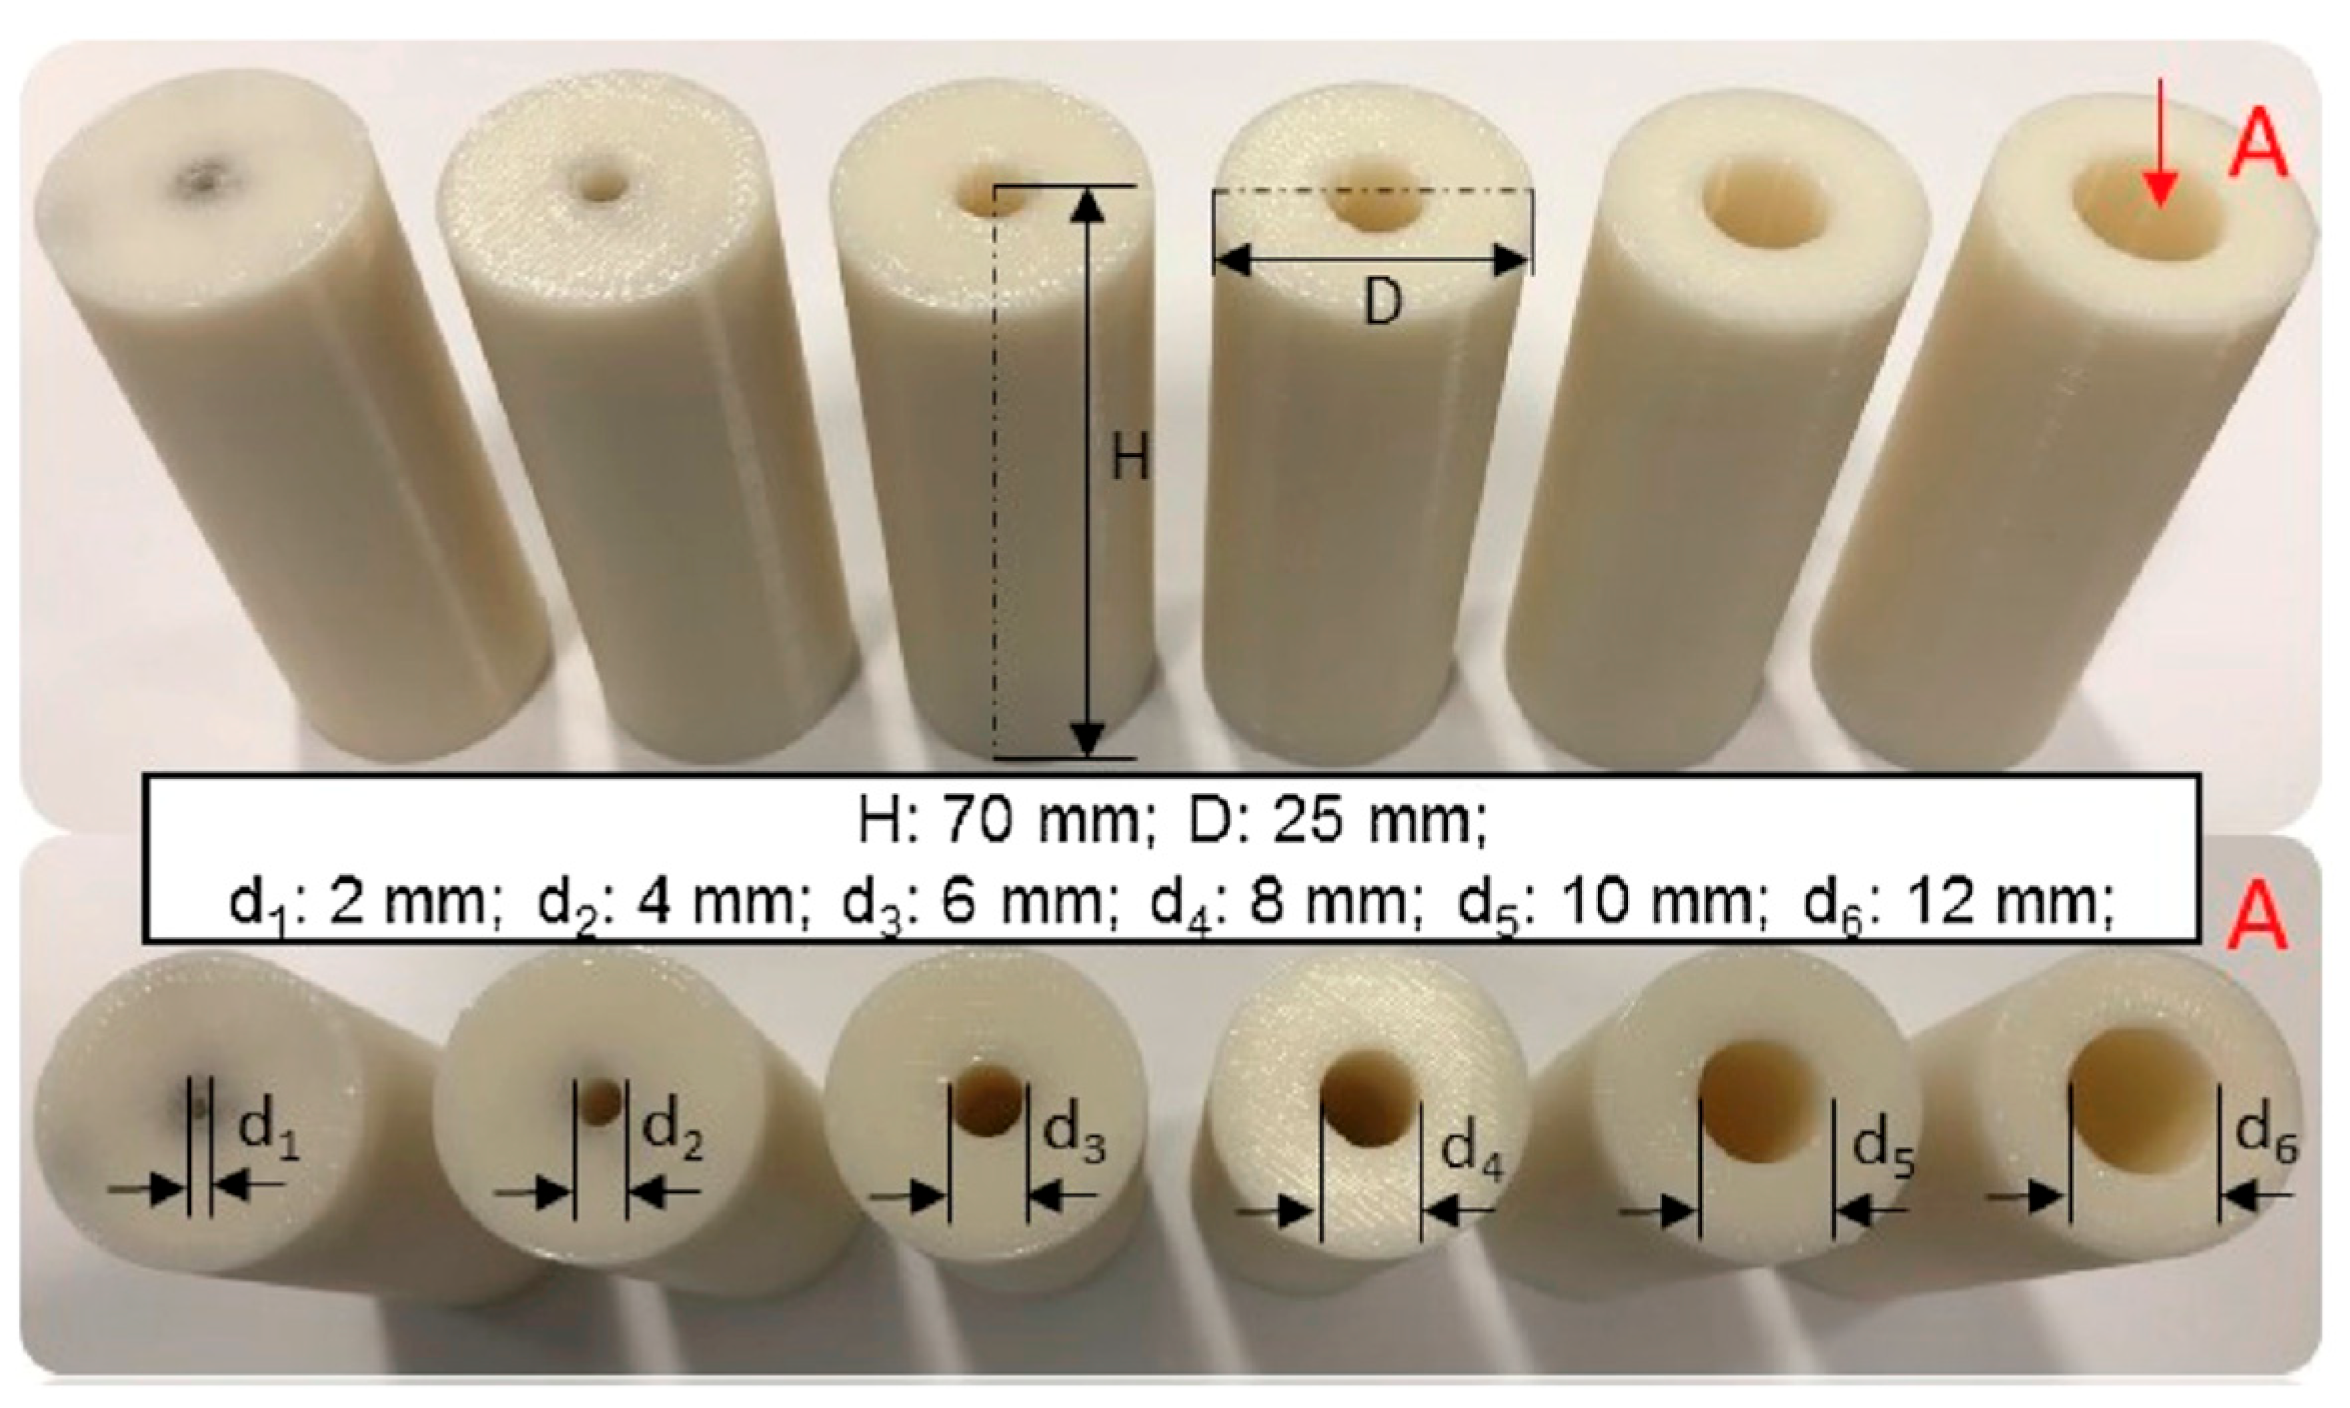
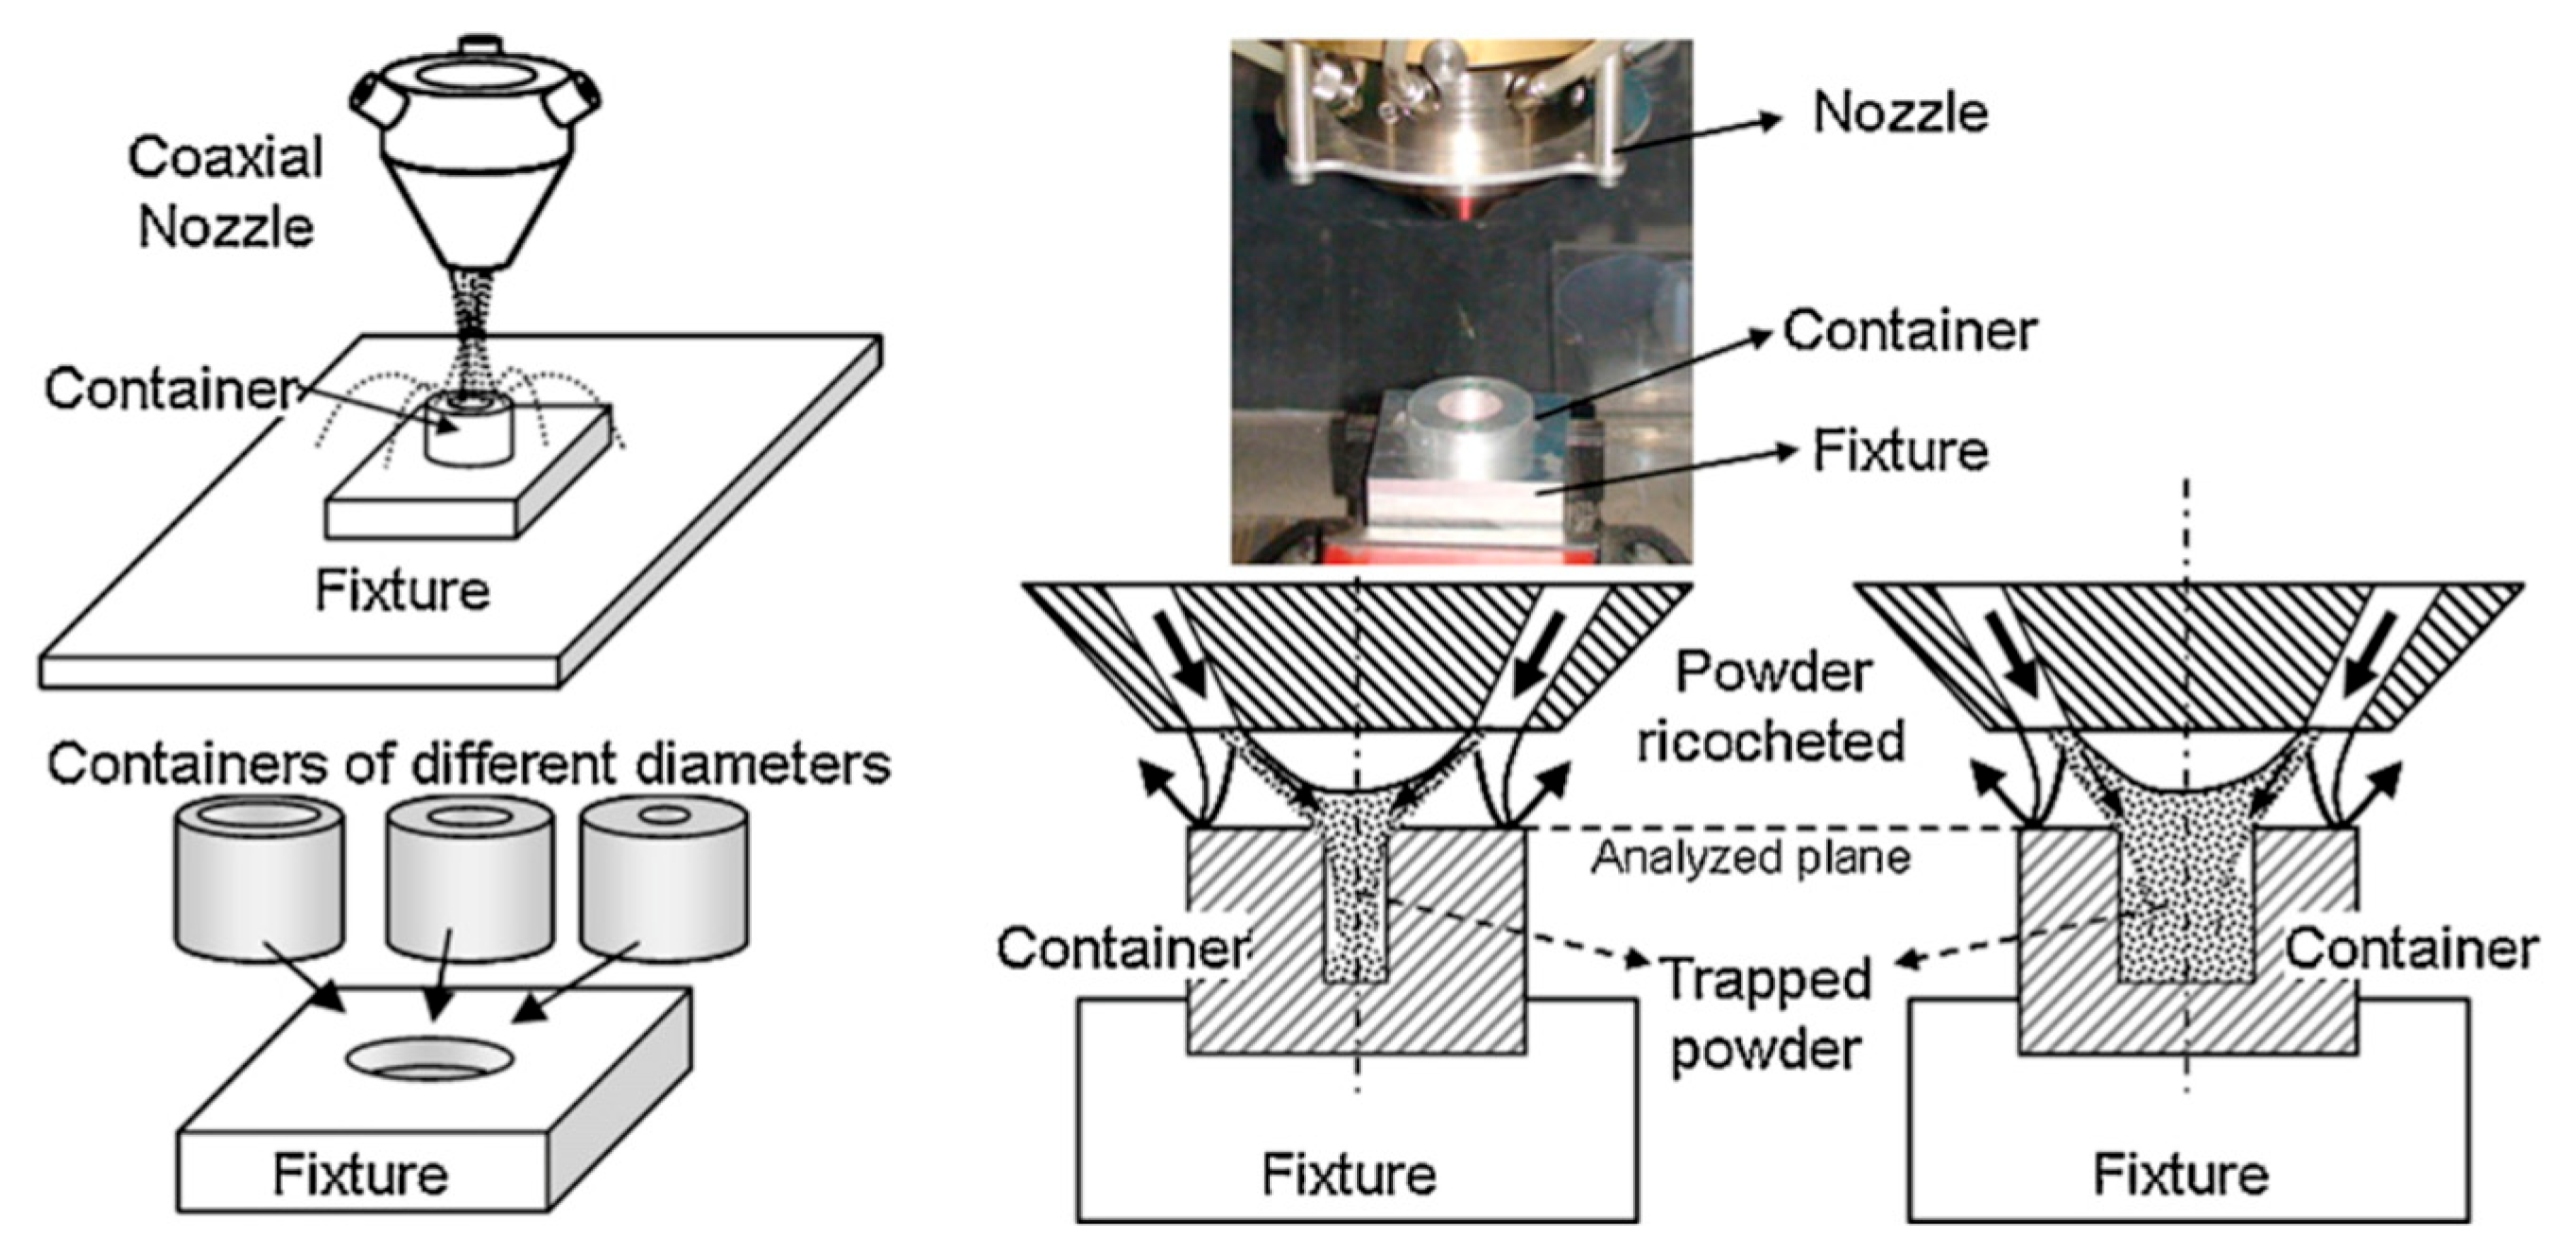
Liu [15] and Tabernero [16] evaluated the PGJS by trapping the powder in identical cylindrical containers with holes of various diameters to assess the powder jet characteristics, as shown in Figure 10 [15]. In this method, the cylinders are placed under the nozzle exit in different regions of the powder jet, and the spatial powder flow distribution of particles can be determined by weighing the amount of powder captured in each container.
By calculating the weight difference between powder collected in each container with different diameters, the amount of powder passing through the holes is measured and the distribution of particles along the PGJS is estimated. Figure 11 [16] shows a schematic and experimental diagram of the procedure.
Weight-based methods provide valuable quantitative data using a simple approach and require minimal equipment. The experimental setup can be validated by integrating the measured powder values over the study area and comparing this total to the total mass of powder injected by the feeder [16]. A cross-validation study conducted by Tabernero [16] reported that the relative error between these measurements was low, ranging from 0.8% to 12.3%, despite minor discrepancies between the programmed and actual injected mass. However, the accuracy of the data can be limited, as this intrusive measurement technique directly interacts with the natural behaviour of the PGJS to collect particles, potentially altering the flow of particles and gases [17]. Additionally, the representability of the data are limited because this method depends on nozzles or collecting devices staying stationary at discrete points for extended periods to gather enough powder for weighting and by the size and spacing of collective devices, such as cylindrical containers and pinholes. Consequently, these methods are poor in spatial and temporal resolution, time-consuming, and static by nature [18]. Therefore, they may not be ideal for applications requiring real-time and dynamic measurements.
In summary, while weight-based methods are valid for obtaining quantitative data on powder flow distribution, their static nature, limited spatial resolution, and lack of capturing real-time dynamics highlight the need for complementary techniques, such as optical methods, for a more comprehensive sensing of the PGJS. By cross-validating weight-based measurements with optical data, both accuracy and completeness of PGJS evaluation can be improved.

3.2. Optical Methods

Optical-based methods, such as digital imaging and analysis, are often used to measure the PGJS by illuminating the particles of the powder jet and photographing them with a camera. According to the literature, there are two camera configurations employed for this method. The first is coaxial, where a camera is mounted coaxially with the nozzle exit to provide a view along the same axis as the powder stream [19]. The second is lateral, in which the camera is positioned alongside the nozzle, capturing images of the illuminated powder jet profile [20].
On both setups, high-speed cameras, equipped with charge-coupled devices (CCDs) or complementary metal-oxide semiconductor (CMOS) sensors, are employed to capture the illuminated particles, ensuring high-quality images even when they are moving quickly [17]. Furthermore, the literature explores three types of optical illumination to observe the particles: area illumination, vertical laser line, and horizontal laser line, as presented in Table 2.
The various experimental setups have been used for the qualitative and quantitative analysis of the PGJS. The following subsections present a structured review of these techniques, categorised by lateral and coaxial camera configurations and further classified by the type of illumination adopted in each. Given the diversity of experimental configurations found across the studies, the classification facilitates understanding the methodological choices, their findings, advantages, and limitations measured by the PGJS.

3.2.1. Lateral Camera Configuration

In the lateral camera setup, the camera is positioned perpendicular to the illumination or laterally to the nozzle [20], capturing images of the illuminated PGJS profile. This setup is widely adopted for its simplicity in capturing a two-dimensional (2D) projection of the powder particles, enabling a qualitative measurement of the shape of the PGJS [40], the particle’s velocity and trajectory [38], and powder concentration and distribution [29], determining key aspects of the PGJS such as SOD and Df [40]. In some cases, a coaxial view can be achieved with this setup by using mirrors and filters to capture a different perspective of the PGJS [17]. The results can vary based on the measurement technique used, including the illumination type, laser thickness, camera setup, and algorithm. It is crucial to note these factors. As shown in Table 3, Jardon [10] demonstrated that when testing the same material under identical setups and configurations, a mere change in the illumination type resulted in different measurements of SOD and Df.
The following subsections detail the specific illumination strategies employed in lateral configurations.
Area Illumination
Area illumination techniques utilise a broad light source, typically from LED panels, to illuminate the powder particles while a front-facing camera captures the overall behaviour of the PGJS [18]. The technique is often used to determine the velocity of the particles and trajectory by detecting the metal particle contours and tracking them across successive frames [18,31]. Furthermore, by analysing the concentration of particles captured by the camera, the technique is also suitable to determine characteristics such as SOD and Df, as shown in the study conducted by Jardon [10].
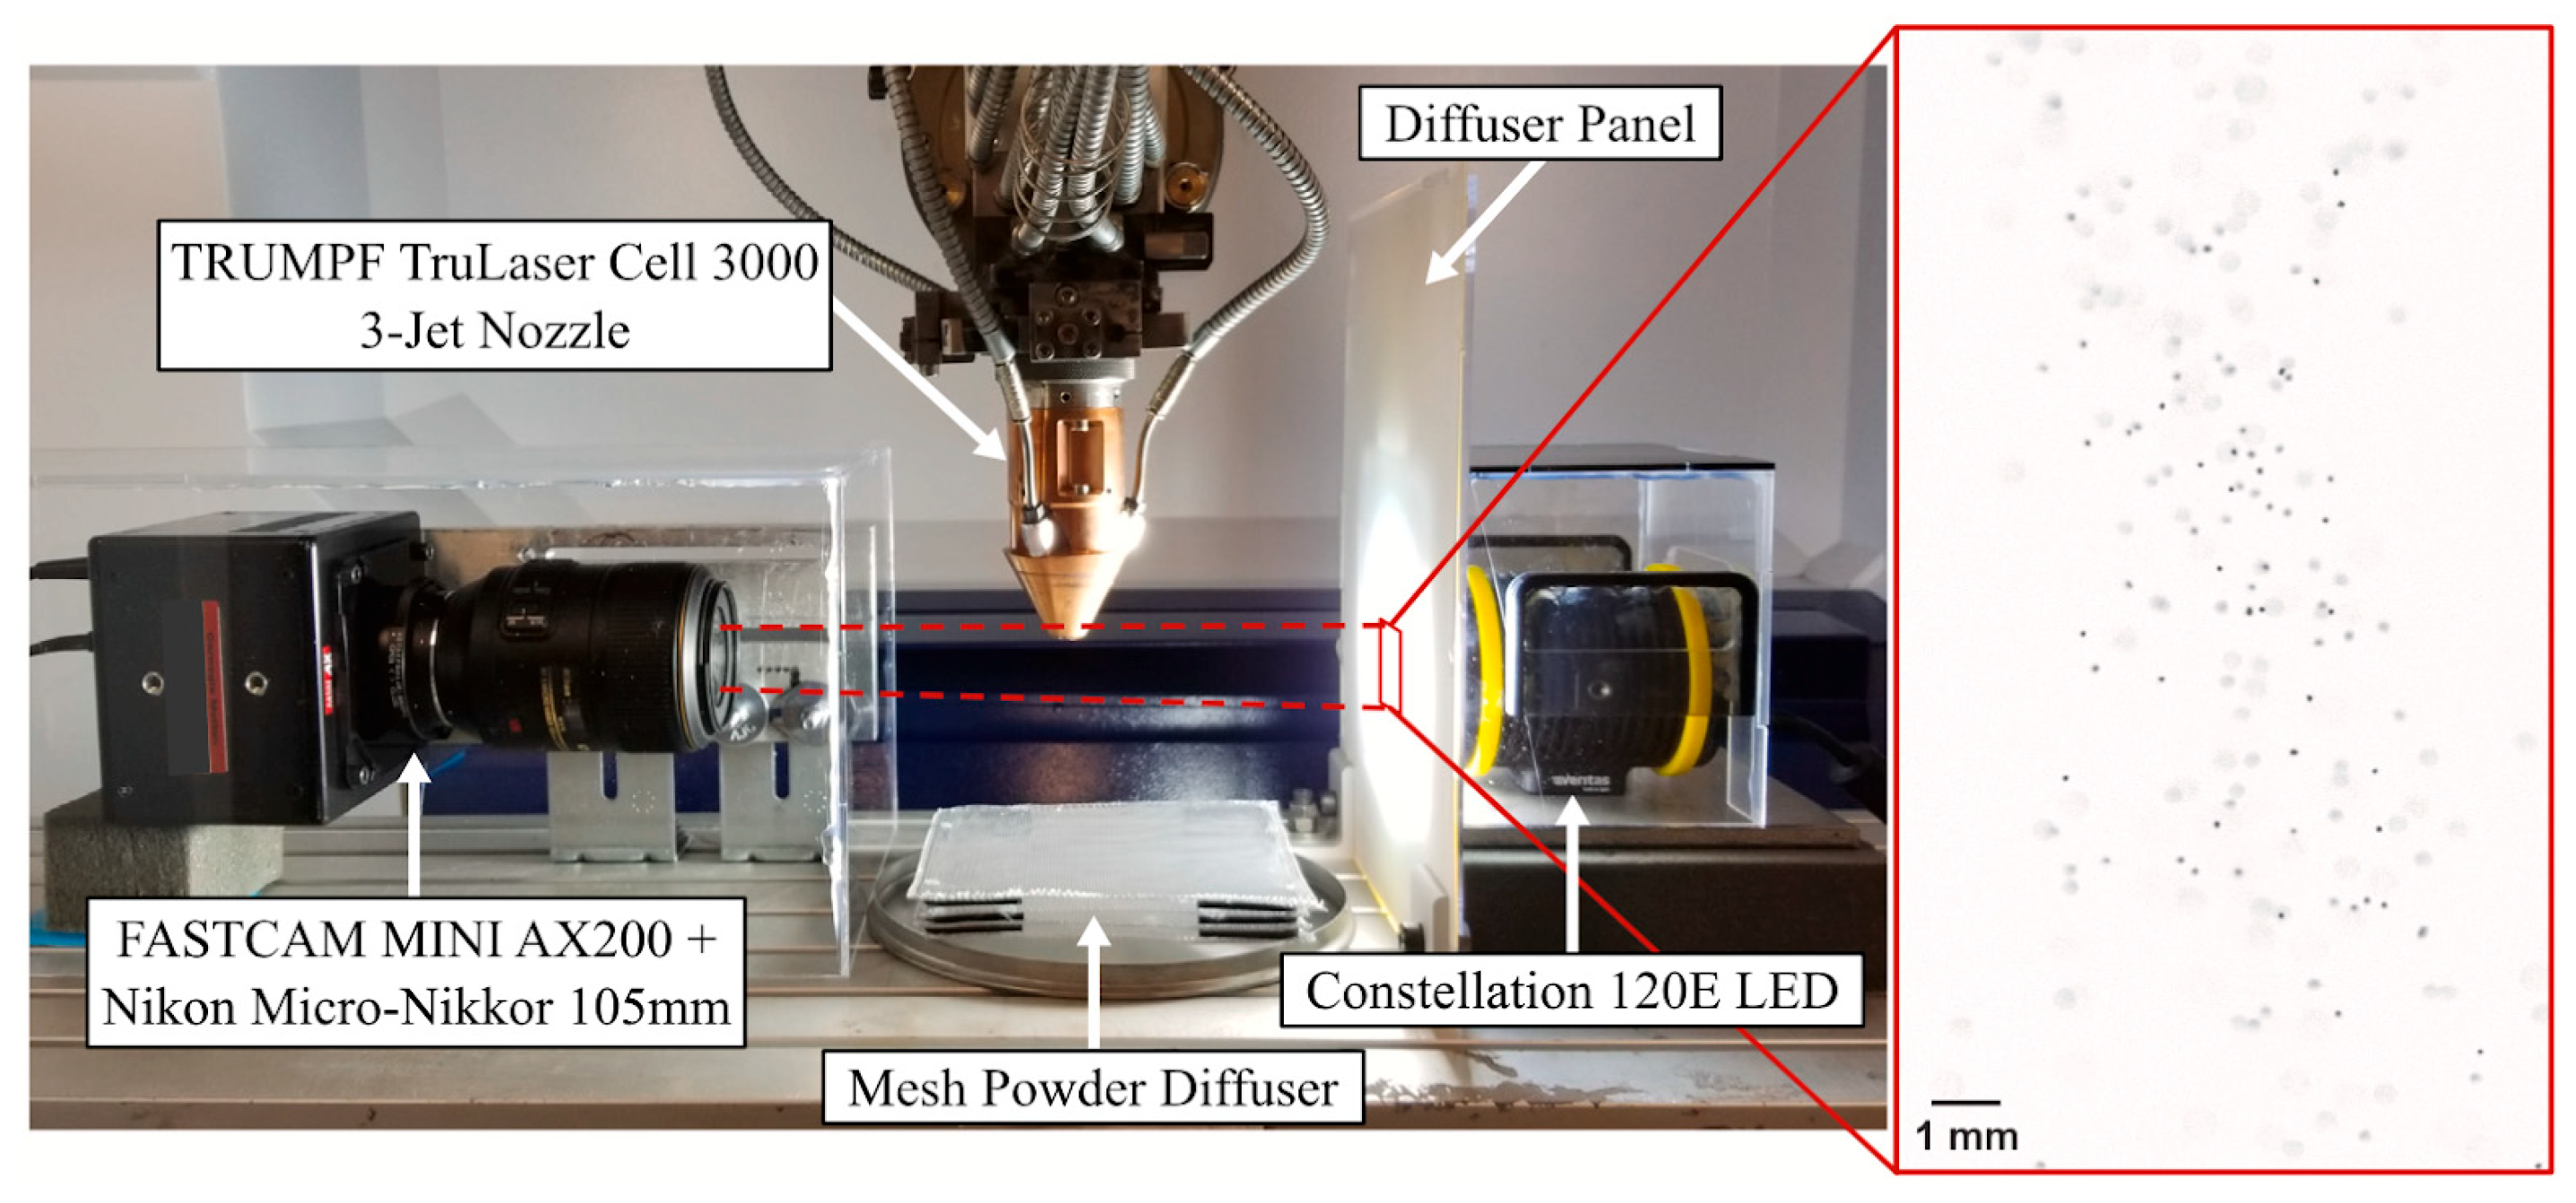
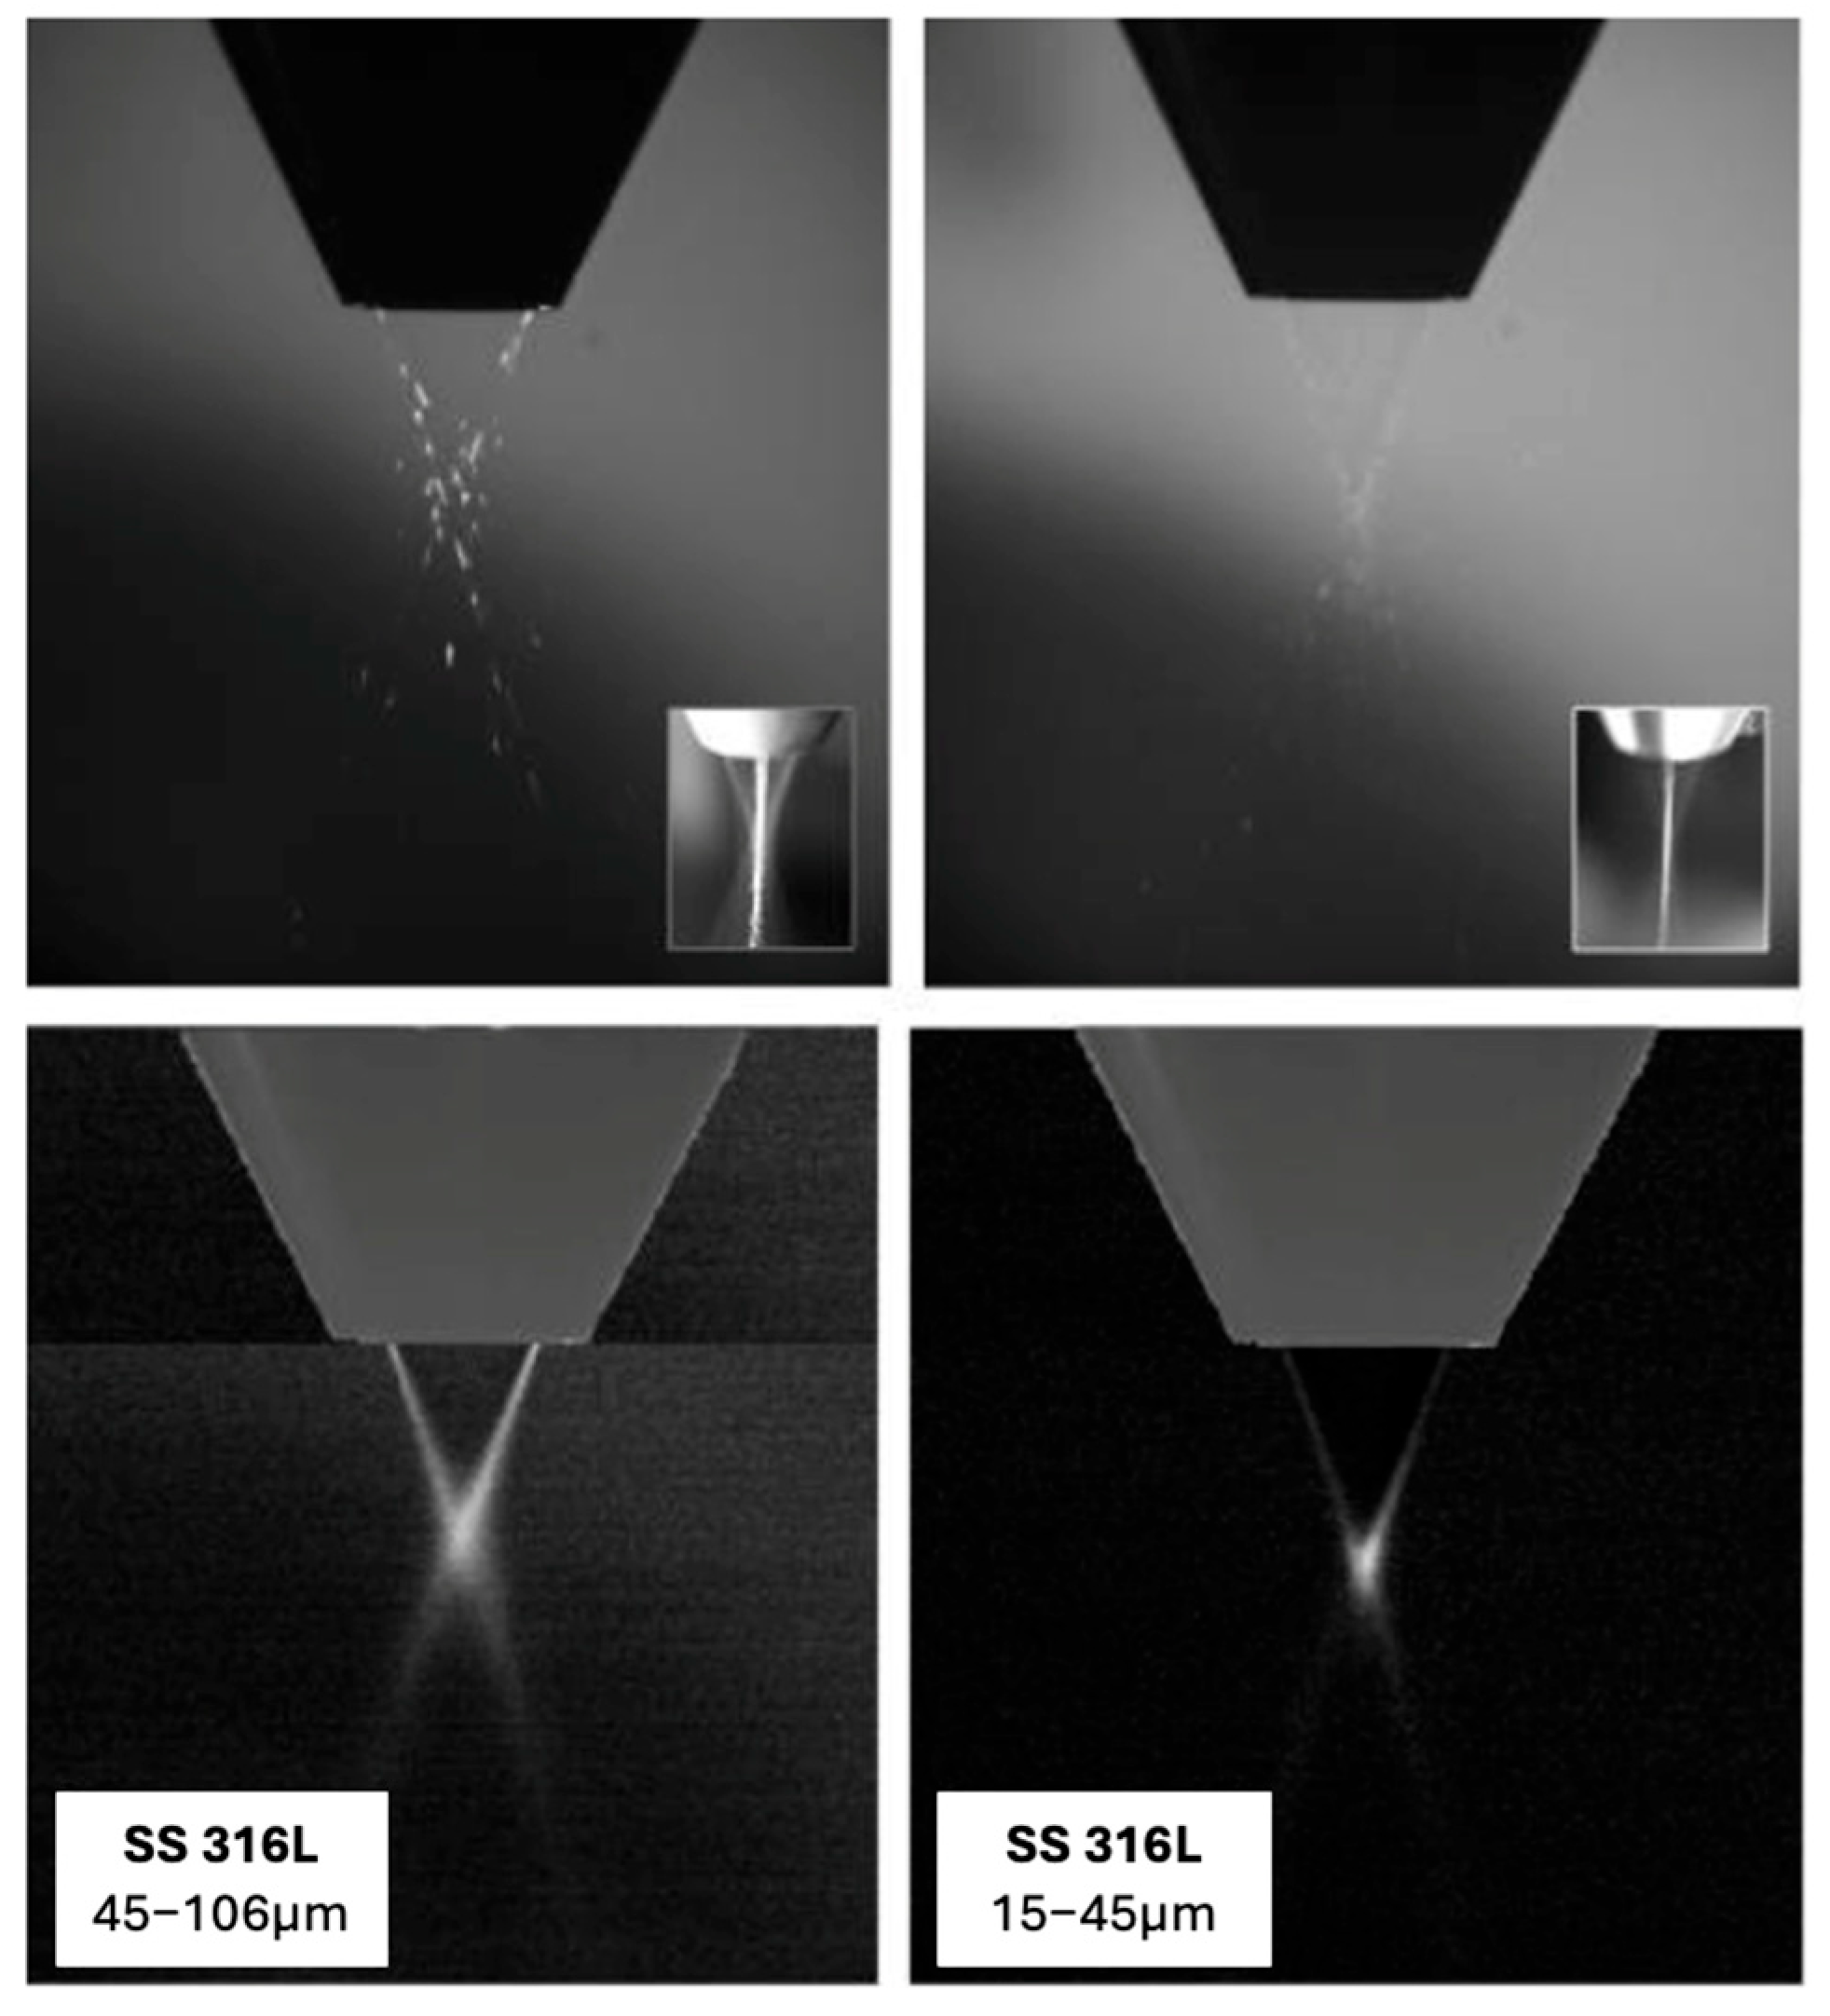
To improve the detection of the contour and maximise the contrast of the powder particles, some lighting arrangements are explored in the literature. One method involves placing the illumination light equipped with a spherical diffuser behind the powder jet, also known as backlight illumination, which provides silhouettes of the particles [21], as shown in Figure 12.
The image processing involves several steps, where the particles are isolated and the characteristics of the PGJS can be further analysed. Most of the images are recorded in greyscale, where each pixel’s value corresponds to reflection intensity, where 0 indicates the lower intensity and 255 the highest, making them suitable for subsequent processing steps [10].
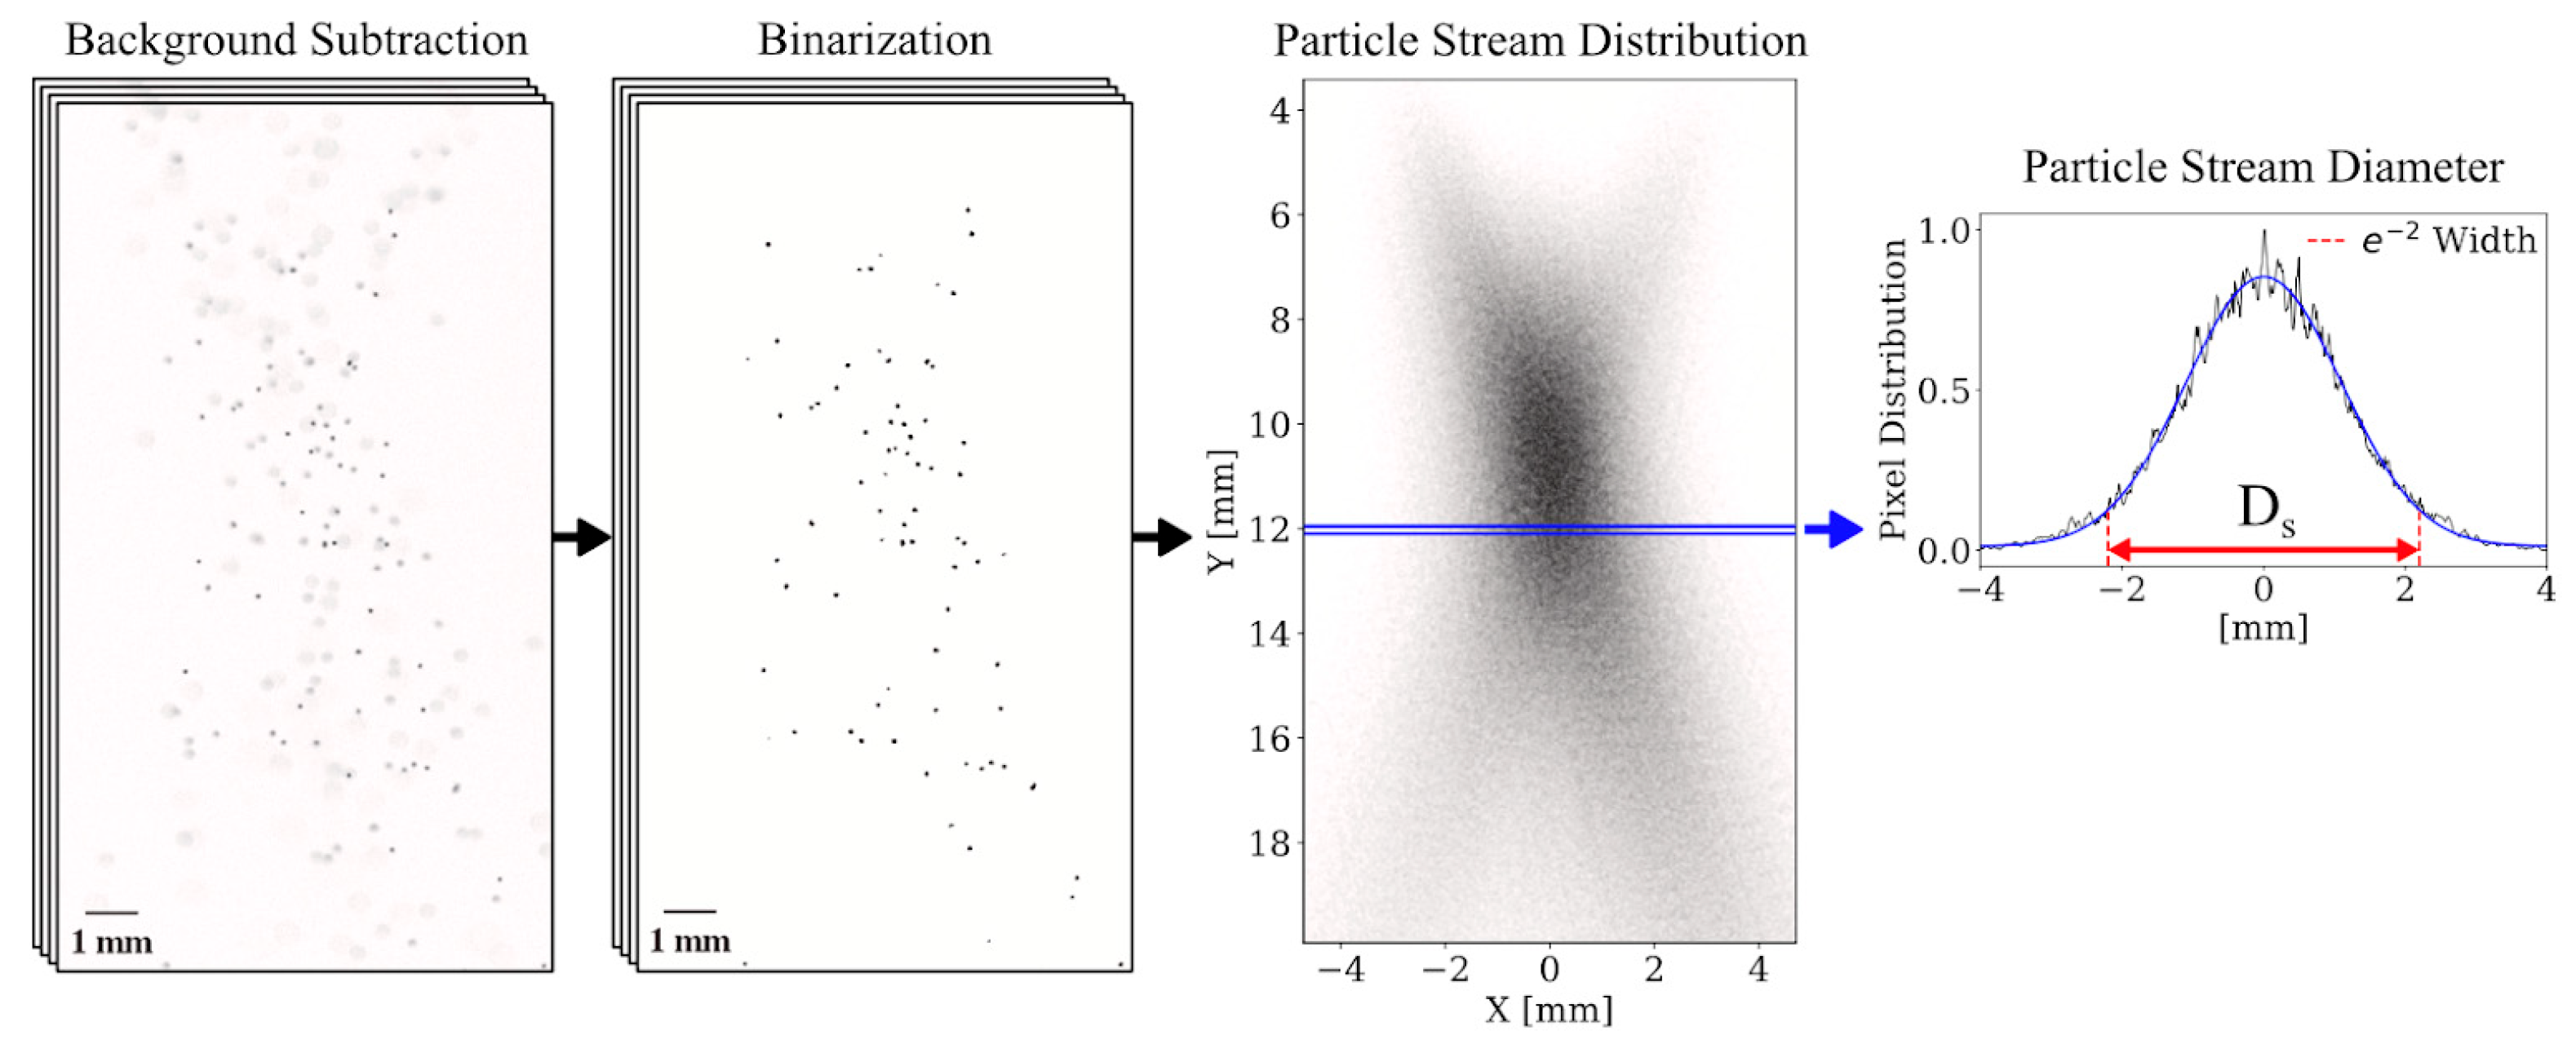
Once the images are captured, elements such as background, nozzle tip, and blurry particles are subtracted by applying a contour enhancement technique to the particles and filtering out pixels with values below a specific threshold to separate the powder jet from the background [10,21]. A particle concentration map (pixel intensity map) is created through the averaging of numerous processing images, facilitating the extraction of intensity curves from the resultant image. An illustrative example of this process, demonstrated by Ancalmo [21], is depicted in Figure 13, showcasing a practical application of the described image processing steps.
To determine the characteristics of the PGJS, a common technique involves using the pixel intensities at each horizontal and vertical position within the image. This process helps generate intensity profiles that represent particle concentration in different regions of the powder jet.
In the study conducted by Jardon [10], intensity profiles were extracted from horizontal lines at different vertical positions in the processed image. These profiles were used to measure parameters like the SOD and the Df. The SOD represents the height along the powder jet where the maximum peak value of the horizontal Gaussian intensity profiles occurs, while the Df is the minimum width of the particle cone containing 86% of the total particles at that SOD. Figure 14 [10] visually explains the process: the left image displays coloured pixel lines at five heights of the PGJS in the processed image; the central image shows the intensity profiles for each pixel line; and the right image illustrates the extraction of the SOD and Df.
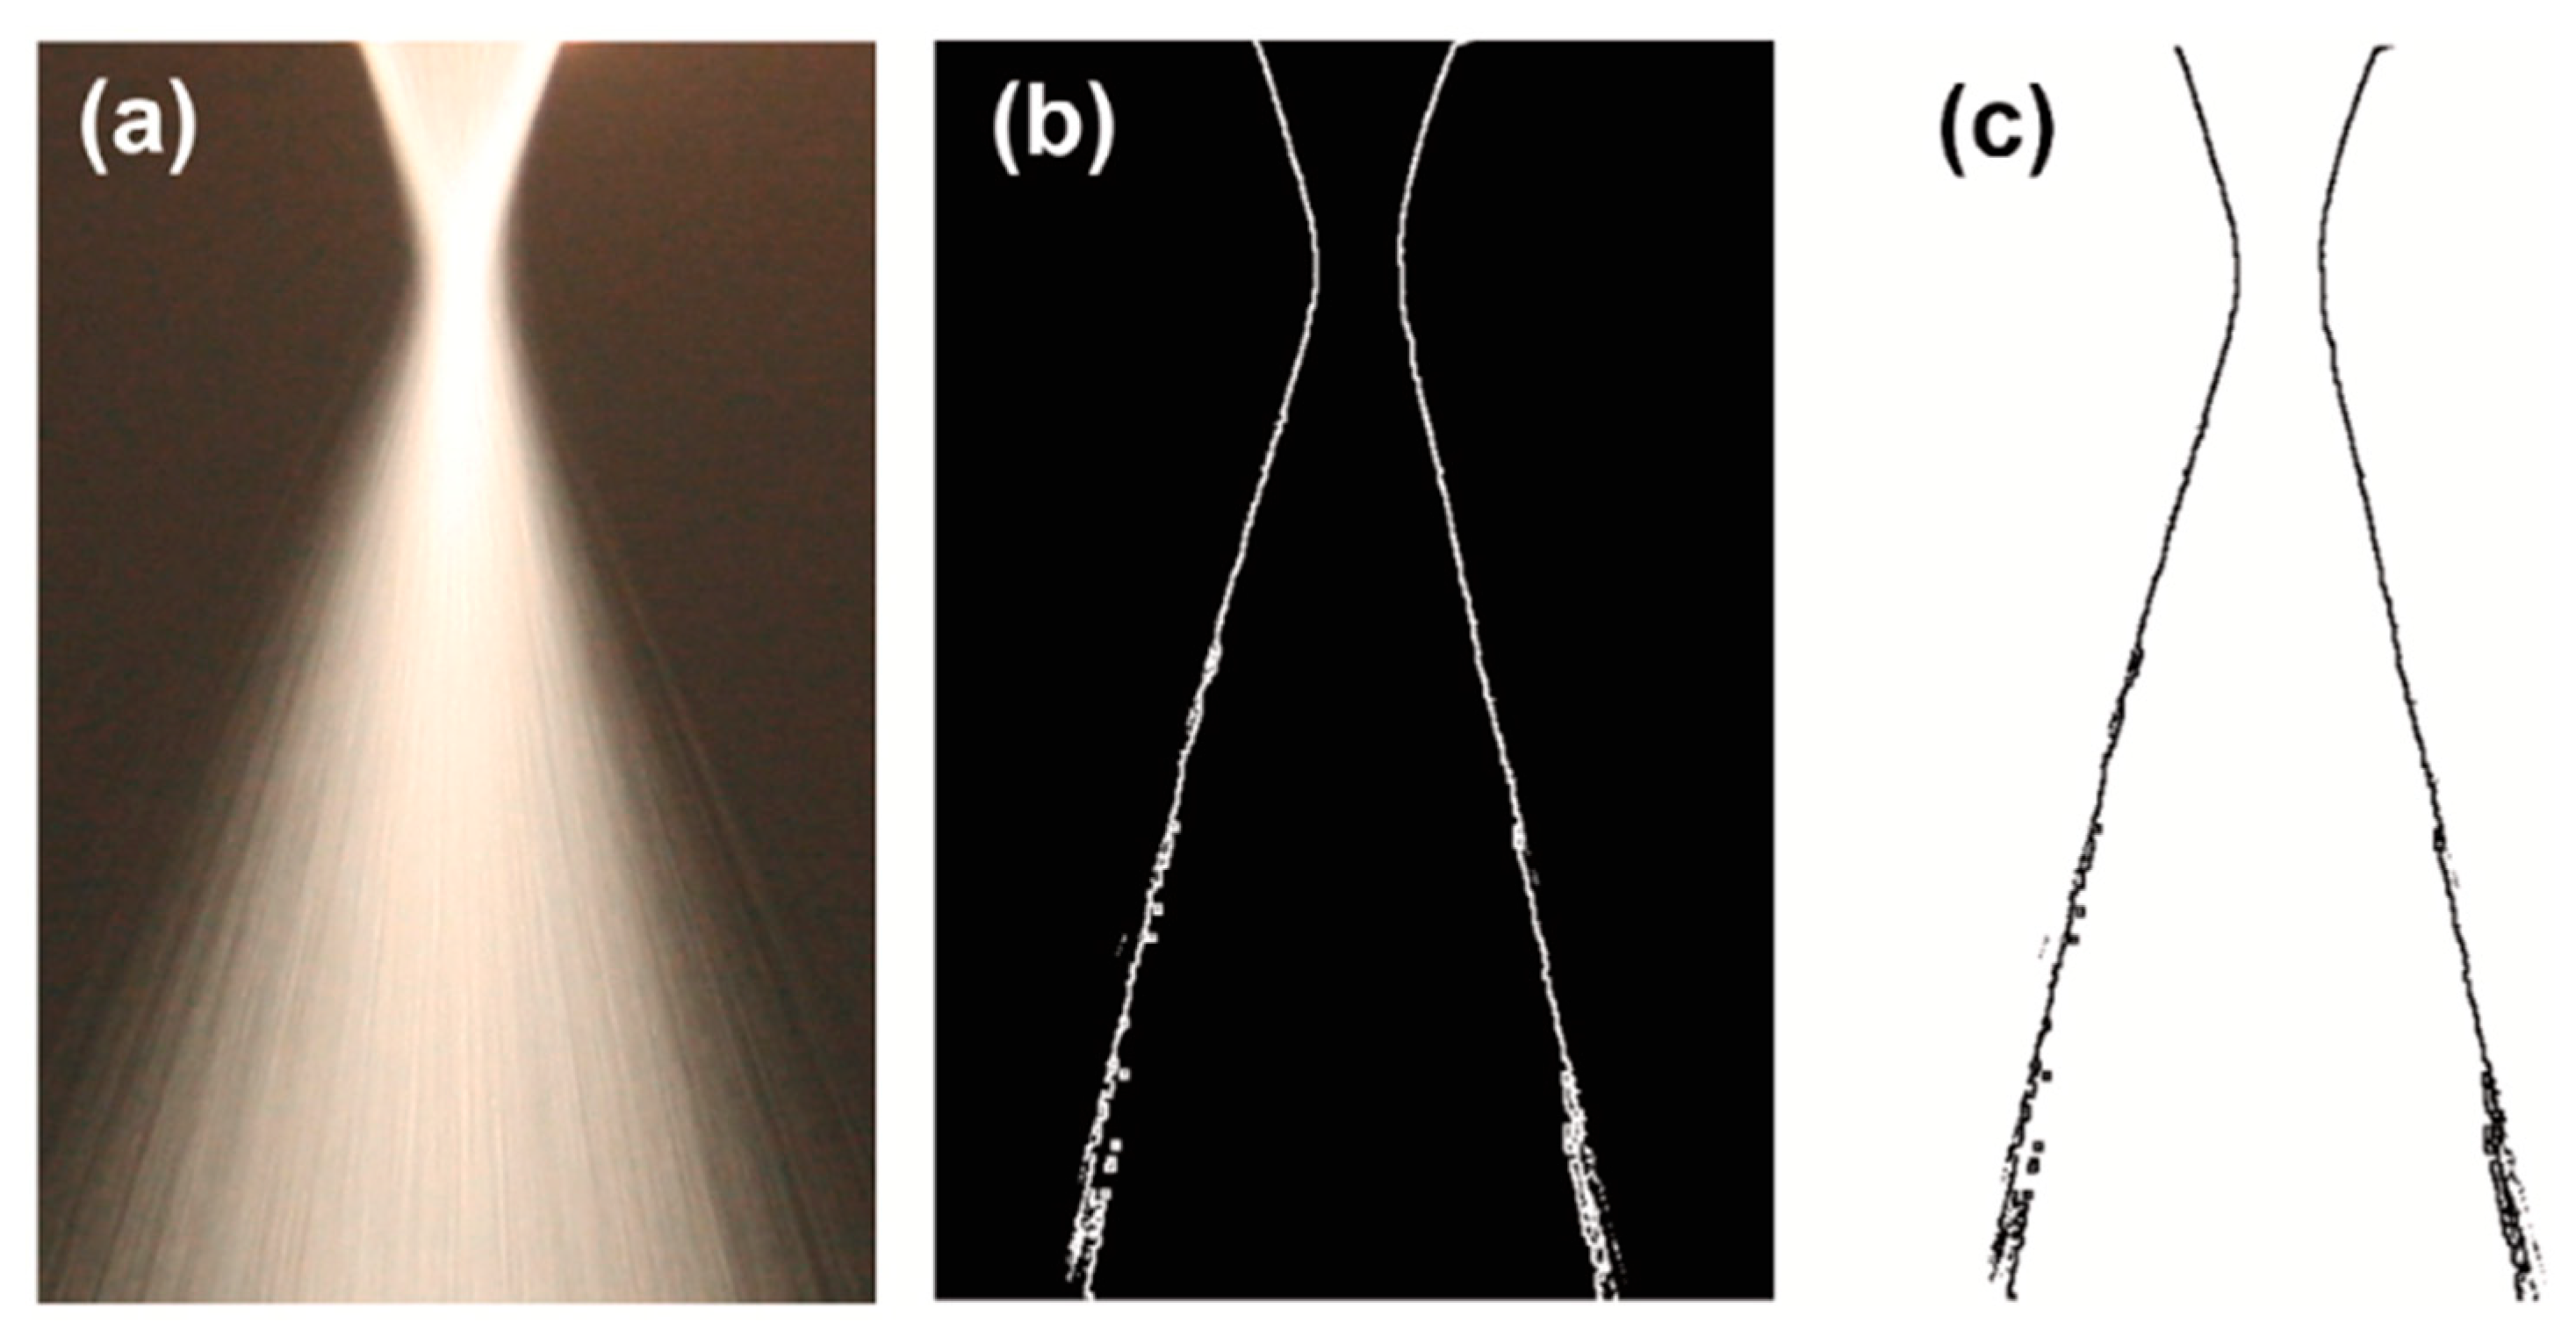
Lopez-Martinez [26] explores a different approach of capturing images of the powder jet using intense light against a black background. This study utilises the Edge Identification Algorithm (EIA) to extract the boundary curves of the PGJS, as shown in Figure 15, providing details into the powder jet’s shape. The method provides a qualitative visualisation of the powder jet and compares it quantitatively with computational methods, analysing the stream shape, convergence location, and powder focus [26].
Another option explored by García-Moreno [31], Warneke [23] and Jing [22] involves the use of one or more strong LED light sources to illuminate the whole powder flow field. This technique is explored in literature specifically for measuring the velocity and trajectory of the particles. Particles are tracked frame-by-frame, and measurements of their motion are obtained using algorithms such as the Kalman filter and Particle Image Velocimetry (PIV). These methods enable the calculation of individual particle paths as well as the overall flow behaviour, providing information about the PGJS’s dynamics in various process conditions.
In general, area illumination techniques enable the measurement without physically disturbing the overall flow of particles and gases [10,21]. Spatial characteristics of the powder jet, such as shape, convergence location and diameter, are clearly visualised through the technique, as shown by Lopez-Martinez [26] in his study. However, there are several limitations are associated with this technique due to the simplicity of illuminating the entire PGJS. Since the powder jet is uniformly illuminated, it restricts layer-by-layer analysis, potentially hiding smaller details and simplifying the identification of jet characteristics. For example, the illuminated area becomes broader at the convergence zone, where particle interaction is most intense, which makes edge detection difficult and leads to slightly overestimated experimental values for convergence diameter and distance [26].
In addition, when smaller particles (15–45 µm) are used, the images tend to be darker and have a lower signal-to-noise ratio because there are fewer pixels per particle. The use of small particles for PGJS measurements creates a necessity for higher frame rates and shorter exposure times to increase the contrast between the background and powder jet. This also leads to an increase in computational load and complexity to eliminate blurred particles outside the focal plane [10]. To address these limitations and provide more detailed and localised information about the PGJS, alternative illumination strategies have been explored in the literature, and these strategies are covered in the following sections of this work.
Vertical Laser Line Illumination
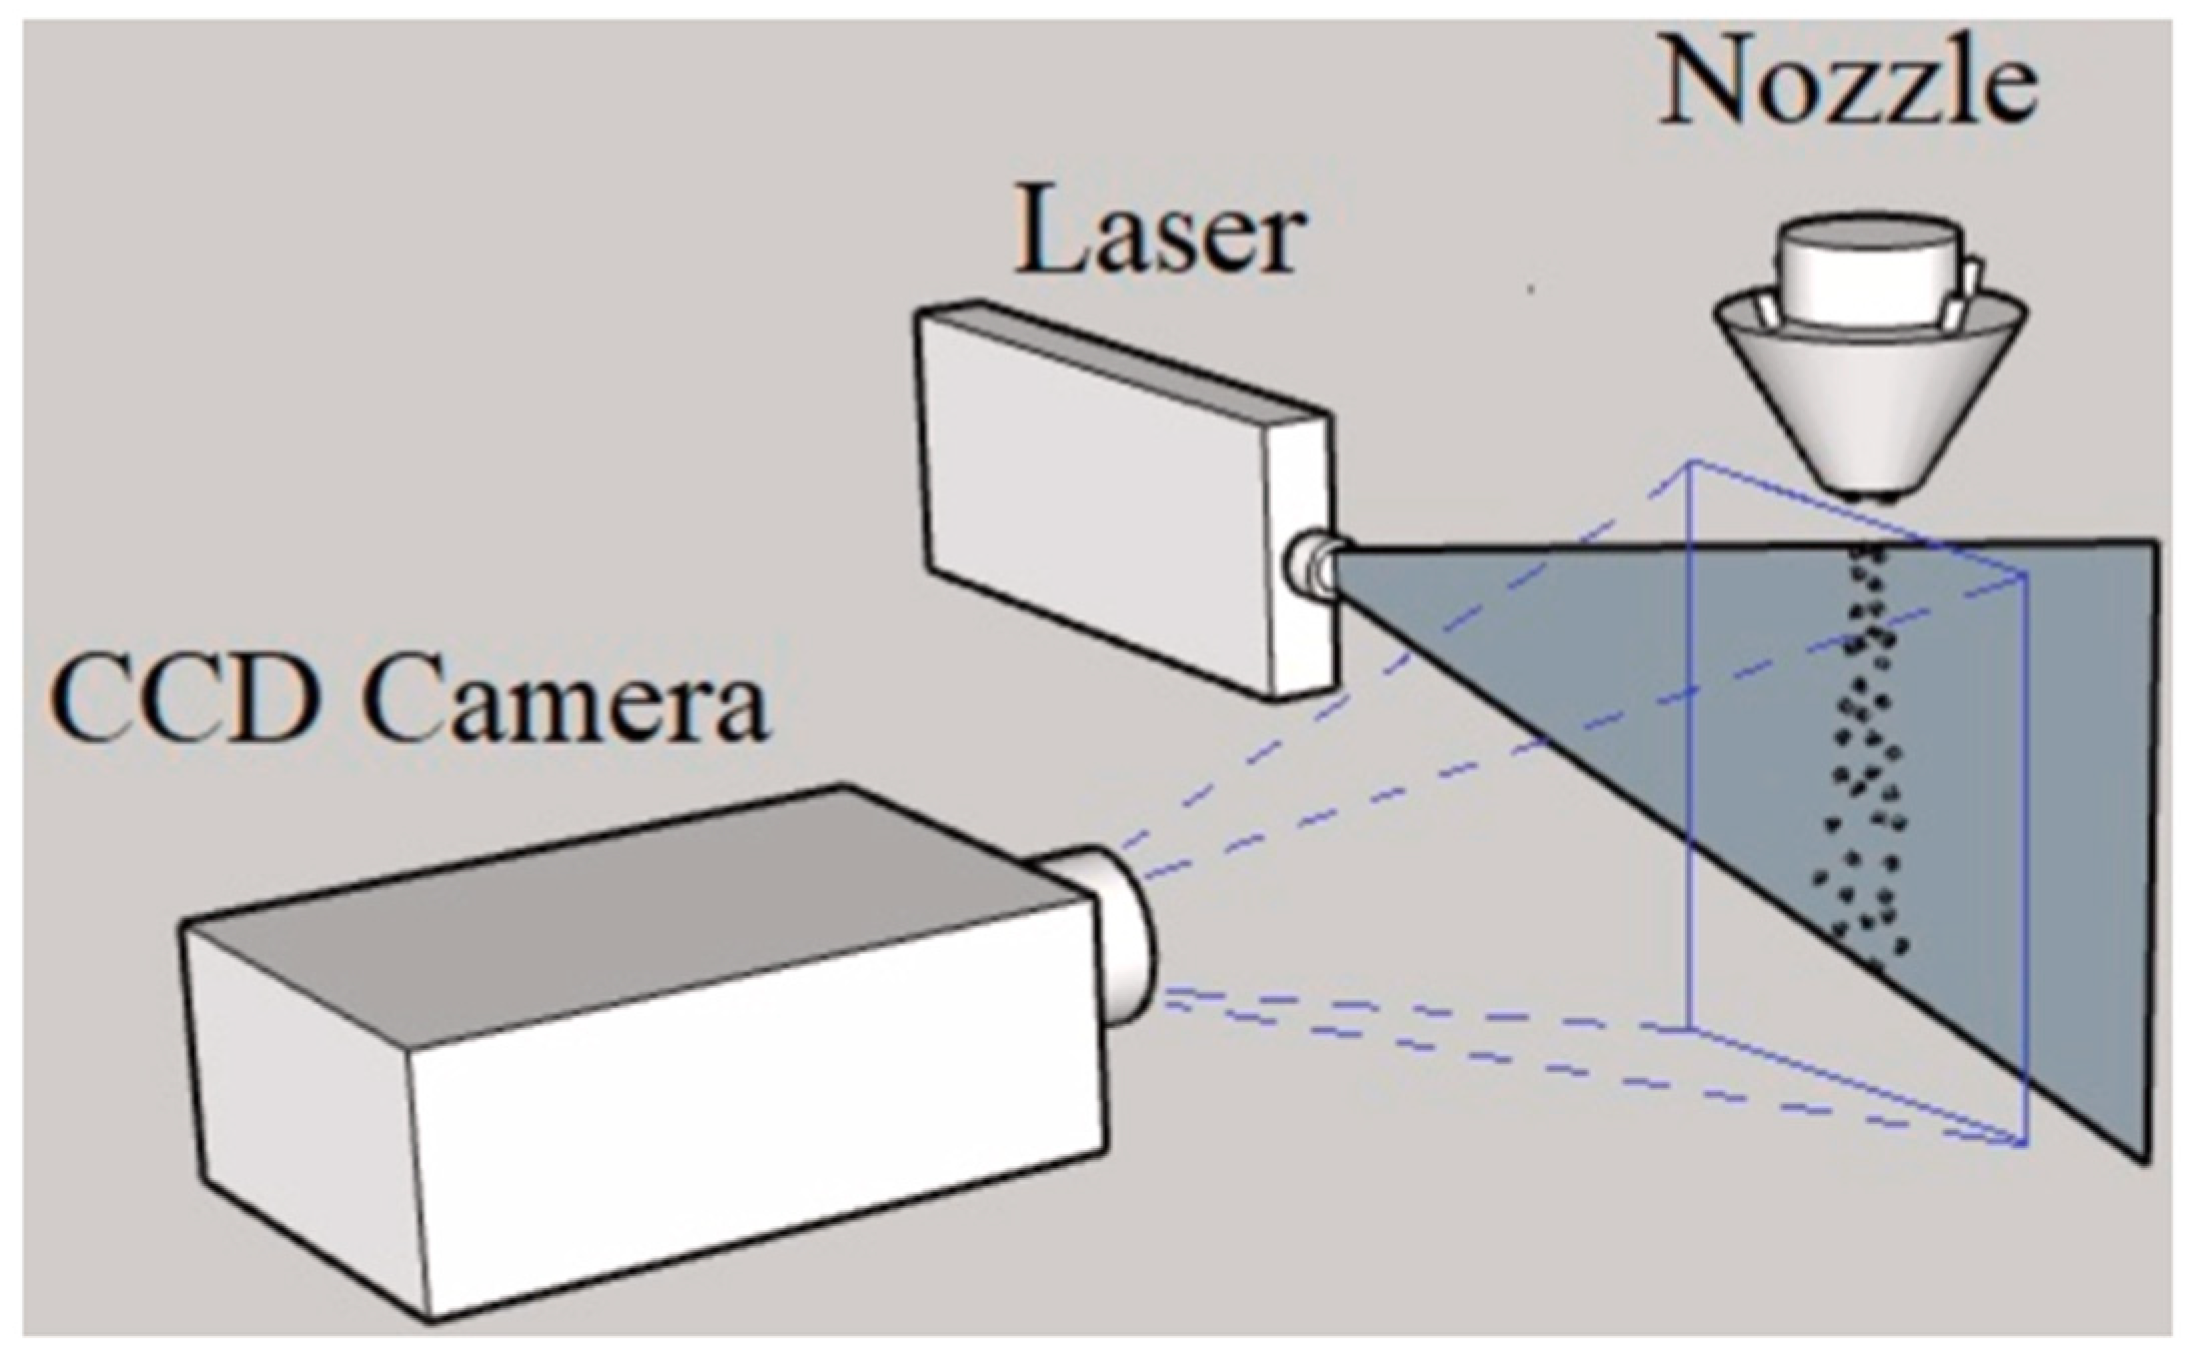
In this method, a vertical laser line is used to illuminate thin slices of the PGJS, while a camera positioned perpendicularly to the illumination captures its illuminated layers. Based on the intensity of light reflected by the vertical layers, the particle concentration can be extracted based on the pixel values of the images, and it is possible to obtain a representative visualisation of the cross-sections [10]. A schematic of the setup is illustrated in Figure 16 [33].
The laser beam directed through a structured light projector [20] or a cylindrical lens [33,36,37] to produce a narrow, evenly distributed sheet of light that covers its illuminated surface uniformly [9]. The laser sources reported in the literature cover a range of visible wavelengths, from blue-violet (405 nm) to red (660 nm). Knowing the illumination wavelength is fundamental for the measurement process, as it allows for the selection of appropriate optical filters that are tuned to that specific wavelength. As documented by Hildinger et al. [44], these filters help attenuate external emissions outside the chosen narrow wavelength range while allowing the reflected illumination light from the powder particles to reach the camera, isolating the powder from the background. Furthermore, the selection of the wavelength considers the sensitivity of the camera chip, which is typically calibrated for the visible spectrum [44]. Table 4 provides a comprehensive overview of the types of lasers, their corresponding wavelengths, laser thicknesses, and the cameras that were used in the studies.
Authors such as Zekovic et al. [20] and Ferreira et al. [17] reported the use of red lasers (650–660 nm) to record the PGJS in their studies. The objective with this illumination in both studies is to determine the shape and structure of the PGJS, exploring the velocity and trajectory of the particles. Both studies analyse materials with similar densities and particle size distributions (PSD): H13 (7.8 g/cm3) ranging from 53 to 150 µm in [20] and IN718 (8.19 g/cm3) ranging from 51 to 109 µm in [17]. In each study, the creation of a focal region where the powder jet consolidates, increasing the particle concentration, and the existence of a converging PGJS along the central axis are identified. They also agree that the shape, convergence, and stability of the PGJS are strongly influenced by the gas flow rates and nozzle geometry. Both also show that particle behaviour is non-uniform and affected by factors such as PSD, collisions, and interactions with gas flows, impacting powder efficiency and deposition accuracy.
It is noteworthy that both studies employ distinct contrast enhancement methods, demonstrating the diversity in approaches. Specifically, Zekovic et al. [20] use a black background to distinguish laser-illuminated particles from the background, whereas Ferreira et al. [17] employ filters fixed to the camera.
In the studies conducted by Balu et al. [40] and Katinas et al. [38], green lasers are employed to illuminate the PGJS and characterise its shape, concentration, and velocity. Both works investigate powder flow from similar coaxial discrete nozzles, using powders with comparable PSD (50–150 µm), though differing in density: [40] focuses on a nickel and tungsten carbide composite, while [38] examines H13 tool steel. The thickness of the laser sheet used by Balu [40] is 200 µm, while Katinas [38] identifies the type of laser but does not specifically mention its thickness. However, the author mentions an “effective laser sheet thickness of 4 mm” in respect to the illuminated jet volume, implying a wider region of particle reflection that the camera was able to capture but a thinner actual sheet width.
Both studies analyse the horizontal distribution of the PGJS using different methods. Katinas et al. [38] apply a numerical model to examine particles in horizontal cross-sections, while Balu et al. [40] obtain horizontal profiles through a physical setup involving a horizontal laser sheet and a camera placed underneath the nozzle (detailed in the following subsection). Despite these methodological differences, the studies report consistent findings regarding the convergence behaviour and concentration profile of the PGJS. Specifically, both observe that the powder stream initially diverges after exiting the nozzle, then converges to a focal point of maximum concentration, before diverging again, resulting in a Gaussian distribution of powder concentration like in the previous studies discussed.
On the other hand, studies from Jardon et al. [10], Platz et al. [35], and Kim and Park [34] report the use of blue-violet laser light (405–447 nm) to measure the PGJS. These three investigations focus on the flow characteristics of stainless-steel metallic powders, specifically 316L and 17–4 PH grades, while exploring different PSDs and powder grades. The methodology used by both Jardon et al. [10] and Kim and Park [34] utilises a fixed vertical line laser for observation, while Platz et al. [35] employ a commercially available measurement system, PowderSpy from Ponticom GmbH. This system uses a 30 mm linear stage to move the laser, capturing images of the powder jet with a camera for subsequent analysis.
The focus of Kim’s [34] study emphasises the effects of the nozzle tip on the powder jet, whereas Jardon et al. [10] and Platz et al. [35] examine the influence of process parameters on the powder jet characteristics with a similar continuous coaxial nozzle. Both studies agree that increasing PMF generally leads to a larger Df. However, their findings diverge on the effects of SG and CG: Jardon et al. [10] report a slight increase in Df with higher SG and a decrease in SOD with increased CG, whereas Platz et al. [35] find no significant effect of SG on diameter and observe that higher CG reduces the Df and results in more uniform focus positions.
These contrasting results may be influenced by various factors as discussed in literature, such as the nozzle model, material properties (density, PSD, sphericity), and the measurement technique employed. Specifically, Jardon et al. [10] use a fixed vertical laser line for illumination, while Platz et al. [35] employ a laser moved along a linear stage. As of this date, there are no benchmarks in the available literature that compare those measurement techniques and analyse the generated powder jet to create a standard metric for qualification of the PGJS; determining which method offers the most accurate or representative characterisation remains a persistent challenge.
Compared to backlight imaging techniques, vertical laser sheet illumination requires less post-processing, as it captures particles within a single plane and eliminates the need to filter out-of-focus particles [10]. Despite its advantages and widespread use for visualising the PGJS, offering a clear 2D cross-section of the particle distribution [20,38] and enabling the reconstruction of the powder caustic profile (i.e., shape and spread) [17], vertical laser line illumination still has limitations in achieving fully 3D characterisation. Since this method directly depends on the single vertical cross-section, only the particles interacting with the sheet are captured, as illustrated in Figure 17 [10].
An alternative to overcome this challenge is addressed by Platz et al. [35], in which the laser is moved along a linear stage to sequentially illuminate the entire PGJS volume. This method still requires post-processing for reconstructing the horizontal profiles and assumes consistent particle behaviour across slices. Furthermore, the thickness of the laser sheet is crucial, as it determines the number of particles illuminated in each plane. The inclusion of particles slightly outside the desired cross-section may blur the actual concentration contours when using a thicker sheet [20,38]. Moreover, selecting the appropriate camera and ensuring its capability to detect powder reflectivity at the chosen laser wavelength can significantly affect image quality, necessitating precise adjustments to exposure time and analogue gain to prevent overexposure or underexposure. These factors collectively limit the technique to a single case, making it a challenge for a general characterisation of the PGJS.
Horizontal Laser Line Illumination
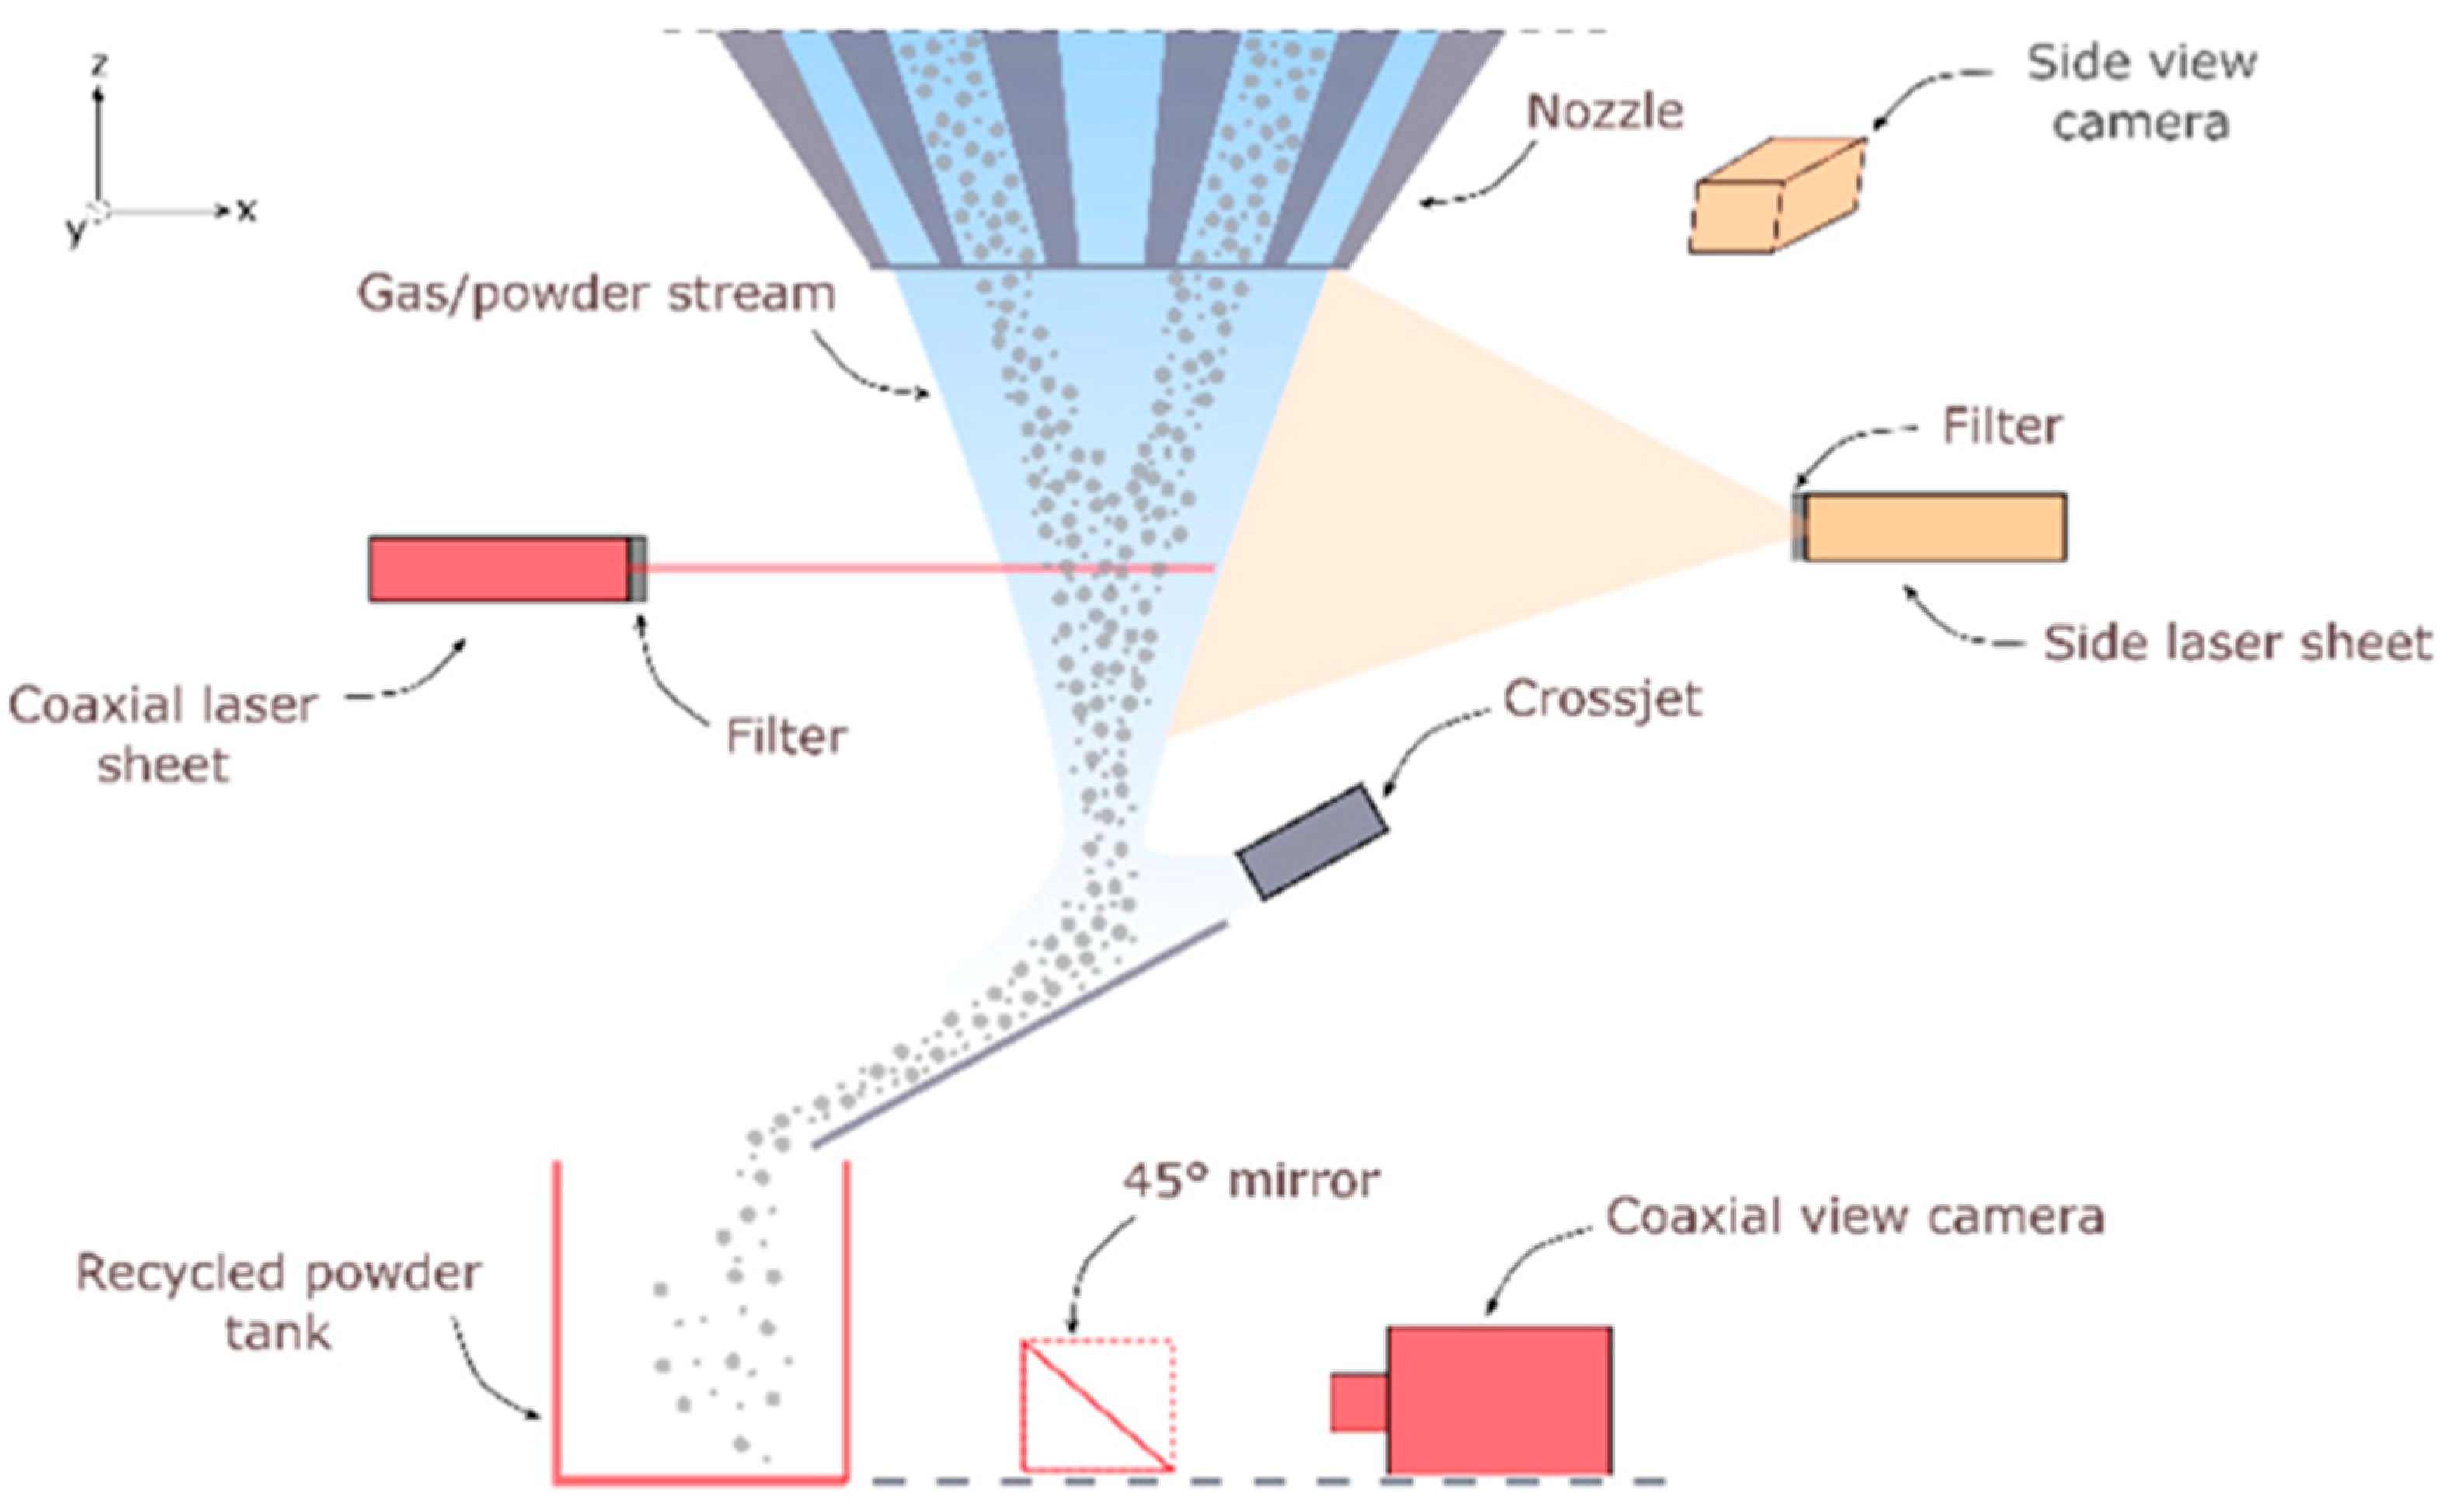
In this method, a laser line is mounted laterally to illuminate the horizontal cross-sections of the PGJS at various axial distances [17], while a camera captures images of the illuminated particles. The primary distinction noted in the literature between studies using this setup lies in the mechanism for viewing the PGJS cross-section. In one case, a mirror positioned at a 45° angle between the camera and nozzle exit is used to capture a “coaxial” view of the powder jet. The alternative approach employs a camera that directly views the horizontal laser sheet as it passes through the powder jet, without an intermediate mirror. Table 5 summarises these different approaches along with their key setup details.
Utilising a 45° mirror provides a direct observation of how the powder concentration spreads at a given height in the PGJS [17,20], facilitating the capture of clear cross-sections, as illustrated in Figure 18 [17]. Authors such as Zekovic et al. (2007) [20], Balu et al. (2012) [40], and Ferreira et al. (2020) [17] used a 200 µm thick laser sheet to illuminate horizontal slices of the PGJS. This process involved capturing images at various axial distances to reconstruct the 3D shape of the powder jet accurately and analysing the powder concentration by examining the pixel grey levels in the images.
The image processing in these studies follows a similar strategy: to improve clarity and reduce the noise, multiple images are taken at each axial distance and stacked. A brightness threshold is then applied to eliminate reflections and light artefacts from the coaxial observation. The intensity of the illuminated particles in the processed images is directly proportional to powder concentration, which is used to identify the characteristics of the PGJS.
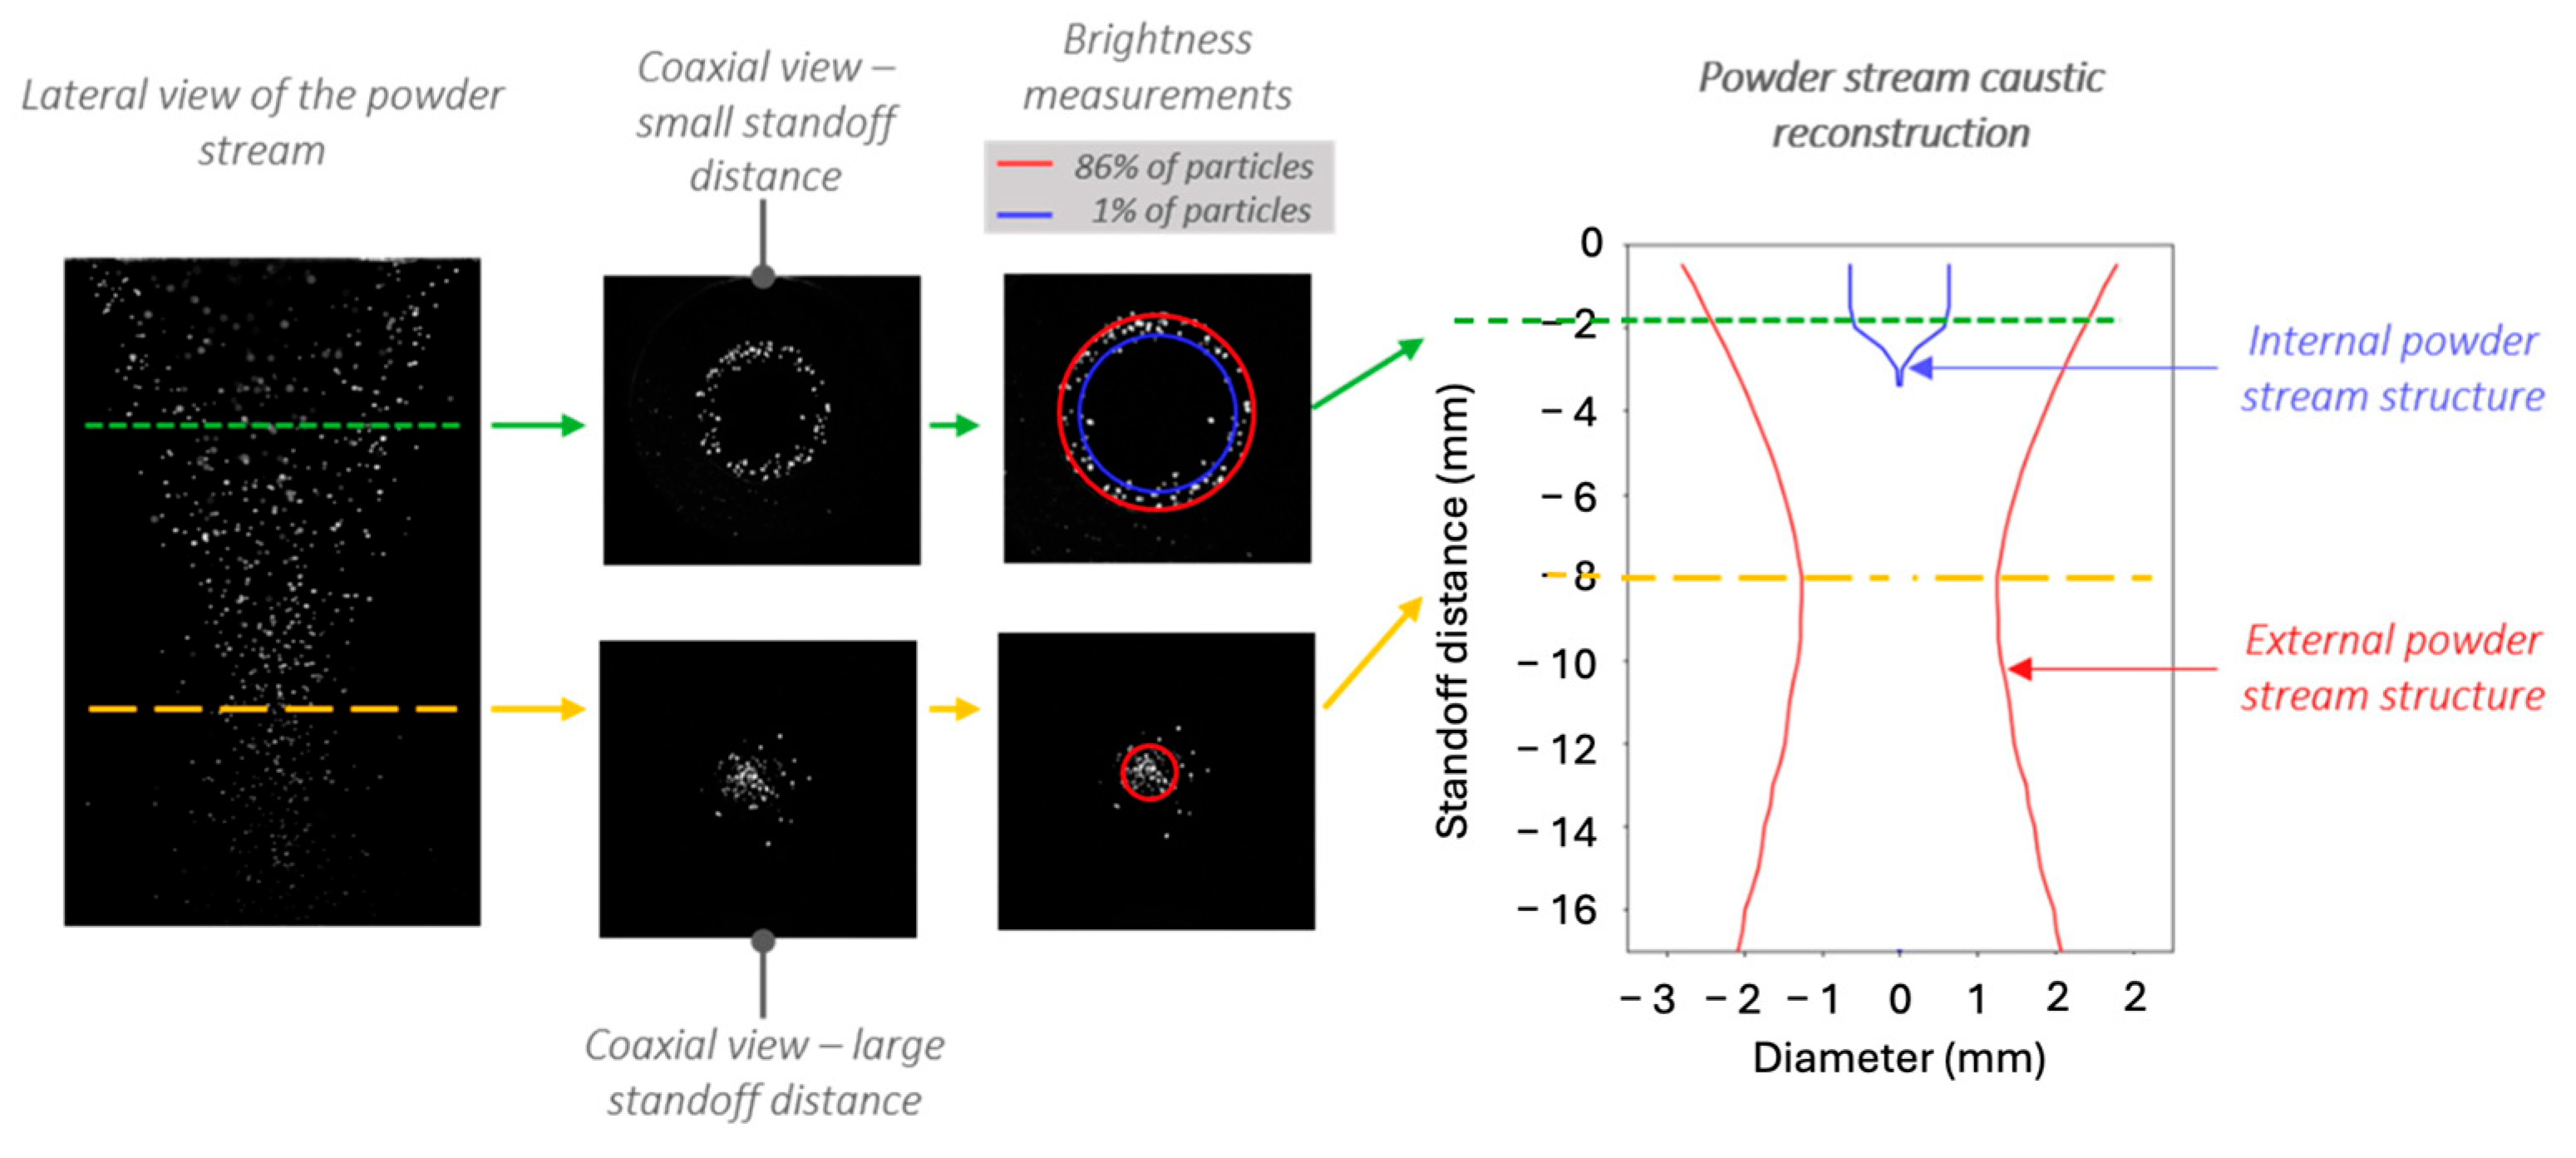
A common factor reported in the studies by the three authors is that near the nozzle exit, the powder jet exhibited an annular shape, which converged into a Gaussian profile as it approached the focal plane. A technique developed by Ferreira et al. (2020) [17] to quantify the Df, uses circles corresponding to 1% and 86% (1/e2) of the maximum intensity to represent the inner and outer boundaries of the cross-section. This method was systematically applied across axial distances ranging from 0.5 mm to 17 mm in 0.5 mm increments. This approach facilitated the reconstruction of the powder stream caustic, including its shape and convergence, as shown in Figure 19 [17].
Compared to other lateral techniques, this approach offers the advantage of a coaxial view of the powder jet’s horizontal cross-section, simplifying the acquisition of planar concentration and geometry data [19]. However, it introduces mechanical complexity, including the need for precise alignment between the mirror, nozzle, and camera, as well as requiring protection against contamination and damage.
Other studies capture the horizontal laser sheet directly with a camera positioned laterally or in front of the nozzle, without intermediate reflection. Unlike the previous method, this approach is reported in the literature by different laser thicknesses and setups, as follows:
  • Jardon et al. (2020) [10] used a 405 nm, 50 µm thick laser line, with a camera positioned in front of the nozzle. By varying the nozzle’s vertical position to scan the full powder cone and taking multiple images of the slices, the PGJS is reconstructed and the Df is calculated based on the intensity/concentration curves extracted from the image at different axial distances (see Figure 20, top left panel), and their local maxima (see Figure 20, top middle panel) are used for the shape reconstruction (see Figure 20, top right and bottom panels).
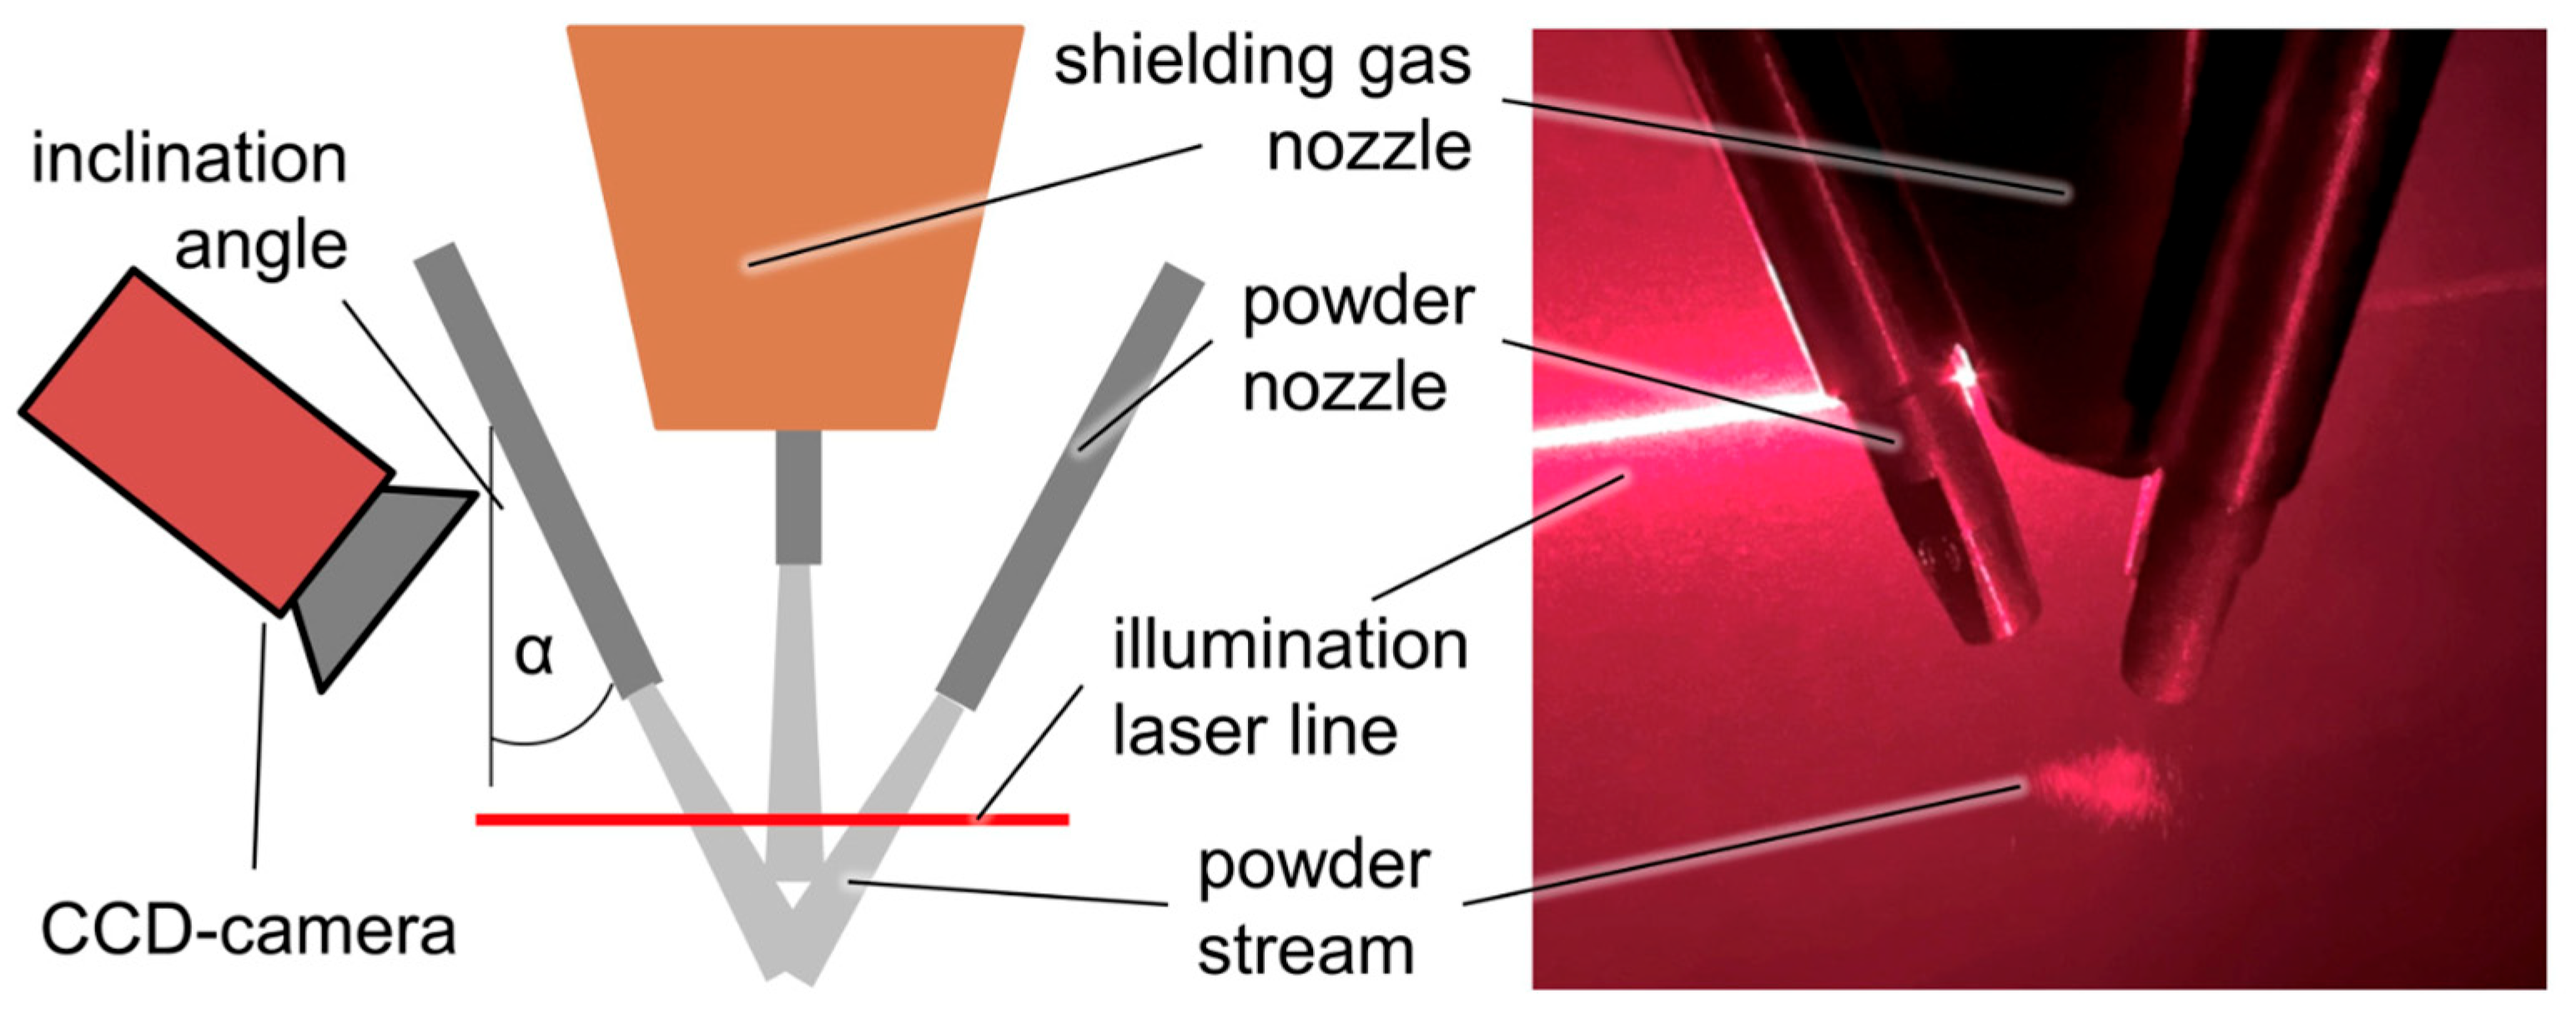
  • Bohlen et al. (2022) illuminated the powder with a 650–655 nm, 150 µm laser line, using a CCD camera mounted laterally with an inclination angle, as illustrated in Figure 21 [7].
  • The author developed a method involving image stacking and intensity analysis in concentric circles to create a radial-symmetric powder distribution profile, like the one presented by Ferreira et al. (2020) [17]. The Df is calculated as 14% of the maximum intensity measured within these circles, like the D86 method used in laser beam measurements. Furthermore, the intersection zone, where powder streams begin to merge, is identified by analysing the mean coefficient of variation (standard deviation divided by mean value) for these concentric circles, noting where this value decreases to a steady level within the smallest powder diameter region of interest.
  • Pang et al. (2025) [41] employed a 520 nm laser line (0.4 mm width) and positioned the camera at 90° to the laser beam, rotating the laser-camera assembly around the nozzle axis to assess stream uniformity in different lateral sections. The experimental setup is illustrated in Figure 22.
  • The captured images are then converted to greyscale, with the luminosity of pixels considered directly proportional to the relative density of powder particles. To determine the SOD, the greyscale values along the Z-axis (longitudinal profile) are analysed, and a Gaussian model is fitted to the data. The Z-coordinate of the highest point of this fitted curve is identified as the SOD. Subsequently, for measuring the Df, the greyscale values along the x-direction (transverse profile) are plotted and fitted, with the boundary of the powder spot precisely defined as the point where the greyscale value drops to 1/e2 of the maximum value on the fitted curve.
Despite its advantages in simplicity and no mechanical interference during measurement, it lacks the ability to obtain a true “coaxial” (XY) view or a complete 3D representation of the powder stream using a side-view camera perspective. It is necessary to capture multiple images at various axial distances and then process and computationally reconstruct them. Jardon et al. (2020) [10] highlight that this reconstruction process “significantly increases processing time” and is “computationally expensive in terms of data storage and post-processing.”

3.2.2. Coaxial Camera Configuration

In the coaxial design, a camera is mounted coaxially with the powder nozzle to provide a view along the same axis of the PGJS [19]. The laser light is directed across the powder flow, illuminating the horizontal cross-sections of the jet and enabling the camera to observe the particles. By measuring the particle density distribution on multiple horizontal layers of the PGJS, both qualitative visualisation of the overall flow behaviour and quantitative measurement of critical parameters are offered [42]. The literature describes two configurations for measuring the PGJS characteristics, classified as offline and online processing, as presented in Table 6.
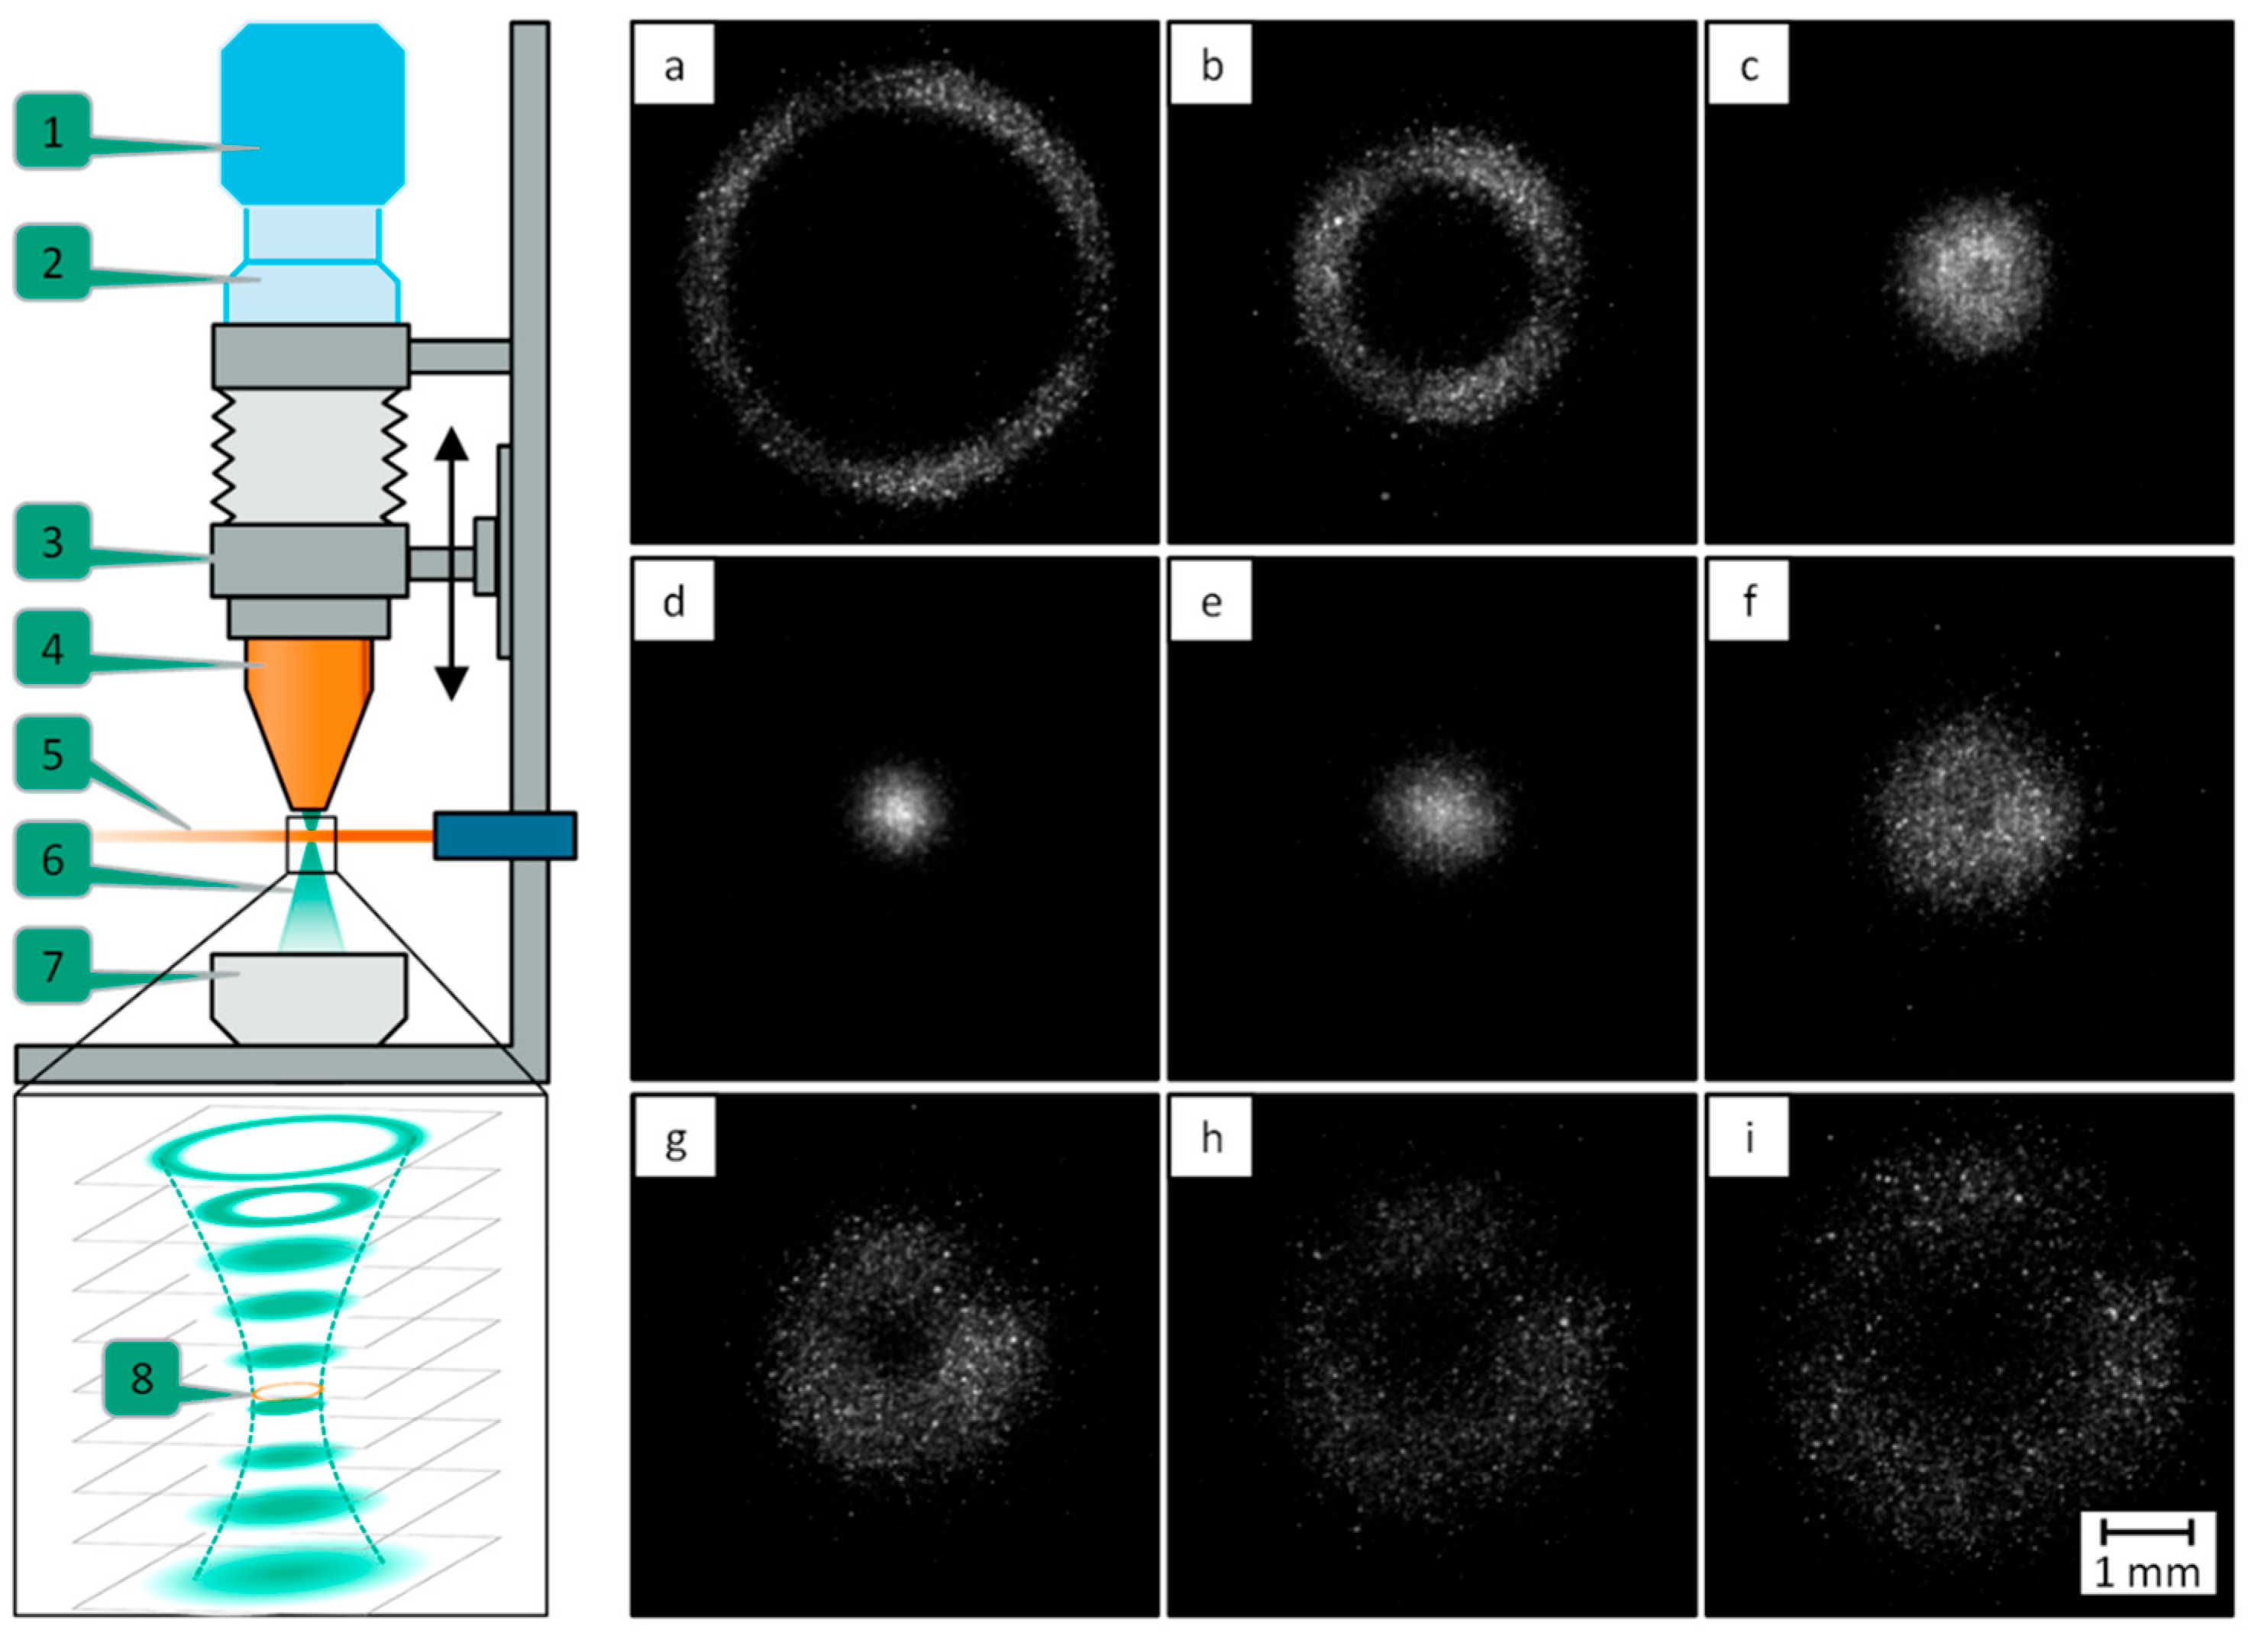
For offline characterisation, a laser-light sectioning method is employed, which was developed and patented by the Fraunhofer Institute for Laser Technology ILT. This technique involves illuminating the PGJS laterally with a horizontal laser light (wavelength of 810 nm) while a high-speed CMOS camera, positioned coaxially to the powder nozzle, captures images of the cross-sections. The system enables measurement of the number and position of powder particles level by level. The image processing technique described and used by Schopphoven et al. (2020) [19] and Brucki et al. (2023) [43] to visualise the powder distribution involves capturing and superimposing 3000 individual images per level, with greyscale values ranging from 0 to 255, revealing the PGJS annular distribution. A schematic of the system is provided in Figure 23 [43].
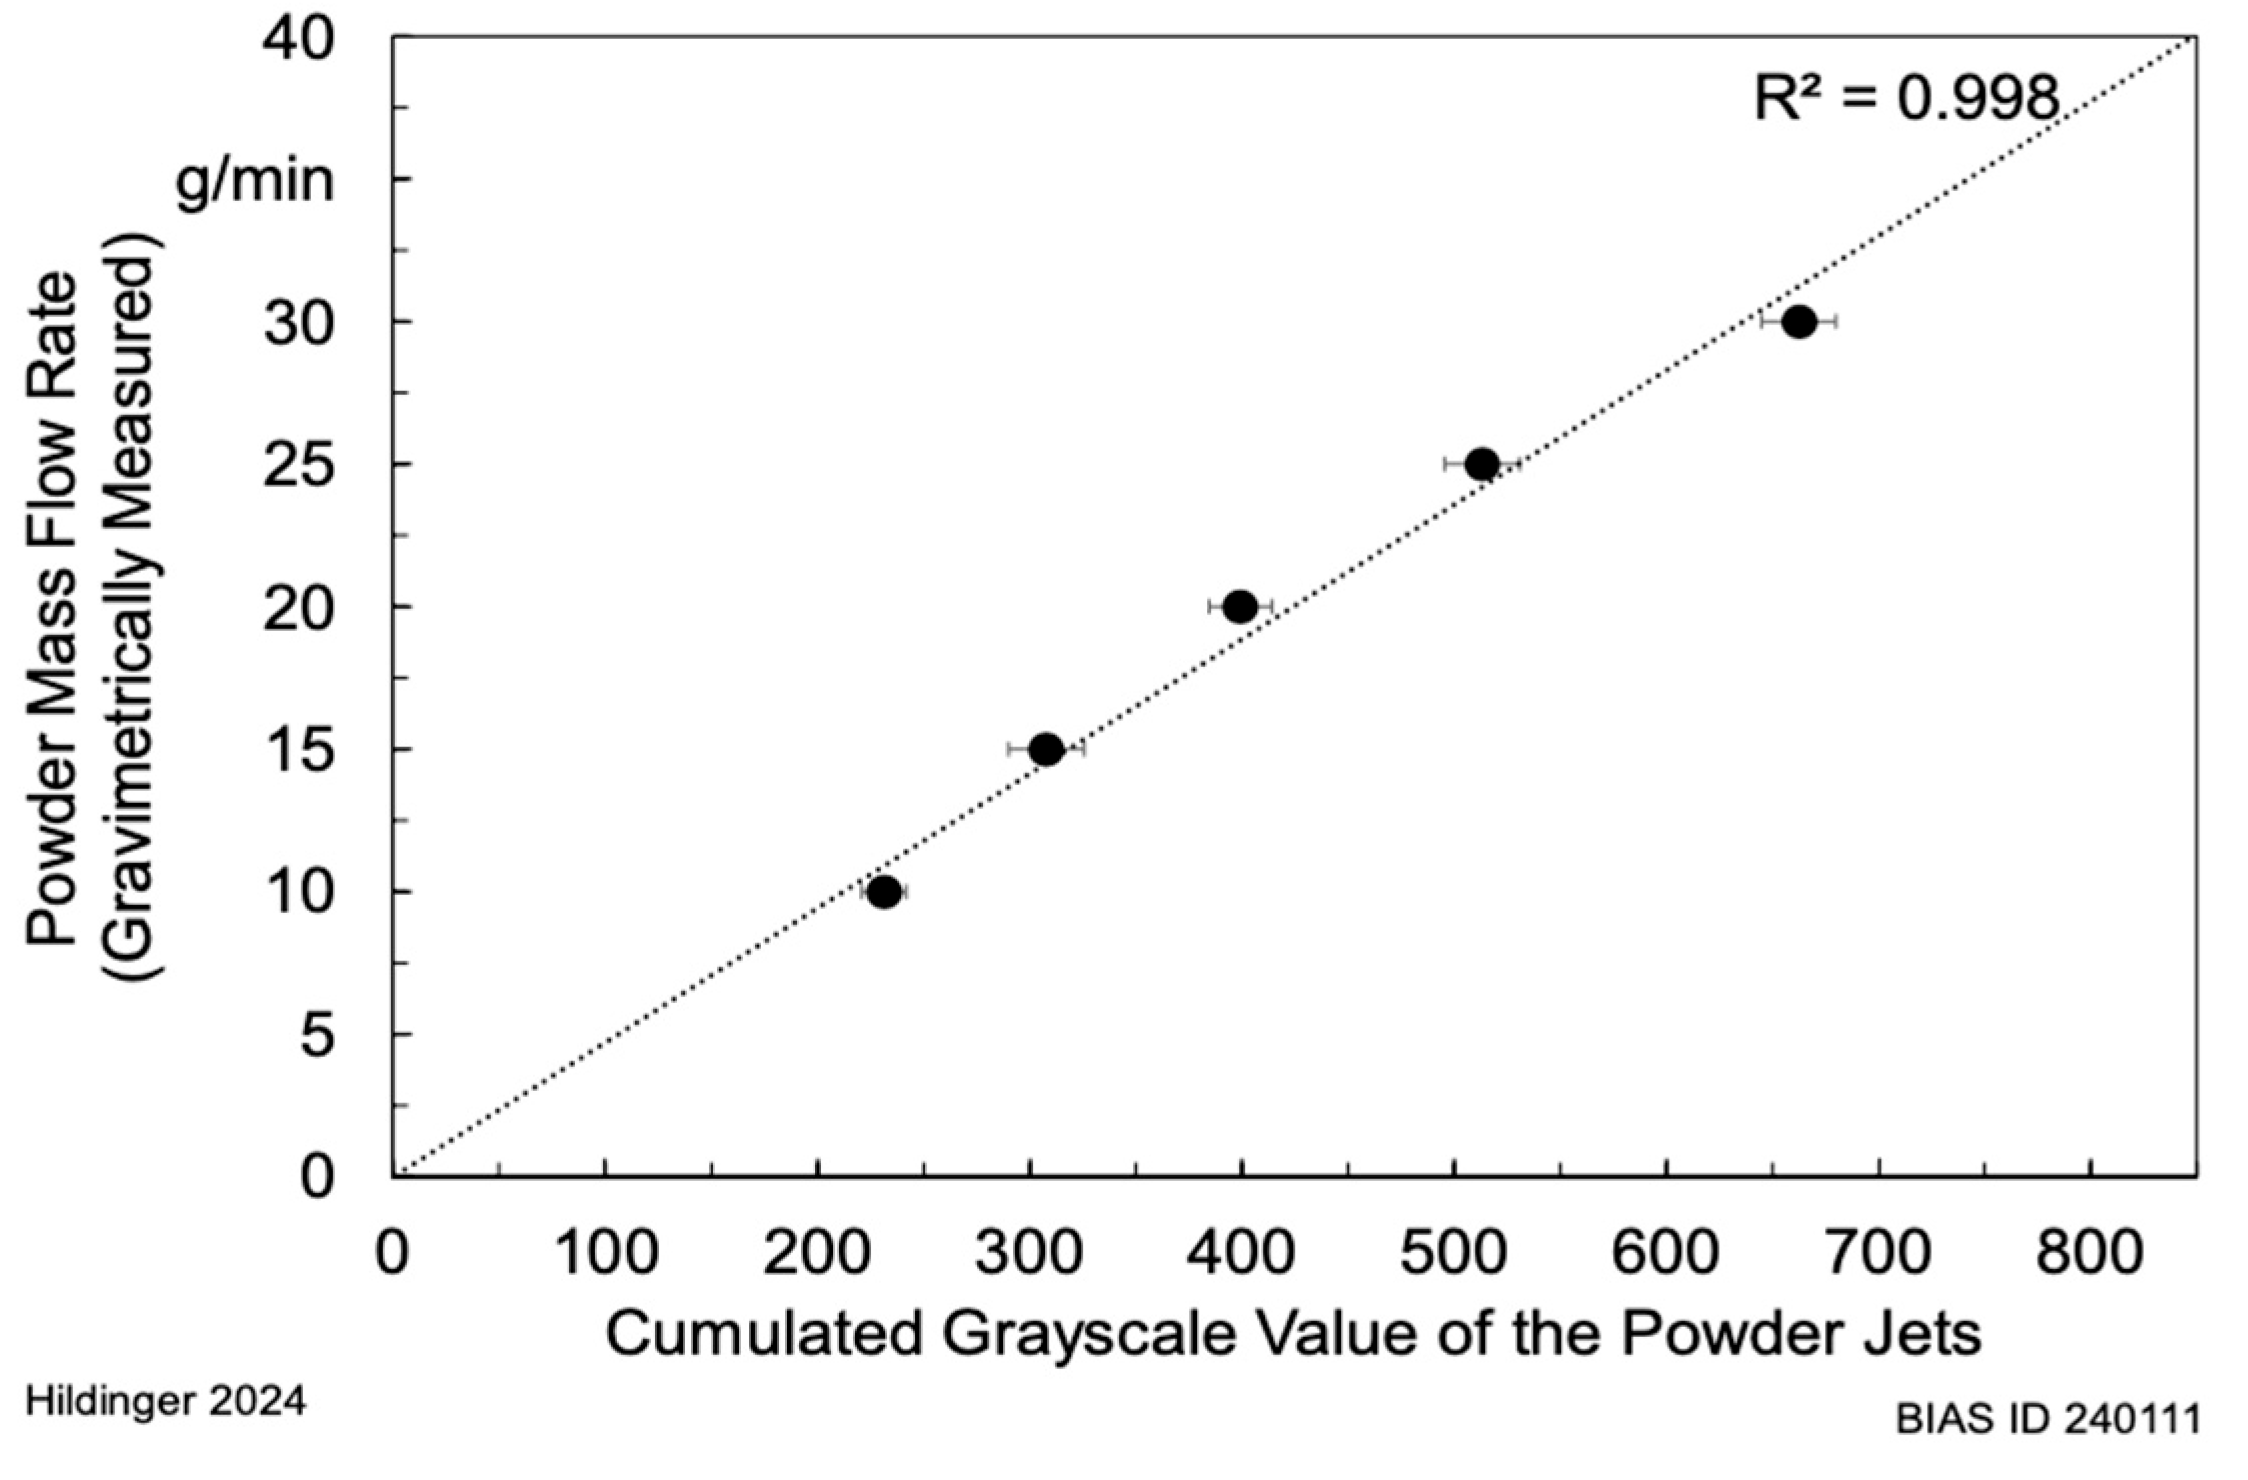
For online process monitoring of the PGJS, Hildinger [41,43] describes the implementation of another coaxial system to detect deviations on the PGJS in real time. The system detects the powder jet under the nozzle and calculates the average greyscale values of particles within it, comparing them with a powder mass flow monitor at the same time. An initial gravimetric calibration is required to correlate PMF with cumulative greyscale values using fixed camera settings, achieving a strong linear relationship (R2 = 0.998) as reported by the author and illustrated in Figure 24 [41]. Recalibration becomes necessary if significant variations in powder material, laser parameters, or PMF occur, as these factors influence particle brightness or risk camera overexposure.
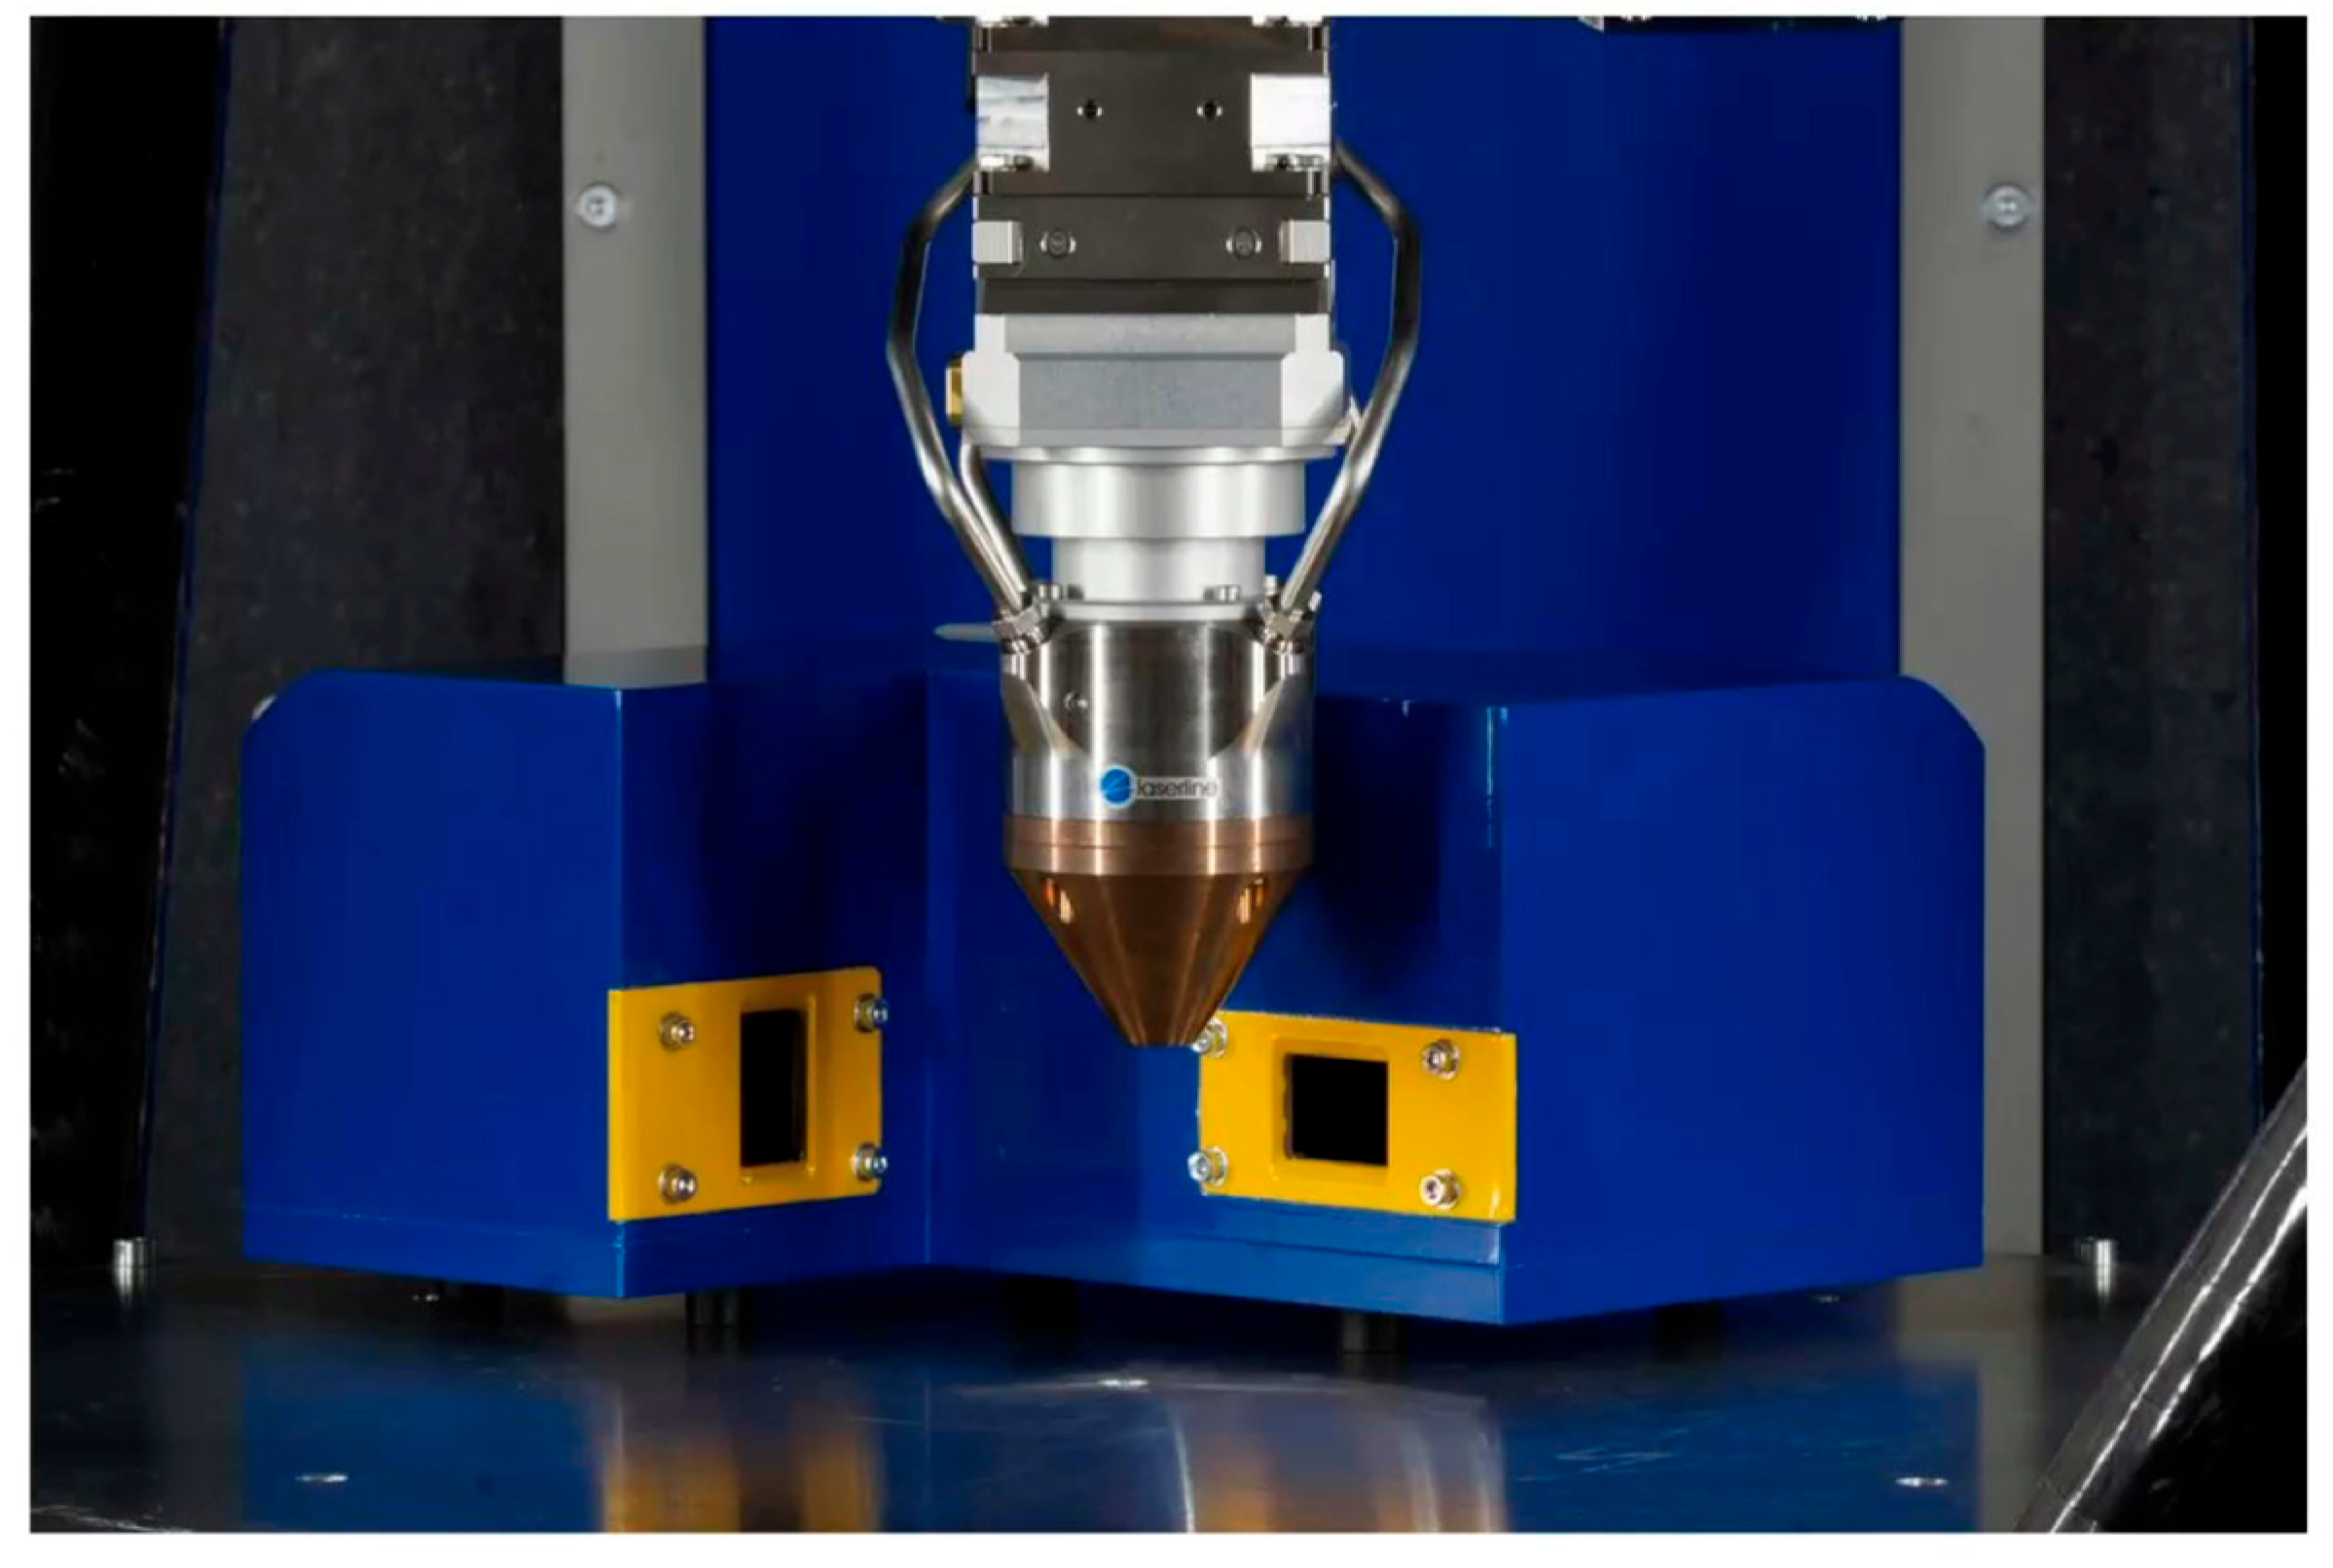
A primary challenge reported by the author to doing it, is maintaining a high contrast between the powder particles and the bright background radiation from the processing laser and melt pool. To overcome this challenge, the powder particles are illuminated by a laterally mounted line laser at a 450 nm wavelength, selected for its low optical process emissions as confirmed by spectroscopy. The back-reflected light from the powder particles is captured by the camera, which is equipped with three stacked 450 nm narrow-band bandpass filters (full width at the half maximum (FWHM) ± 10 nm), to attenuate the melt pool radiation and block other wavelengths. These filters, with an optical density greater than 5 outside the central wavelength, block over 99% of unwanted visible spectrum radiation, ensuring clear differentiation between reflective powder particles, background and melt pool illumination [44]. While optical filtering is central to managing process emissions, specific strategies for window contamination management in the optical system are not detailed, with particle adhesion challenges primarily affecting the nozzle rather than the camera window. This optical setup facilitates the monitoring of individual jets, as illustrated in Figure 25.
Although this method provides a quantitative determination of the number and position of particles within the PGJS, mapping the powder density distribution and creating an explicit representation of the powder jet, particle–particle shading at higher densities can distort the measured particle count, limiting accuracy at certain levels [19]. Furthermore, the complexity of implementing a coaxial system is significantly higher and more costly compared to other techniques, due to the need for specific optical filtering and precise camera adjustments to achieve sufficient contrast [42,44], as well as the expense of installing the system within the machine. These specific requirements result in a solution that is typically limited to a single machine, either as a stand-alone system or as an expensive installation with high costs associated with cameras, lasers, and filters.

3.3. Commercial Equipments

The range of commercial systems available for measuring PGJSs is relatively limited and is dominated by camera-based technologies. This section provides an overview of these systems, based on the available literature, to highlight their configurations and the image processing methods they utilise.
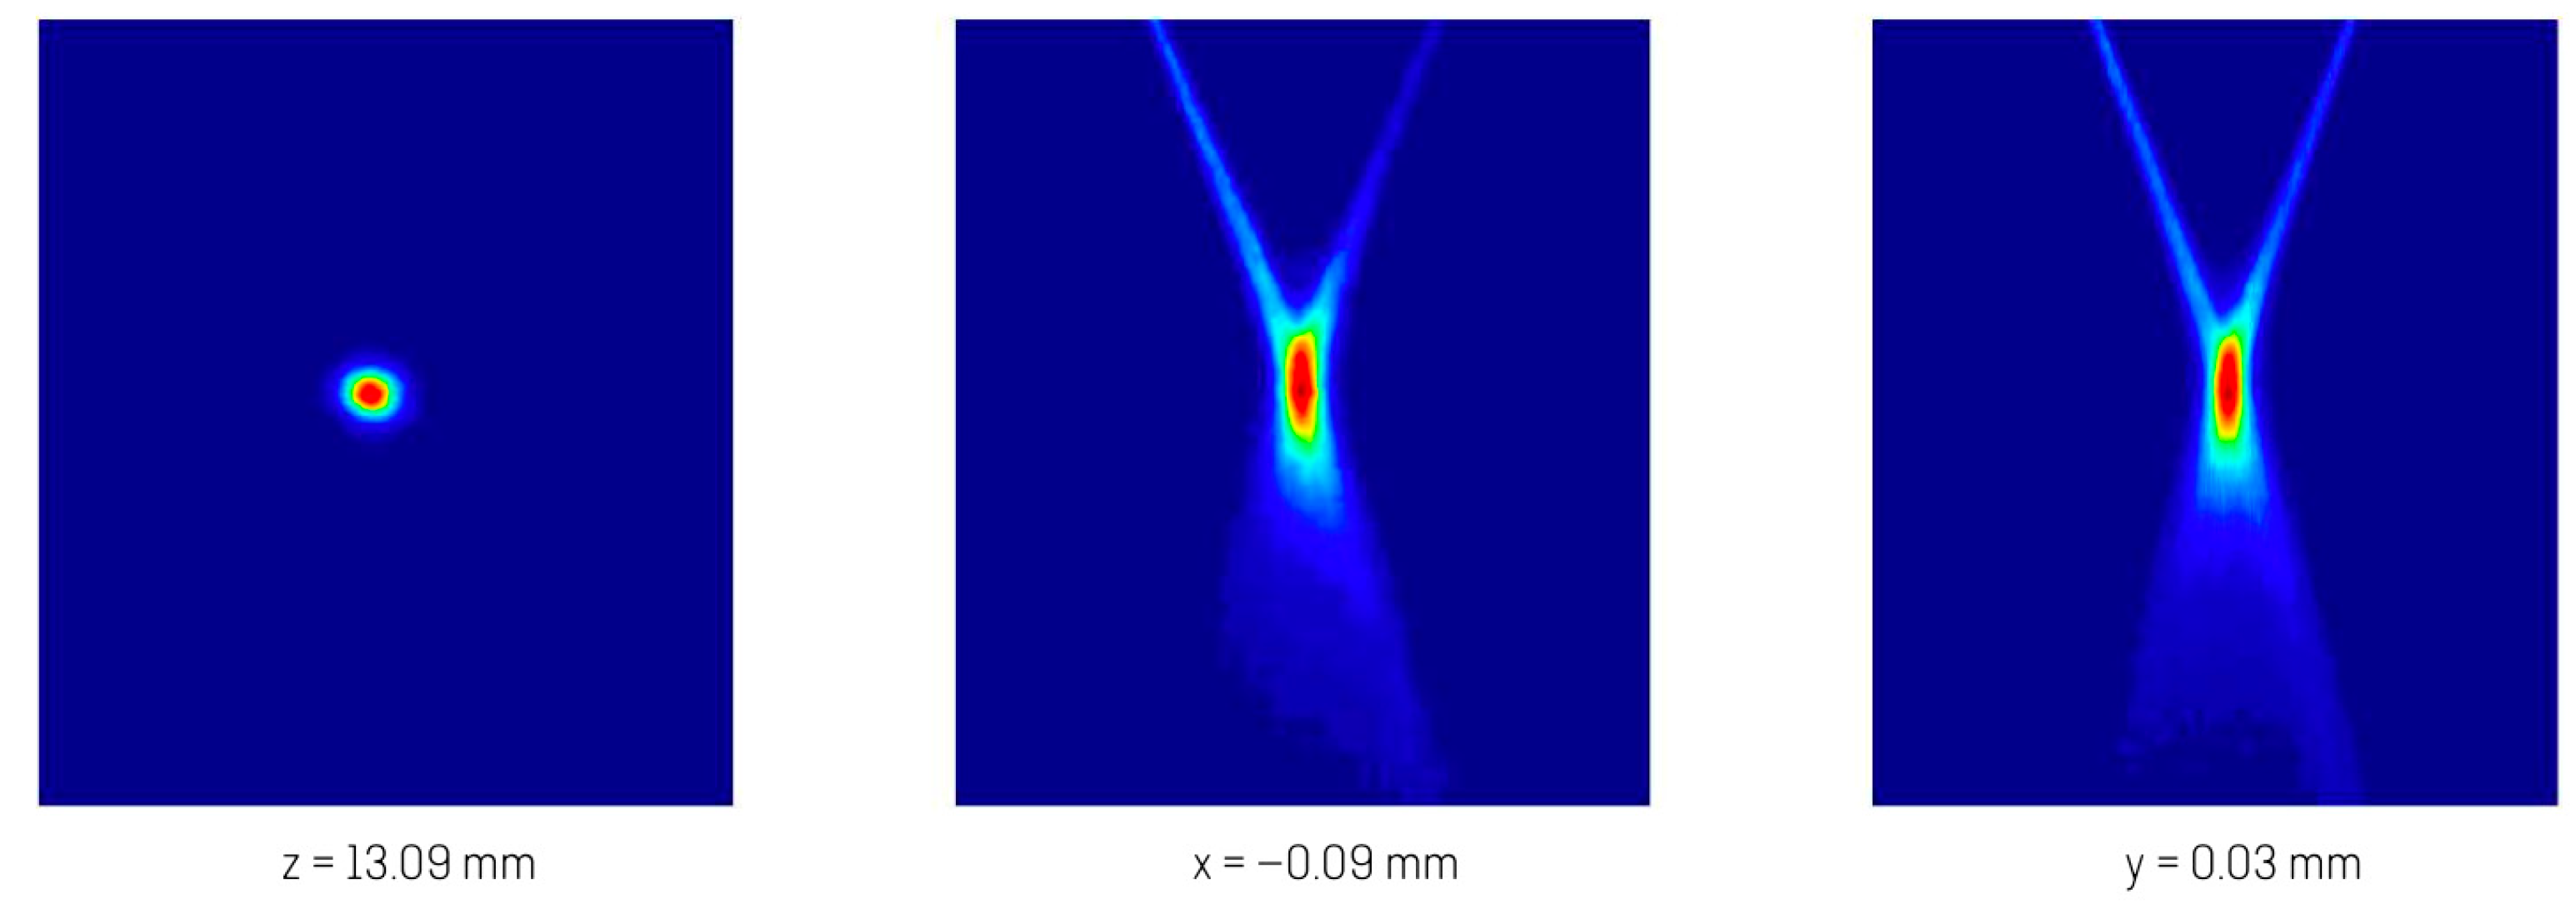
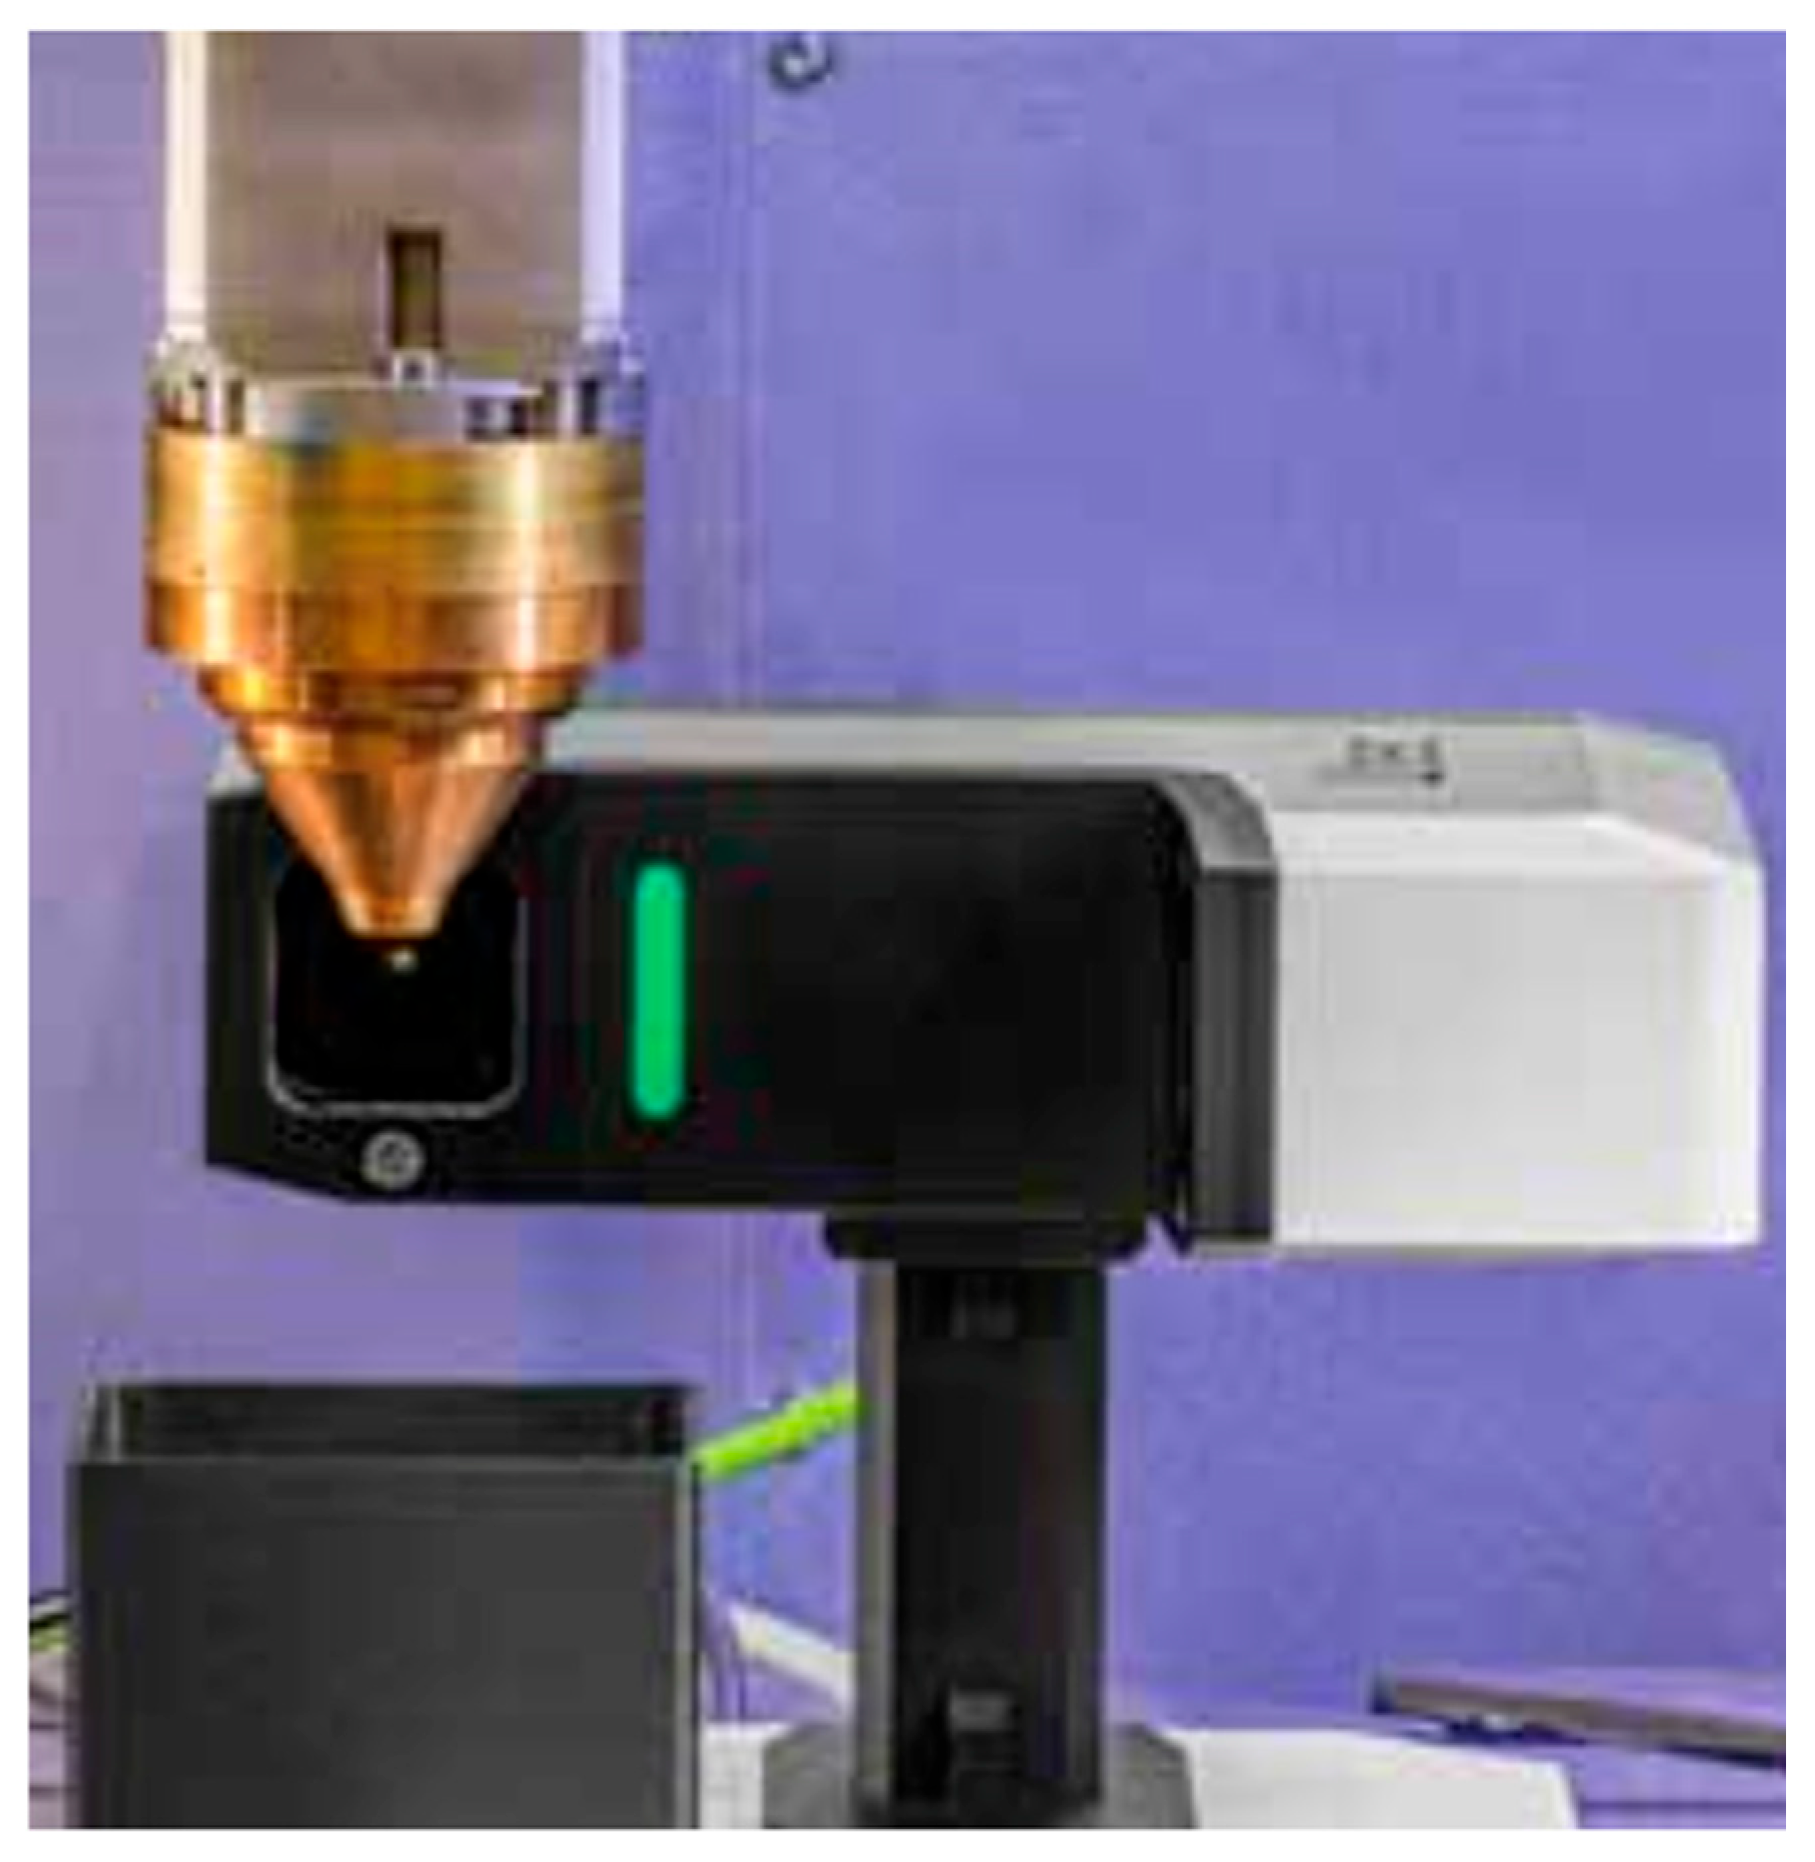
PowderSpy from Ponticon [45], shown in Figure 26, is a portable system designed for measuring and analysing PGJS, offering flexible and efficient measurement capabilities. No installation on the machine is needed for the equipment, which utilises a lateral camera configuration with a 20 µm wide vertical line illumination laser operating at a 405 nm wavelength to illuminate the powder particles. The laser is mounted on top of a linear axis inside the device, and during the measurement, the laser line moves along a predetermined spatial direction while a CMOS camera captures images of the illuminated particles for processing by the image processing algorithm.
After the measurement is completed, an intensity map is created based on the powder density captured within the PGJS, which is then used to calculate the SOD and Df. According to the report in [46], a 1D 86% algorithm is employed to determine these characteristics. Although not described in detail in the literature, this technique is commonly used for calculating laser caustics, where the region containing the highest 86% intensity is used to specify the focal point’s characteristics. Section 4.2 of this review discusses this technique further. By integrating these calculations, the PGJS geometry image is produced along with cross-sectional views of the powder jet. An example of the PGJS profile and cross-section is illustrated in Figure 27.
Similarly, the LIsec system developed by Fraunhofer IWS [47] also features a lateral configuration, with an integrated vertical laser line illumination of 50 µm width and a camera. Unlike the previous system, the camera and laser move together along the linear axis on the system’s base, as shown in Figure 28.
By scanning the area beneath the nozzle, powder density distributions are measured through brightness intensities using image processing algorithms, and the planes are analysed to reconstruct the PGJS. By examining the distribution of particles in the powder jet, information such as the powder beam’s homogeneity and symmetry can be extracted and used to visualise the powder focus extension and cross sections, as illustrated in Figure 29. No further information was found in the literature regarding the algorithm employed, nor about the application of the system for qualifying PGJS from different nozzles under varying processing conditions to assess and report on the system’s properties and sensitivity in identifying variations in the PGJS.
A comparison between both systems is provided in Table 7.
PowderSpy relies on a fixed setup and browser-based interface to provide spatial distribution of the PGJS, offering portability and straightforward deployment. In contrast, LIsec employs a co-moving scanning strategy that allows machine integration, enabling manual or software control, which facilitates process integration. Despite these strengths, the absence of open benchmarking remains a significant gap for standardisation. Without a common framework defining test conditions, evaluation metrics, algorithms, and reporting practices, direct performance comparison between such systems remains limited. This emphasises the need for transparent and standardised evaluation methods that support robust performance assessments.
Another commercial option already mentioned in this paper is the coaxial system developed and patented by Fraunhofer ILT [48]. This system utilises a laser light-sectioning method supported by an analytical instrument as illustrated in Figure 23. This approach enables measurement of the powder particle density distribution across various grain fractions, powder mass flows, and CG and SG settings. According to Schopphoven et al. [19], the image processing system works by superimposing thousands of individual images. This process enables the observation of shape variation at various axial distances from the nozzle tip. The collected data facilitate the approximation of powder particle velocities and the development of statistical models for particle trajectories and density distributions. This includes determining the powder density distribution and particle diameters per plane, as well as the spatial position and propagation of the PGJS focus.
Despite the availability of these commercial systems and measurement devices, no documents were found in the literature that directly compare or comprehensively assess their performance and capabilities. Furthermore, there remains a significant gap due to the absence of an established standard metric or methodology to consistently perform and evaluate these measurements. Addressing these gaps can lead to advancing the reliable qualification and characterisation of PGJS monitoring systems.

4. Discussion and Future Direction

4.1. Synthesis and Interpretation—Weight-Based Methods

The studies found in the literature for measuring the characteristics of the PGJS by weight-based methods involve common steps, from experimental data acquisition to the identification of characteristics of the powder jet and parameter estimation. The core of the principle involves measuring the powder mass passing through a small aperture at various spatial positions of the powder jet, both axial and radial, and using these measurements to reconstruct the powder distribution across the PGJS.
To collect the powder, the nozzle is positioned on top of the measurement equipment, which typically consists of either a plate with a central pinhole [14] or a set of cylindrical containers with concentric holes [15,16], with a precision scale underneath to measure the powder passing through. The distance between the nozzle and the measurement plane is precisely adjustable, and the measurement is performed at multiple vertical and horizontal distances to capture the 3D behaviour of the PGJS [14]. To ensure the data reliability, the powder mass flow rate needs to be calibrated, and the coordinates where the collection equipment is placed must be known, as the method depends on the mass flow of powder collected over a recorded set of times in each position of the jet.
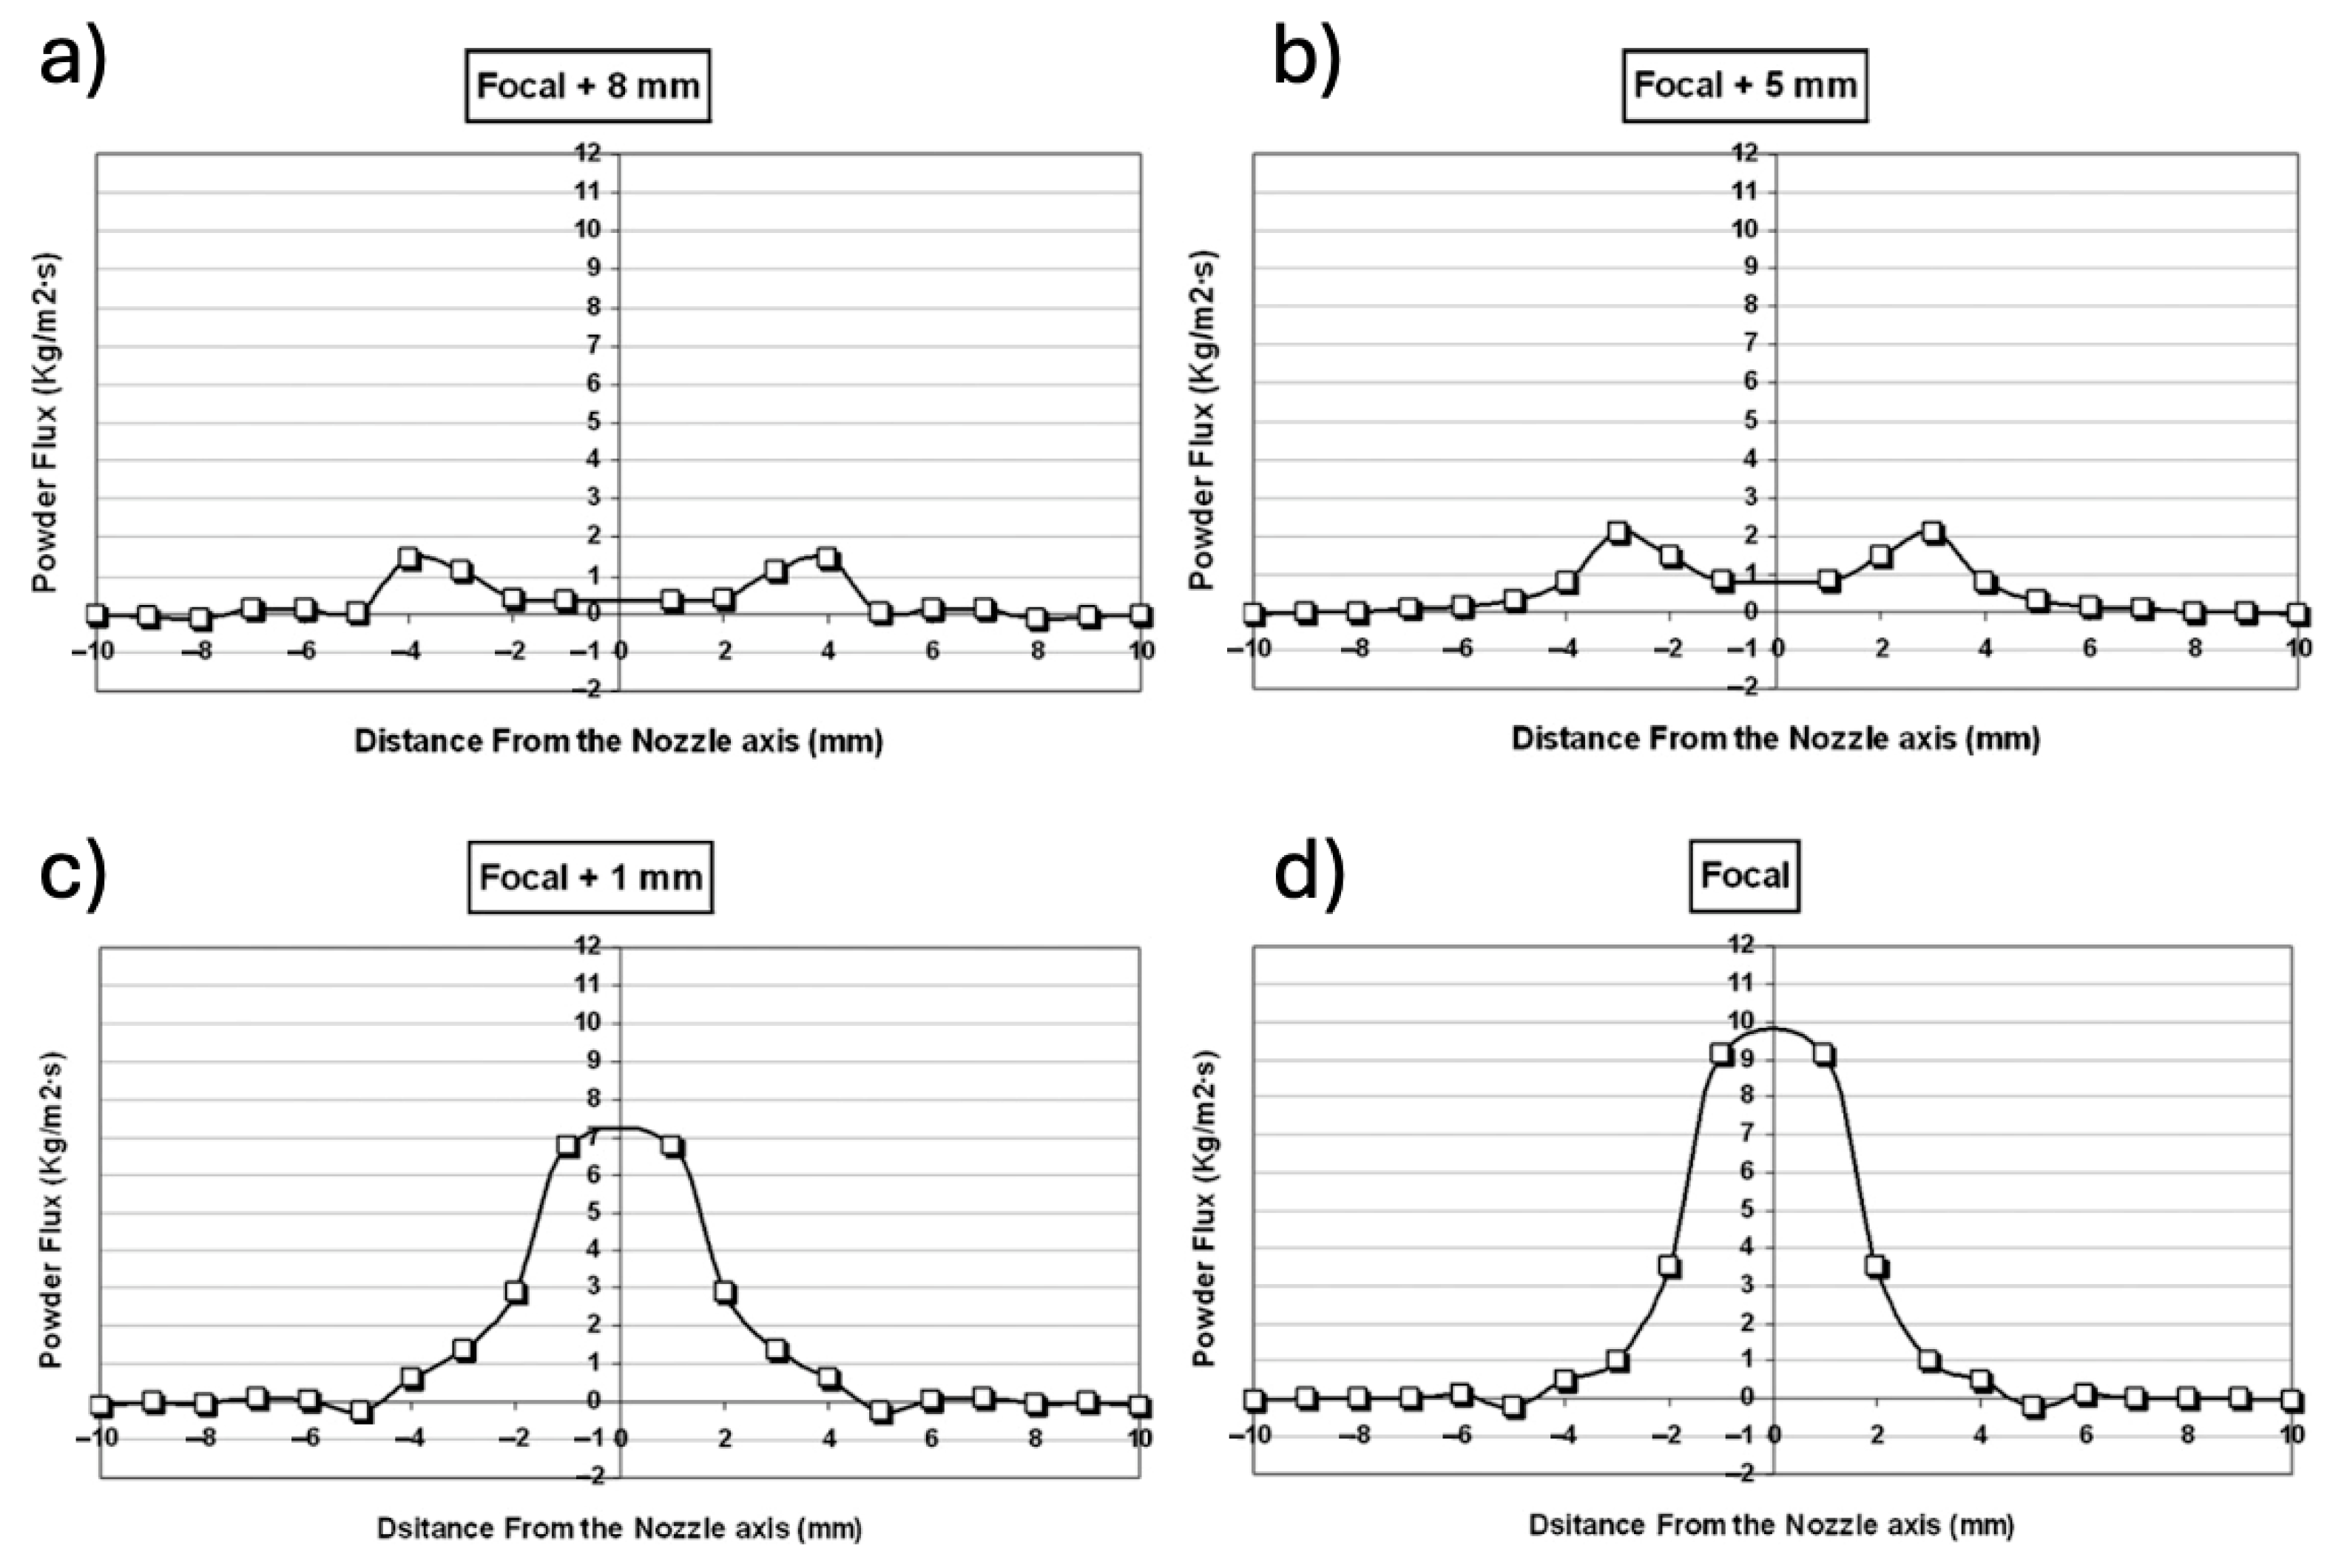
To estimate the parameters of the powder jet, such as SOD, Df, and symmetry, the powder flow density at each measured plane is combined to create a volumetric dataset and fitted to a statistical distribution model, such as the Gaussian curve [14]. The visualisation of the powder flow density throughout the PGJS is obtained by plotting the slices from the volumetric dataset, showing the intensity distribution of the particles at each vertical and horizontal position and how the powder jet behaves at each. This allows observation of distinct concentration zones, such as annular (see Figure 30a,b), transition (see Figure 30c), and Gaussian zones (see Figure 30d) [15,16].
Based on the volumetric distribution and the properties of the fitted Gaussian curve, the intersection zone is determined as the narrowest area of the powder jet, indicating also that the powder catchment of the container is maximised. The Df is determined as the diameter size at the SOD position. By assessing and evaluating visually the fitted Gaussian distribution, it is possible to detect non-uniformities and off-centre alignment of the powder jet, which indicate irregular accumulation of powder in a specific region [14]. Also, experimental observation of the powder distribution that does not conform to the expected Gaussian or annular profiles in specific zones indicates a breakdown of proportionality [15].
The method proves to be a suitable alternative to optical techniques when operating at high powder flow rates, ranging between 50 and 100 g/min, as reported by Bedenk [13]. The author reports that, under these conditions, particle tracks become indistinguishable in optical images due to particle overlap and merging, rendering automatic image processing unfeasible. This dense overlapping behaviour limits the effectiveness of optical methods that depend on tracking individual particles and highlights the benefit of integrated approaches like powder collection and optical [13].
Quantitative data of the PGJS can be obtained using this method; however, the literature reports the uncertainties and complications associated with it. As an example, the synchronisation between time and position can be challenging at industrial CNC machines, as they are not always coupled with measurement systems, requiring external sensors for the data collection and specific algorithms for data correlation [14].
The accuracy of high-precision scales can also be compromised when the measurement is performed dynamically. The design of the powder collection systems also introduces challenges for the measurement procedure. The actual effective area of a pinhole that is used for powder collection is smaller than its geometric area due to the particle rebound effect at the edges, requiring some adjustments for accuracy calculations [14]. Additionally, the design of the collection system, including sharp edges and a flexible connection to an open container, is essential to minimise airflow disturbance and prevent particle losses. Using a closed container or excessively long tubing can cause pressure buildup, significantly reducing the amount of powder collected [15,16].
Furthermore, different powder materials can exhibit different flow distributions even with identical input variables, due to variations in surface tension, density, and other powder properties. This influences the development of a broad, material-agnostic description of the PGJS using the method without focusing on specific material properties [15]. Moreover, weight-based methods are inherently intrusive, requiring direct contact between the container and powder jet for powder collection, which can disturb the flow and introduce errors due to particle rebounding or flow disruption [13].
While weight-based methods are robust for determining total mass flow, they lack the detailed analysis capabilities of camera-based techniques in measuring powder flow dynamics. Moreover, currently there are no commercial measurement systems available that use weight-based techniques specifically for characterising the PGJS. In contrast, optical methods offer a non-intrusive approach that does not disturb the powder stream and enables measurement of particle concentration, velocity fields, and trajectories in multiple dimensions, providing a more comprehensive understanding of the flow behaviour [20,38,40]. The next sections of this work address the findings in the literature of works exploring camera-based systems for measuring the PGJS, including the commercially available systems.

4.2. Synthesis and Interpretation—Camera-Based Methods

Although the methods of measuring the PGJS through camera-based systems vary in terms of setup, the general logic behind them are similar. Based on the literature records, the main steps of measurement in those systems are raw image data acquisition; pre-processing steps to clean and prepare the images; feature extraction and analysis to obtain specific characteristics of the powder jet; as presented by the flowchart in Figure 31.
To capture the images, CCD or CMOS cameras are predominantly used [7,20,29,31,36,40,44], with a wide range of frame rates, which are dependent on the phenomena being observed and analysed. For instance, in studies focusing on the overall structure of the powder jet, such as shape, powder density distribution, SOD and Df, lower frame rates (e.g., 30 fps, 60 fps, 200 fps, 500 fps) are utilised. This choice is justified by the reliance on the representative powder distribution formed over time through superimposed images. In contrast, higher frame rates (e.g., 8000 fps, 10,000 fps) are employed for detailed particle tracking and velocity measurements to capture the particle movement between the frames.
The illumination source is utilised primarily to create a strong contrast between the powder particles and the background, ensuring clear visibility for the overall PGJS. For all the illumination setups, such as area and linear (vertical and horizontal), it is assumed that the light attenuation or scattering detected by the camera is linearly proportional to the particle concentration (given in kg/m3), according to Mie’s theory [10,49]:
L   =   I ref   ·   r 2 A = I inc   ·   n   ·   V k 2   ·   A   ·   F   ( ξ ,   φ )
Table 8 shows the description and units of each parameter of the equation, where the average luminance (L) of a scattering element is proportional to the reflected light intensity (Iref) observed at a distance (r), which results from the number of particles (n) contained within a given volume (V). This relationship depends on the incident light intensity (Iinc), the wave number (k), a dimensionless function (F) that accounts for particle orientation and the polarisation state of the incident light, and the projected area (A) of the scattering volume.
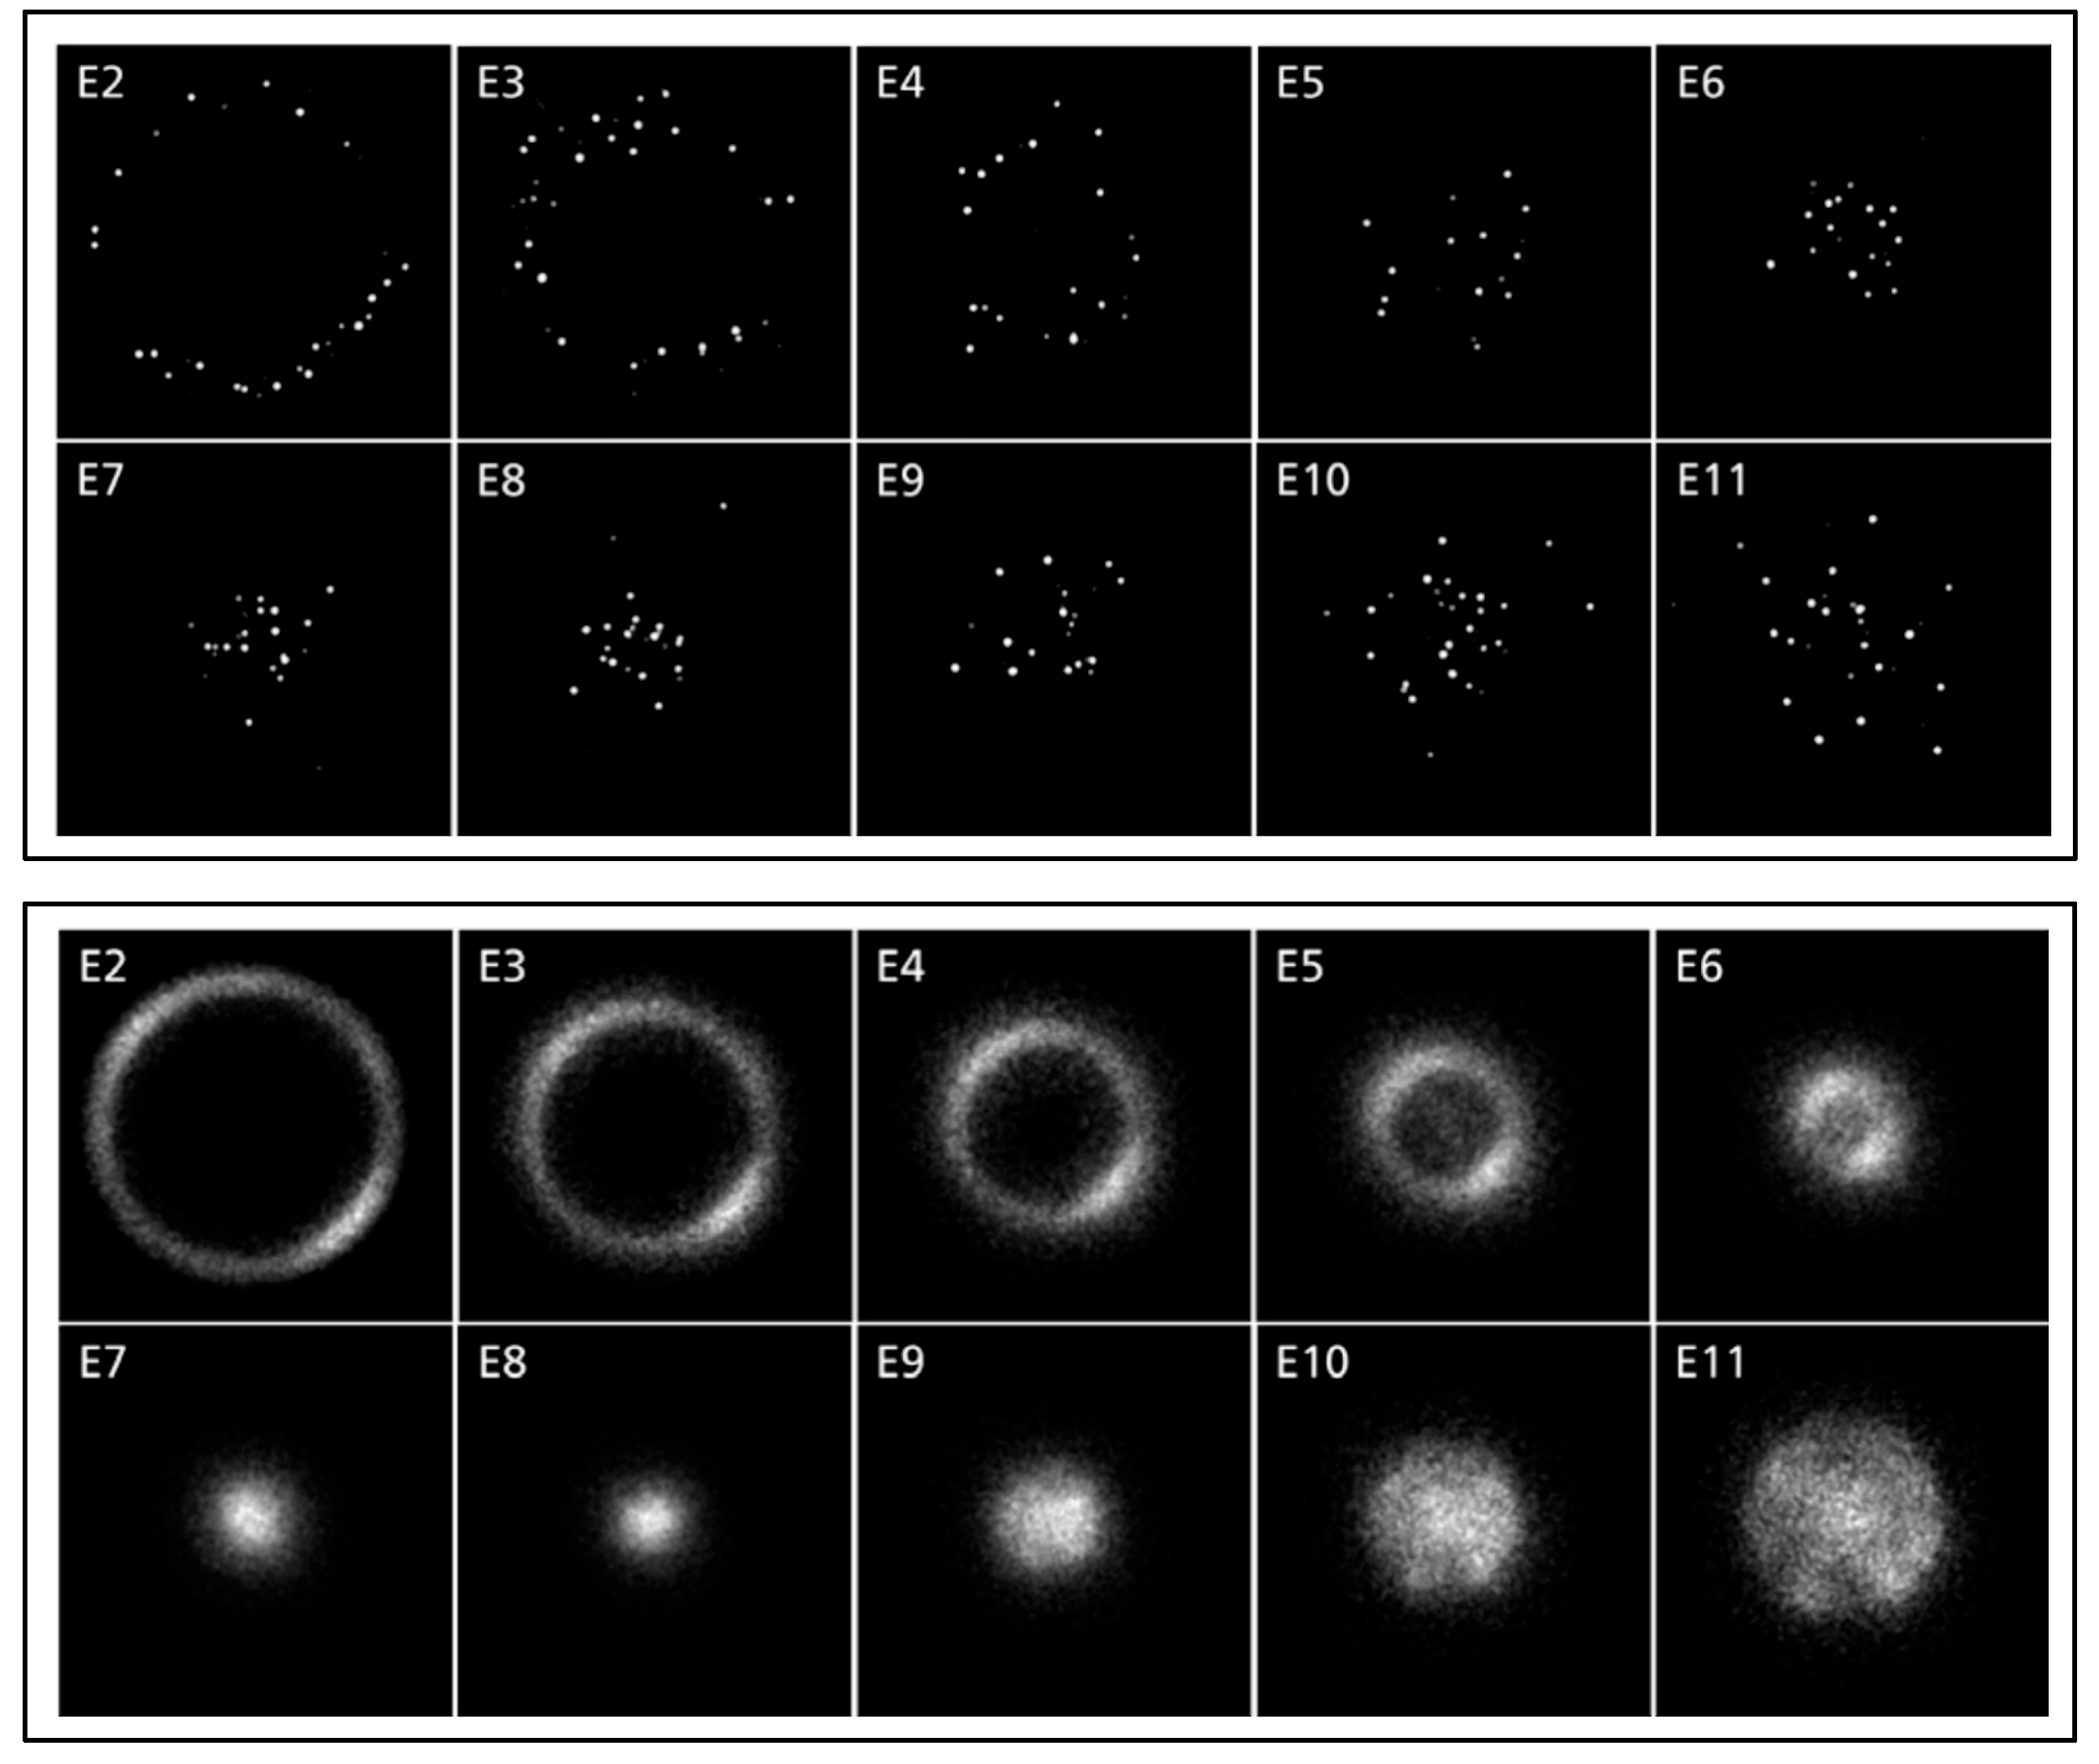
Once the images of the powder jet are captured, static elements, such as the nozzle and background, are subtracted from the images to enhance the contrast and focus only on the particles [23,24,34]. These images are superimposed by capturing multiple frames (e.g., 100, 1000, or 3000 frames) to compensate for fluctuations in the powder jet and obtain a stable and representative image of the distribution over time. This enables the analysis of the powder shape by reducing the discrete nature of the recorded images, facilitating a more detailed assessment of the powder distribution [7,9,10,19,34,43], as shown in Figure 32.
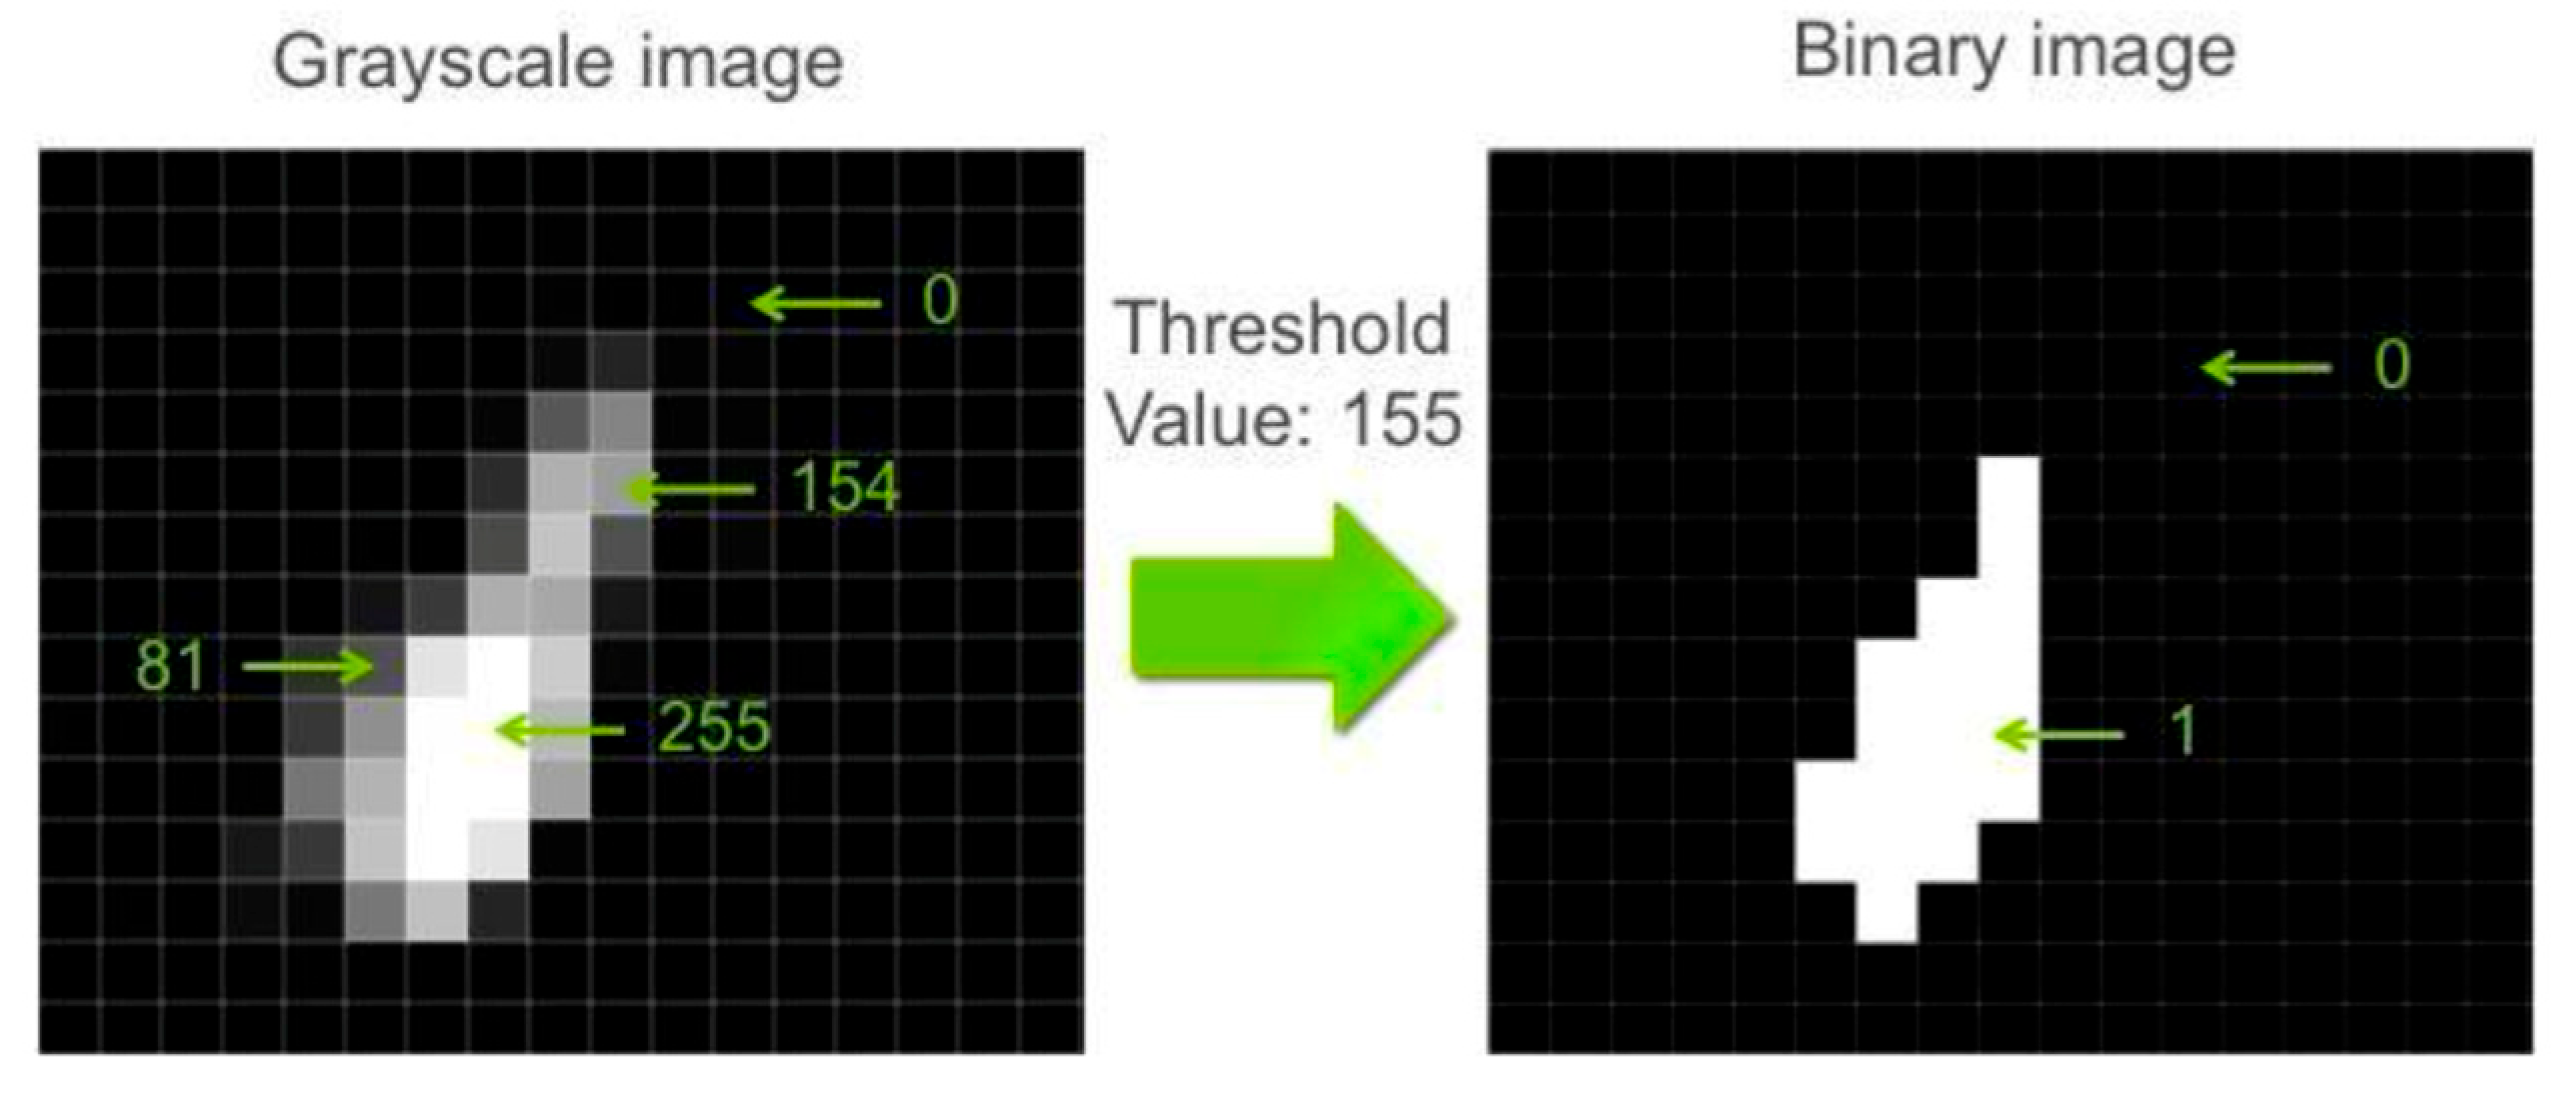
To simplify the analysis, the images are recorded in greyscale, in which the pixel luminosity, or brightness, is mapped to represent the relative powder concentration, with brighter areas indicating higher concentration. A filter technique reported in the literature is used to improve image quality by converting the image into a binary image, where pixels are either black or white. This conversion helps in the identification of individual particles [10]. Pixels are set to white above a threshold value and black below it, as shown in Figure 33 with a threshold value of 155.
A technique used to define the threshold of the image cited by Lopes-Martines et al. [26] is by using Otsu’s method. The method’s algorithm iteratively tests all possible threshold values and selects the one that maximises the inter-class variance, or equivalently, minimises the intra-class variance. For a given threshold t1, the method divides the image pixels into two classes: those with intensities below or equal to t1 and those above it. The mean intensity and probability of each class are computed based on the image histogram, and the threshold that yields the maximum separation between class means is selected, which allows a consistent detection and quantification of particles [50]. Various filtering techniques are reported in the literature and used depending on the study purposes. Garcia-Moreno et al. [31] presented a method for measuring the particle’s velocity by applying an adaptive sharpening filter to highlight the particles. Warneke et al. [23] used Kalman filters to track the particles within the powder jet.
Moreover, a selection of specific areas of the images, such as individual layers of the powder jet or the overall stream, is performed to reduce the computational load and avoid interference from non-relevant areas to the analysis [44]. Homography matrices, a common mathematical transformation used to correct the perspective of the image, are employed to transform distorted images into an undistorted view, enabling PGJS geometry correction, especially when a lateral observation at an angle is performed [7]. Pixel dimensions are converted to real-world units, such as millimetres, using scaling factors determined through calibration [7,34].

Estimation of Powder-Gas Jet Stream Characteristics

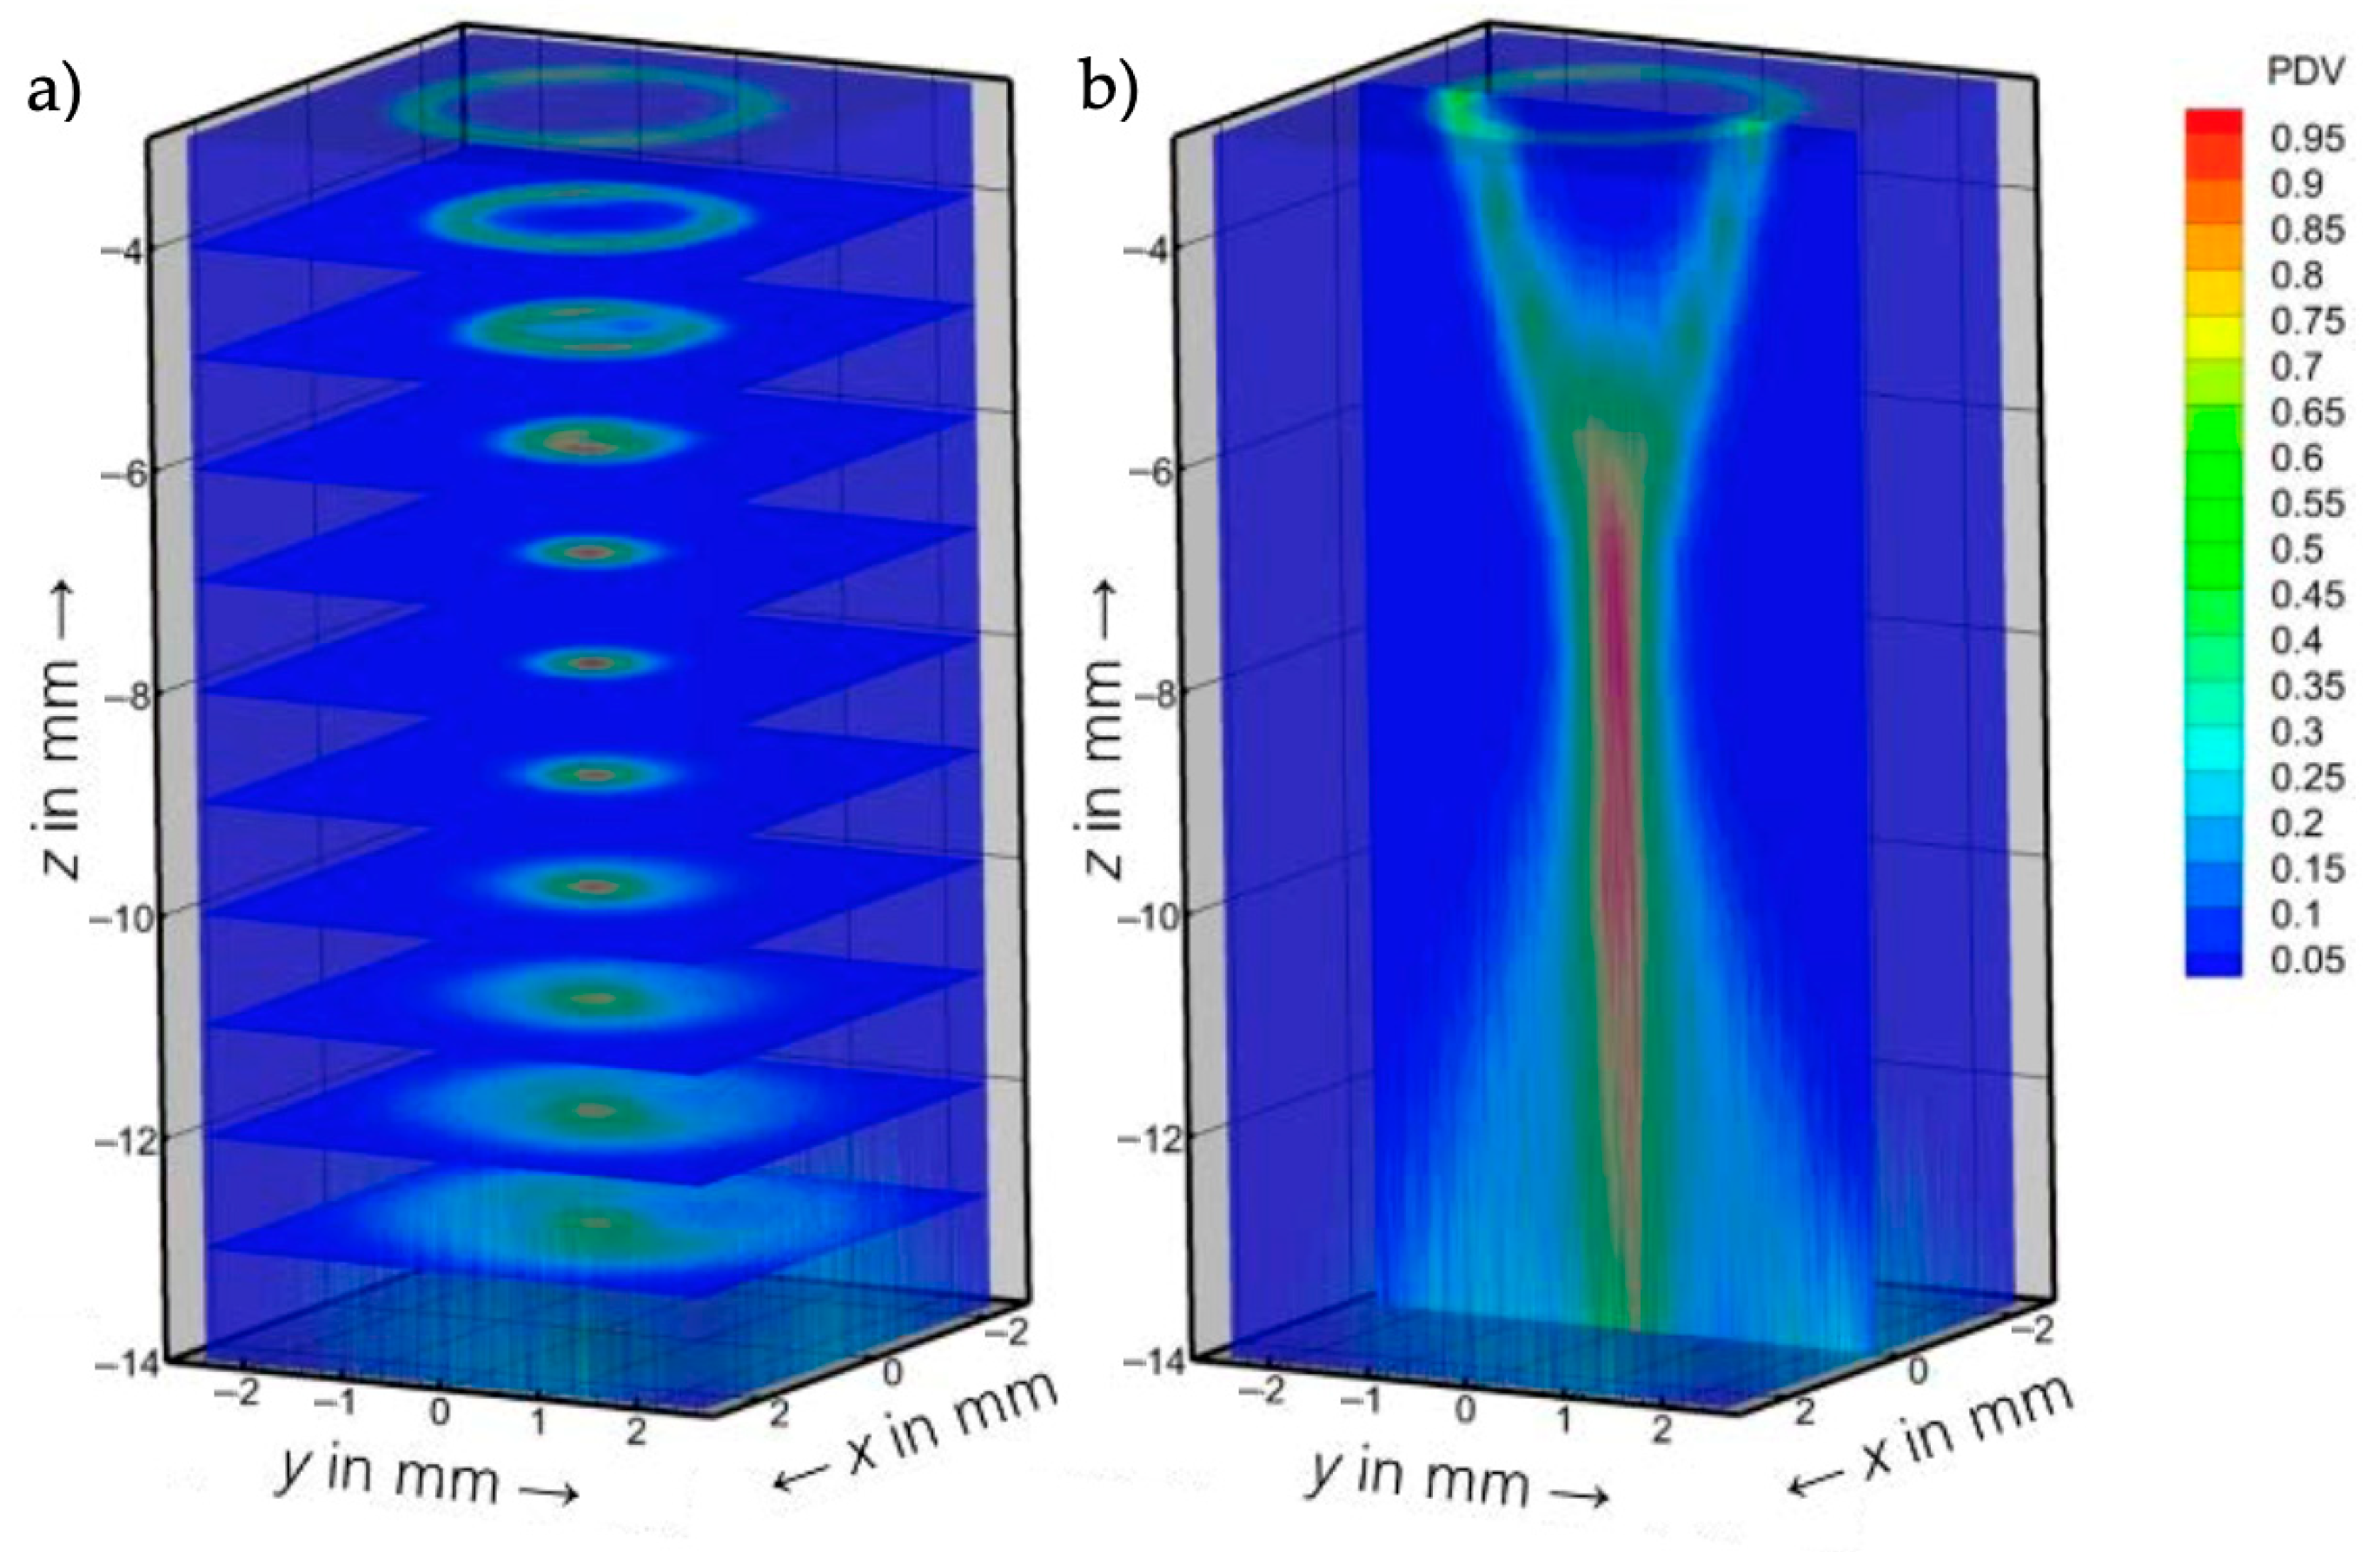
The calculation of the characteristics of the PGJS in camera-based systems is based on the pixel intensity values along the horizontal and vertical cross-section, as it is assumed the luminance intensity is directly proportional to the particle concentration [10,29,40]. These intensity profiles, representing the concentration of particles, are often fitted to Gaussian distributions where the maximum concentration is at the centre and decreases towards the periphery. Figure 34 [19] shows this behaviour by displaying the density distribution of particles with a gradient colour. The image illustrates the horizontal (see Figure 34a) and vertical (see Figure 34b) distribution of particles in various layers across the nozzle axial distances, allowing for the visualisation of a gradual increase in particle concentration towards the focal plane.
The shape of the powder jet is also commonly compared to a laser beam caustic, in which the particles first diverge at the nozzle exit, concentrate at the focal plane, and then diverge again [10,29,32]. The SOD is defined as the axial distance from the nozzle tip to the point where the PGJS has the narrowest diameter [10,36,40]. In case of both vertical and horizontal laser line sources, the SOD is determined by identifying the point of maximum intensity in the Gaussian profile along the Z-axis. For vertical sources, the SOD is identified as the Z-coordinate of the highest point of the fitted Gaussian curve [41], whereas for horizontal sources, it is the Z-position where the peak intensity occurs in the horizontal Gaussian profile [10].
The Df is defined as the minimum width of the particle circle at the SOD [30,43], or the contour of 1/e2 (approximately 13.5%) of the peak intensity, which encloses 86.5% of the particle concentration [10,11]. In studies such as Ferreira et al. [17] and Cui et al. [29], where continuous nozzles are investigated, the inner and external diameters of the powder jet are defined by the diameter of circles encompassing specific percentages of the pixel values, such as 1% and 86%, respectively, as shown in Figure 19. The fundamental idea behind the method is tracking the particles across multiple high-speed frames to calculate their displacement vectors and derive velocity fields [31] or dividing the distance covered by the camera’s shutter speed [36].
Although optical-based methods offer advantages in quantifying and qualifying the PGJS, the literature reports several challenges for its characterisation. The sources acknowledge that measured transverse widths and concentration distributions are inherently influenced by the various factors including the thickness of the laser sheet and the optical system’s point spread function (PSF). These factors encompass elements such as camera resolution, lens and motion blur, depth of field, and light scattering by particles [10,26,34].
The PSF of the optical system affects measurements through several mechanisms, as follows:
  • Motion blur and light trails: Longer exposure times can reduce the ability to identify single particles. Pre-processing techniques, such as sharpening filters, are usually applied to mitigate this effect [31].
  • Camera resolution and pixel size: When pixel size is larger than the particle dimension, images become blurry and low-resolution, complicating particle tracking and identification [43]. This mismatch can also create pixel-locking artefacts, when a particle seems stuck to certain pixel positions instead of showing its real path [31].
  • Light scattering: Scattering can cause powder particles to appear larger than their actual size, influencing the measured width and concentration [18].
  • Particle overlap: Especially at high powder densities or in convergence zones, individual particles may no longer be resolved separately, instead appearing as agglomerates or a continuous flow, which can lead to increased measurement error [26].
  • Interference factors: Reflected light from individual particles can appear discontinuous due to various interference factors [22].
While the sources acknowledge these optical effects and their impact on measurement accuracy, the literature does not provide a universally applicable method to correct these errors. Instead, approaches generally focus on minimising bias through experimental optimisation. This includes employing thin laser sheets to illuminate a narrow cross section, using pulsed illumination to reduce motion blur and adjusting camera parameters (e.g., exposure time, aperture and frame rate) to balance contrast, depth of field and image sharpness [10,19]. The use of optical filters can also help enhance contrast, and ROIs are carefully selected to avoid interference from out-of-plane regions [42].
In addition to experimental optimisation, the literature reports that bias is further reduced through advanced image processing techniques. These include background subtraction to remove gradients and enhance contrast, sharpening and denoising filters to improve particle definition, and thresholding methods, such as Otsu’s method or adaptive Gaussian binarisation, to separate particles from the background and exclude blurry elements [10,21,26,31]. Brightness scaling compensates for light scattering effects, while frame stacking and pixel averaging help smooth pixel distributions and reduce local fluctuations [17,21].
Although the sources extensively recognise the effects of camera PSF and laser thickness in the measurements, no general deconvolution guideline is provided to correct these effects. To measure sheet thickness or PSF, a practical approach is the knife-edge method: scan the laser sheet or beam across a sharp edge (e.g., a board with absorbent and reflective regions) and record the resulting intensity profile using a photodiode or camera [51]. The integrated intensity profile is fitted (e.g., with a hyperbolic tangent function), its derivative computed, and a Gaussian or top-hat function fitted to extract parameters such as the FWHM [51]. It is important to note that the knife-edge method typically underestimates the actual beam width by 45–65% due to its limited capture of scattered and forward-shining light; therefore, if deconvolution or empirical correction is not performed, it is strongly advised to report a bias bound or state the expected variation (e.g., “knife-edge measured FWHM was 45–65% smaller than camera-based measurements”) [51]. Transparent reporting of this bias is important for the accurate interpretation of width and concentration data, as the PSF significantly influences the effective resolution and reliability of optical PGJS measurements.
Despite these efforts, specific challenges persist in the implementation of this method. The non-existence of a measurement standard that defines the properties of the PGJS poses a challenge in this method, as each author applies different assumptions regarding the measurement techniques and algorithms employed, leading to variations in reported results and making direct comparisons difficult.
Another limitation can be related to the computation cost in this method, as high-speed imaging generates large amounts of data, making data storage and post-processing computationally expensive [10]. In addition, the method requires use of specific camera and illumination setups, which can also be installed in the machine, requiring precise calibration to ensure accurate and reliable results (e.g., analogue gain and exposure time of the camera) [18,22].

4.3. Comparative Synthesis for PGJS Characterisation Methods

Weight-based methods offer a low-cost alternative with low setup complexity when compared to the camera-based options [14]. Its robustness to powder dust and welding fumes is an important quality when applied in industrial environments [14]; however, the intrusiveness of the measurement is high due to the nature of the technique [18]. The spatial resolution of weight-based methods relies on repeating the measurements at different radial and axial distances from the nozzle, which limits the method to offline applications and results in poor temporal resolution of the PGJS [15,16].
Camera-based methods using lateral cameras and area illumination, on the other hand, provide high spatial and temporal resolution by employing high-resolution, high-speed cameras with low intrusiveness [10]. The complexity and cost of the setup are higher than those of weight-based methods and vary depending on the specific hardware employed (e.g., medium LED PIV, high multi-camera PIV [31]), in addition to the fact that this method requires post-processing, which can be computationally expensive. It is suitable for in situ monitoring but can be moderately affected by spatter and bright melt pool radiation, necessitating careful optical filtering [21]. Despite the costs, these methods are widely used in both research and practical applications, reflecting a high technology readiness level (TRL).
Vertical laser sheet illumination methods achieve high spatial and temporal resolution while maintaining low intrusiveness. Setup complexity is medium to high, requiring precise calibration and computationally intensive processing [10]. These techniques are robust enough for in situ monitoring and offer improved contrast due to the thin laser sheet, though they share some challenges with general optical methods regarding spatter and melt pool interference [23]. Their TRL is high, including both cited commercial equipment, with broad acceptance in research and process monitoring [34].
Horizontal laser sheet illumination methods provide high spatial but medium temporal resolution, as the layers of the PGJS need to be observed individually [7]. They are non-intrusive but involve very high setup complexity due to the need for mirrors and additional processing steps [17]. Primarily used in offline characterisation, these methods are moderately robust to environmental interferences and have a high readiness level for research purposes.
Coaxial optical imaging varies depending on whether it is applied offline or in situ. Offline implementations offer high spatial and temporal resolution, but with high complexity and cost, as the system needs to be stand-alone in one machine, requiring costs with installation and training [19]. Offline characterisation does not involve the processing laser and thus is not suitable for online use. In contrast, online or in situ coaxial imaging achieves high to very high spatial and temporal resolution with low intrusiveness but requires highly complex setups and sophisticated filtering to manage interference from the melt pool and active lasers. These systems are essential for process control and are actively being developed for industrial applications, reflecting medium to high TRL [42,44].
All this information is summarised in Table 9.
Spatial Resolution: Ratings are based on the reported capabilities of distinguishing or tracking particles (Medium: sufficient overall stream shape or individual jets [14]/High: capable of resolving individual particles or fine features [19]). Temporal resolution: Ratings reflect reported frame rates or explicit statements about real-time capability (Low: single-frame or very low frame rates, lacking real-time capabilities [15]/Medium: suitable for continuous monitoring of overall flow and changes in concentration [10]/High: capturing rapid particle movement or process dynamics [31]). Intrusiveness: Based on whether the method physically interacts with the powder stream (Low: non-contact method/High: direct physical interaction with particles). Setup complexity: Reflects the number and specialisation of components (Low: simple equipment, easy calibration [14]/Medium: multiple components requiring moderate alignment/calibration [10]/High: sophisticated equipment, complex optical parts, integration with active L-DEDp systems [44]). In situ suitability: Based on whether the method is typically used during processing and its ability to provide useful data under such conditions (Low: primarily for offline analysis, difficult to integrate into live process [43]/Medium: possible with significant modifications or specific conditions [18]/High: designed for or successfully adapted for real-time process monitoring [44]). Robustness to spatter/smoke: Assesses the effectiveness of the method in overcoming the challenges posed by the L-DEDp environment’s optical noise (Medium: performance may be affected, but usable with filtering [44]/High: the system is inherently unaffected by process emissions [15]). Cost: General assessment based on the type of equipment required, with patented or highly specialised systems incurring higher costs (Low: basic components [15]/Medium: specialised cameras, lasers, software [10,31]/High: advanced optical systems, custom-built or patented systems [19,44]). TRL: Ratings reflect the maturity level based on descriptions of experimental validation, implementation in relevant/operational environments, and statements regarding industrial establishment (Medium: used for analytical and experimental critical function/characteristic proof-of-concept, and system model or prototype demonstration in a relevant environment [10,14]/High: system complete and proven in operational environment [10,42]).

4.4. Lack of Standardisation

The accuracy and reproducibility are important considerations for PGJS characterisation techniques; this advancement contributes to the maturity of L-DEDp technology, both in scientific understanding and industrial implementation. However, the current landscape of experimental measurement techniques suffers from a significant lack of standardisation, posing considerable challenges for comparing results across different studies and achieving consistent process optimisation.
The literature reports the difficulty in understanding the effects of individual variables experimentally, often due to the time-consuming nature and complexity of the phenomena [27,40]. The absence of universally accepted methodologies makes it challenging to draw definitive conclusions or build upon previous work effectively, as findings may not be directly comparable [30,31]. This issue is particularly pronounced in areas such as particle velocity and concentration measurement, where diverse optical and weighting methods are employed, each with its own advantages and limitations. The impact of manufacturing differences in nozzles also necessitates case-by-case assessment, further underscoring the need for standardised approaches [38].
Both methodologies are subject to measurement uncertainties arising from various instrumental and procedural factors. On weight-based techniques, factors that can induce these uncertainties include scale resolution and drift, effective pinhole area, sampling duration, and particle rebound effects. These error sources are presented in Table 10, summarising the documented impacts reported on the weight-based studies, and where the reports did not provide explicit uncertainty information, common assumptions from metrology practice and data processing were included.
For camera-based methods, the main factors discussed in the literature that can induce measurement uncertainty are summarised in Table 11.
Although studies address these error sources and their potential impact on the accuracy of both methods, a precise numerical quantification of how each individual source propagates to the parameters, such as SOD and Df, remains absent. This gap can be explained by the fact that many studies apply experimental methods for validation of numerical simulation, reporting the error between simulation and experiment rather than assessing the repeatability or reproducibility of the experimental methods themselves.
For instance, the sources generally indicate the use of high-precision scales for powder feed rate calibration, which directly impacts the PGJS, with inherent reproducibility reported around 0.01 g [19]. Although no fixed recalibration intervals are explicitly documented, calibration checks, often conducted before each experiment, and recalibrations on different days are common practice [17].
In studies exploring camera-based methods, the calibration depends heavily on consistent powder back-reflection brightness, which can be affected by changes in powder material, laser processing parameters, camera exposure, and interference from the laser-irradiated zone [42]. Systematic errors, including particle tracking behaviour, seeding density, background noise, and illumination consistency, further complicate measurement accuracy [42]. While no fixed recalibration schedules exist, recalibration is necessary whenever these influential factors change to maintain measurement reliability.
The absence of explicit numerical quantification of repeatability and reproducibility for these methods, as well as universally recommended recalibration intervals, remains insufficiently addressed in the literature, emphasising the gap in standardising these measurement methods. Moreover, the choice of algorithms for data processing directly affects the analysis of results, as different algorithms can interpret the same raw data in varied ways, significantly complicating the comparison of results across different studies. For instance, methods for removing individual particles from background noise and other artefacts are significant in camera-based methods [19]. Some methods reported in the literature are based on brightness thresholds to remove light artefacts or unwanted reflections [17], while others use advanced filters for noise reduction and particle sharpening [44].
In addition, assumptions about powder distribution employ mathematical models to fit experimental data (e.g., Gaussian). The choice of fitting function and the criteria for defining features like Df (e.g., 14% or 86% of maximal luminosity, FWHM, 10% of maximum intensity) can significantly alter reported values [7,17,30,33]. These variations and inconsistencies highlight the critical need for standardised methodologies and comprehensive reporting guidelines to ensure the reproducibility and comparability of camera-based measurement techniques. The following subsection proposes a minimum reporting set to support greater transparency and consistency in experimental methods, offering a structured approach to enhance methodological clarity.

Minimum Reporting Set for Experimental Methods

To enhance reproducibility and facilitate the comparison of experimental data across studies, it is essential to adopt a standardised reporting set encompassing the key experimental and analytical parameters. This paper set an important milestone in the literature to support the standardisation of nomenclature for PGJS characterisation techniques. The following information is recommended to be included in future work addressing PGJS:
  • Nozzle geometry: Comprehensive details of the nozzle design should be provided, including the type (e.g., coaxial continuous or discrete), number of channels or jets, internal and external diameters, channel lengths, and inclination angles. The dimensions should be provided to avoid intellectual property claims.
  • Material density, PSD and morphology: The type of material (alloy) and PSD should be reported using standard descriptors such as quartiles (Dv,n 10, 50, 90), average diameter and distribution mode. Information on particle shape (e.g., spherical, near spherical) supported by scanning electron microscope (SEM) micrographs is also relevant. Powder flowability data are also relevant, such as the ones obtained by the Hall/Carney funnel or powder rheology systems.
  • SG, CG and PMF: Details on the type of gases used (e.g., argon, helium), volumetric flow rates (e.g., litres per minute or grams per minute), gas pressures, and flow rates for individual channels (e.g., inner and outer shielding gases) must be included.
  • Particle trap method and dimensions: The technique employed to capture the particles should be specified (e.g., weighting method using a plate with a circular pinhole, or collection in cylindrical containers with specific concentric holes), including the diameter of the pinhole.
  • Illumination wavelength and sheet thickness: The wavelength of the illumination and thickness of the laser sheet should be reported. If possible, provide the measured (not nominal) laser-sheet thickness and the method used to verify this measurement.
  • Camera sensor and acquisition parameters: The camera type (e.g., CCD, CMOS, high-speed), spatial resolution (e.g., pixels, pixels per millimetre), frame rate (frames per second), exposure time (microseconds), and optical aperture settings (f-number) must be clearly documented.
  • Pixel-to-Millimetre calibration: The scaling factor used to convert pixel measurements into real-world dimensions (e.g., micrometres per pixel or millimetres per pixel) must be provided to ensure measurement accuracy, including uncertainty of devices.
  • Perspective/Homography or lens-distortion correction: Specify whether any perspective, homography, or lens-distortion were applied during image processing. Include the correction method and any parameters or calibration data used.
  • Thresholding and fitting methods: Details on image binarisation procedures (e.g., Otsu, 1/e2 contour), criteria for defining particle boundaries (e.g., greyscale threshold values), and the mathematical functions used for fitting measurement data (e.g., Gaussian) should be included.
  • Frames averaged: The number of frames stacked or averaged to reduce noise and discrete fluctuations, thereby producing a smoother representation of the powder stream, should be documented.
  • Optical filters: Specifications of any optical filters employed to enhance image contrast should be reported, including bandpass filter centre wavelengths, FWHM, optical density, and the use of notch or other specialised filters.
Systematically reporting these parameters in PGJS analysis enhances traceability, transparency, reproducibility, and comparability of experimental methodologies. In addition, verification of the laser sheet thickness and depth-of-field checks are highly recommended to ensure the accuracy of plane-wise illumination. It is important to ensure that the measured particles accurately reside within the illuminated plane, especially at high speeds where out-of-plane motion can lead to substantial errors.
Due to the inherent limitations of 2D measurements in capturing the complex, 3D nature of powder and gas flows, it is essential to adopt 3D volumetric approaches like multi-view stereoscopy or tomography. Although these methods demand a substantial investment in hardware and complex setups, they provide comprehensive access to all three components of velocity and spatial distribution within a defined volume.
Some studies have already adopted multi-view schemes and proposed methodologies to reconstruct 3D powder distributions, enhancing evaluation and accuracy [14,17]. However, these reconstructions often rely on assumptions such as asymmetry, posing challenges as these assumptions may not be universally applicable across all nozzle types or operational scenarios. To validate such 3D models and experimental techniques, validation with a phantom of known distribution or a benchmark database with controllable parameters (e.g., particle concentration, noise level) is essential. This facilitates a more objective evaluation of algorithm robustness and measurement accuracy in a controlled environment, complementing experimental methodologies.

5. Conclusions

Among the experimental approaches reviewed, the characterisation of PGJS is predominantly explored by camera-based methods, including commercial options, due to their ability to measure and quantify the powder jet dynamics without disturbing the flow. Techniques employing laser illumination combined with CCD or CMOS cameras, mounted coaxially or laterally, have captured detailed characteristics of the powder jet based on the powder distribution along the jet. Image processing techniques are employed to create an image representation of the PGJS, based on the pixel’s intensity of the powder particles captured during measurement, allowing the calculation of characteristics such as Df and SOD, which are broadly explored in the papers. The studies have shown that the peak of the Gaussian distribution represents the SOD of the stream. The types of illumination, such as area, horizontal, and vertical laser light illumination, have shown comparable results for measuring the PGJS, although comparative studies in this area remain not very well studied in the literature. Each technique employs its own algorithm and image processing method, contributing to the challenge of understanding why similar conditions lead to different results.
Similarly, weight-based methods provide an alternative way to measure the PGJS through a straightforward and cost-effective means to quantify the powder mass flow and spatial distribution of the jet. The results of these methods often agree with those from optical systems, often showing a Gaussian distribution of particles near the SOD. Despite their quantitative robustness, these methods are inherently intrusive, static, and limited to level-by-level measurements, thus restricting their ability to comprehensively capture the full 3D PGJS dynamics. The need for precise calibration, material-dependent adjustments, and the absence of universal standards further limit their broader application and comparability. Table 12 offers a summarised overview of the measurement methods employed for PGJS characterisation, emphasising their principles, system setups, measurement focuses, as well as advantages and disadvantages.
The absence of an internationally standardised metric applicable across various measurement devices and techniques poses a significant challenge in both techniques for characterising the PGJS. This lack of standards complicates the quantification and qualification of the powder jet based on process parameters and hinders the consistent certification that experimental methods are performed correctly. Without established benchmarks or reference criteria, comparing results from different systems or studies becomes difficult, limiting the reliability and reproducibility of findings in this field and the advancement in accuracy and consistency of PGJS measurements.
To address these challenges, an inter-laboratory comparison is proposed to establish standardised testing protocols and metrics of PGJS characterisation. The proposed study would entail utilising a standard nozzle and material, testing two defined PSD bands under fixed gas flow conditions to maintain consistency across experiments. Standard illumination parameters, including parameters discussed in Section 4.4 of this work, would be employed for camera-based methods. Key quantitative metrics such as SOD, Df, symmetry index, and caustic slope should be reported, all based on unified and clearly defined measurement criteria. Implementing this testing programme would facilitate reliable cross-comparison of results, improve reproducibility, and contribute to the development of an internationally recognised standard for PGJS measurement and evaluation.
Future research should strategically address the identified experimental gaps and limitations, pushing the boundaries of PGJS characterisation by understanding the common characteristics and behaviour of the powder jet through correlation with process parameters based on multiple measurements and exploration of different nozzles, materials, and devices. Identifying the principal characteristics of a powder jet, both geometrically and statistically, is crucial for enabling the establishment of a metric to objectively quantify and compare powder jet characteristics across various systems and conditions. Such a metric would enable standardised evaluation of PGJS measurements, facilitating the process optimisation and supporting the certification and validation of measurement methods.
Looking ahead, it would be valuable to explore in-process measurement techniques for powder jets, allowing for real-time monitoring and control during manufacturing. Integrating sensors directly into the production environment enables continuous assessment of powder jet characteristics as process parameters evolve, providing immediate feedback for required adjustments. This approach can have the potential to enhance process stability, reduce variability, and result in an improvement of the overall part quality by ensuring consistent powder delivery throughout production, ultimately enhancing the accuracy and efficiency of the L-DEDp process.

Author Contributions

Conceptualisation, J.P.M.A. and J.G.; methodology, J.P.M.A.; formal analysis, J.P.M.A.; investigation, J.P.M.A.; data curation, J.P.M.A.; writing—original draft preparation, J.P.M.A.; writing—review and editing, J.P.M.A., J.G., Q.Y. and D.M.; supervision, J.G., Q.Y. and D.M. All authors have read and agreed to the published version of the manuscript.

Funding

This research was funded by TWI: NSIRC, under the Core Research Programme.

Data Availability Statement

No new data were created or analysed in this study.

Conflicts of Interest

Authors João Pedro Madeira Araujo and Jhonattan Gutjahr were employed by TWI Technology Centre. The remaining authors declare that the research was conducted in the absence of any commercial or financial relationships that could be construed as a potential conflict of interest.

Abbreviations

The following abbreviations are used in this manuscript:
3DThree-dimensional
2DTwo-dimensional
CCDCharge-coupled devices
CGCarrier gas
CMOSComplementary metal-oxide semiconductor
DfFocus diameter
EIAEdge identification algorithm
FPSFrames per second
FWHMFull width at half maximum
L-DEDpLaser directed energy deposition process
MQTTMessage queuing telemetry transport
PGJSPowder-gas jet stream
SGShielding gas
SODStand-off distance
PIVParticle image velocimetry
PMFPowder mass flow
PSDParticle size distribution
PSFPoint spread function
RPMRevolutions per minute
TRLTechnology readiness level

References

  1. Ahn, D.G. Directed Energy Deposition (DED) Process: State of the Art. Int. J. Precis. Eng. Manuf. Green. Tech. 2021, 8, 703–742. [Google Scholar] [CrossRef]
  2. Guner, A.; Bidare, P.; Jiménez, A.; Dimov, S.; Essa, K. Nozzle Designs in Powder-Based Direct Laser Deposition: A Review. Int. J. Precis. Eng. Manuf. 2022, 233, 1077–1094. [Google Scholar] [CrossRef]
  3. Kumar, S.P.; Elangovan, S.; Mohanraj, R.; Srihari, B. Critical review of off-axial nozzle and coaxial nozzle for powder metal deposition. Mater. Today Proc. 2021, 46, 8066–8079. [Google Scholar] [CrossRef]
  4. Pinkerton, A.J.; Li, L. Modelling Powder Concentration Distribution from a Coaxial Deposition Nozzle for Laser-Based Rapid Tooling. J. Manuf. Sci. Eng. 2025, 126, 33–41. [Google Scholar] [CrossRef]
  5. Gutjahr, J.; Pereira, M.; Sá De Sousa, J.M.; Ferreira, H.S.; Júnior, A.T. Powder degradation as a consequence of laser interaction: A study of SS 316L powder reuse on the laser directed energy deposition process. J. Laser Appl. 2024, 36, 012022. [Google Scholar] [CrossRef]
  6. Melo, L.D. Powder Jet Particle Density Distribution Analysis and Qualification for the Laser Metal Deposition Process. Master’s Thesis, Universidade Federal de Santa Catarina, Florianópolis, Brazil, 2015. Available online: https://repositorio.ufsc.br/xmlui/handle/123456789/171441 (accessed on 18 June 2025).
  7. Bohlen, A.; Seefeld, T.; Haghshenas, A.; Groll, R. Characterization of the powder stream propagation behavior of a discrete coaxial nozzle for laser metal deposition. J. Laser Appl. 2022, 34, 042048. [Google Scholar] [CrossRef]
  8. Zhong, C.; Pirch, N.; Gasser, A.; Poprawe, R.; Schleifenbaum, J.H. The Influence of the Powder Stream on High-Deposition-Rate Laser Metal Deposition with Inconel 718. Metals 2017, 7, 443. [Google Scholar] [CrossRef]
  9. Zhang, W.; Liu, Y.; Hu, D.; Lv, H.; Yang, Q. Experimental and numerical simulation studies of the flow characteristics and temperature field of Fe-based powders in extreme high-speed laser cladding. Opt. Laser Technol. 2024, 170, 110317. [Google Scholar] [CrossRef]
  10. Jardon, Z.; Guillaume, P.; Ertveldt, J.; Hinderdael, M.; Arroud, G. Offline powder-gas nozzle jet characterization for coaxial laser-based Directed Energy Deposition. Procedia CIRP 2020, 94, 281–287. [Google Scholar] [CrossRef]
  11. Baily, T. In-situ Monitoring of Powder Flow in Directed Energy Deposition Additive Manufacturing. Master’s Thesis, The Pennsylvania State University, University Park, PA, USA, 2021. [Google Scholar]
  12. ISO 11146-1:2021; Lasers and Laser-Related Equipment—Test Methods for Laser Beam Widths, Divergence Angles and Beam Propagation Ratios—Part 1: Stigmatic and Simple Astigmatic Beams. International Organization for Standardization—ISO: Geneva, Switzerland, 2021. Available online: https://www.iso.org/standard/77769.html (accessed on 12 September 2025).
  13. Bedenko, D.V.; Kovalev, O.B.; Sergachev, D.V. Numerical study of the gas-particle flows with the two-way coupling formed by coaxial nozzles for laser cladding. Surf. Coat. Technol. 2022, 445, 128700. [Google Scholar] [CrossRef]
  14. Eisenbarth, D.; Borges Esteves, P.M.; Wirth, F.; Wegener, K. Spatial powder flow measurement and efficiency prediction for laser direct metal deposition. Surf. Coat. Technol. 2019, 362, 397–408. [Google Scholar] [CrossRef]
  15. Liu, Z.; Zhang, H.; Peng, S.; Kim, H.; Du, D.; Cong, W. Analytical modeling and experimental validation of powder stream distribution during direct energy deposition. Addit. Manuf. 2019, 30, 100848. [Google Scholar] [CrossRef]
  16. Tabernero, I.; Lamikiz, A.; Ukar, E.; López De Lacalle, L.N.; Angulo, C.; Urbikain, G. Numerical simulation and experimental validation of powder flux distribution in coaxial laser cladding. J. Mater. Process. Technol. 2010, 210, 2125–2134. [Google Scholar] [CrossRef]
  17. Ferreira, E.; Dal, M.; Colin, C.; Marion, G.; Gorny, C.; Courapied, D.; Guy, J.; Peyre, P. Experimental and Numerical Analysis of Gas/Powder Flow for Different LMD Nozzles. Metals 2020, 10, 667. [Google Scholar] [CrossRef]
  18. Kim, H.S.; Park, S.H. Influence of high powder flow dynamics on the efficiency of laser-directed energy deposition. Mater. Des. 2025, 255, 114145. [Google Scholar] [CrossRef]
  19. Schopphoven, T.; Pirch, N.; Mann, S.; Poprawe, R.; Häfner, C.L.; Schleifenbaum, J.H. Statistical/Numerical Model of the Powder-Gas Jet for Extreme High-Speed Laser Material Deposition. Coatings 2020, 10, 416. [Google Scholar] [CrossRef]
  20. Zekovic, S.; Dwivedi, R.; Kovacevic, R. Numerical simulation and experimental investigation of gas–powder flow from radially symmetrical nozzles in laser-based direct metal deposition. Int. J. Mach. Tools Manuf. 2007, 47, 112–123. [Google Scholar] [CrossRef]
  21. Ancalmo, C.; Narra, S.P. Prediction of the powder catchment efficiency and melt track height in laser directed energy deposition. J. Manuf. Process. 2025, 137, 207–220. [Google Scholar] [CrossRef]
  22. Jing, P.; Qin, J.; Li, Y.; Zhu, H.; Zhong, S.; Zhang, L. Analysis of concentration distribution, flight characteristics, and laser-powder interaction in Ni-based diamond powder laser cladding. Opt. Laser Technol. 2025, 187, 112789. [Google Scholar] [CrossRef]
  23. Warneke, P.; Westermeyer, L.; Bohlen, A.; Seefeld, T. Influencing the powder particle transport in high-speed laser melt injection. J. Laser Appl. 2024, 36, 042023. [Google Scholar] [CrossRef]
  24. Bohlen, A.; Seefeld, T. Influence of the inner roughness of powder channels on the powder propagation behavior in laser metal deposition. J. Laser Appl. 2024, 36, 042007. [Google Scholar] [CrossRef]
  25. Pacheco, J.T.; Prass, G.; Veiga, M.; Meura, V.; Leite, M.; Fiocco, G.; Rego, R. Influence of carrier gas flow rate and particle size of AISI M2 in the laser-directed energy deposition process. Adv. Mater. Process. Technol. 2024, 11, 1836–1850. [Google Scholar] [CrossRef]
  26. López-Martínez, A.; Ibarra-Medina, J.; García-Moreno, A.; Piedra, S.; Vizcaya, L.D.L.; Martínez-Franco, E.; Megahed, M. Modeling and comparison of the powder flow dynamics for tilted annular and discrete-outlet nozzles in laser directed energy deposition. J. Manuf. Process. 2023, 99, 687–704. [Google Scholar] [CrossRef]
  27. Touzé, S.; Rauch, M.; Hascoët, J. Gas-particle flow of cohesive aluminium powders during laser metal deposition—Experimental and numerical investigation. Adv. Powder Technol. 2023, 34, 104182. [Google Scholar] [CrossRef]
  28. Bian, Y.; He, X.; Yu, G.; Li, S.; Tian, C.; Li, Z.; Zhang, Y.; Liu, J. Powder-flow behavior and process mechanism in laser directed energy deposition based on determined restitution coefficient from inverse modeling. Powder Technol. 2022, 402, 117355. [Google Scholar] [CrossRef]
  29. Cui, Y.H.; Wu, L.L.; Yang, Y.C.; Lan, Y.C.; Lin, J.L.; Fang, N.W.; Chen, X.Y.; Li, R. Analysis of Powder Feeding Behaviour in Coaxial Laser Cladding. Lasers Eng. 2022, 42, 361–374. [Google Scholar]
  30. Li, L.; Huang, Y.; Zou, C.; Tao, W. Numerical Study on Powder Stream Characteristics of Coaxial Laser Metal Deposition Nozzle. Crystals 2021, 11, 282. [Google Scholar] [CrossRef]
  31. García-Moreno, A.; Alvarado-Orozco, J.; Ibarra-Medina, J.; López-Martínez, A.; Martínez-Franco, E. A new PIV method to measure powder flow velocity in laser metal deposition: An Eulerian-based approach. Int. J. Adv. Manuf. Technol. 2021, 117, 1825–1841. [Google Scholar] [CrossRef]
  32. Mahmood, M.A.; Popescu, A.C.; Oane, M.; Ristoscu, C.; Chioibasu, D.; Mihai, S.; Mihailescu, I.N. Three-Jet Powder Flow and Laser–Powder Interaction in Laser Melting Deposition: Modelling Versus Experimental Correlations. Metals 2020, 10, 1113. [Google Scholar] [CrossRef]
  33. Kovalev, O.B.; Bedenko, D.V.; Gurin, A.M.; Sergachev, D.V. Study of optimization features of gas-powder jets created by a coaxial nozzle with divided powder supply during direct laser deposition of materials. Opt. Laser Technol. 2025, 181, 112020. [Google Scholar] [CrossRef]
  34. Kim, H.S.; Park, S.H. Powder stream characteristics of replaceable alumina and brass nozzle tips for directed energy deposition. Addit. Manuf. 2025, 102, 104734. [Google Scholar] [CrossRef]
  35. Platz, J.; Steiner-Stark, J.; Kirsch, B.; Aurich, J.C. Investigation on different laser-powder alignments and their influence on part properties in high-speed Directed Energy Deposition. Procedia CIRP 2024, 124, 190–193. [Google Scholar] [CrossRef]
  36. Pant, P.; Chatterjee, D.; Kumar, S.; Kumar Lohar, A. Experimental and Numerical Analysis of the Powder Flow in a Multi-Channel Coaxial Nozzle of a Direct Metal Deposition System. J. Manuf. Sci. Eng. 2021, 143, 071003. [Google Scholar] [CrossRef]
  37. Nagulin, K.Y.; Iskhakov, F.R.; Shpilev, A.I.; Gilmutdinov, A.K. Optical diagnostics and optimization of the gas-powder flow in the nozzles for laser cladding. Opt. Laser Technol. 2018, 108, 310–320. [Google Scholar] [CrossRef]
  38. Katinas, C.; Shang, W.; Shin, Y.C.; Chen, J. Modeling Particle Spray and Capture Efficiency for Direct Laser Deposition Using a Four Nozzle Powder Injection System. J. Manuf. Sci. Eng. 2018, 140, 041014. [Google Scholar] [CrossRef]
  39. Shpilev, A.I.; Iskhakov, F.R.; Nagulin, K.Y.; Gil’mutdinov, A.K. Gas and Powder Flow Optimization in a Four-Jet Laser Cladding Head. Russ. Aeronaut. 2018, 61, 145–148. [Google Scholar] [CrossRef]
  40. Balu, P.; Leggett, P.; Kovacevic, R. Parametric study on a coaxial multi-material powder flow in laser-based powder deposition process. J. Mater. Process. Technol. 2012, 212, 1598–1610. [Google Scholar] [CrossRef]
  41. Pang, M.; Wu, Z.; Sun, S.; Wang, H.; Yang, R.; Wu, Y.; Cai, G. Numerical simulation and experimental investigation of the influence of gas flows in extreme high speed laser cladding. Opt. Laser Technol. 2025, 188, 113002. [Google Scholar] [CrossRef]
  42. Hildinger, P.; Seefeld, T.; Bohlen, A. Image Based In-Process Powder Stream Monitoring during Laser Metal Deposition for the Measurement of the Gravimetric Powder Mass Flow Rate and the Detection of Deviations in the Powder Stream. Procedia CIRP 2024, 124, 219–222. [Google Scholar] [CrossRef]
  43. Brucki, M.; Schmickler, T.; Gasser, A.; Häfner, C.L. Influence of the Relative Position of Powder–Gas Jet and Laser Beam on the Surface Properties of Inconel 625 Coatings Produced by Extreme High-Speed Laser Material Deposition (EHLA). Coatings 2023, 13, 998. [Google Scholar] [CrossRef]
  44. Hildinger, P.; Seefeld, T.; Bohlen, A. Characterization of optical emissions during laser metal deposition for the implementation of an in-process powder stream monitoring. J. Laser Appl. 2023, 35, 042048. [Google Scholar] [CrossRef]
  45. Ponticon GmbH. Why Does PowderSpy Exist? 2024. Available online: https://ponticon.de/wp-content/uploads/2024/04/240305_PowderSpy-Specification.pdf (accessed on 19 July 2025).
  46. Ponticon GmbH. Report PowderSpy Example. 2023. Available online: https://ponticon.de/en/powderspy/ (accessed on 19 July 2025).
  47. Fraunhofer IWS. LIsec Powder Nozzle Qualification Device. 2024. Available online: https://www.iws.fraunhofer.de/content/dam/iws/en/documents/publications/product-sheets/2024_Product-Sheet_LIsec_EN.pdf (accessed on 19 July 2025).
  48. Fraunhofer Gesellschaft zur Forderung der Angewandten Forschung. Method and Device for Detecting a Particle Density Distribution in the Jet of a Nozzle. DE Patent DE102011009345B3, 25 January 2011. [Google Scholar]
  49. Lin, J. Concentration mode of the powder stream in coaxial laser cladding. Opt. Laser Technol. 1999, 31, 251–257. [Google Scholar] [CrossRef]
  50. Guo, S.; Song, S.; Cui, L.; Cui, Y.; Li, X.; Chen, Y.; Zheng, B. Influence of Defocusing Amount on Powder Flow Convergence Characteristics and Forming Microstructure of Coaxial Powder Feeding Laser Cladding. J. Mater. Eng. Perform. 2023, 33, 13237–13250. [Google Scholar] [CrossRef]
  51. Tan, Y.; Lin, F.; Ali, M.; Su, Z.; Wong, H. Development of a novel beam profiling prototype with laser self-mixing via the knife-edge approach. Opt. Lasers Eng. 2023, 169, 107696. [Google Scholar] [CrossRef]
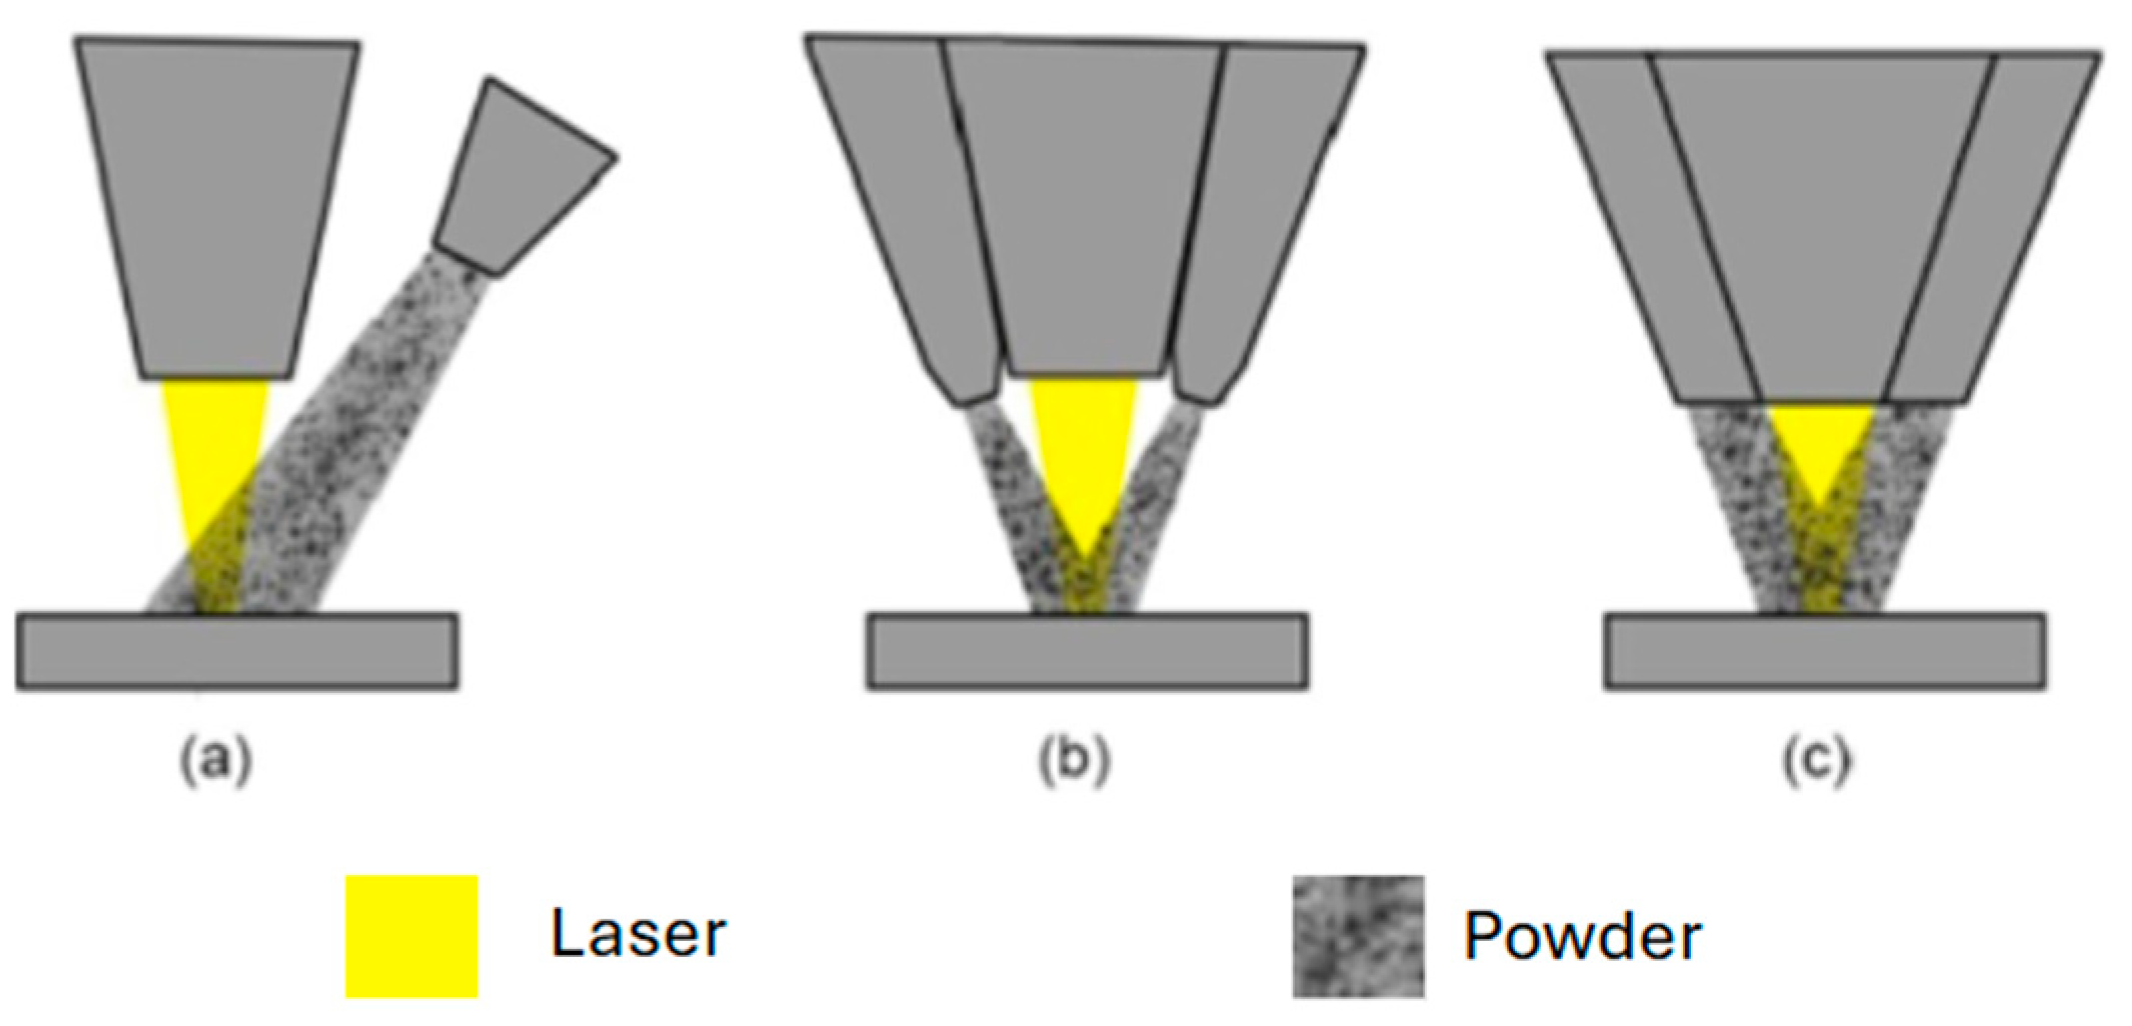
Figure 1. Types of nozzles depending on the powder distribution: (a) off-axis powder injection, (b) discrete coaxial powder and (c) continuous coaxial powder injection (adapted from [3], licensed under CC BY 4.0).
Processes 13 02995 g001
Figure 2. Schematic of the Powder-gas jet stream (author).
Processes 13 02995 g002
Figure 3. PRISMA-style flow diagram illustrating the literature selection process. Records were identified from Scopus (n = 612), screened by title and abstract (n = 221 retained), assessed for eligibility (n = 161), with 52 included that described experimental methods. Non-English and grey literature was not considered (author).
Processes 13 02995 g003
Figure 4. Graphic of the selected publications addressing the effects of process parameters on characteristics of the flow of gases (author).
Processes 13 02995 g004
Figure 5. Graphic of selected publications selected which used camera-based systems as the primary experimental method for PGJS characterisation (author).
Processes 13 02995 g005
Figure 6. Schematic representation of the PGJS, including key characteristics (author).
Processes 13 02995 g006
Figure 7. Powder flow calibration for Inconel 718 powder with coaxial nozzle from [16] and four jet exit nozzle [15]. Reprinted with permission from ref. [15]. Copyright 2025, with permision from Elsevier.
Processes 13 02995 g007
Figure 8. (a) Scheme of powder focusing; (b) photo of the nozzle output with a tube [13]. Reprinted with permission from ref. [13]. Copyright 2025, with permision from Elsevier.
Processes 13 02995 g008
Figure 9. Measurement setup: moving processing head with powder jet, plate representing the base material, measurement of powder through the pinhole by a scale [14]. Reprinted with permission from ref. [14]. Copyright 2025, with permision from Elsevier.
Processes 13 02995 g009
Figure 10. Cylindrical containers [15]. Reprinted with permission from ref. [15]. Copyright 2025, with permision from Elsevier.
Processes 13 02995 g010
Figure 11. Experimental measurement system of powder flux [16]. Reprinted with permission from ref. [16]. Copyright 2025, with permision from Elsevier.
Processes 13 02995 g011
Figure 12. High-speed imaging and lighting hardware to back-illuminate the particle stream [21]. Reprinted with permission from ref. [21]. Copyright 2025, with permision from Elsevier.
Processes 13 02995 g012
Figure 13. Particle stream images were captured at 14.4 kHz, background subtracted, binarised, and summed across all frames to generate a particle stream distribution. The particle stream diameter was measured 12 mm below the nozzle [21]. Reprinted with permission from ref. [21]. Copyright 2025, with permision from Elsevier.
Processes 13 02995 g013
Figure 14. Scan of post-processed image (left), relative pixel intensity profile at 5 heights (50, 100, 150, 200 and 250 pixels) under the nozzle represented by the colours on the post-processed image (middle), extraction of SOD (right) [10] (illumination: LED lamp, camera type: Photron SA1.1 high-speed camera). Reprinted with permission from ref. [10]. Copyright 2025, with permision from Elsevier.
Processes 13 02995 g014
Figure 15. Image processing steps for edge identification. (a) Digital image of powder stream from the nozzle tip. (b) Once powder stream profile has been identified and the image is eroded, this image is obtained. (c). The complement of image (b) is obtained to separate powder stream profile and subsequently convert from pixel to mm for analysis [26] (illumination: not specified, camera type: Canon EOS Rebel T3 digital camera). Reprinted with permission from ref. [26]. Copyright 2025, with permision from Elsevier.
Processes 13 02995 g015
Figure 16. Scheme of experimental diagnostics of PGJS using vertical laser line [33]. Reprinted with permission from ref. [33]. Copyright 2025, with permision from Elsevier.
Processes 13 02995 g016
Figure 17. Front view raw images vertical laser sheet illumination (top), average front view images (bottom) [10] (wavelength: 405 nm, sheet thickness: 50 µm, camera type: Basler camera acA720-540uc colour). Reprinted with permission from ref. [10]. Copyright 2025, with permision from Elsevier.
Processes 13 02995 g017
Figure 18. Schematic of the combined (lateral + coaxial) observation of the PGJS [17] (licensed under CC BY 4.0).
Processes 13 02995 g018
Figure 19. PGJS caustic analysis from lateral and coaxial view. Brightness measurements are taken from coaxial perspective to determine the internal powder stream structure (corresponding to 1% of the particles) within the blue circle, and the external powder stream structure (corresponding to 86% of the particles) within the red circle [17] (licensed under CC BY 4.0).
Processes 13 02995 g019
Figure 20. Superposed front view (top left panel), local maxima of Gaussian fits (top middle panel), axial distance definition (top right panel), relative pixel intensity curves (bottom panel), where the colours represent the axial distance from the nozzle outlet [10] (wavelength: 405 nm, sheet thickness: 50 µm, camera type: Basler camera acA720-540uc monochrome). Reprinted with permission from ref. [10]. Copyright 2025, with permision from Elsevier.
Processes 13 02995 g020
Figure 21. Experimental setup of lateral observation of the PGJS using a tilted camera [7] (licensed under CC BY 4.0).
Processes 13 02995 g021
Figure 22. Experimental setup for powder flow measurement: (a) schematic drawing, and (b) photo of the measurement setup [41] (licensed under CC BY 4.0).
Processes 13 02995 g022
Figure 23. Powder Gas Jet Analysis. Left: Schematic representation of the powder jet monitor; Right: 1000 Superimposed images, each of powder jet measurements taken from (ai) at different axial distances from the nozzle tip; 1: high-speed camera; 2: focusing optics; 3: nozzle mount and linear axle; 4: powder feed nozzle; 5: illumination laser; 6: powder–gas jet; 7: powder collection container; 8: calculated powder–gas jet focus level [43] (wavelength: 810 nm, sheet thickness: 260 µm, camera type: Mikrotron GmbH MC 1362 high-sensitivity) (licensed under CC BY 4.0).
Processes 13 02995 g023
Figure 24. Linear regression (dotted line) for the cumulative greyscale value and gravimetrically determined PMF [42] (licensed under CC BY 4.0).
Processes 13 02995 g024
Figure 25. Experimental setup with lateral positioned line laser and coaxially integrated camera [44] (licensed under CC BY 4.0).
Processes 13 02995 g025
Figure 26. PowderSpy hardware aligned with powder nozzle [45].
Processes 13 02995 g026
Figure 27. PGJS PowderSpy output: cross-section region and powder jet profile [46].
Processes 13 02995 g027
Figure 28. LIsec hardware aligned with powder nozzle [47].
Processes 13 02995 g028
Figure 29. PGJS LIsec output, shape and cross section from (a) intact nozzle, (b) nozzle after collision, and (c) intact nozzle with internal clogging [47].
Processes 13 02995 g029
Figure 30. Powder distribution profiles measured from the nozzle outlet at planes located at (a) 8 mm, (b) 5 mm, (c) 1 mm, and (d) focal plane (0 mm) [16]. Reprinted with permission from ref. [16]. Copyright 2025, with permision from Elsevier.
Processes 13 02995 g030
Figure 31. Image processing pipeline (author).
Processes 13 02995 g031
Figure 32. Selected examples of individual (top) and 3000 superimposed (bottom) pictures of PGJS measurements taken at 2 mm (E2) to 11 mm (E11) (wavelength: 810 nm, sheet thickness: 260 µm, camera type: Mikrotron GmbH MC 1362 high-sensitivity) (adapted from [19], licensed under CC BY 4.0).
Processes 13 02995 g032
Figure 33. Image thresholding: from greyscale to binary image [6].
Processes 13 02995 g033
Figure 34. (a) Level-by-level particle density representation on the horizontal; (b) level-wise particle density distribution representation on the vertical [19] (licensed under CC BY 4.0).
Processes 13 02995 g034
Table 1. Overview of weight-based techniques for PGJS characterisation and trapping methods.
Ref.Measured ParameterWeighting SystemPowder Collection Method
[13]PMFScaleTube connected to open container
[14]Plate with central pinhole
[15]Cylindrical containers with concentric holes (varied diameters)
[16]
Table 2. Overview of camera-based perspectives and illumination types in PGJS studies.
Camera SetupIllumination TypeRef.
LateralArea illumination[9,10,18,21,22,23,24,25,26,27,28,29,30,31,32]
Vertical laser line[10,17,20,33,34,35,36,37,38,39,40]
Horizontal laser line[7] * [10,17] ** [20] ** [40] ** [41]
CoaxialHorizontal laser line[18,41,42,43]
* Camera tilted to observe the illuminated particles from the top; ** camera placed under the nozzle with mirror reflecting the illuminated particles.
Table 3. Comparison of optical methods for reference settings: SG 3.5 L/min, CG 8 L/min, PFR 5 g/min [10].
Method TestedWavelengthLaser Sheet ThicknessPSD (µm)SOD (mm)Df (mm)
Area illuminationLED lamp—No specific wavelength givenN/A45–105
15–45
6.90
7.21
1.77
0.99
Vertical laser line405 nm50 µm45–105
15–45
6.99
7.14
1.89
0.95
Horizontal laser line45–105
15–45
6.95
7.44
2.27
1.14
Table 4. Laser wavelength and thickness, and cameras used in vertical laser line illumination.
Ref.Laser TypeWavelength (nm)Laser ThicknessCamera Type
[17]Red laser650200 µmCCD high-speed camera
[20]Red laser660200 µmDigital camera
[10]Blue-violet laser40550 µmHigh-speed camera
[33]**200 µmCCD high-speed camera
[34]Blue laser4471.93 mmHigh-speed camera
[35]Blue laser40520 µmCMOS high-speed camera
[36]**500 µmCMOS high-speed camera
[37]***High-speed camera
[38]Green laser5324000 µmDigital camera
[40]Green laser532200 µmCCD high-speed camera
[44]Blue laser450*CMOS high-speed camera
* Not specified.
Table 5. Experimental setups for horizontal laser line illumination.
Camera Position/
Viewing Angle
Ref.Laser Wavelength (nm)Laser ThicknessCamera TypeKey Output
Reflection from 45°
mirror below nozzle
[20]660200 µmDigital cameraHorizontal cross-sections,
powder concentration
[40]658CCD cameraHorizontal cross-sections,
max concentration spot and Df
[17]450CCD cameraHorizontal cross-sections, Df, SOD, powder density distribution
In front of nozzle,
directly views horizontal sheet
[10]40550 µmCMOS cameraPGJS shape, SOD and Df
Lateral to nozzle, directly views horizontal sheet[7]650150 µmCCD cameraPGJS shape, SOD and Df
Positioned at 90° relative to illuminating laser beam[41]520400 µmCMOS cameraParticle velocity, powder density distribution and Df
Table 6. Experimental setups for coaxial camera configuration.
Ref.Monitoring SystemLaser Wavelength/ThicknessCameraPropose/Outcome
[19,43]Offline
(Powder Jet Monitor)
810 nm/0.26 mmCMOS
high-speed
Quantitative determination of particle number and position
Statistical/numerical model for PDD, trajectories, gas/powder flow
Analyse PDD and jet diameters
[42,44]Online
(Image-based coaxial)
450 nm/Not statedCMOS
camera
Real-time monitoring during deposition
Detect inhomogeneities and deviations
Correlates greyscale with mass flow (g/min)
Table 7. PowderSpy and LIsec comparison.
EquipmentScanning StrategyReported MetricsPortabilityControl
PowderSpyCamera Fixed/Laser movesPowder Distribution in X-, Y-, and Z-axis
SOD
Df
StandaloneBrowse-based (requires no software installation)
LIsecLaser and Camera move togetherStandalone or Machine IntegratedManually by the user or via Message Queuing Telemetry Transport (MQTT) interface of the LIsec software (version 2.13)
Table 8. Table of symbols, descriptions, and units used in the powder scattering analysis.
SymbolDescriptionUnits
LAverage luminance (radiance) of scattering elementW·m−2
IrefReflected/scattered irradiance at detectorW·m−2
IincIncident irradiance on scattering volumeW·m−2
rDistance from scattering volume to detectorm
nNumber of particles within scattering volume-
VScattering volumem3
kWave number, k = 2π/λm−1
AProjected area of scattering volumem2
F (ξ,φ)Dimensionless Mie scattering function (depends on size parameter ξ, scattering angle and polarisation state φ)-
The term F(ξ,φ) derives from the Mie theory and represents the angular scattering distribution (phase function) normalised by scattering efficiency. It captures how particle size, orientation, and the polarisation of incident light influence the measured scattered intensity.
Table 9. Decision matrix comparing different PGJS characterisation methods.
MethodSpatial ResolutionTemporal ResolutionIntrusivenessSetup ComplexityIn Situ SuitabilityRobustness to Spatter/SmokeCostTRL
Weight-basedMediumLowHighLowLowHighLowMedium
Lateral Camera w/Area IlluminationMediumHighLowMedium to HighLowMediumMedium to HighHigh
Lateral Camera w/Vertical IlluminationHighHighLowMedium to HighMediumMediumMediumHigh
Lateral Camera w/Horizontal IlluminationHighMediumLowHighLowMediumMediumMedium
Coaxial Imaging (Offline Context)HighHighLowHighLowN/AHighMedium to High
Coaxial Imaging (Online Context)HighHighLowHighHighMediumHighMedium to High
Table 10. Uncertainty budget of weight-based methods for measuring PGJS.
Source of UncertaintyAssumed Value/RangeAffected Parameter (s)Propagation MethodContribution to Final Uncertainty
Rebound (Particle loss)20% particle loss, particles ejecting from plate upon collision [17].Powder mass flow, powder density profile.Particles that collide with the collection plate or pinhole and bounce away are missed, causing underestimation of powder flow density at the measurement point [17].The underestimation of powder concentration by 20% was a result of particle loss, leading to inaccuracies in peak concentration and Df measurements [17].
As example, if powder concentration is 100 mg/m3, but 20% of particles are lost, and SOD is defined as the position where powder density reaches 90 mg/m3 (threshold), it is now wrongly detected at a higher z (further from the actual SOD). As a result, the overestimation of Df by the relative error, in this case, 20%, occurs due to this miscalculation.
Scale resolution and driftRepeatability: 1, 0.12 mg. Settling time: 0.15 s [14].Powder mass flow, powder density profile.Directly affects accuracy of powder mass and dynamic readings, affecting the values used to determine focal properties [14].Not explicitly quantified as an uncertainty contribution in the sources.
However, it is implied that higher scale accuracy reduces overall measurement error [14].
Sampling time21 Hz (dynamic readings) [13]; 1 min (static collection) [15]. Powder density profile.Influences the temporal resolution and averaging of collected powder mass flow data. Lower sampling rates can miss transient changes, reducing fit precision, while longer static times help minimise random errors [15].Not explicitly quantified as an uncertainty contribution in the sources.
Pinhole effective areaDiameter: 0.6 mm [13], 2 to 12 mm [15].
Effective area: 0.83 times the geometric area (for 75 µm mean particle) [14].
Powder mass flow, powder density profile.Inaccurate pinhole effective areas, influenced by particle size/shape, directly impacts local powder flow density calculations [14].Using geometric instead of effective area can cause 17% powder capture underestimation, affecting accuracy of the powder concentration profile [14].
Table 11. Uncertainty budget of camera-based methods for measuring PGJS.
Source of UncertaintyAssumed Value/RangeAffected Parameter (s)Propagation MethodContribution to Final Uncertainty
Sheet thickness50 µm [10];
0.26 mm [19];
0.5 mm [36];
4 mm [38].
Powder concentration profile, particle count.Thicker illumination sheets capture particles beyond the 2D plane, causing concentration overestimation, blurring, and particle shading [19].Affects the accurate count of particles within the desired plane [19].
Pixel calibration50 pixels/mm (19.53 µm/pixel) [19];
0.106 mm/pixel [18];
20 µm/pixel [31].
SOD, Df.Pixel-to-mm conversion errors directly affect the measured dimensions of the powder stream, including SOD and Df [19].Not directly quantified as a specific contribution to SOD or Df uncertainty on the sources. However, if SOD is measured at 500 pixels, and pixel size is miscalibrated by 5% (e.g., 20 µm/pixel instead of 19 µm/pixel), then SOD appears as 500 × 20 = 10,000 µm = 10 mm, but true SOD is 500 × 19 = 9.5 mm. This 0.5 mm error directly propagates to SOD and Df values.
Thresholding/fitting errorDefinitions vary: 86% luminosity (1/e2) [16,29], 10% max intensity [33].SOD, Df.The thresholding criteria and the fitting algorithm used to define the boundaries of the PGJS intensity profile can introduce variations in the derived SOD and Df [10].Overall relative errors between simulated and experimental powder utilisation rates were below 14% [50].
Out-of-plane particleUniform brightness for particle distribution [40].Powder concentration, particle velocity.Particles outside the illuminated plane, or being obscured by other particles within the plane, can cause “loss-of-pairs” or false signals, affecting the concentration and velocity accuracy [18].Not directly quantified as a specific contribution to SOD or Df uncertainty on the sources.
Camera noise/saturationLow SNR (low-contrast images, small particles, short exposure),
overexposure,
greyscale discontinuities,
reduced particle count [10,22,42].
Particle detection, pixel estimation, velocity and displacement measurement, greyscale/powder concentration distribution, calibration validity, ROIs, precision.Random noise in the image can obscure particles or generate false signals, impacting particle detection and concentration accuracy. Saturation can lead to a loss of intensity gradient information, hindering accurate profile fitting [31].Leads to reduced measurement accuracy, bias errors, precision loss, over/under-estimation of particle and powder characteristics, and increased need for post-processing/experimental optimisation [10,22,42].
Table 12. Summarised table of measurement methods of PGJS characterisation.
Measurement
Principle
System SetupCommon Focus of MeasuringAdvantagesDisadvantages
Weight-basedPinhole3D powder flow density and distribution.
Powder mass flow rate.
Correlation of time-dependent data with spatial position.
Robust and suited for industrial applications.
It does not require complex or expensive optical measurement systems.
Provides quantitative powder mass distribution for different diameter rings
Enables the detection of inhomogeneities.
It can generate a 3D powder distribution profile.
Offline measurement.
It can be time-consuming.
It lacks the ability to track variations in powder flow velocity and turbulence, limiting its capability to capture the dynamic behaviour of the powder jet.
Provides an estimate of powder utilisation rate based on weight measurements, rather than directly measuring the actual powder distribution.
Cylindrical Containers
Camera-basedLateral Camera with Area IlluminationOverall PGJS behaviour and dynamics.
Particle velocity and trajectories through particle tracking.
Relative powder concentration (luminance intensity).
Powder stream shape, SOD, Df.
Captures the overall behaviour of the PGJS, suitable for qualitative analysis.
Particle tracking across frames enables velocity analysis.
It can detect individual particles.
It can utilise a low-cost hardware configuration.
No laser illumination is necessary for metallic particles.
It does not provide direct measurements of powder mass concentration.
Requires post-processing to filter out-of-camera focal plane particles.
Extremely high or low particle densities can lead to lower spatial resolution in measurements.
It can have high measurement uncertainty for in-process (real-time) approaches due to other process factors like scanning velocity or laser emissivity.
Lateral Camera with Vertical IlluminationLocal powder mass concentration and particle density distribution within a single plane.
Powder jet structure, including SOD, powder-waist diameter, and expansion angle.
Particle velocity and motion paths.
Particle count and position.
Directly measures local powder mass concentration.
Provides the powder jet structure and particle velocity.
Offers high-resolution quantitative data and real-time analysis.
Captures particles within one plane, eliminating the need to discard out-of-focus particles.
Commercially available systems exist (e.g., Ponticon PowderSpy).
It requires precise calibration of the line beam width and measurement area.
Particles that deviate from the thin illumination plane may remain undetected, leading to potential inaccuracies in the measurement.
The image only provides two-dimensional information.
Higher exposure time can result in overestimation of particle density as prolonged exposure may increase the apparent number of particles captured in the image.
Lateral Camera with Horizontal IlluminationTransverse cross-sections (XY planes) of the powder stream at various axial distances.
Maximum powder concentration spot and its diameter.
3D powder stream structure (by combining multiple XY planes).
Reconstruction of powder stream caustic.
Enables in-plane analysis of powder distributions.
Can locate the maximum concentration spot and its diameter.
Allow a 3D description of the stream by scanning different Z-positions.
Does not require discarding out-of-focus particles.
Requires a sophisticated setup involving precise alignment of the horizontal camera and illumination system, adding to the overall complexity of implementation.
It has a limited measurement area, dependent on the positioning of the plane.
Requires more processing time compared to area or vertical laser sheet methods.
Recognition of edges at the convergence location can be difficult due to high particle interaction, leading to a wider illuminated area and potential experimental error.
Horizontal Camera with Horizontal IlluminationOnline, in-process monitoring of the powder stream.
Homogeneity of the powder feed and detection of individual powder jets.
Quantitative measurement of overall powder mass flow rate.
Particle density in a specific horizontal plane illuminated by the laser.
Enables in-process monitoring of the powder stream.
It can provide high contrast between the powder and background despite the active processing laser, especially with optical filters.
Capable of detecting deviations in powder mass flow early.
Determines particle density distribution per plane.
Requires careful selection and tuning of filters and illumination wavelength to ensure sufficient contrast.
Particle-particle shading (overlap) can lead to erroneous particle identification at high densities.
The measured number of particles is influenced by various factors including illumination line height, exposure time, camera chip resolution, and particle velocity.
Necessitates the use of sophisticated and costly optical measurement systems to accurately capture and analyse the powder stream dynamics.
Disclaimer/Publisher’s Note: The statements, opinions and data contained in all publications are solely those of the individual author(s) and contributor(s) and not of MDPI and/or the editor(s). MDPI and/or the editor(s) disclaim responsibility for any injury to people or property resulting from any ideas, methods, instructions or products referred to in the content.