1. Introduction
Cyanobacteria are a group of ancient monophyletic autotrophic microalgae, often referred to as blue-green algae [
1]. They were one of the first photosynthetic organisms to evolve and were the drivers of the Great Oxygenation Event 2.4 billion years ago, fundamentally transforming Earth’s atmosphere, which was dominated by carbon dioxide and methane [
2]. Notably, cyanobacteria are estimated to fix carbon with an efficiency nearly ten times greater than that of terrestrial plants [
3,
4]. Having served as a photosynthetic powerhouse billions of years ago by capturing vast amounts of atmospheric carbon, cyanobacteria may once again offer a potential solution to address our modern carbon crisis. In the past century,
has risen from 300 to an alarming 400 ppm, primarily due to the burning of fossil fuels [
5]. Beyond serving as a carbon sink, cyanobacteria’s carbon sequestration pathways make them a promising source of bioproducts that could replace fossil-fuel-derived inputs in industrial processes. Certain cyanobacteria strains are capable of nitrogen fixation, which makes them suitable for use as sustainable biofertilizers and soil conditioners [
6]. Some compounds in cyanobacteria have also demonstrated natural antioxidant and water retention properties, revealing promising applications in the cosmetic industry [
7]. Pathways leading to the synthesis of diacylglycerol (DAG) and triacylglycerol (TAG) have been identified, offering key precursors for biodiesel production [
3,
8,
9].
In addition to their metabolic versatility, cyanobacteria store fixed carbon primarily as glycogen—a glucose polymer that can be hydrolyzed into free glucose following cell lysis [
10]. This glucose serves as a renewable feedstock for diverse applications within the biorefinery sector, including the production of biofuels, pharmaceuticals, and textiles [
11]. Notably, glucose has shown particularly strong potential for high-yield bioethanol production [
12,
13]. Beyond industrial use, cyanobacteria-derived glucose has also been explored as a valuable nutritional supplement, which is an increasingly relevant area of research as the world faces a climate-driven food security crisis [
14,
15]. Developing an efficient system for the continuous cultivation of cyanobacteria and extraction of its glucose byproducts could therefore play a vital role in addressing these climate challenges. The strain,
Synechocystis sp. PCC 6803, was selected for cultivation due to its high photosynthetic efficiency and extensive characterization in the scientific literature [
16].
Given the potential of cyanobacteria to generate high-value bioproducts, there is a growing need for infrastructure that supports efficient cultivation and harvesting of these compounds. While commercially available bioreactors are available, they are often expensive, proprietary, and poorly suited to integrate into biomanufacturing pipelines. In response, the academic community has developed a range of systems tailored to cyanobacterial cultivation, each with distinct features and constraints. For example, a closed photobioreactor system has been developed to maintain controlled growth conditions and enable the selective enrichment of cyanobacteria over extended cultivation periods [
17]. The Open Source Bioreactor Project offers a benchtop, modular system intended for microbial cultivation and educational use [
18]. Flat-plate photobioreactors have also been constructed using economical materials to support laboratory-scale biomass production [
19]. Despite these efforts, many existing systems lack integrated downstream processing capabilities—such as biomass lysis and product filtration—and are not readily adaptable to customized or open-source biomanufacturing workflows. This underscores the need for a comprehensive, low-cost, and modular bioreactor platform that addresses both cultivation and downstream processing requirements. In particular, no studies appear to have reported a bioreactor system that integrates cyanobacterial cultivation with downstream biomass processing specifically for glucose extraction.
In this work, we present the design, fabrication, and validation of a low-cost bioreactor coupled with an integrated biomass processing unit for cultivating Synechocystis sp. PCC 6803 and extracting glucose as a valuable bioproduct. This system is significantly more affordable than commercial alternatives, fully open-source, and modular in design, allowing seamless integration into diverse biomanufacturing pipelines. The system architecture is readily adaptable for the extraction of alternative bioproducts with minimal modifications.
2. Materials and Methods
2.1. Bioreactor and Control System Design
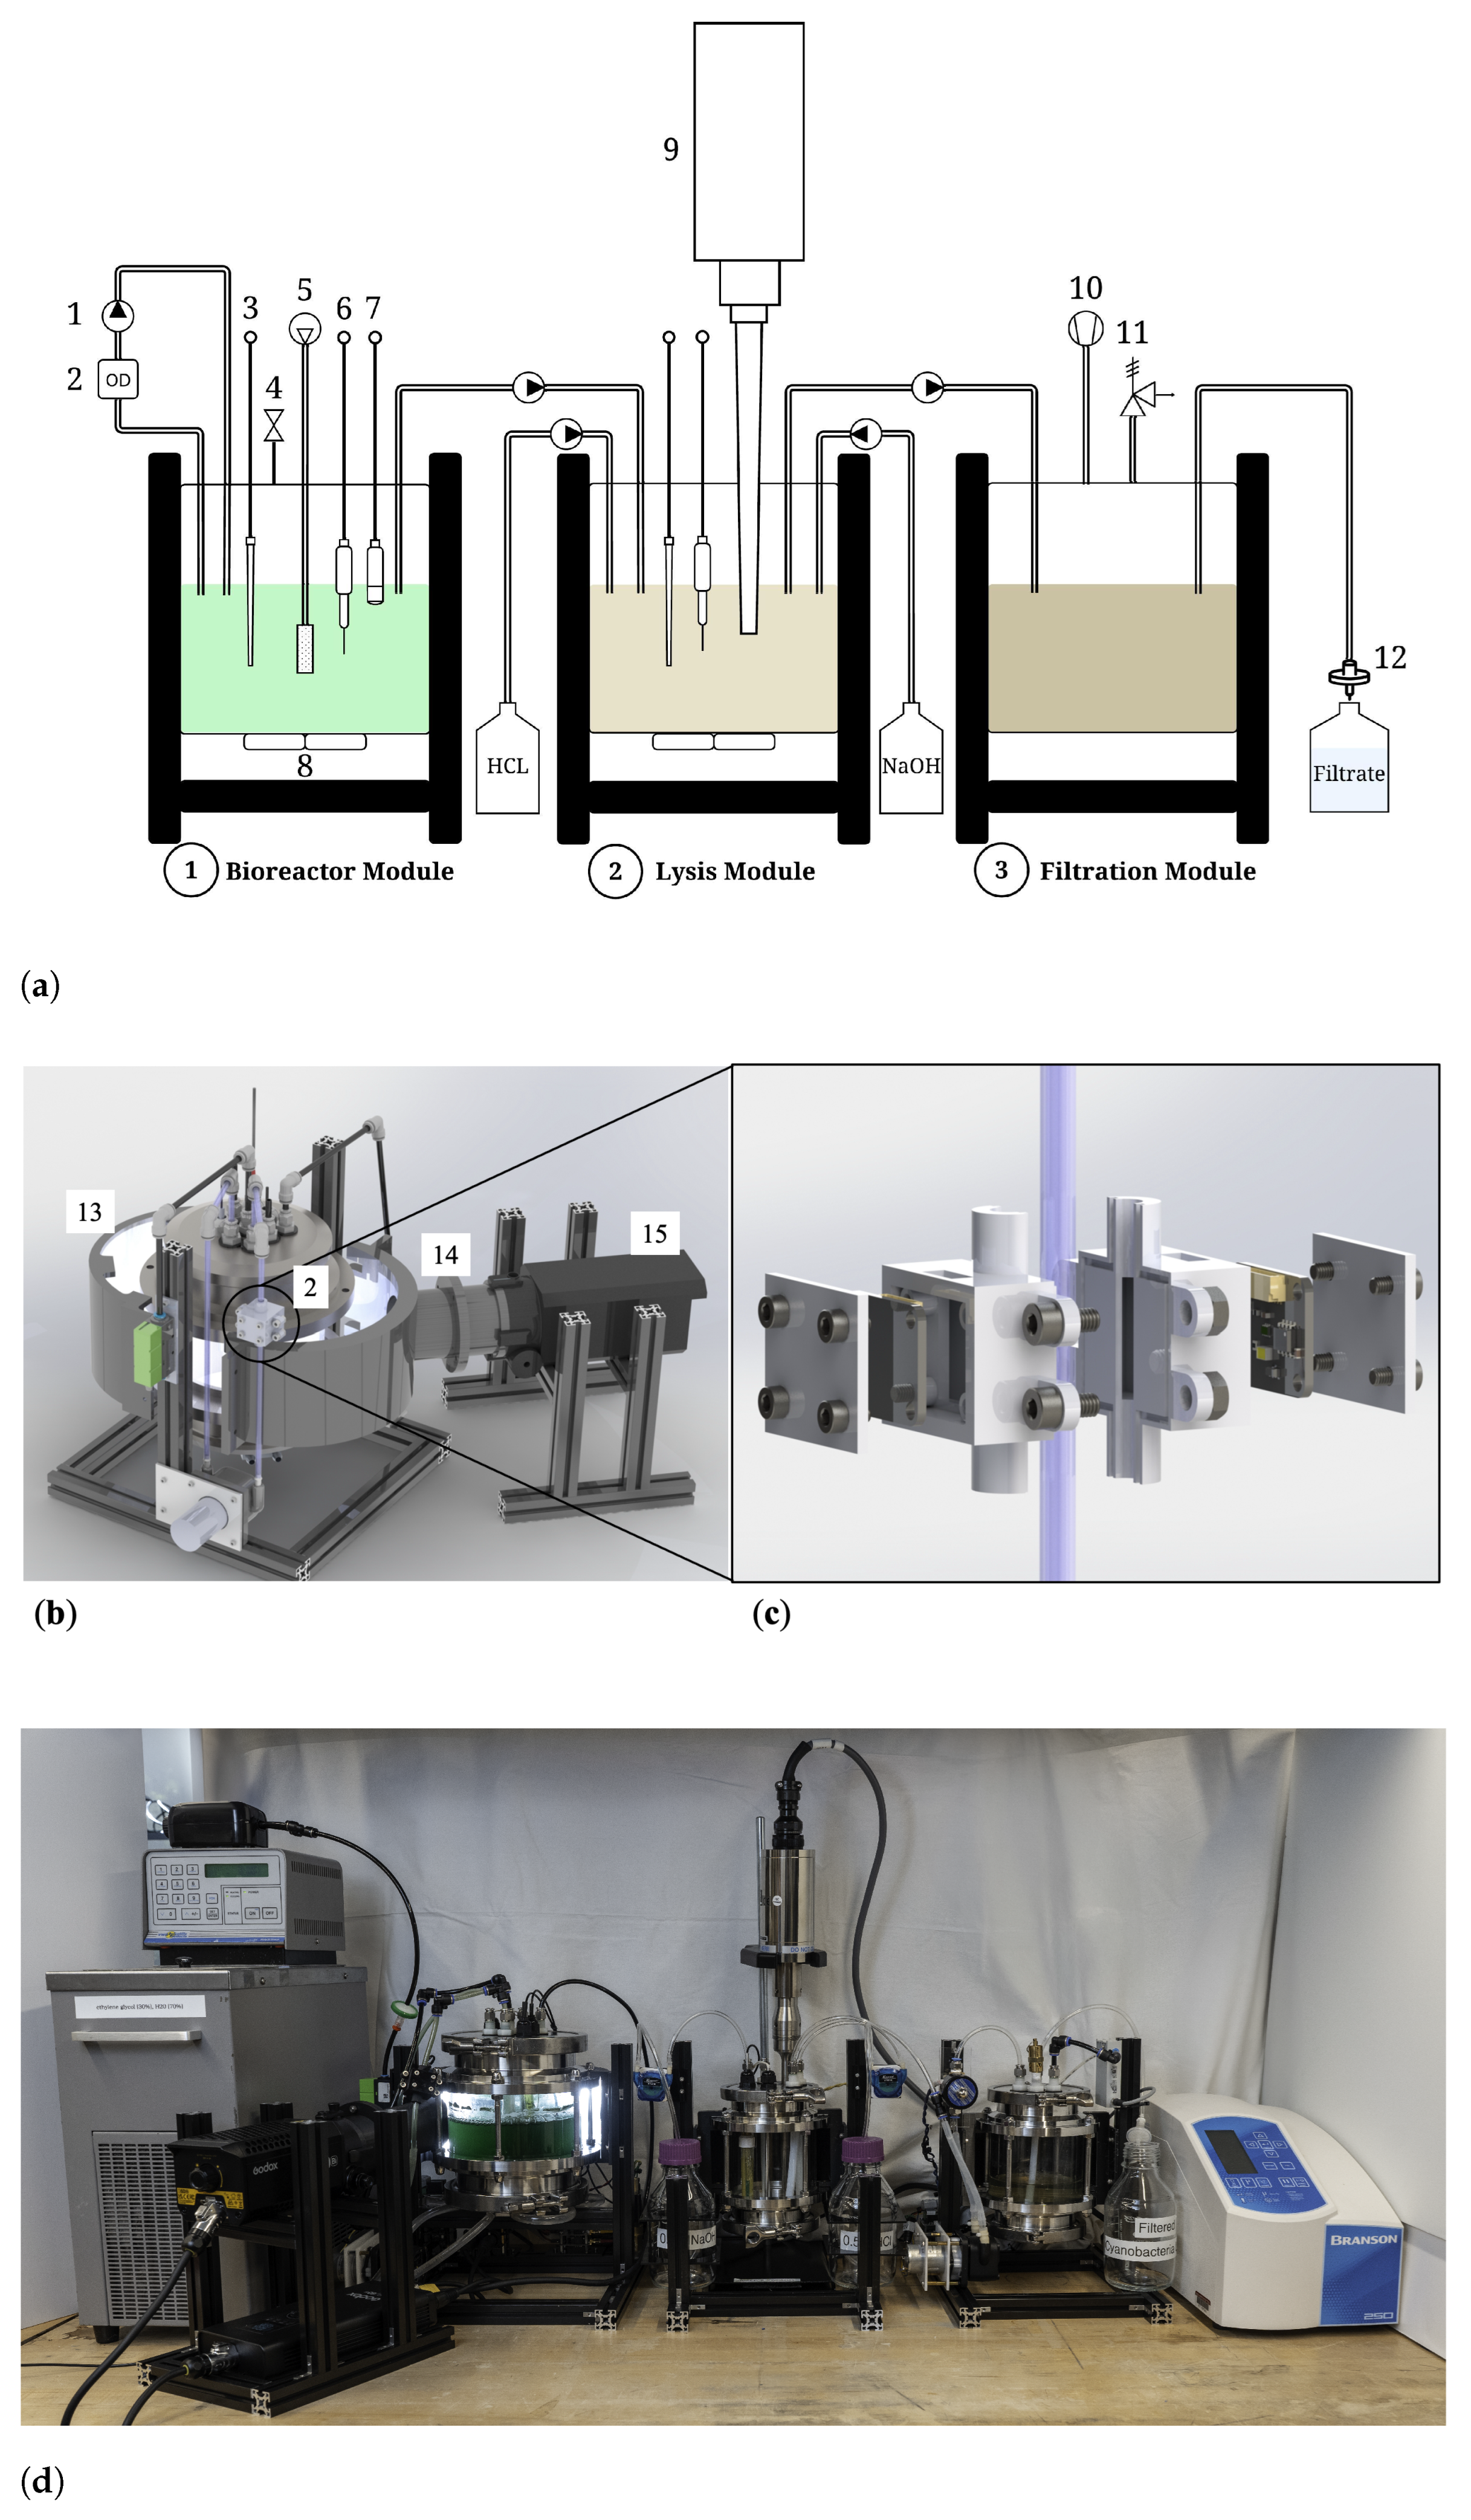
The system can be divided into three functional subsystems as illustrated in
Figure 1: first, the bioreactor, where
Synechocystis is cultivated under controlled light and nutrient conditions; second, the lysis module, which breaks down the cells to release intracellular molecules; finally, the filtration module, which isolates and collects glucose from the lysate. Each module was assembled using in-line sight glasses fitted with stainless steel (SUS316) bodies and sanitary tri-clamps (manufactured by Dernord). The bioreactor unit was assembled with a larger outer diameter of
(5 in tri-clamp ferrule) and a height of
to accommodate multiple probes and additional instrumentation. In contrast, the lysis and filtration modules were more compact, each with an outer diameter of
(4 in tri-clamp ferrules) and a height of
. All modules were supported with T-slot extrusions assembled to provide structural support. Sanitary fittings were used throughout the assembly, ensuring aseptic connections and ease of sterilization, while all system components were fully autoclavable.
The bioreactor module was instrumented with a suite of sensors, as illustrated in the schematic in
Figure 1a and listed in
Table 1. pH and dissolved oxygen were monitored using probes from Atlas Scientific, calibrated using standard 3-point and 2-point procedures, respectively. These sensors interfaced with Atlas EZO circuits and communicated via UART through a Tinkerforge RS232 Bricklet. Temperature was measured using an RTD probe connected to a Tinkerforge Industrial PTC Bricklet.
Water cooling blocks were adhered to the base of the bioreactor to regulate temperature and were connected to a recirculating chiller to maintain stable thermal conditions during cultivation. To ensure adequate aeration and mixing, an air pump was connected to a syringe filter and sparger in series, and a normally open valve was installed to allow passive venting from the otherwise closed system. The reactor lid, purchased from Dernord, was custom-machined to accommodate all instrumentation using appropriate pipe fittings and cord grips.
A peristaltic pump was used in series with a custom-built optical density (OD) measurement module, shown in detail in
Figure 1. This module incorporates two Tinkerforge Color Bricklets—one configured to emit light and the other to detect transmitted light intensity across the red, green, and blue (RGB) channels. A 3D-printed, light-tight housing holds a 6 mm outer diameter culture tube between the two sensors, thereby defining the optical path length. The design ensures that only light passing directly through the culture reaches the detector, minimizing interference from ambient or scattered light.
A Godox LED focusing light was selected for its programmable control over both light intensity and color temperature. To ensure uniform illumination around the bioreactor’s circumference, two custom shrouds were designed and 3D-printed to mount on either side of the reactor, as shown in
Figure 1b. A baffle was also designed to direct the light from the Godox unit into the shrouds. This baffle was printed using multi-filament 3D printing, with a white PLA inner surface to enhance light reflectivity. It channels the light so that it strikes the inner wall of the rear shroud. Both shroud halves are lined with Mylar tape to further reflect and distribute light evenly into the bioreactor.
To evaluate the average light intensity,
i, distributed within the cylindrical culture volume, the following expression was used, which accounts for both radial and angular light attenuation as a function of the incident light
, using the bioreactor radius
R, the cell concentration
c, and the absorption coefficient
[
20]:
where the expression is integrated over the angular coordinate
and the arc length
S along the circumference of the cylindrical bioreactor. This analysis guided the design of the baffle length and the programmed intensity of the Godox light source, both of which influence the incident illumination on the bioreactor.
The lysis module was equipped with the same sensors as the cultivation unit, including a pH probe, an RTD temperature probe, and aluminum water cooling blocks connected to a recirculating chiller with a cooling capacity of . Two peristaltic pumps were integrated into the system: one to supply acid and another to supply base from external tanks for chemical lysis. Additionally, a Branson SFX250 Sonifier probe, operating at 12 kHz with a power output of 250 W, was integrated into the module to supplement chemical lysis with ultrasonic disruption.
The filtration module was designed to be air-tight and connected to an air compressor to facilitate pressure-driven filtration. A safety valve rated to 689.5 kPa (100 PSI) was included to prevent overpressurization. Filtrate was collected through a tube fitted with a 0.22 µm syringe filter, enabling removal of the clarified lysate as the final product.
Table 1.
Itemized list of instrumentation used in the bioprocessing platform.
Table 1.
Itemized list of instrumentation used in the bioprocessing platform.
| Item No. | Instrument | Manufacturer | City/Country | Unit Cost | Qty |
|---|
| 1 | Peristaltic pump (KPHM400-SW3B25) | Kamoer Fluid Tech | Shanghai, China | USD 30 | 5 |
| 2 | Custom optical density instrument | Tinkerforge + in-house | Schloß Holte, Germany | USD 30 1 | 1 |
| 3 | RTD temperature probe | YAOAWE | — | USD 12 | 2 |
| 4 | Air valve (USS2-00081) | US Solid | St Cleveland, OH, USA | USD 30 | 1 |
| 5 | Air pump and sparger | Uniclife | Denver, CO, USA | USD 14 | 1 |
| 6 | pH Probe (ENV-40-pH) | Atlas Scientific | New York, NY, USA | USD 160 | 2 |
| 7 | Dissolved Oxygen Probe (ENV-20-DOX) | Atlas Scientific | New York, NY, USA | USD 215 | 1 |
| 8 | Aluminum cooling block connected to chiller | Kalolary | Guangzhou, China | USD 8 | 2 |
| 9 | Sonifier probe (SFX250) | Branson | Danbury, CT, USA | USD 7000 2 | 1 |
| 10 | Air compressor (CAT-1P1060S) | California Air Tools | San Diego, CA, USA | USD 170 | 1 |
| 11 | Safety valve | Bonuci | — | USD 11 | 1 |
| 12 | 0.22 µm syringe filter | Membrane Solutions | Auburn, WA, USA | USD 1 | 1 |
| 13 | 3D-printed shroud | In-house | — | USD 10 | 2 |
| 14 | 3D-printed baffle | In-house | — | USD 10 | 1 |
| 15 | Focusing LED Light (S60Bi) | Godox | Shenzhen, China | USD 400 | 1 |
2.2. Inoculum and Growth Conditions
The cyanobacterium, Synechocystis sp. (strain designation PCC 6803), was obtained from the American Type Culture Collection (ATCC 27184). Cyanobacterial cultures were grown in BG-11 medium (Thermo Fisher Scientific, Waltham, MA, USA, catalog no. A1379901), a commercially prepared formulation commonly used for freshwater cyanobacteria. No modifications were made to the supplied medium, and the complete composition is available from the supplier. To maintain a near-neutral pH during cultivation, a 1.0 M HEPES buffer solution (pH 7.5; Thermo Fisher Scientific) was added to the culture medium. All autoclavable components of the cultivation line (sight-glass vessels, stainless steel tri-clamp fittings, and tubing) were sterilized by autoclaving at for 30 min. Components that could not be autoclaved, such as the pH, dissolved oxygen probes, and pumps, were sanitized by surface treatment with 70% (v/v) ethanol, followed by sterile air-drying prior to installation. Aeration and vent lines were equipped with hydrophobic PTFE filters to maintain aseptic conditions during cultivation.
The environmental conditions during cultivation were regulated by the instrumentation integrated into the bioreactor system. Aeration was provided by an air pump delivering a flow rate of
, where the uncertainty represents the standard deviation across repeated measurements. Temperature was controlled using a recirculating chiller set to
, which maintained the culture at a stable temperature near this setpoint. Illumination was supplied by a Godox LED—initially set to
—and measured by a quantum PAR meter (Apogee Instruments MQ-510). This irradiance level was selected based on previous studies identifying it as optimal for promoting rapid growth in
Synechocystis sp. PCC 6803 [
23]. Due to light attenuation within the culture medium, the average internal light intensity was calculated using Equation (
1) to be approximately
. However, to experimentally identify optimal illumination conditions for biomass accumulation, four light regimes were tested with varying levels of illumination, temporal light cycles, and color temperature cycles: (i) a 12 h light/dark cycle at
, (ii) continuous illumination at
, (iii) continuous illumination at
, and (iv) a dynamic color temperature gradient under
. The first three conditions were operated at a fixed color temperature of 6500 K, while the fourth involved a time-varying cycle that transitioned from 3500 K to 6500 K during the light phase, held steady at 6500 K, and gradually returned to 3500 K before entering a 12 h dark period—thereby emulating natural day/night and circadian color patterns.
Throughout the cultivation period, growth conditions were continuously monitored, with real-time data collected for dissolved oxygen, pH, optical density (OD), temperature, and airflow into the sparger. This dataset was used to train and evaluate the performance of several machine learning models—including linear regression, random forest, and XGBoost—with the goal of predicting OD based on environmental parameters and system inputs. These models lay the foundation for characterizing the system and enabling closed-loop control and autonomous optimization of growth conditions in future photobioreactor systems.
2.3. Biomass Processing and Glucose Extraction
While still in the growth phase, the culture was transferred from the cultivation unit to the lysis module, where it first underwent ultrasound treatment for 20 min using a 5 s on/off pulsing cycle to prevent overheating. To maintain low temperatures during sonication and prevent metabolite degradation, the recirculating chiller was set to 0 °C. The objective of ultrasound treatment is to disrupt the cell membrane through cavitation-induced mechanical stress [
24]. Following sonication, the culture was treated with 0.5 M hydrochloric acid and heated to 90 °C for one hour, a process adapted from the literature to hydrolyze complex polysaccharides—such as glycogen—into simple sugars like glucose [
25,
26,
27,
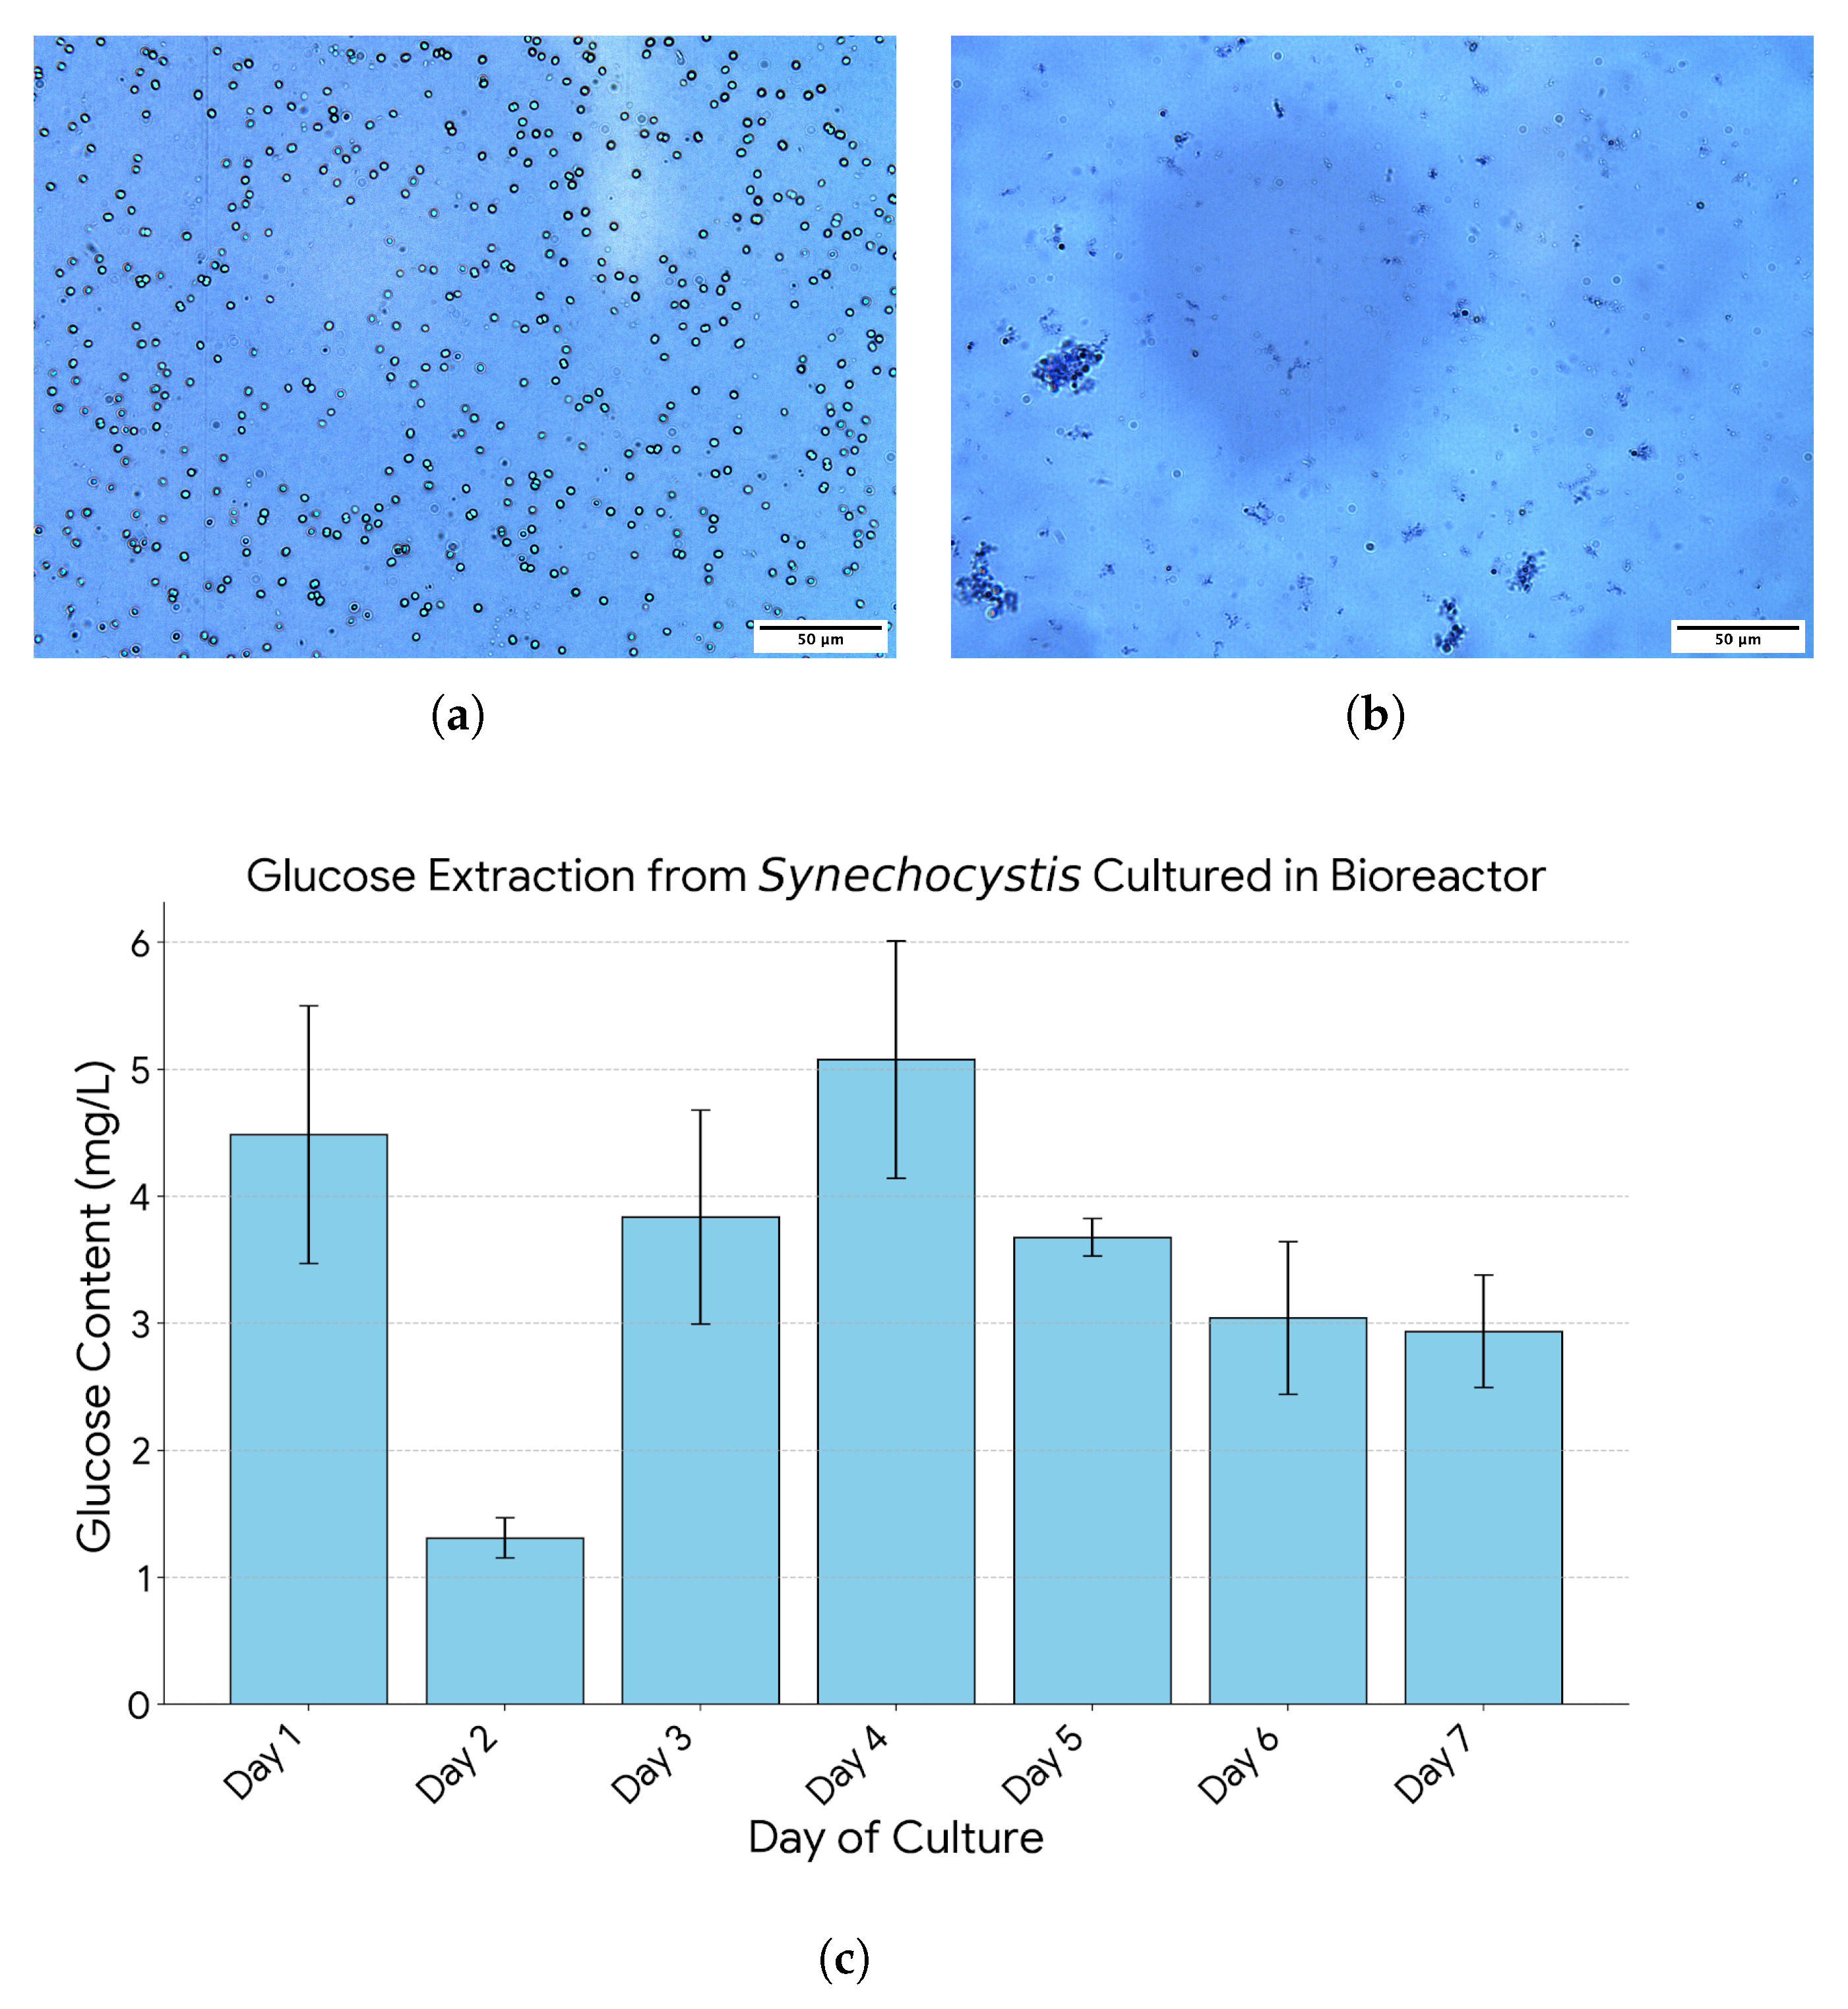
28]. Finally, the lysate was neutralized by titration with 0.5 M sodium hydroxide. Throughout the lysis procedure, both temperature and pH were continuously monitored to prevent thermal degradation and to ensure accurate pH adjustment to near-neutral conditions. Lysis efficacy was qualitatively confirmed by staining culture aliquots collected before and after treatment with Trypan Blue (1:1 ratio) and examining the resulting changes in cell morphology and coloration under microscopic observation. After lysis, the lysate was transferred to the filtration unit, where the vessel was pressurized to approximately 400 kPa to drive the lysate through a 0.22 µm syringe filter. This process allows glucose and other small molecules to pass into the filtrate, while retaining macromolecules and cellular debris. In this way, the filtration module serves as the primary debris separation step within the integrated bioreactor system, ensuring that only clarified lysate reaches the collection vessel.
2.4. Analytical Methods
2.4.1. Determination of Biomass and Growth Rate
Culture growth was monitored at hourly intervals using a custom-built OD instrument. To maintain a low-cost design, OD measurements were derived from the transmitted light intensity over a wavelength range rather than through narrow-band filtering. Red light in the range of 620
to 750
was chosen, consistent with the standard practice of measuring
Synechocystis optical density within this spectral region [
29,
30]. OD was calculated using a simplified form of the Beer–Lambert law, which describes the attenuation of light through a medium [
31]:
where
denotes the intensity measured through a blank, and
I is the transmitted intensity through the culture.
The resulting OD value serves as a proxy for biomass concentration, with higher OD indicating greater cell density due to increased light absorption and scattering. To standardize readings from the custom-built instrument, OD measurements at 680 nm were taken daily using a spectrophotometer, with samples collected in biological triplicates throughout the culture period.
In parallel, dry biomass was quantified daily for selected cultures to further characterize growth. For this, 10 mL of culture was vacuum filtered through pre-weighed nylon filters. Filters were collected in triplicate and dried overnight in an oven at 70 °C. The change in filter mass, normalized by the culture volume, was used to calculate dry biomass concentration (g L−1).
OD measurements collected throughout the cultivation period were used to calculate the specific growth rate,
, which describes the rate of biomass increase during the logarithmic growth phase [
19]:
where
and
are the OD values at the initial time
and later time
t, respectively.
Additionally, dry biomass measurements were used to quantify culture productivity,
P, representing the average rate of biomass accumulation over the cultivation interval [
32]:
2.4.2. Analysis of Glucose Concentration
To verify that glucose could be harvested from the system, glucose concentration of lysate samples was determined by high-performance liquid chromatography (HPLC, Agilent Technologies, Santa Clara, CA, USA 1260) equipped with a refractive index detector and an HPX-87H column (Bio-Rad, Hercules, CA, USA). The mobile phase consisted of sulfuric acid (Sigma-Aldrich, St. Louis, MO, USA), with a flow rate of at . The injection volume was .
First, a calibration curve was developed by performing serial dilutions with a glucose standard. To prepare the lysis sample, culture was extracted from the bioreactor and lysed using the protocol described above (sonication followed by acid hydrolysis). The lysate was then processed for HPLC analysis by concentrating the supernatant: samples were first centrifuged, and the supernatant was dried under a continuous stream of air. The resulting residue was reconstituted in 1 mL of ultrapure water, dried again, and finally resuspended in 150 µL. After a final centrifugation step, the clarified supernatant was analyzed by HPLC. This procedure was performed daily on 10 mL culture samples in biological triplicate. Glucose concentrations were determined from the peak intensities using the standard calibration curve, and then scaled to reflect the concentration in the original bioreactor culture, accounting for the sample concentration steps.
3. Results
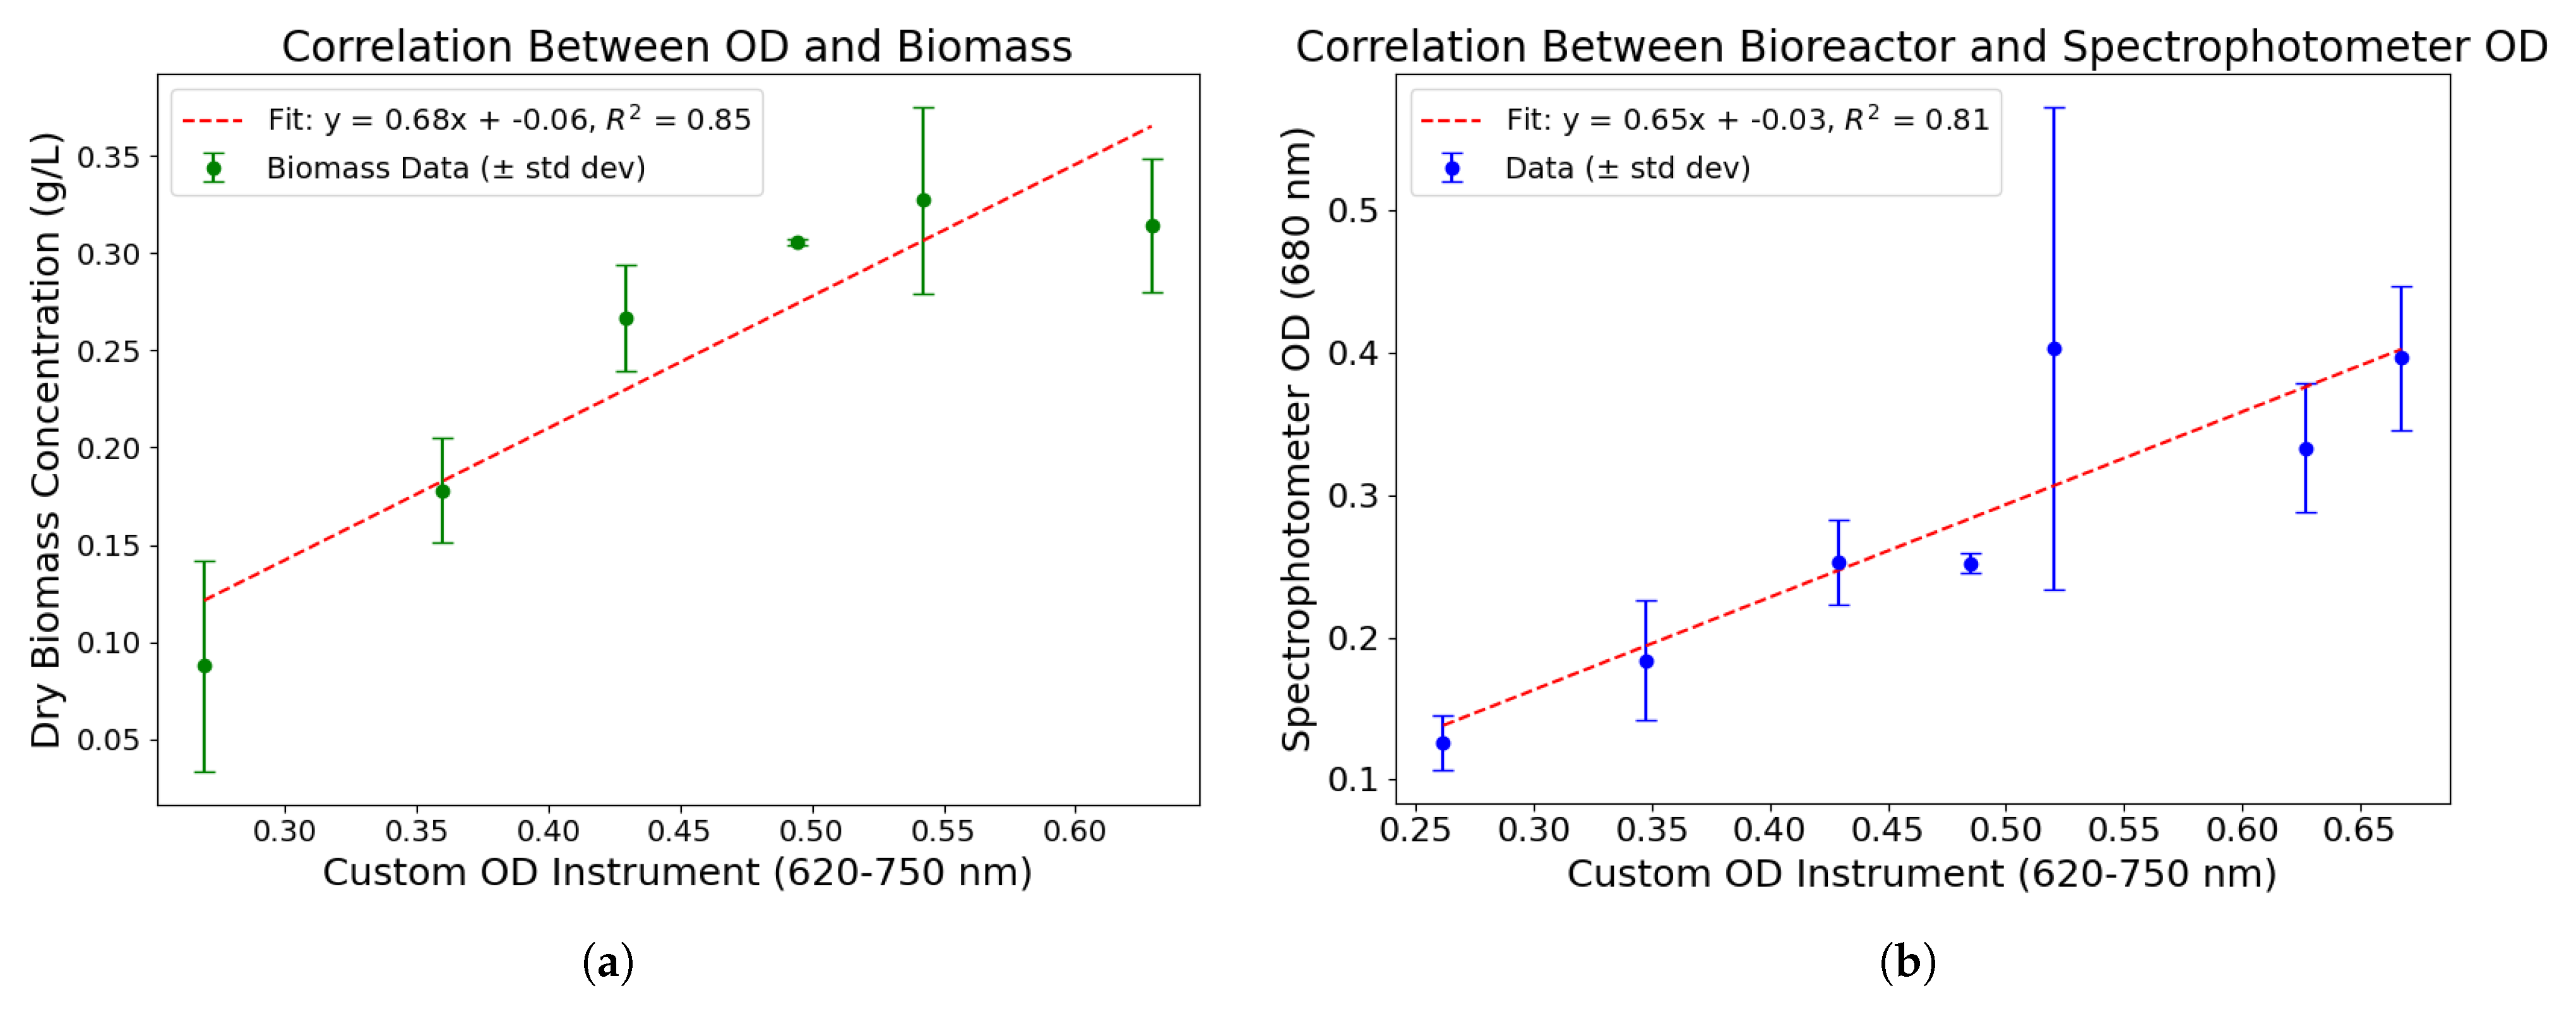
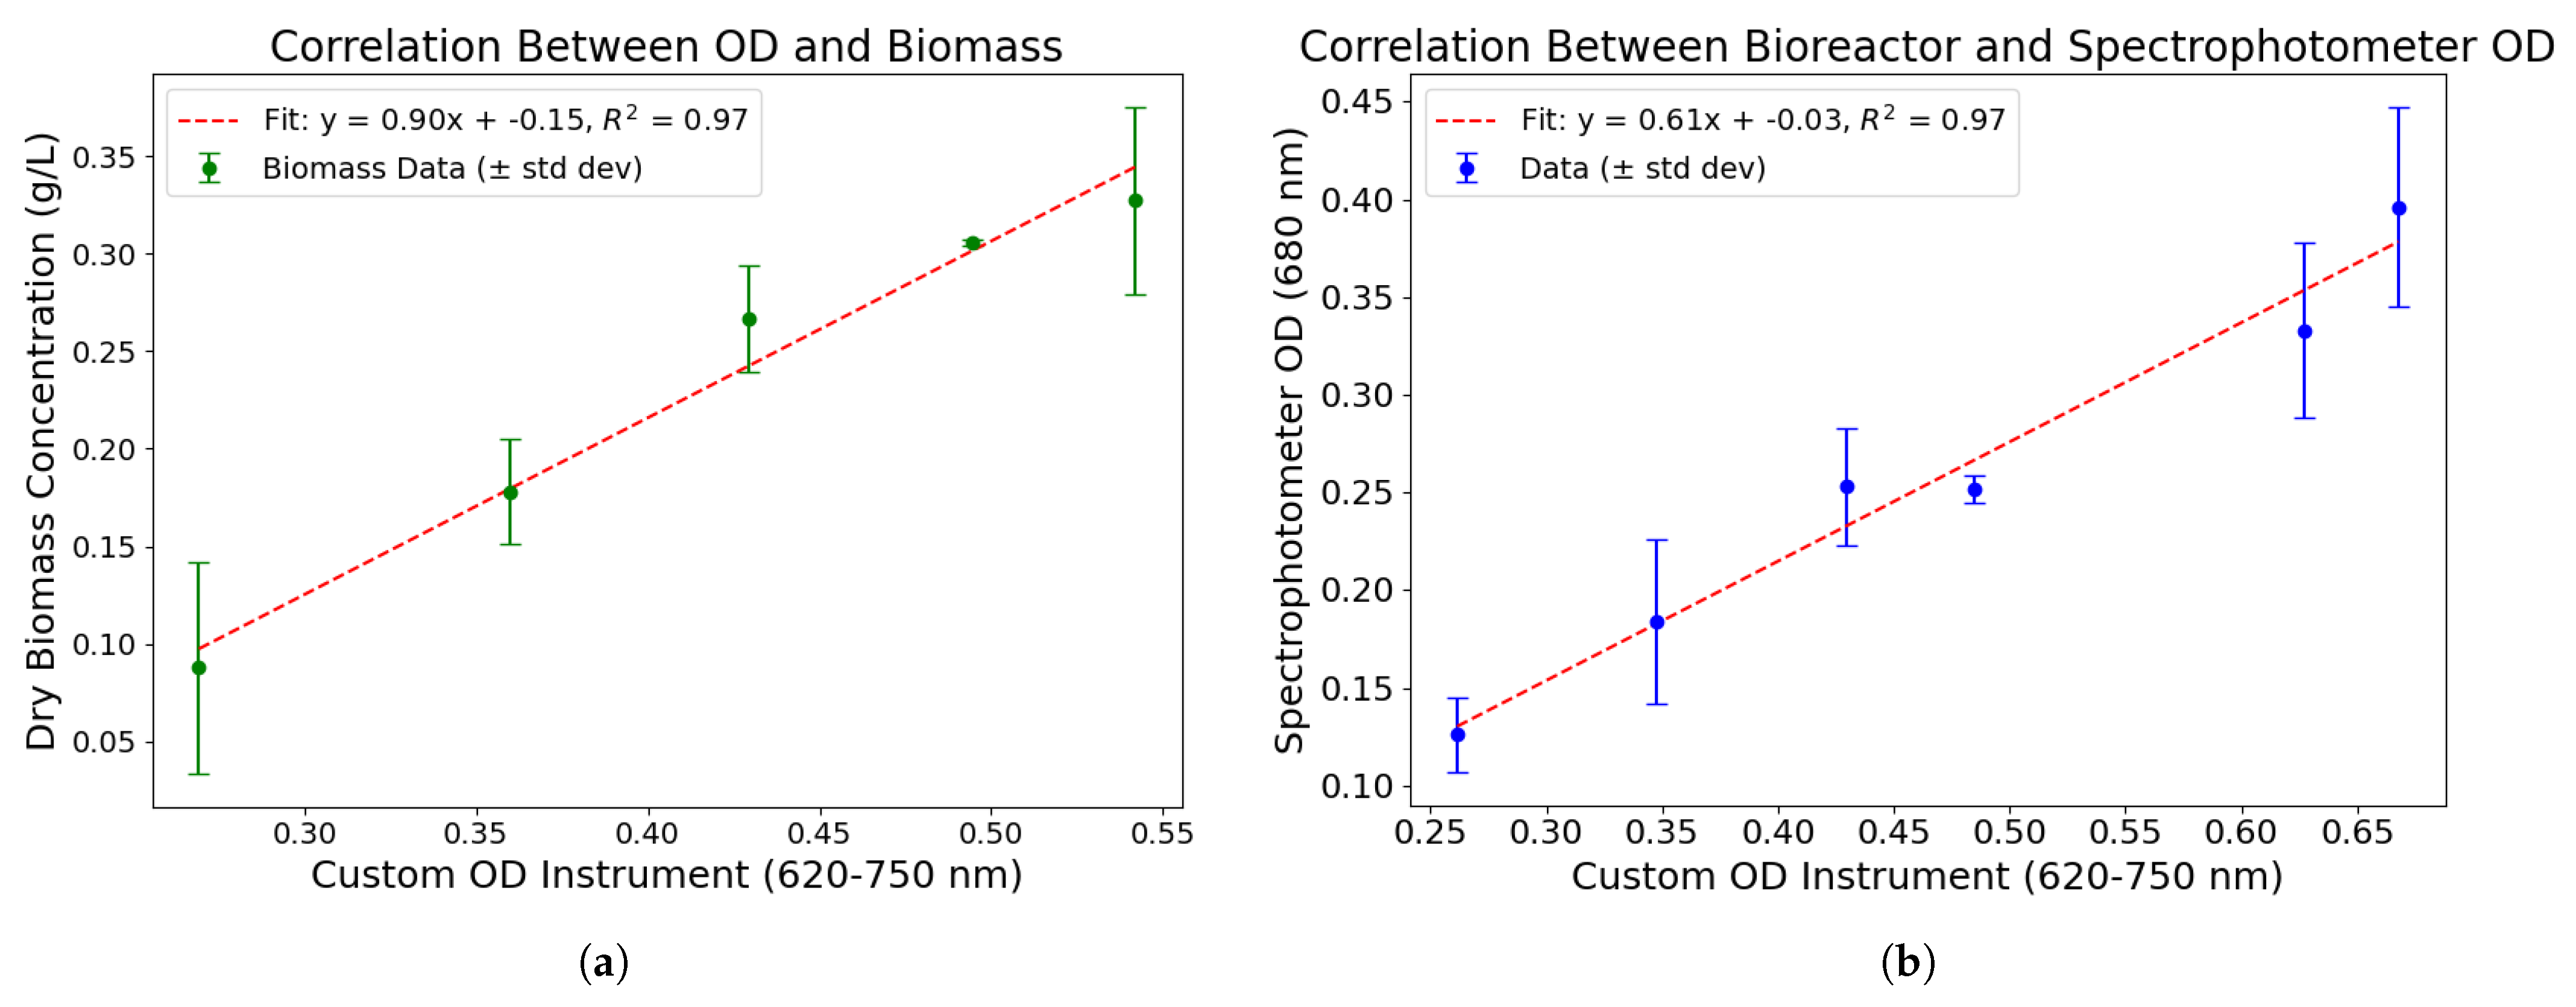
To assess the performance of the custom-built OD module, unitless OD values calculated from measured red light absorbance (620–750 nm) were compared with two independent reference measurements: gravimetrically determined dry biomass and spectrophotometer OD at 680 nm (
Figure 2). A strong linear correlation was observed between the calculated OD and dry biomass concentration (
;
Figure 2a), indicating that OD from the custom sensor can serve as a reliable proxy for biomass accumulation. Based on the biomass time course, the maximum productivity recorded during the cultivation period was approximately 90 mg
. Similarly, calculated OD values showed a high degree of agreement with spectrophotometer readings (
;
Figure 2b), further validating the performance of the custom instrument. In both cases, data was collected in triplicate and are shown with standard deviation error bars. One data point was excluded from each regression due to deviation from the expected trend; however, the full datasets are provided in
Figure A1. To characterize the growth of the remaining cultures, optical density measurements from the custom-built module were used, denoted as
.
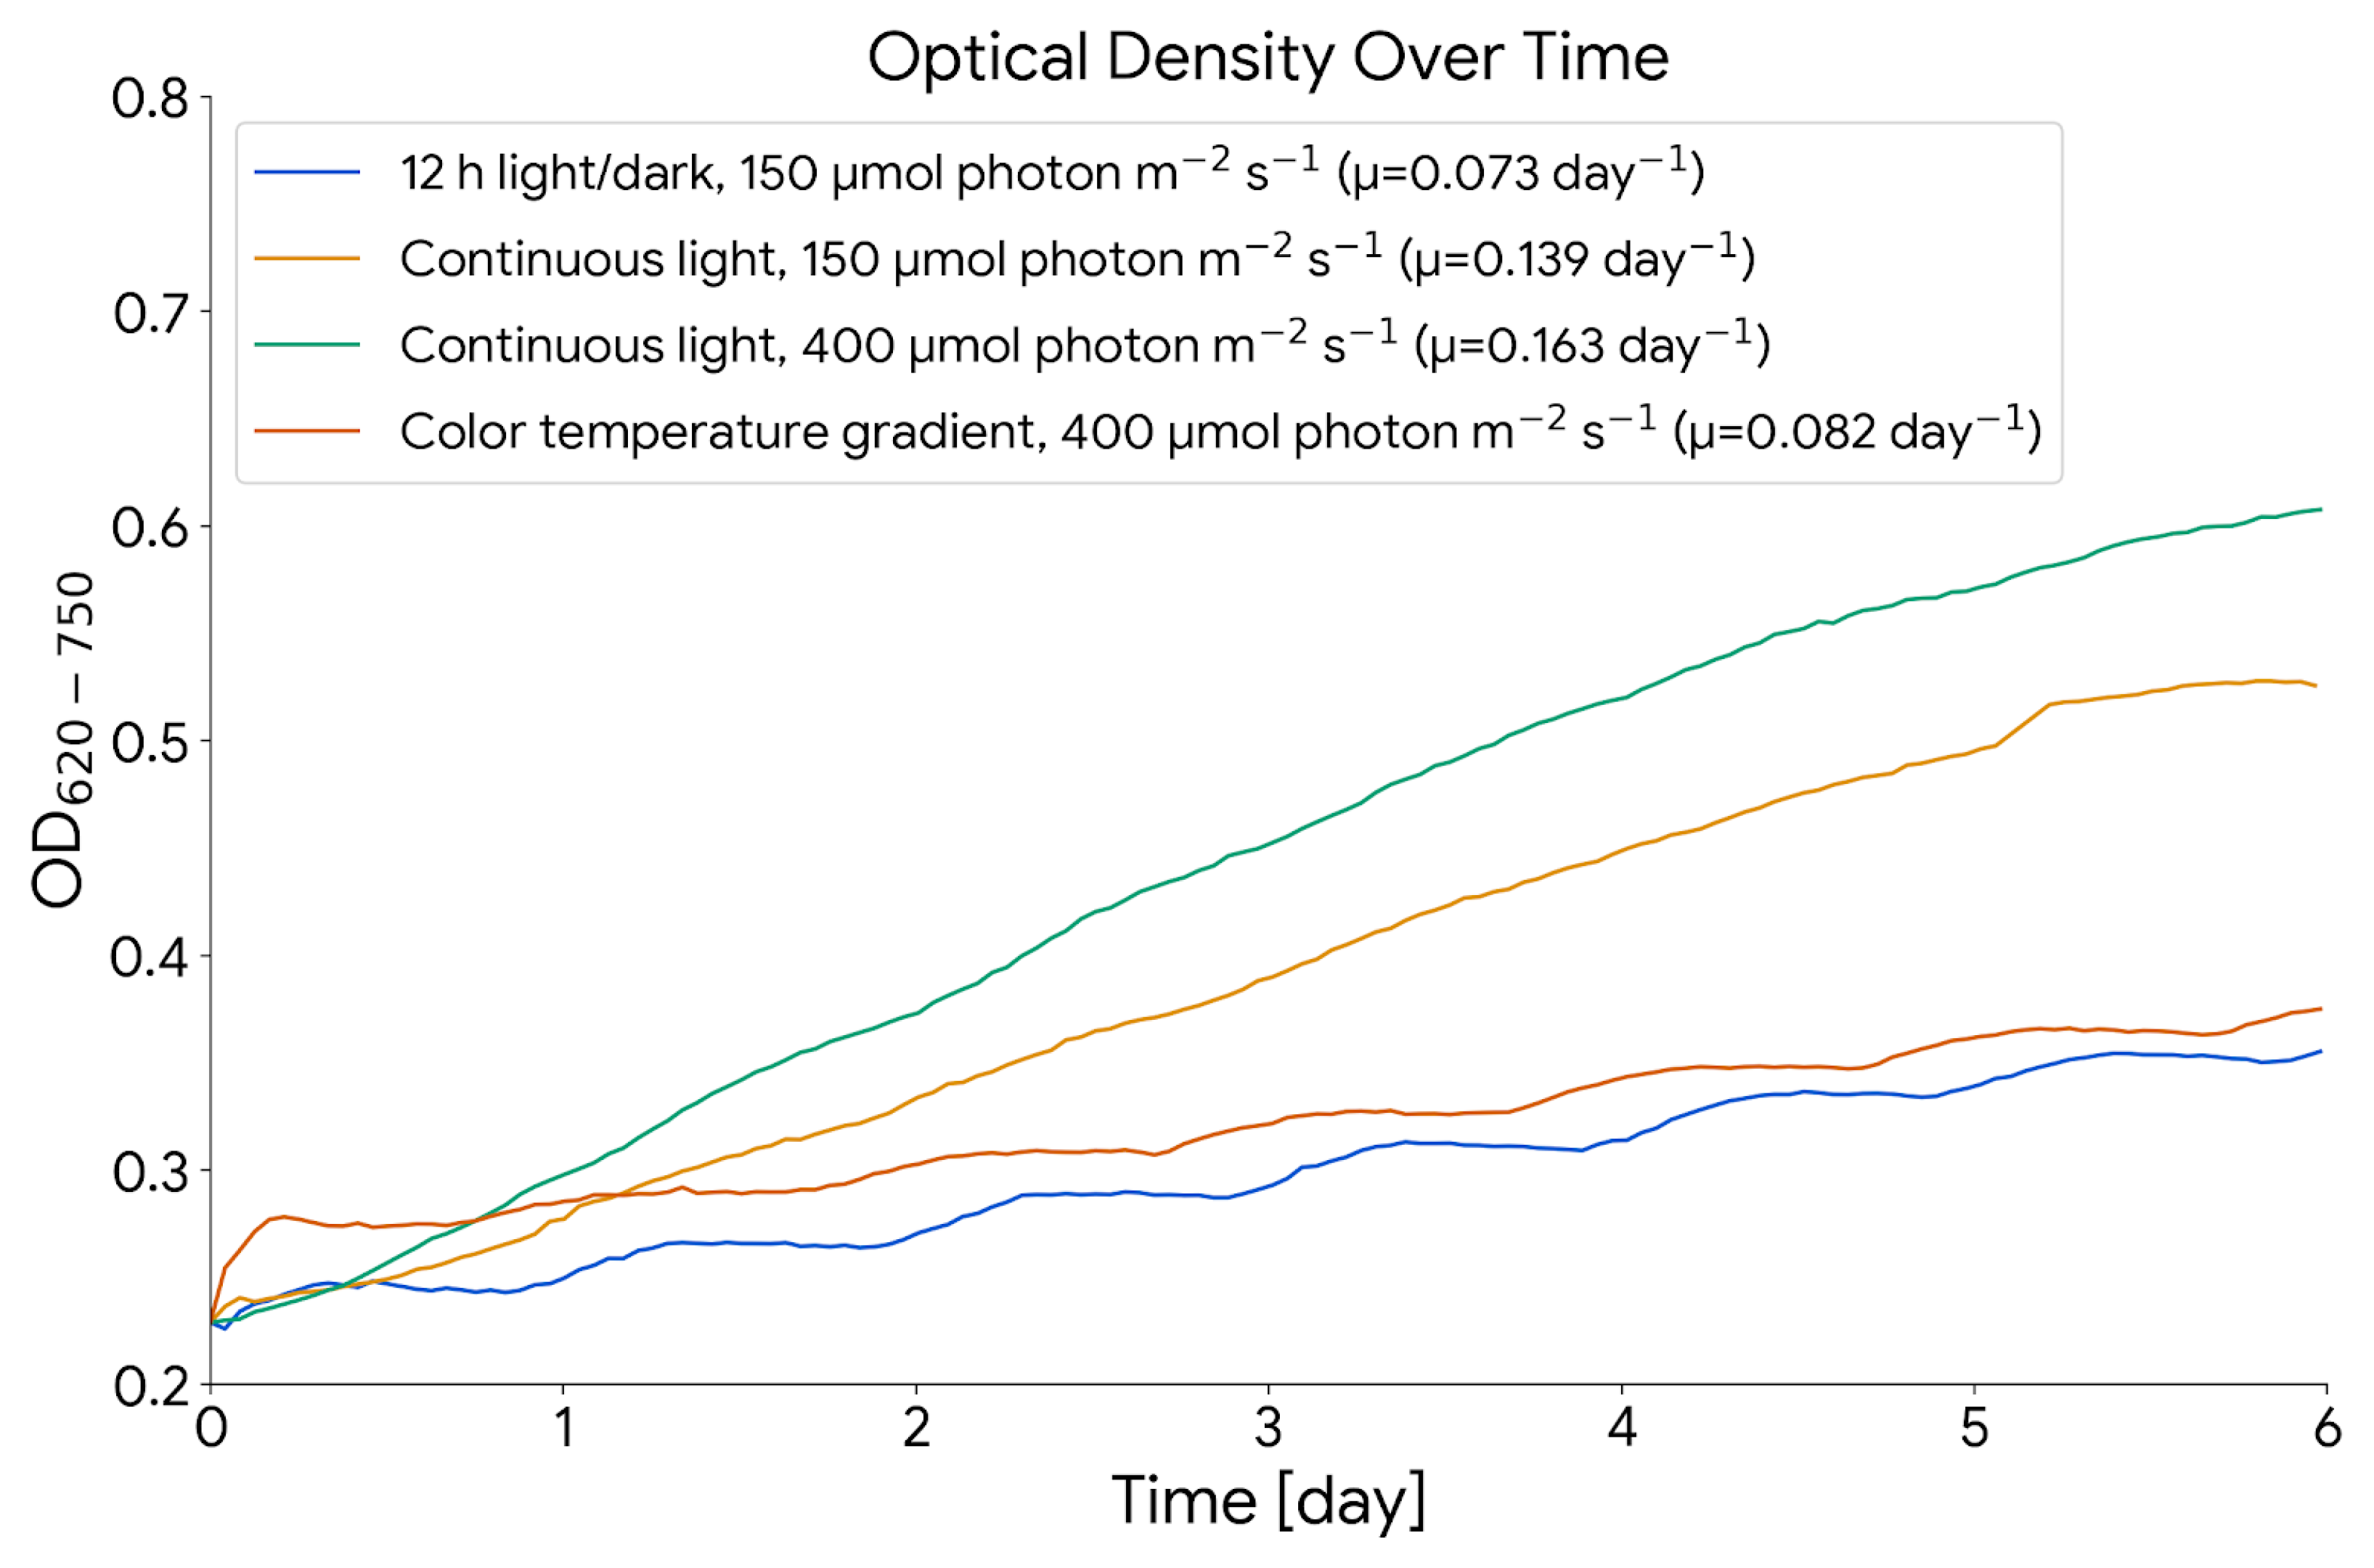
Figure 3 displays the resulting growth curve from each of the four light regimes tested: (1) 12 h light/dark cycle at
, (2) continuous light at
, (3) continuous light at
, and (4) continuous light with a dynamic color temperature gradient at
. Specific growth rates (
) for each condition were calculated using Equation (
3), based on
values at the start and end of the log phase (pre-stationary phase).
Figure 3 presents only this log-phase interval prior to the onset of stationary growth, and the calculated
values are reported in the legend. The growth rate under continuous illumination at
was
, while the 12 h light/dark regime at
yielded a slower rate of
. This corresponds to a ∼1.93-fold increase in growth rate under continuous light.
To assess the statistical significance of this difference, a two-sample t-test was conducted on the log-transformed OD values over a shared 145.5 h time window. The test yielded a p-value of , indicating a statistically significant enhancement in growth under continuous illumination. This difference could be attributed to the cessation of photosynthetic activity during the dark phase, resulting in a diurnal oscillation in growth. In contrast, cultures grown under continuous illumination exhibited steady, uninterrupted growth. Increasing the light intensity from 150 to under continuous lighting further enhanced the growth rate by a factor of 1.18, suggesting a light-dependent increase in photosynthetic efficiency and biomass accumulation. Interestingly, the culture exposed to a color temperature gradient at exhibited a noticeably lower growth rate than the constant cool lighting at the same irradiance. This suggests that emulating a natural color temperature shift throughout the day is less effective for promoting growth in Synechocystis than maintaining a consistent cool color temperature.
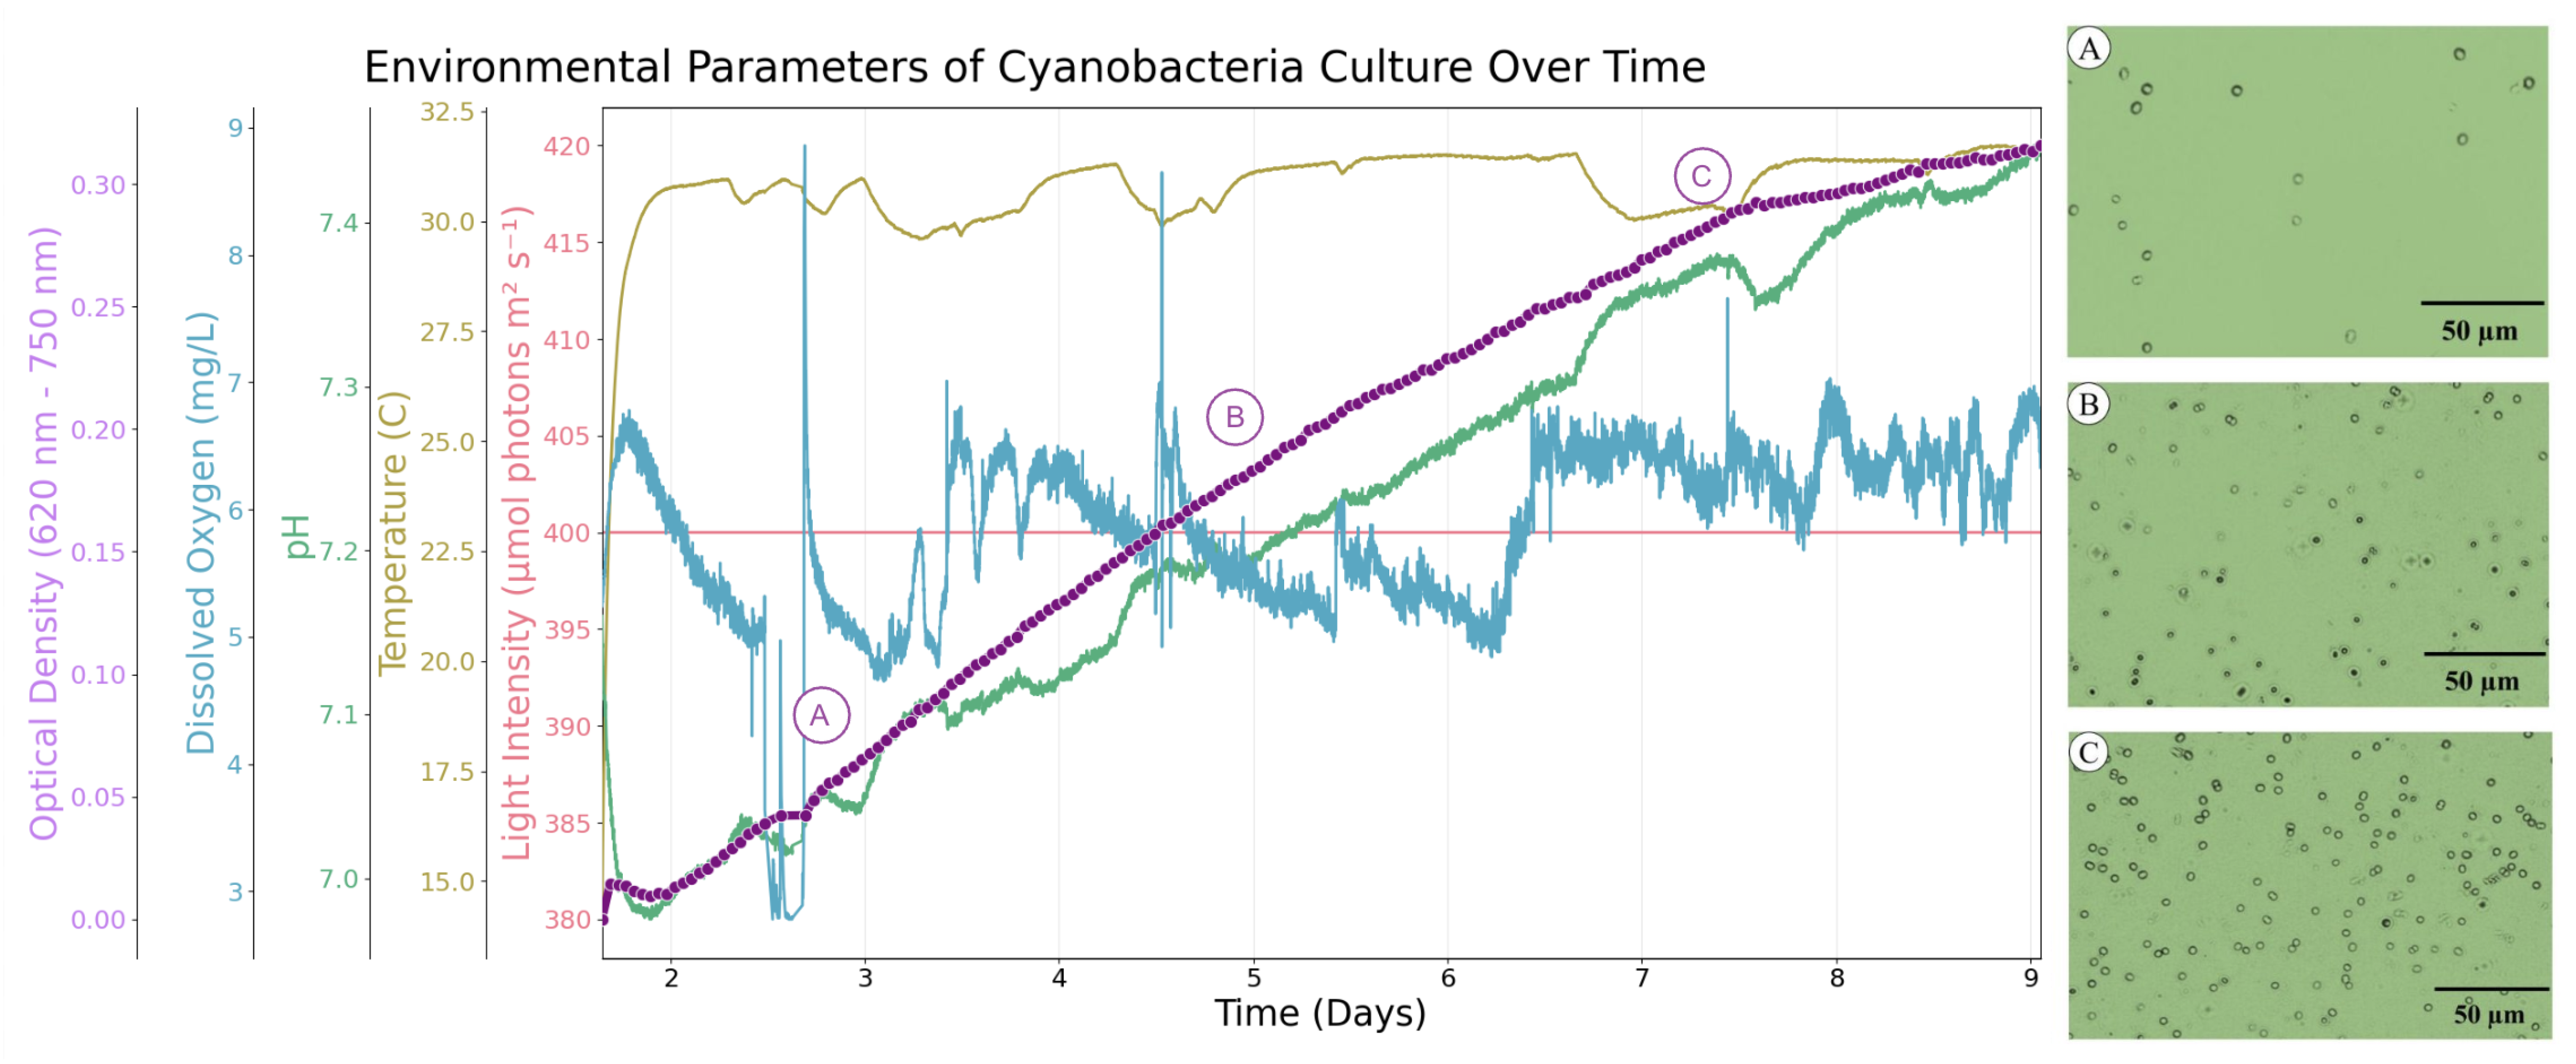
Data collected on culture growth and environmental conditions is presented in
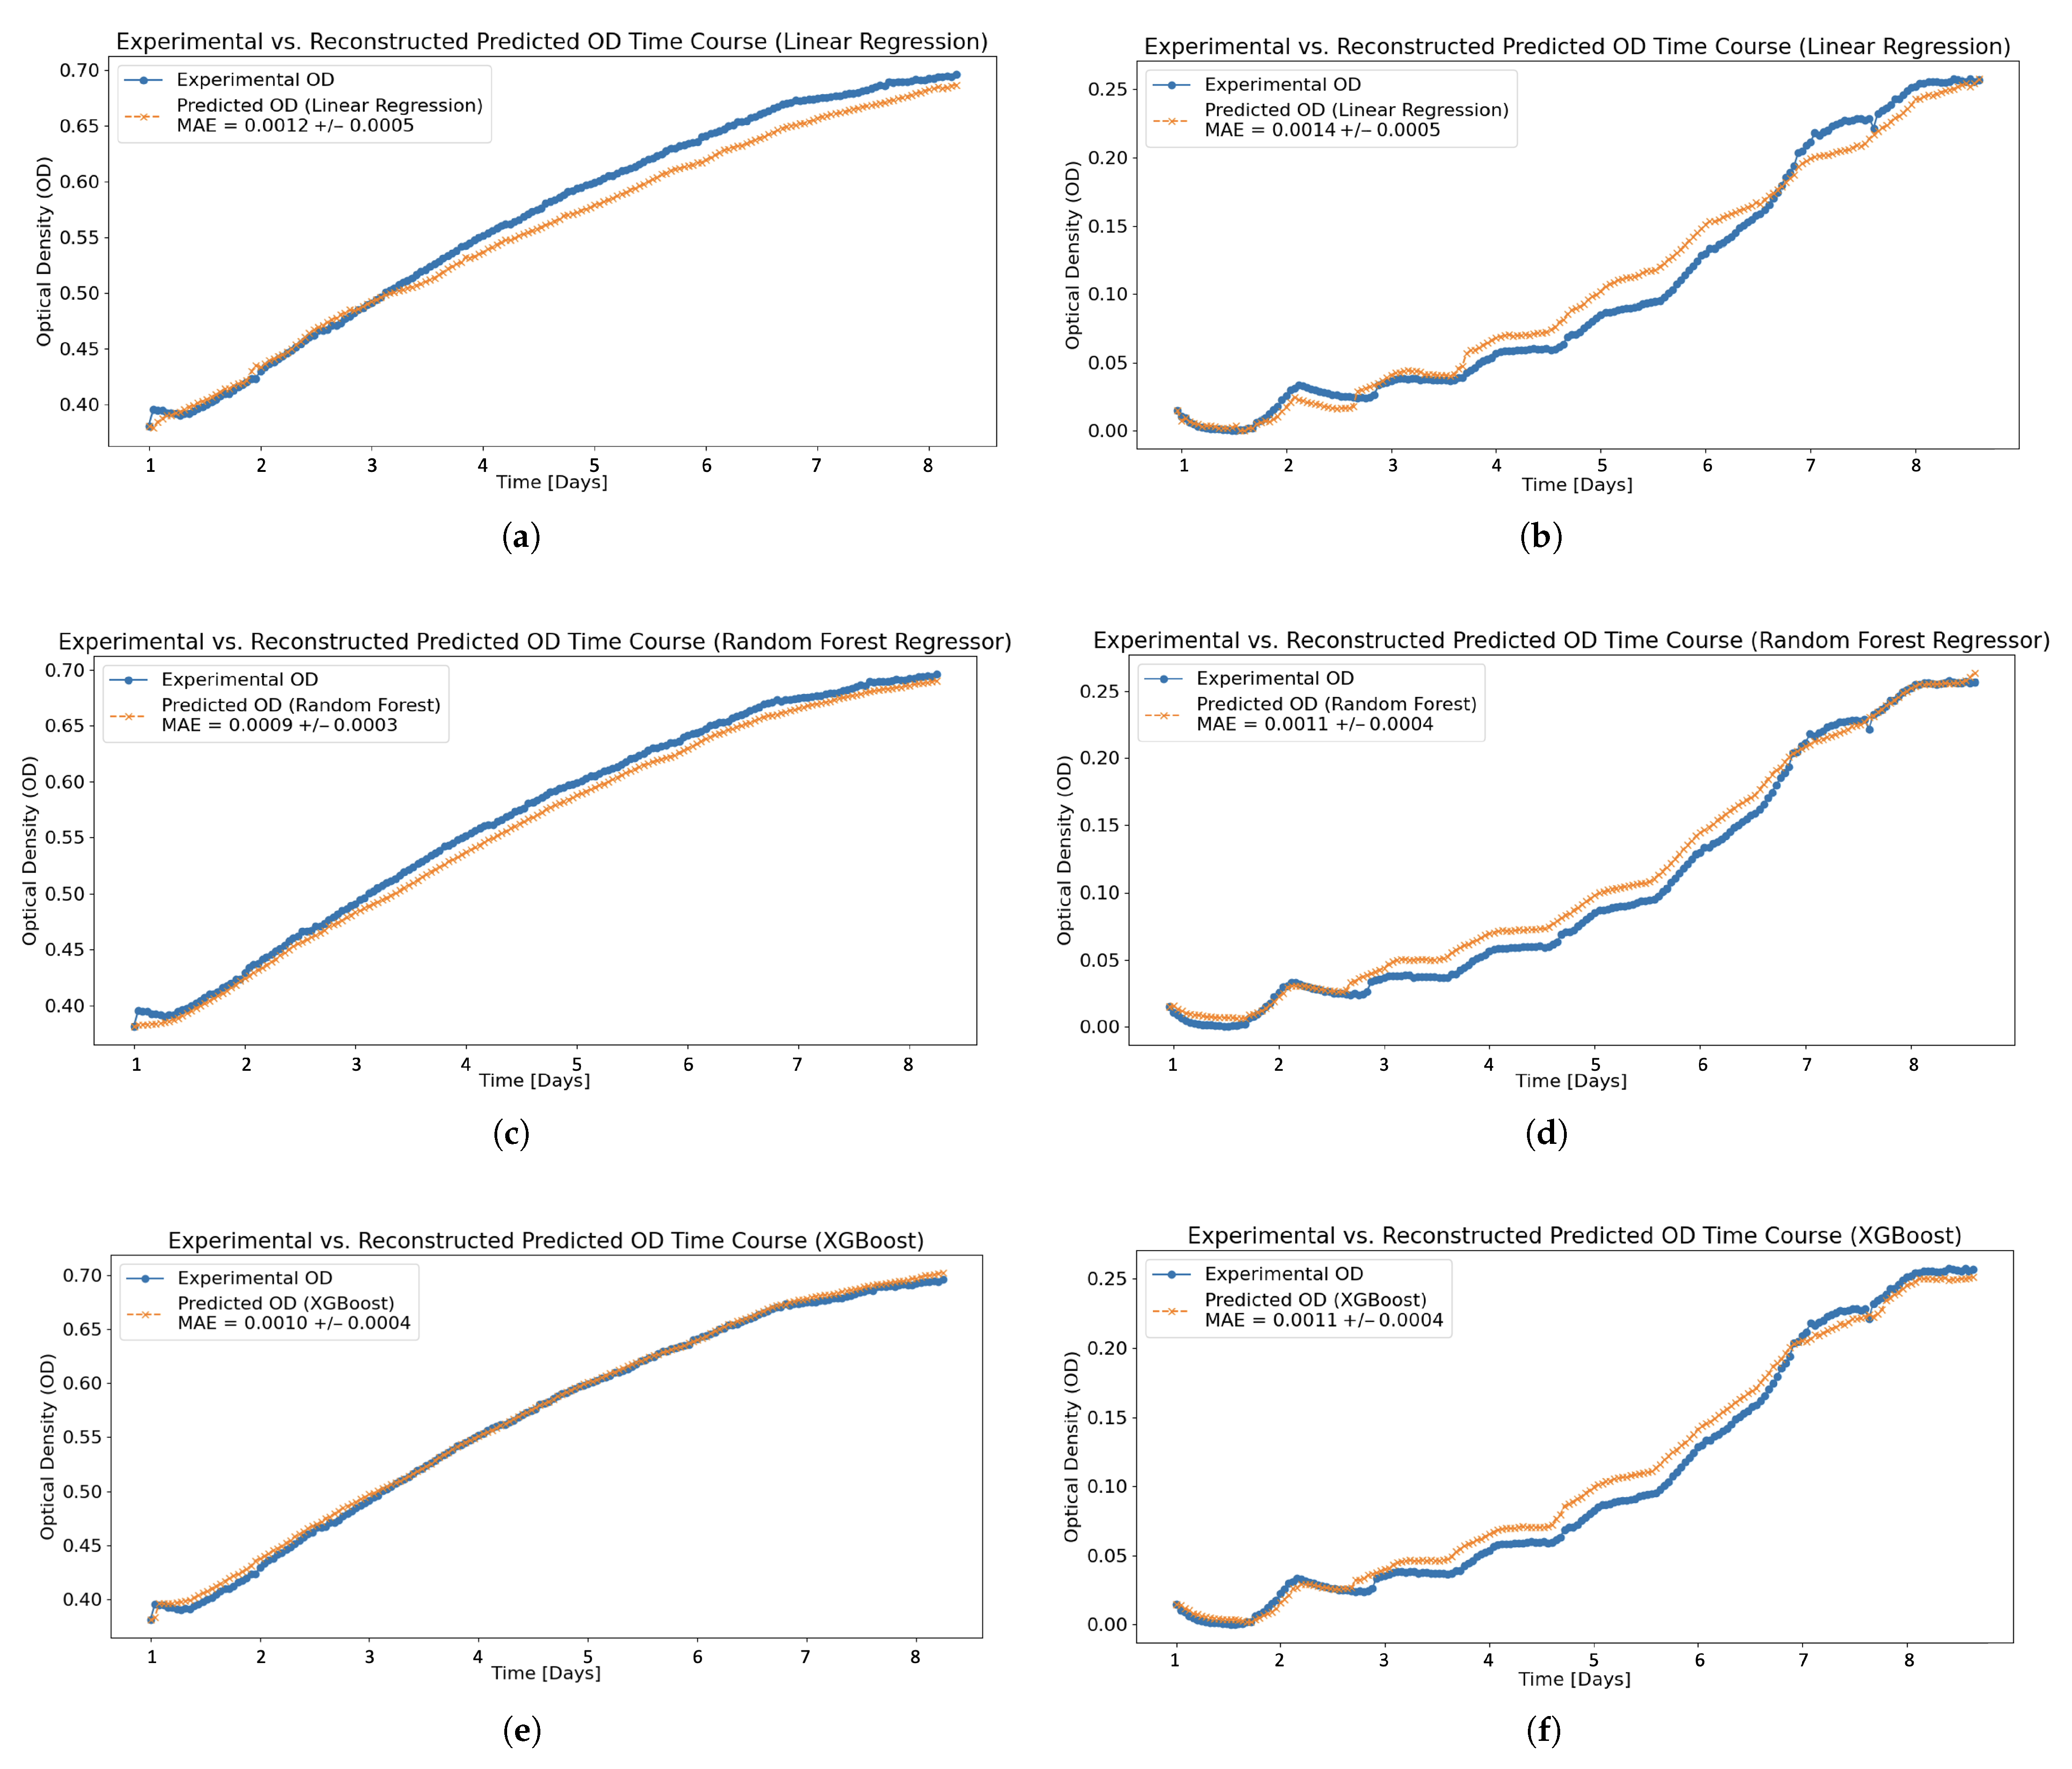
Figure 4, which also includes microscopy images illustrating qualitative changes in culture density over time. This dataset served as a representative example used to train machine learning models aimed at predicting the temporal evolution of OD based on environmental input parameters. Three models were evaluated: linear regression, random forest, and Extreme Gradient Boosted decision trees (XGBoost). Each model was trained using the full set of measured growth conditions to predict the change in OD (
OD) at each time step, enabling reconstruction of the entire OD time course. A 10-fold cross-validation was conducted for each dataset. To evaluate model performance across distinct growth behaviors, separate models were trained using data from two different light regimes: continuous illumination and a 12 h light/dark cycle.
Figure 5 displays the experimental OD and predicted OD across each model and light regime.
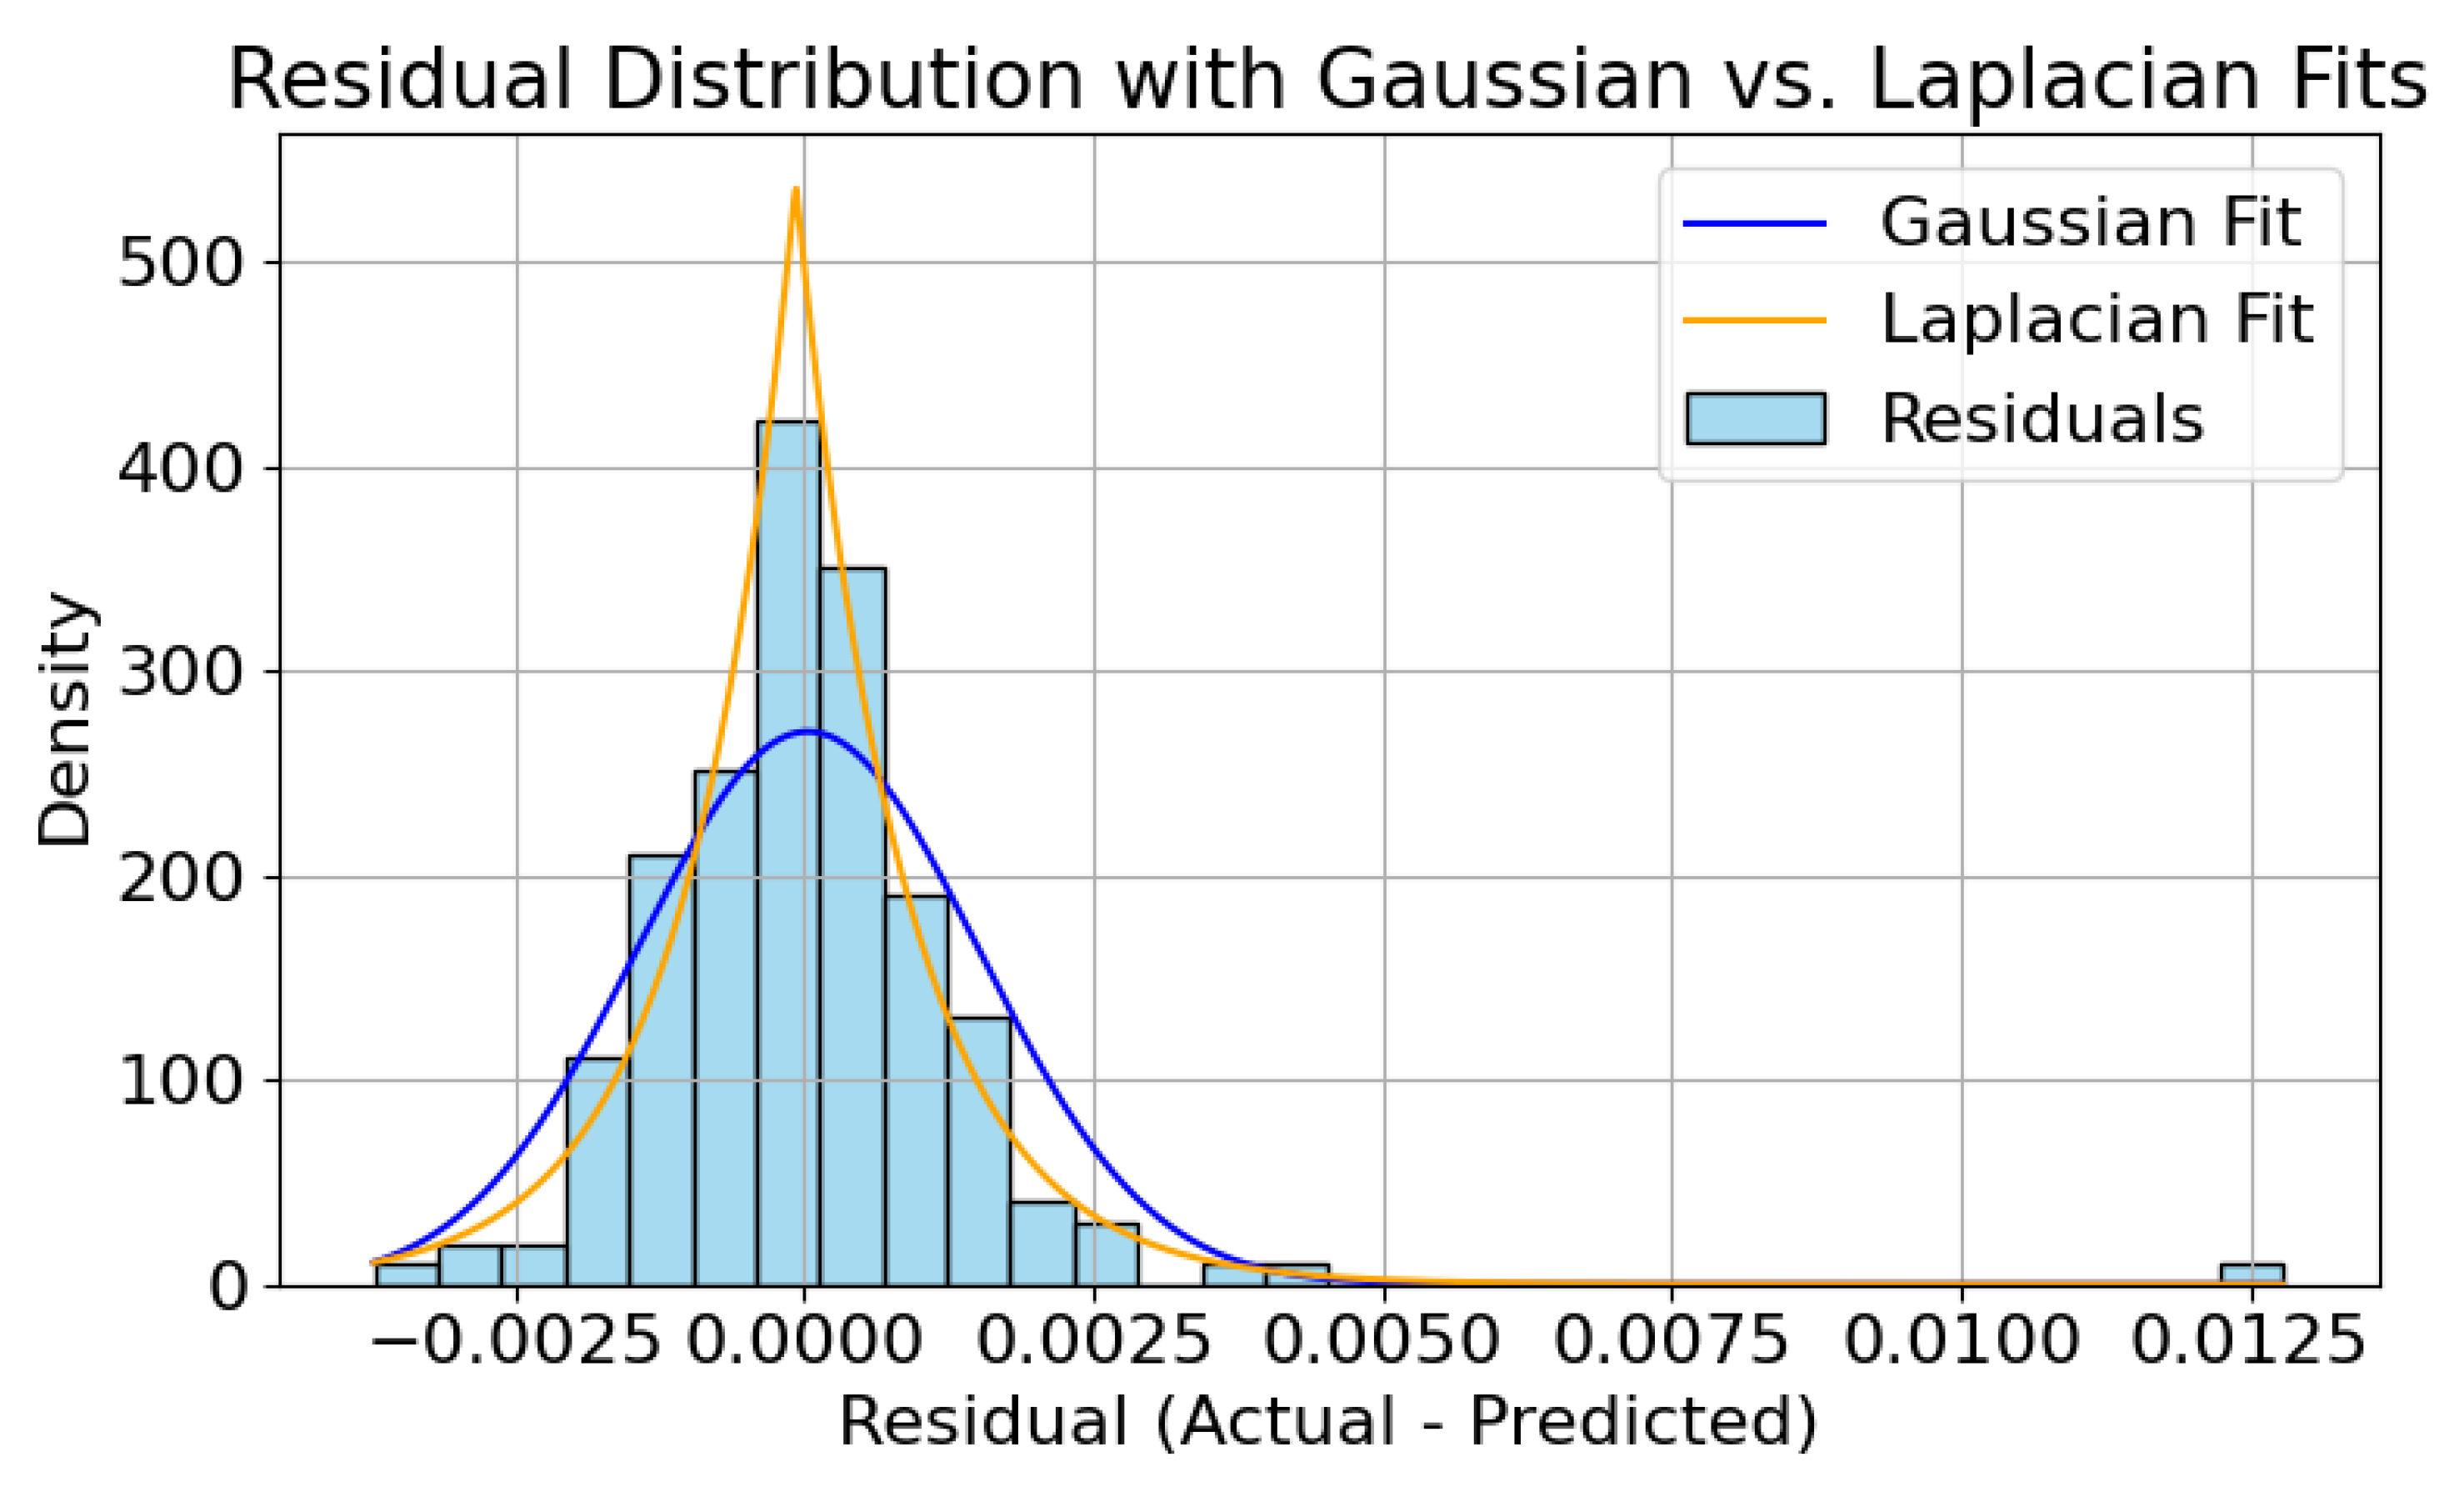
Given that the distribution of residuals followed a Laplacian profile (see
Figure A2), the mean absolute error (MAE) was selected as the loss function for evaluating model performance [
33]. Since OD is unitless, the MAE is also unitless in this context. The models exhibit low MAE—indicating accurate OD predictions over time—for both the continuous light and the 12 h light/dark cycle, demonstrating that the models can generalize. Across both light regimes, the random forest and XGBoost models consistently achieved lower MAEs compared to linear regression. Furthermore, the standard deviation across the 10-fold cross-validation was low for all models, suggesting minimal variance and high consistency.
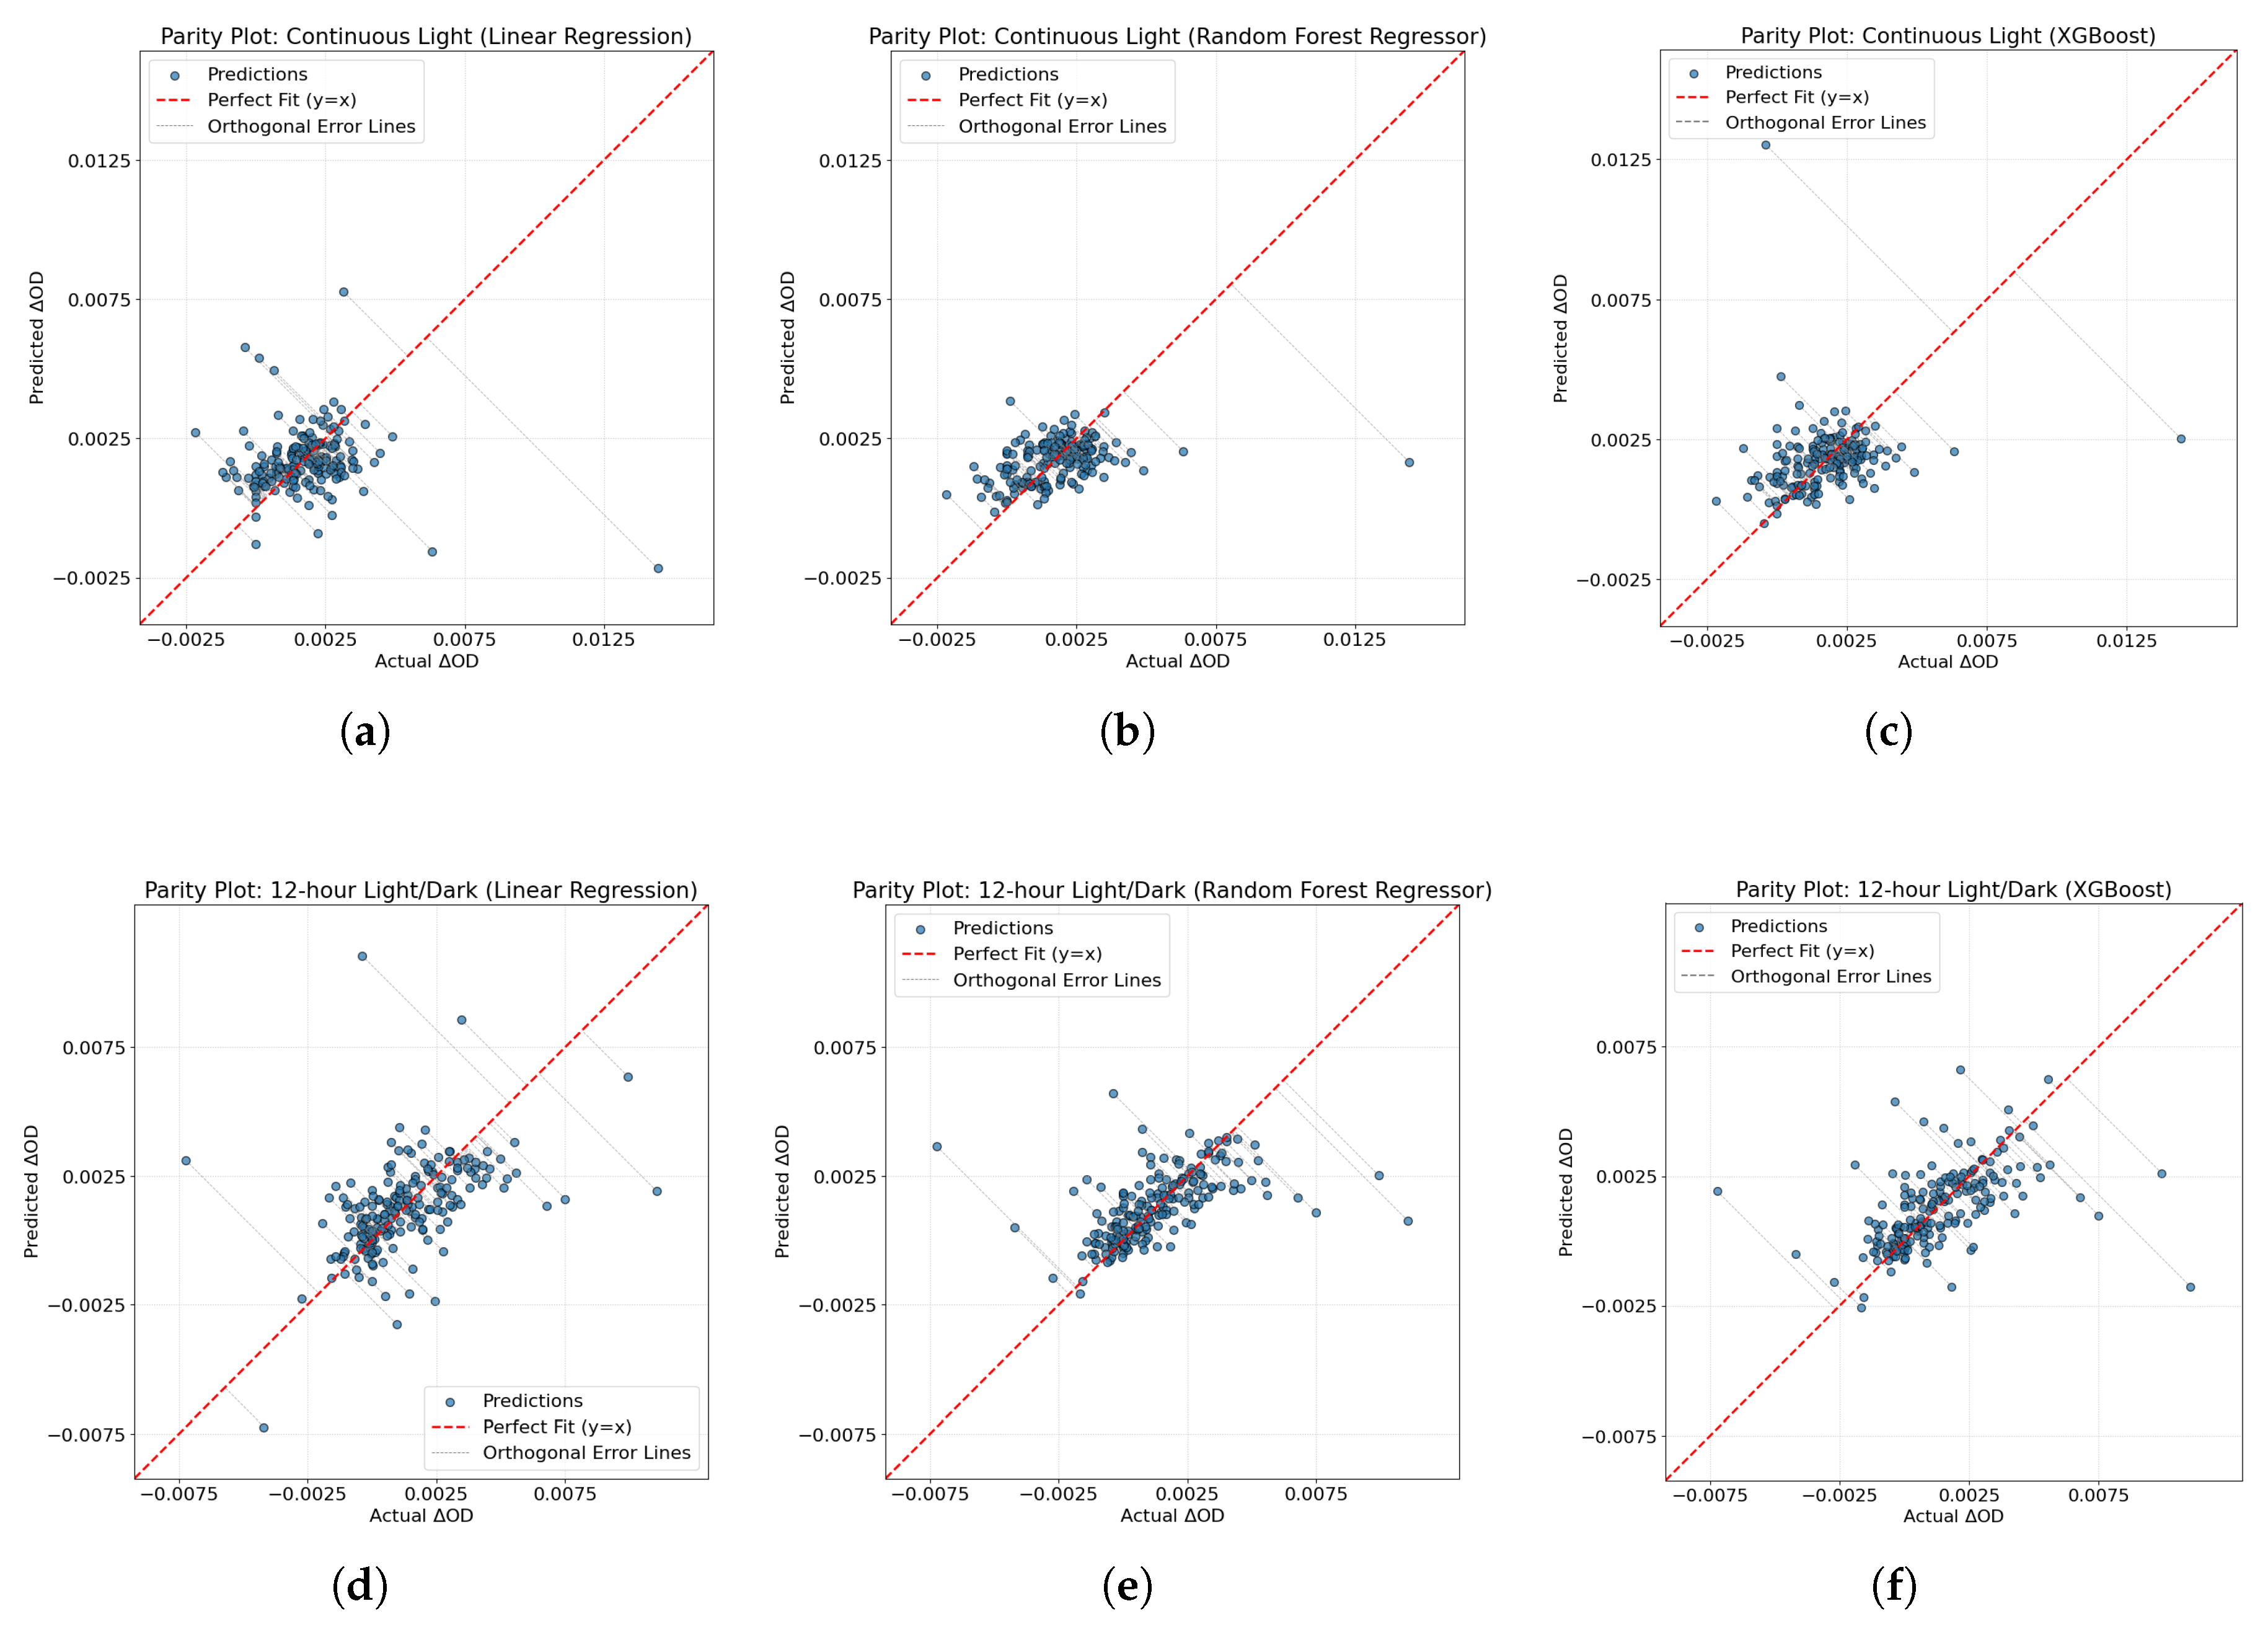
Balancing both predictive accuracy (lower MAE) and model complexity, the random forest model was selected as the preferred approach. Additional performance metrics, including parity plots for each model, are provided in
Figure A3.
The culture was extracted from the bioreactor and lysed following the aforementioned protocol. The effect of the lysis protocol on cell morphology is shown in
Figure 6a,b, and the impact of the lysis protocol on cell integrity was assessed by Trypan Blue staining and microscopy. The glucose concentration extracted from cultures grown in the bioreactor was quantified daily over a 7-day period using HPLC, with each measurement performed in biological triplicate (
Figure 6c). The plotted bars represent the mean glucose content, with error bars indicating the standard deviation. Overall, the data show an initial increase in glucose concentration during the early growth phase, followed by a plateau, consistent with the transition into stationary phase. The highest glucose concentration was observed on Day 4, reaching 5.08 mg
for a biomass concentration of approximately 30 mg
. Excluding the elevated Day 1 measurement, the trend supports the hypothesis that glucose accumulation correlates with biomass increase during the log phase. The observed variability across days suggests the importance of time-point selection in optimizing glucose recovery.
4. Discussion
This study demonstrates the feasibility of a low-cost, modular bioreactor system that integrates cultivation of
Synechocystis sp. PCC 6803 with downstream glucose extraction. Beyond the technical innovation, it is important to evaluate how the biological performance of the system compares with established benchmarks. In our experiments, the maximum biomass productivity observed in our system was approximately 90 mg
, with a specific growth rate of
. These values are comparable with those reported for wild-type
Synechocystis PCC 6803 under similar photoautotrophic conditions [
32,
34]. Although some studies using optimized photobioreactors have reported higher growth rates, our results validate that a low-cost system can still yield comparable performance with potential for further optimization. For example, supplementing the aeration with CO
2-enriched air has been shown to significantly increase growth rates in
Synechocystis PCC 6803 cultures [
30,
35].
The extracted intracellular glucose concentration in our system peaked at approximately 5 mg
, corresponding to roughly 14.3% of the total biomass given the maximum measured biomass concentration of around 35 mg
. While direct measurements of intracellular free glucose concentrations in wild-type
Synechocystis PCC 6803 are not commonly reported, glycogen content—a proxy for intracellular glucose storage—has been documented in the literature as approximately 10% of dry cell weight under photoautotrophic conditions [
36,
37]. Our observed glucose levels thus align closely with—and perhaps exceed—these literature benchmarks, supporting the efficacy of our extraction method. Day-to-day variability was observed in the extracted glucose levels, with a notable dip on Day 2. One possible explanation is that early in the growth phase, fixed carbon may be directed toward biomass accumulation rather than carbohydrate storage, resulting in temporarily reduced glucose concentration. Technical variation in lysis and quantification may also have contributed to this fluctuation.
In batch-mode operation, as demonstrated in this paper, the bioreactor culture volume capacity of 5 L can yield approximately 25 mg of intracellular glucose per run. While this mode of operation offers the advantage of straightforward sterilization and removal of biofouling between cycles, continuous or semi-continuous operation could enable more streamlined and sustained glucose production, albeit with additional challenges. These include maintaining stable light distribution and sufficient air transfer over prolonged periods. While the system was operated aseptically at bench scale using autoclaving and ethanol sanitation, prolonged operation also increases the risk of contamination through biofilm formation, filter fouling, or air ingress. These risks can be mitigated by maintaining positive pressure with sterile-filtered air, scheduled sanitation between runs, and routine monitoring for microbial contamination. At larger scales, syringe-based filtration would not be practical due to throughput limitations and the tendency for fouling. In such cases, tangential flow filtration (TFF) offers a more efficient approach, as it allows continuous clarification while reducing clogging and supporting long-term operation. Furthermore, to obtain higher absolute glucose yields than the ∼25 mg recovered per batch at the current scale, the system would need to be operated at larger volumes, which introduces its own set of challenges. These include maintaining sterility as the surface-to-volume ratio decreases, achieving efficient nutrient and CO2 mixing, and avoiding the formation of light gradients. Addressing these factors will be critical for translating the present proof-of-concept system into a reliable platform for long-term or scaled-up operation.
Unlike strains genetically engineered for glucose secretion, our system isolates the naturally accumulated glucose through physical disruption. By relying on a wild-type strain, this work lowers the barrier to entry for labs that may lack access to proprietary or engineered variants, broadening the system’s applicability across different research settings. This study focuses on glucose as the target metabolite because of its relevance in several biorefinery applications. While the extraction procedure inevitably releases various intracellular metabolites, quantifying those additional compounds would require distinct and optimized analytical workflows, which were beyond the scope of this work. Nevertheless, purification of glucose could be achieved using downstream processing methods, such as ion-exchange chromatography, offering a pathway toward isolating the target product at higher purity in future implementations.
A machine learning model was developed to predict changes in optical density based on environmental inputs such as light intensity, pH, temperature, and dissolved oxygen. The random forest model showed the lowest mean absolute error among those tested, highlighting its potential for non-linear pattern recognition in biological systems. The ability to accurately model growth behavior from sensor data provides a foundation for future system self-optimization. Overall, the combination of hardware innovation and data-driven modeling establishes a foundation for accessible, automated, and sustainable glucose extraction using Synechocystis.
Compared to existing systems, the platform offers a lower cost of fabrication and operation. While commercial bioreactors with comparable sensors often exceed USD 10,000, the system described here was assembled for under USD 3500 using modular, off-the-shelf components. This cost excludes the ultrasound equipment, which can be replaced with lower-cost alternatives. Additionally, the system incorporates an innovative design for low-cost, inline optical density measurement, as well as an illumination setup that ensures uniform light distribution through a novel form factor. It should be emphasized that while the cost of the system is substantially lower than commercial alternatives, the current glucose productivity of approximately 1.25 mg is below the levels required for economic profitability. Therefore, the present study is intended as a proof-of-concept demonstration of low-cost system integration rather than an immediate industrial solution, with optimization needed to improve productivity. To put this performance in context, it is useful to compare it with more established glucose extraction methods.
Traditional glucose extraction from biomass typically relies on multi-step hydrolysis of agricultural residues such as corn stover or sugarcane bagasse. These workflows involve an initial pretreatment step, such as steam explosion, followed by acid or enzymatic hydrolysis, with reported conversions of up to 35% of the initial feedstock into glucose [
38]. In addition, enzymatic hydrolysis of algal biomass has been demonstrated, achieving glucose yields of up to 60% of the biomass [
39]. By contrast, the inline lysis-based approach presented in this work emphasizes process simplicity and seamless integration with cultivation. Although the current glucose recovery efficiency is lower than that of conventional hydrolysis methods, the system eliminates the need for harsh pretreatments or expensive enzymes, providing a modular and accessible alternative that can be further optimized.
