4.2.2. Design of Experiments
Offline: Training Stage
To conduct the training phase, 200 observations were taken from each operating state (NOC, Faults, and Attacks). The F-2 and A-2 patterns were not included in the training dataset. The aim was to assess the algorithm’s ability to identify and locate new events during the online phase. For this reason, two experiments were conducted during the training phase:
Experiment 1: F-2 was not considered during training. The training database (TDB1) was made up of the following pattern: NC, F-1, A-1, A-2.
Experiment 2: A-2 was not considered during training. The training database (TDB2) was made up of the following pattern: NC, F-1, A-1, F-2.
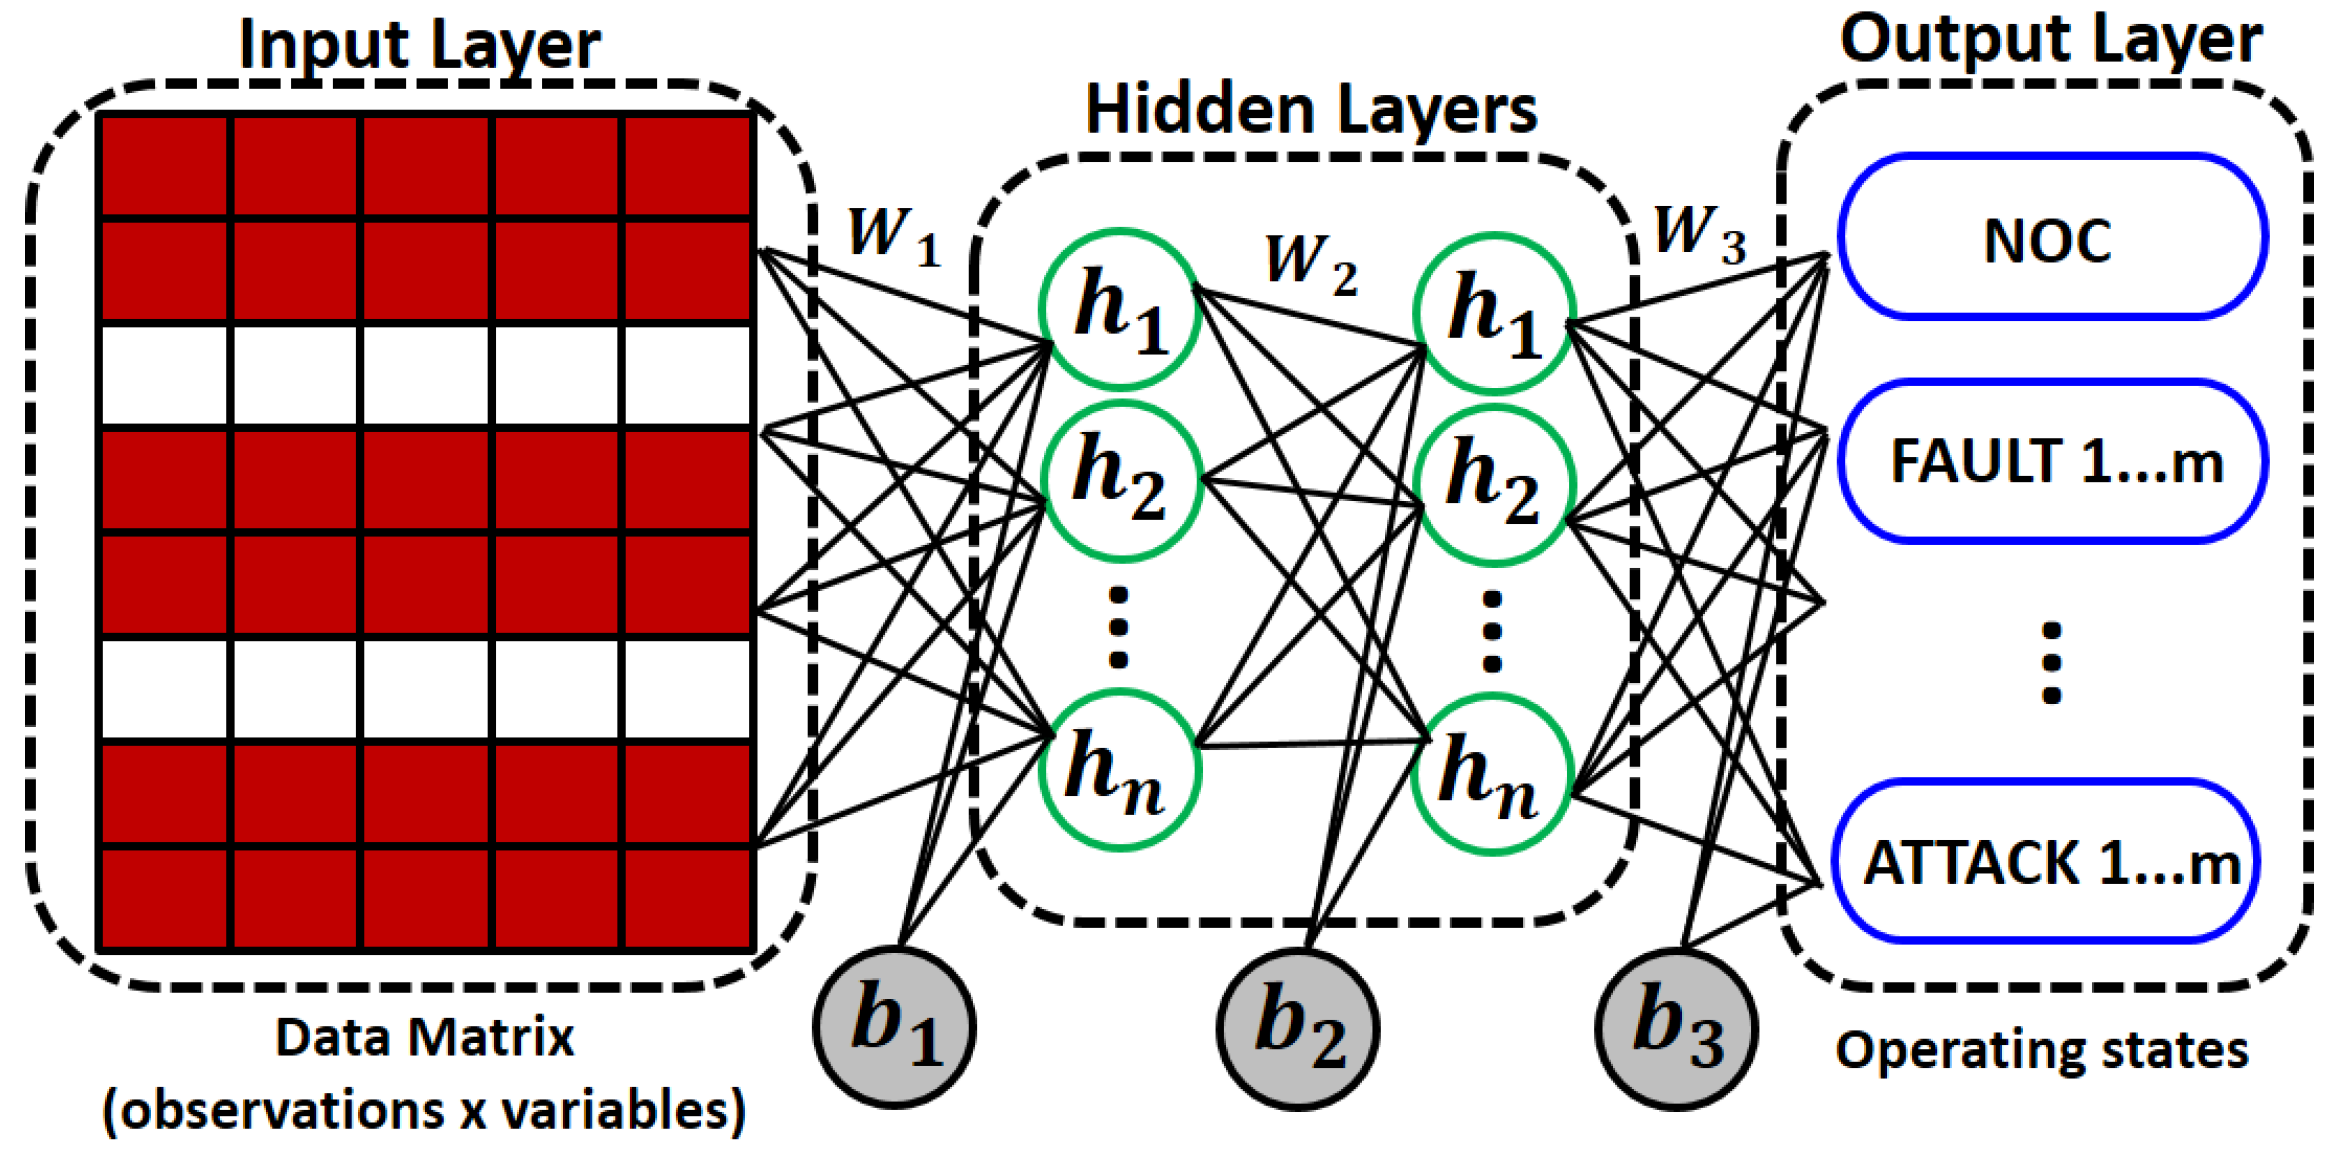
For both experiments, the MLP network was built with four neurons in the output layer (four classes) and a softmax activation function. The same hyperparameters were used according to
Table 1. To determine the parameter
using the DE algorithm, the same control parameters described in
Section 4.1.1 were used. In this case, the search space is
. In this case, five neighbors (
h = 5) were used for the LOF algorithm.
Online: Recognition Stage
In the online phase, forty observations were used for each class. In addition, fifty new samples (ten for each operating state) were added to this data set, distributed evenly across classes, to represent potential outliers. Outliers were generated as values outside the measurement range for each variable.
To validate the online recognition phase, three variants were considered for each experiment carried out in the training. In all scenarios, fifty observations were used to simulate the sequential acquisition of data in an online setting.
Experiment 1: TDB1
Scenario 1: Fifty samples were utilized, with forty belonging to NOC and ten being outliers. The aim was to assess the system’s ability to accurately classify normal functioning and its ability to detect several samples that represent outliers as SAS.
Scenario 2: Ten samples from F-1 and forty outliers that did not constitute a class were used. The aim was to analyze the system’s accuracy in classifying the F-1 fault and its capacity to detect multiple outliers, such as SAS points which do not form a new class due to their low density.
Scenario 3: Forty samples from unknown event (Fault F-2) and ten outliers were used. The aim was to analyze the appropriate classification of these samples as SAS and the capacity to detect which of these values formed a new class (new fault).
Experiment 2: TDB2
Scenario 1: Fifty samples were utilized, with forty belonging to A-1 and ten being outliers. The aim was to evaluate the system’s ability to accurately classify attack A-1 and its ability to detect several samples that represent outliers as SAS.
Scenario 2: Ten samples from F-2 and forty outliers that did not constitute a class were used. The aim was to analyze the system’s accuracy in classifying fault F-2 and its capacity to detect multiple outliers, such as SAS points which do not form a new class due to their low density.
Scenario 3: Forty samples from an unknown event (Attack A-2) and ten outliers were used. The aim was to analyze the appropriate classification of these samples as SAS and the ability to detect which of these values conformed to a new class (new attack).
4.2.3. Analysis and Discussion of Results
Offline: Training Stage
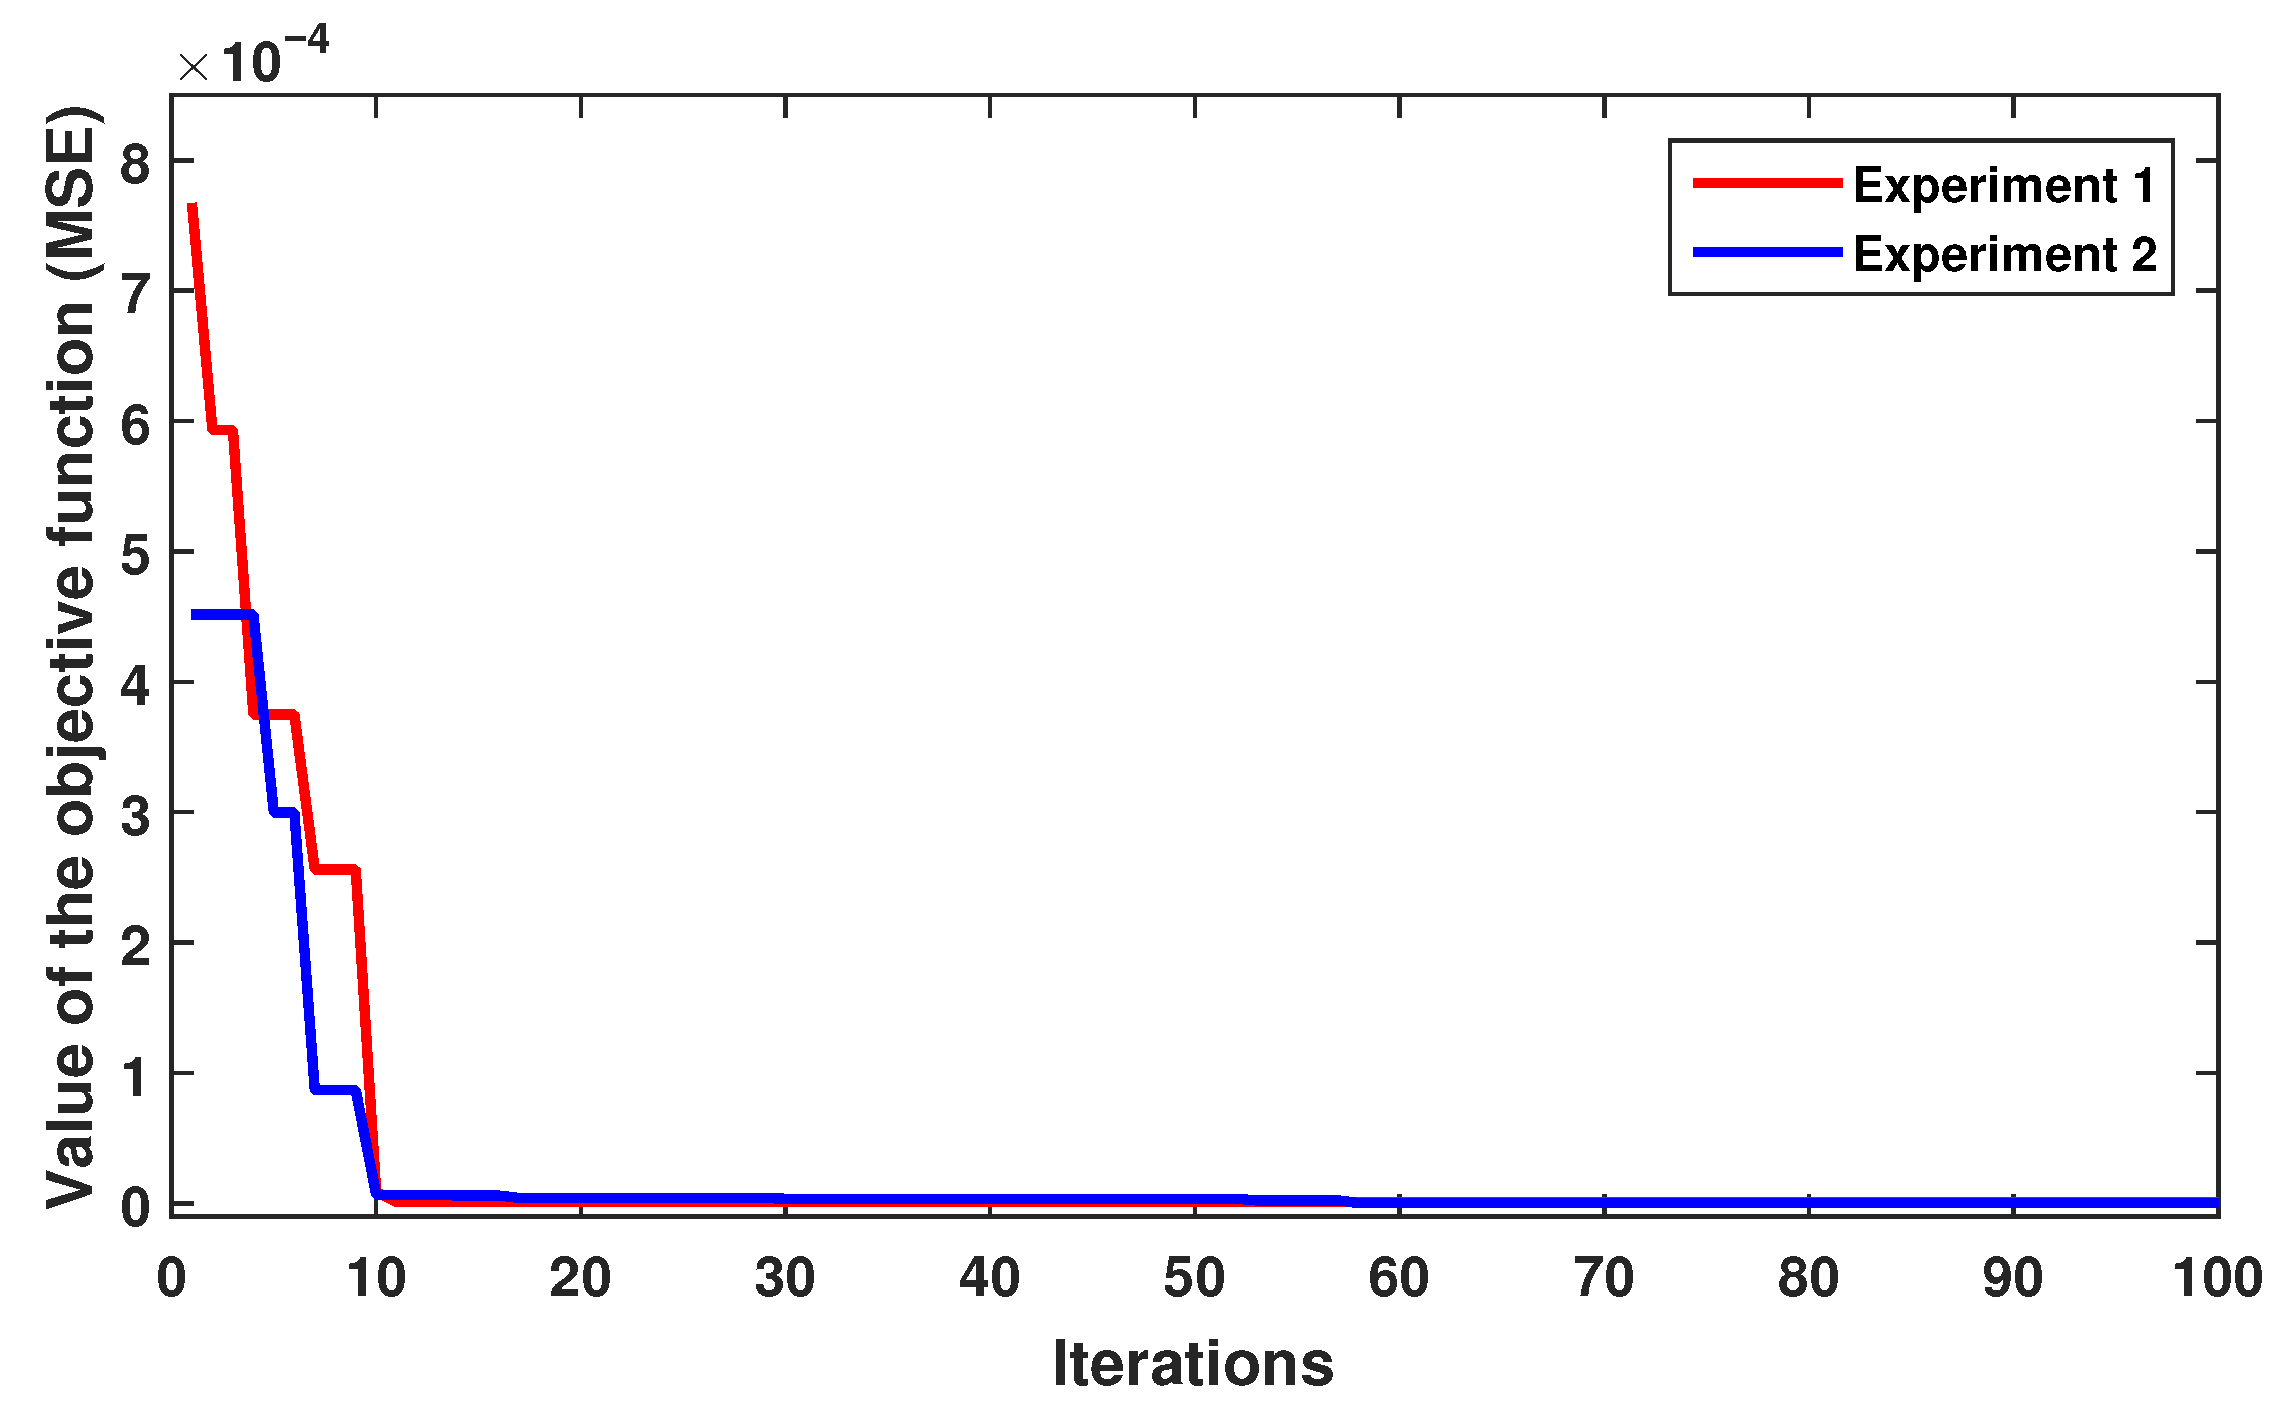
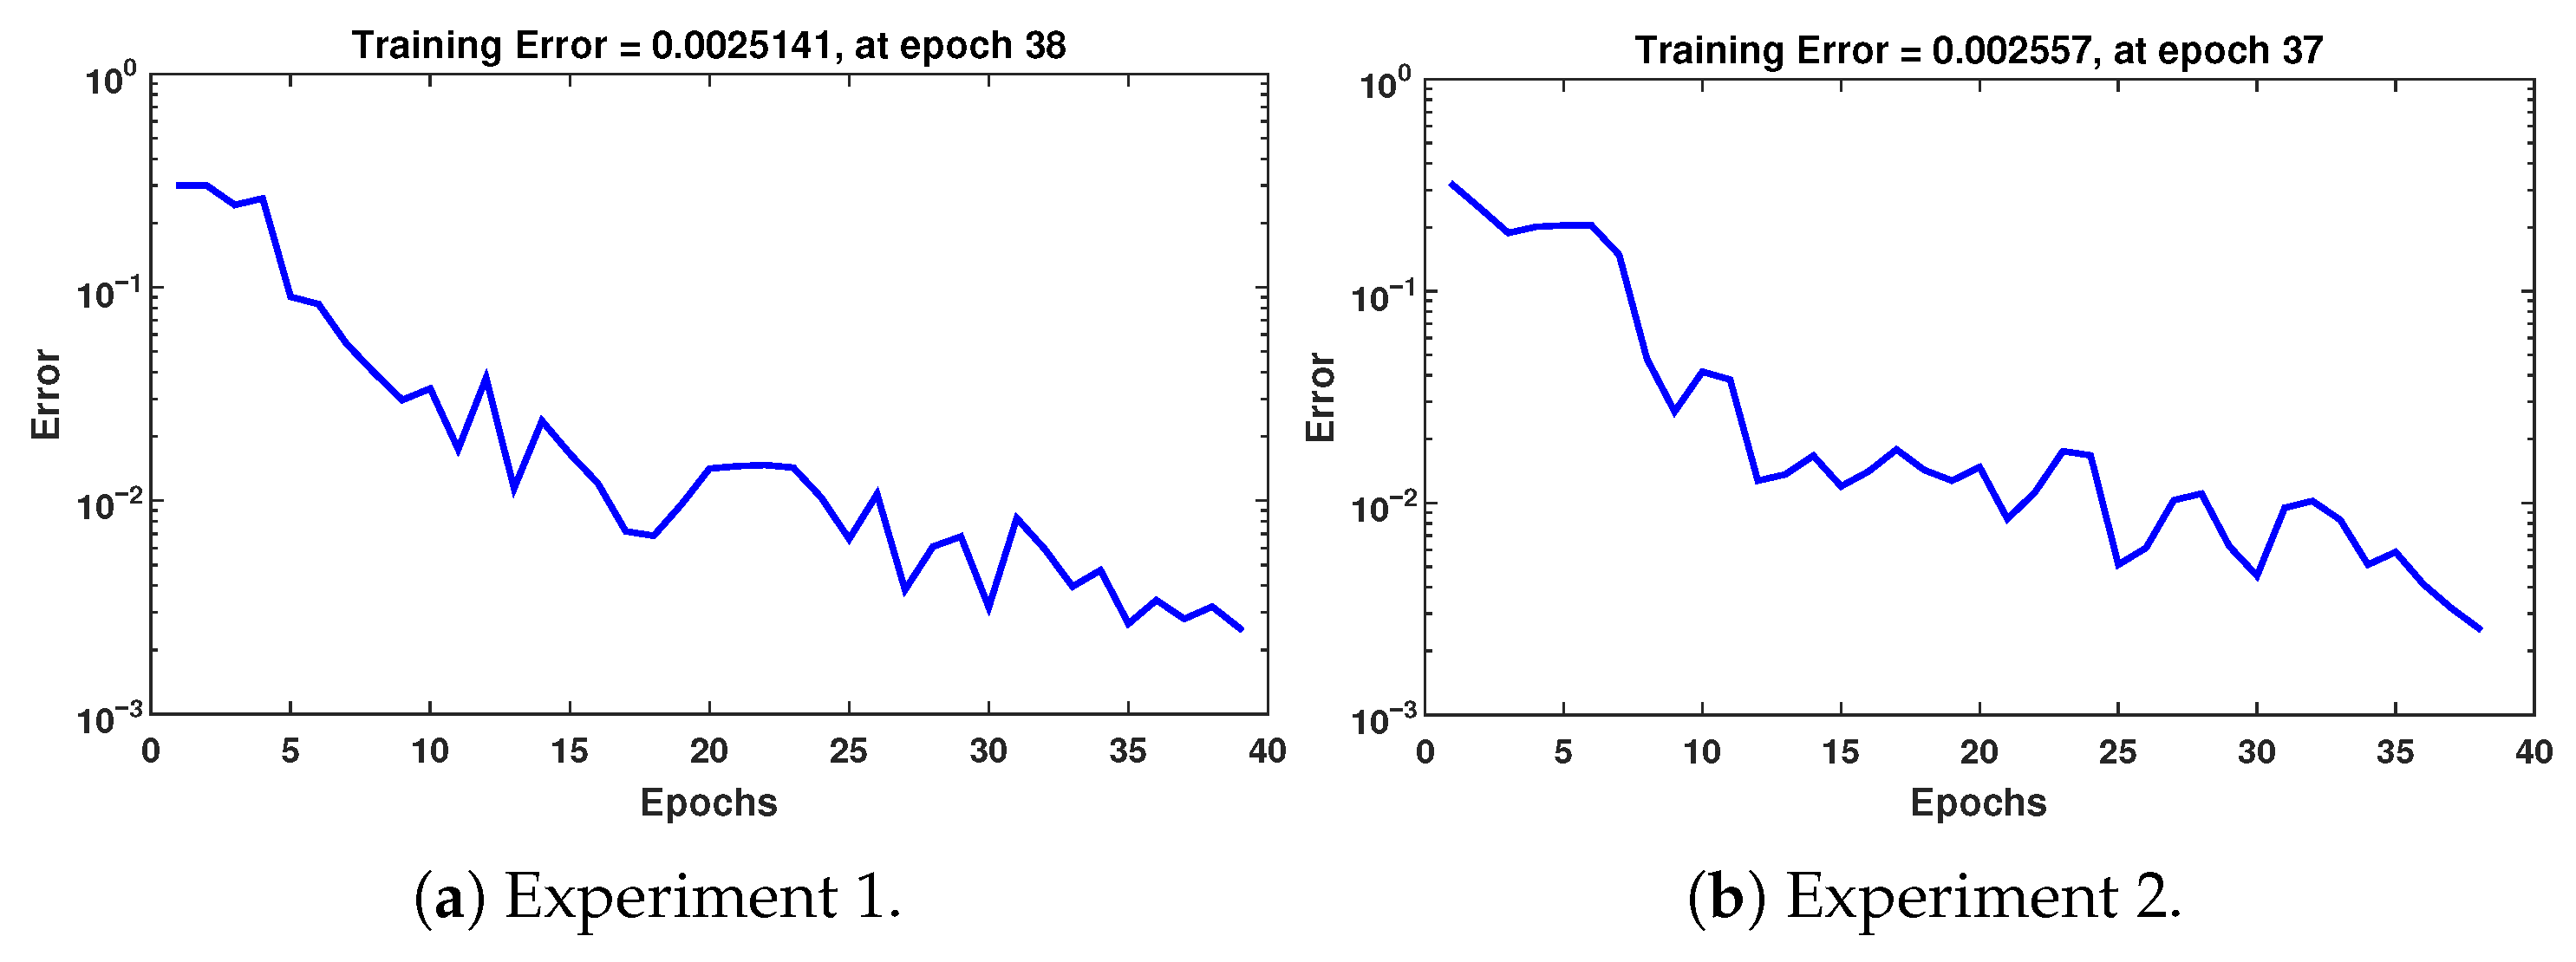
For both experiments, the performance of the objective function (MSE) is illustrated in
Figure 12, again demonstrating the rapid convergence of the DE algorithm. In both experiments, the best parameter was
= 10, obtained in iteration 10. The training error achieved by the MLP network with DE-estimated parameters is shown in
Figure 13, while
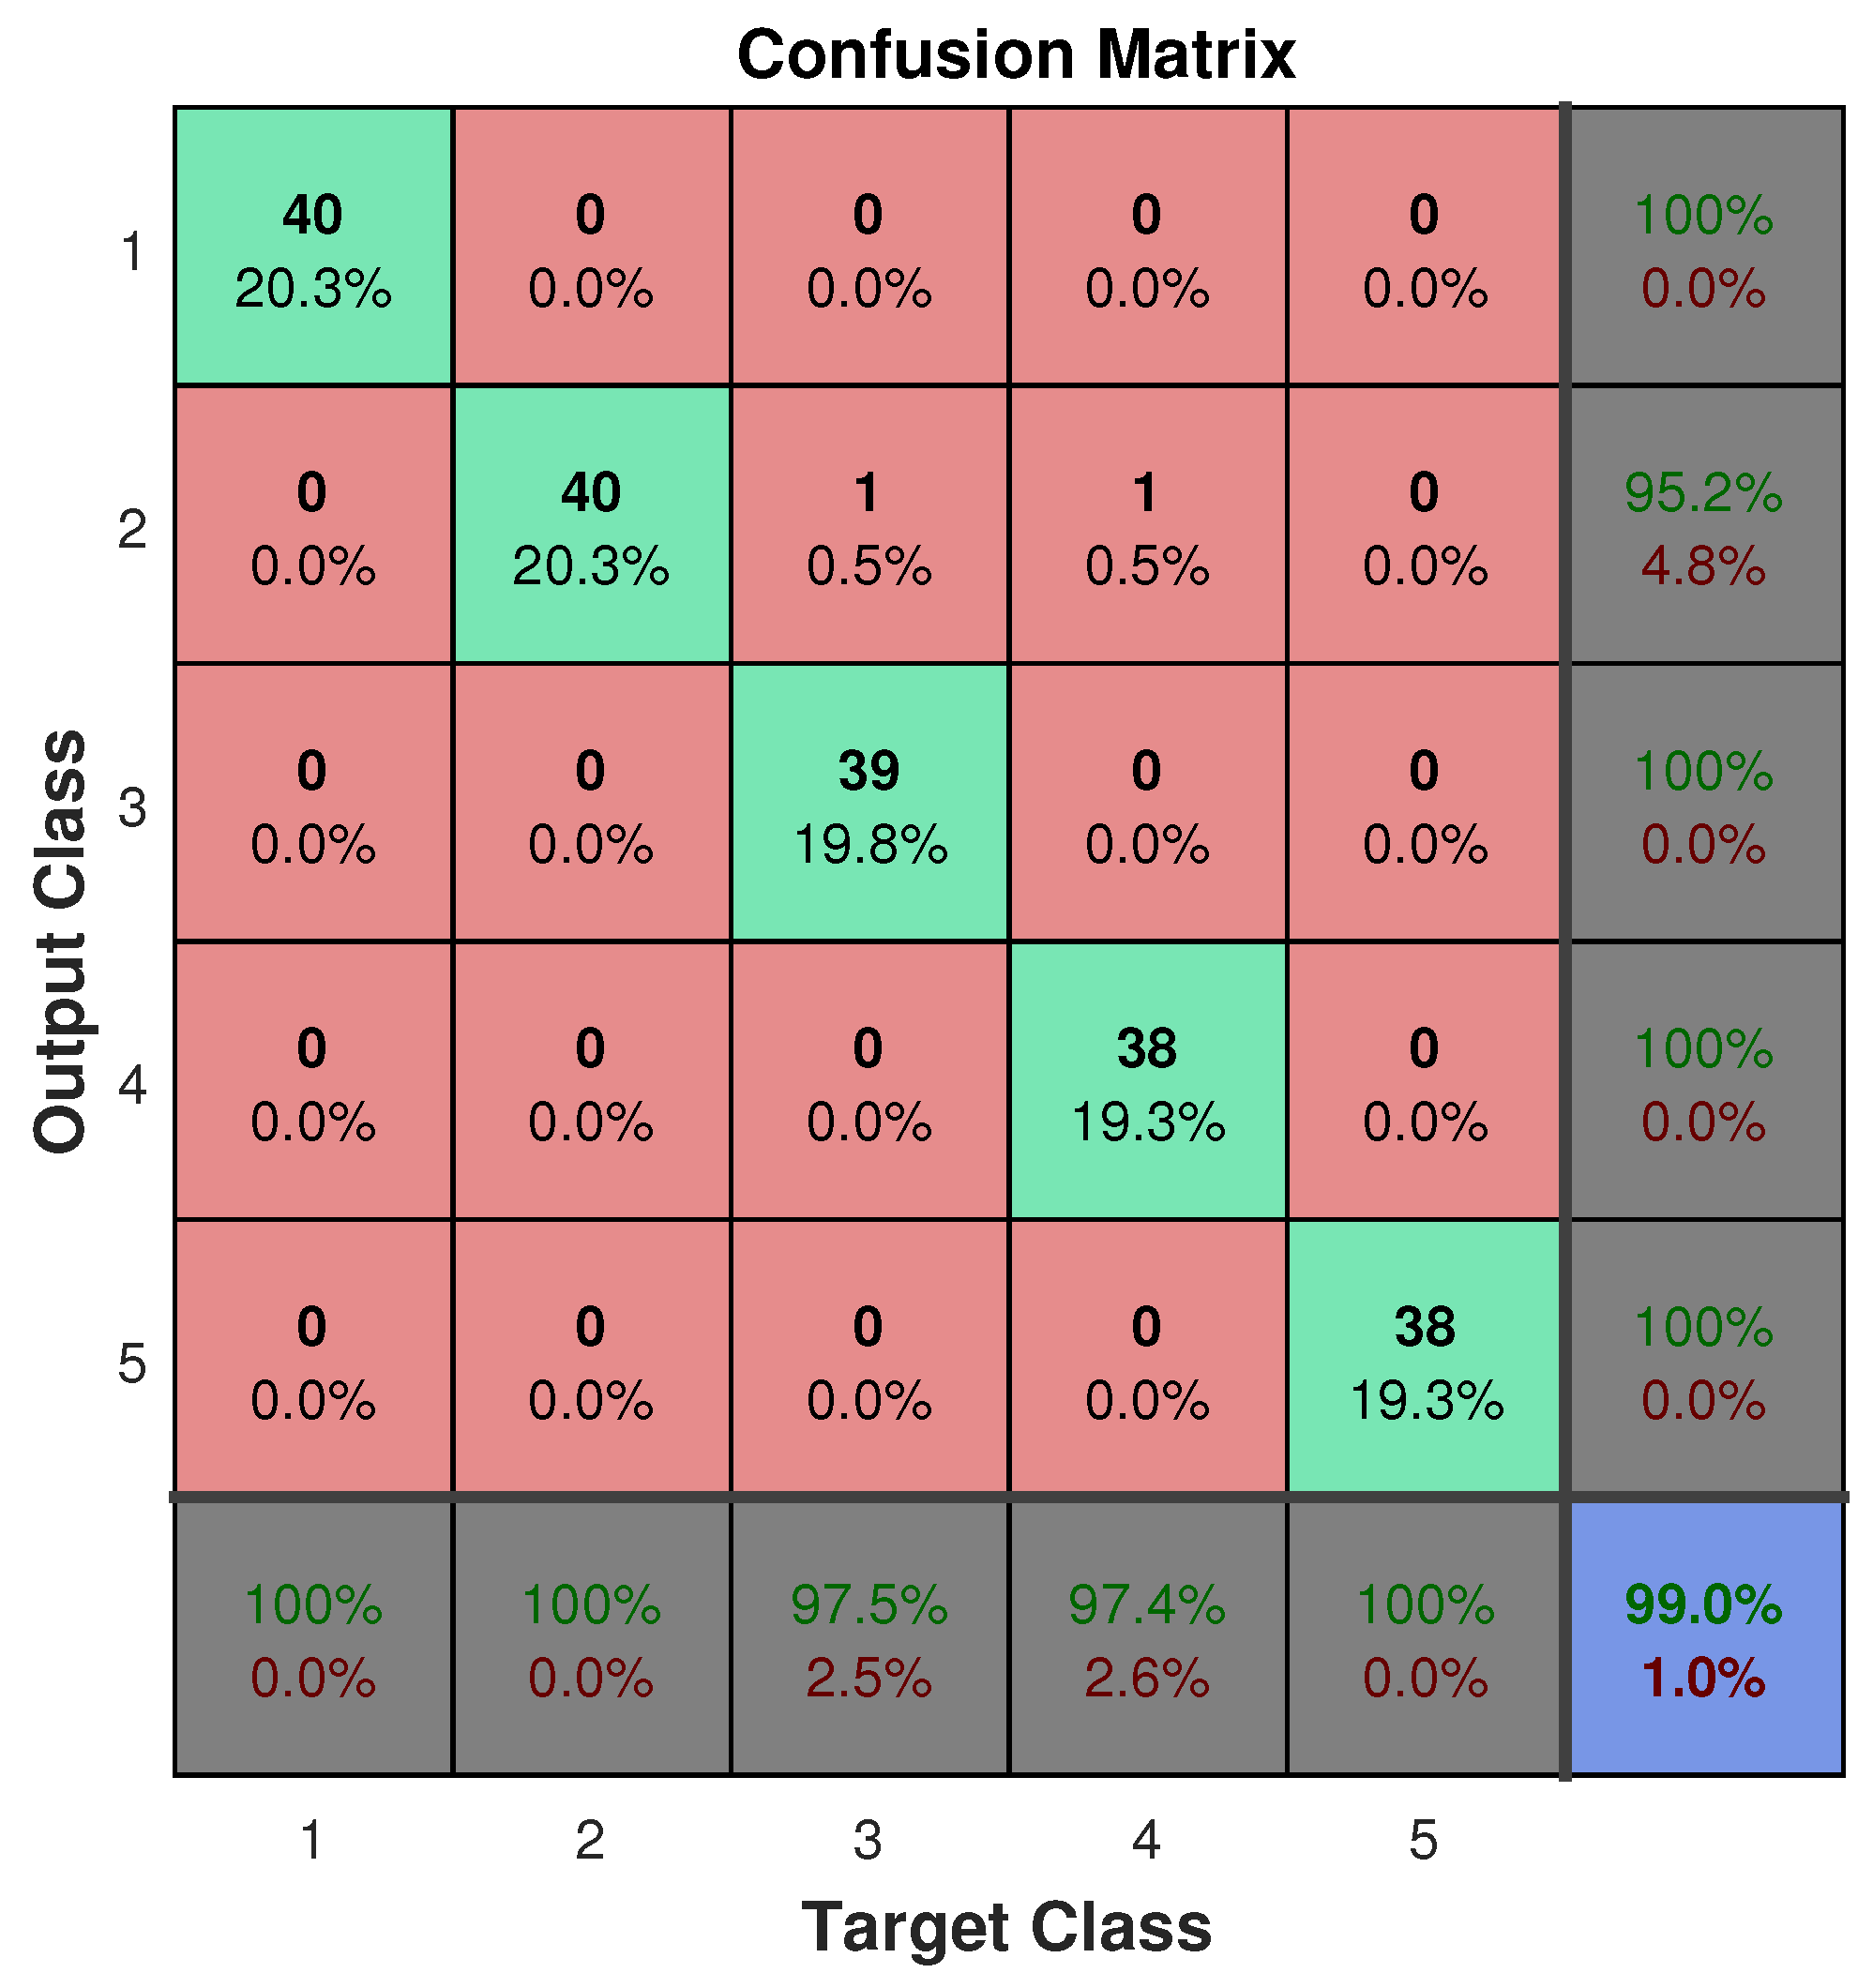
Figure 14 shows the confusion matrices during the training phase for the two experiments.
Online: Recognition Stage
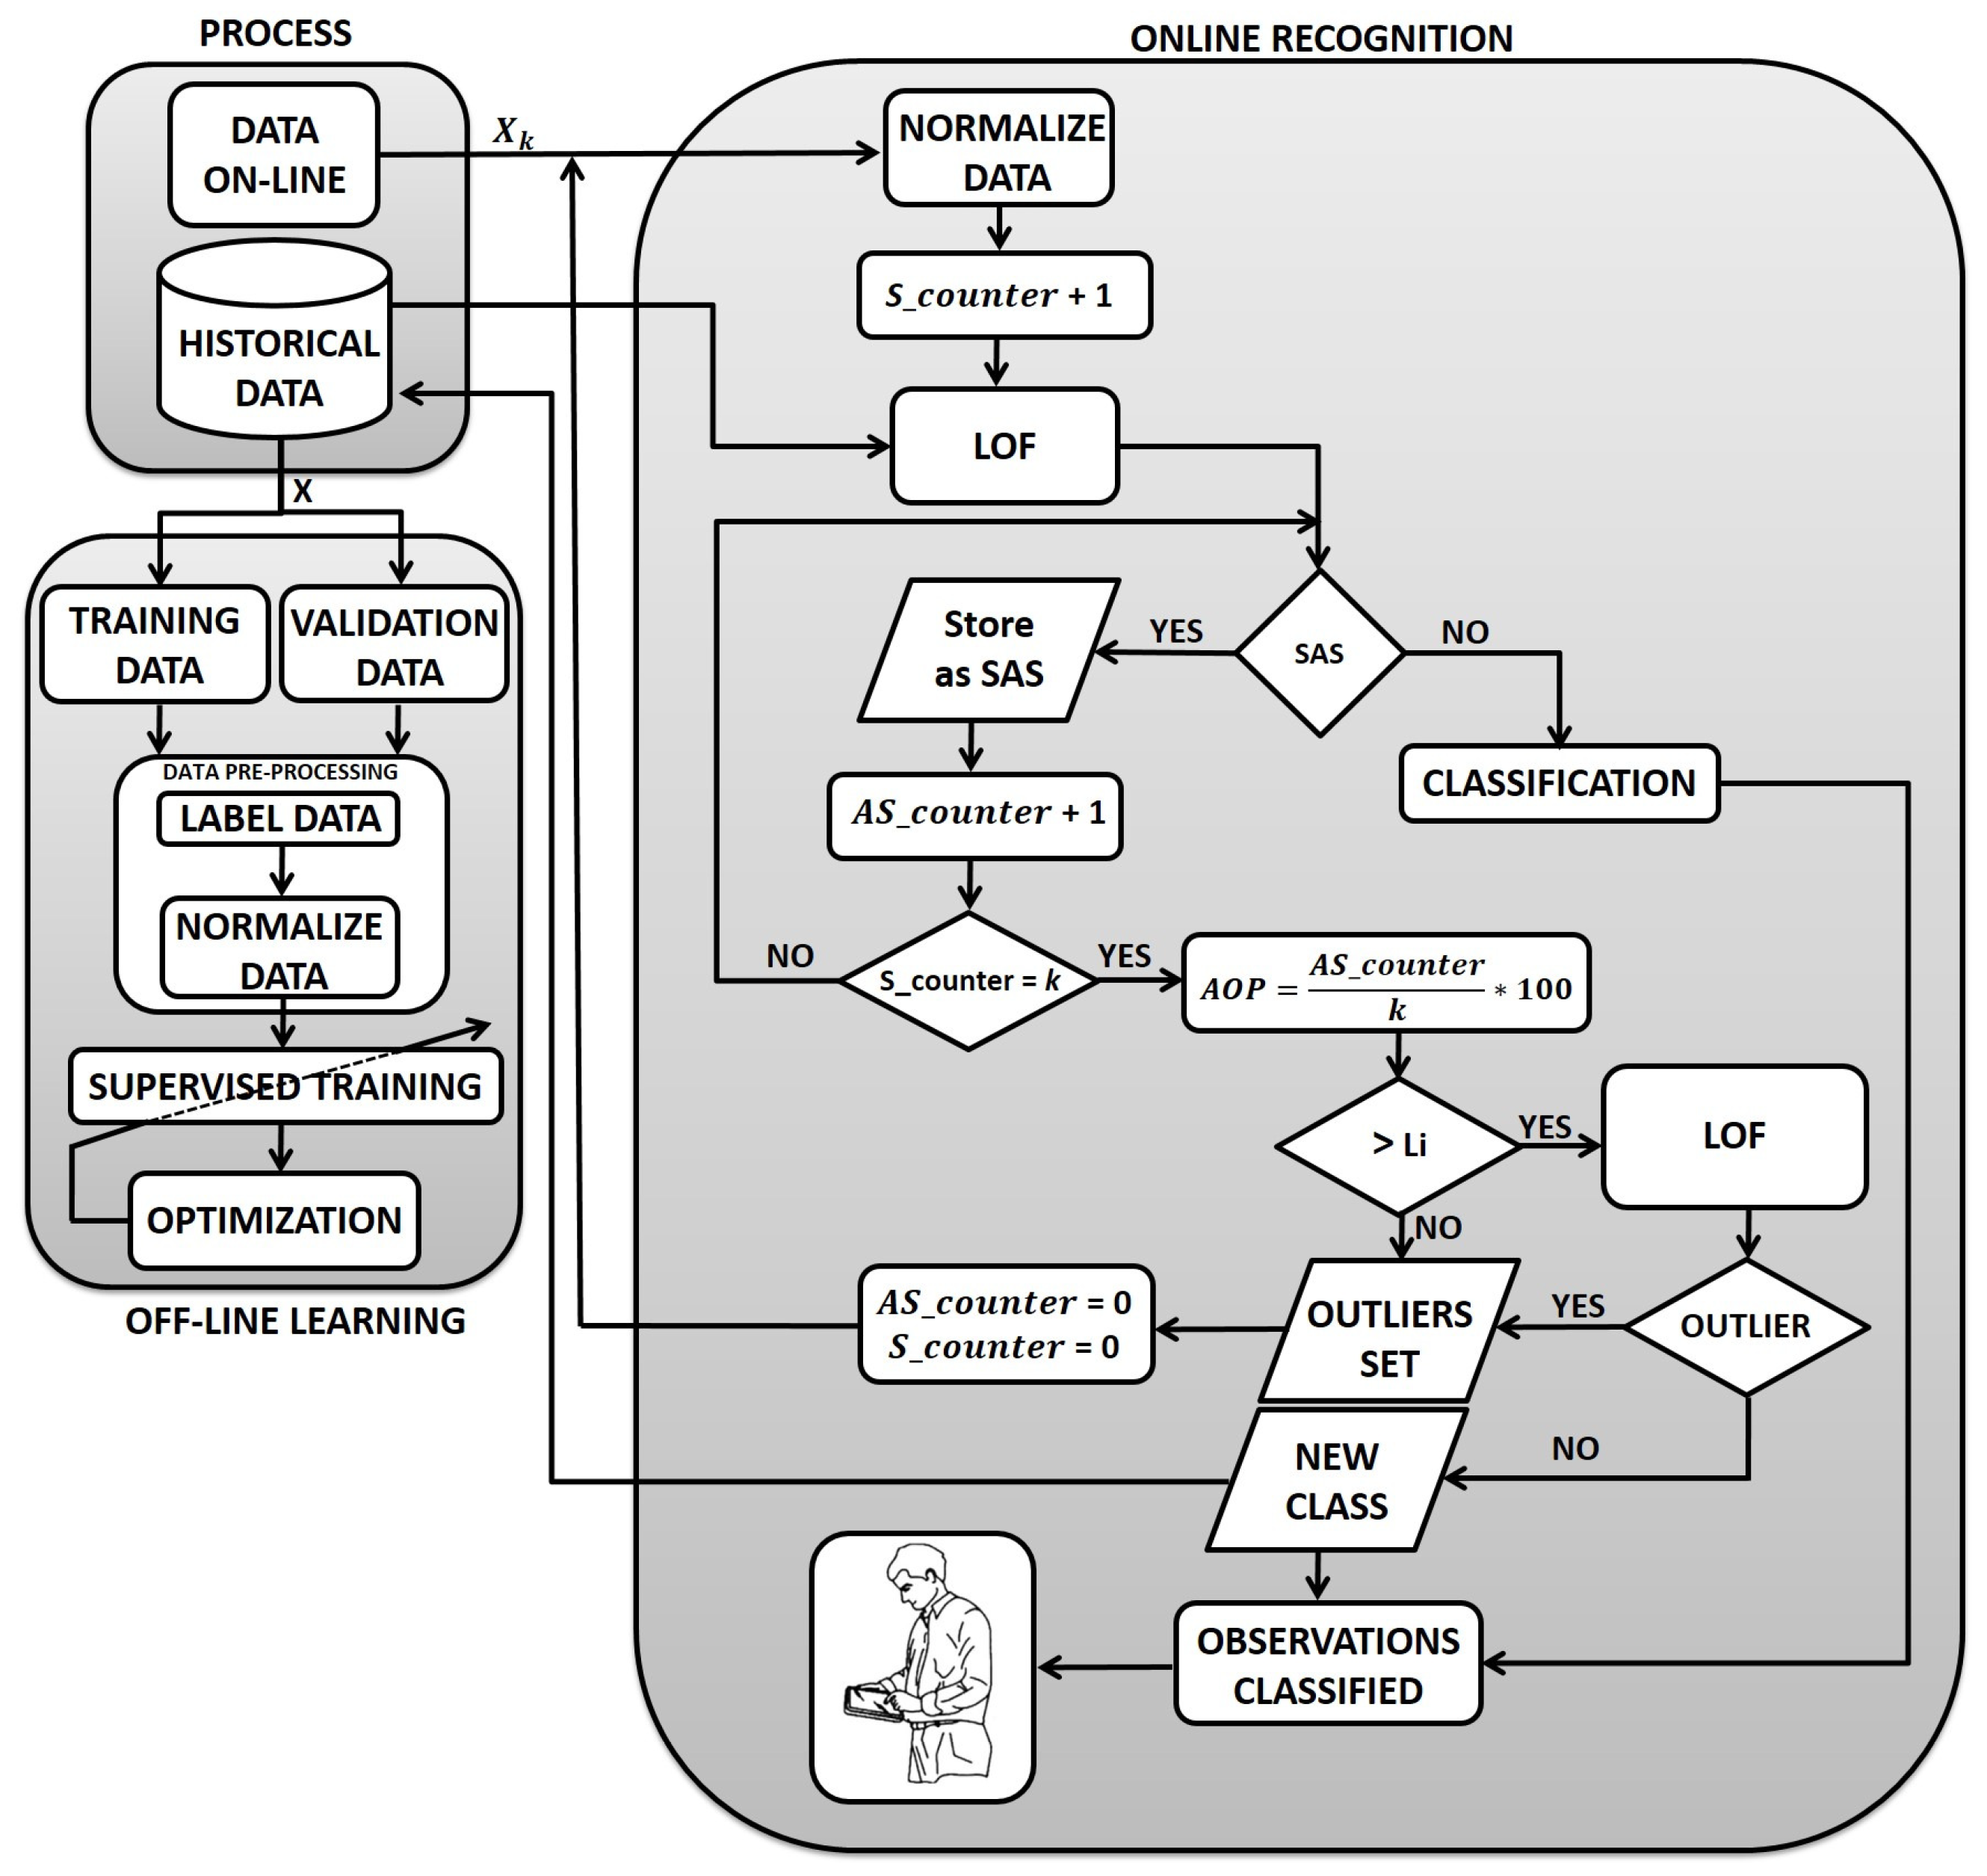
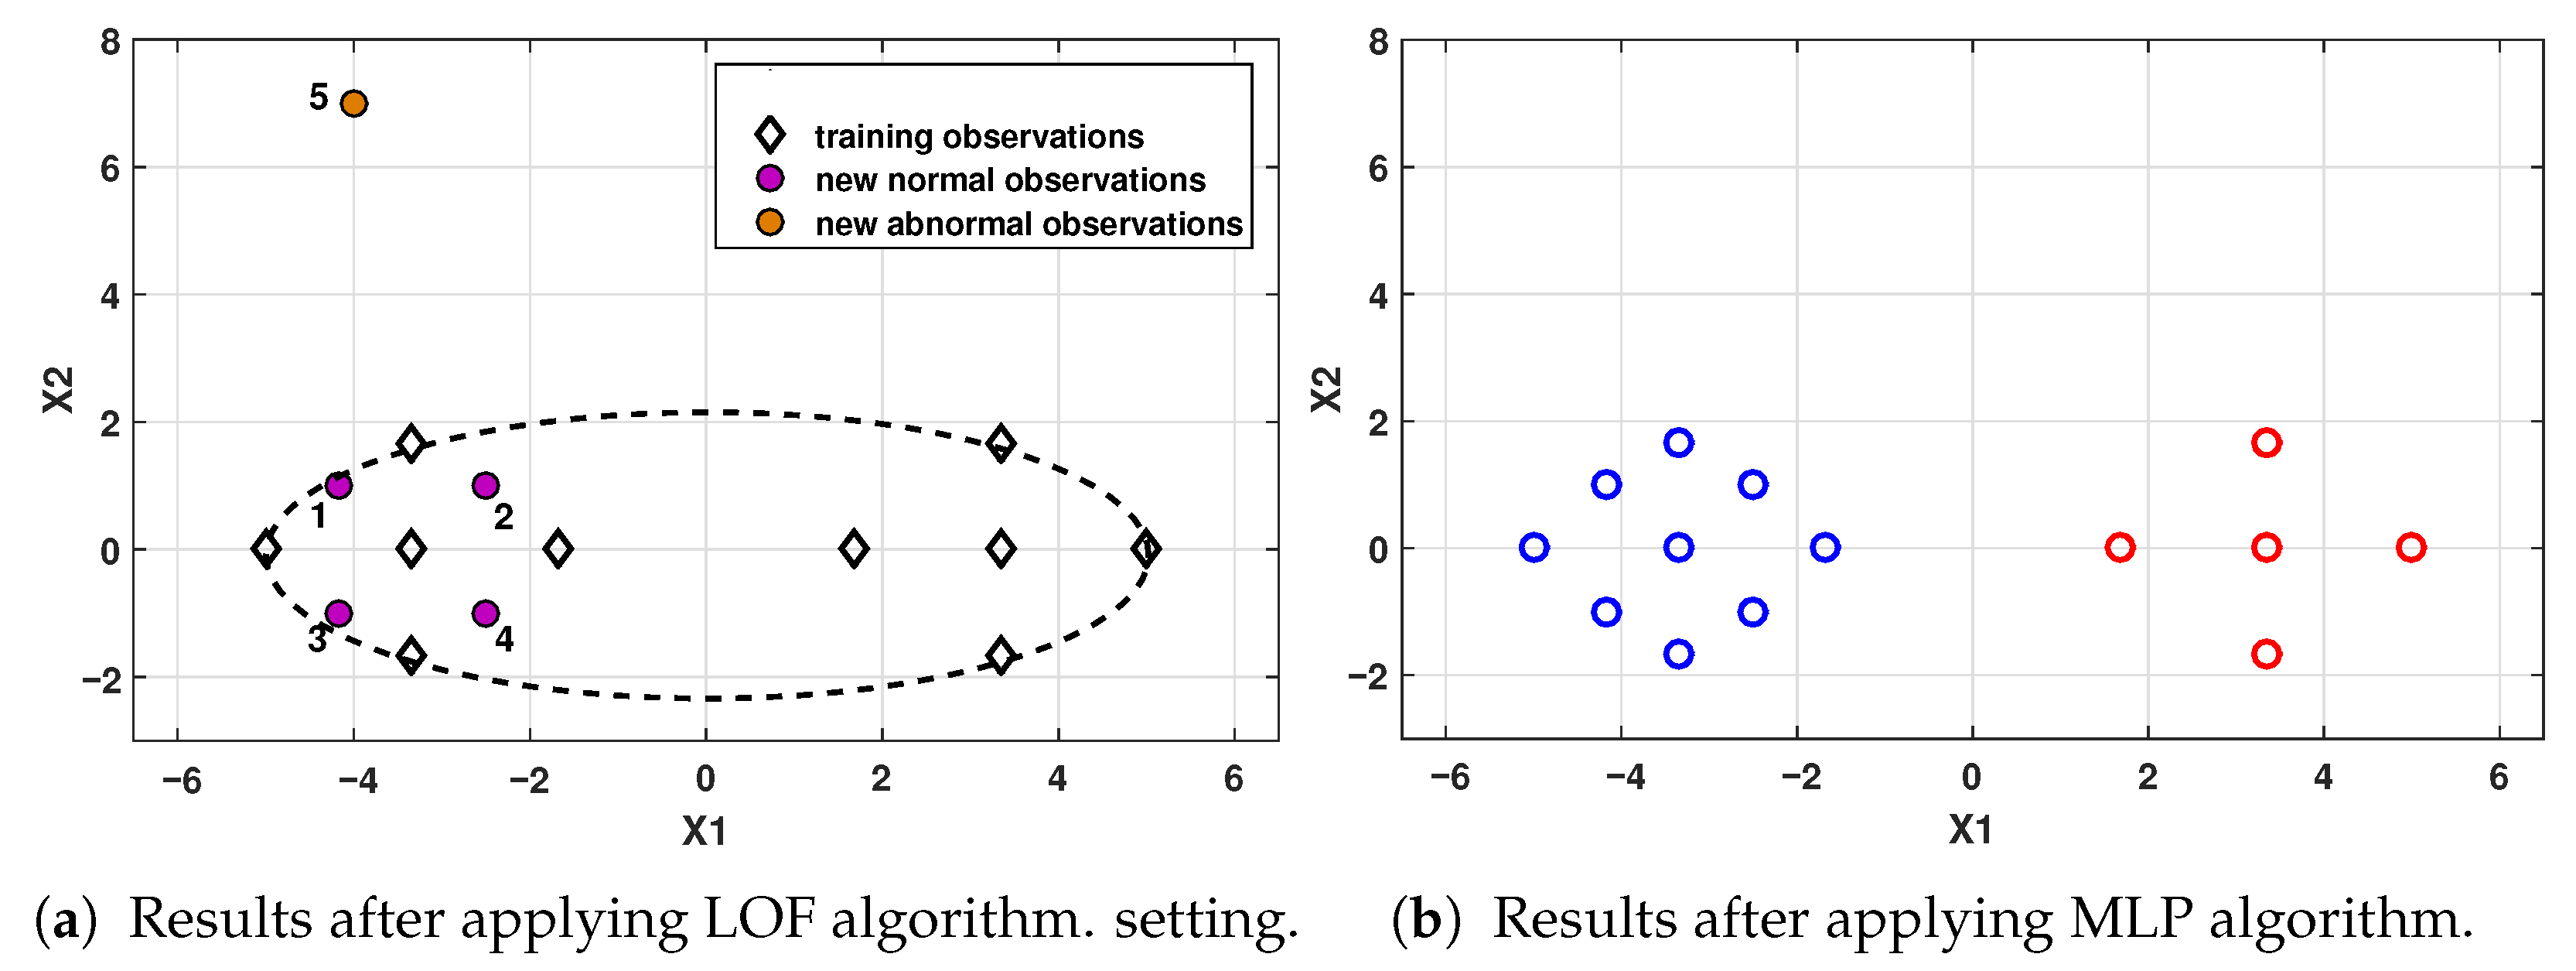
Under the premise of quickly detecting a new event, fifty samples were considered for evaluation. Therefore, a time window , equivalent to 50 s, was considered. Furthermore, to define an appropriate level for most of the samples classified as unknown events, it was decided to use a decision threshold of . It is important to highlight that the selection of these parameters responds to the type of process and the opinions of the specialists.
Table 3 and
Table 4 show the confusion matrices for the experiments described in the previous section. We considered the states NOC, F-1, A-1, F-2, A-2, and New Event (NE), along with the Outliers (O) class. The main diagonal of the confusion matrix indicates the number of samples accurately identified or classified, while the off-diagonal values reflect misclassifications. The classification accuracy for each class and total can be computed using the information of the confusion matrix. The last row exhibits the Average Accuracy (AVE) across all classes.
Analysis of Results.
As seen in
Table 3, satisfactory results were obtained thanks to accurate classification of both the NOC class and the outliers. In Scenario 1 (TDB1), the LOF algorithm classifies the ten samples as
, then
; therefore, the density of the set of
was not evaluated. For Scenario 2 (TDB1), it is shown that the online algorithm achieved satisfactory results in identifying ten samples from the F-1 fault and the forty outliers. In this scenario, the LOF algorithm classifies 38 observations as
, meaning that
, then evaluates the density of the set of SAS. The two outliers identified as known classes are analyzed by the MLP algorithm and classified into classes A-1 and A-2. In Scenario 3 (TDB1), forty samples belonging to a new event (Fault F-2) and ten outlier observations are evaluated and classified over fifty sample periods. In this scenario, the LOF algorithm classifies fifty observations as
; thus,
, meaning that the set of outliers must be analyzed.
Considering Scenario 1 (TDB2),
Table 3 displays the obtained results. In this scenario, satisfactory results are obtained thanks to accurate classification of attack A-1 and the outliers. For Scenario 2 (TDB2), the ten samples of fault F-2 and the forty outliers are successfully identified. In this case, the LOF algorithm classifies 39 observations as
; thus,
, and the density of the set of
must be evaluated. The outlier identified as a known class is analyzed by the MLP algorithm and classified into the A-1 class.
In Scenario 3 (TDB2), the classification of forty samples belonging to a new event (Attack A-2) and ten outliers is evident. In this case, the LOF algorithm classifies 49 observations as ; thus, , meaning that the set of outliers must be analyzed. The identified as a known class is analyzed by the MLP algorithm and classified into the NOC class.
For Scenario 2 (TDB1),
Table 4 shows the evaluation results of the 38 samples identified as
. In this case, the density-based LOF algorithm must determine which
items in the set are classified as either a new event or as outliers. In this analysis, the LOF algorithm is used to identify a single new class, where the set of
represents the outliers. The next crucial step requires experts to evaluate these results and decide whether a new event implies a new attack or fault pattern. As can be seen, all observations are identified as outliers; therefore, they are removed and the
and
S counters are reset.
For Scenario 3 (TDB1),
Table 4 shows the results after implementing the LOF algorithm to classify the set of
as outliers or as a new event. In this case, the presence of a new event (Fault F-2) is clearly evident. After identifying a new class, experts must characterize the pattern and update the historical database. This crucial step allows the condition monitoring system algorithms to be retrained, thereby integrating the new pattern.
For Scenario 2 (TDB2), the evaluation results for the 39 samples identified as
are shown. In this case, all observations are identified as outliers; therefore, they are deleted and the
and
S counters are reset. In Scenario 3 (TDB2),
Table 4 presents the results after implementing the density-based LOF algorithm to classify the 49
as either outliers or as a new event. It can be seen that the presence of a new event (Attack A-2) is evident.
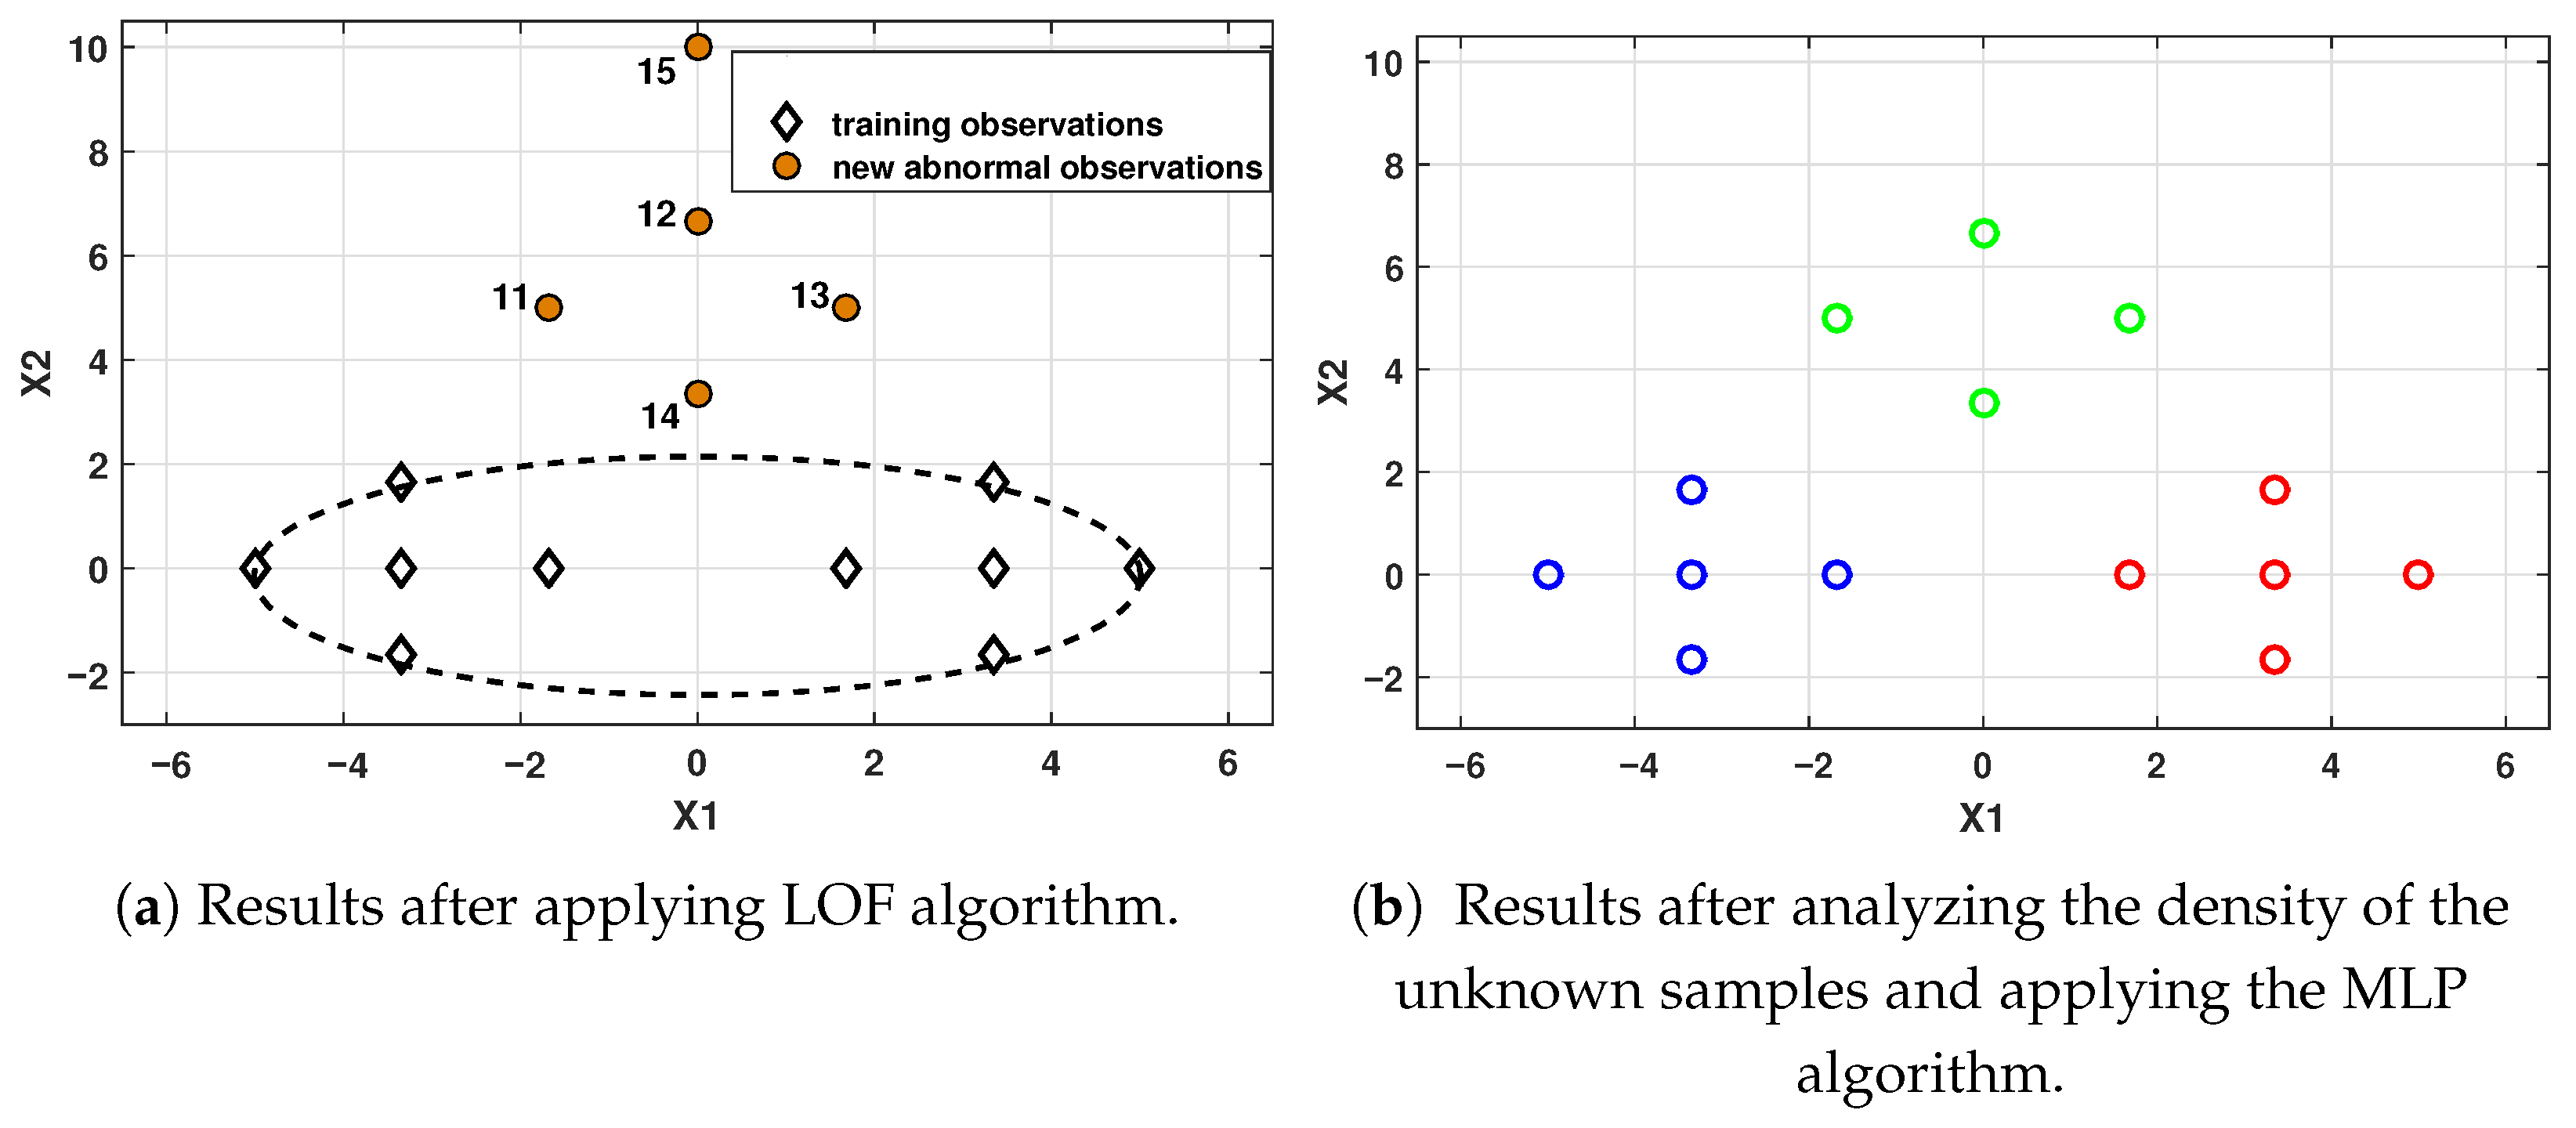
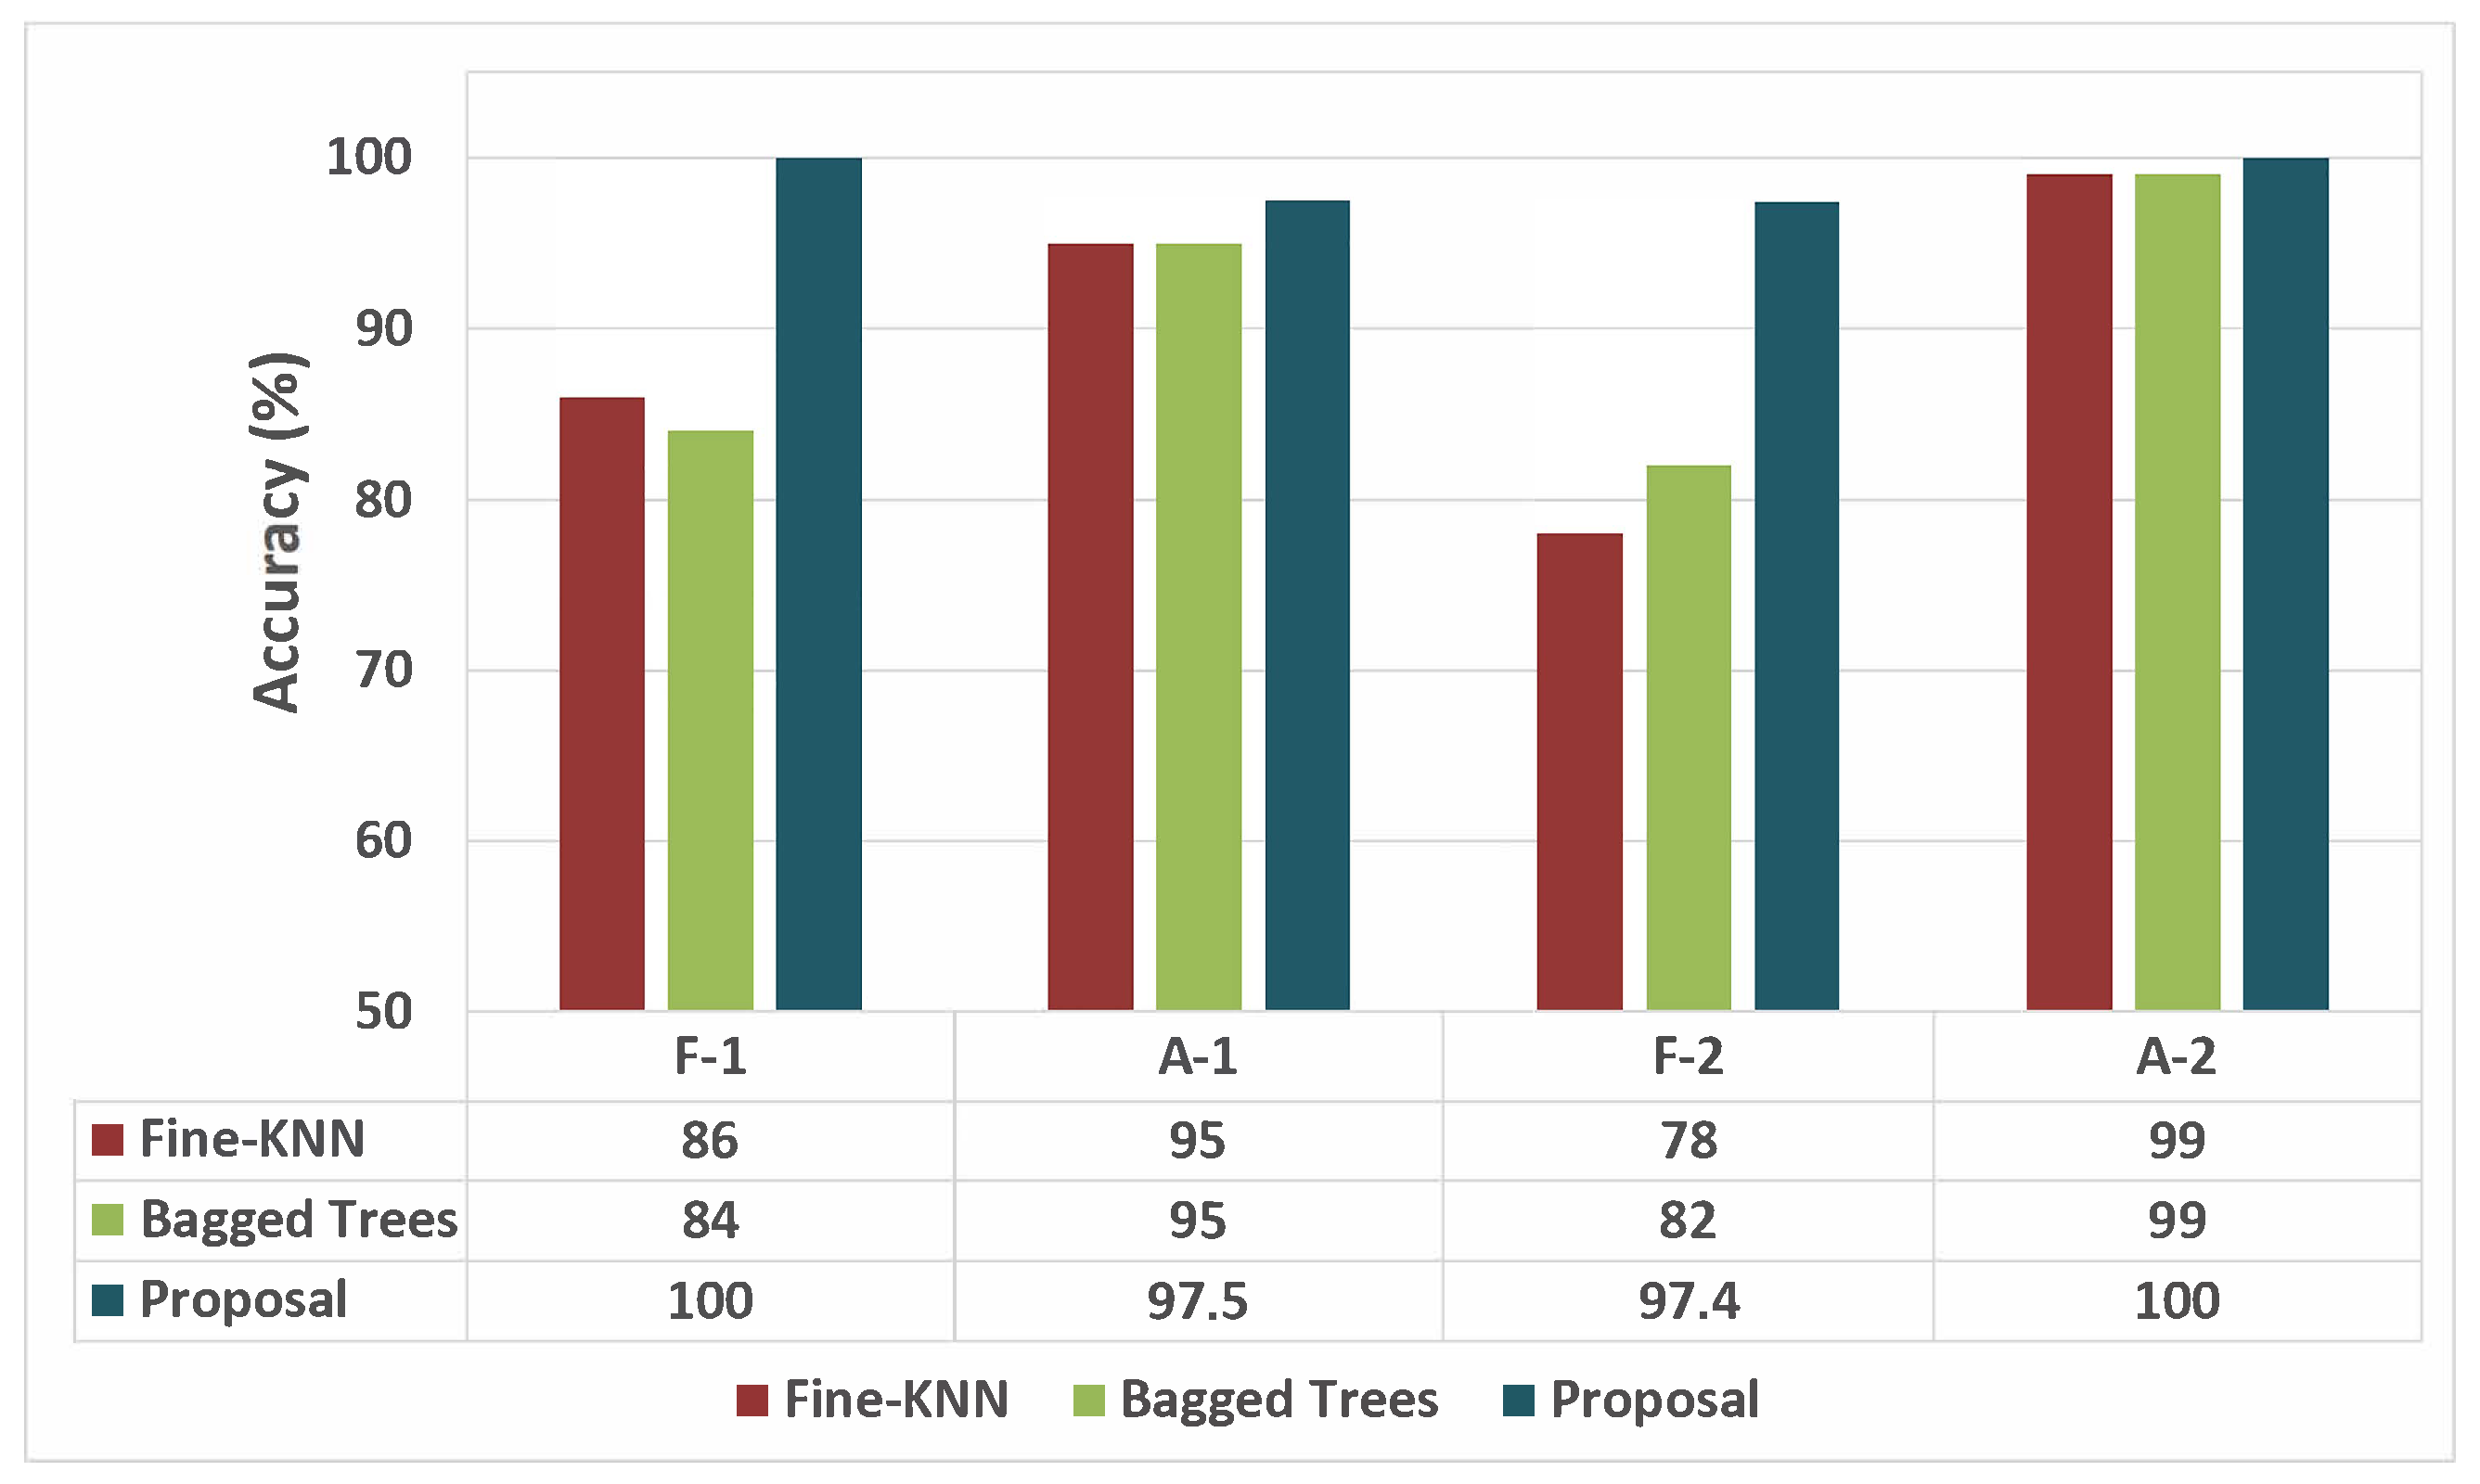
Figure 15 shows the results after the new events (fault F-2 and attack A-2) are identified and updated in the training database.
Table 5 shows the performance in the online classification stage. For each operating state analyzed, high precision (percentage of accurate predictions among all positive predictions) is evident, always maintaining values above 97%. Recall (percentage of positive labels that the classifier correctly predicted to be positive) shows satisfactory performance, achieving 95.24% for F-1 and 100% for the remaining classes. Finally, the F1 score is always above 97 %, offering an excellent balance between the previous metrics.
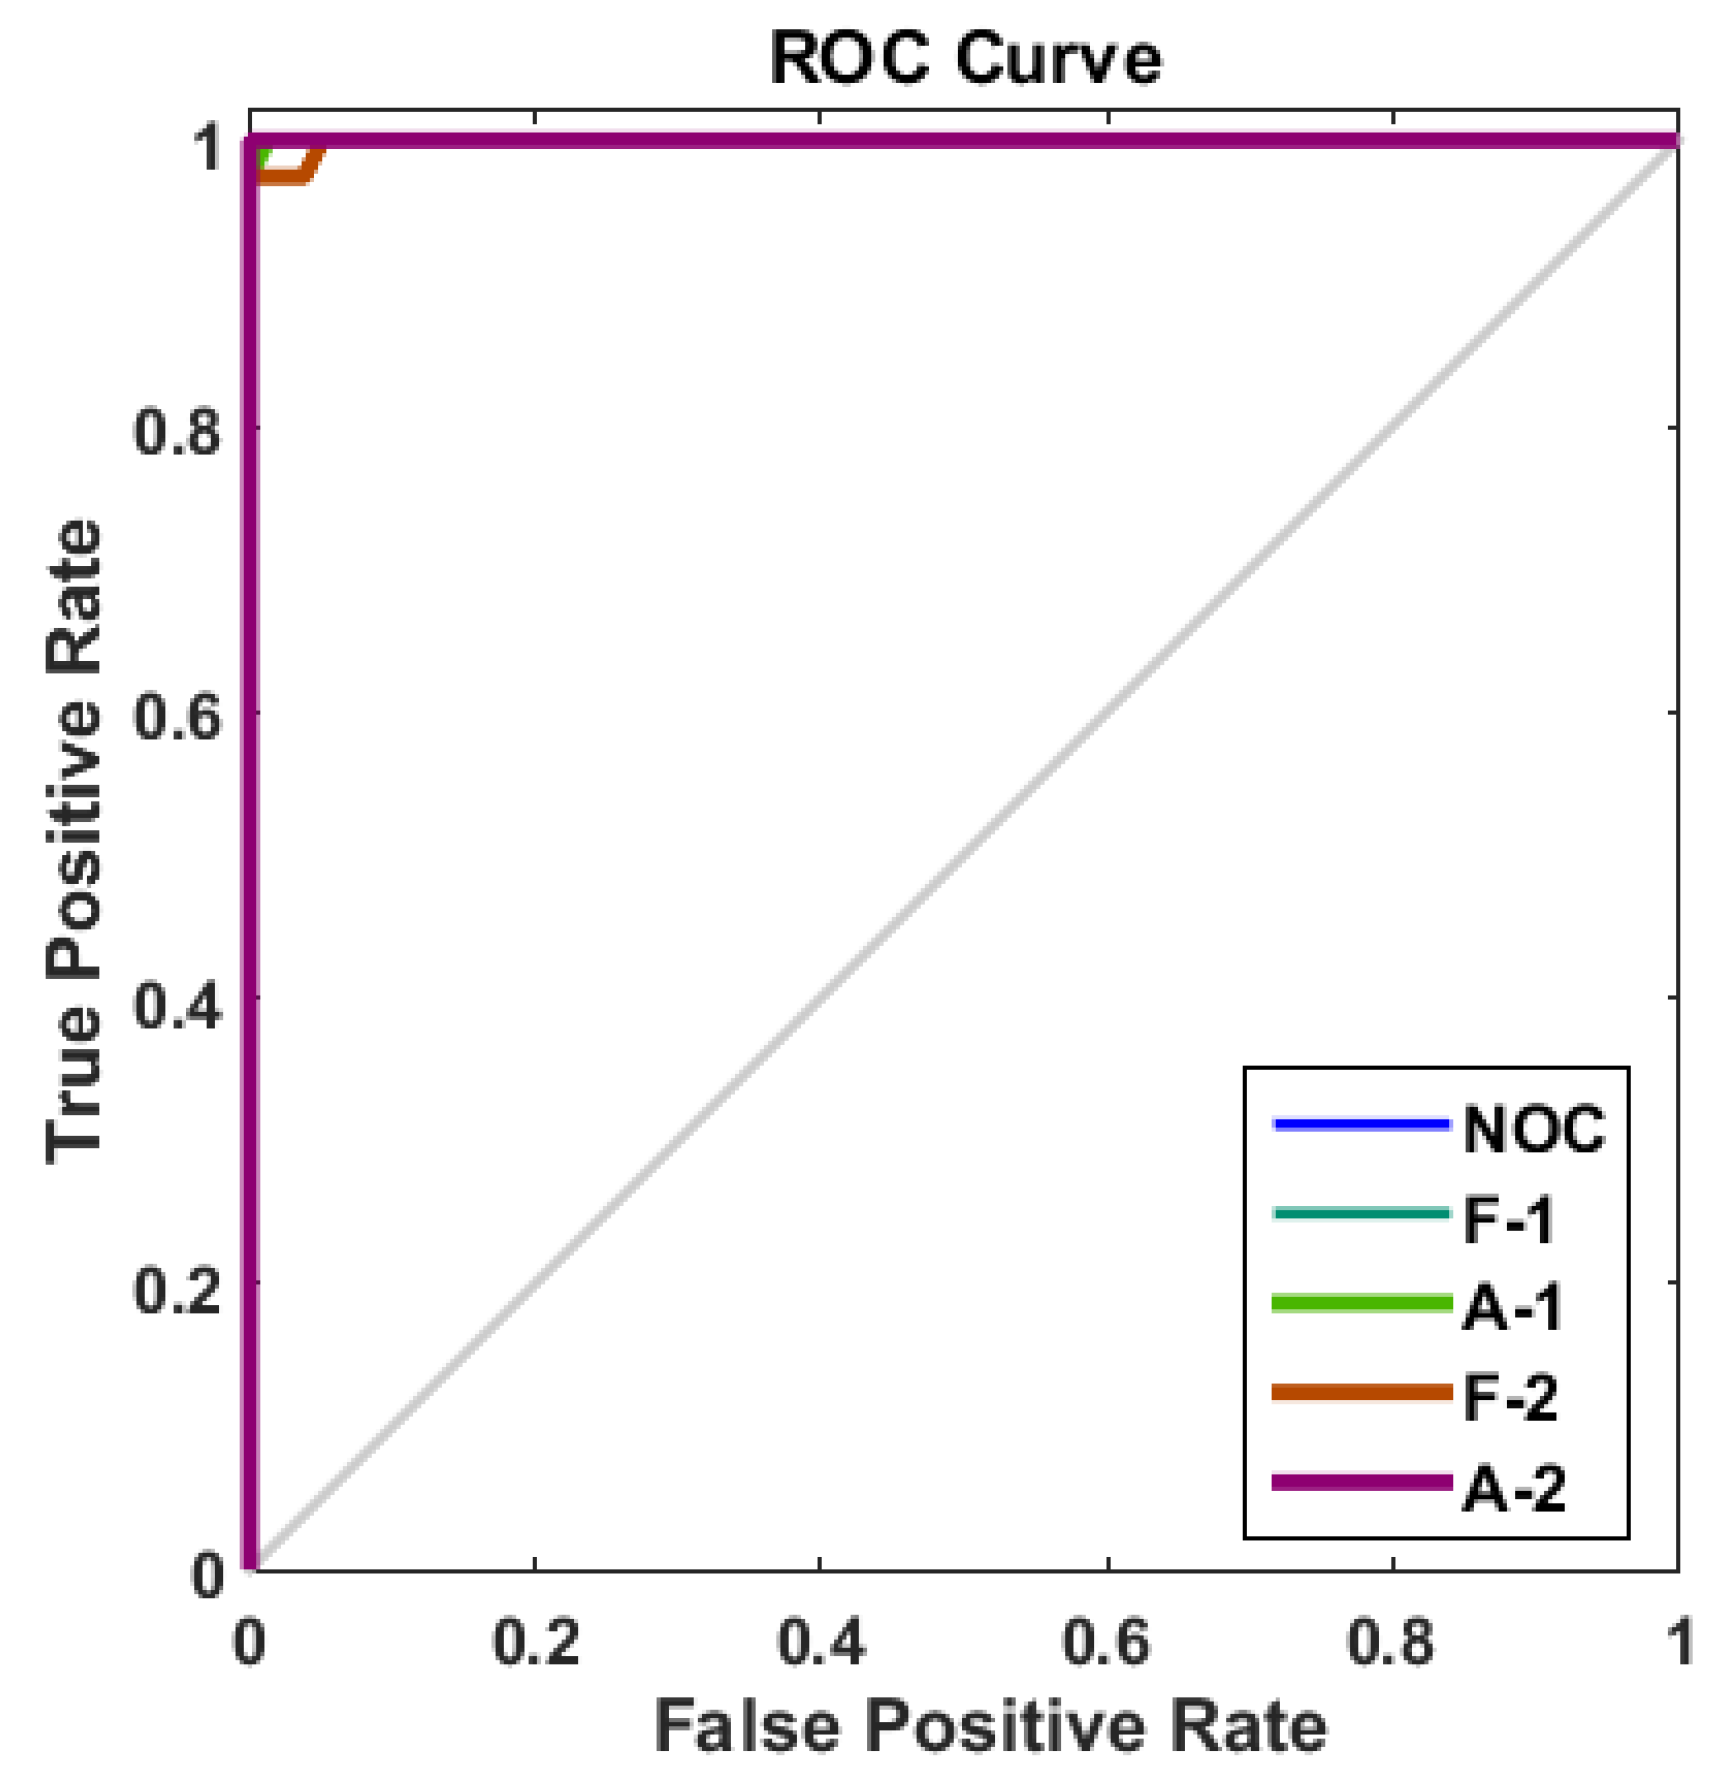
In addition, the Receiver Operating Characteristic (ROC) curve shown in
Figure 16 demonstrates satisfactory performance in classifying the analyzed operating states. It can be seen that the ROC curve tends towards the upper left corner, indicating a high True Positive Rate (TPR) close to 1 and low False Positive Rate (FPR) close to 0.
