Article

Performance Evaluation and Kinetic Analysis of an Iron Ore as Oxygen Carrier in Chemical Looping Combustion

1
China Resources Building Materials Technology Holdings Co., Ltd., Shenzhen 518000, China
2
Jiangsu Key Laboratory of Process Enhancement and Energy Equipment Technology, School of Mechanical and Power Engineering, Nanjing Tech University, Nanjing 211816, China
*
Authors to whom correspondence should be addressed.
Processes 2025, 13(9), 2949; https://doi.org/10.3390/pr13092949
Submission received: 8 August 2025 / Revised: 6 September 2025 / Accepted: 13 September 2025 / Published: 16 September 2025

Abstract

Chemical looping combustion (CLC) provides an inherently cost-effective method for carbon capture by employing a solid oxygen carrier (OC) to transfer lattice oxygen from air to fuel. The search for low-cost, high-performance natural OCs is crucial for the large-scale deployment of this technology. A natural iron ore containing 41.34% Fe2O3 was systematically evaluated as OC for the CLC of CO. Its redox performance was quantified in a fixed-bed reactor between 750 °C and 900 °C with CO concentrations of 10–20%. Multi-cycle tests were conducted to assess stability. Kinetic analysis of the initial cycles was performed using an integral model fitting method. Multi-cycle tests revealed that the fresh ore achieved peak conversions of 48.9% at 750 °C and 77.2% at 900 °C. However, severe sintering occurred beyond 850 °C after the first cycle, causing approximately a 50% drop in OC conversion. Interestingly, once sintered, a self-activation phenomenon was observed during subsequent cycles; the OC conversion slowly recovered from 32% to 37% from the second to the fifteenth cycle under the aggressive conditions (900 °C, 20% CO). Kinetic analysis of the initial cycles (before sintering) revealed low apparent activation energies, ranging from 15.93 to 19.13 kJ mol−1, which are significantly lower than the typical literature values for iron-based ores. This work underscores the potential of natural iron ores as economical and sustainable OCs for CO-rich fuels. The observed self-activation ability of the sintered OC is a promising finding for long-term operation. The results also highlight the critical importance of operating conditions to avoid deep reduction and sintering, necessitating a high solids inventory and a moderate oxygen-to-fuel ratio in practical CLC systems.

1. Introduction

The issue of global warming caused by CO2 emissions has been the focus of research for many years, especially after 2015 when the Paris Agreement was signed [1,2,3,4]. However, in early 2025, official reports indicated that the Earth’s average temperature had increased by more than 1.5 °C compared to pre-industrial levels [5]. The data reiterated the urgent need to curb carbon emissions, which reached an unprecedented peak in 2024 [6]. In the energy sector, fossil fuels play an important role as the cornerstone for energy safety. As the imperative for decarbonization grows, there is heightened focus on carbon capture and storage technologies within this domain [7,8,9].
There have been different ways for carbon capture in fossil fuel utilization, such as integrated gasification combined cycle, CO2 sorption in flue gas, oxy-fuel combustion, and so on [10,11,12,13]. Of these, chemical looping combustion (CLC) has garnered significant attention, owing to its inherent CO2 separation during combustion, low-NOx formation, and high exergy efficiency, etc. [13,14,15,16]. In CLC, fuel and air are processed in different reactors, namely the fuel reactor (FR) and air reactor (AR). Oxygen from the air is transferred to the fuel via an oxygen carrier (OC), typically a metal oxide. That avoids the direct contact between the fuel and air. Consequently, combustion products in the FR are not diluted by the nitrogen in air. After condensation and purification of the flue gas at the FR side, it yields a high-concentration CO2 stream for capture. The principle of CLC is shown in Figure 1.
OC circulates between two reactors, participating alternately in redox reactions, which is crucial to CLC [15,17]. Its properties directly determine the combustion efficiency, carbon capture performance, long-term stability, and operational cost. When selecting an oxygen carrier, it is necessary to consider its performance from multiple aspects, such as the reaction kinetics, oxygen carrying capacity, and environmental performance [17]. Among various OCs, Fe-based OC exhibits favorable properties in terms of reactivity and environmental impact [15,18,19]. The preparation of Fe-based OCs typically involves using Fe2O3 as the active component with Al2O3, ZrO2, TiO2, SiO2, and other inert substances [20,21,22]. By adjusting ratios and processes, controllable oxygen carriers can be synthesized. However, the scalability and cost-effectiveness of the synthetic process remain significant challenges [23]. Researchers recognize the economic viability of using natural ore as an oxygen carrier and consider it an inevitable choice for large-scale CLC systems [24,25,26,27]. The selection of appropriate OC necessitates a comprehensive investigation into its reaction performances.
The prevalent iron ores encompass ilmenite and hematite, among others. To examine the combustion performance of such ores as OC, the intermediate gasification products like CO, H2, and CH4 from the solid fuel combustion process are usually employed as fuels to study their reaction characteristics with iron ore [28,29]. Leion et al. conducted an investigation into the reaction performance of various ilmenite minerals in CLC using a laboratory-scale fluidized bed. Their findings affirmed the viability of using natural ores as oxygen carriers and established that these OCs possess commendable strength and fluidization characteristics [27]. Adánez et al. employed CO, CH4, and H2 as gaseous fuels in a thermogravimetric analyzer (TGA) to study the reaction performance of ilmenite in CLC. They observed an enhancement in the reaction performance of ilmenite during the initial few redox cycles, which is referred to as the activation process. The duration of this activation process was found to be contingent upon the composition of the gas fuel [30]. For performance evaluation, experiments are usually conducted to derive kinetic parameters such as the apparent activation energy for the reaction between OCs and fuel. Significant progress has been made in the research on the reaction characteristics of natural iron ore, and some of the main relevant literature is summarized in Table 1.
The activation energy among varying iron ores exhibits significant diversity, attributable to the different distribution locations and active component concentrations inherent in natural iron ores, as well as a variety of microstructure changes (such as pore characteristics, surface structure, etc.). In recent years, numerous pilot-scale CLC units have been constructed and set into operation [14,15,24,26,41]. There is a substantial demand for low-cost and efficient OC. Though many works have focused on the performance evaluation and selection for OCs, only a few types of OCs have been tested on pilot-scale or sub-industrial CLC units. Previously, our group has designed and established a pilot-scale CLC circulating fluidized bed reactor [13,42]. A kind of iron ore OC has been used for the CLC of coal. Satisfactory CLC performances were obtained. While the feasibility of natural iron ores as OCs is established, this work focuses on an ore with a comparatively low Fe2O3 content (41.34%) but high inherent SiO2 and Al2O3, evaluating its performance under aggressive conditions. Testing ores with lower active content but high mechanical strength is highly relevant for cost-cutting. The primary focus of this study was to evaluate the macroscopic redox performance and reaction kinetics of a naturally sourced iron ore under typical CLC conditions.

2. Experimental Section

2.1. Material

As previously noted, both the OC circulation and inventory are much larger in a pilot-scale CLC unit. The expense associated with synthetic OC is prohibitively high, and it always exhibits relatively low mechanical strength. A kind of iron ore produced in Hebei, China, is chosen due to its properties of low cost and proper Fe content in prior selections.
The selected iron ore was crushed and sieved to obtain a particle size fraction from 350 to 830 µm. Then, the ore particle is calcined at 1000 °C for 2 h in the atmosphere of air to guarantee sufficient oxidation. For the precalcination step, it is not merely for oxidation but is a critical pre-treatment to achieve a stable initial microstructure and maximum oxidation state before the redox cycles begin. This pre-treatment at high temperature is also a common method in the study of OC performance in the field of CLC. The calcined particle is used for the OC in following experiment. Its compositions are analyzed using X-ray Fluorescence (XRF) Spectrometer, typed Rigaku ZSX Primus III+ (Rigaku Corporation, Tokyo, Japan). The results are shown in Table 2.
It is seen that this kind of OC has relatively high contents of SiO2 and Al2O3, which are always used as inert supports in synthetic OC. This natural ore has a relatively high mechanical strength due to this reason. While the factors such as particle size, fuel type, and reactor design can indeed influence the observed reaction rates and apparent kinetics, a detailed comparative analysis of these parameters falls beyond the intended scope.

2.2. Experimental Setup and Procedures

A fixed-bed reactor system is employed to test the CLC performance of this iron ore OC, which is shown in Figure 2. The experimental setup consists of a fixed-bed reactor, gas supply and flow rate controller, temperature controller, and a gas processing and analyzer.
The primary reactor body is made of stainless steel, which has an inner diameter of 8 mm with a height of 600 mm. Within the reactor, a porous sintered plate is located in the flat-temperature zone to place the OC particles. Electrical heating is employed to maintain the reaction temperature, which is measured using a thermocouple. The various gases are quantified using MFC, then mixed in a mixer. At the outlet of the mixer, the gas line is preheated. A temperature controller, equipped with two separated instruments, is used to control the reactor and preheater temperatures through fuzzy PID logic. As the flue gas exits from the reactor, it is cleaned and dried in pure water and silica gel. Subsequently, the cleaned gas is analyzed by a mass spectrometer (MS) to obtain the gas concentrations. To ensure the highest accuracy, the absolute calibration of the MS was not solely reliant on the MFCs. Before each experiment, the MFCs and MS were calibrated using a primary standard: a soap-film flow meter. This calibration was performed at the reactor outlet, after all conditioning elements, thus directly correlating the MS signal to the volumetric flow rate of the gas mixture at ambient temperature and pressure. This procedure directly validates the entire chain of flow and concentration measurements against a primary standard and accounts for any minor deviations in the MFC calibrations or the physical state of the gas.
Prior to the OC evaluation experiment, 15.000 g of OC is weighed and placed into the reactor. Then, the Ar is introduced to purge the reaction zone, while the reactor is simultaneously heated to the setting temperature. While the reactor temperature reaches the operating temperature, a stream of CO gas, at a specific concentration and diluted by Ar, is introduced into the reactor for the reduction of OC. This process continues for 10 min, after which the pure Ar gas is reintroduced for an additional 5 min to sweep the reactor. Following this, a stream of 21% O2, diluted by Ar, is introduced to regenerate the OC for 10 min. The cycle concludes with the reintroduction of pure Ar to sweep the reactor in preparation for the next redox cycle. When all redox cycles are finished, the electrical heater is turned off and the Ar is introduced for cooling the system. Throughout the various stages of the redox cycles, the total gas volume flow rate is maintained at 800 mL min−1. Fixed reaction times ensure that each cycle and each experiment is performed identically, allowing for a direct and fair comparison of the final conversion and deactivation trends. Also, this setting of the reaction time is long enough to capture the reaction profile and reach a pseudo-steady state in gas composition. In addition, the oxidation of reduced iron phases to Fe2O3 is a highly exothermic and typically much faster process than reduction, especially in the presence of air. The 10 min period with air is exceedingly long to ensure complete re-oxidation of OC before the next cycle begins.

2.3. Experimental Data Processing

The gas compositions at the reactor outlet are analyzed to determine the gaseous productions. Typically, the reactivity of the OC is gauged by its reduction, given that the oxidation process is quite fast. During the reduction process, the iron ore OC may be reduced to different phases, as shown in Equation (1):
Fe 2 O 3 Fe 3 O 4 FeO Fe ,
The theoretical weight loss of the OC in a reduced state is different depending on the final phases represented in Equation (1). In order to quantify the conversion of the OC utilized in this work, the final state of the OC is considered to be Fe. During the experiment, the conversion of the OC X is defined by the following equation:
X = m o x m t m o x m r e d ,
where the mox is the weight of the iron ore OC in fully oxidized state, namely the weight fed into the reactor; mred is the OC weight in theoretical reduced state; mt is the OC weight at time t during reduction process, which should be calculated by the lattice oxygen offered by the OC.
During the reduction process, the CO2 is generated due to the participation of lattice oxygen provided by the OC. The molar flow of the CO2  n CO 2 can be determined as follows:
n CO 2 = 0 t n r e d x CO 2 d t ,
where n r e d is the total gas molar flow rate during reduction period, which can be calculated by the volume flow rate of gaseous products Fred; x CO 2 represents the gas concentration as measured by a mass spectrometer.
The inert gas does not participate in the reduction of OC. Therefore, the mass balance of the inert gas, Ar, can be used to determine the total flow rate of the flue gas. The use of an inert gas as an internal standard for mass balance calculations is indeed the universal and fundamental method in the CLC field for determining absolute gas flow rates and solid conversion. This method is well-established in the literature. Based on that, the Fred can be calculated using the balance of Ar in the reaction system, namely:
F r e d = F A r 1 x CO x CO 2 ,
where FAr is the flow rate of the carrier gas Ar in the CO gas; x CO is the concentration of CO in the gaseous products.
The increase in mass from CO to CO2 is equivalent to the decrease in mass of OC during the reduction period. This can be quantified by the following calculation:
m o x m t = 1000 n CO 2 22.4 × 16 44 = 2000 n CO 2 125.4 ,

3. CLC Performance of the Iron Ore as Oxygen Carrier

In a practical CLC process, numerous factors influence the OC reactivity, including reaction temperature, fuel characteristics, reaction time, etc. In this part, the effects of two key factors, namely temperature and the concentration of gaseous fuel, are investigated. Blank experiments were conducted under identical conditions (flow rate, temperature, particle size) using a bed of inert quartz sand with the same size and volume as the OC. This directly measures the system’s intrinsic response time, including the mixing in the preheater, reactor void volume, and the MS response. The response time has been treated when the OC is used as bed material for the CLC experiment.

3.1. Effects of Reaction Temperature

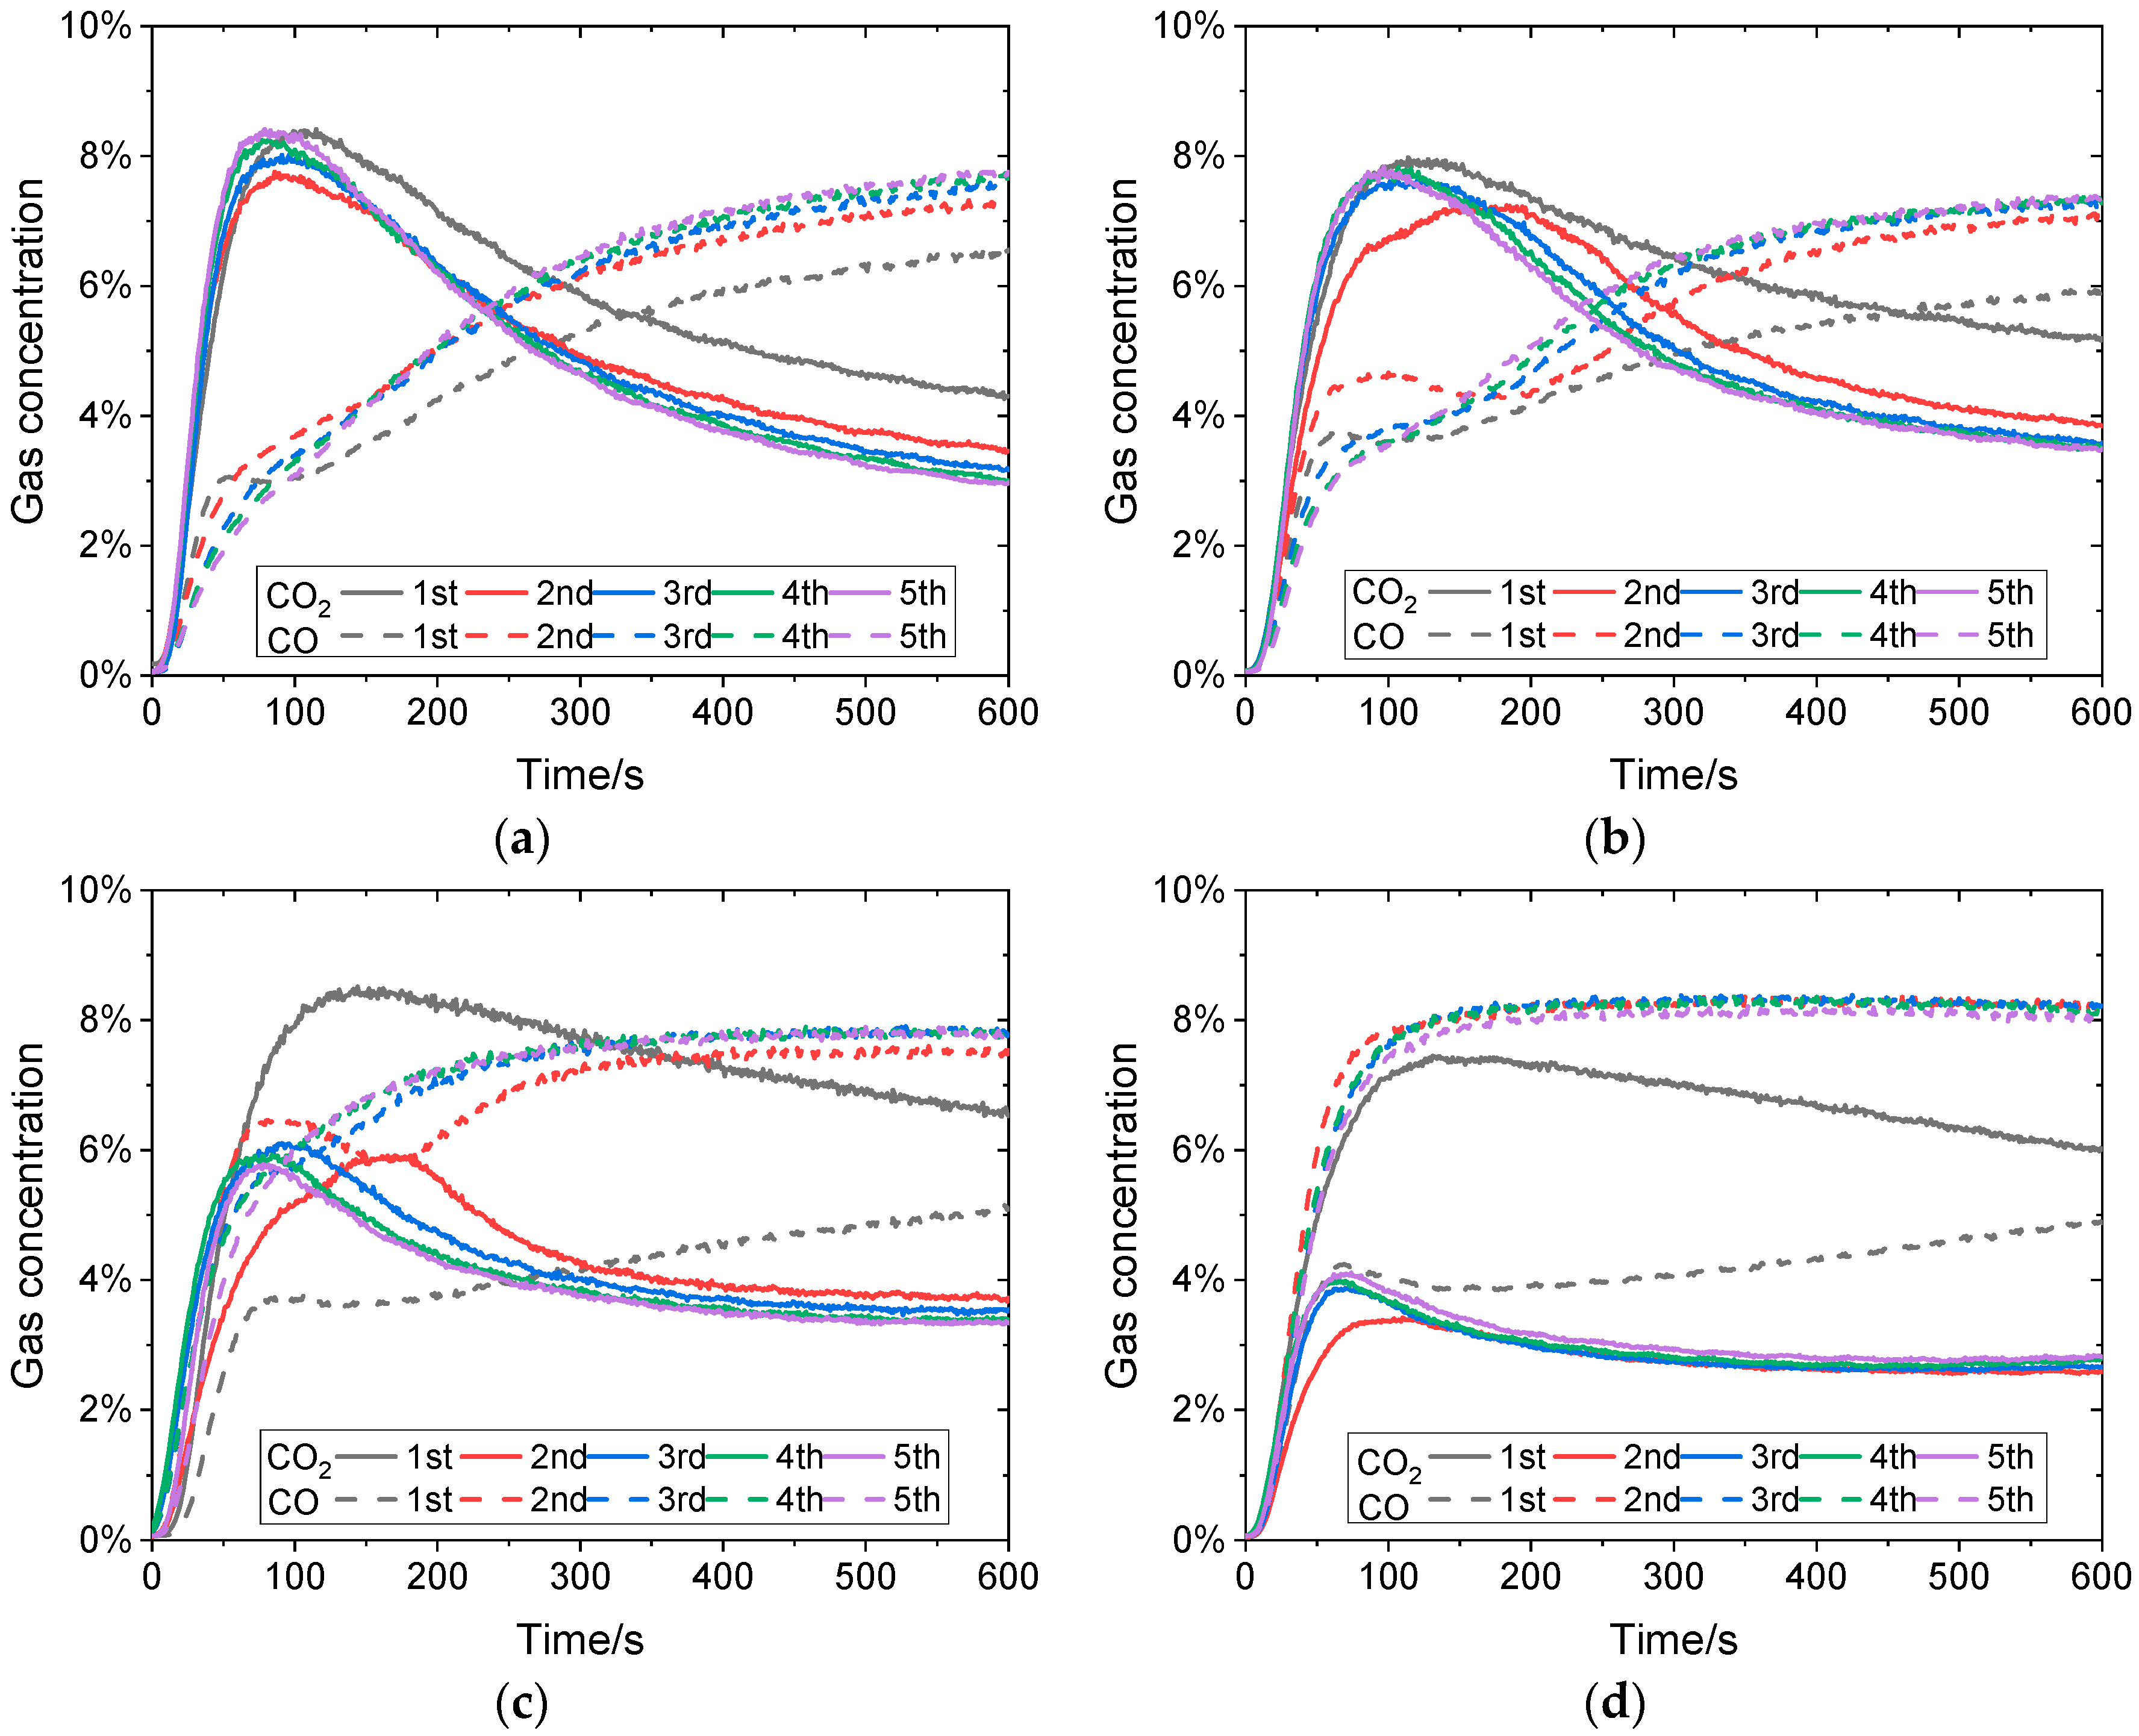
In a common CLC unit, the reaction temperature is a key factor affecting the reactivity of the OC. When the CLC reaction temperature is changed from 750 °C to 900 °C, the inlet CO concentration is kept at 10%. Each redox experiment is conducted for five cycles. The gaseous products during the OC reduction period are shown in Figure 3.
Once the CO is introduced into the reactor, it reacts with the OC, resulting in the production of CO2. However, due to the short residence time of CO, it cannot be totally converted, thus both CO and CO2 are measured at the outlet of the reactor. As illustrated in Figure 3a, the CO2 concentration reaches its maximum of 8.35% in the first cycle at 118 s, then it decreases over time. The peak CO2 concentration in the second cycle is 7.59%, which is lower than that in the first cycle. Additionally, the time to reach it is also slightly earlier. In the subsequent three cycles, the peak CO2 concentration exceeds that of the second cycle, and the time to reach these peaks shortens. The fifth cycle records the highest CO2 concentration, reaching 8.37% at approximately 89 s. When the reduction period ends, the CO2 concentrations in these cycles decrease to 4.31%, 3.46%, 3.17%, 3.01%, and 2.98%, respectively. Notably, the rate of decrease in the first cycle is significantly slower, indicating a higher conversion of CO compared to the subsequent cycles, where the rates are similar. The CO concentrations increase over the reaction time within these cycles. A higher concentration of CO2 in the first cycle suggests greater CO conversion. Its concentration is noticeably lower than that in other cycles.
At 800 °C, the CO2 and CO concentrations exhibit a pattern similar to that at 750 °C. However, there are notable differences: the time required to reach the maximum is longer, and the subsequent decline is more gradual, resulting in a broader peak of CO2 concentration as illustrated in Figure 3b. At the final seconds of the reduction periods, the CO2 concentrations in these cycles decrease to 5.19%, 3.85%, 3.59%, 3.49%, and 3.50%, respectively, which are higher than those at 750 °C. This suggests an increased formation of CO2 while CO is being consumed. Moreover, it is found that the final CO2 concentrations in these cycles become relatively stable with the increase in cycle number.
The gas concentrations at 850 °C markedly differ from those observed previously. In the initial redox cycle, CO2 achieves its maximum of 8.51% at approximately 144 s. Subsequently, it decreases to 6.53% at 600 s with a moderate decline rate. Notably, the CO2 concentration remains elevated throughout the reduction period, demonstrating a high conversion of CO and OC. The CO concentration first increases and then decreases to a low value of 3.58% almost at the same time as the maximum CO2 concentration. As the reaction progresses, the CO concentration experiences a slight uptick. The CO2 concentrations in the following cycles are much lower than those in the first cycle. The maximum values of them are 5.92%, 6.10%, 5.92%, and 5.77%, respectively. With the exception of the second cycle, the durations to reach these peaks are quite short, near 80~90 s. In these cycles, the CO concentration keeps a relatively similar variation trend and level, demonstrating a similar conversion of CO. However, discernible deviations from the first cycle suggest potential sintering of the OC.
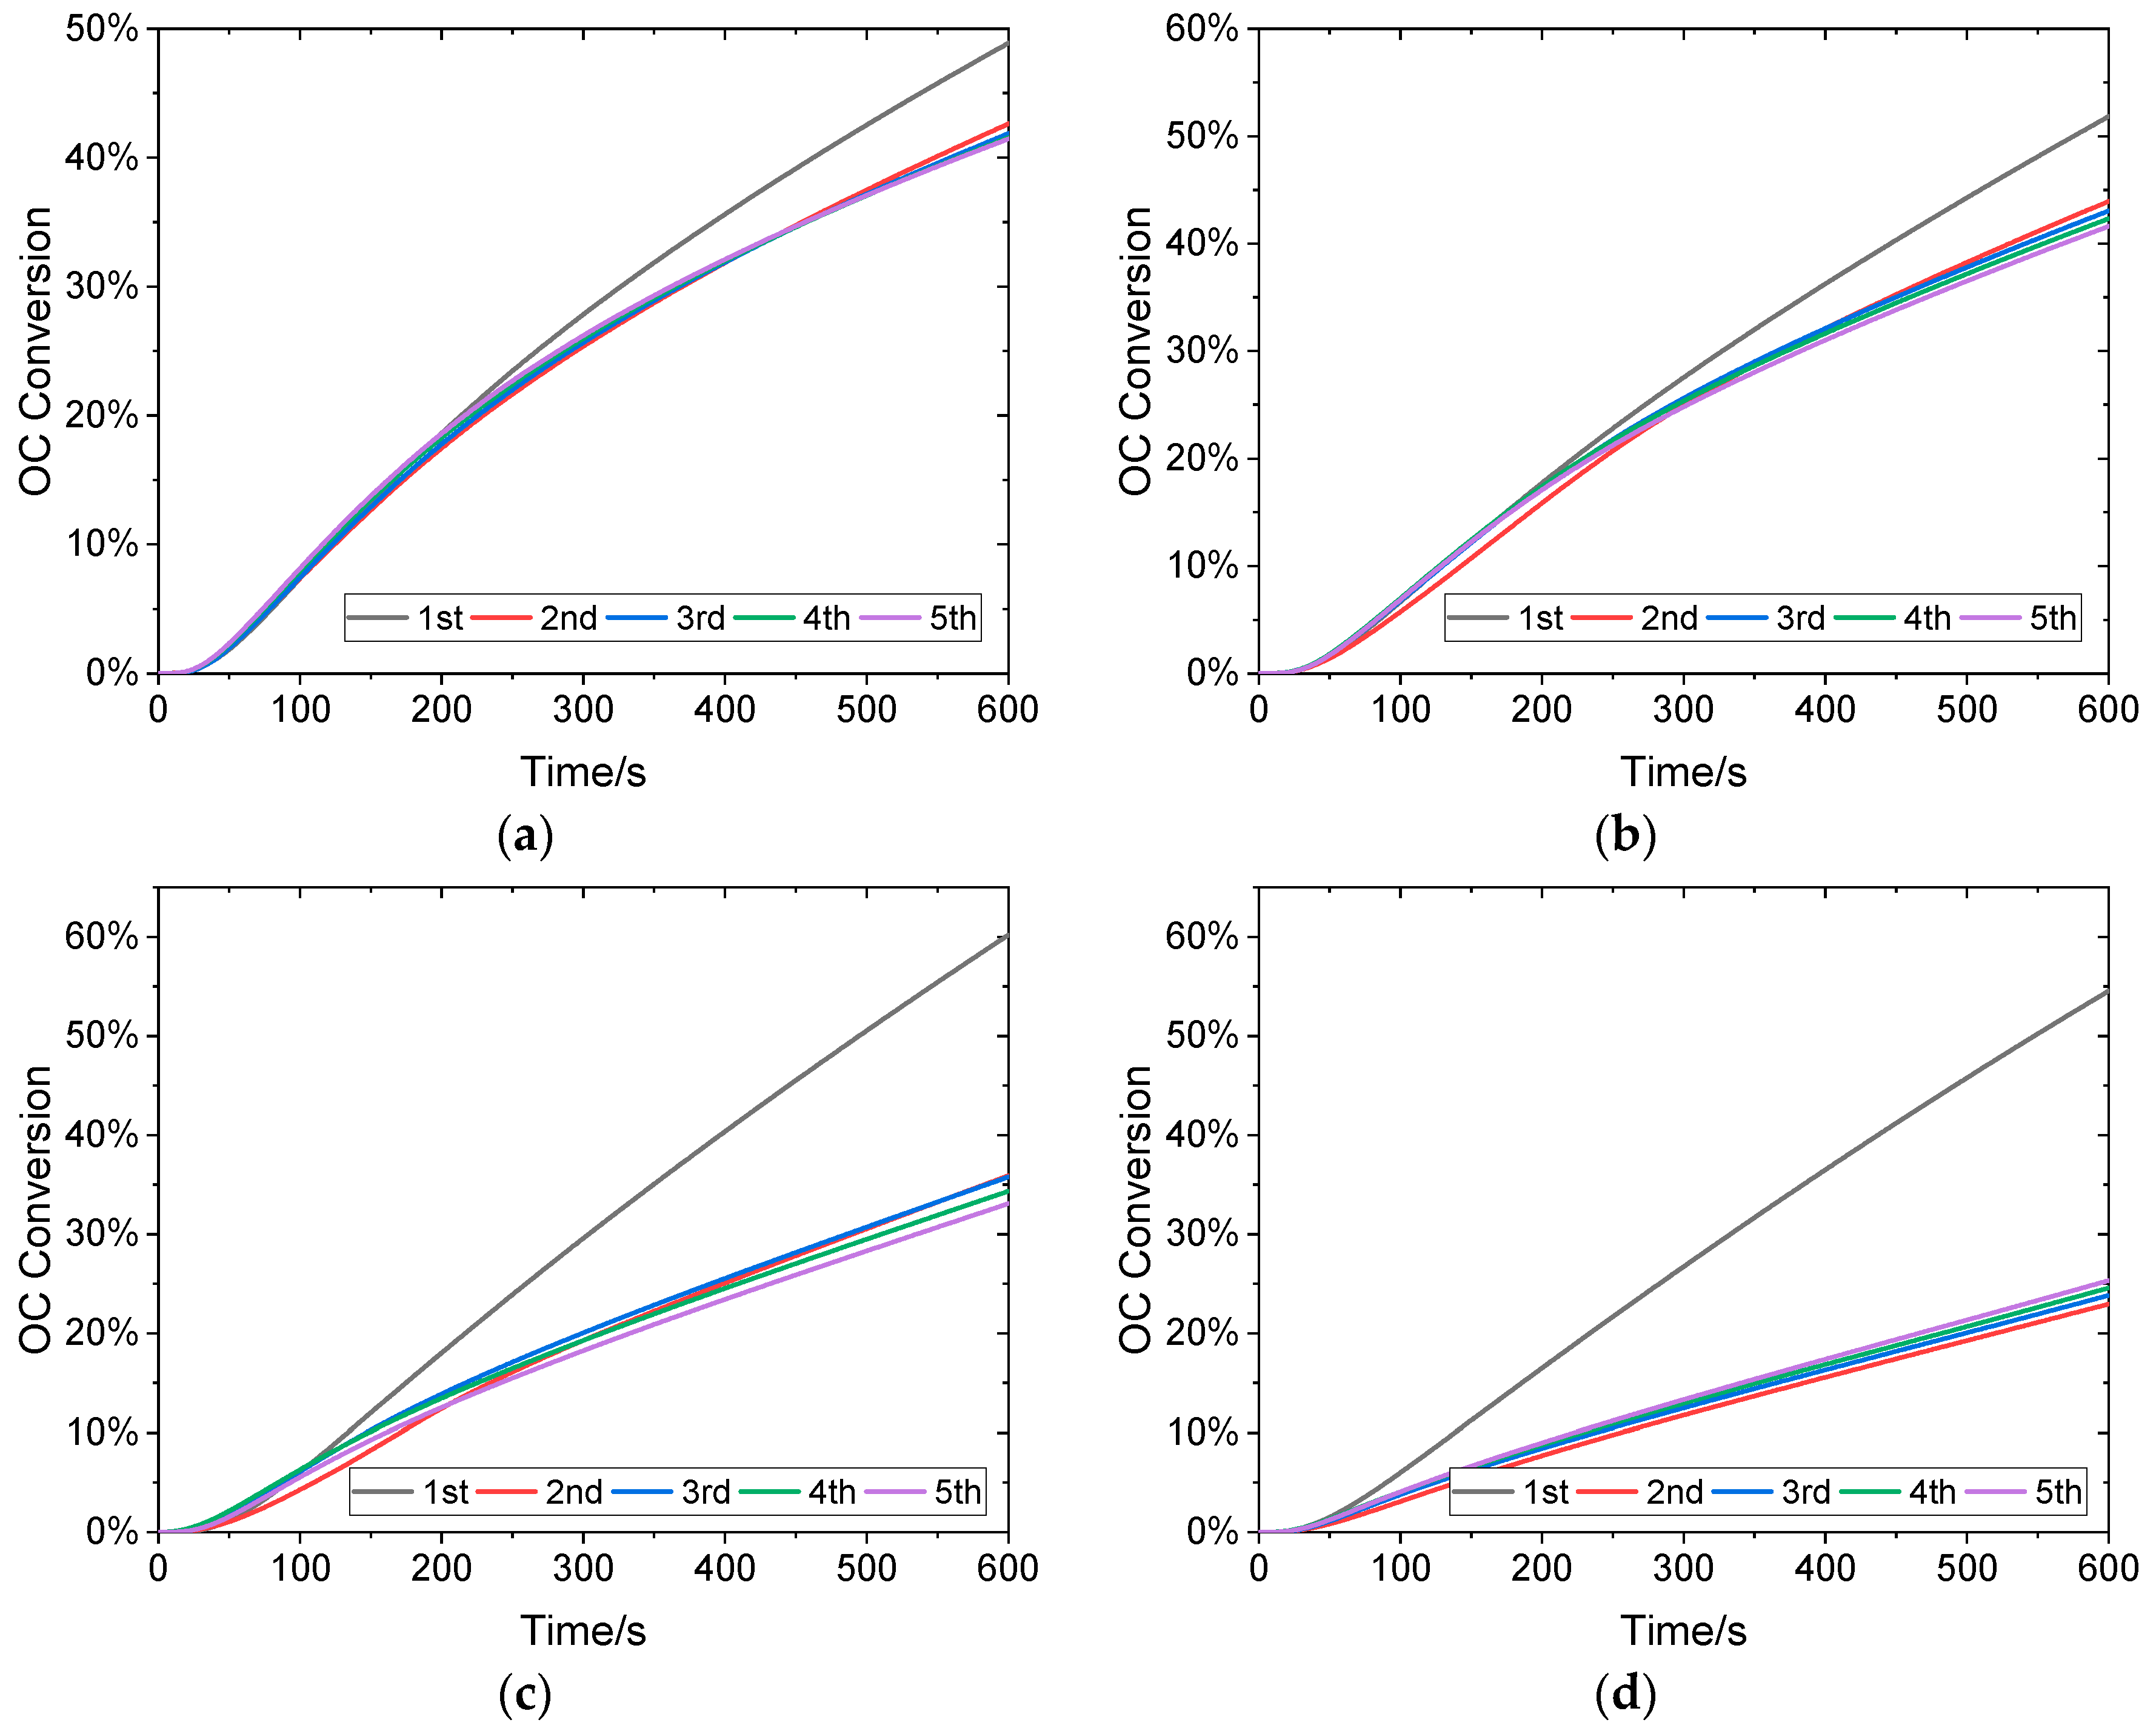
At 900 °C, the CO2 concentration variation is similar to that at 850 °C during the initial cycle. However, its maximum value is lower than that at 850 °C. In the following cycles, the CO2 concentrations remain relatively low, with maximum values of 3.42%, 3.87%, 3.99%, and 4.11%, respectively. On the contrary, the CO concentrations are significantly higher. This phenomenon confirms the previous speculation about the potential sintering of oxygen carriers at elevated temperatures. In these cases, the OC conversion is calculated and shown in Figure 4.
The results indicate that the OC conversion during the first cycle surpasses that of subsequent cycles. The OC conversions in the first cycles reach 48.89%, 51.85%, 60.19%, and 54.55%, respectively, when the temperature increases from 750 to 900 °C. Clearly, a temperature increase is advantageous for OC conversion, bolstering the reduction reaction between the OC and CO. However, due to the potential of high-temperature sintering, the OC conversion decreases at 900 °C. When the Fe-containing phase in OC is totally reduced to Fe3O4 or FeO, the expected OC conversion should be 3.33% or 10%, respectively. However, under these conditions, the observed OC conversions are much higher, suggesting that the Fe-containing phase in the OC has been converted into the Fe phase from FeO.
At 750 °C, the OC conversion maintains a relatively high value, ranging from 41.47% to 42.63% in the following cycles. Although these values are lower than those in the first cycle, they persist within a stable range, demonstrating a consistent reactivity of the OC. When the reaction temperature is 800 °C, the OC conversions in the following cycles are not only higher than those at 750 °C but also approximately 8~10% lower than that of the first cycle. Though the OC conversion at 850 °C in the first cycle is the highest, it decreases to a low level near 35% in the following cycles. A similar trend is observed at a temperature of 900 °C. These findings align with previous results of the gas concentrations, revealing the potential severe deterioration of OC reactivity in CLC. This is due to the deep reduction of the Fe-based OC. Typically, the suitable reduced phase of OC is considered to be Fe3O4. Upon further reduction to a lower valence state, there would be a huge amount of reaction heat generated during the oxidation period, which consequently leads to the sintering of OC.
However, there is an interesting phenomenon that has been observed in the cases at 900 °C. Though the OC has potential to be sintered, the OC conversions from the second to fifth cycles are 22.95%, 23.83%, 24.58%, and 25.33%, respectively, indicating an upward trend—a pattern that is unique to this temperature, as the conversions decrease at other temperatures. That is suggestive of a self-activation behavior of the sintered OC. In typical pilot-scale CLC units, the large OC circulation rate prevents reduction to FeO or Fe phases. However, under certain extreme sintering conditions, a gradual improvement in the reactivity of the OC can be seen. The implications of this phenomenon warrant further investigation.

3.2. Effects of CO Concentration

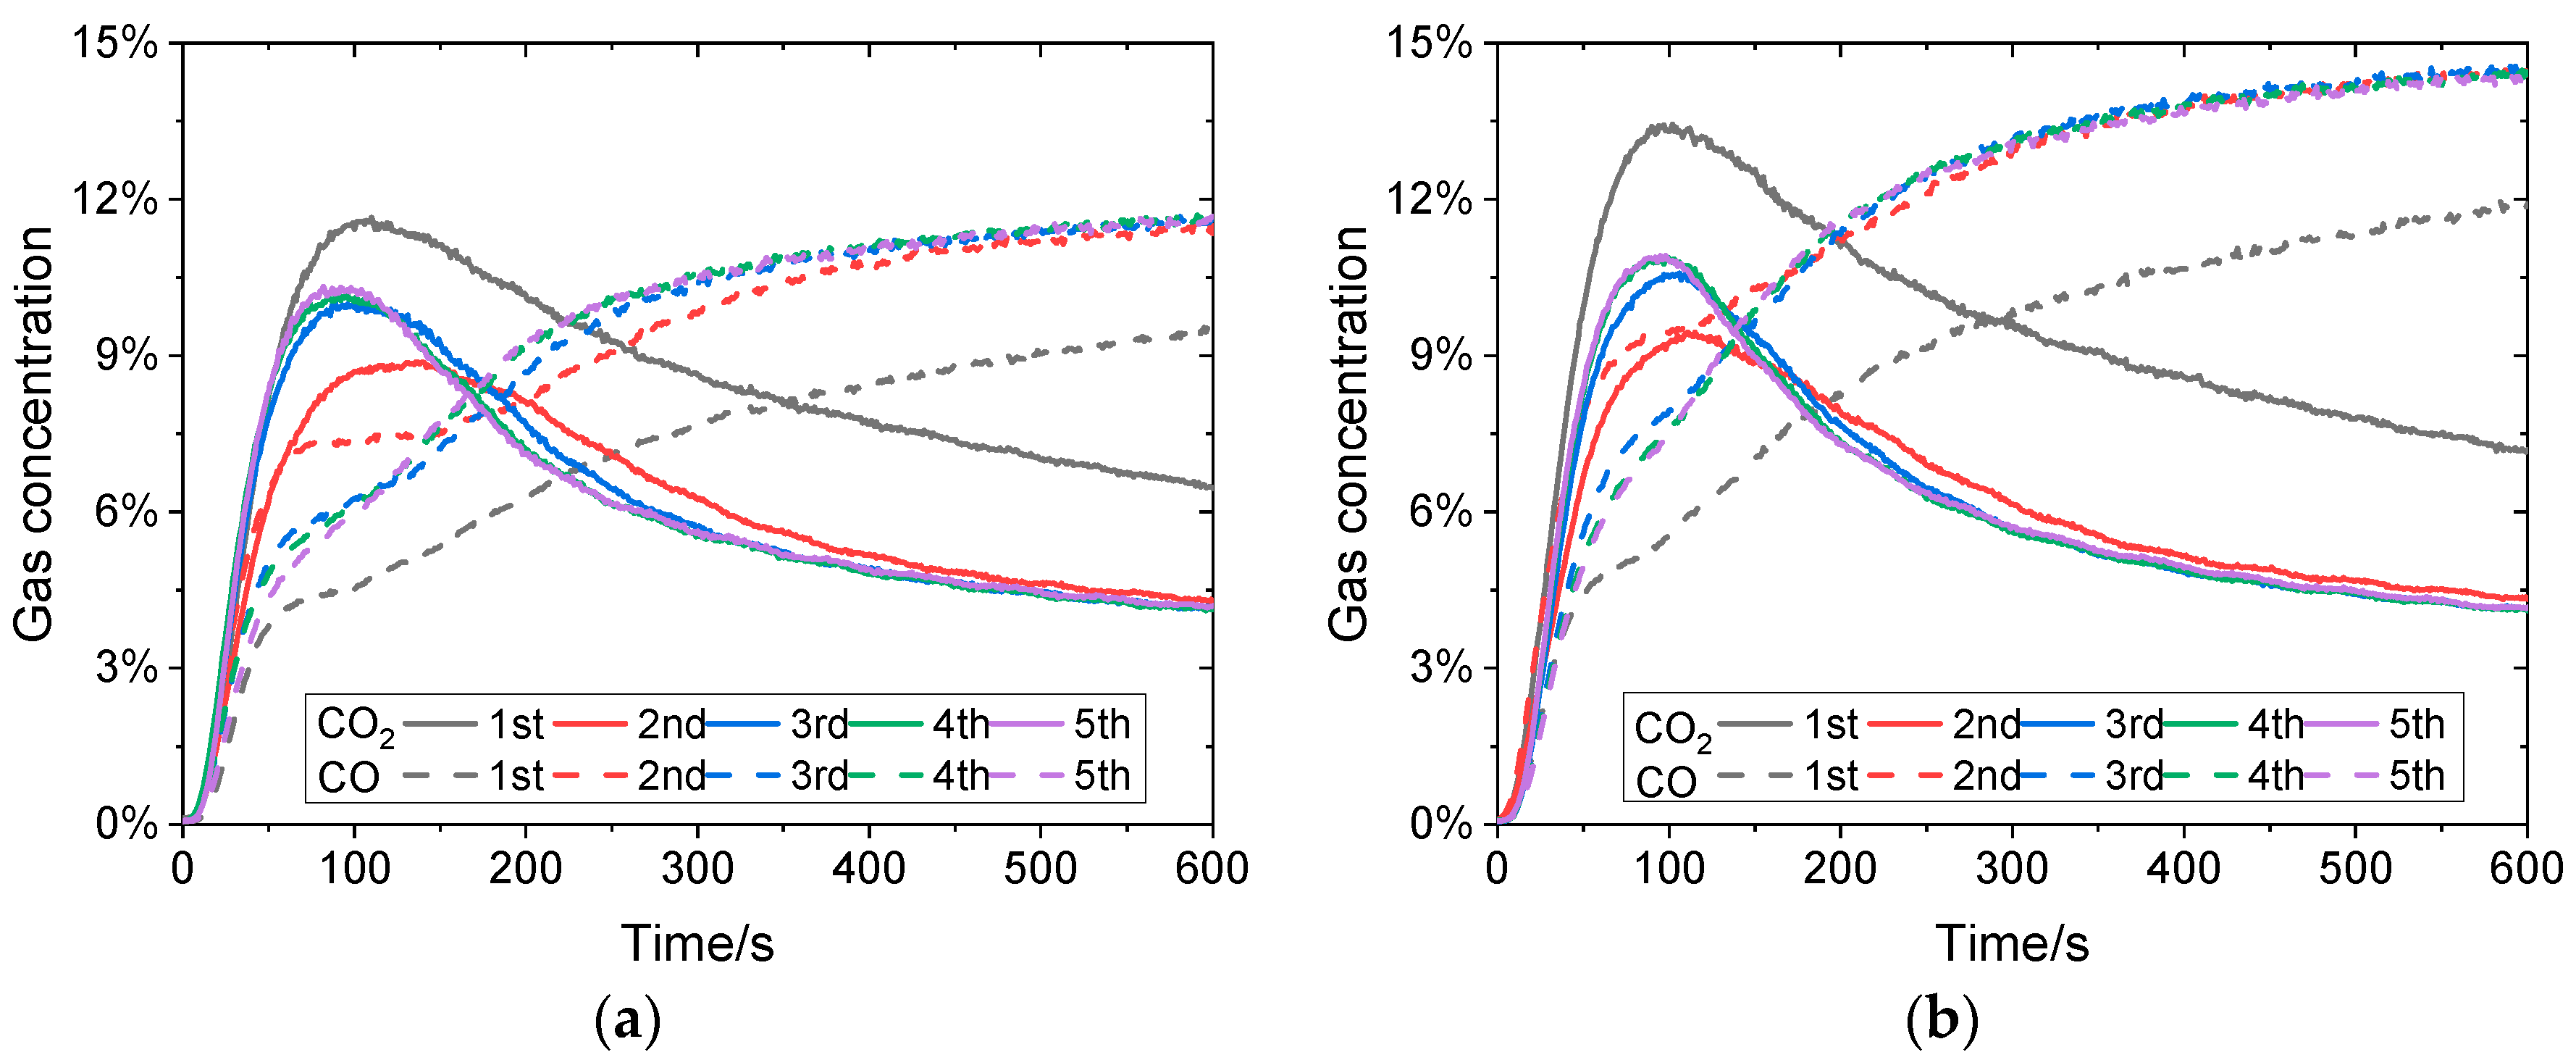
With the reaction temperature maintained at 800 °C, the inlet CO concentration is changed to 10%, 15%, and 20%. The results under the condition of 10% CO concentration have been given in the previous part. Under other conditions, the gas concentrations are shown in Figure 5.
As illustrated in Figure 3b, the peak CO2 concentration in the first redox cycle is approximately 7.98%. There is a noticeable trend of increasing peak CO2 concentrations in subsequent cycles when the inlet CO concentration rises. Consistent with prior observations, the concentration in the first cycle is the highest. With an inlet CO concentration of 15%, the observed CO2 concentration surpasses that with 10% inlet CO in the corresponding cycle. In this instance, the CO2 concentration peaks at 11.66% at 110 s during the first cycle and then decreases to 6.46% at 600 s. This concentration remains higher than those in the following cycles. By the end of these cycles, the CO2 concentration decreased to 4.29%, 4.18%, 4.13%, and 4.20%, respectively. Correspondingly, the CO concentration in the first cycle is the lowest.
When the inlet CO concentration reaches 20%, the peak CO2 concentration across five cycles is 13.44%, 9.45%, 10.58%, 10.89%, and 10.90%, respectively. The CO2 concentration at the final second of the first cycle is 7.20%, which is higher than that in the previous condition. In these cases, the sintering of OC becomes unavoidable due to the high conversion in the first cycle.
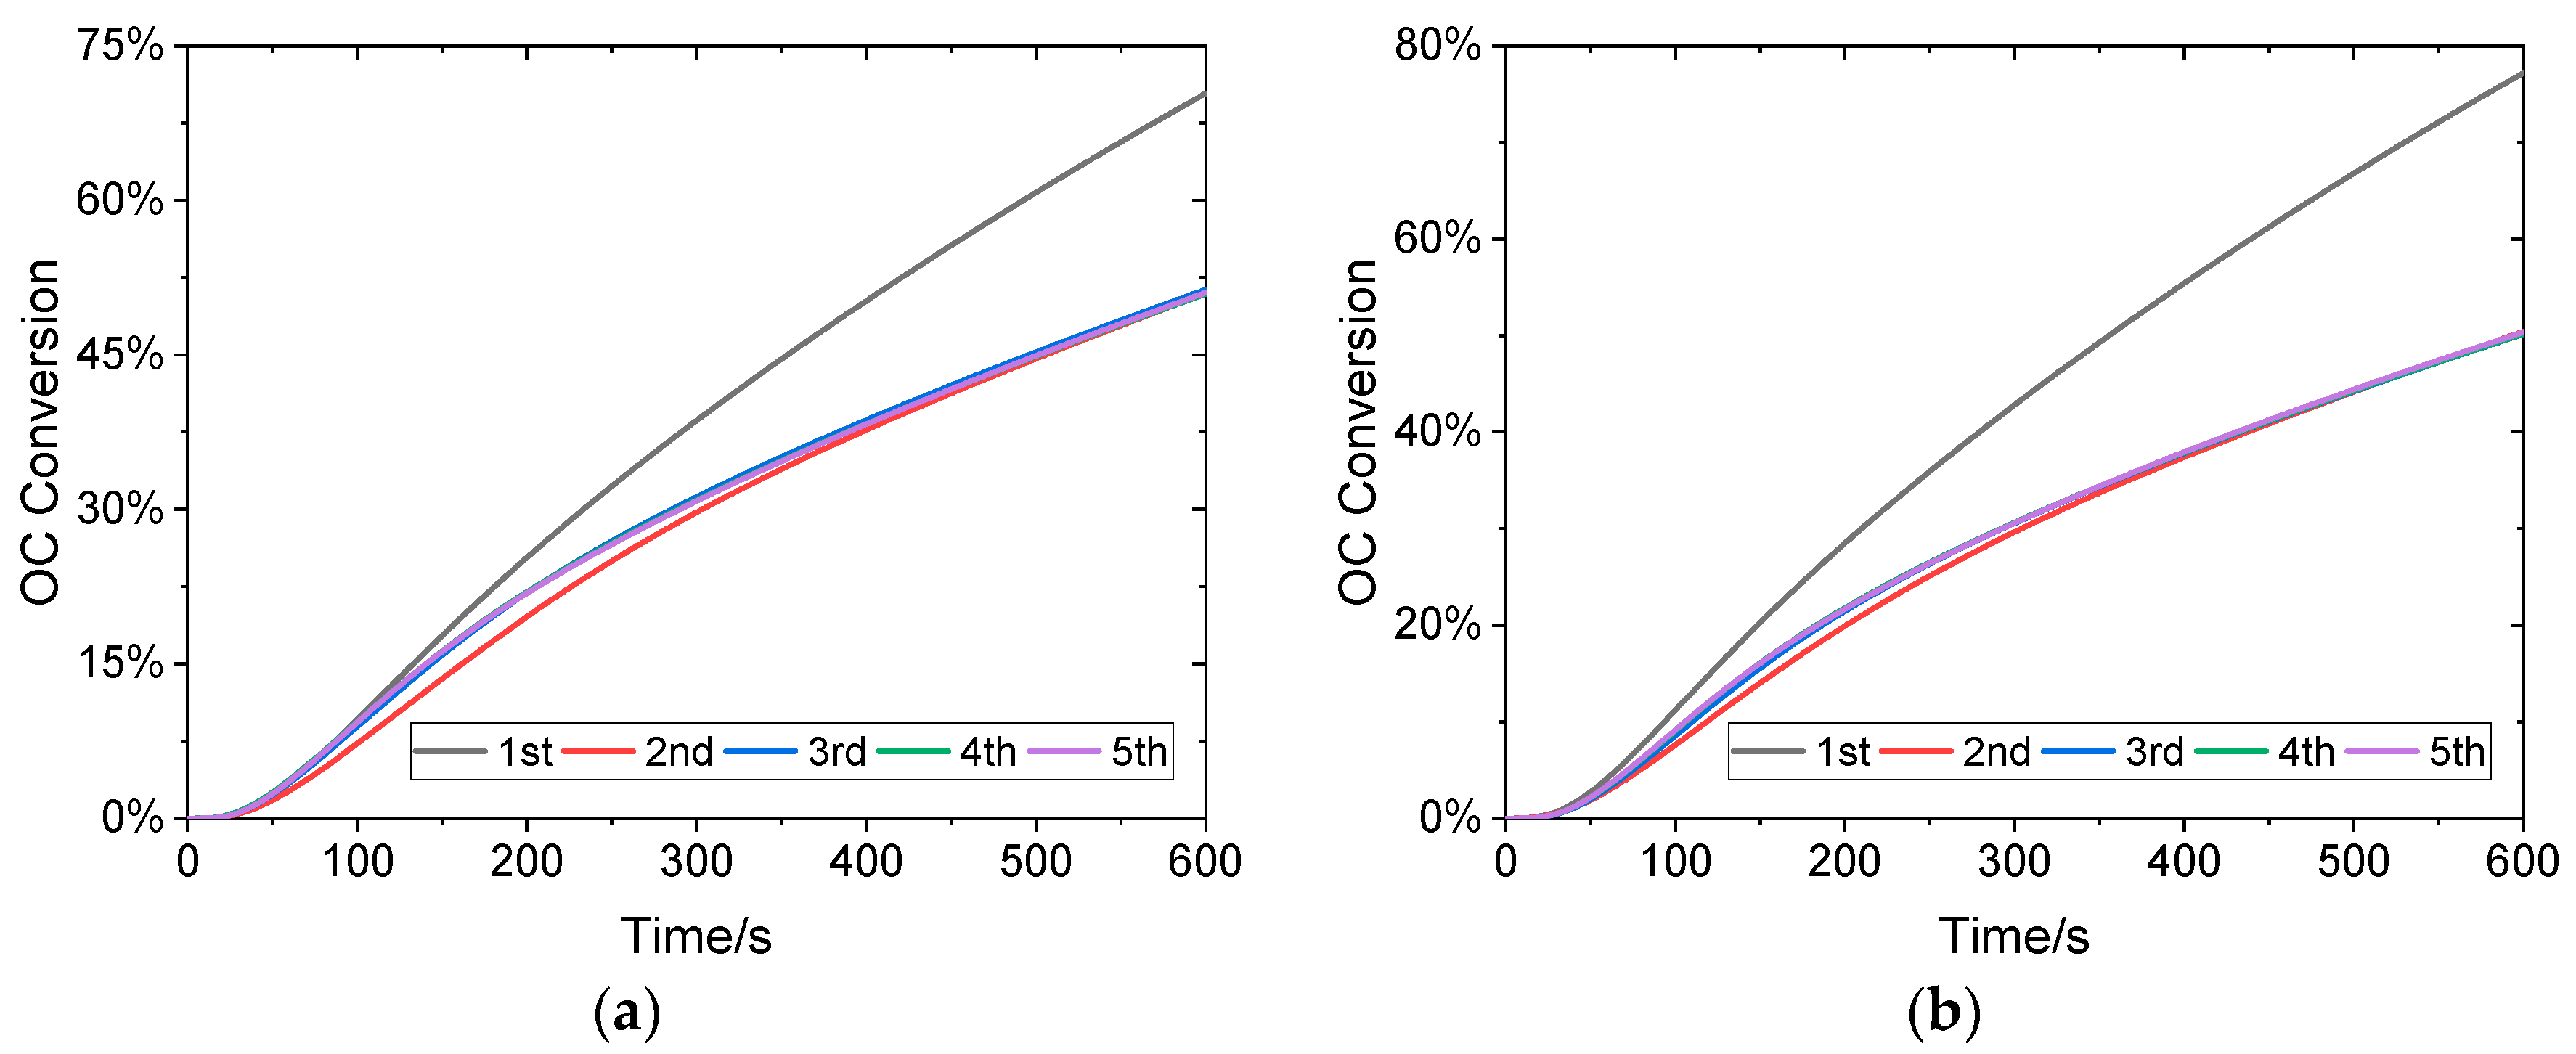
Under these conditions, the OC conversions are shown in Figure 6.
With a 15% inlet CO concentration, the OC conversion in the first cycle achieves 70.39%, significantly surpassing the 51.85% observed with an inlet CO concentration. This suggests that an increased CO concentration positively impacts its conversion, attributed to a higher partial pressure in the atmosphere. In the second cycle, the conversion rate of OC, which is directly proportional to the CO2 concentration, is relatively slow, which leads to a low conversion of 50.95% at the end of the reduction period. From the third to fifth cycles, the OC conversions have similar variation trends, with no obvious difference among them. At approximately the initial 200 s, the conversion rate in these three cycles is higher than that in the second cycle, yielding a higher conversion. However, the conversion rate in these cycles becomes slower, and the OC conversions gradually cope with that in the second cycle. The final OC conversions in these cycles are similar, which are 51.35%, 50.93%, and 51.04%, respectively.
While 20% CO is employed as fuel, the OC conversion in the first cycle peaks at 77.22%, making it the highest performance under the test conditions in this work. This indicates that over half of the Fe-containing phase has been converted to Fe. During the regeneration period, the sintering of the OC would become severe, leading to the deterioration of the OC reactivity. In the following four cycles, the OC conversions reach 50.42%, 50.16%, 50.17%, and 50.36%, respectively, which are slightly lower than those under the condition with 15% CO as fuel.

3.3. Self-Activation of Sintered OC

As previously noted, a potential self-activation process of the sintered OC is noticed in multiple redox cycles. To further verify this capability from the perspective of OC conversion, an experiment under more rigorous conditions is conducted. The reaction temperature is set as 900 °C, and the inlet CO concentration is set as 20%. The CO2 concentrations and the OC conversions in fifteen redox cycles are shown in Figure 7.
The first reduction cycle is substantially different from the rest, having a much higher CO2 concentration (maximum of 13.47% at 119 s) and a broader reaction profile. This suggests a rapid initial reduction step followed by fast kinetics towards completion. This distinct initial behavior is attributed to the activated phase of the fresh OC, potentially involving the initial reduction of surface oxides and structural changes upon its first exposure to the reducing atmosphere. Similar to the previous result, the sintering occurs after the first redox cycle. From the second cycle onwards, the CO2 concentration follows a stable pattern, characterized by significantly lower concentrations and a more defined peak shape. Peak CO2 concentrations for cycles 2–15 were generally in the range from 5.27% to 6.02%. This stabilization signifies the establishment of a consistent reduction mechanism and surface chemistry after the sintering in the first cycle. The consistent peak height and shape across cycles 2 through 15 suggest that the oxygen release capacity and reaction kinetics are relatively constant during this period. Sintering of the OC leads to several detrimental effects. It decreases the active surface area available for gas–solid reactions between CO and OC. In addition, high temperatures cause pore collapse or widening, restricting CO diffusion into the particle interior and reducing access to internal oxygen storage sites.
Similarly, a pronounced distinction in OC conversion is immediately evident between the first reduction cycle and all subsequent cycles. The initial reduction period exhibits markedly higher reaction rates and achieves substantially greater conversion at any given time point compared to later cycles. For instance, at 600 s, OC conversion reached 89.30% in the first cycle. In stark contrast, the second cycle achieves only 32.07% conversion. The conversion trajectories for cycles 2, 3, 4, 5, 7, 9, 11, 13, and 15 largely overlap or show only marginal improvements in later cycles compared to cycle 2, but with minor variations. It is seen that the final OC conversion gradually increased from 32.07% in the second cycle to 37.33% in the fifteenth cycle. The consistency in the conversion from the second to fifteenth cycles suggests that the most severe sintering occurs during the initial cycle, after which the particle morphology stabilizes, albeit in a state with inherently lower reactivity than the fresh material. The very minor, gradual increase in conversion observed in later cycles could potentially indicate limited crack formation or surface restructuring over extended cycling, slightly mitigating the effects of sintering. This agrees with the previous hypothesis about the self-activation ability of sintered OC, although it does not reverse the dominant effect of potential sintering. The high content of inert SiO2 and Al2O3 (see Table 2) likely acts as a natural support matrix, providing mechanical integrity and potentially limiting the extent of sintering, which may contribute to this observed self-activation ability. The long-term cycling (50–100 cycles) under non-destructive conditions and mechanical attrition testing is the gold standard for applied OC development. Future work will focus on it to verify the long-term behavior of OC under moderate conditions.
It is noteworthy that the present study primarily focuses on the macroscopic redox performance and reaction kinetics of the iron ore OC. The primary aim was to evaluate the feasibility and bulk reactivity of this low-cost, natural ore under CLC conditions. The conclusions regarding sintering and self-activation are therefore inferred from the consistent and reproducible trends observed in the gas conversion and OC conversion data presented in Section 3.1, Section 3.2 and Section 3.3. This study focuses on CO as a representative fuel to probe the intrinsic reduction kinetics and stability of the ore; its performance with other fuels such as H2 and CH4 is a critical subject for future research.

4. Kinetic Analysis

Kinetic parameters are important for the OC performance evaluation. There are different methods to determine the reaction kinetics, such as isoconversional analysis, model fitting method, and so on. Isoconversional analysis is a powerful tool for revealing multi-mechanism processes. Isoconversional and model-fitting methods are complementary. The former is excellent for estimating activation energy without model assumptions, especially for complex processes, while the latter is valuable for directly testing specific mechanistic hypotheses. The primary goal of our kinetic analysis was to identify the most probable reaction mechanism that describes the reduction process of this specific ore. Also, the apparent activation energy was obtained to compare with the literature. Therefore, the kinetic parameters of this OC in CLC are calculated based on the model fitting method, which is widely used in this field.

4.1. Model Fitting Method

In the gas–solid reaction of OC reduction, the conversion is always related to the reaction temperature. As demonstrated earlier, the sintering occurs in the first redox cycle when the temperature exceeds 850 °C and 10% CO is used as the reduction gas. Therefore, the results in the first cycles at temperatures from 750 °C to 850 °C are employed to determine the kinetic parameters. Typically, the conversion rate can be expressed as a function of temperature and OC conversion during the reduction period, as described below:
d X d t = k ( T ) f ( X ) ,
where f(X) is the model function during the reduction period; k(T) is the Arrhenius rate constant, which is given as:
k ( T ) = A exp E R T ,
where A and E are two kinetic parameters, namely the pre-exponential factor and apparent activation energy; R denotes the gas constant.
The integral of the model function f(X) is g(X). While the reaction is conducted isothermally, the g(X) is expressed as:
g ( X ) = 0 X d X f ( X ) = k ( T ) t ,
The common kinetic models are given in Table 3.
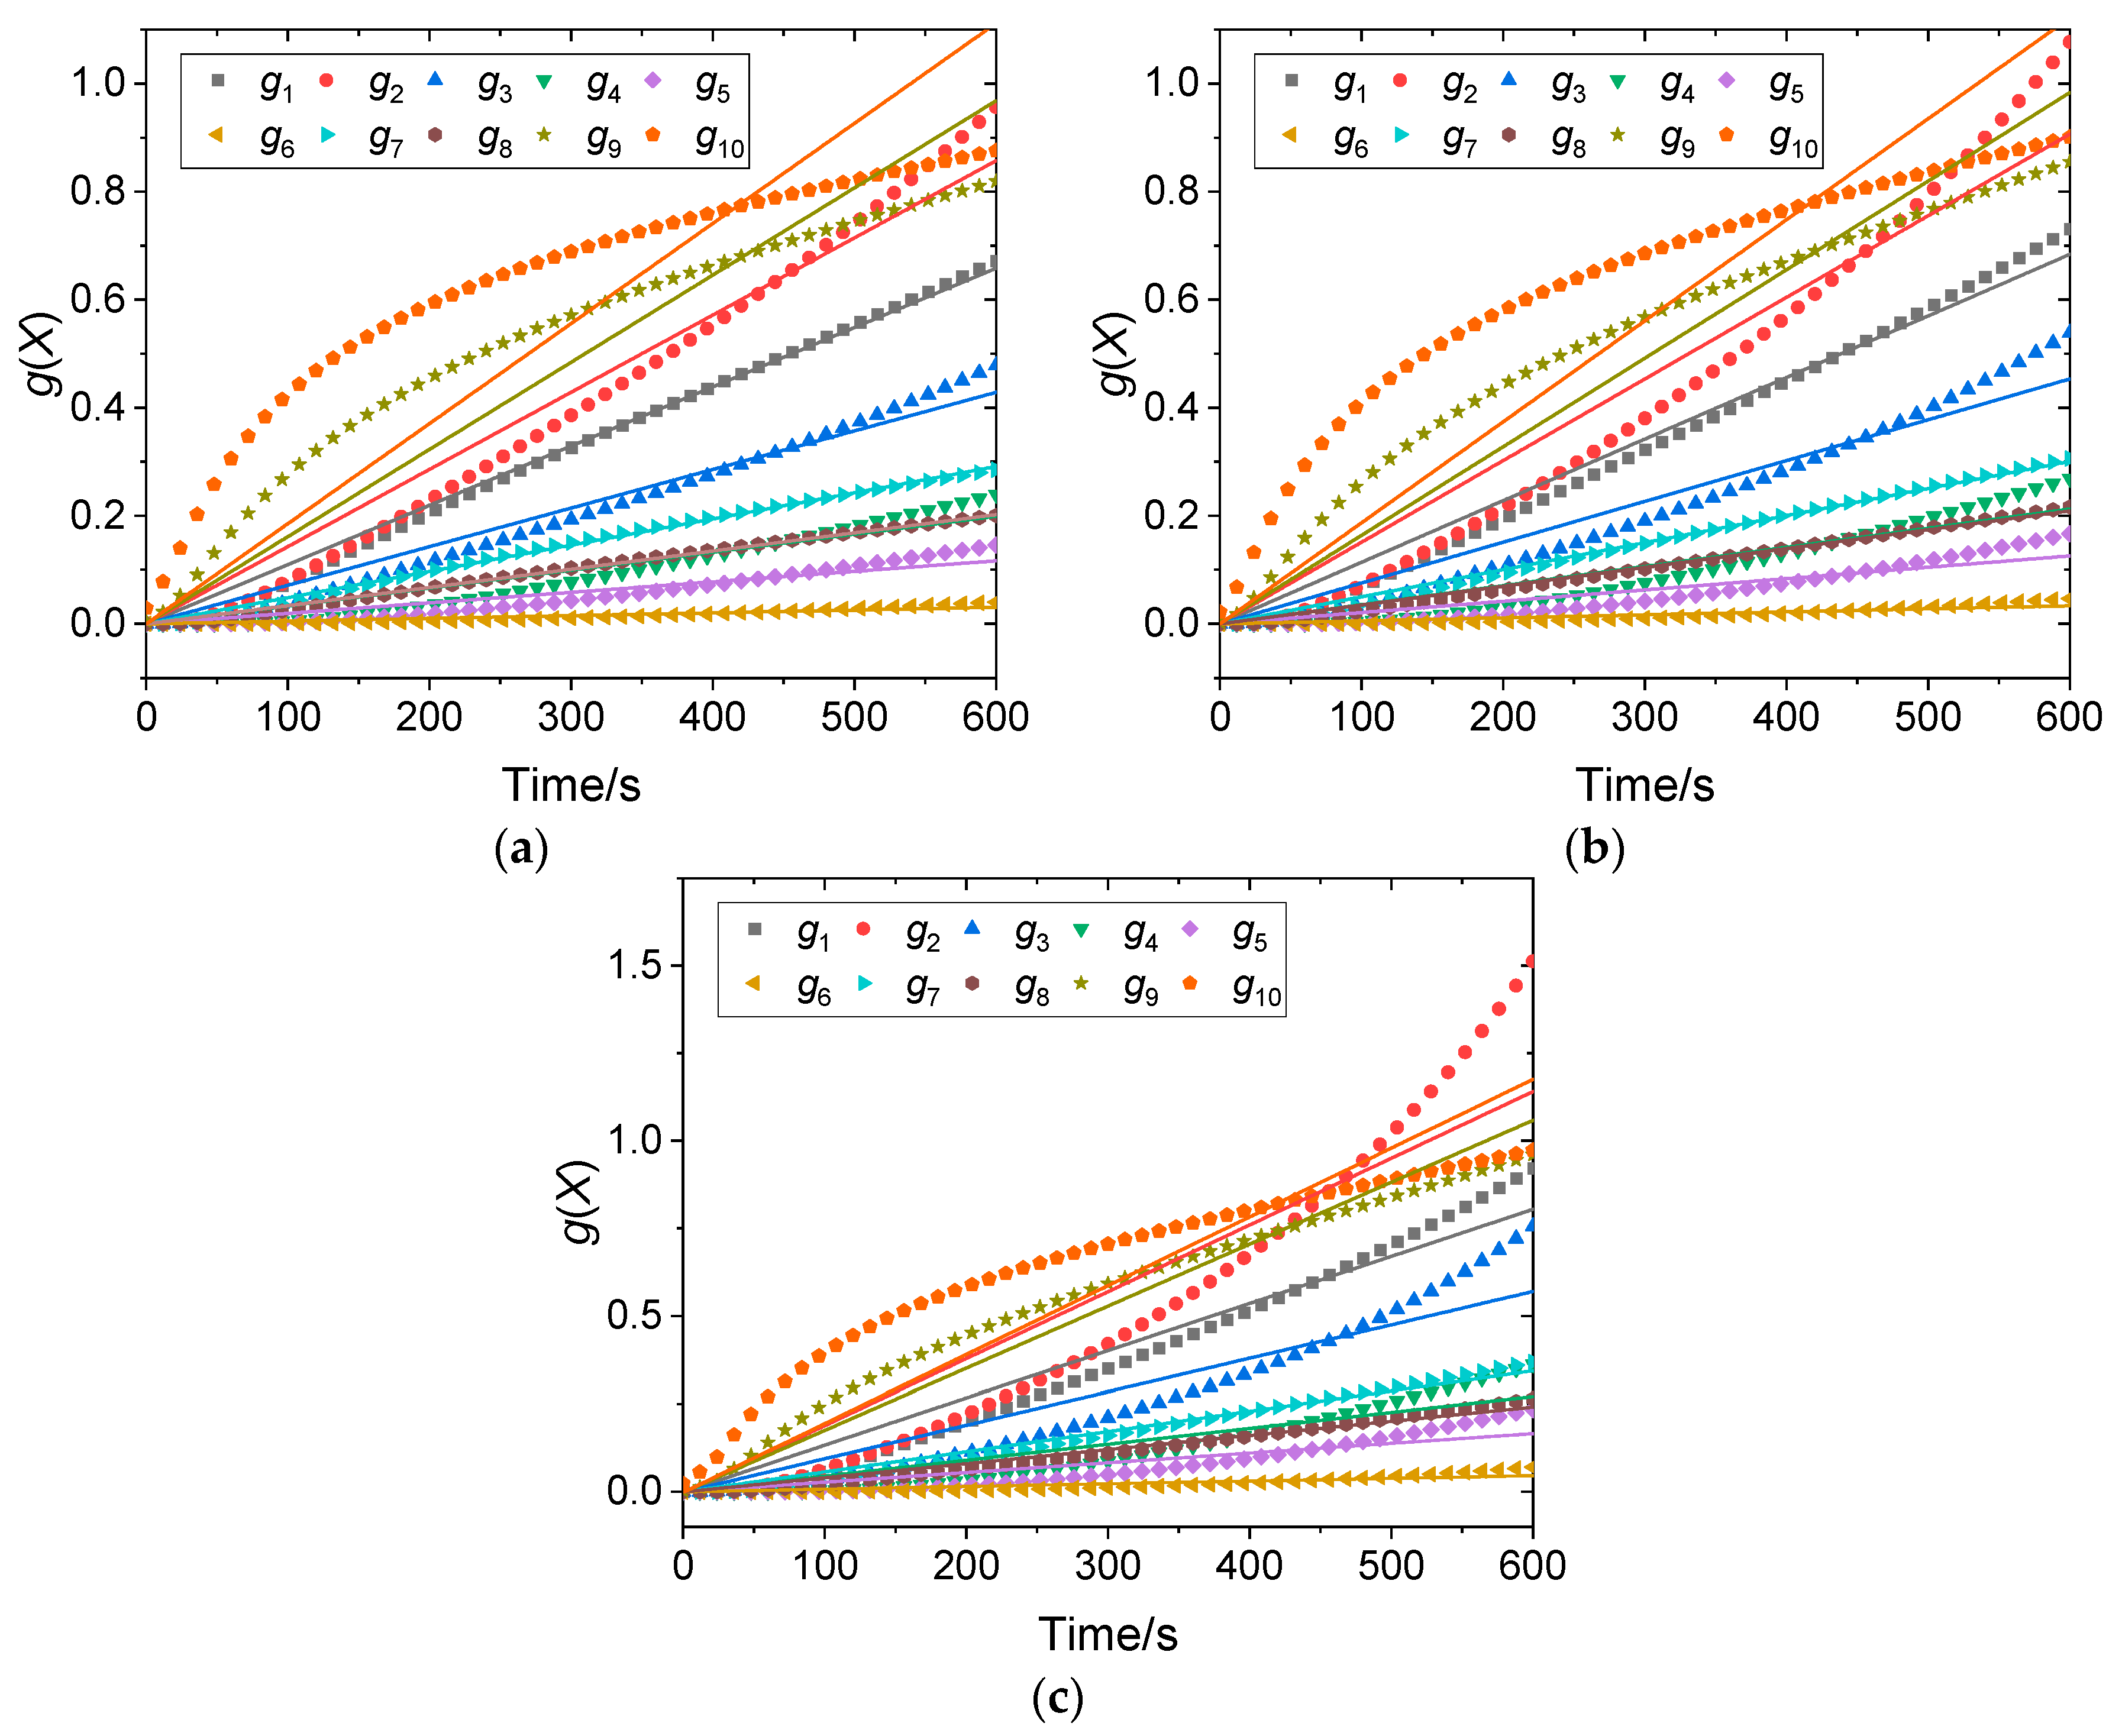
There are two different methods for fitting the models using these functions. While f(X) is employed, it necessitates the calculation of dX/dt, which is highly sensitive to the noises and fluctuations. To avoid these effects, this work employs the integral function g(X) to fit the conversion. It is seen from Equation (8) that when the model is suitable to describe the reduction of OC, the g(X) should exhibit a linear relationship with reaction time.
When the functions in Table 3 are used, the conversion variation against time is used to obtain the g(X). Then the g(X) is fitted using a linear function via the linear least squares method. The data samples for g(X) and the linear fitting results are shown in Figure 8.
It is seen that certain kinetic models exhibit an approximate linear relationship with reaction time. This suggests that these models are suitable for describing the gas–solid reaction. For choosing the reliable models, the coefficient of determination R2 for each fitting result is given in Table 4.
From these quantitative results, the g1, g7, and g8 are regarded as possible kinetic models for the reduction of this iron ore OC due to a high R2 over 95% at different temperatures.

4.2. Determination of Kinetic Parameters

Once the kinetic models have been determined, their kinetic parameters can be derived from the fitting results. The slope of the fitted line is directly related to the k(T) as illustrated in Equation (8). By taking the logarithm of Equation (7), it can be obtained as follows:
ln k ( T ) = ln A E R 1 T
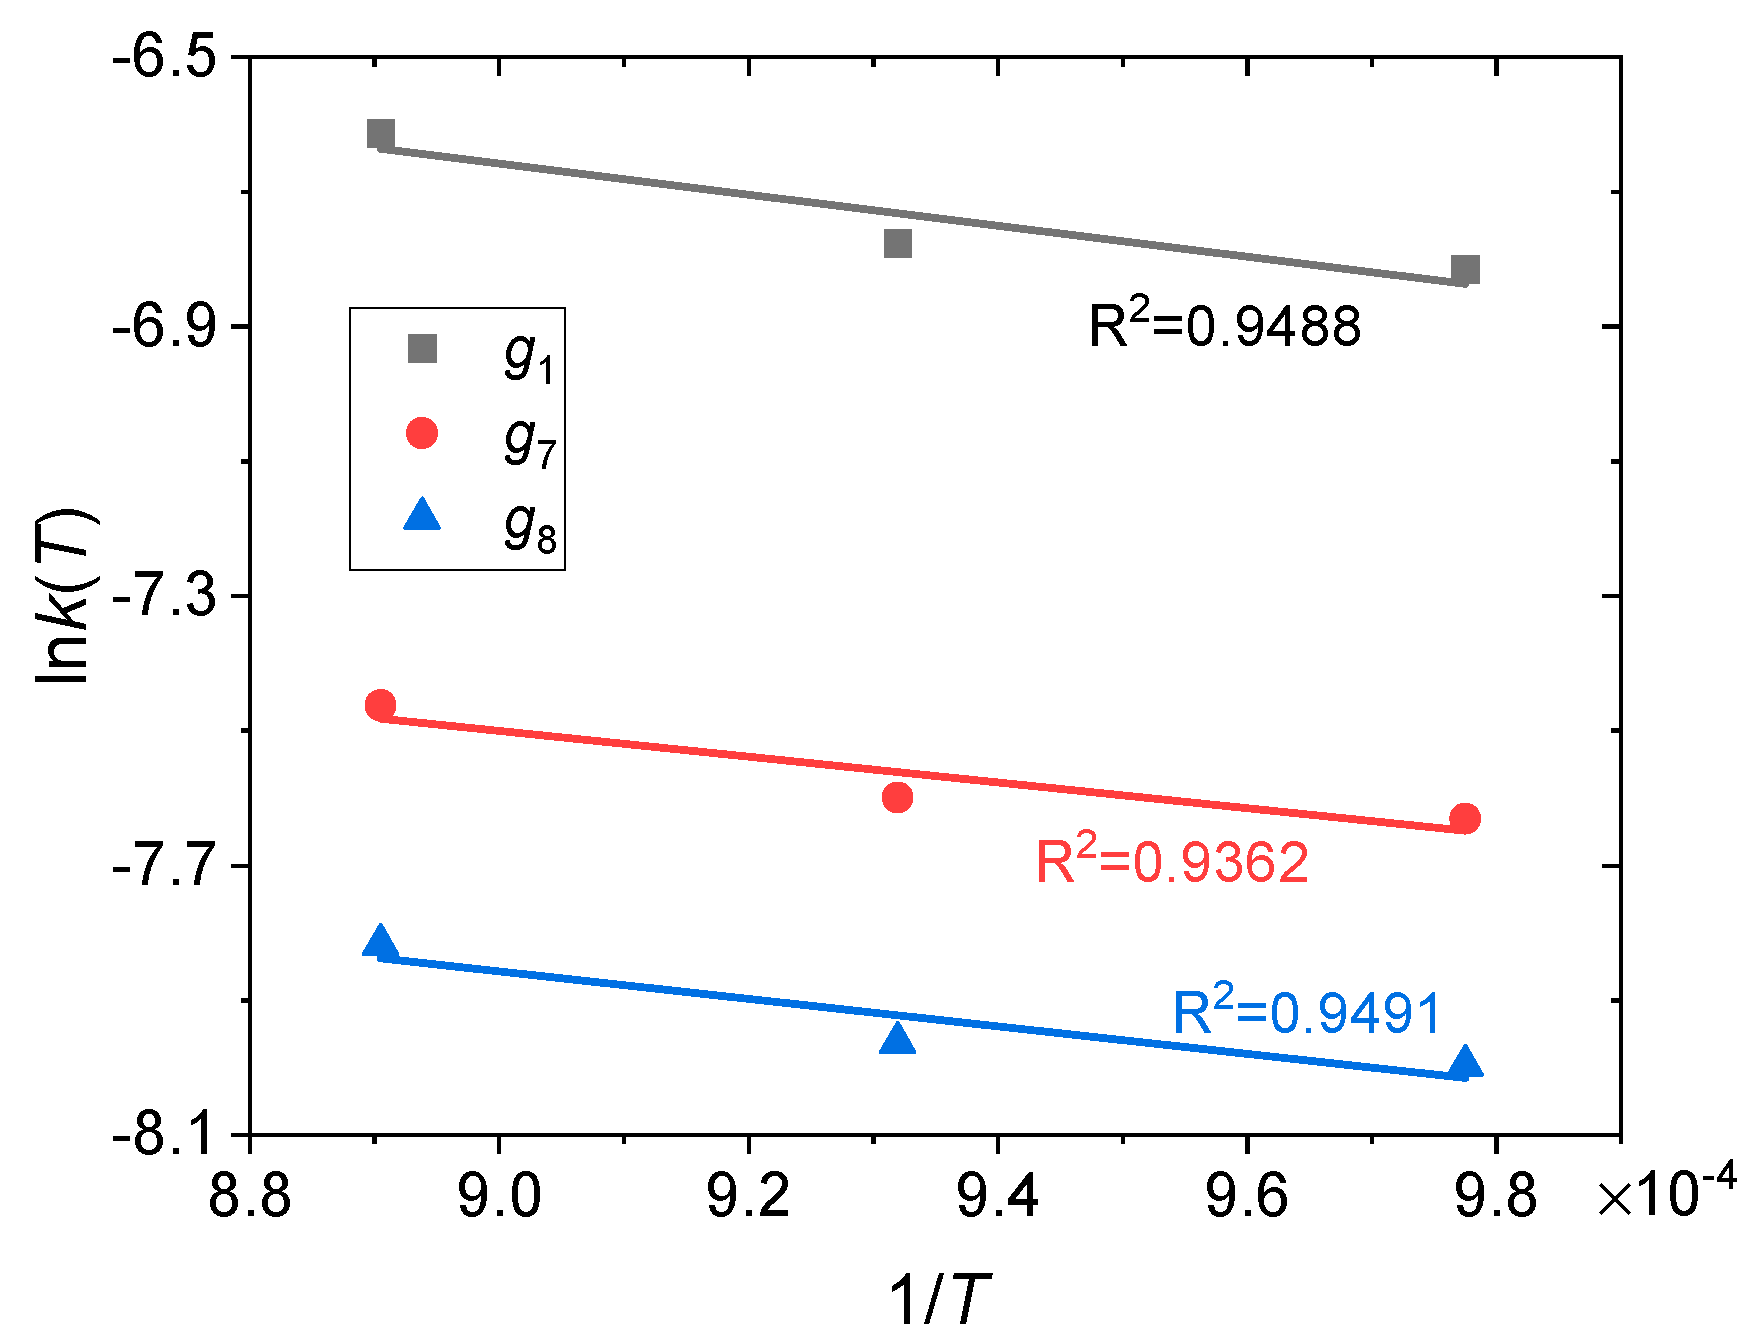
Using the fitting results in Figure 8, both k(T) and T are known. By substituting these values into Equation (9), a linear relationship between k(T) and T can be obtained. The slope and intercept of this relationship can be employed to calculate the pre-exponential factor and apparent activation energy. Given three possible kinetic models, the relationship between lnk(T) and 1/T is shown in Figure 9.
According to the relationship illustrated in Figure 9, the apparent activation energies of the OC reduction in these models can be obtained as listed in Table 5.
As shown in Table 5, the apparent activation energy of this OC for CLC varies in the range from 15.93 kJ mol−1 to 19.13 kJ mol−1, which is much lower than previous results as listed in Table 1. This OC is suitable for CLC; however, in the practical CLC system, a large equivalence ratio of OC to the fuel is needed to avoid a deep reduction of the OC, which causes the sintering of OC. The low apparent activation energies determined for the reduction reaction, coupled with the best fit to the contracting volume model and purely surface–chemical controlled model, provide insight into the likely reaction mechanism. The values obtained here are remarkably low, suggesting the chemical reaction at the interface is very facile. The fit to the models g7 and g8 indicates that the overall reaction rate is significantly influenced by the diffusion of oxygen ions through the product layer (FeO/Fe) or the inward movement of the reaction interface. The large particle size used in this study (20–40 mesh) further promotes such diffusional limitations.

5. Conclusions

In contrast to the high-Fe2O3 ores prevalent in the literature, this study demonstrates that an iron ore with a lower active content, but high inert support, can exhibit favorable reactivity and a unique self-activation phenomenon post-sintering. The redox performance of a natural iron ore used as OC in CLC was evaluated under different temperatures and CO concentrations. The reaction kinetics were analyzed based on a model-fitting method. From the results, key conclusions are obtained as follows:
(1)
Increasing the reaction temperature from 750 °C to 850 °C enhances the initial OC conversion, whereas operating at 900 °C instigates swift potential sintering, as indicated by a pronounced drop in CO2 yield.
(2)
High CO concentration not only expedites the initial conversion but also intensifies sintering. This reaffirms the imperative for meticulous control over reduction depth.
(3)
A notable self-activation effect was noted in sintered OC during prolonged cycling at 900 °C with 20% CO, which led to a gradual increase in conversion from 32.07% to 37.33% over 15 cycles.
(4)
Kinetic modeling confirms that the reduction of this OC adheres to a contracting volume model or first-order kinetic mechanism, characterized by an apparent activation energy of 15.93–19.13 kJ mol−1.
This work provides a fundamental evaluation of a natural iron ore’s performance under CO reduction, underscoring its potential as an economical OC for processes utilizing syngas or similar CO-rich fuels. To leverage these benefits in pilot-scale or full-scale CLC units, it is crucial to maintain a high solids inventory and a moderate oxygen-to-fuel ratio. This approach limits the OC reduction to Fe3O4/FeO, thereby preventing activity loss due to sintering. However, its performance with other fuels like CH4 and H2, crucial for broader industrial applications, remains to be investigated in future work.

Author Contributions

Conceptualization, C.T. and X.W.; methodology, Q.L. (Qingmei Li) and Q.L. (Qian Liang); software, Q.L. (Qian Liang); validation, Q.L. (Qingmei Li), M.H. and X.S.; formal analysis, Q.L. (Qian Liang) and M.H.; investigation, C.T., M.W. and X.W.; resources, C.T. and H.W.; data curation, M.W. and H.W.; writing—original draft preparation, C.T. and X.W.; writing—review and editing, Q.L. (Qian Liang); supervision, Q.L. (Qian Liang) and X.W.; funding acquisition, X.W. All authors have read and agreed to the published version of the manuscript.

Funding

This research was funded by the National Natural Science Foundation of China (52406141), the Natural Science Foundation of Jiangsu Province (BK20240547), and the Natural Science Foundation of the Jiangsu Higher Education Institutions of China (23KJB470016).

Data Availability Statement

The original contributions presented in this study are included in the article. Further inquiries can be directed to the corresponding author.

Conflicts of Interest

Authors Congxi Tao, Qian Liang, Qingmei Li, Minghai He, Xuhui Shen, Hao Wang, Ming Wang were employed by the company China Resources Building Materials Technology Holdings Co., Ltd. The remaining author declare that the research was conducted in the absence of any commercial or financial relationships that could be construed as a potential conflict of interest. The company had no role in the design of the study; in the collection, analyses, or interpretation of data; in the writing of the manuscript, or in the decision to publish the results.

References

  1. Seneviratne, S.I.; Rogelj, J.; Séférian, R.; Wartenburger, R.; Allen, M.R.; Cain, M.; Millar, R.J.; Ebi, K.L.; Ellis, N.; Hoegh-Guldberg, O.; et al. The many possible climates from the Paris Agreement’s aim of 1.5 °C warming. Nature 2018, 558, 41–49. [Google Scholar] [CrossRef] [PubMed]
  2. Boon, J. Sorption-enhanced reactions as enablers for CO2 capture and utilisation. Curr. Opin. Chem. Eng. 2023, 40, 100919. [Google Scholar] [CrossRef]
  3. Chen, L.; Msigwa, G.; Yang, M.; Osman, A.I.; Fawzy, S.; Rooney, D.W.; Yap, P.S. Strategies to achieve a carbon neutral society: A review. Environ. Chem. Lett. 2022, 20, 2277–2310. [Google Scholar] [CrossRef]
  4. Matthews, H.D.; Wynes, S. Current global efforts are insufficient to limit warming to 1.5 °C. Science 2022, 376, 1404–1409. [Google Scholar] [CrossRef]
  5. Tollefson, J. Earth breaches 1.5 °C climate limit for the first time: What does it mean? Nature 2025, 637, 769–770. [Google Scholar] [CrossRef]
  6. International Energy Agency. Global Energy Review 2025. Available online: www.iea.org/reports/global-energy-review-2025/co2-emissions (accessed on 8 August 2025).
  7. Hong, F.; Qi, Y.; Yang, Z.; Yu, L.; Guang, X.; Diao, J.; Sun, B.; Liu, H. Recent advances of CO2 hydrogenation to methanol. DeCarbon 2025, 8, 100111. [Google Scholar] [CrossRef]
  8. Wang, F.; Guan, D.; Wu, C.; Zhang, X.; Wang, G. Numerical study on induction heating enhanced methanol steam reforming for hydrogen production. DeCarbon 2024, 6, 100075. [Google Scholar] [CrossRef]
  9. Dou, B.; Song, Y.; Liu, Y.; Feng, C. High temperature CO2 capture using calcium oxide sorbent in a fixed-bed reactor. J. Hazard. Mater. 2010, 183, 759–765. [Google Scholar] [CrossRef]
  10. Dubey, A.; Arora, A. Advancements in carbon capture technologies: A review. J. Clean. Prod. 2022, 373, 133932. [Google Scholar] [CrossRef]
  11. Wilberforce, T.; Olabi, A.; Sayed, E.T.; Elsaid, K.; Abdelkareem, M.A. Progress in carbon capture technologies. Sci. Total Environ. 2021, 761, 143203. [Google Scholar] [CrossRef]
  12. Osman, A.I.; Hefny, M.; Abdel Maksoud, M.I.A.; Elgaragy, A.M.; Rooney, D.W. Recent advances in carbon capture storage and utilisation technologies: A review. Environ. Chem. Lett. 2021, 19, 797–849. [Google Scholar] [CrossRef]
  13. Wang, X.; Wang, X.; Kong, Z.; Shao, Y.; Jin, B. Auto-thermal operation and optimization of coal-fueled separated gasification chemical looping combustion in a pilot-scale unit. Chem. Eng. J. 2020, 383, 123159. [Google Scholar] [CrossRef]
  14. Adánez, J.; Abad, A. Chemical-looping combustion: Status and research needs. Proc. Combust. Inst. 2019, 37, 4303–4317. [Google Scholar] [CrossRef]
  15. Adánez, J.; Abad, A.; Mendiara, T.; Gayán, P.; Diego, L.F.; García-Labiano, F. Chemical looping combustion of solid fuels. Prog. Energy Combust. Sci. 2018, 65, 6–66. [Google Scholar] [CrossRef]
  16. Wang, X.; Shao, Y.; Jin, B. Spatiotemporal statistical characteristics of multiphase flow behaviors in fuel reactor for separated-gasification chemical looping combustion of solid fuel. Chem. Eng. J. 2021, 412, 128575. [Google Scholar] [CrossRef]
  17. Lyngfelt, A. 11—Oxygen carriers for chemical-looping combustion. In Calcium and Chemical Looping Technology for Power Generation and Carbon Dioxide (CO2) Capture; Woodhead Publishing: Cambridge, UK, 2015; pp. 221–254. [Google Scholar] [CrossRef]
  18. Mendiara, T.; Pérez, R.; Abad, A.; Diego, L.F.; García-Labiano, F.; Gayán, P.; Adánez, J. Low-Cost Fe-Based Oxygen Carrier Materials for the iG-CLC Process with Coal. 1. Ind. Eng. Chem. Res. 2012, 51, 16216–16229. [Google Scholar] [CrossRef]
  19. Guan, Y.; Liu, Y.; Lin, X.; Wang, B.; Lyu, Q. Research Progress and Perspectives of Solid Fuels Chemical Looping Reaction with Fe-Based Oxygen Carriers. Energy Fuels 2022, 36, 13956–13984. [Google Scholar] [CrossRef]
  20. De Vos, Y.; Jacobs, M.; Van Der Voort, P.; Driessche, I.V.; Snijkers, F.; Verberckmoes, A. Optimization of spray dried attrition-resistant iron based oxygen carriers for chemical looping reforming. Chem. Eng. J. 2017, 309, 824–839. [Google Scholar] [CrossRef]
  21. Abad, A.; Gayán, P.; García-Labiano, F.; Diego, L.F.; Izquierdo, M.T.; Mendiara, T.; Adánez, J. Relevance of oxygen carrier properties on the design of a chemical looping combustion unit with gaseous fuels. Greenh. Gases Sci. Technol. 2023, 13, 125–143. [Google Scholar] [CrossRef]
  22. Cheng, D.; Yong, Q.; Zhao, Y.; Gong, B.; Zhang, J. Study on the Interaction of the Fe-Based Oxygen Carrier with Ashes. Energy Fuels 2020, 34, 9796–9809. [Google Scholar] [CrossRef]
  23. Liu, X.; Bu, H.; Zou, G.; Wu, X.; Zheng, C.; Ma, J.; Zhao, H. Industrial-Scale Preparation of Biore Oxygen Carriers for Chemical Looping Combustion via a Hydroforming Method. Energy Fuels 2024, 38, 6156–6170. [Google Scholar] [CrossRef]
  24. Li, Z.; Wang, Y.; Li, W.; Wei, G.; Liu, X.; Lin, S.; Li, J.; Li, D.; Meng, Q.; Nie, L.; et al. Demonstration of a 5-MWth Chemical Looping Combustion Unit Fueled by Lignite. Engineering 2025, in press. [Google Scholar] [CrossRef]
  25. Wang, X.; Shao, Y.; Jin, B. Thermodynamic evaluation and modelling of an auto-thermal hybrid system of chemical looping combustion and air separation for power generation coupling with CO2 cycles. Energy 2021, 236, 121431. [Google Scholar] [CrossRef]
  26. Ströhle, J.; Orth, M.; Epple, B. Design and operation of a 1MWth chemical looping plant. Appl. Energy 2014, 113, 1490–1495. [Google Scholar] [CrossRef]
  27. Leion, H.; Mattisson, T.; Lyngfelt, A. Use of Ores and Industrial Products as Oxygen Carriers in Chemical-Looping Combustion. Energy Fuels 2009, 23, 2307–2315. [Google Scholar] [CrossRef]
  28. De Vos, Y.; Jacobs, M.; Van Der Voort, P.; Driessche, I.V.; Snijkers, F.; Verberckmoes, A. Development of Stable Oxygen Carrier Materials for Chemical Looping Processes—A Review. Catalysts 2020, 10, 926. [Google Scholar] [CrossRef]
  29. Liu, F.; Liu, J.; Yang, Y. Review on the Theoretical Understanding of Oxygen Carrier Development for Chemical-Looping Technologies. Energy Fuels 2022, 36, 9373–9384. [Google Scholar] [CrossRef]
  30. Adánez, J.; Cuadrat, A.; Abad, A.; Gayán, P.; Diego, L.F.; García-Labiano, F. Ilmenite Activation during Consecutive Redox Cycles in Chemical-Looping Combustion. Energy Fuels 2010, 24, 1402–1413. [Google Scholar] [CrossRef]
  31. Ksepko, E.; Babinski, P.; Evdou, A.; Nalbandian, L. Studies on the redox reaction kinetics of selected, naturally occurring oxygen carrier. J. Therm. Anal. Calorim. 2016, 124, 137–150. [Google Scholar] [CrossRef][Green Version]
  32. Lu, X.; Rahman, R.A.; Lu, D.Y.; Ridha, F.N.; Duchesne, M.A.; Tan, Y.; Hughes, R.W. Pressurized chemical looping combustion with CO: Reduction reactivity and oxygen-transport capacity of ilmenite ore. Appl. Energy 2016, 184, 132–139. [Google Scholar] [CrossRef]
  33. Abad, A.; Adánez, J.; Cuadrat, A.; García-Labiano, F.; Gayán, P.; Diego, L.F. Kinetics of redox reactions of ilmenite for chemical-looping combustion. Chem. Eng. Sci. 2011, 66, 689–702. [Google Scholar] [CrossRef]
  34. Su, M.; Ma, J.; Tian, X.; Zhao, H. Reduction kinetics of hematite as oxygen carrier in chemical looping combustion. Fuel Process. Technol. 2017, 155, 160–167. [Google Scholar] [CrossRef]
  35. Su, M.; Zhao, H.; Tian, X.; Zhang, P.; Du, B.; Liu, Z. Intrinsic Reduction Kinetics Investigation on a Hematite Oxygen Carrier by CO in Chemical Looping Combustion. Energy Fuels 2017, 31, 3010–3018. [Google Scholar] [CrossRef]
  36. Ksepko, E.; Babiński, P.; Nalbandian, L. The redox reaction kinetics of Sinai ore for chemical looping combustion applications. Appl. Energy 2017, 190, 1258–1274. [Google Scholar] [CrossRef]
  37. Khakpoor, N.; Mostafavi, E.; Mahinpey, N.; Siegler, H.D.H. Oxygen transport capacity and kinetic study of ilmenite ores for methane chemical-looping combustion. Energy 2019, 169, 329–337. [Google Scholar] [CrossRef]
  38. Mendiara, T.; Abad, A.; de Diego, L.; García-Labiano, F.; Gayán, P.; Adánez, J. Reduction and oxidation kinetics of Tierga iron ore for Chemical Looping Combustion with diverse fuels. Chem. Eng. J. 2019, 359, 37–46. [Google Scholar] [CrossRef]
  39. Wang, X.; Liu, H.; Jin, B.; Zhao, J.; Sun, C.; Snape, C.E. Experimental Evaluation of a Chinese Sulfur-Containing Lean Iron Ore as the Oxygen Carrier for Chemical-Looping Combustion. Ind. Eng. Chem. Res. 2016, 55, 428–435. [Google Scholar] [CrossRef]
  40. Wang, X.; Wang, X.; Shao, Y.; Jin, Z.; Jin, B. Reactivity of a Chinese lean iron ore as oxygen carrier: Kinetics and characterization. Thermochim. Acta 2018, 670, 114–122. [Google Scholar] [CrossRef]
  41. Lyngfelt, A. Chemical Looping Combustion: Status and Development Challenges. Energy Fuels 2020, 34, 9077–9093. [Google Scholar] [CrossRef]
  42. Wang, X.; Wang, X.; Zhang, S.; Kong, Z.; Jin, Z.; Shao, Y.; Jin, B. Test Operation of a Separated-Gasification Chemical Looping Combustion System for Coal. Energy Fuels 2018, 32, 11411–11420. [Google Scholar] [CrossRef]
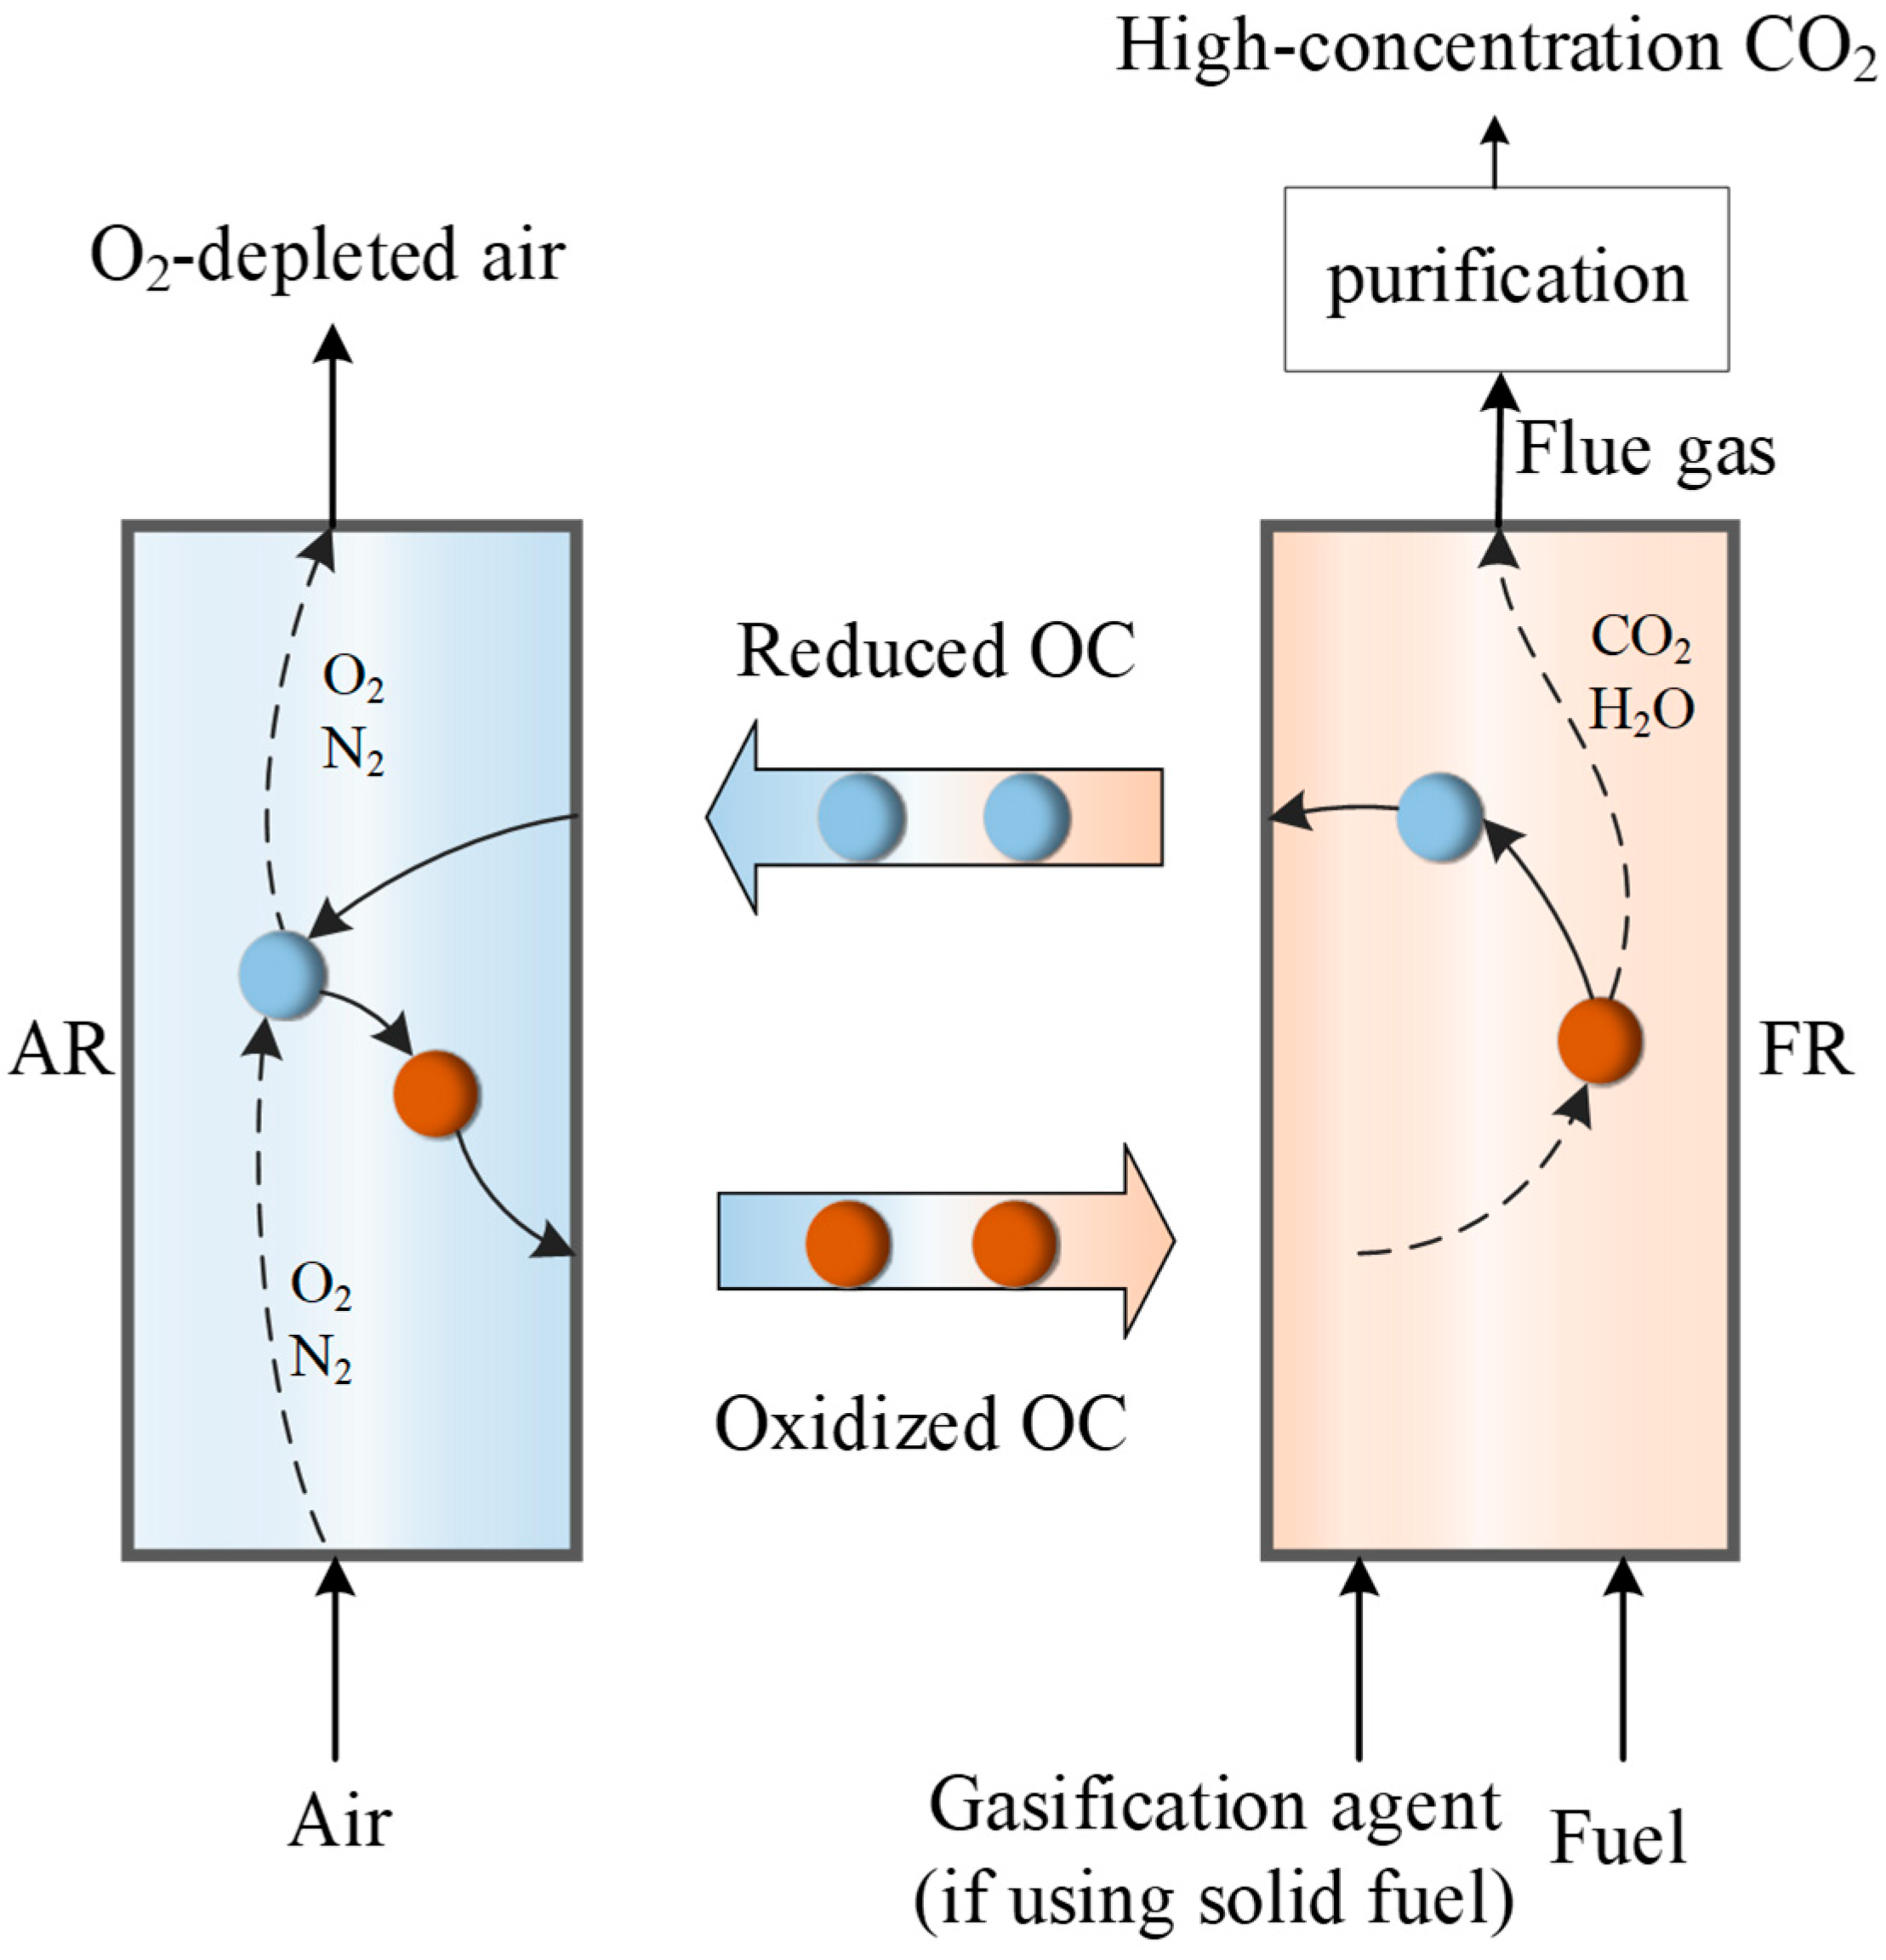
Figure 1. Principle of CLC.
Processes 13 02949 g001
Figure 2. Fixed-bed reactor setup for OC evaluation.
Processes 13 02949 g002
Figure 3. Gas concentrations at different reaction temperatures: (a) 750 °C; (b) 800 °C; (c) 850 °C; and (d) 900 °C.
Processes 13 02949 g003
Figure 4. OC conversions at different reaction temperatures: (a) 750 °C; (b) 800 °C; (c) 850 °C; and (d) 900 °C.
Processes 13 02949 g004
Figure 5. Gas concentrations with different inlet CO concentrations: (a) 15%; (b) 20%.
Processes 13 02949 g005
Figure 6. OC conversions with different inlet CO concentrations: (a) 15%; (b) 20%.
Processes 13 02949 g006
Figure 7. CO2 concentrations and the OC conversions in 15 redox cycles: (a) CO2 concentrations; (b) OC conversions.
Processes 13 02949 g007
Figure 8. Examination and linear fitting of different models: (a) 750 °C; (b) 800 °C; and (c) 850 °C.
Processes 13 02949 g008
Figure 9. Relationship between lnk(T) and 1/T for different models.
Processes 13 02949 g009
Table 1. Performance evaluation using Fe-based iron ore as OC.
OC TypesActive CompositionsTest FuelReactorApparent Activation EnergyReaction OrderReference
Kryvbas iron ore84.86% Fe2O3CH4TGA42.0 kJ mol−11.98[31]
Canadian ilmenite55.8% Fe2O3
32.6% TiO2
COTGA115 kJ mol−10.67[32]
Norwegian ilmenite11.2% Fe2O3
54.6% Fe2TiO5
H2
CO
CH4
TGA109.2 kJ mol−1
113.3 kJ mol−1
165.2 kJ mol−1
1[33]
Chinese hematite66% Fe2O3COTGA110.75 kJ mol−11.5[34]
Chinese hematite66% Fe2O3COFluidized bed reactor74.48 kJ mol−11[35]
Ilmenite46.4% Fe2O3CH4TGA62.4 kJ mol−10.52[36]
Canadian ilmenite10.4% Fe2O3 + 30% Fe2TiO5CH4TGA106.7 kJ mol−10.7[37]
Spanish iron ore76.5% Fe2O3H2
CO
CH4
TGA81.1 kJ mol−1
76.1 kJ mol−1
257 kJ mol−1
1[38]
Lean iron ore35.21% Fe2O3
10.0% CaSO4
CH4
CO
TGA62 kJ mol−1
56 kJ mol−1
0.5[39]
Chinese iron ore44.16% Fe2O3CH4TGA157.5kJ mol−1
126.9 kJ mol−1
1
2
[40]
Table 2. Main components of the iron ore OC.
ComponentsFe2O3SiO2Al2O3CaOMgOOthers
Weight41.34%32.17%11.85%3.77%1.47%9.40%
Table 3. Some common kinetic models for f(X) and g(X) [40].
Kinetic Modelf(X)g(X)
Kinetics-order modelsf1 = 1 − Xg1 = −ln(1 − X)
f2 = (1 − X)2g2 = (1 − X)−1 − 1
f3 = (1 − X)3g3 = [(1-X)−2 − 1]/2
Diffusion modelf4 = 1/(2X)g4 = X2
f5 = 1/[−ln(1 − X)]g5 = (1 − X)ln(1 − X) + X
f6 = (3/2)(1 − X)2/3[1 − (1 − X)1/3]g6 = [1 − (1 − X)1/3]2
Contraction modelf7 = 2(1 − X)1/2g7 = 1 − (1 − X)1/2
f8 = 3(1 − X)2/3g8 = 1 − (1 − X)1/3
Nucleation modelf9 = 2(1 − X)[−ln(1 − X)]1/2g9 = [−ln(1 − X)]1/2
f10 = 3(1 − X)[−ln(1 − X)]2/3g10 = [−ln(1 − X)]1/3
Table 4. R2 of each linear fitting result.
T (°C)g1g2g3g4g5g6g7g8g9g10
7500.99330.97140.97140.90710.88790.86550.99490.99510.82890.3878
8000.98350.94610.94610.87760.85450.8280.99240.99020.88430.5104
8500.95800.89130.89130.84330.81290.77740.97850.97270.94530.6787
Table 5. Calculated apparent activation energy in these models.
Modelg1g7g8
Apparent activation energy19.13 kJ mol−115.93 kJ mol−116.94 kJ mol−1
Disclaimer/Publisher’s Note: The statements, opinions and data contained in all publications are solely those of the individual author(s) and contributor(s) and not of MDPI and/or the editor(s). MDPI and/or the editor(s) disclaim responsibility for any injury to people or property resulting from any ideas, methods, instructions or products referred to in the content.