Article

Comparison of Statistical Process Control Models for Monitoring the Biological Burden of a Buffer Solution Used as Input to Produce an Attenuated Viral Vaccine

by
Josiane Machado Vieira Mattoso
1,2,
Greice Maria Silva da Conceição
1,
Ana Paula Roque da Silva
1,
Paulo Vinicius Pereira Miranda
1,
Letícia de Alencar Pereira Rodrigues
2,
Marcelo Luiz Lima Brandão
1,* and
Jeancarlo Pereira dos Anjos
3,4
1
Oswaldo Cruz Foundation FIOCRUZ, Brazil Avenida Brasil, 4365, Manguinhos, Rio de Janeiro 21040-900, Rio de Janeiro, Brazil
2
Industrial Management and Technology, SENAI CIMATEC University, Orlando Gomes Avenue, 1845, Piatã, Salvador 41650-010, Bahia, Brazil
3
Center for Natural and Human Sciences, Federal University of ABC, Avenida dos Estados 5001, Bangú, Santo André 09210-580, São Paulo, Brazil
4
National Institute of Science and Technology in Energy and Environment (INCT E & A), Federal University of Bahia, Ondina Campus, Salvador 40170-110, Bahia, Brazil
*
Author to whom correspondence should be addressed.
Processes 2025, 13(9), 2917; https://doi.org/10.3390/pr13092917
Submission received: 12 August 2025 / Revised: 5 September 2025 / Accepted: 10 September 2025 / Published: 12 September 2025

Abstract

The pharmaceutical industry faces various production challenges. Bioburden control is essential, and appropriate strategies and procedures must be implemented at all stages of production to prevent microbial contamination and comply with regulatory standards. Quality tools can provide important information for data management in production processes. The objective of this study was to compare two types of statistical process control charts (Laney’s U-chart and Bell distribution) in monitoring the bioburden of a buffer solution used as an input to produce an attenuated viral vaccine. Bioburden data for the buffer solution were obtained over a two-year period. The results showed that the analyzed products met the regulatory specifications, as 99% of them presented ≤ 10 colony-forming units (CFU)/100 mL after filtration. Various microorganisms were identified in the buffer solution, including species from the genus Bacillus spp., Micrococcus spp., Kocuria spp., Staphylococcus spp., and Acinetobacter spp. The Bell distribution proved to be statistically more suitable for application in the management of bioburden data for the buffer solution since the limits were closer to the specified value and could more effectively assist in the investigation of process deviations in the production of an attenuated viral vaccine.

1. Introduction

In recent decades, the pharmaceutical industry has driven the healthcare products market, whose multi-million dollar values reflect the sector’s importance as a source of income. Furthermore, the sector has undergone significant changes in human resource and raw material management to improve industry quality [1].
To manage processes and, above all, make decisions more accurately, it is necessary to work based on facts and data, that is, information generated during the process—and to correctly seek and interpret available information to eliminate empiricism [2]. This management has been enhanced with the implementation of Industry 4.0 in the pharmaceutical sector, as it allows for faster (real-time), automated, and auditable data generation and interpretation [3]. To this end, there are important and effective techniques, called quality tools, that can enable the collection, processing, and clear presentation of available information or data related to the processes managed within organizations [2].
Control charts or graphs use statistical concepts such as range, arithmetic mean, and standard deviation to identify the effects of variability in a data set. They utilize variables that can display relevant information, providing evidence of both random and determinable variations and highlighting their importance. They allow preventive action in the process, correct potential quality deviations in real time, prevent the possibility of nonconformity from continuing and spreading throughout the production line, and contribute to improved intrinsic quality, productivity, reliability, and costs [4,5,6,7].
Statistical process control (SPC) is a sampling inspection system that provides a process profile with the aim of identifying special causes that must be analyzed and blocked so that process variability can be controlled. Therefore, neglecting to monitor quality characteristics in a production process will result in high costs related to failures [5,7,8,9].
With the trend of industrial bioprocesses occurring in an integrated and continuous manner, real-time monitoring of certain parameters (such as the bioload of solutions, culture media, and intermediate and final products, among others) is of great importance to ensure the quality of the process and the final product [10].
The term bioburden (microbial load) is used in the pharmaceutical industry to report the count and types of microorganisms present in raw materials, culture media, solutions, or products [11,12]. The presence of certain microbial species in these products, regardless of quantity, can affect their quality, safety, and stability [13]. Studies evaluating the correlation of parameters, such as environmental monitoring data and product bioburden, have been described in the literature. It has been shown that the pharmaceutical industry has pursued rapid and robust data correlation and interpretation to support decision-making throughout the process [14,15].
Given the above, this study aimed to study two statistical process control models for monitoring bioburden data from a stabilizing buffer solution used in the production of an attenuated viral vaccine by a biopharmaceutical company. Stabilizers are substances that help protect vaccines against adverse conditions, such as freezing, heat, and pH changes; they are also used to create bulk when the amount of antigen is minimal [16]. Therefore, rigorous control is essential to ensure the quality, safety, and stability of the final product, ensuring compliance with previously established specification parameters.

2. Materials and Methods

2.1. Preparation of the Buffer Solution Used in the Production of an Attenuated Viral Vaccine

The buffer solution preparation process at the studied biopharmaceutical unit takes place in a Class C area, according to the Brazilian area classification [17], comprising the following steps: (i) weighing the solution components, which consists of two amino acids, one sugar, two chloride salts, polysorbate 80, ethylenediaminetetraacetic acid [EDTA], 96% ethanol, and water for injection (WFI) to adjust the final volume; (ii) homogenization; (iii) filtration (0.22 µm PVDF filters—poly(vinylidene difluoride)); and (iv) storage in aseptic bags (the average storage time of the prepared solution, until use, is up to 7 days, at a temperature of 5 ± 3 °C). The average preparation time for 400 L of buffer solution is 4 h.
The buffer solution is filtered after preparation (step iii) to reduce the microbiological load. However, the European Commission [18] establishes that filtration should not affect the product, either by removing its ingredients or by adding other substances.

2.2. Sample Collection for Biological Burden Analysis

For bioburden analysis, 100 mL aliquots of the buffer solutions used in the production of the attenuated viral vaccine (in 250 mL vials) were collected, totaling 743 samples from different batches over a two-year period. Sampling was performed before and after the load reduction filtration of the manufacturing process for each batch of the buffer solution, according to the EMA instructions [11].
All samples collected for analysis were obtained directly from the Class C area [17] of the production facilities, where environmental parameters (temperature, humidity, and pressure) are constantly monitored and controlled. The samples were transported to the laboratory, kept refrigerated (5 ± 3 °C), and analyzed within a period of less than 24 h.

2.3. Monitoring the Biological Load of the Buffer Solution

During the vaccine production process, quality control of the buffer solution was performed by monitoring the bioburden (count of heterotrophic bacteria, fungi, and yeasts), in accordance with the compendium guidelines [19,20], for each of the batches in the period selected for the study. As a result, the sum of the counts of identified microorganisms [total count] was considered.
Furthermore, microorganisms isolated from the bioburden analysis were subjected to identification. Colonies were analyzed according to their characteristics, and at least one colony of each different type was transferred to Tryptic Soy Agar (TSA) (BioCen do Brasil, São Paulo, Brazil) and incubated at 32.5 ± 2.5 °C for 24–48 h. The cultures were then inspected for purity, and reisolation was performed when necessary. Subsequently, pure colonies (except for filamentous fungi) were subjected to Gram staining [19,21].
According to Gram characteristics, cultures were subjected to identification using the VITEK® 2 Compact System (BioMérieux, Craponne, France) or the VITEK® MS RUO (BioMérieux, Craponne, France), according to the manufacturers’ instructions, respectively.

2.4. Statistical Process Controls for Monitoring Biological Load in Buffer Solutions

For statistical analyses, the data collected regarding the number of colony-forming units (CFU)/100 mL per plate of bioburden analyzed, before and after filtration of the different batches of the buffer solution, were classified as a discrete variable.
Based on the bioburden data, the application of two statistical models was proposed to assist in the evaluation of the data obtained: (i) Laney U-chart and (ii) Bell distribution. For this purpose, frequency plots and control charts by attributes of the Laney U-chart were constructed using Minitab® 22.1© software [22], and the graphs referring to the Bell distribution were constructed with the aid of the free software R version 4.5.0 Copyright© 2025 [23]. Both statistical models were applied and evaluated to verify the best fit to the data obtained during the buffer solution bioburden monitoring period.
Additionally, a Cause-and-Effect Diagram, proposed by [24], was used. This diagram allowed us to evaluate the possible variables and probable impacts on the process of preparing the buffer solution to be used in the preparation of the viral vaccine. So, it was possible to propose mitigation solutions for possible contamination throughout the vaccine production process.

3. Results and Discussion

3.1. Identification of Microorganisms Present in the Bioburden of the Buffer Solution

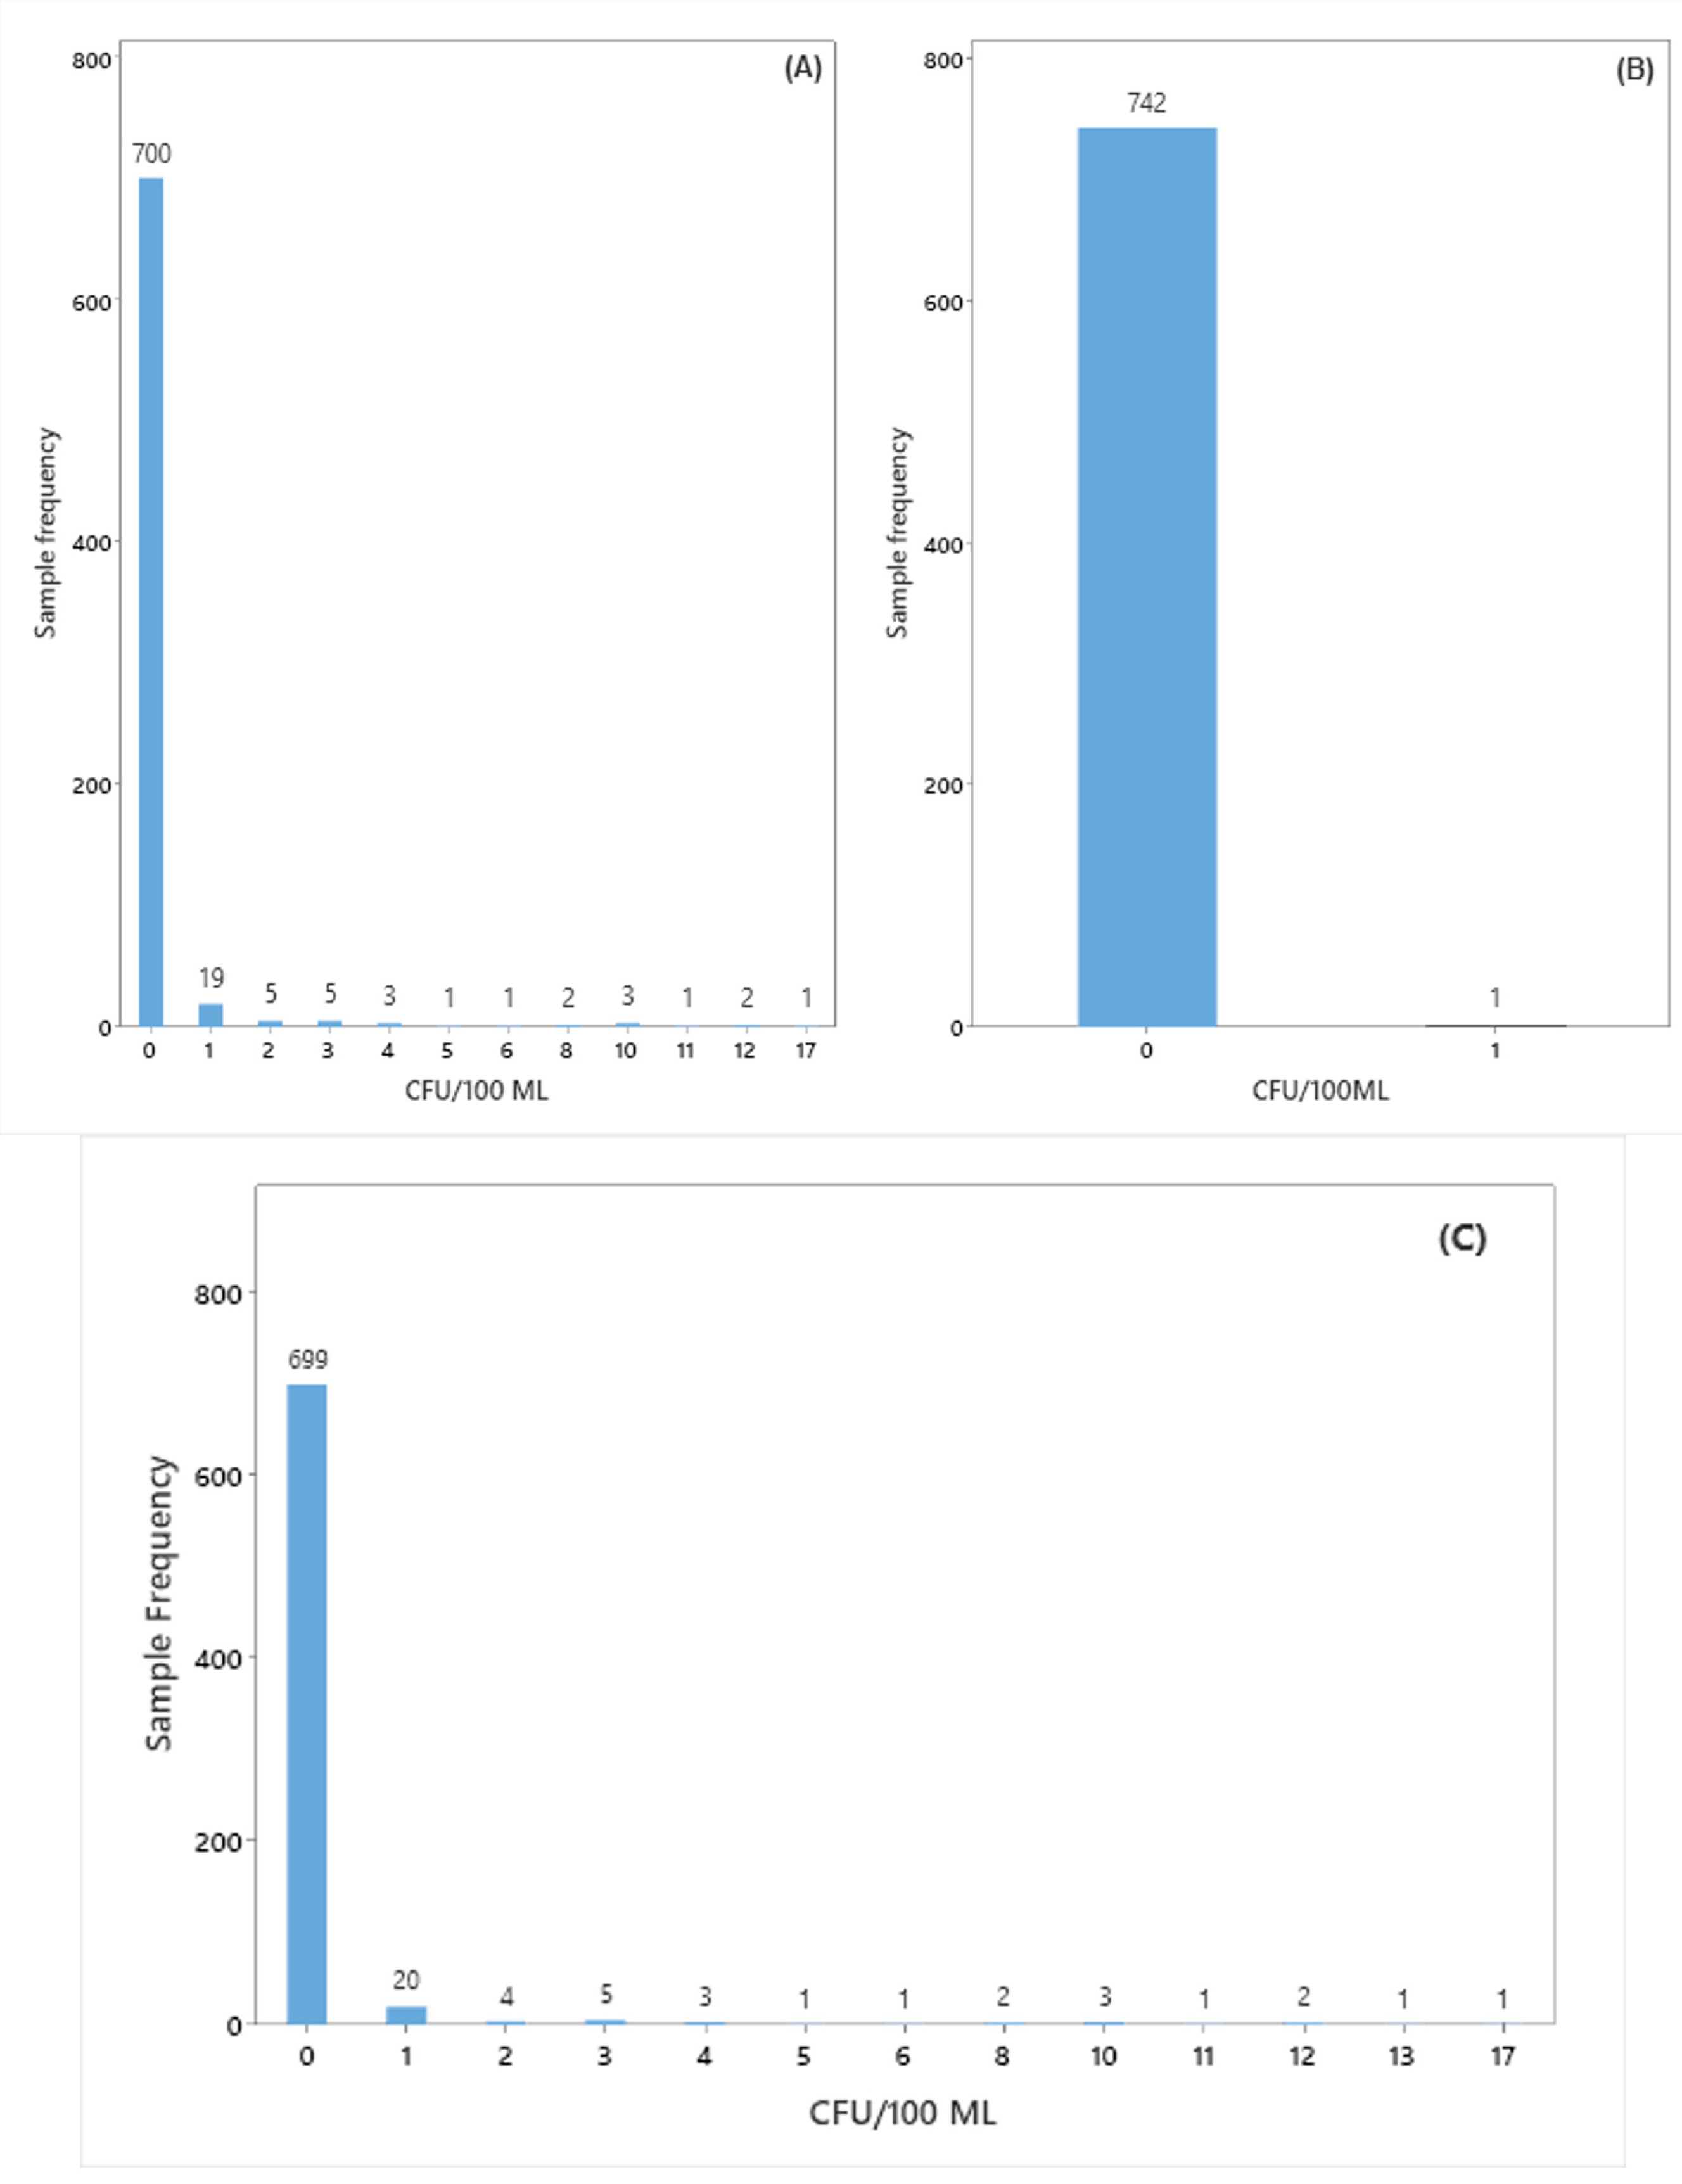
Frequency plots for CFU/100 mL of heterotrophic bacteria, fungi, and yeast counts (before filtration) from 743 different batches of a buffer solution used as a stabilizer during the formulation of a viral vaccine are presented in Figure 1.
Based on the frequency graphs (Figure 1), 587 samples (79%) showed results ≤ 10 CFU/100 mL in the total count, before filtration. According to [11], a bioburden value greater than 10 CFU/100 mL before pre-filtration can only be acceptable if it is due to inherent microbial contamination of the starting material.
In the total count, a greater occurrence of heterotrophic bacteria (91% of the batches analyzed) was observed in relation to fungi (9% of the batches analyzed) for the identified microbial load. These results may be attributed to the intrinsic characteristics of the raw materials used in the solution preparation, which may already have a higher bacterial load than fungi. Another possibility is that, after preparation, bacteria could be favored (if present in the buffer solution) since their bacterial growth rate is faster than that of fungi. Consequently, they would have greater amplification during the total solution production time, which could inhibit or even reduce fungal growth through competition [25].
Figure 2 shows the results of counting the number of CFU/100 mL of heterotrophic bacteria, fungi, and yeasts after filtration of each of the batches of buffer solution prepared.
Bioburden monitoring of the buffer solution after filtration revealed that 738 samples (99%) had results ≤ 10 total CFU/100 mL, which is considered within specification. Of these, 699 samples [94%] had results < 1 total CFU/100 mL, demonstrating a significant percentage reduction in bioburden in the buffer solution compared to the results before filtration. This demonstrates the effectiveness of the filtration step in reducing the microbial load of the buffer solution prior to its use in the formulation of an attenuated viral vaccine.
However, it is possible to observe that, even after the filtration procedure, 44 batches of the analyzed samples (6%) still showed the presence of microorganisms, which could compromise the final quality of the vaccine produced.
The process of product sampling, being multifaceted and operator-dependent, inherently carries a risk of adventitious contamination. This can lead to false-positive results, ultimately resulting in product rejection. As Sandle [26] highlighted, merely eluting the product into a sterile container may not be sufficient to prevent the introduction of contaminants. Even with rigorous training, occasional adventitious contamination can occur, underscoring the vulnerability of the sampling procedure.
In this way, the microorganisms present in each of the batches of buffer solution prepared were identified (Figure 3).
According to Figure 3A, different types of microorganisms were identified before filtration of the buffer solution, with 100% bacteria (89.13% Gram-positive strains and 10.86% Gram-negative strains). Of these isolates, 52.17% were Gram-positive bacilli, with Bacillus licheniformis presenting the highest incidence in the analyzed samples (n = 259).
Other studies also reported the high prevalence of Bacillus spp. and related genera from pharmaceutical industries’ environmental [27] and bioburden assays [13,28]. The presence of this microorganism may be directly related to the environment in which the buffer solution is prepared and/or used since this is a microorganism commonly found in soil and has the characteristic of being a spore former. Refs. [29,30,31] mention that the bacterium B. licheniformis is ubiquitous in nature, and its spores are highly resistant to environmental stresses, including the application of sanitizers in the food industry.
According to the criteria for classification and management of bioburden results proposed by Mattoso et al. [13], B. licheniformis is considered an objectionable microorganism that can represent risk to the process due to its pathogenicity for humans. Zou et al. [32] consider B. licheniformis as a potential pathogen, especially in immunocompromised patients, as it can cause bloodstream infection.
In addition to B. licheniformis, the bacterium Micrococcus luteus also stood out among the microorganisms identified before (n = 165) and after (n = 6) filtration of the buffer solution. This microorganism is an opportunistic pathogen present mainly on human and animal skin, as well as in soil and water, and causes serious infections (such as pneumonia, meningitis, peritonitis, and endocarditis, especially in immunosuppressed patients) [33].
Ramos et al. [10] evaluated the microorganisms found in a biopharmaceutical facility from September/2014 to February/2024 and reported that M. luteus was the most prevalent species found (n = 286; 15.11%). According to the criteria proposed by Mattoso et al. [13], M. luteus is considered an objectionable microorganism, also due to its pathogenicity for humans.
Furthermore, microorganisms of the genus Kocuria spp. were also identified in a significant number of batches of the buffer solution, mainly before the filtration procedure (n = 256). Organisms belonging to the genus Kocuria are Gram-positive, coagulase-negative, coccoid actinobacteria that reside on human skin and mucous membranes. These microorganisms are generally considered contaminants, recognized as opportunistic pathogens, and can cause infections in adults and children [33,34]. According to Ref. [13], Kocuria rhizophila, Kocuria rosea, and Kocuria varians are considered objectionable microorganisms, also due to their pathogenicity for humans.
After filtration of the buffer solution, a change in its microbiological profile was observed, despite a significant reduction in its biological load. Thus, 42 types of microorganisms were identified, demonstrating greater diversity and heterogeneity of identified species, with 92.8% being bacteria, of which 47.6% were Gram-positive cocci, 28.6% were Gram-positive bacilli, 16.7% were Gram-negative cocci, and 7.1% were filamentous fungi.
Therefore, after filtration, there was a predominant incidence of Gram-positive coccal microorganisms, originating from the human microbiota and possible causes of infections and toxin producers (such as microorganisms of the genus Staphylococcus spp., which possess species considered pathogenic microorganisms) [13,35].
Staphylococcus spp. are Gram-positive, facultatively anaerobic bacteria commonly found in the microbiota of mammalian skin and mucous membranes. This genus includes clinically relevant opportunistic pathogens in human and veterinary medicine that frequently colonize a variety of biotic surfaces [36]. Despite their ubiquitous nature, these microorganisms have been considered contaminants and are associated with studies of antimicrobial resistance and serious infections (pneumonia, meningitis, septicemia, and others), such as Staphylococcus aureus [37,38,39], which represents a global public health challenge associated with prolonged illness, increased healthcare costs, and high mortality rates [37,38,39]. Other studies reported the presence of Staphylococcus species in samples from pharmaceutical industries [10,27], including bioburden analysis [40,41,42].
In addition to Staphylococcus spp., other microorganisms were identified in the buffer solution, such as the genus Acinetobacter, which are recognized human pathogens and have also been frequently associated with antimicrobial resistance studies [43,44]. For example, the multidrug-resistant Acinetobacter baumannii bacterium is increasingly recognized as an important cause of hospital-acquired infections, such as ventilator-associated pneumonia, surgical site infections, secondary meningitis, and urinary tract infections, particularly in patients admitted to intensive care units (ICUs).
Bacteria of this genus are defined as ESKAPE pathogens, which include Enterococcus faecium, S. aureus, Klebsiella pneumoniae, A. baumannii, Pseudomonas aeruginosa, and Enterobacter spp. [45,46]. Acinetobacter spp. is commonly found in pharmaceutical industries, mainly in water samples [47].
Therefore, the microbiological characterization of the buffer solution used in the production of an attenuated viral vaccine is important for understanding the biota with recognized pathogenicity in the production process. For example, questionable microorganisms may pose a risk to the process, according to Mattoso et al. [13]. As a treatment, a multidisciplinary risk assessment needs to be carried out to evaluate the risk to patient safety, stability, and product quality for batch release or rejection. As well, emerging measures are being taken to minimize the risks of contamination of the final product, including additional analyses in one or more steps after detection of the microorganism to improve the quality and safety of the vaccine.

3.2. Statistical Tools Used in Monitoring the Biological Burden of Buffer Solution

Statistical tools exist to monitor process performance and set control limits that differentiate individual deviant events from baseline variability [48]. The Poisson, Binomial, and Negative Binomial probability distributions are examples of models capable of explaining many of these everyday situations. These models are examples of discrete probabilistic models.
In the Poisson distribution, the chances of a given event occurring are always the same for each interval of the same length, and the number of occurrences in one interval does not depend on another. However, a major disadvantage of the Poisson distribution is that its mean is equal to the variance. Therefore, the emergence of alternative distributions capable of better explaining count data in which the variance is greater than the mean is increasingly common [49].
Control charts offer several benefits to the pharmaceutical industry, such as improving the cost-effectiveness of the manufacturing process. Furthermore, control charts provide a measure of the process’s ability to meet specifications and data trends, with the added benefit of the presence of upper control limits (UCLs), lower control limits (LCLs), and process mean lines. Furthermore, control charts are a graphical presentation that makes it easy to visualize points at which the process is out of control [50].
Therefore, it is observed that the data analyzed in our study present some of the aforementioned characteristics, with emphasis on the existence of an excess of “zeros”, even before filtration (65 samples, corresponding to 8.7% of the data set, presented a result < 1 total CFU/100 mL). These results may be associated with the quality of the raw material batches used (low biological load), use of sterile WFI, use of aseptic bags (single-use and sterile) for storage of the buffer solution, control of the Class C area where the process takes place, and training and experience of the operators (which reduces the probability of product contamination).
The control chart commonly used in monitoring microbiological counts in the pharmaceutical industry is type C, when subgroup sizes are equal across samples, and type U, when samples are not equal in size. Attribute control charts require the underlying distribution to follow a particular pattern, such as geometric, Poisson, or binomial. Since the bioburden did not follow this type of distribution, the best approach to using the attribute chart was achieved by applying Laney’s modification to correct for overdispersion and/or underdispersion.
In relation to the other samples, which showed the presence of microorganisms, the microbial load data showed great variation, with results ranging from 1 to 148 CFU/100 mL (mean = 7; median = 6; coefficient of variation = 110%). This condition causes the variability found in the process to be greater than its average; that is, it causes an overdispersion of the data [51].
Based on this, Laney U-charts are used in the statistical evaluation of data sets with such characteristics, as they adapt to conditions of overdispersion. Furthermore, it is considered the ideal control chart when the data are counts (non-negative integers) [51].
Commonly, when identifying counts per observation unit (in this study, plates), the Laney U-chart is considered the most suitable for calculating control parameters (central value and upper and lower limits), as it monitors the number of nonconformities (CFU/100 mL > 0) per inspection unit (plate) [48]. However, this type of control chart requires a larger number of samples than charts that evaluate continuous data, so that the prediction of control parameters is more assertive [52].
Laney charts take into account intra- and inter-subgroup variation and provide specific control limits for each subgroup, adjusted for dispersion and quantified by sigma z values [53], to monitor the process defect rate and to adjust for over- or underdispersion in your data.
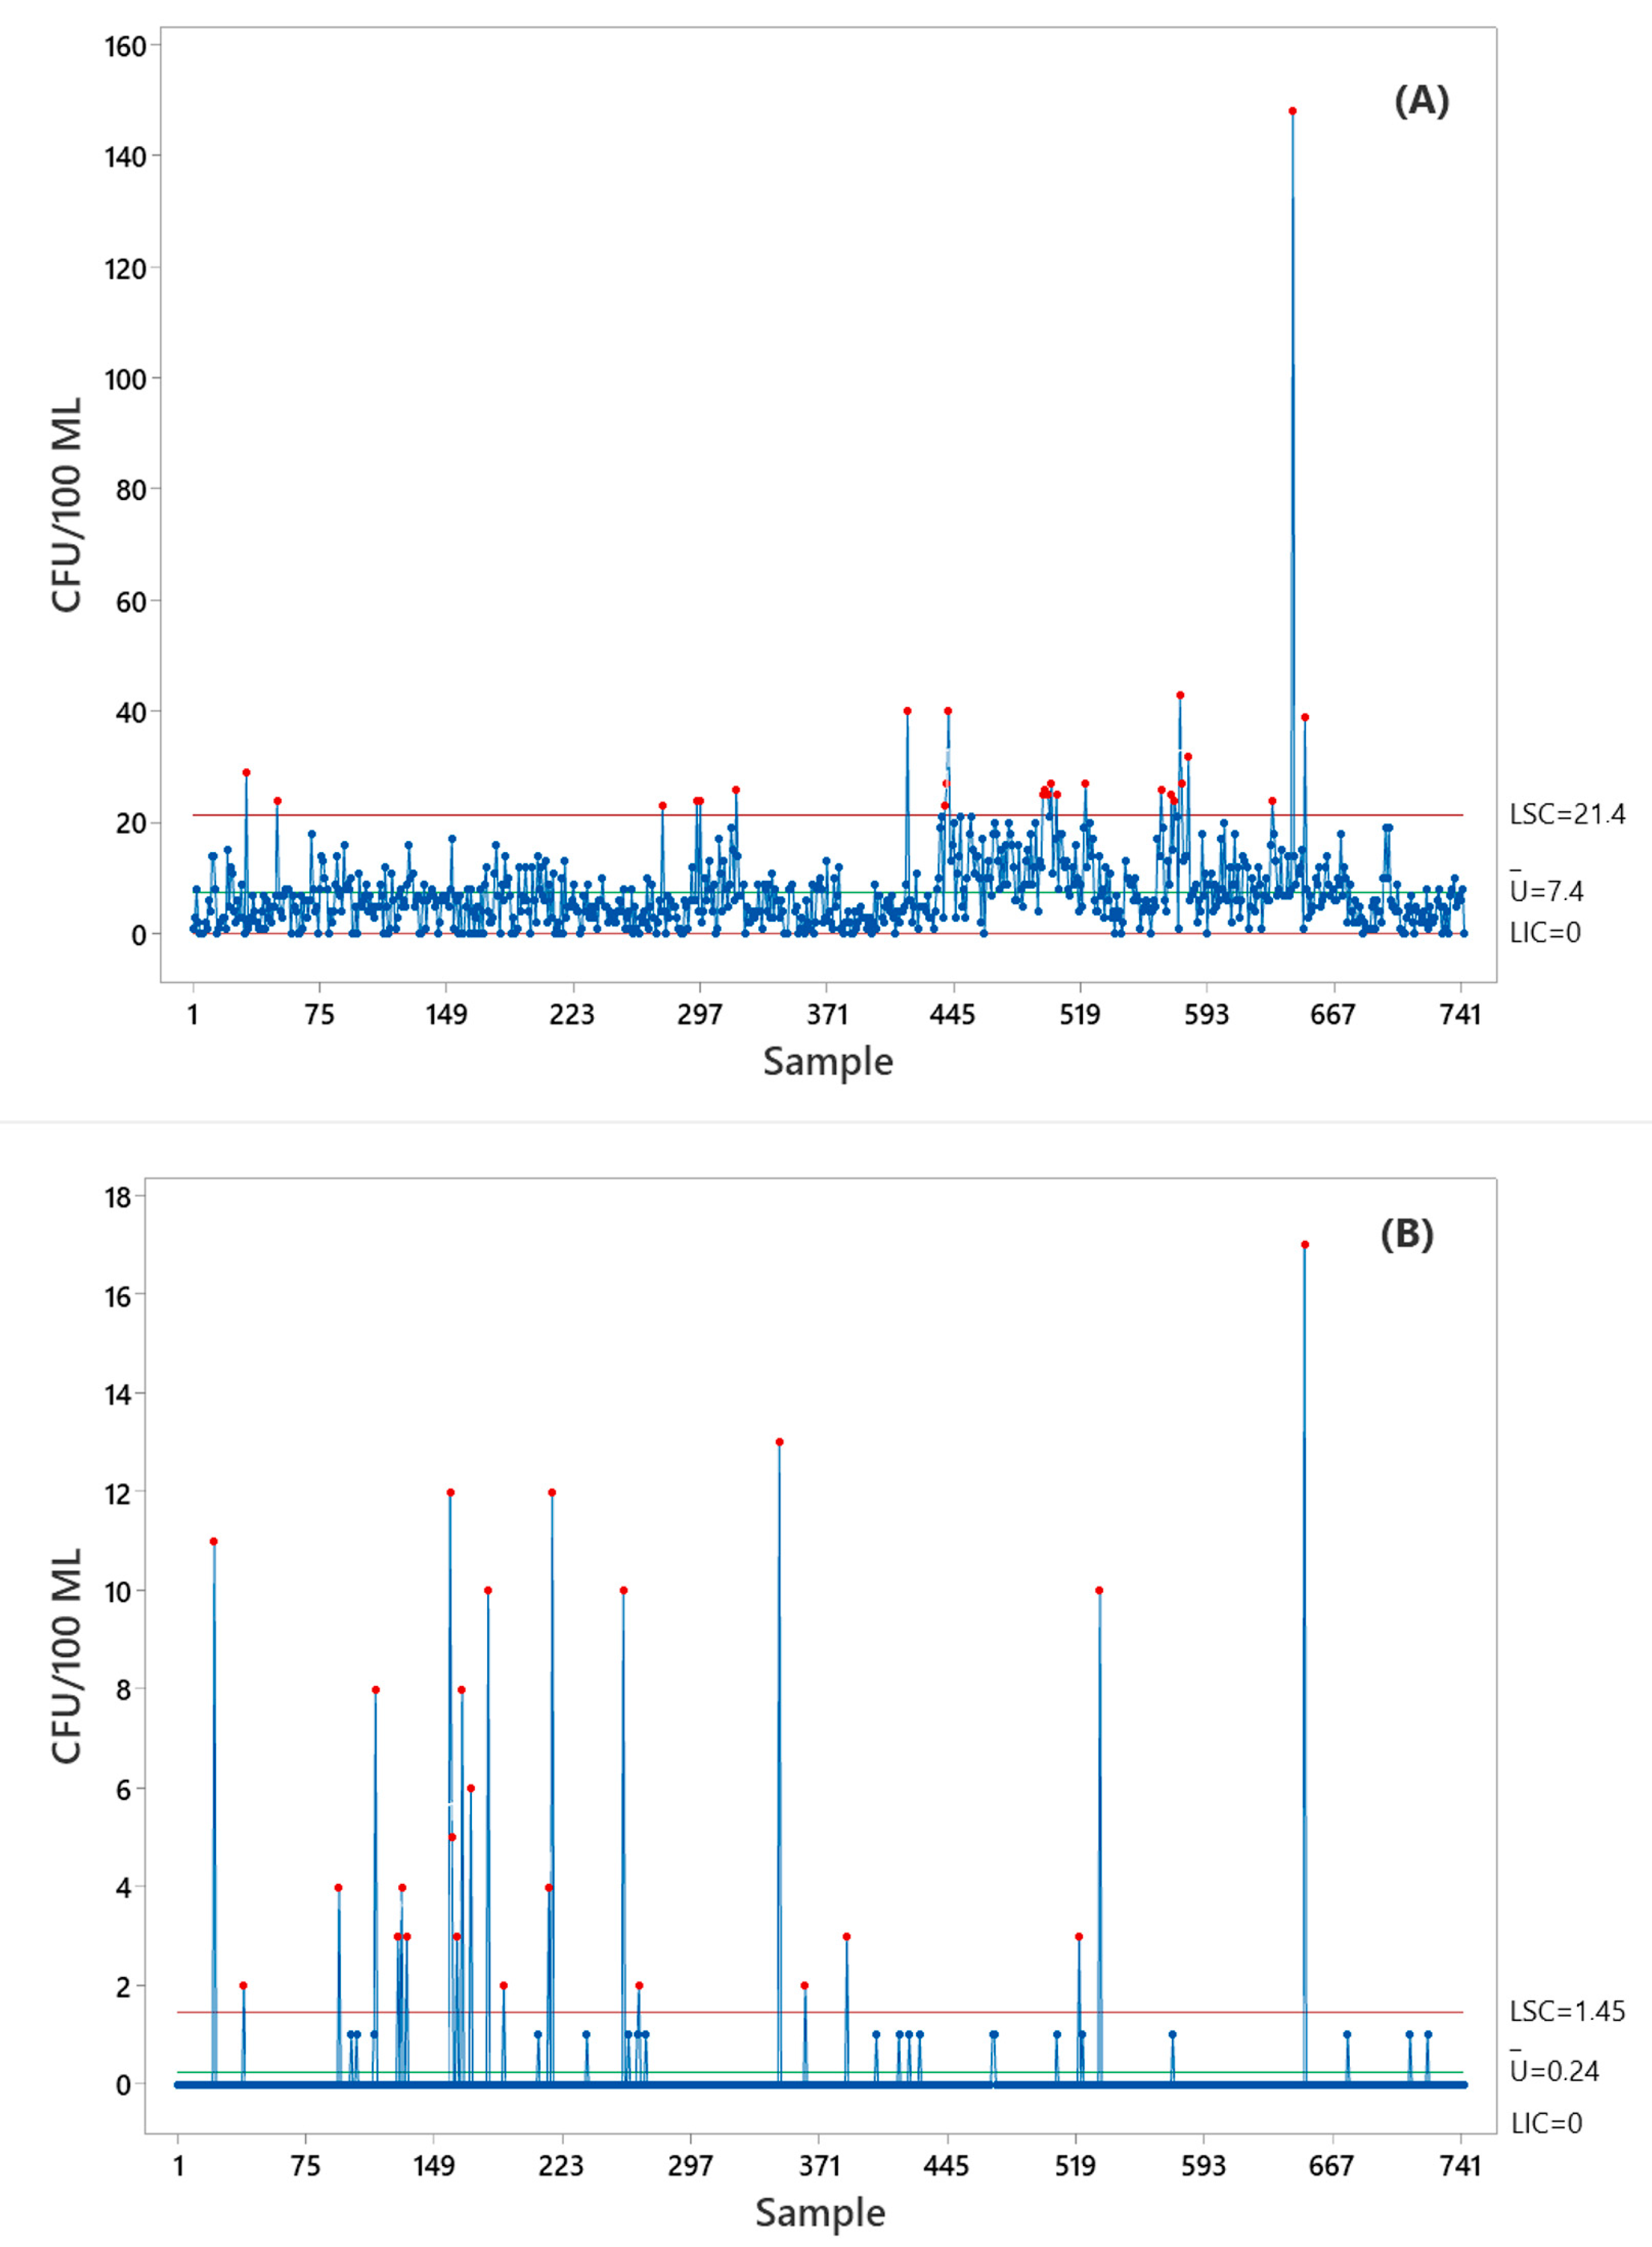
Overdispersion can cause a traditional U-chart to show an increased number of points outside the control limits. Underdispersion can cause a traditional U-chart to show very few points outside the control limits. The Laney U-chart adjusts for these conditions. To ensure that your results are valid, the following guidelines should be considered when collecting data, performing analysis, and interpreting results: you must be able to count the number of defects in each item or unit; the data must be in chronological order; the data must be collected at appropriate time intervals; collect data in subgroups; the subgroups must be large enough; and enough subgroups must be collected to obtain accurate control limits [22]. Therefore, in this study, the Laney U control chart was used to evaluate the bioburden data obtained from different batches of buffer solution used in the formulation of an attenuated viral vaccine (Figure 4).
Figure 4A reveals a microbiologically unstable manufacturing process between batches, which requires further investigation to elucidate the causes of these differences in bioburden quality between product batches. Points outside the control limit indicate that microbial load should be monitored consistently over time to identify and eliminate causes of variation. Laney’s U control charts indicated that the results were not in control, demonstrating significant variability that should be corrected [54].
Therefore, the Laney U-chart has proven to be a useful tool for monitoring microbiological quality and its trends during production processes. Even if the results appear to meet specifications, factors related to fluctuations in contamination data should be investigated (Figure 4B), including factors such as operators, manufacturing environment, and failures in good manufacturing practices (GMP).
Comparing the control charts, it is observed that the variability detected in the results may arise from special causes in the viral vaccine production process, which influence the characteristics that microbiological data generally do not follow a normal distribution, contain many zeros, and are highly dispersed [48], and confirms that it is inappropriate to assume a normal distribution for microbiological data. Calculations that assume a normal distribution tend to underestimate variability and, consequently, set the microbiological control level too low. Therefore, a more detailed investigation of this variation was necessary to elucidate the reason for the instability in the amount of CFU/100 mL among the samples considered in this study.
Bell described a distribution that was not obtained through the discretization of a known continuous distribution, as is customary. Furthermore, based on the Bell distribution, a new regression model was proposed in which the response variable is a count. It has only one parameter (since the more parameters a model has, the more difficult its interpretation), belongs to the exponential family of distributions, is infinitely divisible, and can accommodate overdispersed data (since its variance is greater than the mean), among other things. Furthermore, the mean response of the Bell regression model is related to a linear predictor through a link function [49].
Alternatively, a discrete probability distribution of an evaluated parameter was introduced, called the Bell distribution [55]. It is infinitely divisible and capable of modeling overdispersed count data, as is the case with the bioburden data obtained in the present study. One advantage of the Bell distribution is that it approximates the Poisson distribution for small values of a given parameter. In other words, the Poisson distribution is a limiting case of the Bell distribution that arises when the Bell parameter [in this study, the CFU count] tends to zero.
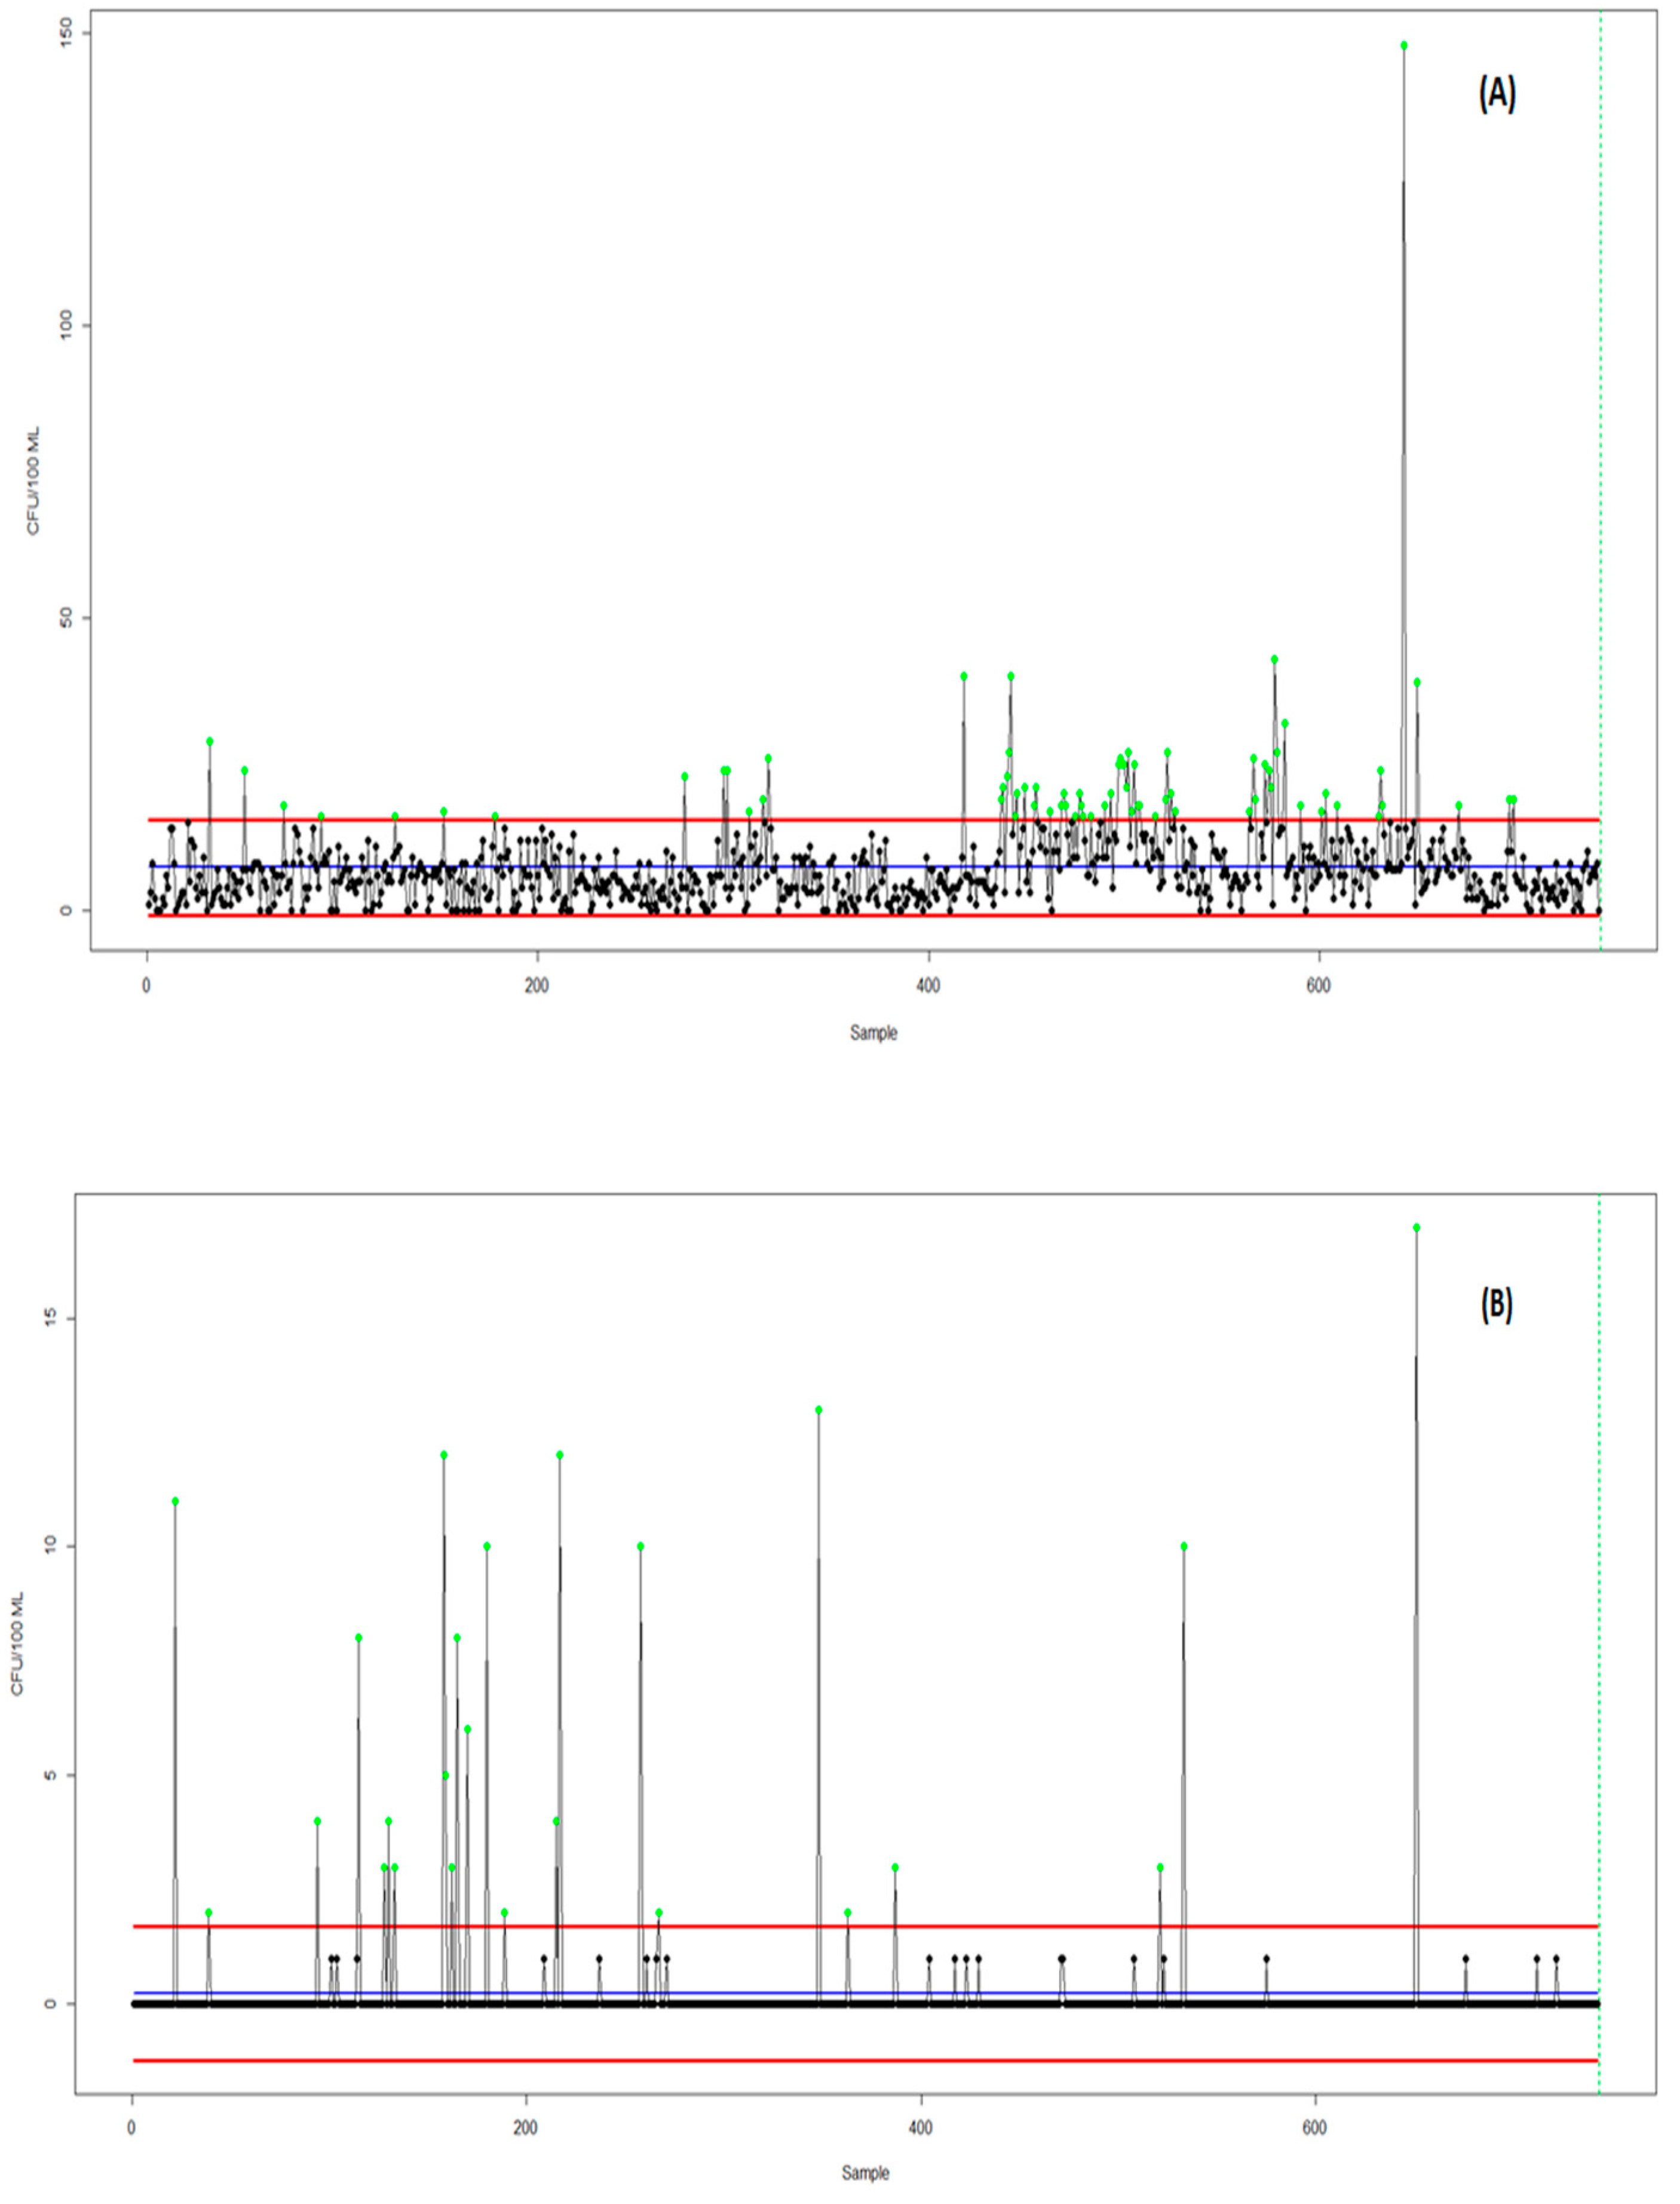
Bell’s control chart theory can be applied in practical situations as a useful tool and an interesting alternative to the well-known Poisson control charts (C and U charts), developed through the Poisson hypothesis, among others, when the data are overdispersed [56]. Thus, in comparison with Laney’s U-chart, the Bell control chart was applied to the bioburden results obtained in the present study (Figure 5).
It is observed that the UCL of the Bell distribution was 15.6 CFU /100 mL in the pre-filtration stage, presenting a more rigorous result in relation to the Laney U-chart (21.4 CFU/100 mL), in relation to the bioburden data of the buffer solution and closer to the specification limit before filtration, which is 10 CFU/100 mL [11].
Therefore, we clearly demonstrate that monitoring the microbiological load in inputs for viral vaccine production using the Bell Distribution Chart can be adopted more effectively, targeting corrective actions and/or improvements in the vaccine production process. The main purpose is to reduce the upper limit for this statistical model and, consequently, improve the safety and microbiological quality of the final product.
To verify the observed data, we performed additional quantitative evaluations, with adjustment measures and residue analysis on both control charts, as shown in Table 1.
Based on the results, we found that in the Laney U-chart, the residual values were extreme values of up to 30 standard deviations, rejecting normality in the Shapiro–Wilk distribution (p < 0.0001) and significant autocorrelation (Ljung–Box p < 2.2 × 10⁻¹⁶). In the Bell distribution, the residuals were less extreme (maximum of 19 standard deviations), with a median closer to zero (−0.19 versus −0.29 in the Laney distribution) and a lower absolute mean (MAR = 0.65 versus 1.02).
Regarding the goodness-of-fit measures, we found that the Pearson index (χ2/gL) was 8.90 in the Laney U-chart, compared to 1.21 in the Bell distribution, approaching the expected ideal value of around 1. The Laney U-chart flagged 26 out-of-control points (3.5% of the series), while the Bell chart flagged only 6 points (0.8%), significantly reducing false alarms.
The Bell chart confirmed a better statistical fit in the analyses, generating more stable residuals, lower relative dispersion, and greater robustness against overdispersion. It also revealed an increase in special cause alerts in the process compared to the Laney U-chart (Figure 4), which exceeded the provisional process control limits. Therefore, it can be inferred that the process is out of statistical control. Therefore, process consolidation is necessary so that more detailed analyses can be performed regarding the stability of vaccine production.
In general, when analyzing both control charts (Laney’s U distribution and Bell distribution), it was possible to verify that, although the products met the specifications required by legislation [11], the processes were out of statistical control and, therefore, the capability indices could not be calculated in this work.
To make the process stable and achieve capability, we need to identify the special causes of variation, and their elimination is essential. Points outside the control limits demonstrate that they are not inherent to the process, such as operational failure, equipment failure, cross-contamination, and environmental problems. Once the special causes are eliminated and the process becomes stable (i.e., under statistical control), the focus shifts to the common causes of variation, which is a key to continuous improvement. This is where engineering and management teams must act to improve the process design, optimize procedures, and invest in more accurate technology to narrow the data distribution curve.

3.3. Evaluation of Factors That May Cause Contamination of the Buffer Solution Used in the Formulation of an Attenuated Viral Vaccine

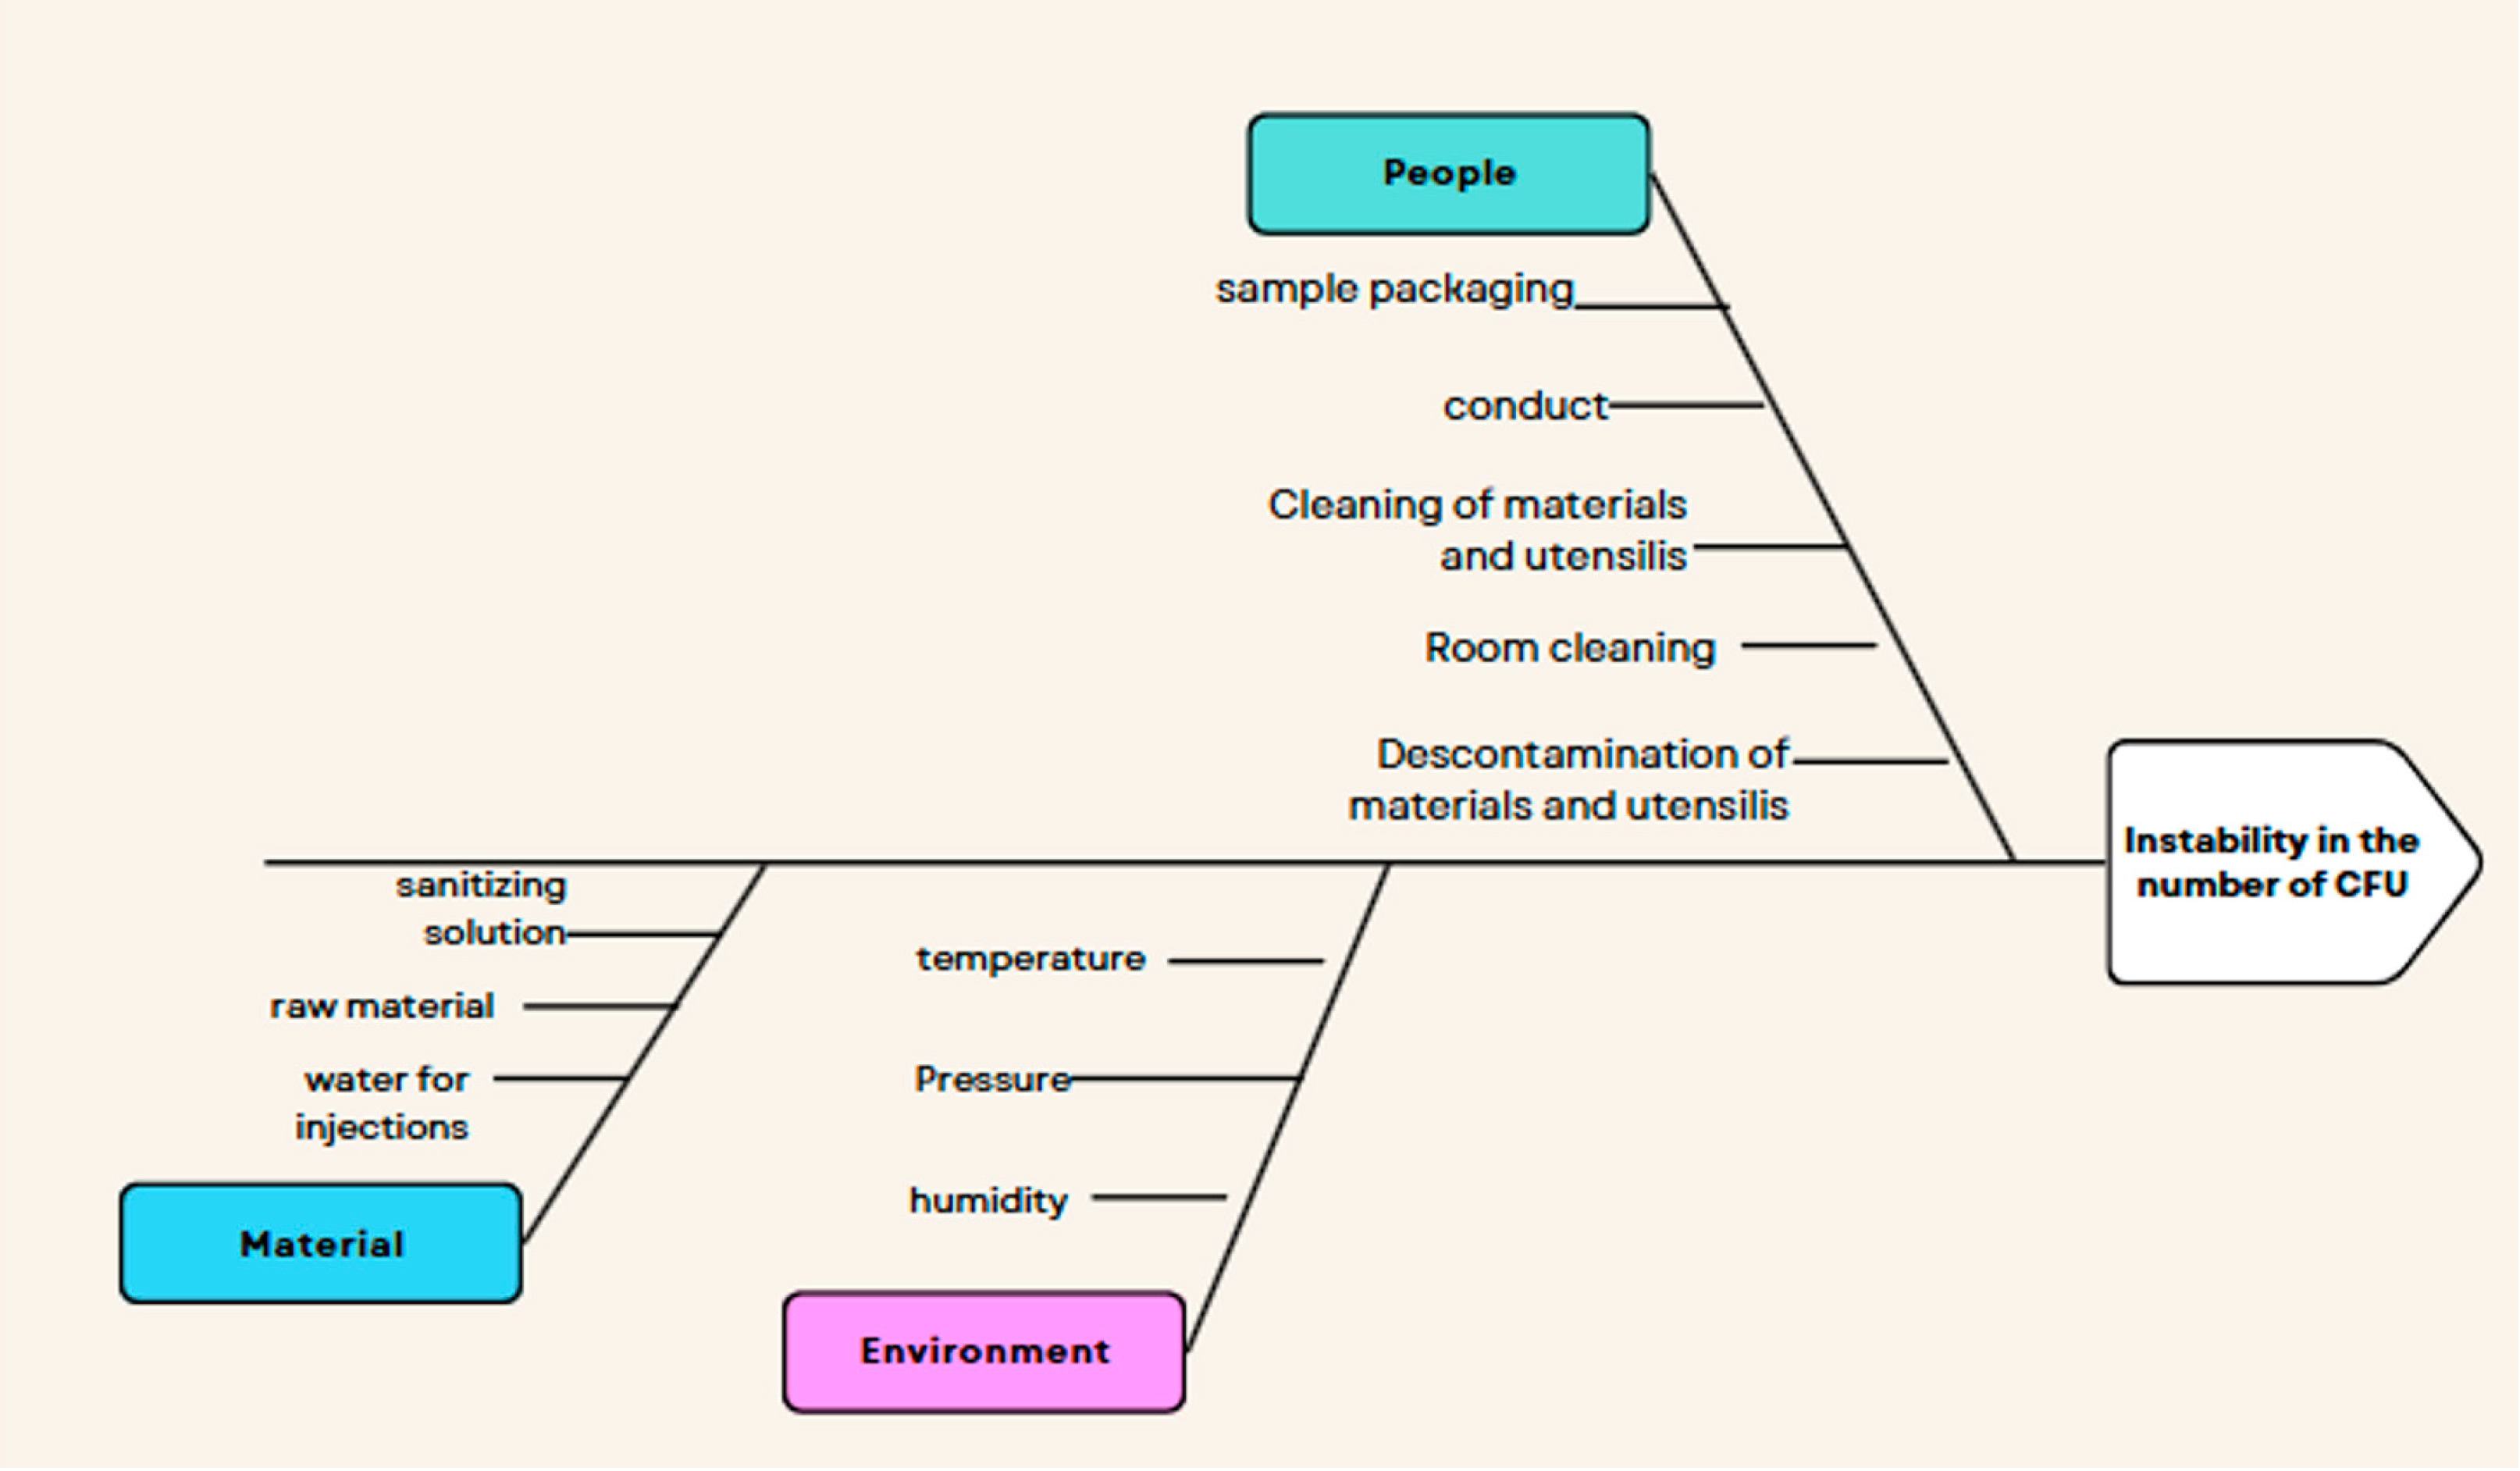
In order to investigate the factors that may influence the contamination of the buffer solution used in the formulation of an attenuated viral vaccine, the Cause-and-Effect Diagram tool was applied, as proposed by Simões [24] (Figure 6).
From the elucidation of the Cause-and-Effect Diagram, it was possible to enumerate the factors and possible impacts that could contribute to the variability in the count of colony-forming units of microorganisms verified in the monitoring of the bioburden of the studied buffer solution (Table 2).
Table 2 allows for a more detailed assessment of the critical factors and potential impacts on increased biological burden during the preparation and use of the buffer solution used as an input to produce the attenuated viral vaccine. Furthermore, these impacts may be decisive in the variability of biological burden data throughout the buffer solution monitoring period.
Consequently, by comparing Figure 6 and Table 2, it is possible to immediately assess and interpret the performance of the production process and the use of the buffer solution, contributing to more assertive decision-making regarding the reduction of process failures, errors, and lack of controls that impact the variability of the biological load of the buffer solution used as an input for vaccine production. When mapping the Cause-and-Effect Diagram, we found that, for example, sterile water for injection and sterile collection containers are variables with virtually no impact on microorganism insertion. However, based on the microbiota identified, the sampling process is a critical variable for bioburden results (especially post-filtration), where the lack of process validation simulating sampling and specific operator training does not guarantee sampling reproducibility and standardization. This failure can result in variability in results across the production process. These measurements can serve as a basis for implementing action plans to adopt corrective measures aimed at improving the production process of the buffer solution under study and the consequent impact on the quality and safety of the vaccine.
In the pharmaceutical industry, particularly within the production chain of sterile products as vaccines and biologicals, the presence of critical microorganisms in raw materials, in-process solutions, or final products necessitates robust investigation into their origin [13]. While the identification of specific microbial species is a crucial first step, it often falls short of definitively establishing the contamination source.
Therefore, clonal studies employing advanced molecular methods, such as enterobacterial repetitive intergenic consensus–polymerase chain reaction (ERIC-PCR), multilocus sequence typing (MLST), or Whole-Genome Sequencing (WGS), can be applied [42,57]. These techniques enable the precise comparison of genetic profiles between isolates found within the bioburden of the product and those recovered from potential environmental reservoirs, personnel, or raw material batches.
Another technique for typing microorganisms is Fourier-Transform Infrared Spectroscopy (FT-IR), which has already been applied with success for Staphylococcus epidermidis and Stenotrophomonas maltophilia species isolated from pharmaceutical industries [42,57]. By revealing the relatedness of isolates, clonal analysis provides compelling evidence for microbial source tracking, transforming speculative conclusions about contamination into scientifically substantiated findings. This capability is critical for identifying specific points of failure in manufacturing processes, implementing targeted remediation strategies, enhancing product safety, and regulatory compliance.

4. Conclusions

The adoption of a load reduction filter has been shown to be effective in reducing behavioral bioburden compared to results before filtration and may contribute to improving the microbiological quality of the buffer solution preparation used in the formulation of an attenuated viral vaccine.
Monitoring microbial loads according to the specification, in compliance with the acceptance criteria, is not sufficient to demonstrate the quality of the production processes and the products generated in the formulation of an attenuated viral vaccine.
The microorganisms identified before and after filtration influenced the qualitative and quantitative variability of the microbial load and the possible impact on the microbiological quality of the buffer solution samples analyzed. The initial microbiological load of the raw materials, failures in monitoring environmental parameters, and/or operational errors may have influenced the incidence of Gram-positive bacilli and spore-forming microorganisms, which can be found in the environment [air, soil] where the buffer solution is prepared or used.
After filtration, a change in the microbiological profile of the buffer solution was observed, where the microorganisms identified in the samples may be directly related to failures in the operators’ conduct, given the predominance of microbiota present in human flora [such as Gram-positive cocci].
The two statistical process control models (Laney U-chart and Bell distribution) used to monitor bioburden data of a supplied solution used in the formulation of an attenuated viral vaccine showed microbiological instability in the overall process.
For this case study, the Bell distribution regression model approach estimated variability more reliably than the Laney U control chart since the lower and upper limits were closer to the specified buffer solution bioburden value. Thus, the Bell distribution regression model can more effectively aid in the investigation of process deviations and obtain more robust results, thus contributing to the evaluation of improvements in the production processes of a biopharmaceutical industry.
Although both control charts used in this study indicate that the process was out of control, statistical process control has contributed significantly to assessing variations in a microbiological data set in the biopharmaceutical industry, especially if they occur within an acceptable range. Furthermore, by analyzing the behavior of the data, it becomes possible to assess process-related trends with greater assertiveness and less empiricism.
The Bell distribution control chart and the Cause-and-Effect Diagram are quality tools that will greatly contribute in other facilities and/or pharmaceutical industries. The study will serve as a basis and guide for data where the biological load does not follow a normal distribution, where there is a need to correct overdispersion and/or many zeros, as in the case of raw materials, intermediate products, or even in environmental monitoring, contributing to the continuous improvement of processes and decision-making.

Author Contributions

J.M.V.M.: Conceptualization, Methodology, Validation, Formal Analysis, and Writing—Original Draft. G.M.S.d.C.: Methodology and Formal Analysis. A.P.R.d.S.: Methodology and Formal Analysis. P.V.P.M.: Methodology and Formal Analysis. L.d.A.P.R.: Conceptualization, Writing—Review and Editing, and Visualization. M.L.L.B.: Conceptualization, Writing—Review and Editing, and Visualization. J.P.d.A.: Conceptualization, Writing—Review and Editing, Visualization, and Supervision. All authors have read and agreed to the published version of the manuscript.

Funding

This research received no external funding.

Data Availability Statement

The data from this study will be available upon reasonable request from the corresponding author.

Acknowledgments

The authors would like to thank the Coordination for the Improvement of Higher Education Personnel (CAPES) for supporting the postgraduate program. We also thank the Oswaldo Cruz Foundation (Fiocruz) and the Corporate School/General Coordination of Human Resource Management (Cogepe—Fiocruz), within the scope of the Management Development Program (PDG), for their organizational.

Conflicts of Interest

The authors declare no conflicts of interest.

References

  1. Nascimento, J.M.R.; Santos, M.R.; Quintilio, M.S.V. Quality control in the pharmaceutical industries. Rev. JRG Estud. Acad. 2022, 5, 43–55. [Google Scholar] [CrossRef]
  2. Mariani, C.A. Método PDCA e ferramentas da qualidade no gerenciamento de processos industriais: Um estudo de caso. Rev. Adm. Inovação 2005, 2, 110–126. [Google Scholar]
  3. Sharma, D.; Patel, P.; Shah, M.A. Comprehensive study on Industry 4.0 in the pharmaceutical industry for sustainable development. Environ. Sci. Pollut. Res. Int. 2023, 30, 90088–90098. [Google Scholar] [CrossRef] [PubMed]
  4. Lima, A.A.N.; Lima, J.R.; Silva, J.L.; Alencar, J.R.B.; Soares-Sobrinho, J.L.; Lima, L.G.; Rolim-Neto, P.J. Application of statistical process control in the pharmaceutical industry. Rev. Basic. Farm. Sci. Apl. 2006, 27, 177–187. [Google Scholar]
  5. Maciel, T.H.; Branco, G.M.; Werner, L. Cartas de controle multivariadas: Estudo de caso em vinícolas italianas. Cad. IME Sér. Estat. UERJ 2014, 37, 1–14. [Google Scholar] [CrossRef]
  6. Pérez-Benítez, B.E.; Tercero-Gómez, V.G.; Khakifirooz, M.A. Review on Statistical Process Control in Healthcare: Data-Driven Monitoring Schemes. IEEE Acess 2023, 11, 56248–56272. [Google Scholar] [CrossRef]
  7. Saidy, C.; Xia, K.; Kircaliali, A.; Harik, R.; Bayoumi, A. The Application of Statistical Quality Control Methods in Predictive Maintenance 4.0: An Unconventional Use of Statistical Process Control (SPC) Charts in Health Monitoring and Predictive Analytics. In Advances in Asset Management and Condition Monitoring; Smart Innovation, Systems and Technologies; Springer SBM: Cham, Switzerland, 2020; Volume 166, pp. 1051–1061. [Google Scholar]
  8. Kuk, E.; Bobek, S.; Nalepa, G.J. Explainable proactive control of industrial processes. J. Comput. Sci. 2024, 81, 102329. [Google Scholar] [CrossRef]
  9. Tran, P.H.; Nadi, A.A.; Nguyen, T.H.; Tran, K.D.; Tran, K.P. Application of Machine Learning in Statistical Process Control Charts: A survey and perspective. In Control Charts and Machine Learning for Anomaly Detection in Manufacturing; Springer Series in Reliability Engineering; Springer: Cham, Switzerland, 2021; pp. 7–42. [Google Scholar]
  10. Ramos, V.B.A.; Costa, L.V.; Pereira, G.R.; Miranda, R.V.S.L.; Valadão, T.B.; Brandão, M.L.L.; da Costa, L.V. Development of a methodology for classifying the criticality of isolated bacterial species in the environmental monitoring of the pharmaceutical industry producing immunobiologicals. In Biosafety and Bioprotection Symposium: High Biological Containment Environments, 1st ed.; Quality Week: From Compliance to Performance, 11; Instituto de Comunicação e Informação Científica e Tecnológica em Saúde (Icict/Fiocruz): Rio de Janeiro, Brazil, 2024; Available online: https://arca.fiocruz.br/items/4bce9071-0d2a-469c-a68c-7761f27f7181 (accessed on 30 October 2024).
  11. European Medicines Agency. Guideline on the Sterilisation of the Medicinal Product, Active Substance, Excipient and Primary Container; EMA/CHMP/CVMP/QWP/850374/2015; European Medicines Agency: Amsterdam, The Netherlands, 2019. [Google Scholar]
  12. National Health Surveillance Agency. Normative Instruction No. 127, of March 30, 2022. Provides for Good Manufacturing Practices Complementary to Biological Inputs and Medicines; Official Gazette of the Union No. 62, Section 1; National Health Surveillance Agency: Brasília, Brazil, 2022. [Google Scholar]
  13. Mattoso, J.M.V.; Costa, L.V.; Vale, B.A.; Reis, C.M.F.; Andrade, J.M.; Braga, L.M.P.S.; Conceição, G.M.S.; Costa, P.B.M.; Silva, J.B.; Rodrigues, L.A.P.; et al. Quantitative and Qualitative Evaluation of Microorganism Profile Identified in Bioburden Analysis in a Biopharmaceutical Facility in Brazil: Criteria for Classification and Management of Results. PDA J. Pharm. Sci. Technol. 2025, 79, 125–156. [Google Scholar] [CrossRef]
  14. Bain, D.; Hardy, D.; Bell, B.L.; Forng, R.Y.; Knight, M.; Bawa, A.; Ramsey, S.; Arbesser-Rastburg, C.; Paul, M.; Ton, C.; et al. Microbial Monitoring For Biological Drug Substance Manufacturing: An Industry Perspective. PDA J. Pharm. Sci. Technol. 2015, 69, 451–460. [Google Scholar] [CrossRef]
  15. Kremer, T.; Patel, R. Correlation between Environmental Monitoring and Product Bioburden. Biomed. Instrum. Technol. 2019, 53, 32–37. [Google Scholar] [CrossRef]
  16. Santos, E.P. Guide to Good Immunization Practices in Remote, Hard-to-Reach Areas. Brazilian Society of Immunization. 2017. Available online: https://sbim.org.br/images/books/guia-imunizacao-areas-remotas.pdf (accessed on 30 October 2024).
  17. National Health Surveillance Agency. Normative Instruction No. 35, of August 21, 2019. Provides for Good Manufacturing Practices Complementary to Sterile Medicines; Official Gazette of the Union No. 162, Section 1; National Health Surveillance Agency: Brasília, Brazil, 2019. [Google Scholar]
  18. European Commission. Rules Governing Medicinal Products in the European Union, Volume 4, EU Guidelines for Good Manufacturing Practice for Medicinal Products for Human and Veterinary Use, Annex 1—Manufacture of Sterile Medicinal Products; European Commission: Luxembourg, 2022. [Google Scholar]
  19. National Health Surveillance Agency. Brazilian Pharmacopoeia. <5.5.3.1.2> Counting the Total Number of Mesophilic Microorganisms, 7th ed.; National Health Surveillance Agency: Brasília, Brazil, 2024; pp. 110–111. Available online: https://anvisalegis.datalegis.net/action/UrlPublicasAction.php?acao=abrirAtoPublico&num_ato=00000940&sgl_tipo=RDC&sgl_orgao=ANVISA/MS&vlr_ano=2024&seq_ato=222&cod_modulo=134&cod_menu=1696 (accessed on 30 October 2024).
  20. United States Pharmaceuticals. National Formulary. In Microbiological Examination of Nonsterile Products: Enumeration Tests; U.S. Pharmacopeia: Rockville, MD, USA, 2022; Chapter 61; Available online: https://www.usp.org/harmonization-standards/pdg/general-methods/microbial-enumeration (accessed on 30 October 2024).
  21. Tripathi, N.; Zubair, M.; Sapra, A. Gram staining. In StatPearls [Internet]; Stat Pearls Publishing: Treasure Island, FL, USA, 2025. Available online: https://www.ncbi.nlm.nih.gov/books/NBK562156/ (accessed on 14 August 2023).
  22. MINITAB. Help and How to Improve Quality and Processes with Control Charts, Supporting Topics for Understanding Attributes, Control Charts, Overdispersion and Underdispersion. 2024. Available online: https://support.minitab.com/en-us/minitab/help-and-how-to/quality-and-process-improvement/control-charts/supporting-topics/basics/understanding-control-charts/ (accessed on 30 October 2024).
  23. R Core Team. R: A Language and Environment for Statistical Computing; R Foundation for Statistical Computing: Vienna, Austria, 2023. [Google Scholar]
  24. Simões, A.; Veiga, F.; Vitorino, C. Question-based review for pharmaceutical development: An enhanced quality approach. Eur. J. Pharm. Biopharm. 2024, 195, 114174. [Google Scholar] [CrossRef]
  25. Rogers, A.; Bullard, K.; Dod, A.; Wang, Y. Bacterial Growth Curve Measurements with a Multimode Microplate Reader. Bio Protoc. 2022, 12, e4410. [Google Scholar] [CrossRef]
  26. Sandle, T. Improving microbiological assurance for bioburden tests Improving microbiological assurance for bioburden testing. Eur. Pharm. Rev. 2016, 21, 41–44. Available online: https://www.researchgate.net/publication/305114253 (accessed on 30 October 2024).
  27. Song, M.; Li, Q.; Liu, C.; Wang, P.; Qin, F.; Zhang, L.; Fan, Y.; Shao, H.; Chen, G.; Yang, M. A comprehensive technology strategy for microbial identification and contamination investigation in the sterile drug manufacturing facility—A case study. Front. Microbiol. 2024, 15, 1327175. [Google Scholar] [CrossRef]
  28. Caldeira, N.G.S.; de Souza, M.L.S.; de Miranda, R.V.S.L.; Costa, L.V.; Forsythe, S.J.; Zahner, V.; Brandão, M.L.L. Characterization by MALDI-TOF MS and 16S rRNA Gene Sequencing of Aerobic Endospore-Forming Bacteria Isolated from Pharmaceutical Facility in Rio de Janeiro, Brazil. Microorganisms 2024, 12, 724. [Google Scholar] [CrossRef] [PubMed]
  29. Janiszewska, D.; Złoch, M.; Pomastowski, P.; Szultka-Młyńska, M. Implications of Sample Preparation Methods on the MALDI-TOF MS Identification of Spore-Forming Bacillus Species from Food Samples: A Closer Look at Bacillus licheniformis, Peribacillus simplex, Lysinibacillus fusiformis, Bacillus flexus, and Bacillus marisflavi. ACS Omega 2023, 8, 34982–34994. [Google Scholar] [PubMed]
  30. Muras, A.; Romero, M.; Mayer, C.; Otero, A. Biotechnological applications of Bacillus licheniformis. Crit. Rev. Biotechnol. 2021, 41, 609–627. [Google Scholar] [CrossRef]
  31. Dai, H.; Ma, L.; Xu, Z.; Soteyome, T.; Yuan, L.; Yang, Z. Invited review: Role of Bacillus licheniformis in the dairy industry—Friends or foes? J. Dairy Sci. 2024, 107, 7520–7532. [Google Scholar] [CrossRef] [PubMed]
  32. Zou, Q.; Cai, M.; Hu, Y.; Ge, C.; Wang, X.; Duan, R. Bacillus licheniformis bloodstream infections associated with oral probiotic administration: Two case reports. Indian J. Med. Microbiol. 2024, 47, 100485. [Google Scholar] [CrossRef]
  33. Wei, M.P.; Yu, H.; Guo, Y.H.; Cheng, Y.L.; Xie, Y.F.; Yao, W.R. Antibacterial activity of Sapindus saponins against microorganisms related to food hygiene and the synergistic action mode of Sapindoside A and B against Micrococcus luteus in vitro. Food Control 2021, 130, 108337. [Google Scholar] [CrossRef]
  34. Zhang, Y.; Hu, Q.; Li, Z.; Kang, Z.; Zhang, L. Kocuria species: An underappreciated pathogen in pediatric patients—A single-center retrospective analysis of 10 years’ experience in China. Diagn. Microbiol. Infect. Dis. 2023, 107, 116078. [Google Scholar] [CrossRef]
  35. Ahmad-Mansour, N.; Loubet, P.; Pouget, C.; Dunyach-Remy, C.; Sotto, A.; Lavigne, J.P.; Molle, V. Staphylococcus aureus Toxins: An Update on Their Pathogenic Properties and Potential Treatments. Toxins 2021, 13, 677. [Google Scholar] [CrossRef]
  36. Araújo, D.; Oliveira, R.; Silva, B.L.; Castro, J.; Ramos, C.; Matos, F.; Almeida, C.; Silva, S. Antimicrobial resistance patterns of Staphylococcus spp. isolated from clinical specimens of companion animals in Northern Portugal, 2021–2023. Vet. J. 2024, 1, 305. [Google Scholar] [CrossRef] [PubMed]
  37. Rossi, C.C.; Ahmad, F.; Giambiagi-deMarval, M. Staphylococcus haemolyticus: An updated review on nosocomial infections, antimicrobial resistance, virulence, genetic traits, and strategies for combating this emerging opportunistic pathogen. Microbiol. Res. 2024, 282, 127652. [Google Scholar] [CrossRef]
  38. Sigudu, T.T.; Oguttu, J.W.; Qekwana, D.N. Antimicrobial Resistance of Staphylococcus spp. from Human Specimens Submitted to Diagnostic Laboratories in South Africa, 2012–2017. Microorganisms 2024, 12, 1862. [Google Scholar] [CrossRef]
  39. Sigudu, T.T.; Oguttu, J.W.; Qekwana, D.N. Prevalence of Staphylococcus spp. from human specimens submitted to diagnostic laboratories in South Africa, 2012–2017. S. Afr. J. Infect. Dis. 2023, 38, 477. [Google Scholar] [CrossRef]
  40. Lima, J.C. Identificação e avaliação da hemólise e biofilme de Staphylococcus spp. isoladas de uma indústria farmacêutica. In Proceedings of the Reunião Anual da FESBE, Búzios, Brazil, 27–30 August 2023; FeSBE: Búzios, Brazil, 2023. Available online: https://arca.fiocruz.br/items/0db4ff2e-ee75-4b1a-b336-58461fe7801f (accessed on 30 October 2024).
  41. Vale, B.A.; Lima, J.C.; Souza, P.A.; Miranda, R.V.S.L.; Brandão, M.L.L.; Costa, L.V.; Tom, H.K. Characterization of Staphylococcus hominis strains isolated in an immunobiological pharmaceutical unit. In Proceedings of the Congresso Brasileiro de Microbiologia 2023, Foz do Iguaçu, Brazil, 18–22 October 2023; 145-1. Available online: https://sbmicrobiologia.org.br/32cbm-anais/resumos/R-0145-1.html (accessed on 30 October 2024).
  42. Loureiro, J.M.P.; Guimarães, R.C.C.; Valadão, T.B.; Miranda, R.V.S.L.; Andrade, J.M.; Costa, I.V.; Brandão, M.L.L. Application of Fourier-Transform Infrared Spectroscopy (FT-IR) for Staphylococcus epidermidis Typing as a Tool for Contamination Control Strategy in a Pharmaceutical Industry Facility. PDA J. Pharm. Sci. Technol. Novemb. 2024, 78, 761–762. [Google Scholar] [CrossRef]
  43. Roque-Borda, C.A.; Primo, L.M.D.G.; Franzyk, H.; Hansen, P.R.; Pavan, F.R. Recent advances in the development of antimicrobial peptides against ESKAPE pathogens. Heliyon 2024, 10, e31958. [Google Scholar] [CrossRef]
  44. Ribeiro, T.A.N.; dos Santos, G.A.; dos Santos, C.T.; Soares, D.C.F.; Saraiva, M.F.; Leal, D.H.S.; Sachs, D. Eugenol as a promising antibiofilm and anti-quorum sensing agent: A systematic review. Microb. Pathog. 2024, 196, 106937. [Google Scholar] [CrossRef] [PubMed]
  45. Nocera, F.P.; Attili, A.R.; De Martino, L. Acinetobacter baumannii: Its Clinical Significance in Human and Veterinary Medicine. Pathogens 2021, 10, 127. [Google Scholar] [CrossRef] [PubMed]
  46. Idris, F.N.; Nadzir, M.M. Multi-drug resistant ESKAPE pathogens and the uses of plants as their antimicrobial agents. Arch. Microbiol. 2023, 205, 115. [Google Scholar] [CrossRef]
  47. Vasconcellos, L.; Silva, S.V.; da Costa, L.V.; de Miranda, R.V.d.S.L.; dos Reis, C.M.F.; Braga, L.M.P.S.; Silva, C.; Conceição, G.; Mattoso, J.; Silva, I.B.; et al. Phenotypical and molecular characterization of Acinetobacter spp. isolated from a pharmaceutical facility. Lett. Appl. Microbiol. 2023, 76, ovad101. [Google Scholar] [CrossRef]
  48. Gordon, O.; Goverde, M.; Pazdan, J.; Staerk, A.; Roesti, D. Comparison of Different Calculation Approaches for Defining Microbiological Control Levels Based on Historical Data. PDA J. Pharm. Sci. Technol. 2015, 69, 383–398. [Google Scholar] [CrossRef]
  49. Sousa, B.K. Análise de Diagnóstico em Modelos de Regressão Bell. Master’s Thesis, Centro de Ciências Exatas e da Terra, Universidade Federal do Rio Grande do Norte, Natal, Brazil, 2023. [Google Scholar]
  50. Eissa, M.E. Variable and Attribute Control Charts in Trend Analysis of Active Pharmaceutical Components: Process Efficiency Monitoring and Comparative Study. Exp. Med. 2018, 1, 31–44. [Google Scholar]
  51. Eissa, M.E. Application of Laney control chart in assessment of microbiological quality of oral pharmaceutical filterable products. Bangladesh J. Sci. Ind. Res. 2017, 52, 239–246. [Google Scholar] [CrossRef][Green Version]
  52. Montgomery, D.C. Introduction to Statistical Quality Control, 7th ed.; LTC: Rio de Janeiro, Brazil, 2016; p. 572. [Google Scholar]
  53. Moon, J. An Investigation into the Use of Laney U Chart as a Visual Schedule Tracker to Graphically Monitor the Schedule Performance Index. J. Eng. Proj. Prod. Manag. 2020, 10, 35–41. [Google Scholar][Green Version]
  54. Mora, J.G.M.; Guzmán, B.A.F.; Suárez, J.H.; León, J.J.M. Aplicación del Control Estadístico de Procesos: Un caso de estudio. Cienc. Lat. Rev. Científica Multidiscip. 2025, 9, 440–462. [Google Scholar] [CrossRef]
  55. Castellares, F.; Ferrari, S.L.P.; Lemonte, A.J. On the Bell distribution and its associated regression model for count data. Appl. Math. Model. 2018, 56, 172–185. [Google Scholar] [CrossRef]
  56. Boaventura, L.L.; Ferreira, P.H.; Fiaccone, R.L.; Ramos, P.L.; Louzada, F. New statistical process control charts for overdispersed count data based on the Bell distribution. An. Acad. Bras. Cienc. 2023, 95, e20200246. [Google Scholar] [CrossRef] [PubMed]
  57. Souza, P.; Miranda, R.; Santos, M.; Costa, L.; Silva, R.; Miranda, C.; Boas, M.; Brandão, M. Evaluation of Fourier-Transform Infrared Spectroscopy as a rapid method to type Stenotrophomonas maltophilia strains isolated from pharmaceutical industry. In Annals of the Symposium: Building Pathways to Accelerate the Development of the National Technological Innovation Ecosystem; Institute of Technology in Immunobiologicals: Rio de Janeiro, Brazil, 2024; p. 123. [Google Scholar]
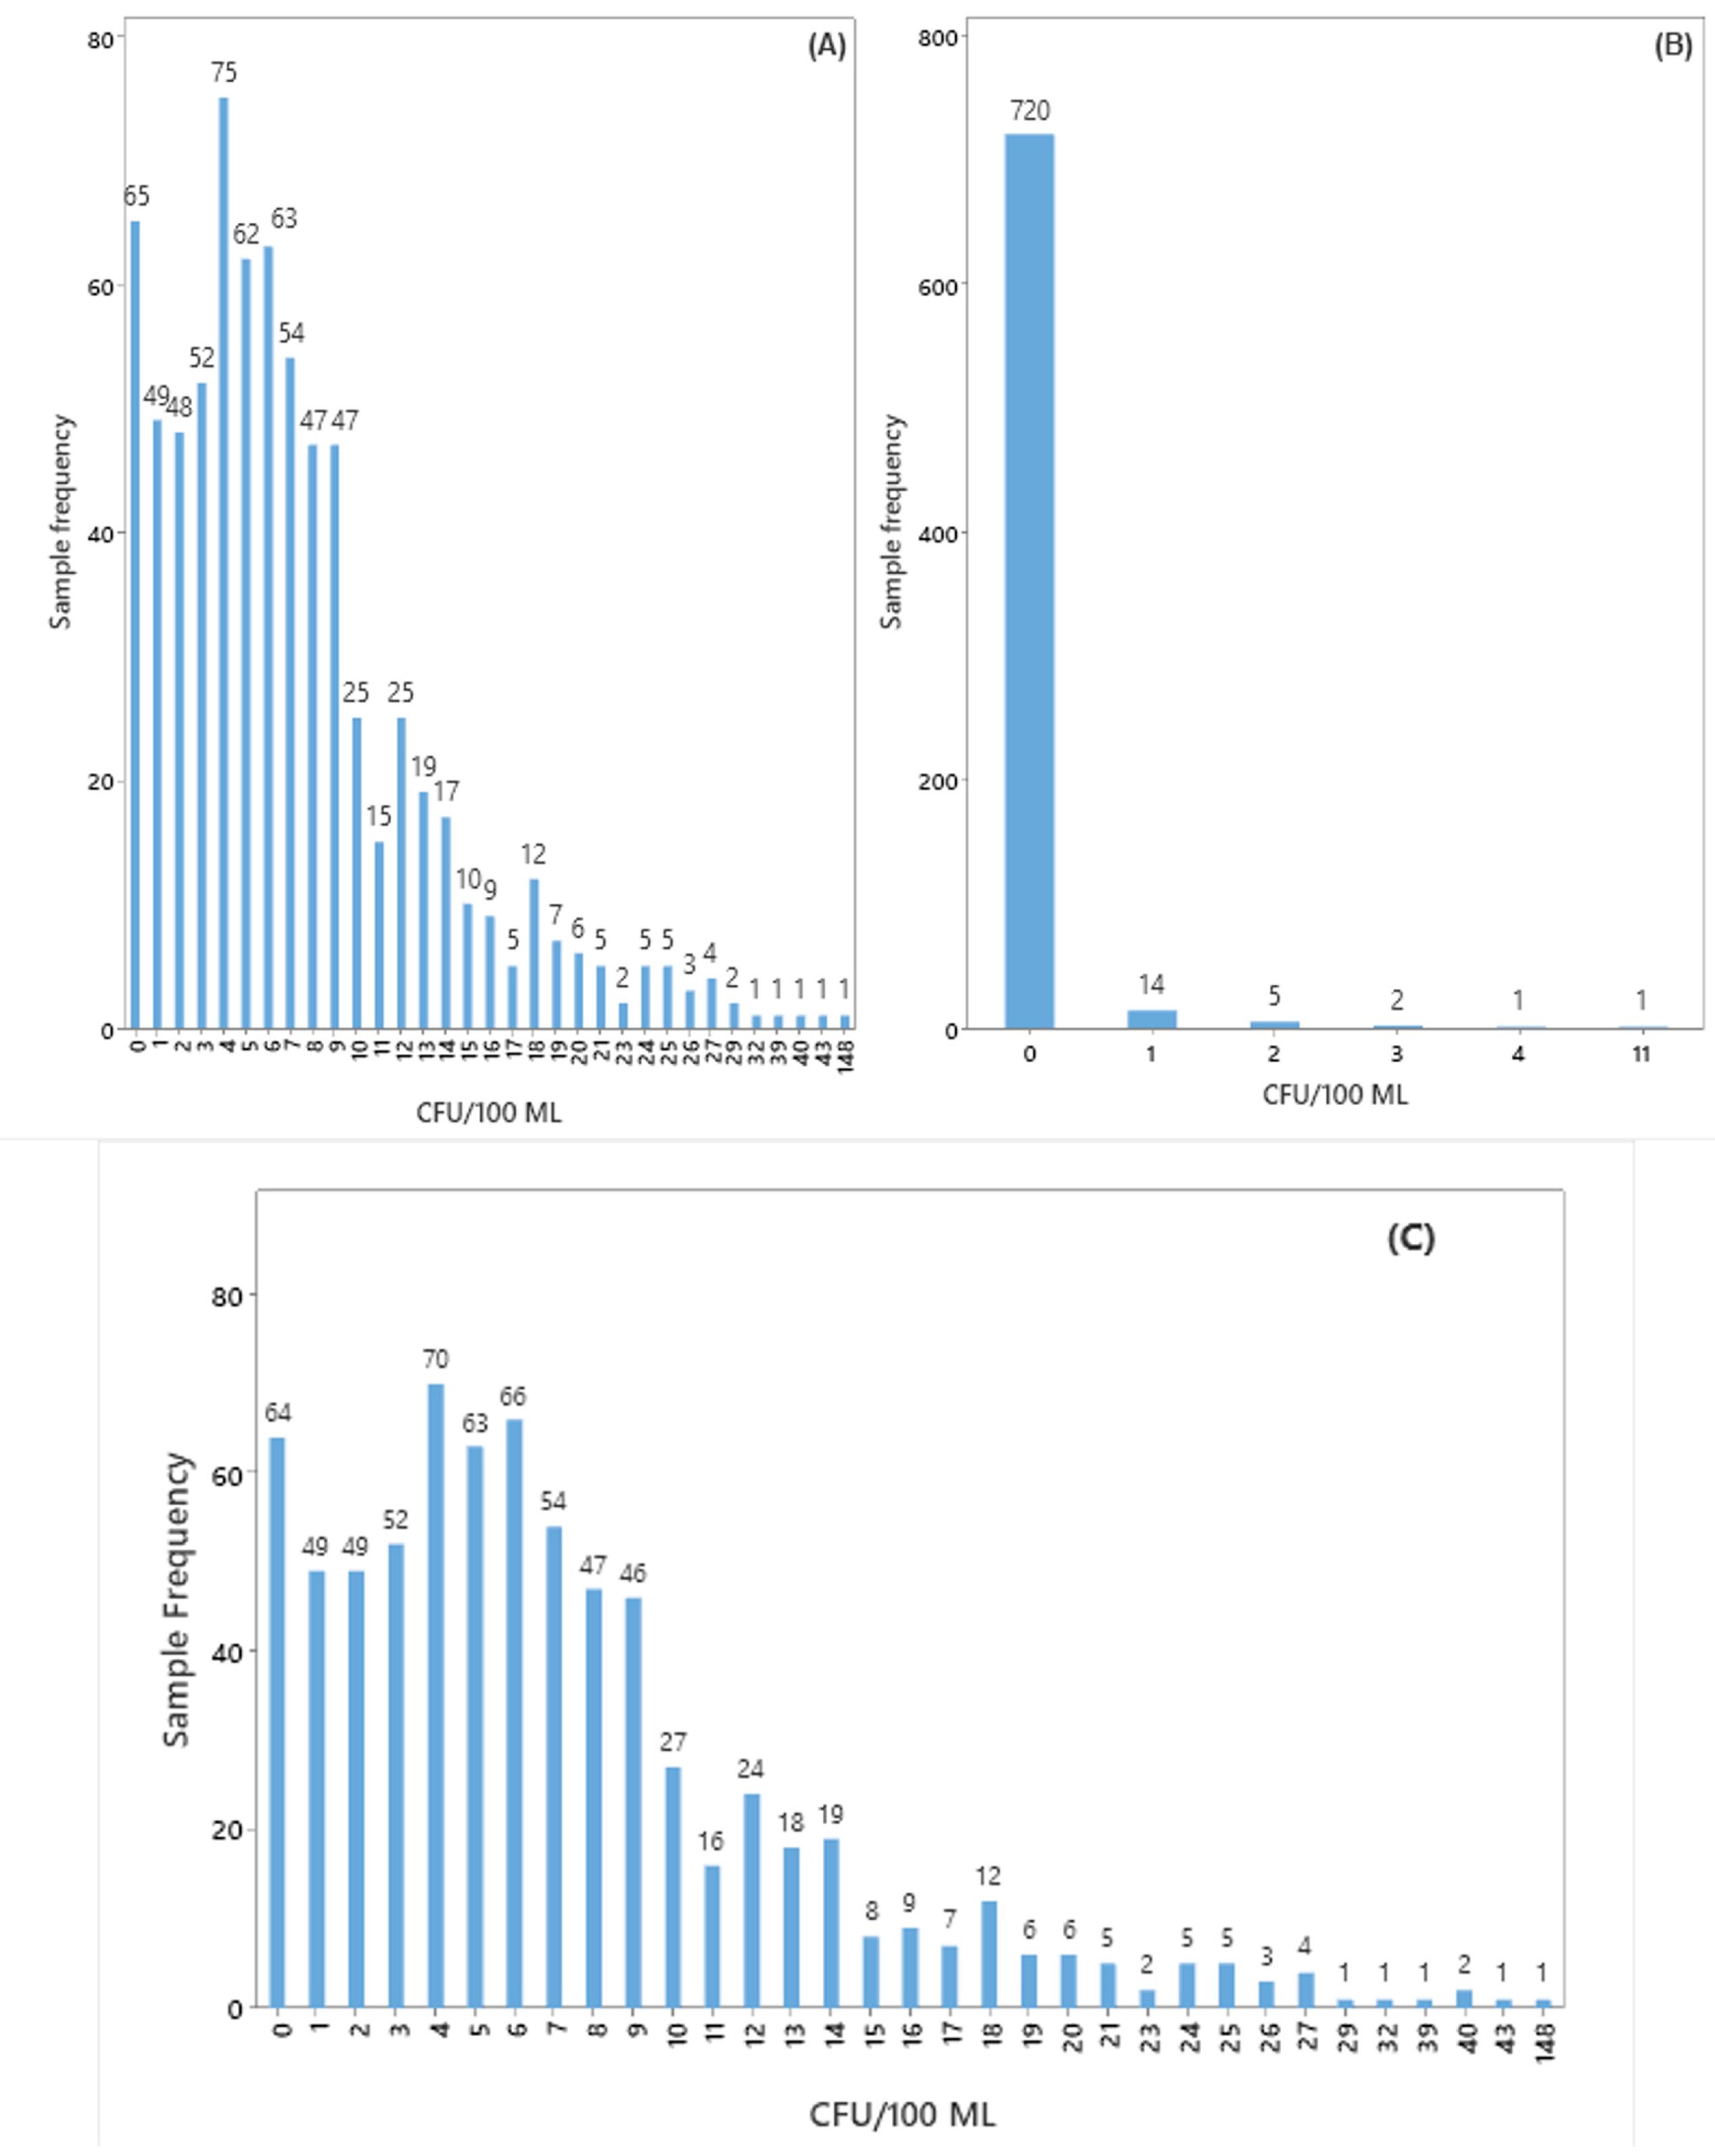
Figure 1. Frequency distribution of colony-forming units (CFU/100 mL) of bacteria (A), fungi and yeast (B), and total count (C), before filtration, of the buffer solution used to formulate the attenuated viral vaccine.
Processes 13 02917 g001
Figure 2. Frequency distribution of colony-forming units (CFU/100 mL) of bacteria (A), fungi and yeast (B), and total count (C), after filtration, of the buffer solution used to formulate the attenuated viral vaccine.
Processes 13 02917 g002
Figure 3. Microorganisms identified in the buffer solution before filtration (A) and after filtration (B), including the quantity of each microorganism identified (CFU/100 mL) in the different batches.
Processes 13 02917 g003
Figure 4. Use of the Laney U control chart for bioburden data obtained from the buffer solution used in the formulation of an attenuated viral vaccine. The data refer to CFU/100 mL, i.e., total count (sum of bacteria, fungi, and yeasts), (A) before filtration (lower control limit = 0, upper control limit = 21.4, and control limit = 7.4) and (B) after filtration (lower control limit = 0, upper control limit = 1.45, and control limit = 0.24) of the buffer solution, respectively.
Processes 13 02917 g004
Figure 5. Use of the Bell control chart for bioburden data obtained from the buffer solution used in the formulation of an attenuated viral vaccine. The data refer to CFU/100 mL, that is, total count [sum of bacteria, fungi, and yeasts] before filtration [lower control limit = −0.8106 (red), upper control limit = 15.567 (red) and control limit = 7.3782 (blue)] (A) and after filtration [lower control limit = −1.2263 (red), upper control limit = 1.7027 (red) and control limit = 0.2382 (blue)] (B) of the buffer solution, respectively. Blue line indicates the average value, black dots indicated values within the control limits, and green dots indicated values above the upper control limits.
Processes 13 02917 g005
Figure 6. Cause-and-Effect Diagram applied to the monitoring of the bioburden of different batches of the buffer solution used in the formulation of an attenuated viral vaccine.
Processes 13 02917 g006
Table 1. Comparative evaluation between Laney’s U control chart and the Bell Distribution Chart.
CriteriaLaney U-ChartBell Distribution Chart
Number of Points743743
Mean (CL)7.387.38
Empirical Dispersion (φ)8.90 (strong overdispersion)(modeled by the dispersion parameter)
σ_z (Laney)1.72
Predicted Variance54.44
Outlier26 (3.5%)6 (0.8%)
Residuals—Minimum−1.58−1.00
Residuals—Median−0.29−0.19
Residuals—Maximum30.0819.06
Shapiro–Wilk (normalidade)p < 0.0001 → rejects normalityp < 0.0001 → rejects normality
Ljung–Box (independence)p < 2.2 × 10⁻¹⁶ → significant autocorrelationp < 2.2 × 10⁻¹⁶ → significant autocorrelation
χ2/gL (Pearson coefficient)8.901.21
MAR (mean standardized residual)1.020.65
AIC (information criterion)4862.1 (compared to Poisson, reference = 6811.1)
Source: Prepared by the author (2025), based on R results (bellreg and base packages).
Table 2. Factors and respective impacts that could contribute to the variability of bioburden data obtained from a buffer solution used in the formulation of an attenuated viral vaccine.
FactorsImpacts
Labor
-
Possible operational conduct errors [unnecessary or accelerated movements] and/or failure to perform clothing and asepsis procedures correctly may release viable particulates originating from the human microbiota;
-
Lack of periodic monitoring of operators’ health [such as regular medical examinations] and consequent introduction of viable particulates originating from human microbiota into all stages of the process;
-
Lack of specific sampling procedure and training, allowing the introduction or reintroduction of microbial load into the solution;
-
Failure or absence of the validation test of the filters used or filter validity not assessed, allowing the initial microbial load to pass into the vaccine;
-
Inadequate storage and/or packaging of samples (temperature, humidity, packaging, and others), which may increase the microbial load;
-
Inadequate cleaning and sanitization after processes, which may cause cross-contamination and/or introduction of microbial load.
Raw materials
-
The raw material could have a high intrinsic bioburden and, as a consequence, the solution may have a high initial bioburden;
-
Failures in the handling and packaging of raw materials can increase the initial bioburden and, consequently, the bioburden of the buffer solution.
Storage and/or packaging of the buffer solution
-
Lack of temperature control during storage and/or packaging of the buffer solution, which may increase the initial load;
-
Failure in the sealing of the buffer solution packaging, allowing the introduction of microbiological contaminants into the solution.
Sanitizing solution
-
Failure in the pre-established concentration and/or sanitizing solution out of date, compromising effectiveness against environmental microbiota and allowing microbiological contaminants to remain;
-
Failure to sterilize the sanitizing solution can introduce microbiological contaminants into the manufacturing area.
Water for injections (WFI)
-
Failure to sterilize the WFI could cause an increase in bioburden and a consequent increase in the microbiological load of the buffer solution.
Cleaning of the preparation room
-
Procedural and/or operational failures in the cleaning process in the preparation room could increase the environmental microbiological load and/or carry microorganisms to the controlled area, leading to contamination of the buffer solution.
Decontamination of materials and utensils
-
Failures in the execution of the decontamination process [steam or oven sterilization] of materials and utensils could introduce a microbiological load through contact with the buffer solution to be produced.
Room pressure
-
Failure in the pressure differential of the environment may allow the entry and/or increase of microbiological particles in the buffer solution production room, material preparation room, or raw material weighing room, which may cause an increase in the bioburden of the environment through cross-contamination and, consequently, cause an increase in the bioburden of the buffer solution.
Relative humidity of the environment
-
An increase in the percentage of ambient humidity may be correlated with an increase in the bioload in the controlled area [mainly in relation to fungi and yeasts] and, consequently, may cause an increase in the bioload in the buffer solution.
Room temperature
-
An increase in the established temperature range of the buffer solution preparation environment may encourage the growth of mesophilic microorganisms in the environment, which could lead to contamination of the buffer solution.
Disclaimer/Publisher’s Note: The statements, opinions and data contained in all publications are solely those of the individual author(s) and contributor(s) and not of MDPI and/or the editor(s). MDPI and/or the editor(s) disclaim responsibility for any injury to people or property resulting from any ideas, methods, instructions or products referred to in the content.