1. Introduction
As an important theory to describe the physical adsorption process of gas on solid [
1], the adsorption potential theory has been widely used in shale gas and coalbed methane adsorption [
1,
2,
3,
4,
5,
6,
7,
8,
9,
10,
11,
12,
13,
14,
15,
16,
17,
18,
19,
20], including the consistency analysis of adsorption characteristic curves [
2,
3,
4,
5,
6,
7], the prediction of isothermal adsorption curves [
8,
9], and the construction of isothermal adsorption curve prediction models [
10,
11,
12,
13,
14], as well as the key parameters of the Dubinin–Radushkevich equation (hereinafter, D-R equation) [
15] and Dubinin–Astakhov equation (hereinafter, D-A equation) [
16], and the adsorption potential is used to fit the isothermal adsorption curve by using D-R and D-A equations, or to improve the equations [
17,
18,
19,
20].
At present, the above research adopts the ideal gas adsorption potential equation [
1,
2,
3,
4,
5,
6,
7,
8,
9,
10,
11,
12,
13,
14,
15,
16,
17,
18,
19,
20], which is derived based on the assumption that the adsorbate is an ideal gas, the adsorption phase is a liquid film, and the adsorption-phase pressure is the saturated vapor pressure of the adsorbate. For shale gas and coalbed methane adsorption, the ideal gas adsorption potential equation is obviously not applicable.
Adsorption-phase pressure is a key parameter to quantitatively characterize the adsorption-phase state and calculate the adsorption potential. For gas adsorption below the critical temperature, the adsorption-phase pressure is the saturated vapor pressure [
21], and above the critical temperature, the saturated vapor pressure is meaningless. Because the adsorbate is not liquefiable, the virtual saturated vapor pressure is often used instead of the saturated vapor pressure [
22,
23,
24]. For shale gas and coalbed methane adsorption [
4,
5,
6,
7,
8,
9,
10,
11], the Dubinin semi-empirical formula is usually used to calculate the virtual saturated vapor pressure [
22,
23,
24]. The Dubinin semi-empirical formula includes the Dubinin formula [
22,
23] and the improved Amankwah formula [
24]. The difference between the two is the value of the index parameter of the reduced temperature; in the Dubinin formula, it is 2, and in the Amankwah formula, it is the unknown parameter K. K is related to the specific adsorption system and has a great influence on the virtual saturated vapor pressure, which in turn affects the accuracy of adsorption potential, the adsorption characteristic curve, and the prediction results of the isothermal adsorption curve. In [
25], the value of K for coal-rock gas adsorption was analyzed by using the consistency of the adsorption characteristic curve. However, because the adsorption potential equation used in [
15] is the ideal gas adsorption potential equation, the results of K still have applicability problems.
In this paper, based on the assumption that the adsorbate is a real gas and the adsorption phase is a compressible gas, the real gas state equation is introduced into the Polanyi adsorption potential definition formula, and the supercritical gas adsorption potential equation is derived. The adsorption-phase pressure in the equation is calculated by the Amankwah formula. The unknown parameter K of the Amankwah formula was optimized. At the same time, the isothermal adsorption experimental data of Bornholm shale were used for practical calculation. The optimal value of K and the adsorption-phase pressure were determined. The difference in adsorption potentials and the adsorption characteristic curves between ideal gas and supercritical gas were discussed, and the simplified equation of supercritical gas adsorption potential was proposed.
2. The Adsorption Potential Theory
2.1. Adsorption Potential Definition Equation
In 1814, de Saussure proposed that the surface of the adsorbent was attractive to the adsorbate. The closer to the surface, the greater the gravity and the density of the adsorbate. In 1914, Euken defined adsorption attraction as adsorption potential. In the same year, Polanyi put forward the theory of adsorption potential [
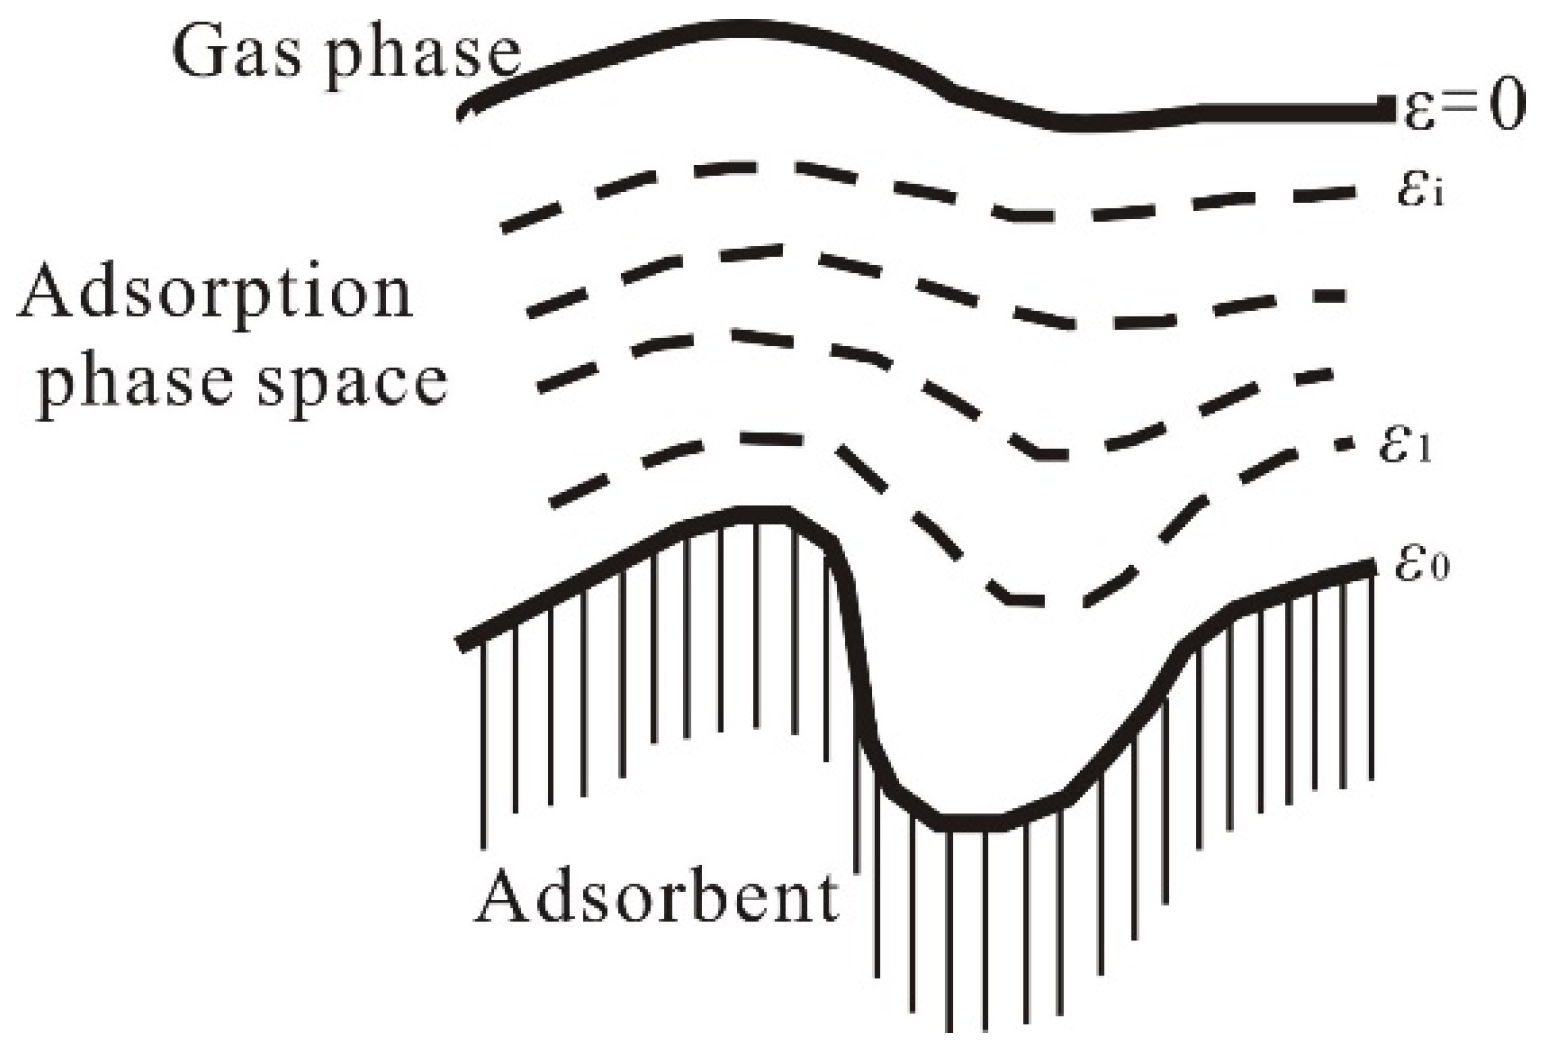
26]. The theory holds that there is an adsorption potential field on the adsorbent surface, in which the points with the same adsorption potential constitute an equipotential surface, and the space between each equipotential surface and the adsorbent surface is the adsorption-phase space (as shown in
Figure 1). Polanyi calculated the adsorption potential for the first time [
27].
Polanyi defined the adsorption potential as the work required to attract 1 mole of gas from the bulk phase to a point
i in the adsorption space [
26,
27,
28], expressed functionally as
where
is the adsorption potential at point
i in the adsorption space (J/mol);
P is the gas-phase pressure (MPa);
is the pressure at point i in the adsorbed phase (MPa);
is the molar volume of the adsorbate (cm
3/mol); and
p denotes the variable of integration (distinguished from the gas-phase pressure
P, MPa). Thus, the adsorption potential theory is a thermodynamic approach that does not involve microscopic mechanisms of adsorption but rather provides a macroscopic description of adsorption equilibrium.
For shale gas and coalbed methane adsorption, if the pressure is assumed to be uniform throughout the adsorption space, then the adsorption potential becomes equal at all points and is written as follows:
where
is the adsorption potential in the adsorption space (J/mol), and
is the adsorbed phase pressure (MPa). Equation (2) represents the definition of adsorption potential adopted in this study.
2.2. Adsorption Potential for Ideal Gases
Assuming that the adsorbed phase is an incompressible liquid film and the adsorbed gas is an ideal gas, the adsorption potential is defined as follows:
The work done when 1 mole of an ideal gas is attracted from the bulk gas phase with a pressure of to the liquid adsorption film with a saturated vapor pressure of P0 under the condition of constant temperature.
The ideal gas state equation (
PVm = R
T) is applicable to the characterization of the molecular behavior of the adsorbate. At the same time, it is considered that during the adsorption process, there is only the work of gas compression and no surface work. Then, the adsorption potential (Equation (2)) can be written as follows [
27]:
where
is the ideal gas adsorption potential (J/mol); R is the universal gas constant (8.314 J/(mol·K));
T is the adsorption equilibrium temperature (K); and
P0 is the saturation vapor pressure (MPa).
If the logarithmic function with base e in Equation (3) is expressed as a logarithmic function with base 10, then Equation (3) can be rewritten as follows:
Equation (4) is briefly referred to as the Polanyi adsorption potential equation. At the same time, Berenyi proposed a semi-empirical formula for calculating the ideal gas adsorption potential [
22]:
where
b is the constant in the van der Waals equation (cm
3/mmol), and is written as follows [
22]:
where
Tcr is the critical temperature (K), and
Pcr is the critical pressure (MPa). Equation (5) is briefly referred to as the Berenyi adsorption potential equation.
In the fields of shale gas and coalbed methane adsorption, the Polanyi adsorption potential equation (Equation (4)) is usually used to calculate the adsorption potential.
2.3. Supercritical Gas Adsorption Potential Equation
In fact, Polanyi believed that when the system temperature (
T) exceeds the critical temperature (
Tc) of the adsorbate, the adsorbed phase is a compressed gas. At the same time, physical adsorption is similar to the process of vapor being compressed. The interaction between the adsorbate molecules in the adsorption space is the same as that in the gas-phase space, and the real gas state equation is still applicable to the characterization of the behavior of the adsorbate molecules [
27].
Assuming the adsorbate is a real gas, the adsorbed phase is a compressed gas, and the adsorbed pressure (
Pa) is uniform throughout the adsorption space, Equation (2) can be transformed using integration by parts to obtain the following:
The Redlich–Kwong equation (abbreviated as the R-K equation) is a highly accurate [
28] and widely applied real gas state equation [
29,
30]. It is written as follows [
31]:
where A and B are constants related to the critical parameters of the gas and are written as follows:
Substituting Equation (8) into Equation (7) yields
Integrating and rearranging Equation (11) yields
Equation (12) represents the adsorption potential equation for supercritical gas established in this study, where is the supercritical gas adsorption potential (J/mol), is the molar volume of the adsorbed phase (cm3/mol), and is the molar volume of the gas phase (cm3/mol).
The molar volumes of both the adsorbed phase and the gas phase are calculated using Equation (8).
2.4. Adsorbed Phase Pressure
Since gases above their critical temperature cannot be liquefied, the unconventional natural gas adsorption field universally adopts either the Dubinin equation [
22,
23] or the modified Amankwah equation [
24] to calculate the pseudo-saturation vapor pressure as a substitute for the saturation vapor pressure.
The Dubinin equation is written as follows:
The Dubinin equation is a semi-empirical formula [
22,
23] proposed under the premise that at the critical temperature, the adsorption potentials obtained by using the Polanyi equation (Equation (4)) and the Berenyi equation (Equation (5)) are equal, and at the same time, the adsorption characteristic curves within different temperature ranges (
T ≥
Tcr and
T ≤
Tcr) are consistent [
22,
23].
Since both the Polanyi equation and the Berenyi equation are established on the assumption that the bulk phase gas is an ideal gas and the adsorbed phase is a liquid film, the Dubinin equation essentially inherits the above assumptions.
Reference [
24] improved the exponential part of the reduced temperature in the Dubinin equation to parameter K and proposed the general form of the Dubinin equation, namely the Amankwah equation, which can be written as follows:
where
is the virtual saturated vapor pressure obtained by using the Amankwah equation (MPa). The value of parameter K is related to the adsorption system.
2.5. Adsorption Characteristic Curve
When the adsorption space increases, the adsorption potential decreases. Therefore, the adsorption potential can be regarded as a function of the adsorption space [
26], which can be expressed as follows:
where
is the volume of the adsorbed phase corresponding to the adsorption potential (cm
3/g).
Polanyi believed that for a specific adsorption system, the functional relationship between the adsorption potential and the adsorption space is independent of temperature. Therefore, the adsorption potential distribution curve represented by Equation (15) is known as the characteristic curve [
27].
The adsorbed phase volume is a key parameter for calculating the adsorption characteristic curve, which is defined as
where
is the adsorbed phase volume (cm
3/g), and
n is the adsorption capacity (mmol/g).
When the adsorbed phase is regarded as a liquid-like film, the molar volume of the adsorbed phase
can be expressed as
where
is the molar volume of the adsorbed phase when the adsorbed phase is regarded as a liquid-like film (cm
3/mol),
is the adsorbate molar mass (g/mol), and
ρal is the adsorbed phase density when the adsorbed phase is regarded as a liquid-like film (g/cm
3).
At this time, the density of the adsorbed phase is calculated by the Ozawa empirical formula method, which is expressed as
where
is the adsorbed phase density (g/cm
3), and
is the boiling point (K). For CH
4,
= 0.424 g/cm
3, and
= 111.65 K. When the adsorbed phase is regarded as a compressible gas, the molar volume of the adsorbed phase
is denoted as
(cm
3/mol). The molar volume of the adsorbed phase
is calculated using the R-K equation (Equation (8)).
3. Isothermal Adsorption Experimental Data and Absolute Adsorption Capacity Correction Method
3.1. Isothermal Adsorption Experimental Data
The isothermal adsorption experimental data of shale used in the case analysis are cited from reference [
32]. The experimental samples are from the Bornholm region in Denmark, briefly referred to as Holm shale. Since the temperatures of common shale/coalbed methane (CH
4) adsorption systems are mostly between 25 and 90 °C (298.15 and 363.15 K) [
1,
2,
3,
4,
5,
6,
7,
8,
9,
10,
11,
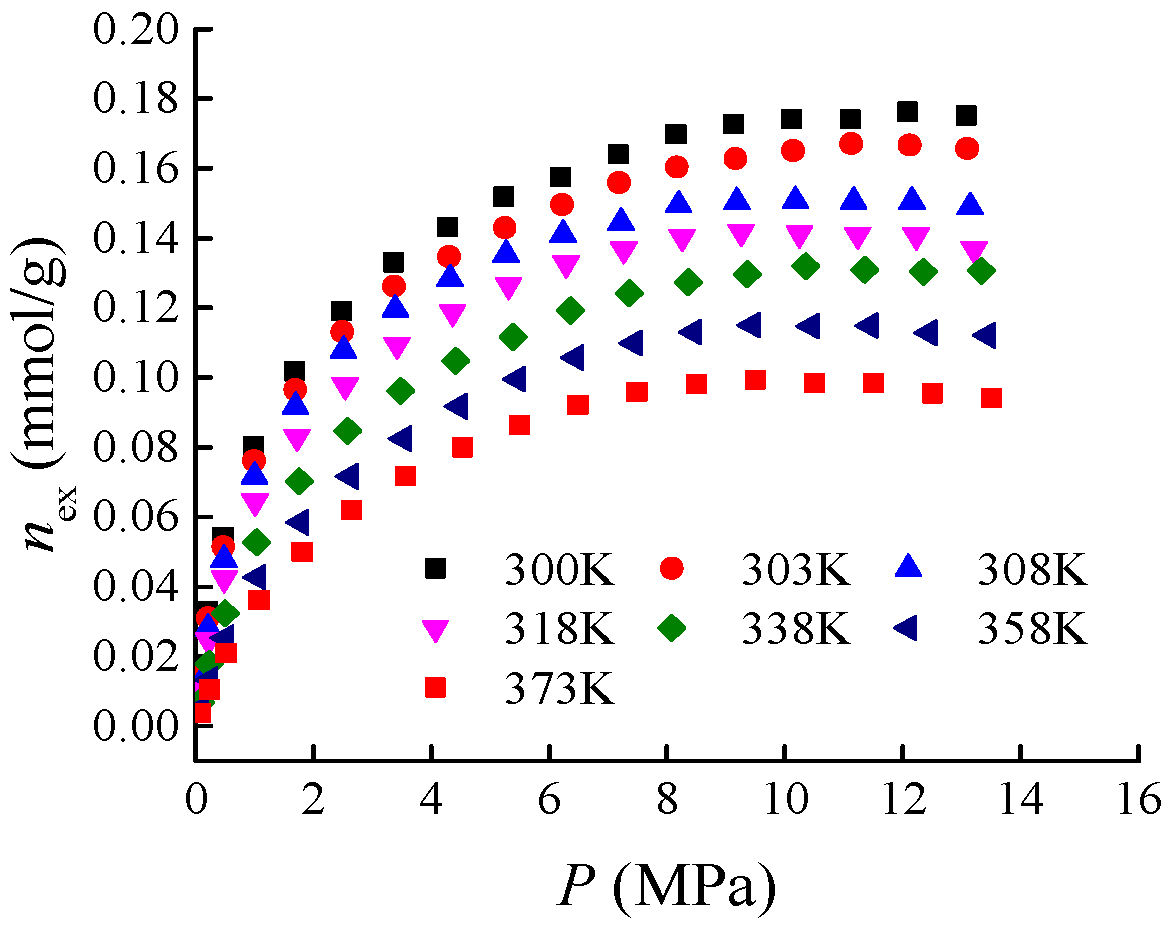
12], the isothermal adsorption experimental data of Holm shale for CH
4 adsorption within the temperature range of 300–373 K (see
Figure 2) are selected for case analysis. Parameters such as the sampling location, mineralogical characteristics, geochemical characteristics, and physical property characteristics of Holm shale, as well as the detailed procedures of the isothermal adsorption experiments, can be found in [
32,
33].
3.2. Correction of Absolute Adsorption Capacity
The isothermal adsorption curve represents the excess adsorption capacity, which cannot reflect the actual adsorption amount. Therefore, it is necessary to convert the excess adsorption capacity into absolute adsorption capacity.
According to the definition of Gibbs adsorption quantity, the relationship between the excess adsorption quantity and the absolute adsorption quantity can be expressed as [
32]
where
nex is excess adsorption capacity (mmol/g),
nab is absolute adsorption capacity (mmol/g),
ρg is gas-phase density (g/cm
3), and
ρa is adsorption-phase density (g/cm
3).
Equation (19) is referred to as the Gibbs adsorption equation. The density of the gas phase is written as follows:
In the equation, Vmg represents the molar volume of the gas phase (cm3/mol), which is calculated using the Redlich–Kwong (R-K) state equation (Equation (8)).
When the adsorbed phase is regarded as a liquid film, the adsorbed phase density is calculated using Ozawa’s empirical formula method (i.e., Equation (18)).
When the adsorbed phase is regarded as a compressed gas, since the molar volume of the adsorbed phase is calculated using the R-K equation, the adsorbed phase density is expressed as
where
is the density of the adsorption phase when the adsorption phase is treated as a compressible gas (g/cm
3).
4. Calculation of Adsorption Potential for Supercritical Gases
In the adsorption potential equation for supercritical gases, the adsorption-phase pressure Pa is calculated using the Amankwah equation (Equation (14)). However, parameter K in the Amankwah equation is an unknown parameter whose value is related to the adsorption system. Therefore, accurately obtaining parameter K has become the key to determining the adsorption-phase pressure, adsorption potential, and adsorption characteristic curve.
For a specific adsorption system, the consistency of adsorption characteristic curves refers to the overlap of adsorption characteristic curves at any temperature in a Cartesian coordinate system with adsorption potential as the ordinate and adsorption-phase volume as the abscissa. The higher the degree of overlap, the better the consistency. Meanwhile, adsorption characteristic curves depend on the nature of the adsorbent and adsorbate themselves and are independent of conditional factors such as temperature and pressure. Therefore, the adsorption characteristic curves can be used to predict the isothermal adsorption curves of the system at any temperature.
Based on the above characteristics, the author proposes to use the consistency of adsorption characteristic curves to determine the candidate interval of parameter K and then screen out the optimal K value via the accuracy of the isothermal adsorption curve prediction results based on the adsorption characteristic curves.
4.1. Determination of Candidate Interval for Parameter K Based on Consistency of Adsorption Characteristic Curves
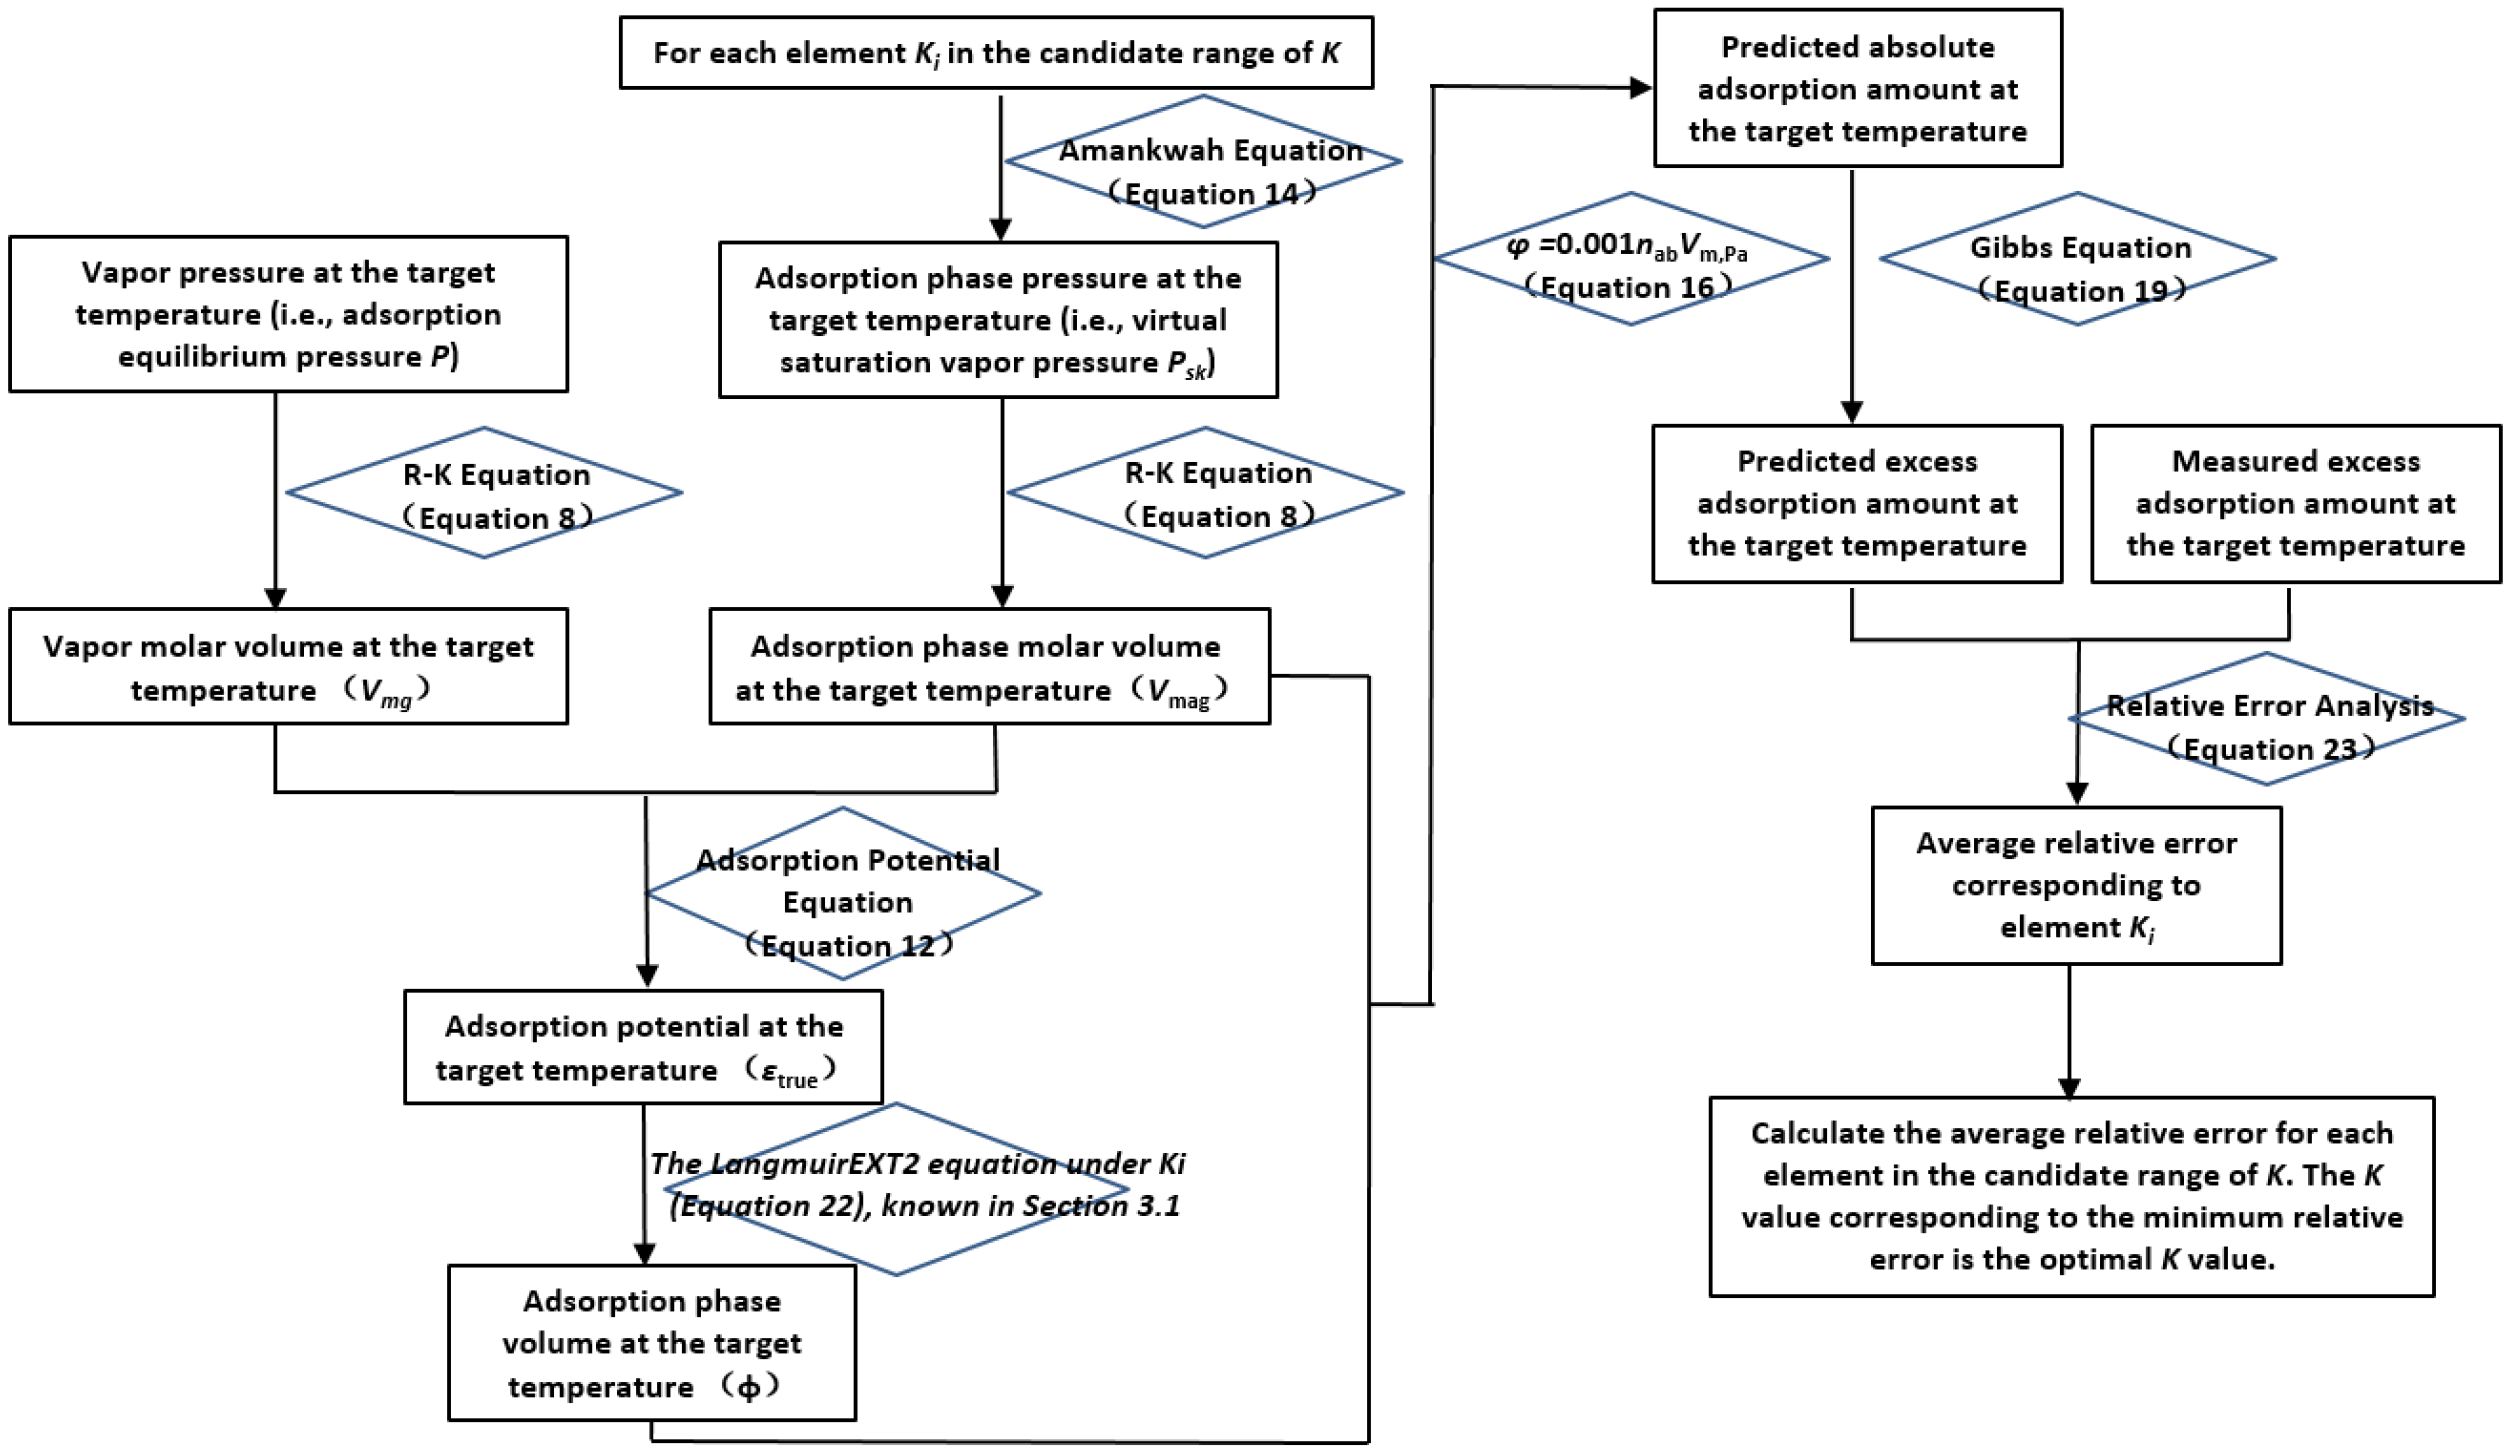
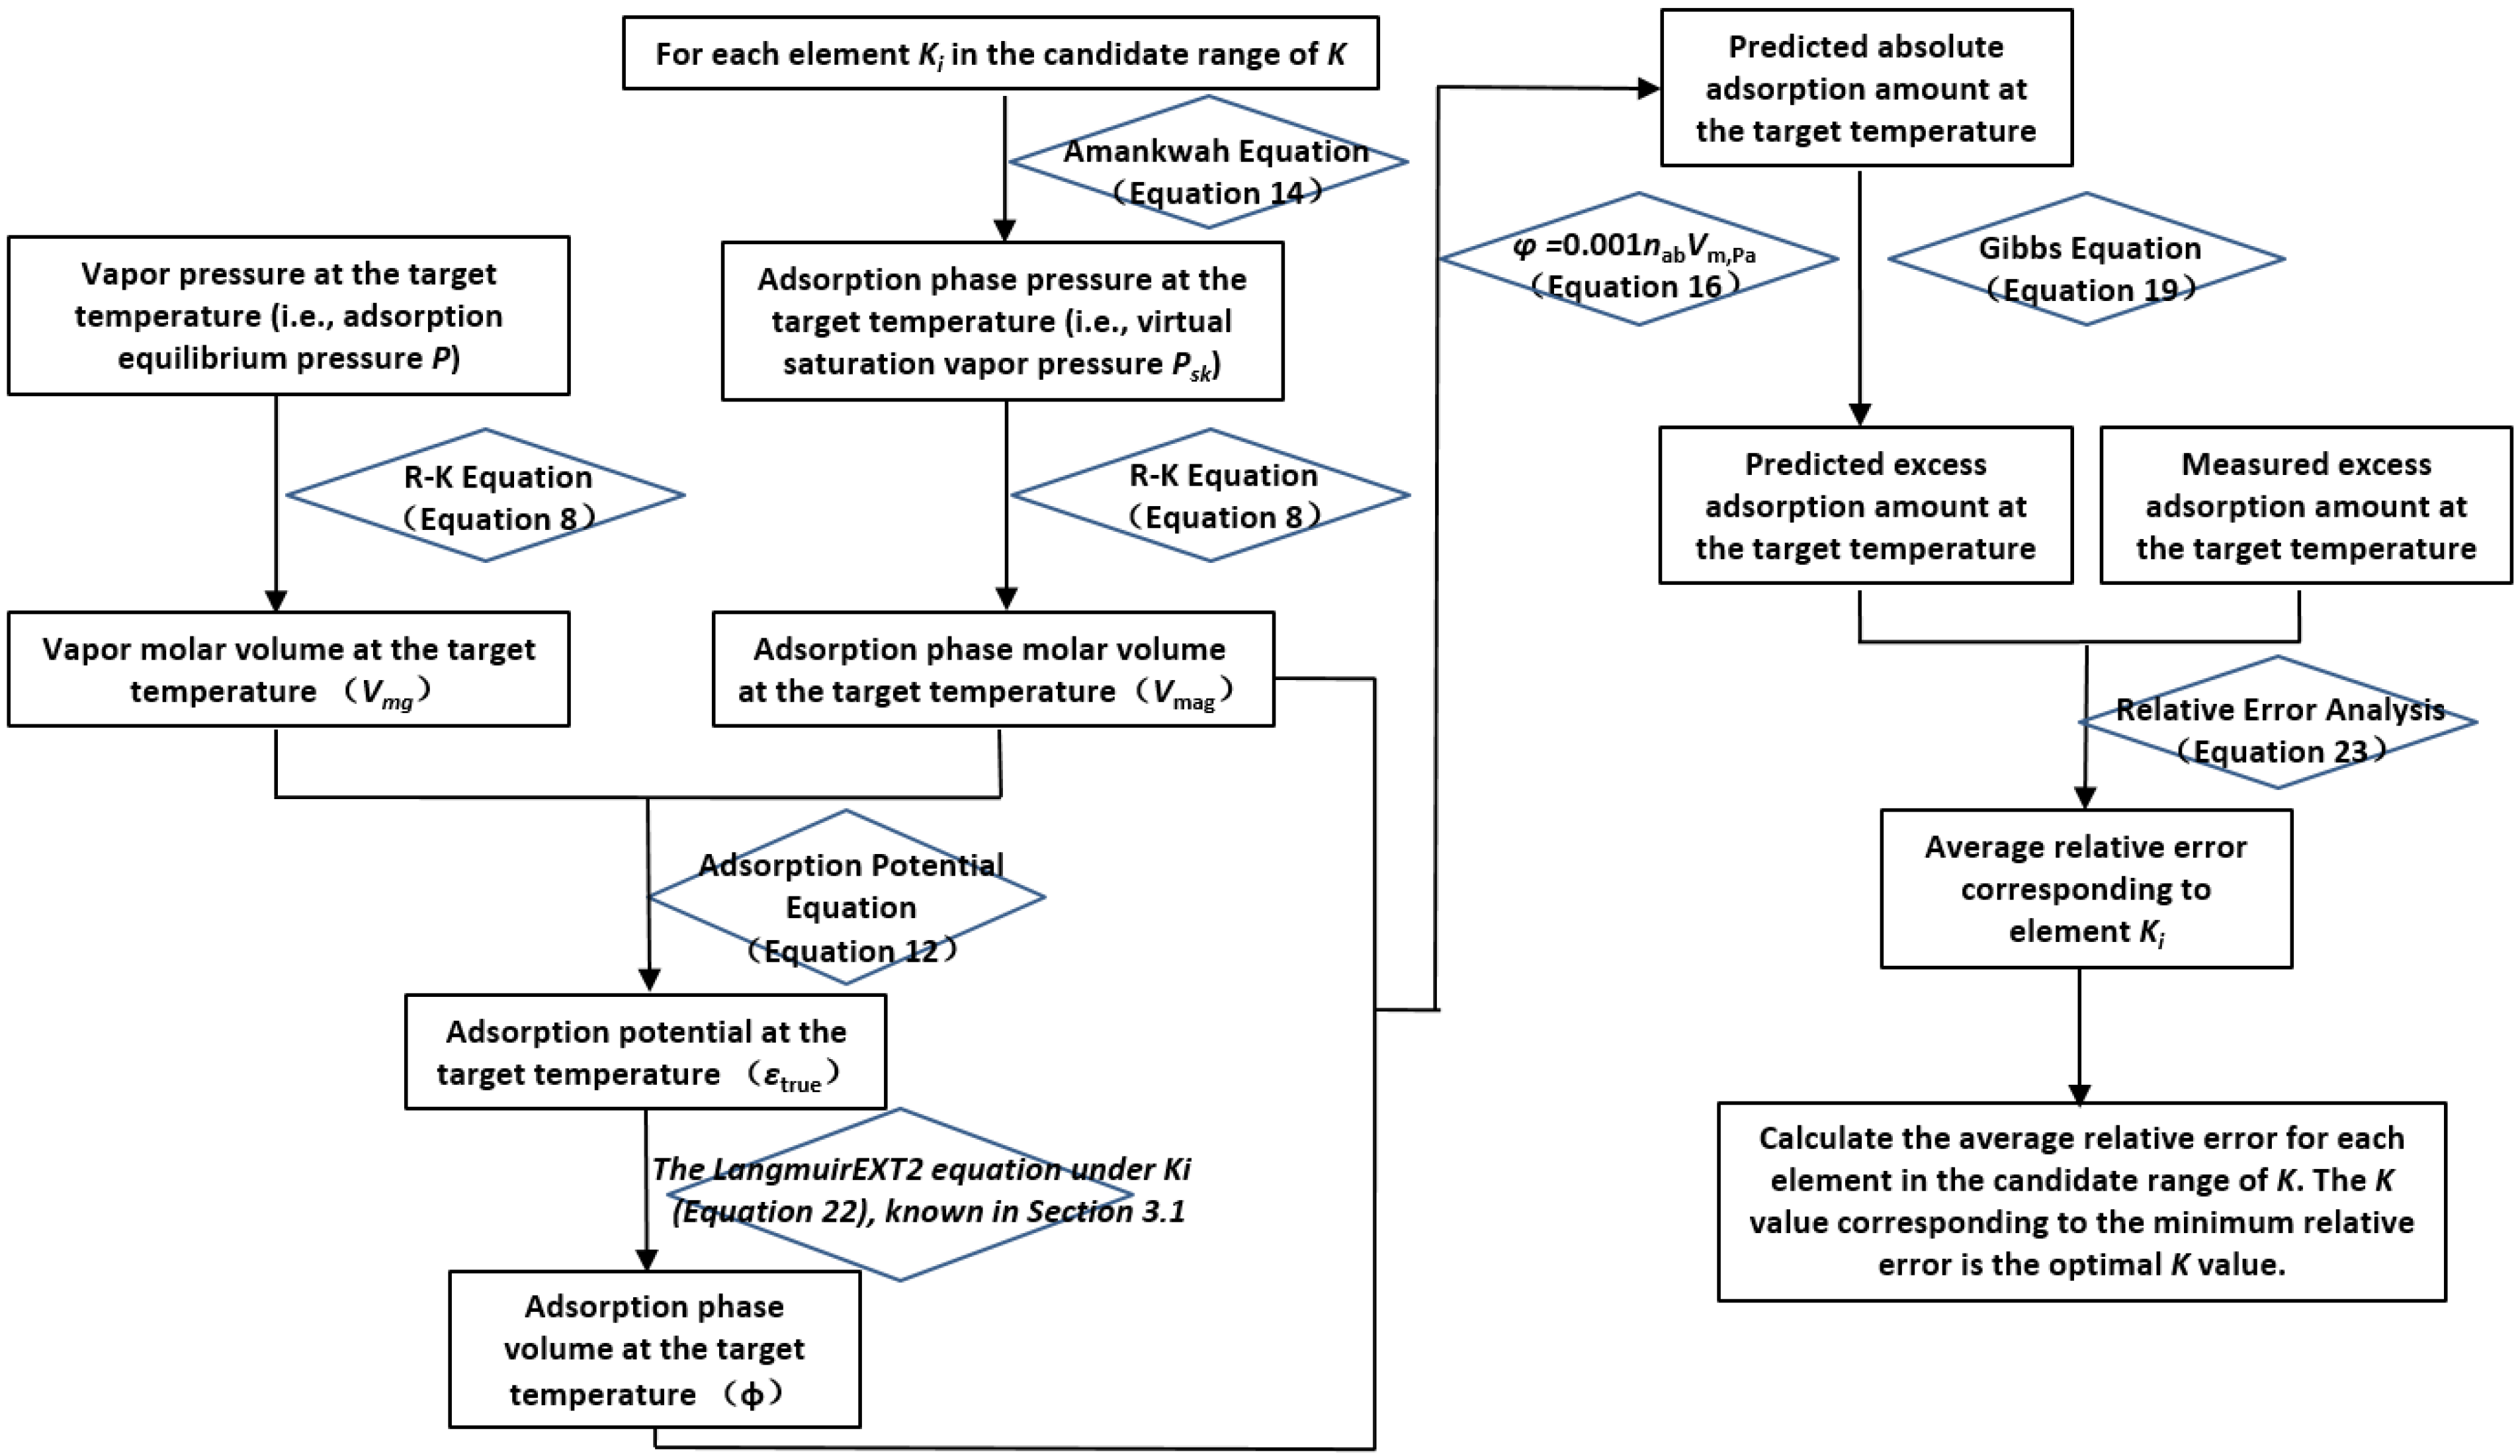
The calculation process for determining the candidate interval of K values is illustrated in
Figure 3.
First, the initial interval for K values is preset. Using the K values within this interval, the adsorption-phase pressure () is calculated via the Amankwa equation (Equation (14)), followed by the computation of the adsorption-phase molar volume () using the Redlich–Kwong (R-K) equation (Equation (8)). Simultaneously, the gas-phase molar volume () is calculated using the gas-phase pressure (P) and the R-K equation (Equation (8)). Subsequently, the supercritical gas adsorption potential (εtrue) is derived by combining and with the supercritical gas adsorption potential equation (Equation (12)).
Next, the adsorption-phase density () is obtained using and Equation (21). This, along with the gas-phase density (ρg), is applied to the Gibbs adsorption equation (Equation (19)) to convert the excess adsorption amount (nex) into the absolute adsorption amount (nab). The adsorption-phase volume (φ) is then calculated using Vmag and nab via Equation (16). This allows the adsorption characteristic curve (εtrue-φ) to be generated.
Finally, the εtrue-φ curve is fitted using the LangmuirEXT2 equation (Equation (22)). If the correlation coefficient R2 ≥ 0.98 and the adsorption-phase volume (φ) is not less than or equal to 0, the selected K value is considered to fall within the candidate interval. Otherwise, the K value is redefined, and the above calculations are repeated until all elements within the initial K-value interval have been evaluated.
The LangmuirEXT2 equation is written as follows:
where
a,
b, and
c are fitting parameters that are dimensionless.
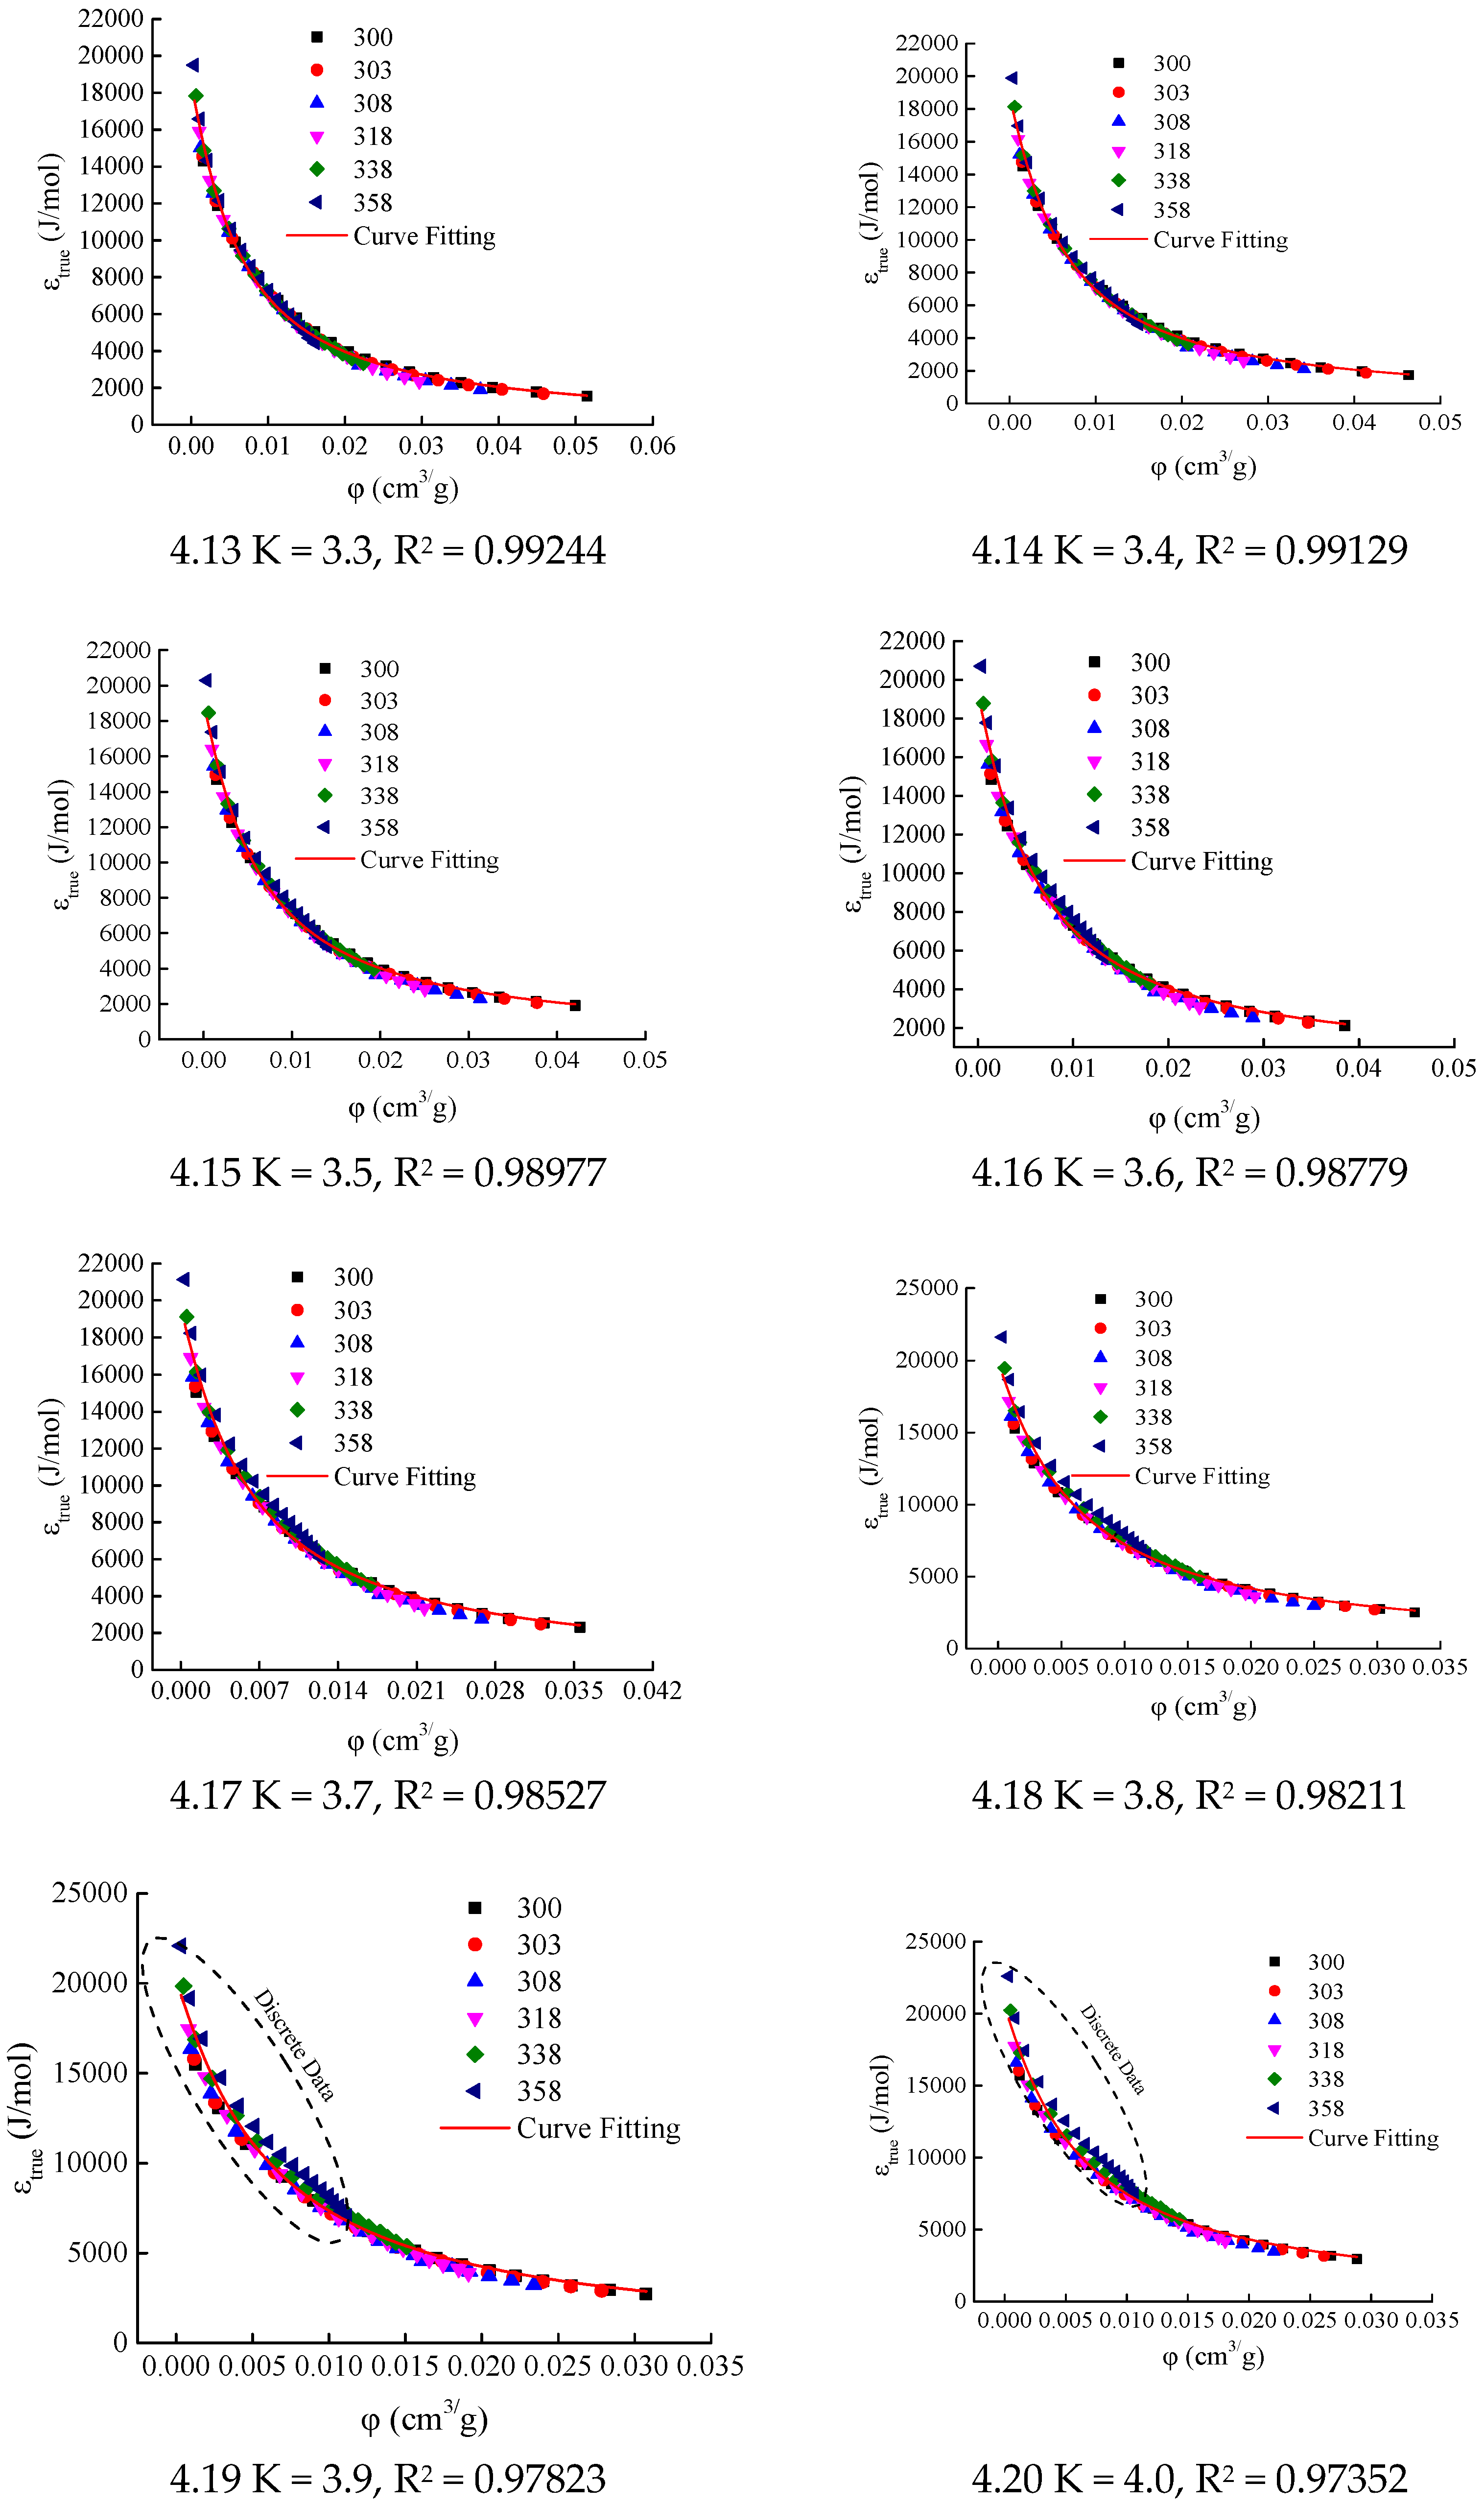
In this study, the excess adsorption isotherms of Holm shale at temperatures of 300 K, 303 K, 308 K, 318 K, 338 K, and 358 K (see
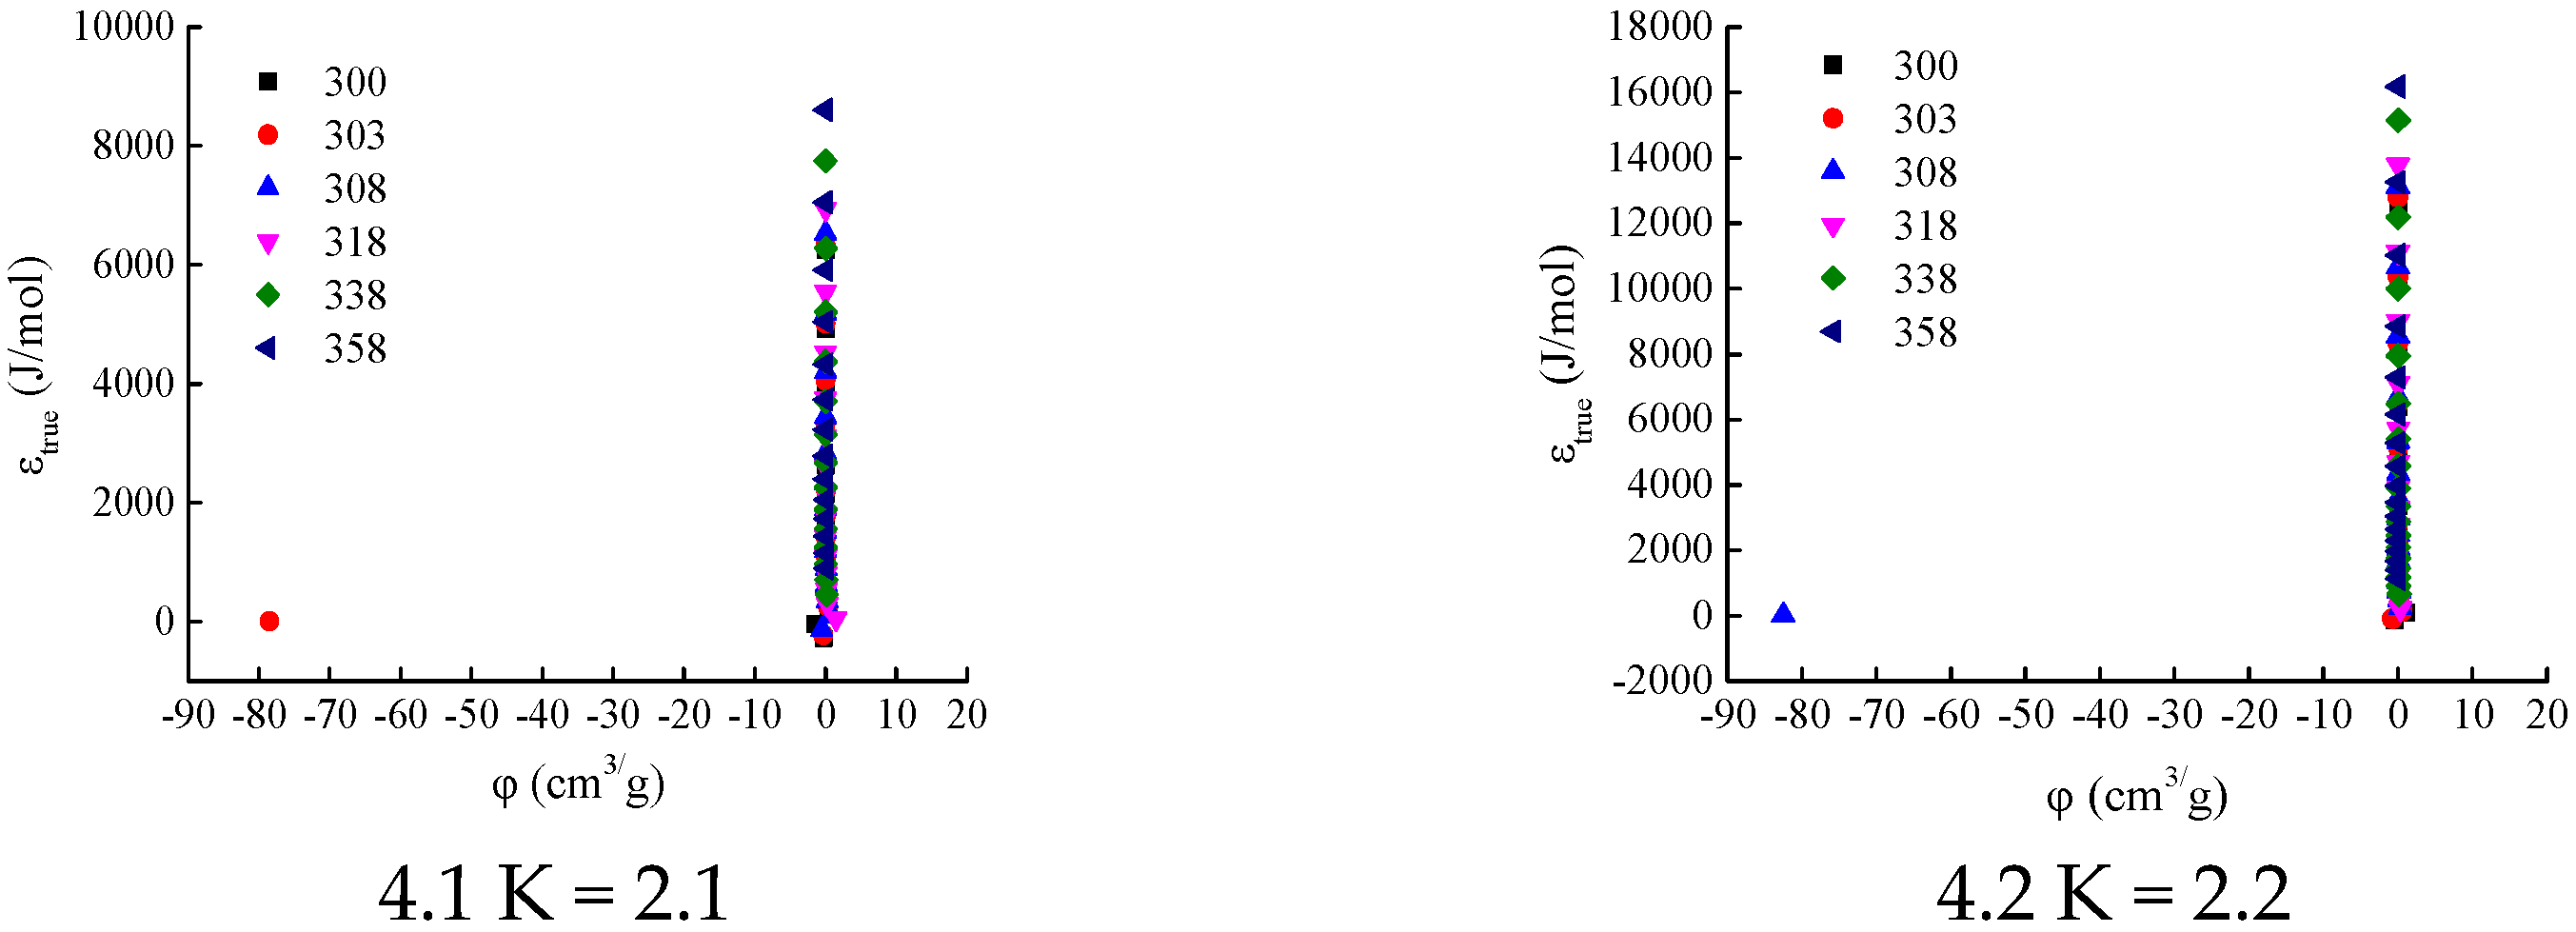
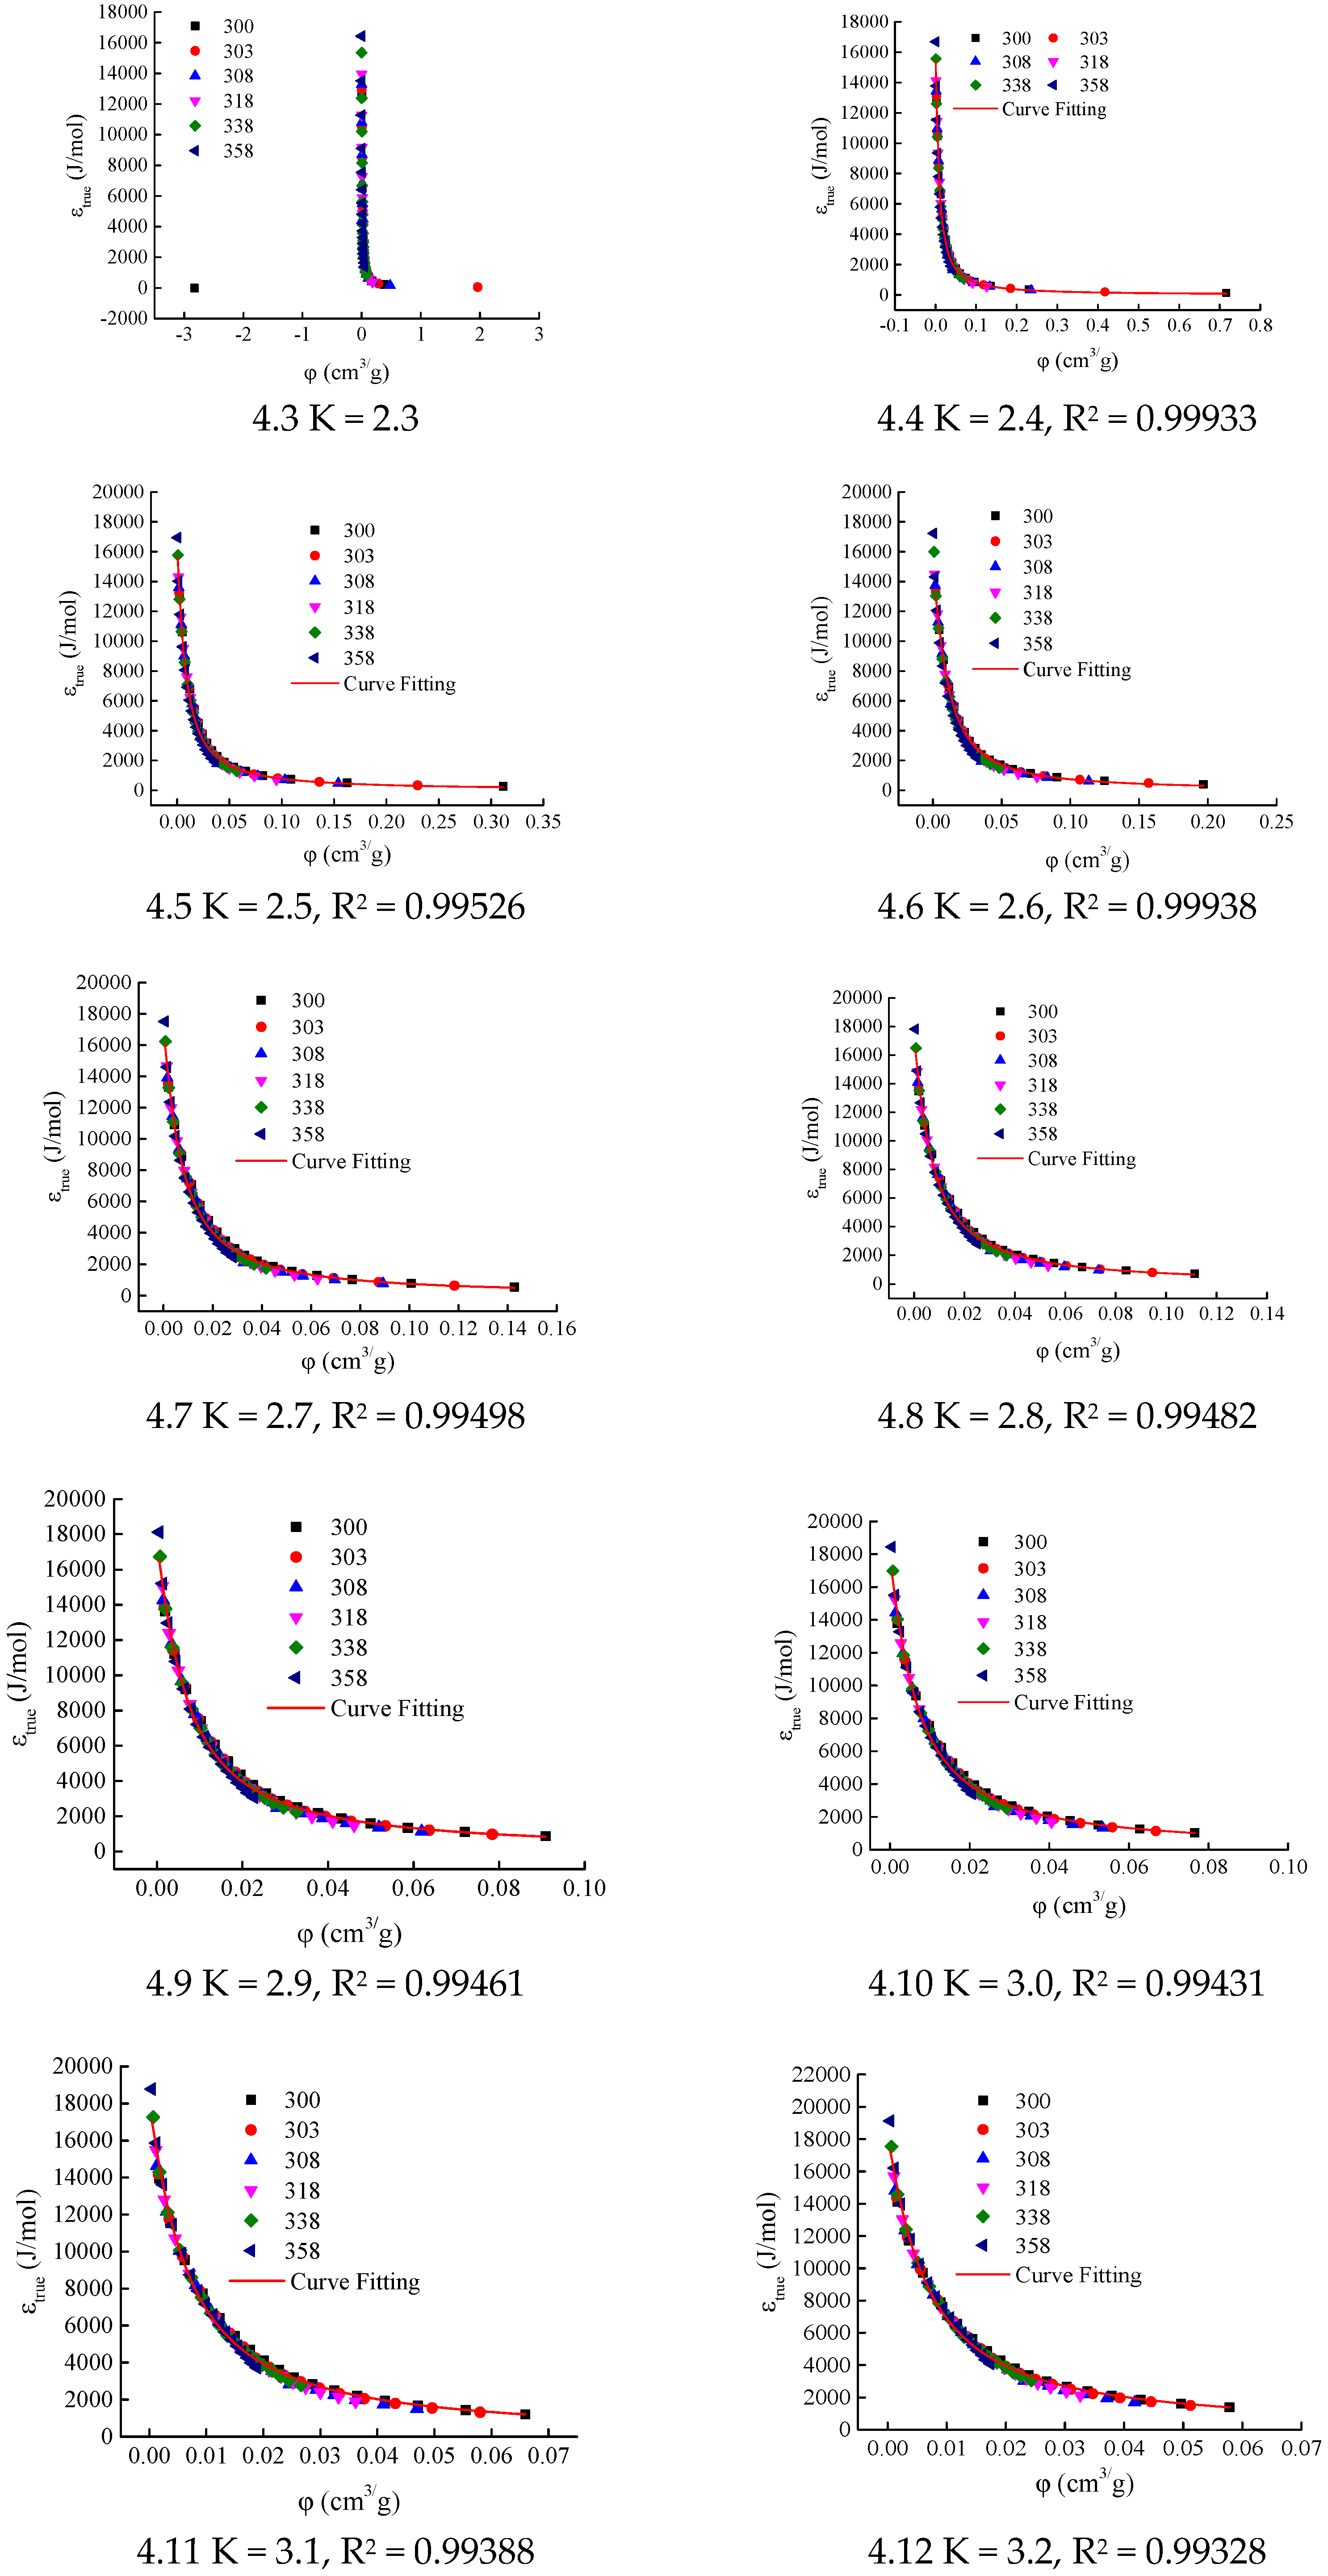
Figure 2) were used to calculate the adsorption characteristic curves for different K values. The initial interval for the K value was set as [2.1, 4.0], with an increment of 0.1. The calculation results are shown in
Figure 4.
When K = 2.1, 2.2, and 2.3, the adsorption-phase volume
φ at certain temperatures (300 K, 303 K, and 308 K) is negative (see
Figure 4(4.1–4.3)). Since the adsorption-phase volume cannot be negative under any temperature and pressure conditions, the values of K do not fall within the range of 2.1–2.3.
When K ∈ [2.4, 3.8], the correlation coefficients R
2 of the LangmuirEXT2 equation fitting for the adsorption characteristic curves all exceed 0.98 (see
Table 1 and
Figure 4(4.3–4.17)), meeting the consistency requirements for the adsorption characteristic curves. When parameter K takes values of 3.9 and 4.0, respectively, the data appears to be scattered in the range where the adsorption-phase volume is less than 0.1 cm
3/g (see
Figure 4(4.19,4.20)). This leads to a decrease in the correlation coefficients of the LangmuirEXT2 equation fitting, with values of 0.97823 and 0.97352, respectively. Therefore, the candidate interval for parameter K is determined to be [2.4, 3.8].
For any adsorption system that reaches an adsorption equilibrium state under arbitrary temperature and pressure conditions, the adsorption-phase state (including adsorption-phase pressure, adsorption-phase volume, and adsorption capacity) must be unique, and the adsorption characteristic curve and the corresponding parameter K value should be unique. However, for a parameter K value within the candidate interval [2.4, 3.8], the fitting correlation coefficients of the functional equation (Equation (22)) for the adsorption characteristic curves of CH4 adsorption on Holm shale all exceed 0.98. Therefore, it is difficult to determine a unique parameter K value solely based on the consistency of the adsorption characteristic curves.
4.2. Determination of Optimal K Value Based on Accuracy of Isothermal Adsorption Curve Prediction Results
The process for determining the optimal K value is shown in
Figure 5. Using the elements (K
i) within the candidate interval of the K value derived in
Section 3.1, and combining the adsorption equilibrium temperature and gas-phase pressure (
) of the excess adsorption curve to be predicted, the molar volume of the gas phase (
), molar volume of the adsorbed phase (
), adsorption potential (
εtrue), and adsorbed phase volume (
φ) at the target temperature are sequentially calculated. Subsequently, the predicted value of the excess adsorption quantity at this temperature is computed by using Equation (16) and Equation (19).
Meanwhile, the average relative error (Equation (23)) is used to quantitatively evaluate the error between the predicted value and experimental value of the excess adsorption quantity. The above calculations are repeated for all elements in the candidate interval of the K value, and the K value corresponding to the minimum average relative error is defined as the optimal K value for the adsorption system.
The average relative error is expressed as follows:
where
is the average relative error (%),
is the predicted value of the excess adsorption capacity (mmol/g),
is the measured value of the excess adsorption capacity (mmol/g), and
N is the number of data points in the excess adsorption capacity curve (dimensionless).
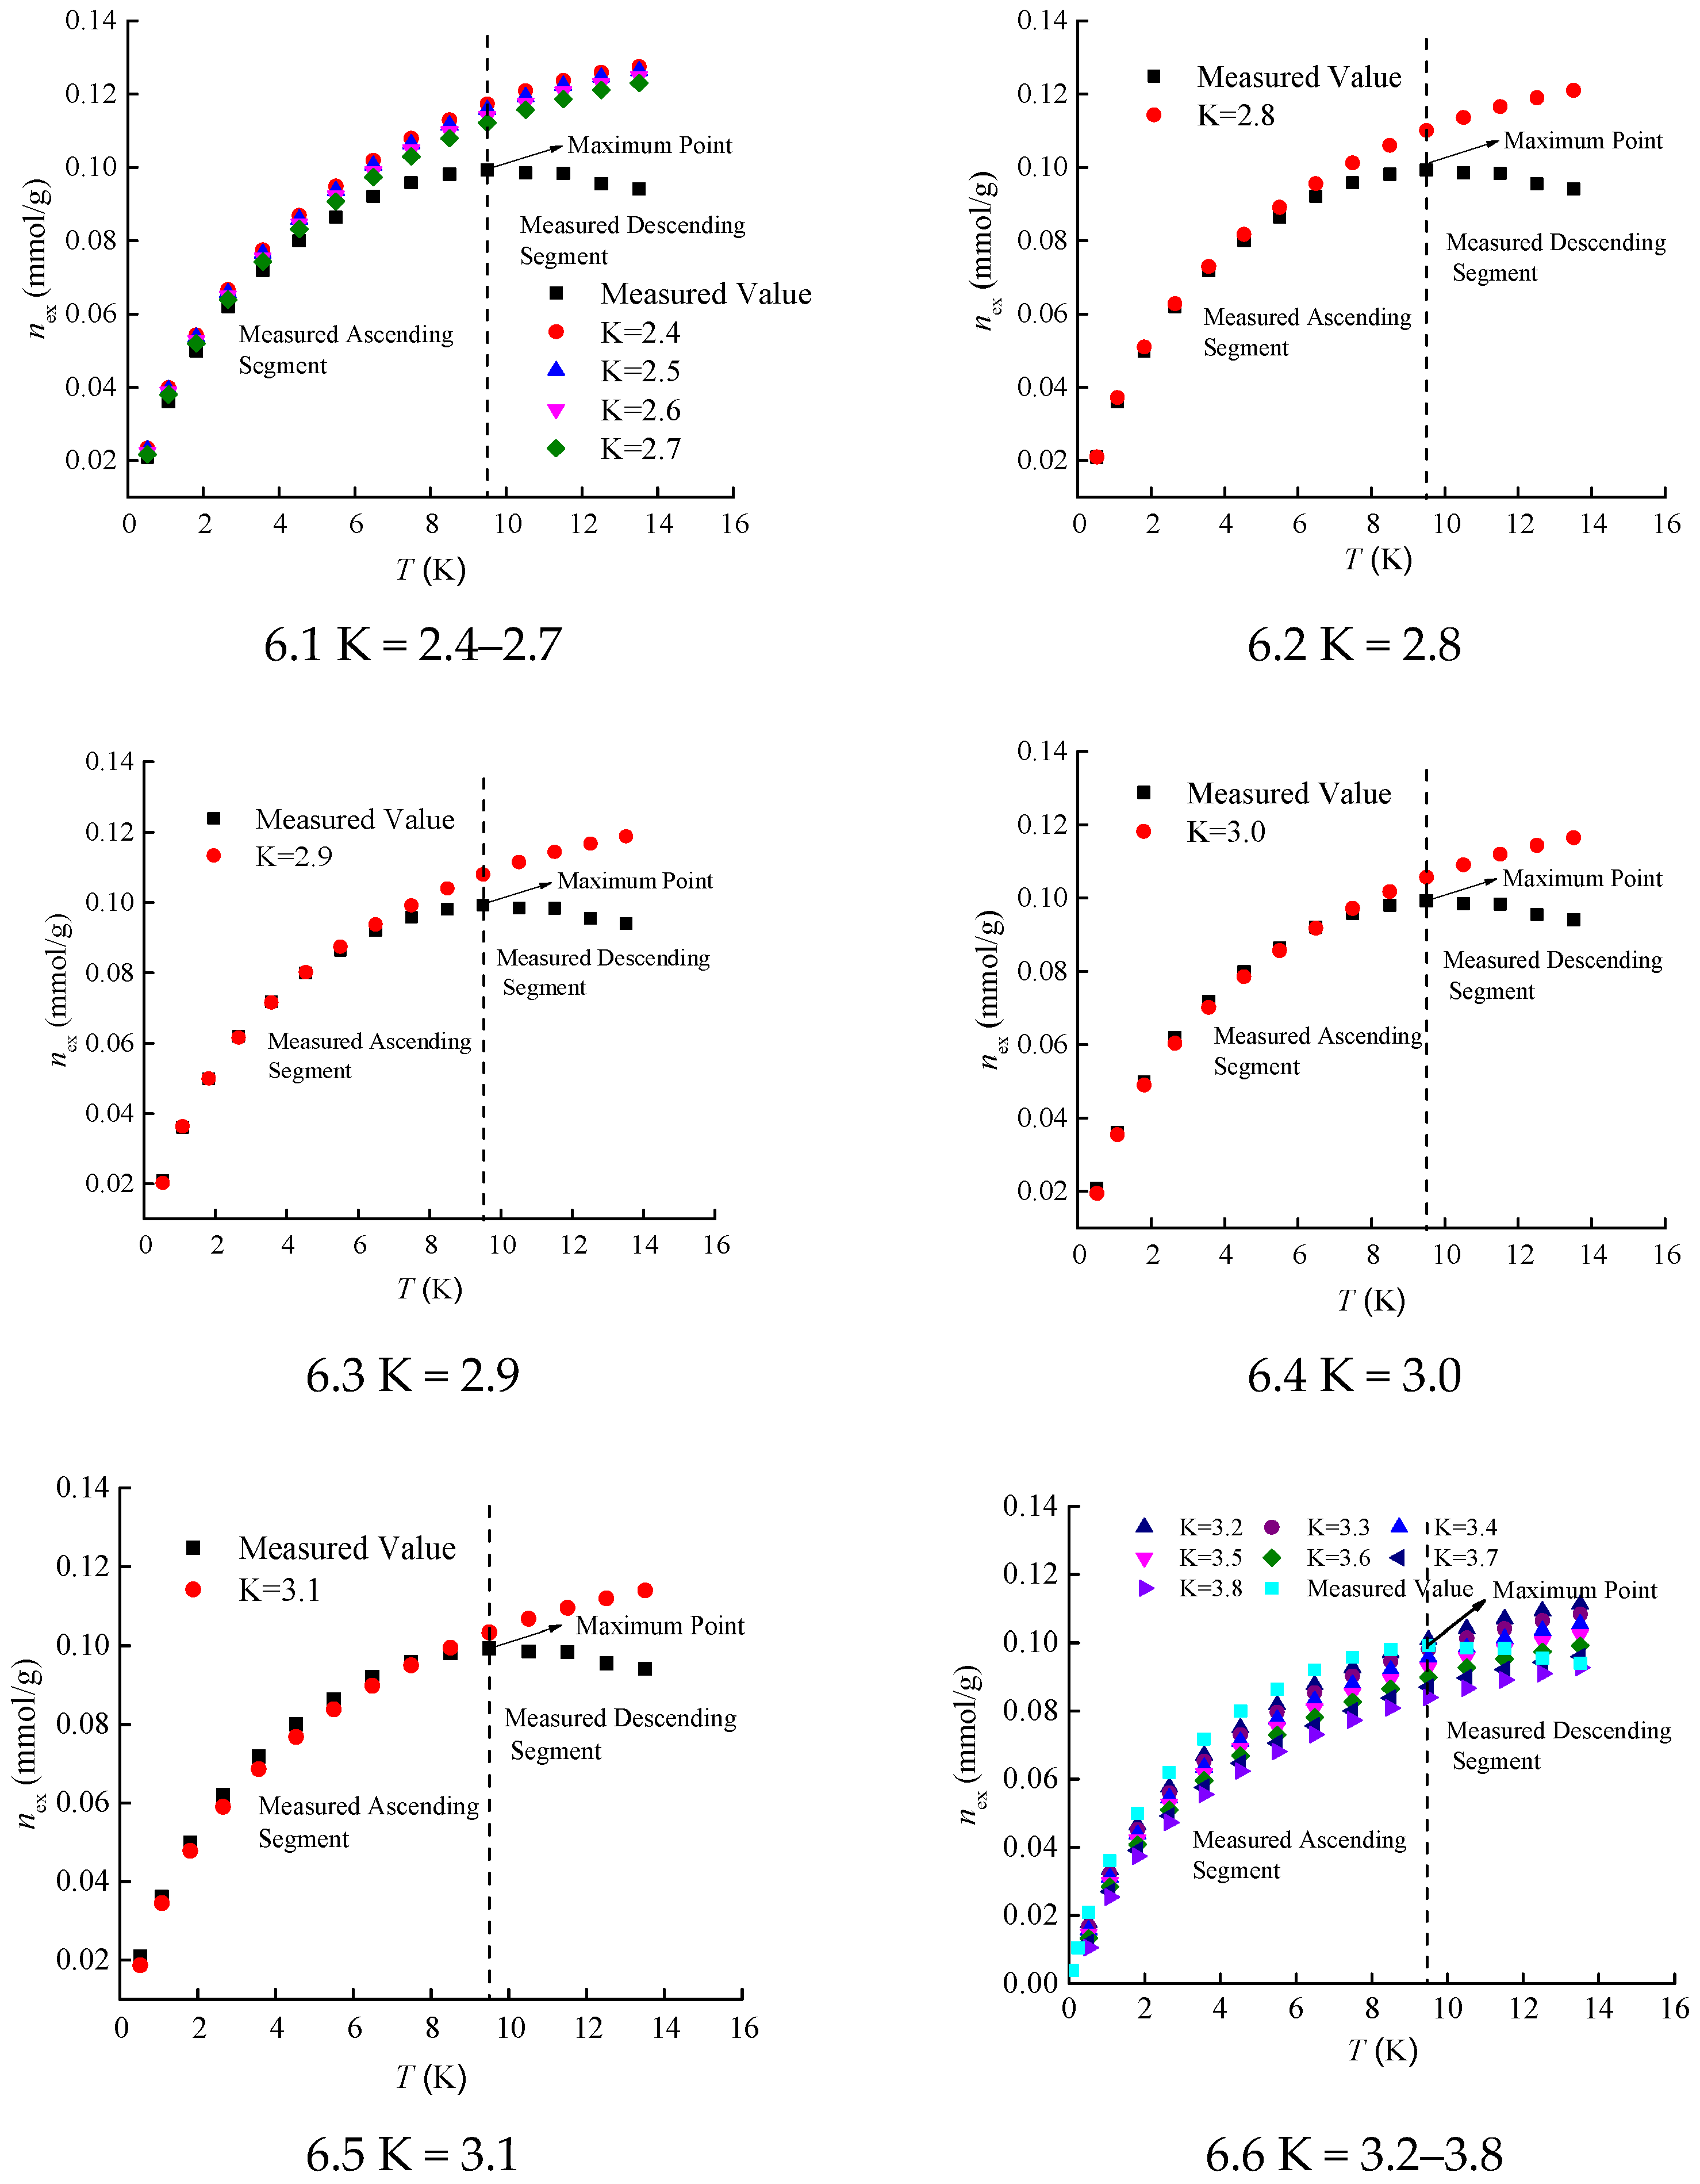
In this paper, the isothermal adsorption curve of Holm shale at a temperature of 373 K is taken as the curve to be predicted (as shown in
Figure 2). Using all elements within the candidate interval [2.4, 3.8] of the K value analyzed in
Section 3.1, sequential predictions of the isothermal adsorption curve were carried out, and the prediction results are shown in
Figure 6.
The results indicate that for any K value, the predicted values of excess adsorption capacity always maintain a monotonically increasing curve shape. However, the measured values of excess adsorption capacity for Holm shale exhibit a maximum at a pressure of 9.5 MPa. The non-monotonic change in the excess adsorption capacity curve under supercritical conditions is an essential feature of supercritical fluid adsorption. The isothermal adsorption curve prediction method based on adsorption characteristic curves cannot effectively predict the descending segment of the excess adsorption capacity curve, which is related to the characteristics of the adsorption characteristic curve and its fitting function. Nevertheless, it can effectively fit the ascending segment of the excess adsorption capacity curve.
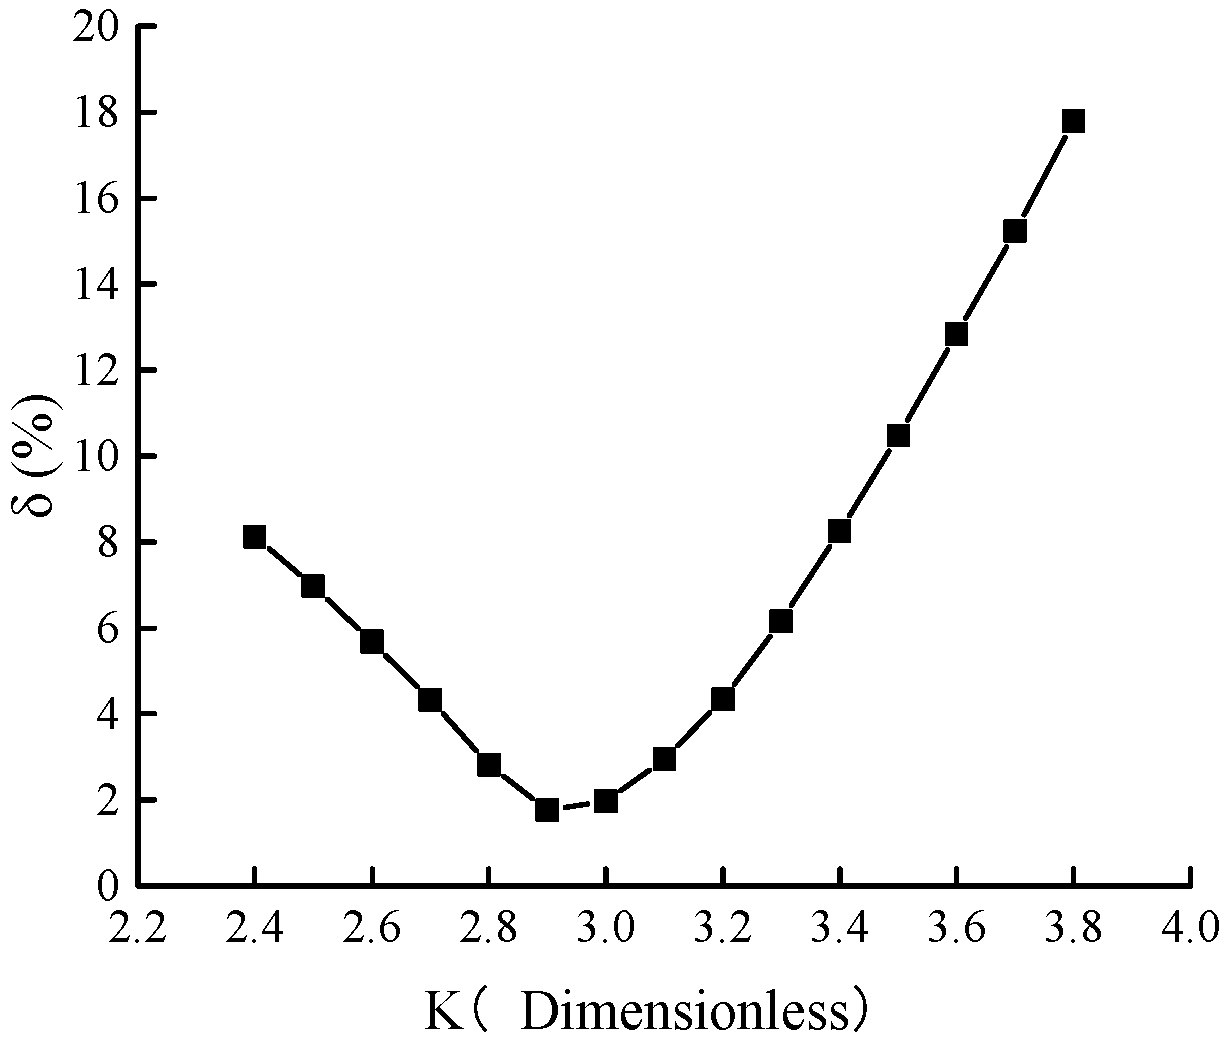
The pressure range of the ascending segment of the excess adsorption capacity curve for Holm shale at 373 K is from 0 to 9.5 MPa. Calculations show the relative errors between the predicted and measured values of the ascending segment under different K values, as presented in
Figure 7. As K increases from 2.4 to 3.8, the relative error generally decreases first and then increases: it drops from 8.12% at K = 2.4 to 1.77% at K = 2.9, before rising to 17.79% at K = 3.8. The highest prediction accuracy for the excess adsorption capacity curve occurs at K = 2.9.
Therefore, for the adsorption of CH4 by Holm shale, when parameter K is set to 2.9, it can simultaneously satisfy the requirements of consistency in the adsorption characteristic curve and accuracy in the prediction results of the ascending segment of the isothermal adsorption curve. Thus, the optimal value of K is 2.9.
4.3. Adsorption-Phase Pressure, Adsorption Potential, and Adsorption Characteristic Curve of CH4 Adsorbed on Holm Shale
Through the above research, the optimal K value of the CH4 adsorption system of the Holm shale is determined to be 2.9. Therefore, the adsorption-phase pressure of the system can be obtained by using the Amankwah equation (Equation (14)) (see
Figure 8). The adsorption potential is obtained by using the supercritical gas adsorption potential equation (Equation (12)) (see
Figure 9), and then the adsorption characteristic curve is obtained by combining the adsorption-phase volume (Equation (16)) (see
Figure 4(4.9)).
The adsorption-phase pressure curve of the Holm shale–CH
4 adsorption system is shown in
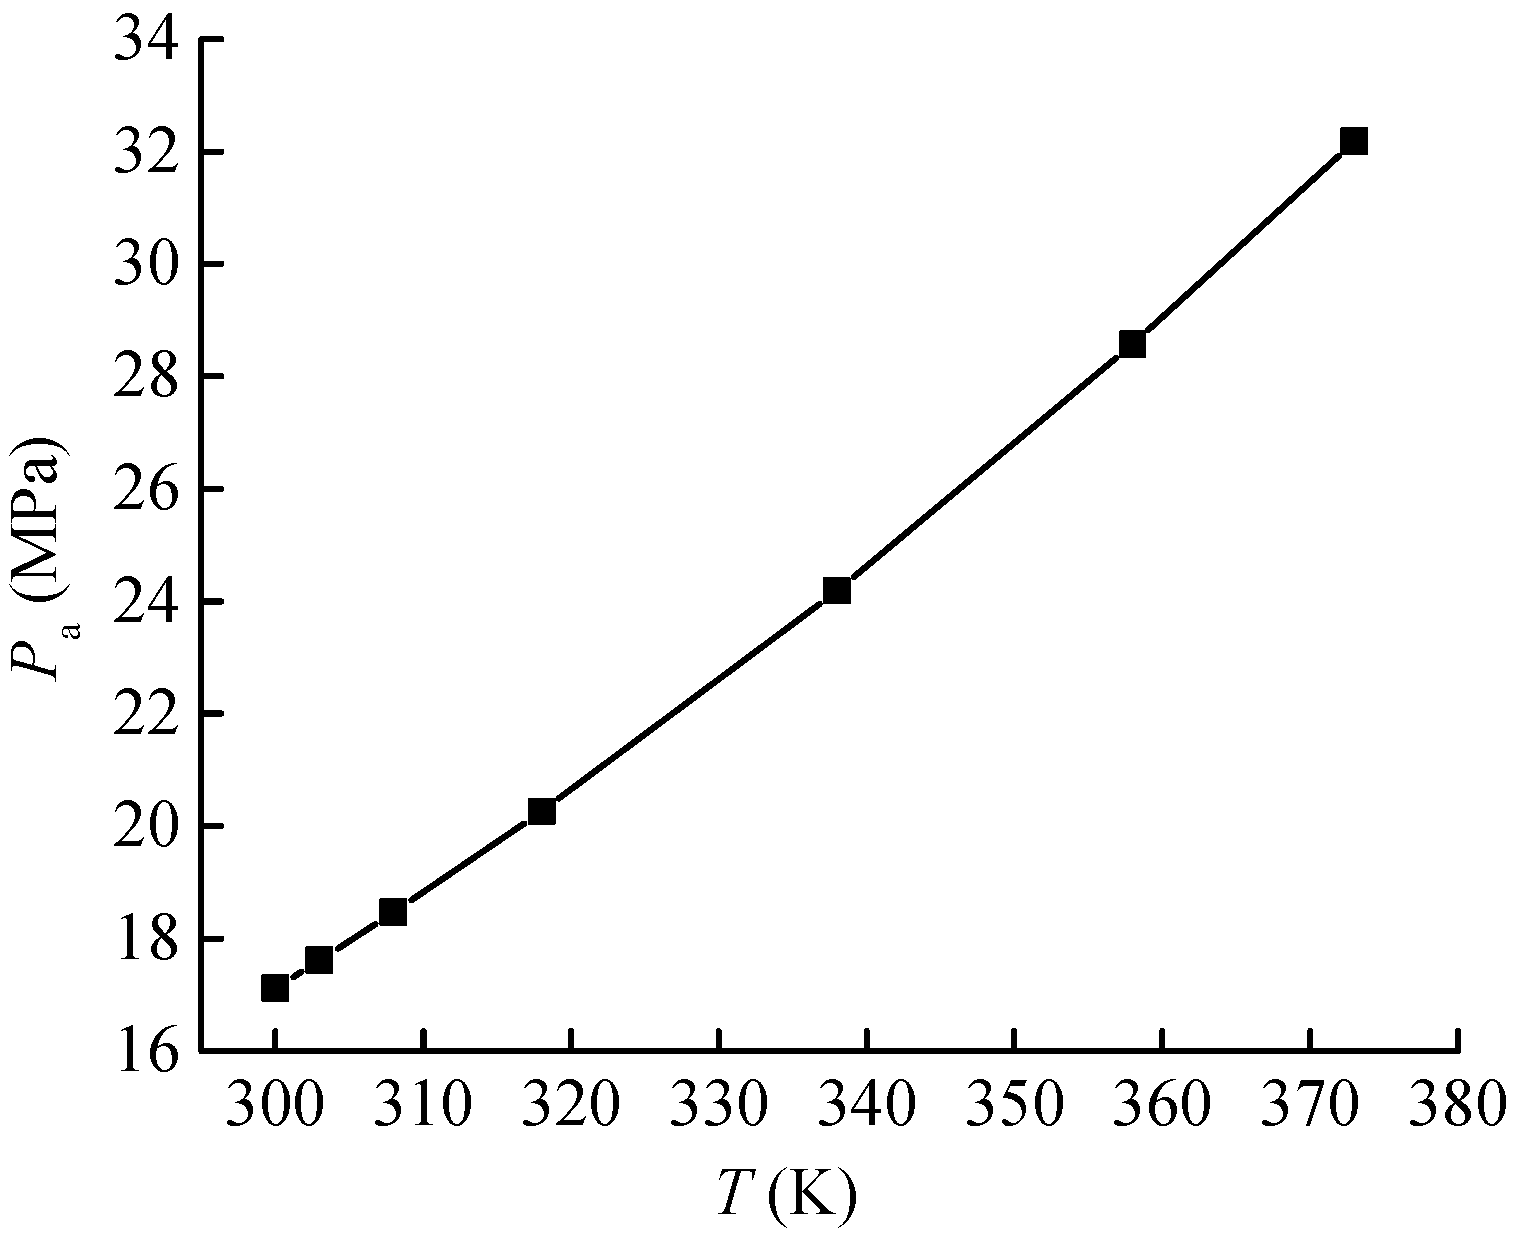
Figure 8. It can be seen that with the increase in temperature, the adsorption-phase pressure shows a monotonically increasing trend, rising from 17.11 MPa at 300 K to 32.19 MPa at 373 K.
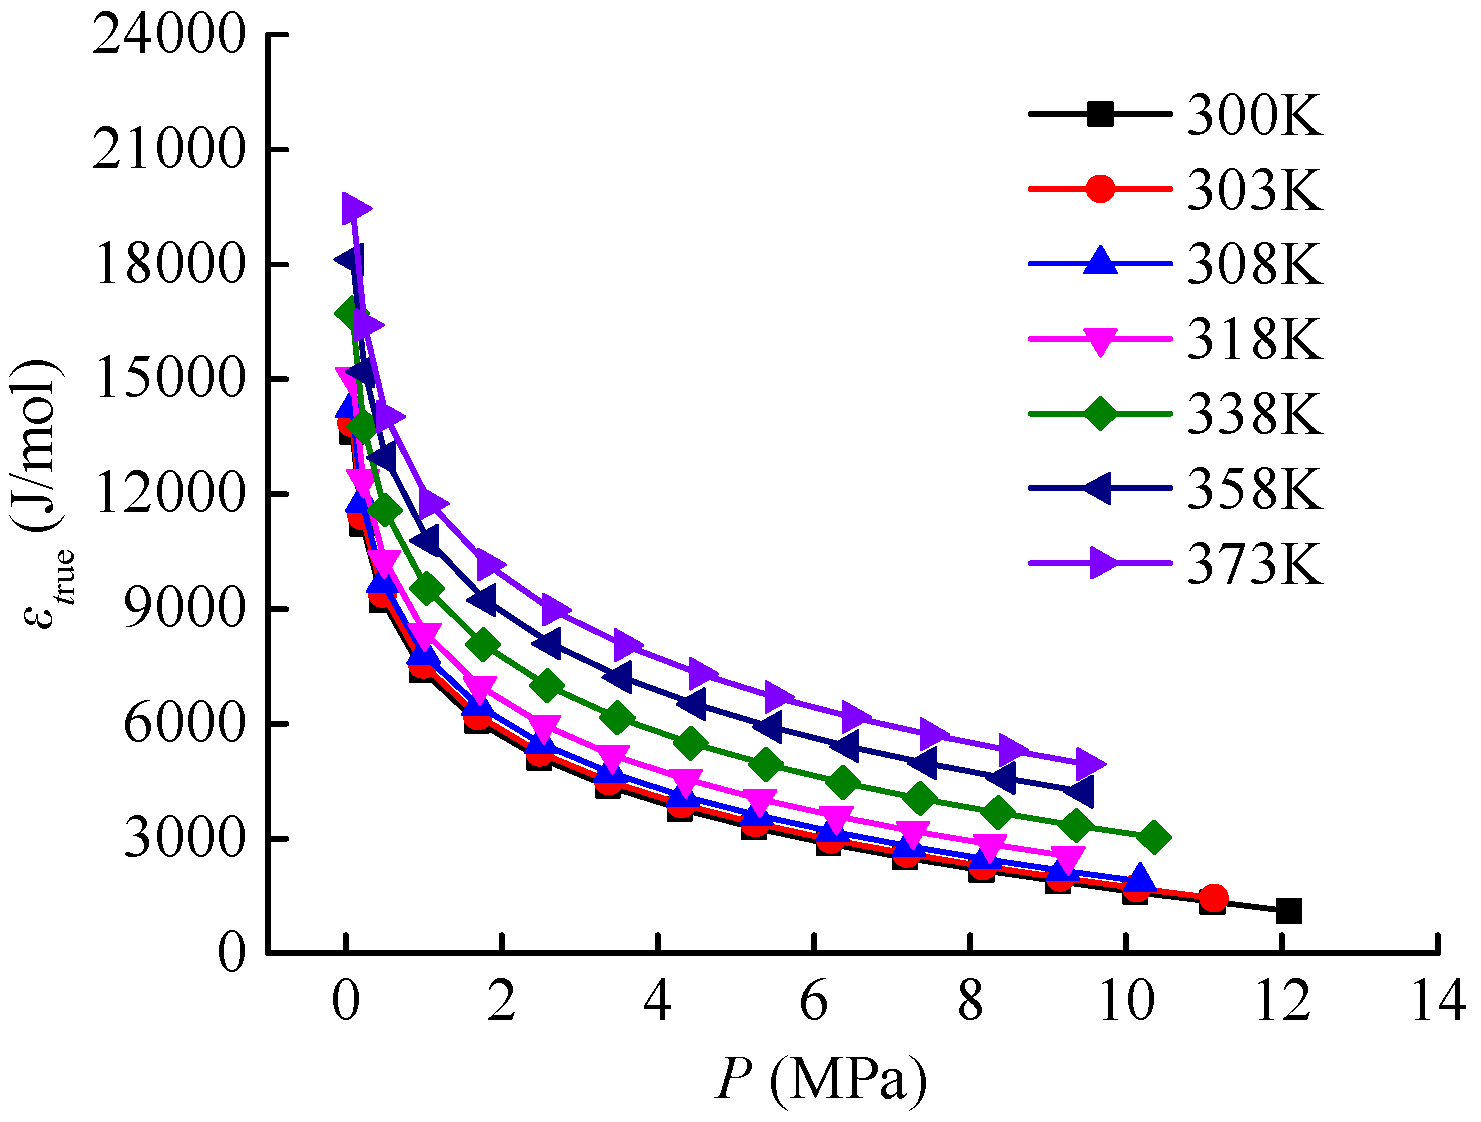
The adsorption potential curve of the Holm shale–CH
4 adsorption system is shown in
Figure 9. It can be observed that the adsorption potential curve exhibits a monotonically decreasing trend with increasing pressure. Taking the adsorption potential curve at 373 K as an example, the adsorption potential is 19,455.74 J/mol at a pressure of 0.09 MPa and decreases to 4942.07 J/mol when the pressure increases to 9.5 MPa.
Notably, within the lower pressure range (P ≤ MPa), the adsorption potential decreases rapidly. When the pressure exceeds 2 MPa, the decline rate of the adsorption potential significantly slows down. Since the adsorption potential reflects the work done by the system during the process of adsorbate molecules entering the adsorption-phase space, the variation pattern of the adsorption potential curve indicates that as the pressure increases from the initial adsorption stage to the saturated adsorption stage, the work required for the bulk gas of the adsorbate to enter the adsorption space and transform into the adsorption-phase gas gradually decreases.
Meanwhile, for the adsorption potential at the same pressure but different temperatures, the adsorption potential gradually increases with rising temperature. Taking a pressure of approximately 2.5 MPa as an example, as the temperature increases from 300 K to 373 K, the adsorption potential rises from 5110.19 J/mol to 8973.11 J/mol. When the pressure is held constant, increasing the temperature leads to an increase in the kinetic energy of adsorbate molecules, thereby requiring more work to convert bulk gas into adsorption-phase gas.
The adsorption characteristic curve of CH
4 adsorption on Holm shale is shown in
Figure 4(4.9). The author used the LangmuirEXT2 equation (Equation (22)) to fit the adsorption characteristic curve. When K = 2.9, the fitting function parameters are a = 5.77314 × 10
−5, b = 0.01831, and c = 2.16176, with a fitting correlation coefficient of 0.99461 (
Table 1), indicating good consistency of the adsorption characteristic curve.
5. Discussion
For ease of description, the adsorption characteristic curves (), adsorption potentials (), and adsorption-phase volumes () obtained based on the ideal gas adsorption potential equation (Equation (4)) and the supercritical gas adsorption potential equation (Equation (12)) are hereinafter referred to as ideal gas adsorption characteristic curves (), ideal gas adsorption potentials (), and ideal gas adsorption-phase volumes (), as well as supercritical gas adsorption characteristic curves (), supercritical gas adsorption potentials (), and supercritical gas adsorption-phase volumes (), respectively.
In the field of unconventional natural gas adsorption, the ideal gas adsorption potential equation (Equation (4)) is typically employed to calculate the ideal gas adsorption potential and construct the ideal gas adsorption characteristic curve in conjunction with the Dubinin equation. Specifically, the ideal gas adsorption potential () is calculated using the Polanyi adsorption potential equation (Equation (4)), where the adsorption-phase pressure is replaced by the virtual saturated vapor pressure , which is determined via the Dubinin equation (Equation (13)). The ideal gas adsorption-phase volume is calculated using Equation (16), in which the molar volume of the adsorption phase is derived from Equation (17), and the density of the adsorption phase is computed through Ozawa’s empirical formula (Equation (18)).
In this section, the adsorption characteristic curves and adsorption potential analyses for both ideal gases and supercritical gases utilize the isothermal adsorption data of Holm shale (see
Figure 1). The excess adsorption amount is corrected to the absolute adsorption amount using the Gibbs adsorption equation (Equation (19)). The gas-phase density is calculated by combining Equation (20) with the R-K equation (Equation (8)).
5.1. Differences in Adsorption Characteristic Curves Between Ideal Gases and Supercritical Gases
The ideal gas adsorption characteristic curve (
) of Holm shale is shown in
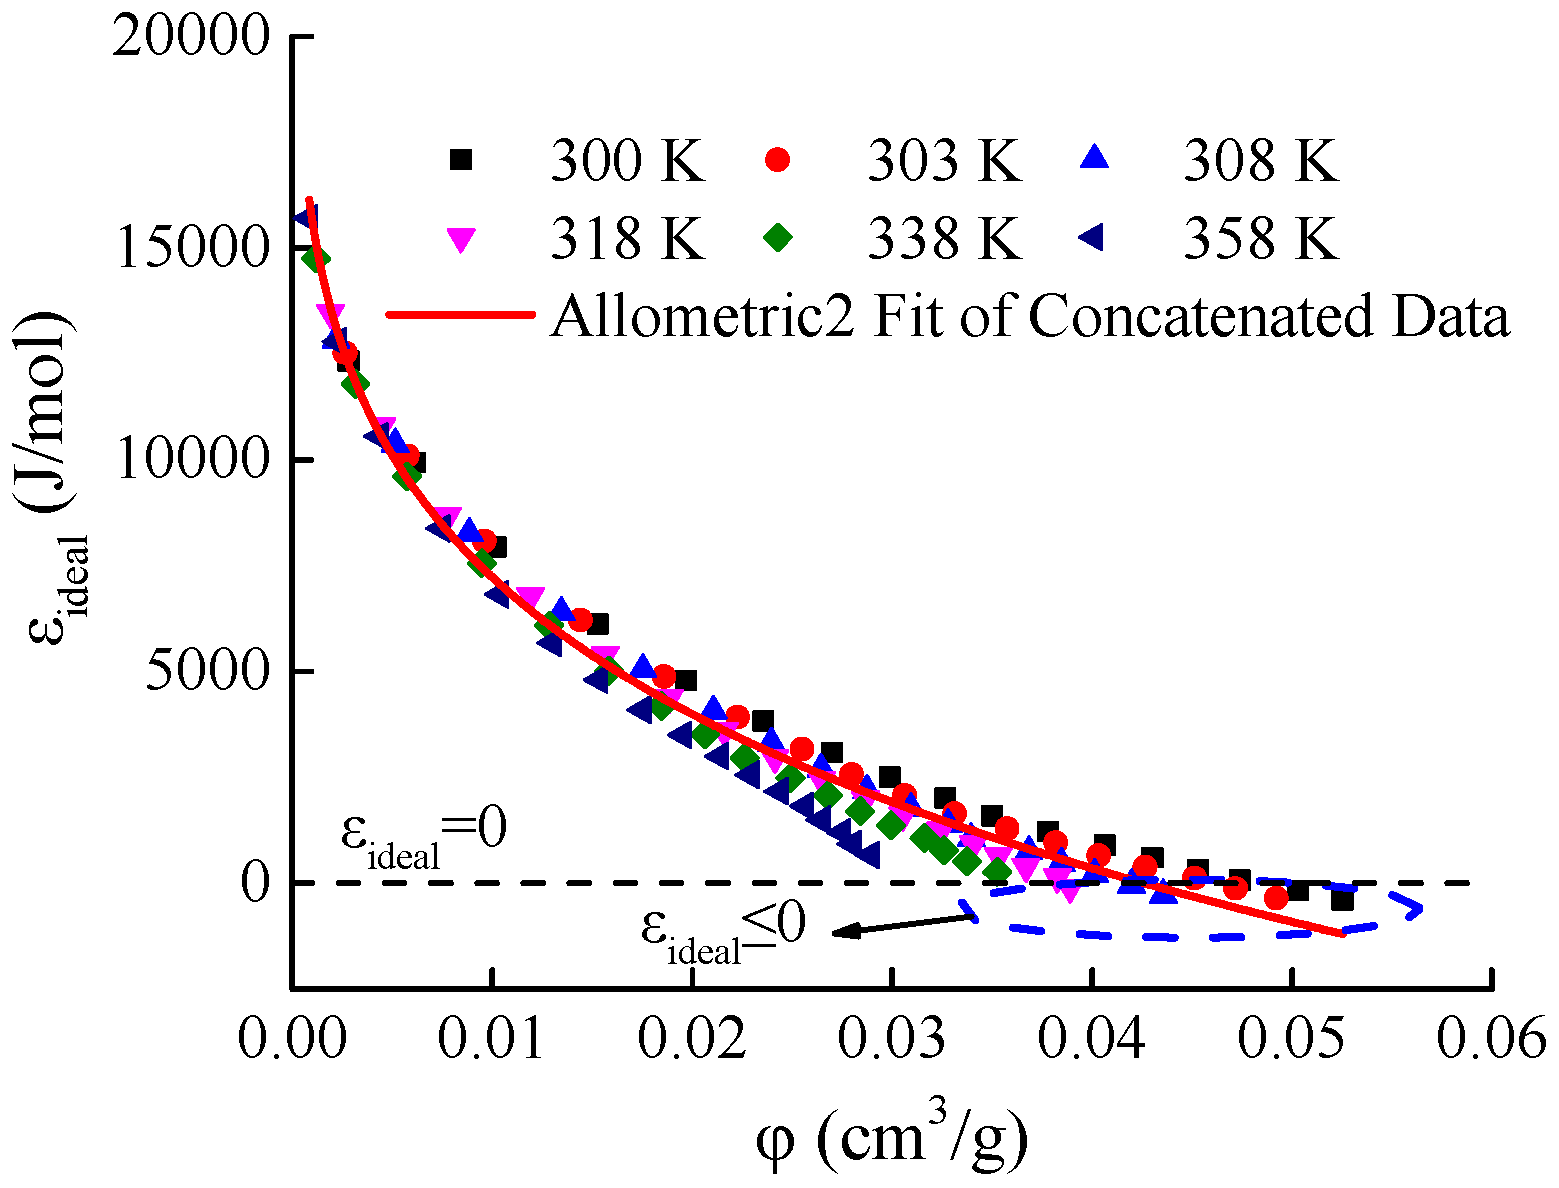
Figure 10. As the adsorption-phase volume of the ideal gas (
) increases, the ideal gas adsorption potential (
) decreases. Notably, in the temperature range from 300 to 318 K, the ideal gas adsorption potential
becomes less than zero near the maximum value of the adsorption-phase volume
. The adsorption potential reflects the work done when 1 mol of gas is attracted from the bulk phase to the adsorption space. The limiting condition for the increase in adsorption-phase volume should be when the space occupied by the adsorbate has completely transformed into the adsorption-phase space, at which point the adsorption potential may be zero, but the phenomenon of the adsorption potential being less than zero should not occur. From a mathematical perspective, the reason why the ideal gas adsorption potential is less than zero is that within the temperature range of 300–318 K, the virtual saturated vapor pressure obtained using the Dubinin equation (Equation (13)) is lower than the gas-phase pressure. Therefore, the ideal gas adsorption potential equation is not suitable for the theoretical analysis of adsorption potential in unconventional natural gases.
Meanwhile, the degree of dispersion in the ideal gas adsorption potential curves (ε
ideal) at different temperatures increases. Since the LangmuirEXT2 equation (Equation (22)) in
Section 3.1 fails to effectively fit the adsorption characteristic curve shown in
Figure 9, the author employs the Allometric2 equation for curve fitting. The Allometric2 equation can be expressed as
where,
,
, and
are equation fitting parameters that are dimensionless.
The fitting results show that the coefficient of determination (R
2) for the functional fitting of the ideal gas adsorption characteristic curve is 0.9828. Using a correlation coefficient of 0.98 as the criterion for consistency, the ideal gas adsorption characteristic curve meets the consistency requirement for adsorption characteristic curves. However, compared with the supercritical gas adsorption characteristic curve (
Figure 4(4.9)), its consistency is poorer. More importantly, for the adsorption of unconventional natural gases, the ideal gas adsorption characteristic curve lacks a reasonable theoretical foundation.
5.2. Difference in Adsorption Potential Between Ideal Gas and Supercritical Gas
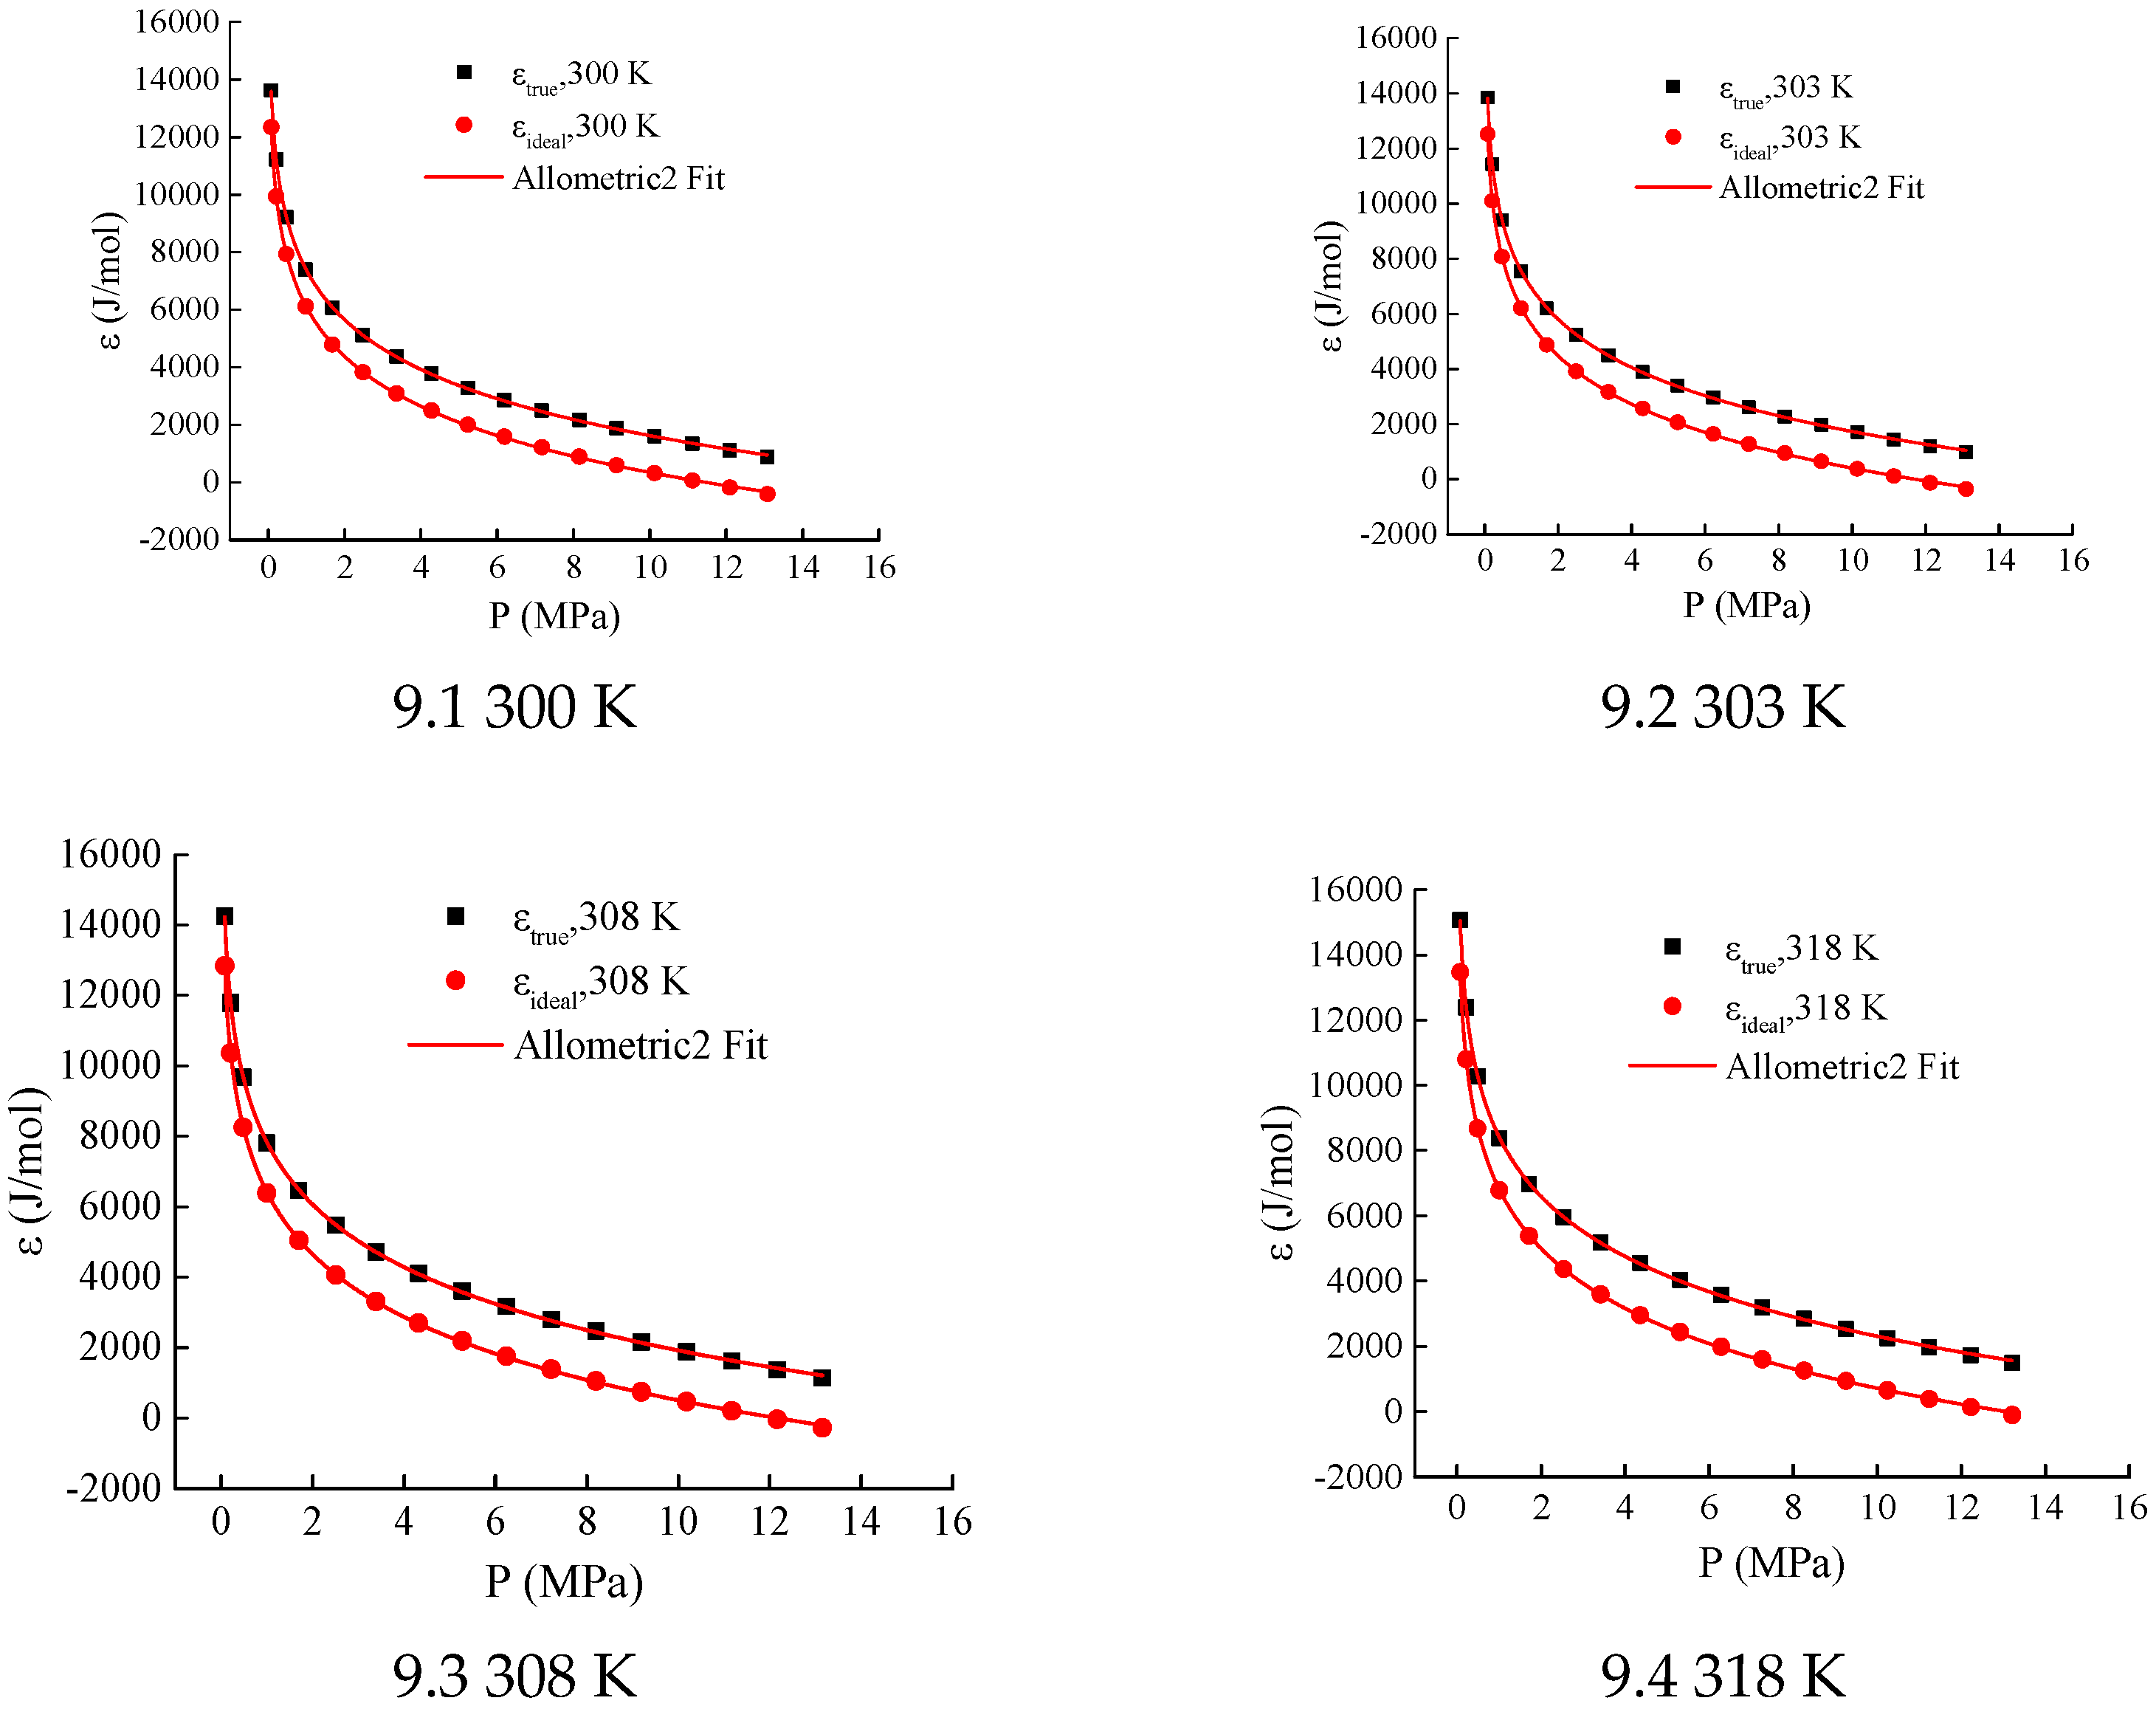
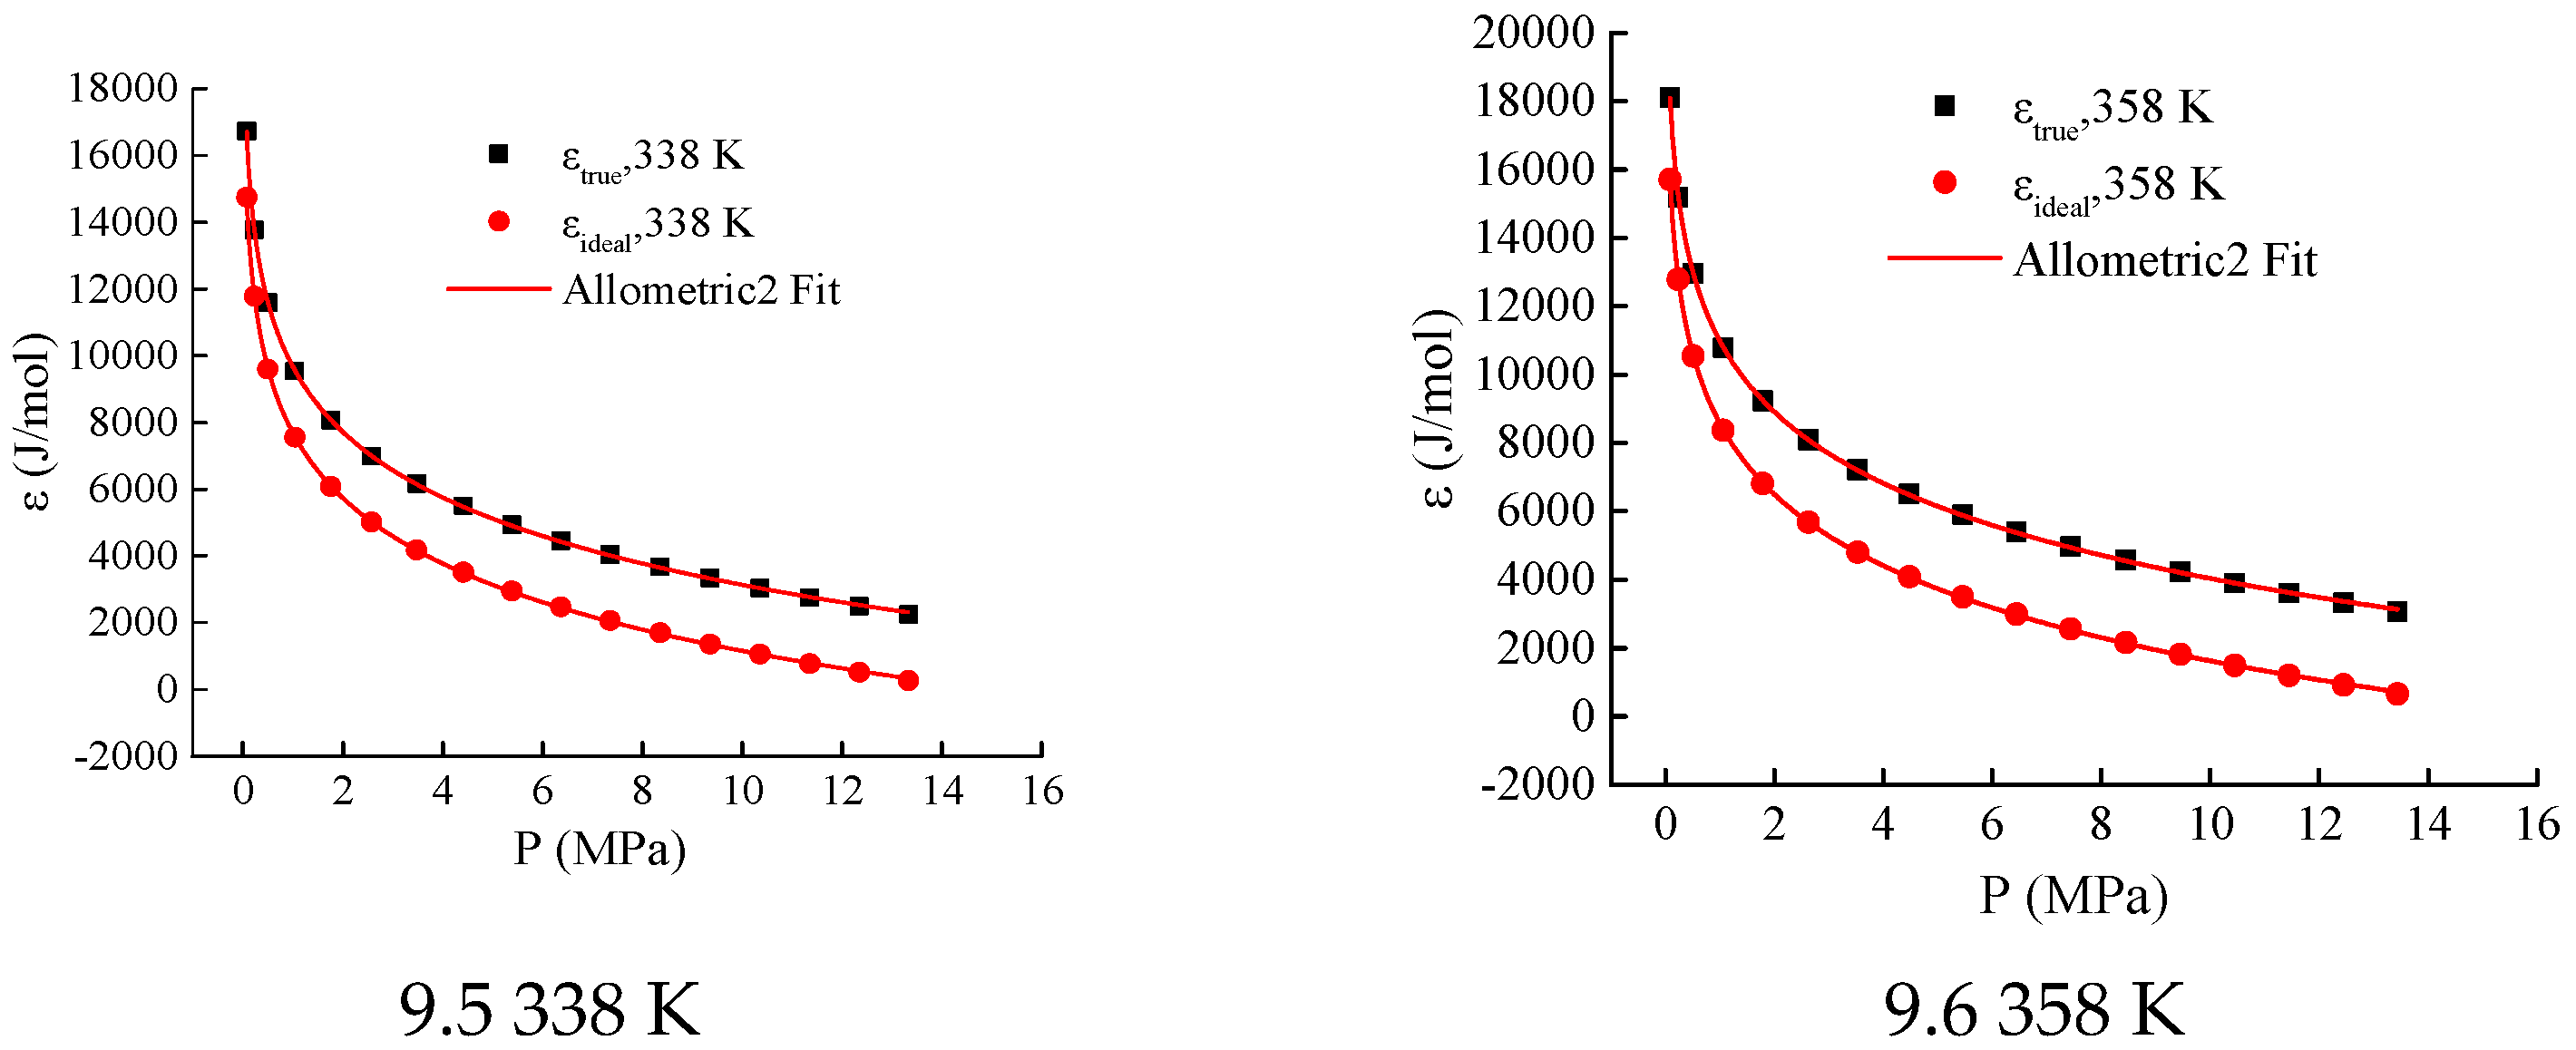
To analyze the differences between the adsorption potentials of ideal gases and supercritical gases, adsorption potential curves for both types were plotted within the temperature range of 300 K to 358 K, as shown in
Figure 11. Within this temperature range, the adsorption potential of supercritical gases is greater than that of ideal gases at the same pressure.
The Allometric2 equation (
, where
,
, and
are parameters) was used to fit the two types of adsorption potential curves. The correlation coefficients of the fitting functions are all above 0.9999. Additionally, the parameters
and
of the fitting functions for the two types of adsorption potential curves are the same at the same temperature (see
Table 2). This indicates that the curve shapes of the two types of adsorption curves are consistent.
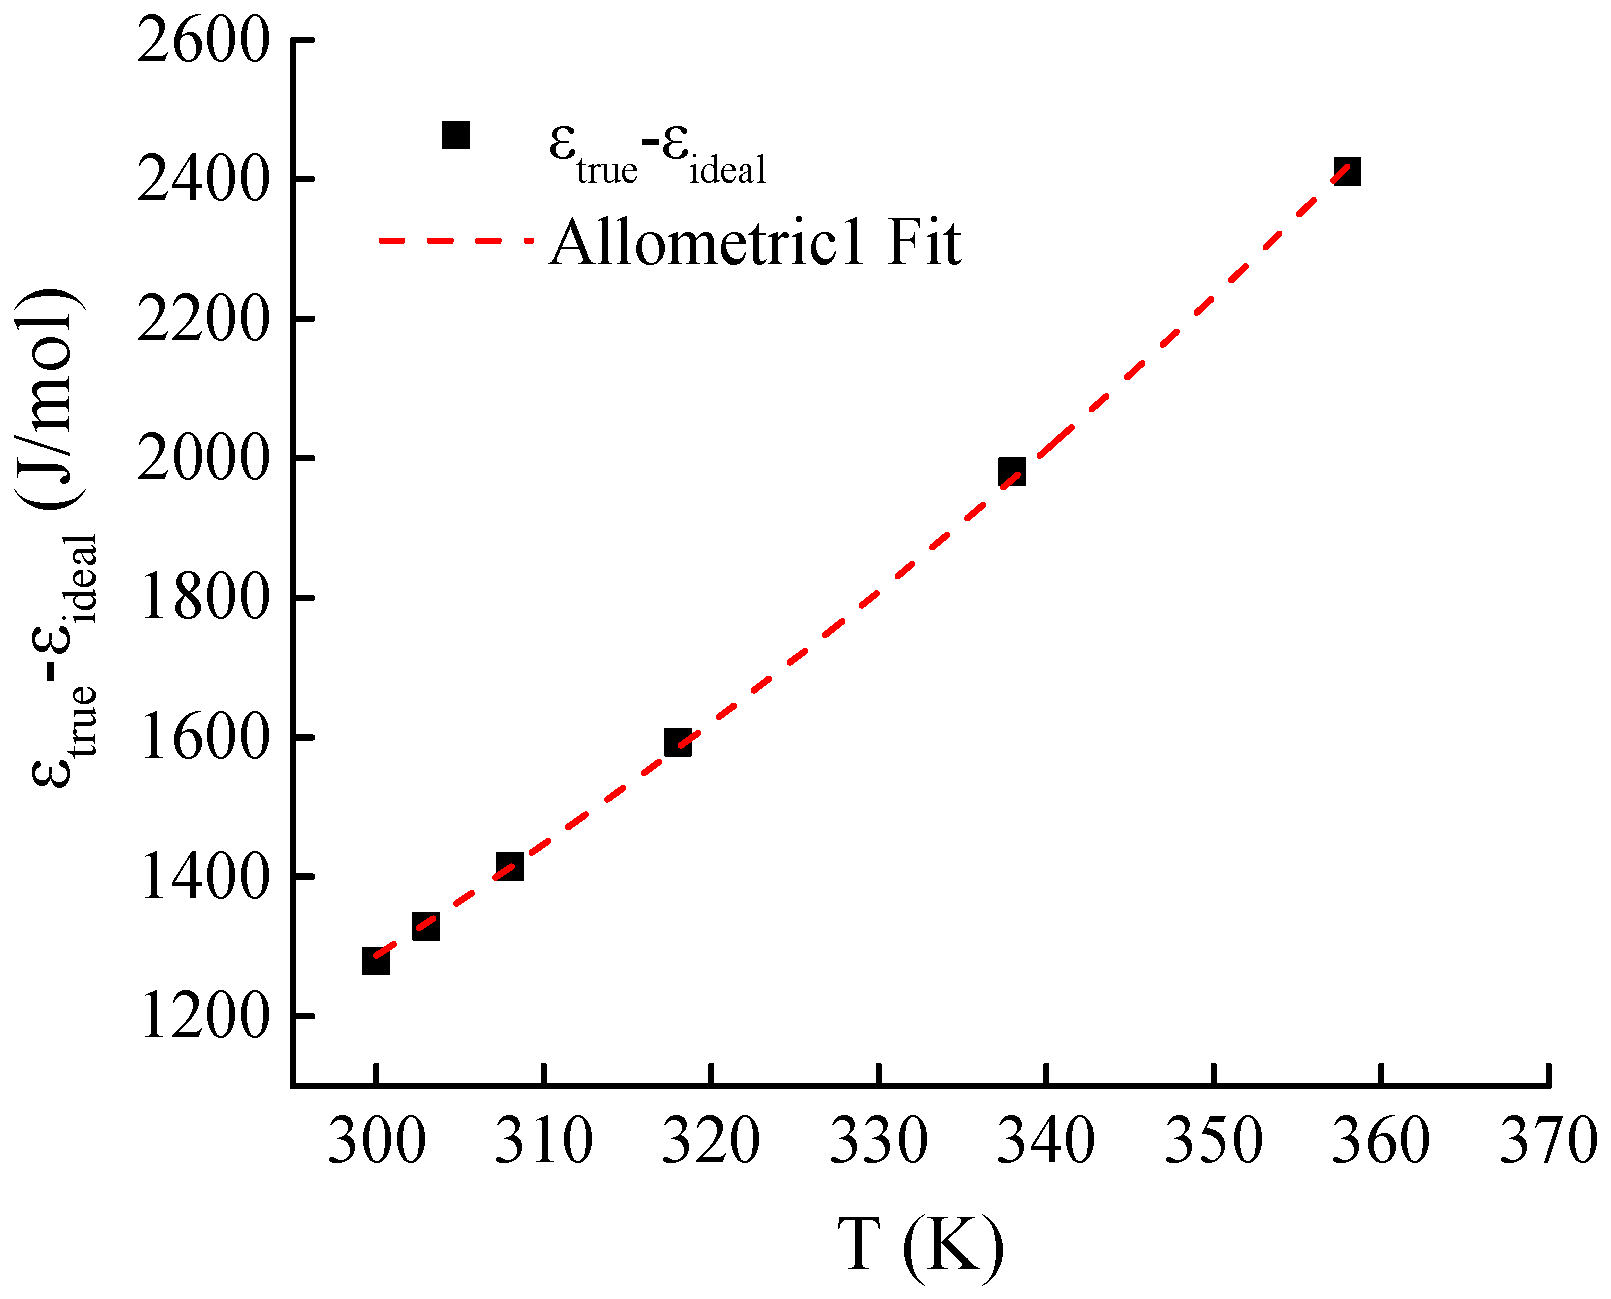
Given that the adsorption potentials of ideal gases and supercritical gases exhibit the same curve shape, the authors calculated the differences between the two types of adsorption potential curves under the same temperature and pressure conditions. The calculation results (as shown in
Figure 11) indicate that for the two types of adsorption potential curves at the same temperature, the adsorption potential difference corresponding to the same pressure is constant.
At the same temperature, the relationship between the two types of adsorption potential curves can be expressed as
where
is the difference between the two types of adsorption potential curves under the same temperature and pressure conditions, in J/mol.
The Allometric1 function was used to fit the curves of the differences between the two types of adsorption potentials and at different temperatures (see
Figure 11). The form of the fitting equation is
where
and
are the parameters of the fitting function. The fitting results indicate that for the Holm shale-adsorbing CH
4 system, the difference
and temperature T satisfy the following equation:
The correlation coefficient of the fitting function is 0.9996 (see
Figure 12).
Substituting the Polanyi adsorption potential equation (Equation (4)) and Equation (26) into Equation (25) yields the simplified form of the supercritical adsorption potential equation, which can be expressed as
In the Polanyi adsorption potential equation, the adsorption-phase pressure () is calculated using the Dubinin equation (Equation (13)). Since the parameters ( and ) are obtained through functional fitting of the difference between the supercritical gas adsorption potential and the ideal gas adsorption potential at the same pressure, and the key parameter K in the supercritical gas adsorption potential equation is specific to the adsorption system, the parameters ( and ) in the simplified form of the supercritical gas adsorption potential equation are also inherently related to the specific adsorption system.
For the Holm shale-adsorbing CH
4 system, the supercritical gas adsorption potential equation can be simplified as
6. Conclusions
To address the theoretical inapplicability of the ideal gas adsorption potential equation commonly used in the field of unconventional natural gas adsorption, this study constructs a supercritical gas adsorption potential equation, proposes an optimal selection method for parameter K in the Amankwah equation, and achieves calculations of adsorption-phase pressure, adsorption potential, and adsorption characteristic curves for unconventional natural gases. The main research conclusions are as follows:
(1) By assuming the adsorption phase is a compressible gas and introducing the Real Gas Equation of State (R-K equation) into the definition of adsorption potential, a supercritical gas adsorption potential equation suitable for the adsorption process of unconventional natural gas was derived. Among them, the adsorption-phase pressure was calculated using the Amankwah equation.
(2) For the determination of the unknown parameter K in the Amankwah equation, a method is proposed to determine the optimal K value of the adsorption system by using two key factors: the consistency of adsorption characteristic curves and the accuracy of the prediction results of isothermal adsorption curves based on adsorption characteristic curves, so as to realize the calculation of adsorption-phase pressure.
(3) For the Holm shale-adsorbing CH4 system, the optimal value of parameter K is 2.9. Within the temperature range of 300–373 K, the adsorption-phase pressure ranges from 17.11 to 32.19 MPa. The adsorption characteristic curves of supercritical gases exhibit good consistency, fitting well with the LangmuirEXT2 equation. Additionally, at 373 K, the average relative error of the predicted values for the ascending segment of excess adsorption capacity is only 1.77%.
(4) The ideal gas adsorption characteristic curves meet the consistency requirements for adsorption characteristics, but they exhibit abnormal phenomena where the adsorption potential is less than 0 at high adsorption-phase volumes, lacking a reasonable theoretical foundation. Meanwhile, the supercritical gas adsorption potential curves and ideal gas adsorption potential curves at the same temperature share the same curve morphology, and the difference between the two is related to temperature. Based on this, a simplified form of the supercritical gas adsorption potential equation was proposed.
Author Contributions
Conceptualization, P.X. and Q.L.; methodology, C.G.; software, J.Y.; validation, C.H.; formal analysis, Y.M. All authors have read and agreed to the published version of the manuscript.
Funding
This research was funded by the Yanchang Petroleum Group Technology Project, grant number YCSY2025JCYJ-B-04.
Data Availability Statement
The authors confirm that the data supporting the findings of this study are available within the article.
Conflicts of Interest
The authors Pei Xue, Quansheng Liang, Chao Gao, Jintao Yin, and Yushan Ma are employed by Shaanxi Yanchang Petroleum (Group) Co., Ltd. Author Cheng Huang was employed by Northwest University. The authors declare that the research was conducted in the absence of any commercial or financial relationships that could be construed as a potential conflict of interest.
References
- Kondo, S.; Ishikawa, Y.; Abe, I. Adsorption Science; Chemical Industry Publishing House: Beijing, China, 2005. [Google Scholar]
- Ma, D.; Li, L.; Li, X.; Bai, H.; Wang, J.; Liu, H.; Li, F. Contrastive experiment of adsorption-desorption between CH4 and CO2 in Coal Seam 4 of Dafosi Coal Mine. J. China Coal Soc. 2014, 39, 1938–1944. [Google Scholar]
- Changtao, Y.; Shuyuan, L.; Linyue, L.; Hailong, W. Adsorption characteristics of shale reservoirs in the Jingmen area and application of adsorption potential theory. Pet. Geol. Exp. 2016, 38, 346–353. [Google Scholar]
- Su, X.B.; Lin, M.; Lin, X.Y. Study of Methane Adsorption on Coal with Adsorption Potential Theory. China Coalbed Methane 2006, 3, 28–30. [Google Scholar]
- Su, X.; Liu, G.; Guo, S.; Lin, X. Relationship of Coalbed Methane Adsorption Potential and Coal Rank. China Coalbed Methane 2006, 3, 21–23. [Google Scholar]
- Su, X.; Chen, R.; Lin, X.; Song, Y. Application of Adsorption Potential Theory in the Fractionation of Coalbed Gas during the Process of Adsorption/Desorption. Acta Geol. Sin. 2008, 82, 1382–1389. [Google Scholar]
- Gao, R. The Adsorption/Desorption of Methane on Tectonic Coal Based on Adsorption Potential Theory; Henan Polytechnic University: Henan, China, 2012. [Google Scholar]
- Huan, X.; Zhang, X.; Wei, H. Research on parameters of adsorption potential via methane adsorption of different types of coal. J. China Coal Soc. 2015, 40, 1859–1864. [Google Scholar]
- Bao, Y.; Zhou, Y. Application of characteristic gas adsorption curves for shales. Pet. Geol. Exp. 2015, 37, 660–664. [Google Scholar]
- Chai, L.; Wu, S.; Niu, Y. Study on Coal Adsorbing Supercritical Methane Based on Adsorption Potential Theory. Saf. Coal Mines 2017, 48, 21–27. [Google Scholar]
- Zhu, L.; Sang, M.; Du, J.; Liu, C. Construction of supercritical model for coal adsorbing CO based on adsorption potential theory. Saf. Coal Mines 2022, 53, 25–30. [Google Scholar]
- Wang, Y.; Tao, C.; Ni, X.; Gao, X.; He, Y. Amount of adsorbed gas in deep coal reservoir based on adsorption potential theory. J. China Coal Soc. 2018, 43, 1547–1552. [Google Scholar]
- Wang, Q.; Ning, Z.; Zhang, R.; Feng, Y.; Huawei, Z. Adsorption Equilibrium Prediction of Shale Gas Pool Based on Adsorption Potential Theory. Xinjiang Pet. Geol. 2015, 36, 308–312. [Google Scholar]
- Xiong, J.; Liu, X.; Liang, L. Adsorption model of shale to CH4 based on adsorption potential theory and its application. J. Chengdu Univ. Technol. 2014, 32, 19–22. [Google Scholar]
- Dubinin, M.M. Fundamentals of the theory of adsorption in micropores of carbon adsorbents: Characteristics of their adsorption properties and microporous structures. Pure Appl. Chem. 1989, 61, 1841–1843. [Google Scholar] [CrossRef]
- Dubinin, M.M.; Astakhov, V.A. Development of the concepts of volume filling of micropores in the adsorption of gases and vapors by microporous adsorbents. Bull. Acad. Sci. USSR Div. Chem. Sci. 1971, 20, 3–7. [Google Scholar] [CrossRef]
- Xiong, J.; Liu, X.; Liang, L.; Lei, M. Improved Dubibin-Astakhov model for shale-gas supercritical adsorption. Acta Pet. Sin. 2015, 36, 849–857. [Google Scholar]
- Song, Y.; Jiang, B.; Li, M.; Liu, J.; Liu, H. Supercritical CH4 adsorption characteristics and applicability of adsorption models for low, middle-rank tectonically deformed coals. J. China Coal Soc. 2017, 42, 2063–2073. [Google Scholar]
- Hou, X.; Wang, M.; Liu, Y.; Liu, J.; Song, Y. Supercritical adsorption model of shale gas and its geological significance. J. China Univ. Min. Technol. 2016, 45, 111–118. [Google Scholar]
- Sheng, M.; Li, G.; Chen, L.; Shao, S.J.; Zhang, R. Mechanisms analysis of shale-gas supercritical adsorption and modeling of isorption adsorption. J. China Coal Soc. 2014, 39 (Suppl. S1), 179–183. [Google Scholar]
- Zhou, L.; Zhou, Y.; Sun, Y.; Su, W. Research progress on supercritical adsorption and gas fuel substitution technology. Prog. Nat. Sci. 2004, 14, 615–623. [Google Scholar] [CrossRef]
- Nikolaev, K.M.; Dubinin, M.M. A Study of Adsorption Isotherms of Gases and Vapors on Active Carbons over a Wide Interval of Temperatures. including the Critical Region. Russ. Chem. Bull. 1958, 7, 1124–1133. [Google Scholar] [CrossRef]
- Dubinin, M.M. The Potential Theory of Adsorption of Gases and Vapors for Adsorbents with Energetically Nonuniform Surfaces. Chem. Rev. 1960, 60, 235–241. [Google Scholar] [CrossRef]
- Amankwah, K.A.G.; Schwarz, J.A. A modified approach for estimating pseudo-vapor pressures in the application of the Dubinin-Astakhov equation. Carbon 1995, 33, 1313–1319. [Google Scholar] [CrossRef]
- Liang, Y.; Liu, S.; Wei, J.; Wang, H.; Jia, L.; Liu, X. Study on Saturated Vapor Pressure Parameter k of Adsorption Potential Theory. Saf. Coal Mines 2016, 47, 145–148. [Google Scholar]
- Zhu, Y.; Zhao, Z. Fundamentals of Interface Chemistry; Industrial Press: Beijing, China, 1996; pp. 336–339. [Google Scholar]
- Gu, T.; Zhu, Y.; Li, W.; Ma, J.; Dai, L.; Cheng, H. Surface Chemistry; China Science Publishing: Beijing, China, 1994; pp. 275–280. [Google Scholar]
- Zhao, Z. Principles of Adsorption Application; Chemical and Applied Chemistry Publishing Center, Chemical Industry Press: Beijing, China, 2005. [Google Scholar]
- He, B.; Ning, Z.; Yang, F.; Detao, K.; Pan, P. Impact of Equations of State on Methane Adsorption Isotherms of Shales. Xinjiang Pet. Geol. 2014, 35, 442–446. [Google Scholar]
- Zhang, N.; Yu, Z. Chemical Thermodynamics, 2nd ed.; Dalian University of Technology Press: Dalian, China, 2014. [Google Scholar]
- Redlich, O.; Kwong, J. On the thermodynamics of solutions; an equation of state; fugacities of gaseous solutions. Chem. Rev. 1949, 44, 233. [Google Scholar] [CrossRef]
- Rexer, T.F.T.; Benham, M.J.; Aplin, A.C.; Thomas, K.M. MethaneAdsorption on Shale under Simulated Geological Temperature and Pressure Conditions. Energy Fuels 2013, 27, 3099–3109. [Google Scholar] [CrossRef]
- Xue, P.; Zhang, L.; Liang, Q.; Shi, Y.; Cao, C. Thermodynamic characteristics of shale adsorption of supercritical CH4. Nat. Gas Geosci. 2020, 31, 1261–1270. [Google Scholar]
| Disclaimer/Publisher’s Note: The statements, opinions and data contained in all publications are solely those of the individual author(s) and contributor(s) and not of MDPI and/or the editor(s). MDPI and/or the editor(s) disclaim responsibility for any injury to people or property resulting from any ideas, methods, instructions or products referred to in the content. |
© 2025 by the authors. Licensee MDPI, Basel, Switzerland. This article is an open access article distributed under the terms and conditions of the Creative Commons Attribution (CC BY) license (https://creativecommons.org/licenses/by/4.0/).
