Article

Reliability Study of Metal Bellows in Low-Temperature High-Pressure Liquid Carbon Dioxide Transportation Systems: Failure Mechanism Analysis

1
School of Energy and Building Environment, Guilin University of Aerospace Technology, Guilin 541004, China
2
Henan Tezhong Equipment Testing Co., Ltd., Zhengzhou 450018, China
3
College of Mechanical Science and Engineering, Northeast Petroleum University, Daqing 163318, China
*
Author to whom correspondence should be addressed.
Processes 2025, 13(9), 2908; https://doi.org/10.3390/pr13092908
Submission received: 1 August 2025 / Revised: 4 September 2025 / Accepted: 5 September 2025 / Published: 11 September 2025
(This article belongs to the Section Materials Processes)

Abstract

In order to meet the harsh working environment and complex and changeable stress conditions, the low-temperature and high-pressure liquid carbon dioxide conveying system used in oil extraction will choose metal bellows for transportation. In this paper, the bellows in an accident section are investigated and observed by the working environment and characterization methods such as macroscopic analysis, metallographic analysis, EDS component analysis, fracture scanning electron microscopy analysis, and related mechanical performance test methods. The failure mechanism of the accident is preliminarily judged, and the unidirectional fluid–structure coupling model and the standard k-ω turbulence model are used as the calculation models for subsequent simulation. Combined with Fluent finite element simulation analysis, it is verified that the failure is caused by a welding defect, the maximum stress of the metal bellows under normal conditions is less than its own yield strength, and the material can work normally. When the welding crack is greater than 2 mm, the strength of the workpiece weld will be reduced, and the stress concentration has exceeded the yield strength that the workpiece can bear, causing failure fracture at the welding defect part. Combined with ANSYS simulation of accident defects, compared with bellows without defects, the stress at the crack will increase with the increase in the inlet flow velocity and decrease with the increase in temperature, and the flow rate will have a greater influence on it. Therefore, in actual working conditions, the stiffness and fatigue life of the conveying system can be improved by appropriately reducing the liquid flow rate and increasing the temperature. It provides a reference for the future application research of bellows and the research on bellows fracture failure.

1. Introduction

Metal bellows serve as critical mechanical components in conveying systems, and their performance directly impacts the safety and reliability of the entire mechanical system [1]. As a common pressure pipeline device, bellows offer excellent sealing performance, sufficient pressure resistance, elimination of vibration stress caused by fluid velocity, connecting pipeline components, compensating for thermal expansion and contraction of pipelines, absorbing pipeline settlement deformation, exhibiting strong corrosion resistance in extreme harsh environments, being easy to maintain, and extending the fatigue life of the entire system [2,3]. As a result, they have significant application potential in fields such as petrochemicals, aerospace, and mechanical manufacturing [4].
Metal bellows are classified as pressure-bearing special equipment in pressure vessel pipeline components. However, due to the short research period, many people are unaware of their characteristics. In 2016, at Harbin Huaneng Company, issues with the heating system arose due to bellows damage caused by underground soil pressure, extremely low environmental temperatures, and product quality issues, resulting in heating problems across the entire city. In 2022, during pre-fracturing operations at the Daqing Oilfield, a metal corrugated pipe ruptured, causing a leak of liquid CO2 medium, resulting in significant property damage and casualties [5].
Complete and powerful bellows are usually a combination, and their core composition can be summarized as follows: “one main body (bellows body) two interfaces (end pipes) and three layers of protection (mesh sleeve pressure, deflector anti-erosion, tie rod limit)”. Among them, mesh sleeves are not found in all bellows, but they are essential for bellows that withstand higher pressures. It is a mesh sleeve woven in a certain order from stainless steel wire (usually 304 or 316) that covers the outside of the bellows. Its function is to share the internal pressure of the bellows, greatly improve the pressure-bearing capacity of the bellows, prevent it from over-expanding or bursting, and protect the soft bellows body from external bumps and wear. The failure of metal bellows is mainly related to factors such as stress corrosion cracking [6], manufacturing quality (especially cutting corners and welding defects), instability, and fatigue caused by chloride ions [7,8]. Corrugated pipes with welds made of 304 steel are run under pressure to transport liquid carbon dioxide [9]. Additionally, 304 stainless steel can generally maintain good comprehensive mechanical properties at low temperatures, with improved strength and usually not embrittlement, but it is necessary to pay attention to the decrease in the toughness of the weld area compared with the base metal and the tendency of intergranular corrosion caused by sensitization [10]. When welding, the right amount of ferrite in the weld can help prevent thermal cracking, but too much can compromise low-temperature toughness and long-term performance [11]. Therefore, it is more conducive to the establishment of a pipeline safety system and the provision of safety measures for pipeline transportation to be carried out to analyze the failure of the metal bellows in the accident section, find out the cause of the failure, and put forward effective improvement measures to prevent similar failure accidents [12].
Therefore, this paper takes the actual damaged bellows as the research object and successively conducts macroscopic analysis, metallographic analysis, EDS component analysis, and fracture scanning electron microscopy analysis to determine the failure mechanism of the accident. Then, it establishes the finite element simulation and analysis model of metal bellows for verification and finally conducts finite element force analysis under different defects and the influence analysis of different entrance parameters on bellows containing defects to further supplement the discussion of this paper.

2. Failure Analysis and Testing of Metal Bellows

2.1. Selection of Experimental Materials

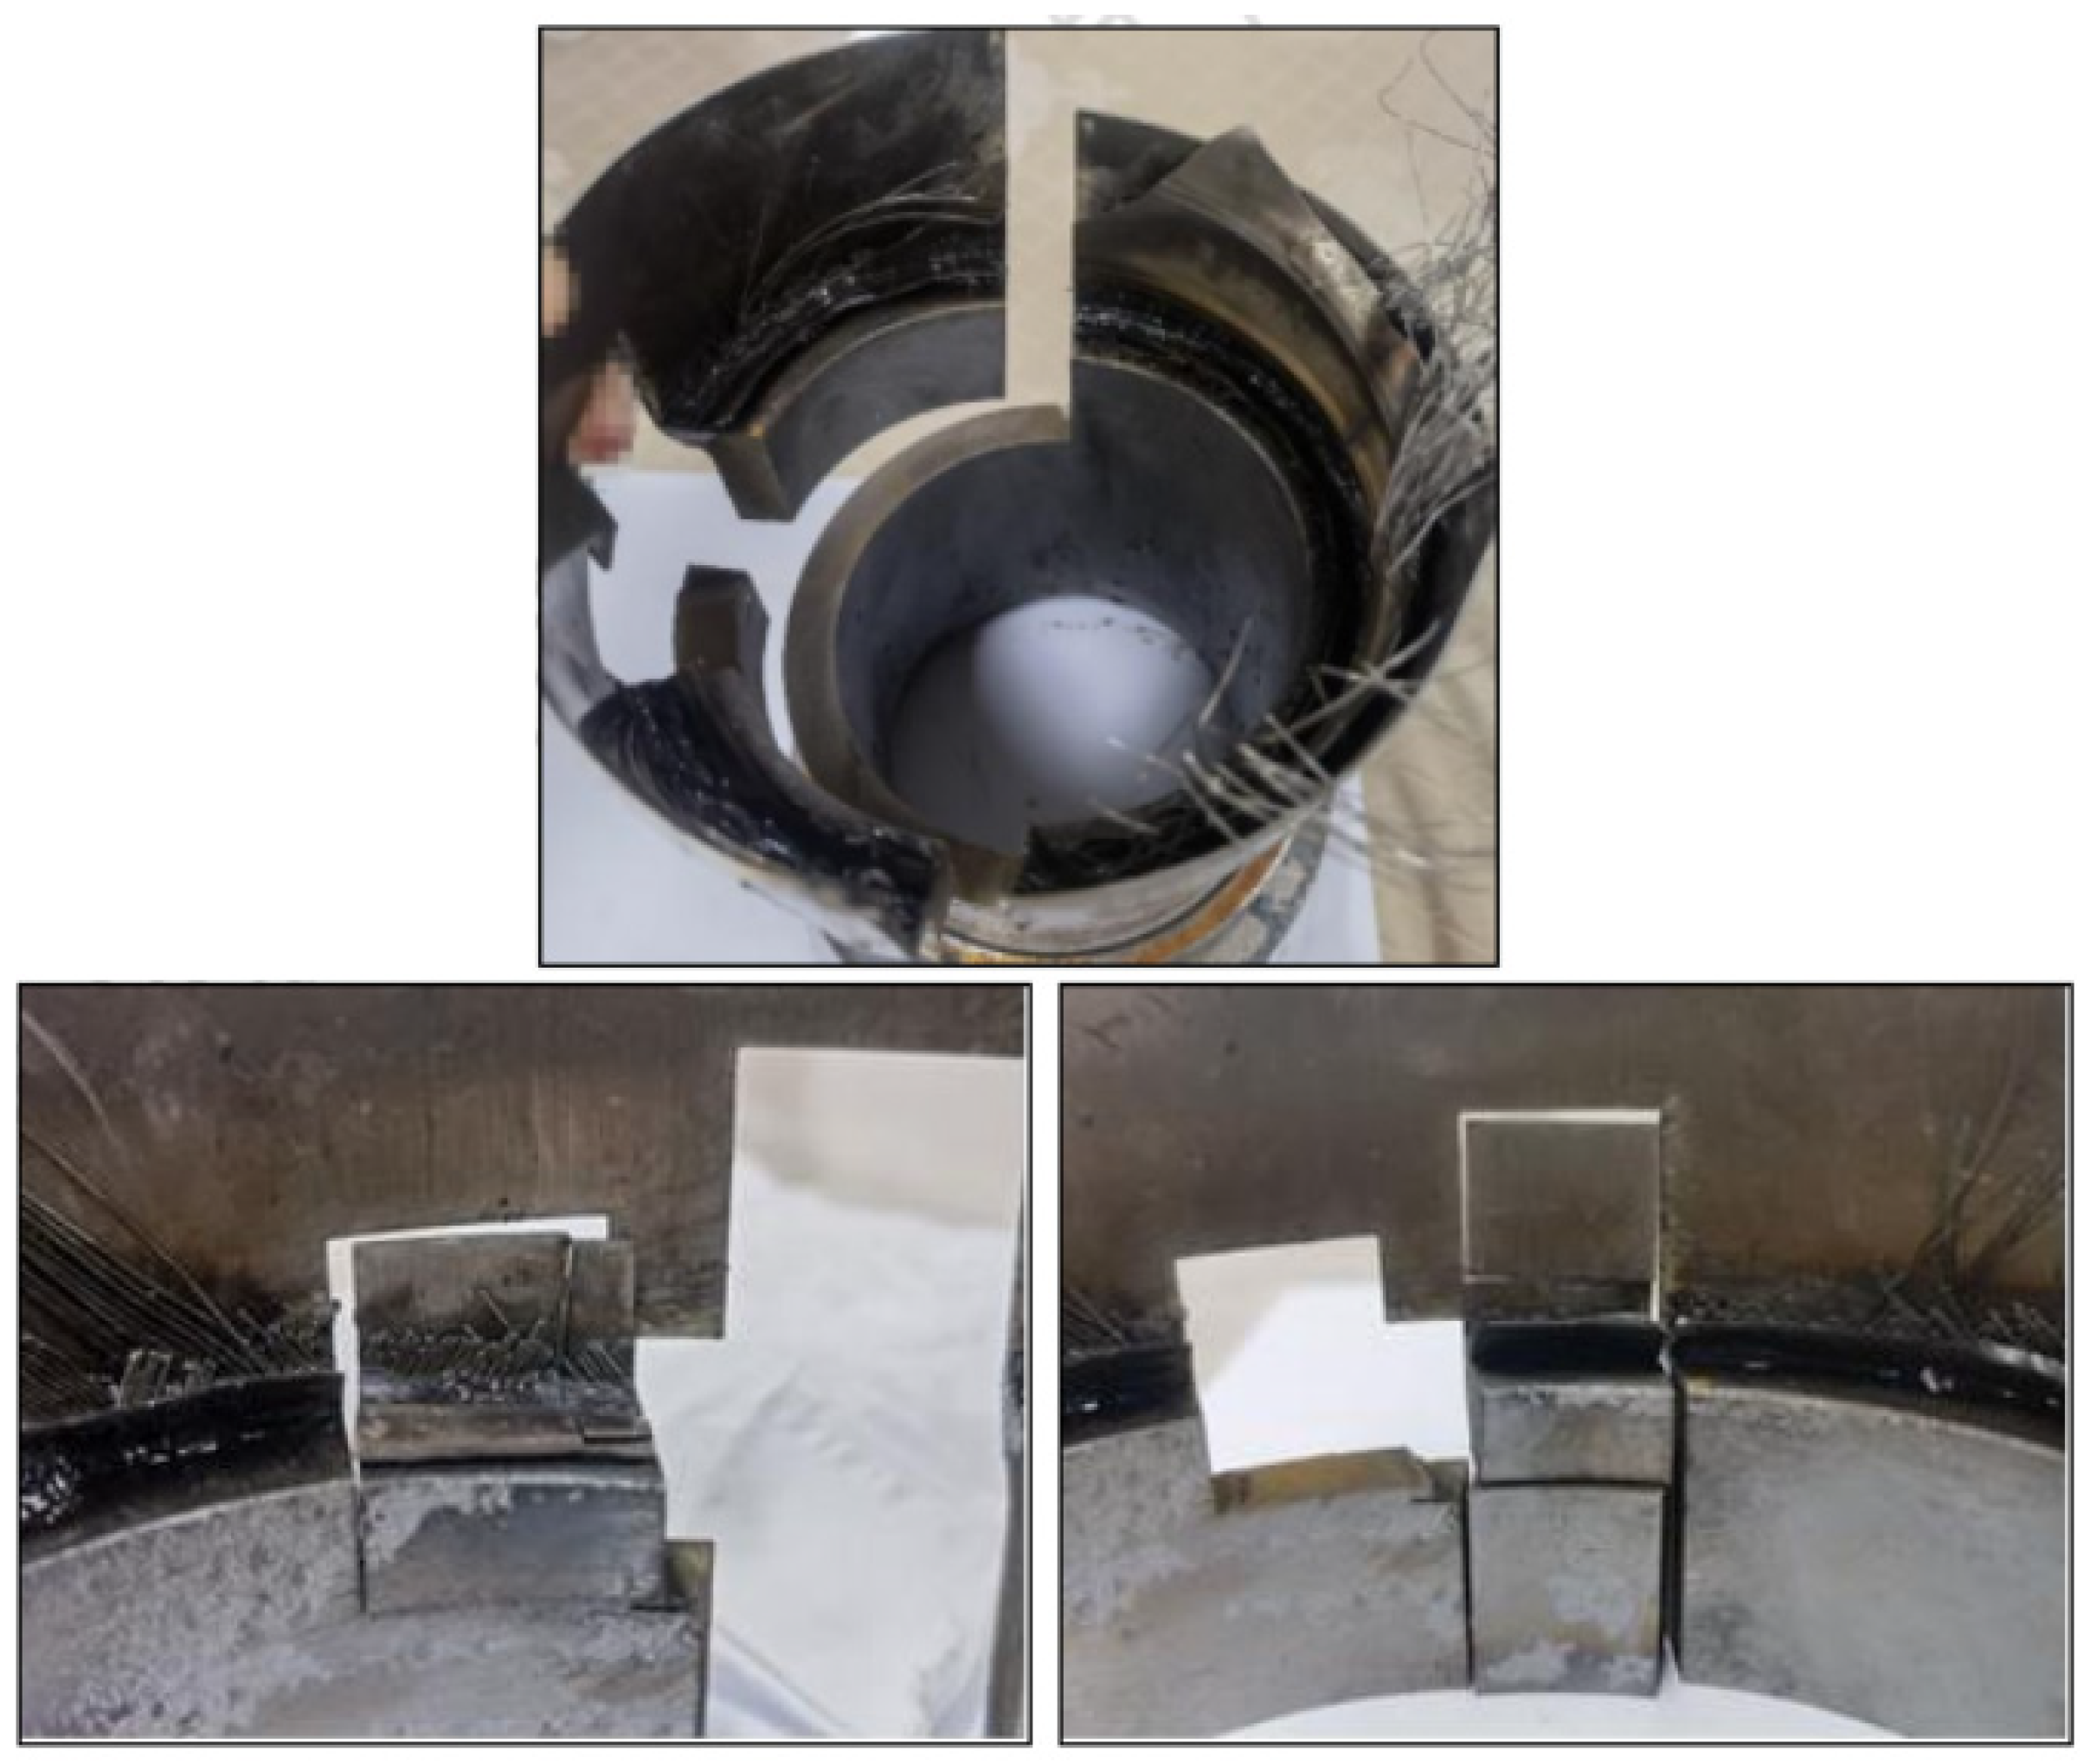
The experimental material studied in this paper is the bellows of the actual accident section, as shown in Figure 1. In 2022, during the injection of liquid carbon dioxide into an outdoor oil well at a certain farm in Daqing, a metal corrugated tube explosion and leakage accident occurred [13]. To thoroughly investigate the cause of the explosion, it was decided to conduct an inspection and analysis of the corrugated tube. This corrugated tube is a special-purpose pressure pipeline made of metal corrugated tubes used in the low-temperature, high-pressure liquid carbon dioxide transportation system of pre-fracturing technology in petroleum extraction. The bellows are made of austenitic 304 stainless steel material. Their structural design features a series of continuous, densely spaced transverse ring-shaped folds (bellows) forming an axially symmetric cylindrical thin-walled tube component [14]. The tube walls exhibit a regular, alternating convex–concave wave-like pattern. The component is primarily composed of a 304 stainless steel wire mesh and a 304 stainless steel corrugated tube sleeve welded at the tube opening, with the welded assembly then fully welded to an outer protective tube and connecting tube. The design pressure is 2.5 MPa. The metal hose has been in service for two months, has not been subjected to any external pressure impacts, and the liquid transported internally is liquid carbon dioxide, which only supports internal pressure. The corrugated tube had undergone strict quality inspection by the company prior to shipment, so the failure is unrelated to product quality.
The main test equipment is a model JSM6510 scanning electron microscope, OXFORD energy spectrometer, Leica DMI 3000 metallographic microscope, and mobile phone camera.

2.2. Macro Analysis

The metal corrugated tube was marked at the root of the fracture as point A, then divided clockwise into four sections labeled ABCD, with point D being the location of the outer tube weld. Figure 1 shows the overall appearance of the fractured component.
By observing the outer surface of the workpiece, there are obvious scratch marks on the outside of C and D. On the outside of A, there are two obvious traces of impact. The obvious collision mark is not completely parallel to the length of the pipe diameter, and there is no obvious difference in the width of the two ends of the trace, which is not the main reason for the failure of the bellows pipe, so it is not explained.
Measurements of the dimensions of various parts of the workpiece indicate that deformation primarily occurred on the C side, which has steel wires. The A, B, and D sections did not exhibit significant deformation. This indicates that the workpiece has an AC-directional tilt, with the internal corrugated tube and woven mesh at location A fracturing preferentially.

2.3. Local Analysis

As shown in Figure 2 and Figure 3, enlarging the inner side of the workpiece allows observation of the full extent of the corrugated tube tear on the inner side. The woven mesh wires did not break from the root but at a certain distance from the welded area. Near the A side, the inner corrugated tube broke along the root, and the corresponding wires broke in an orderly manner. Near the B and D areas, the wires clearly extended toward the woven mesh wires on the C side, and the remaining woven mesh wires on the C side were quite long. This further confirms that the fracture originated from the A side.

2.4. Metallographic Analysis

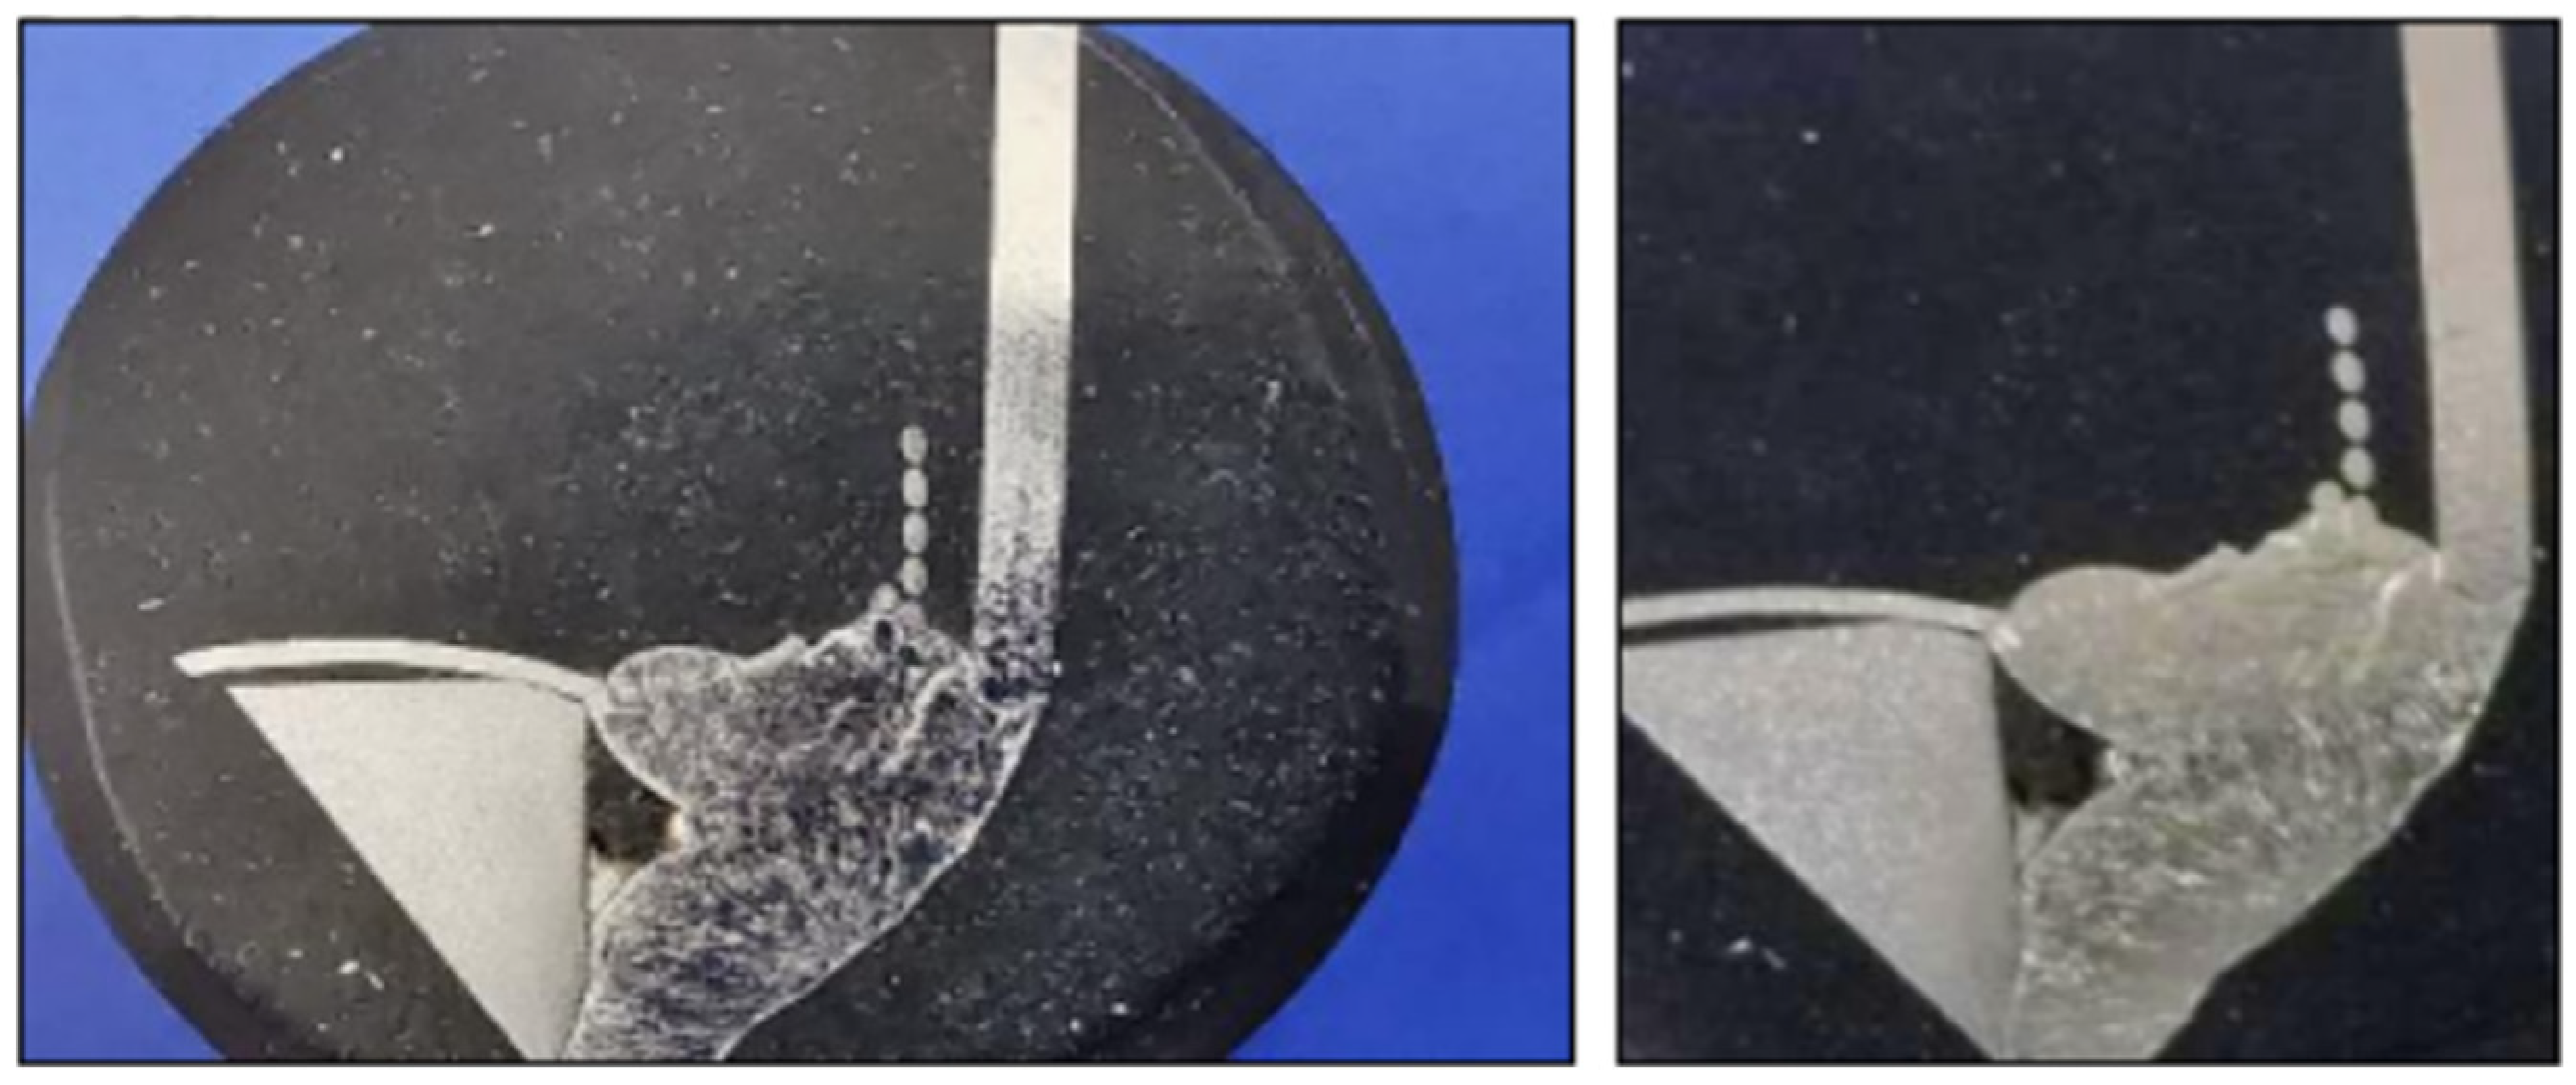
The workpiece was cut open using wire cutting to further determine the detailed location of the fracture, and a localized sample was taken from the area near point A. The A1 sample obtained in Figure 4 is the area most likely to have initiated the fracture, with the inner corrugated tube no longer visible. The steel wires fractured at a height of approximately 2.5–3.5 mm from the root, with visible signs of stretching. The width of the fracture at the lower position is approximately 10 mm. The A1 sample is located at the welded joint, where the flux fusion surface is uneven, and the position is below the fracture of the woven steel wires. Sample A2 Figure 5 shows a sample from the adjacent area. In the A2 region, the fracture lengths of wires in the same weaving direction also vary, indicating that the wires in this area did not fracture simultaneously but rather after the fractures in the A1 region. Additionally, a metallographic specimen was prepared from the welded cross-section between A1 and A2 for microstructural and compositional analysis of the welded region.

2.4.1. Metallographic Analysis of Stainless Steel Wire

As shown in Figure 6, a long mesh steel wire and retrograde mounting were taken and ground into metallography, and the structure was analyzed by a metallographic microscope. Observing that the austenitic grains in the steel wire do not have obvious morphology, such as a bundle of neatly combed fibers or a fiber structure with defective characteristics such as high-density dislocations inside the grains, it indicates that it has not been obviously work hardened. Because it has not been work hardened, the strength and hardness of the steel wire will be relatively low, and the plasticity will be better.

2.4.2. Metallographic Analysis of the Welded Area Cross-Section

Figure 7 and Figure 8 shows a metallographic sample photo prepared from the interface between samples A1 and A2. This was used for metallographic analysis of the welded area. Observation revealed that the welded area was formed by two welds. The first weld involved joining the metal corrugated tube with the woven wire mesh, while the second weld connected the first welded section with the outer protective sleeve and connecting tube. At this location, the fracture height of the woven wire mesh is approximately five wire diameters, and there is no significant difference in distance between these wires and the outer sleeve, suggesting no noticeable pulling behavior toward the inner side. The inner corrugated tube and woven wire mesh exhibit good weld fusion.
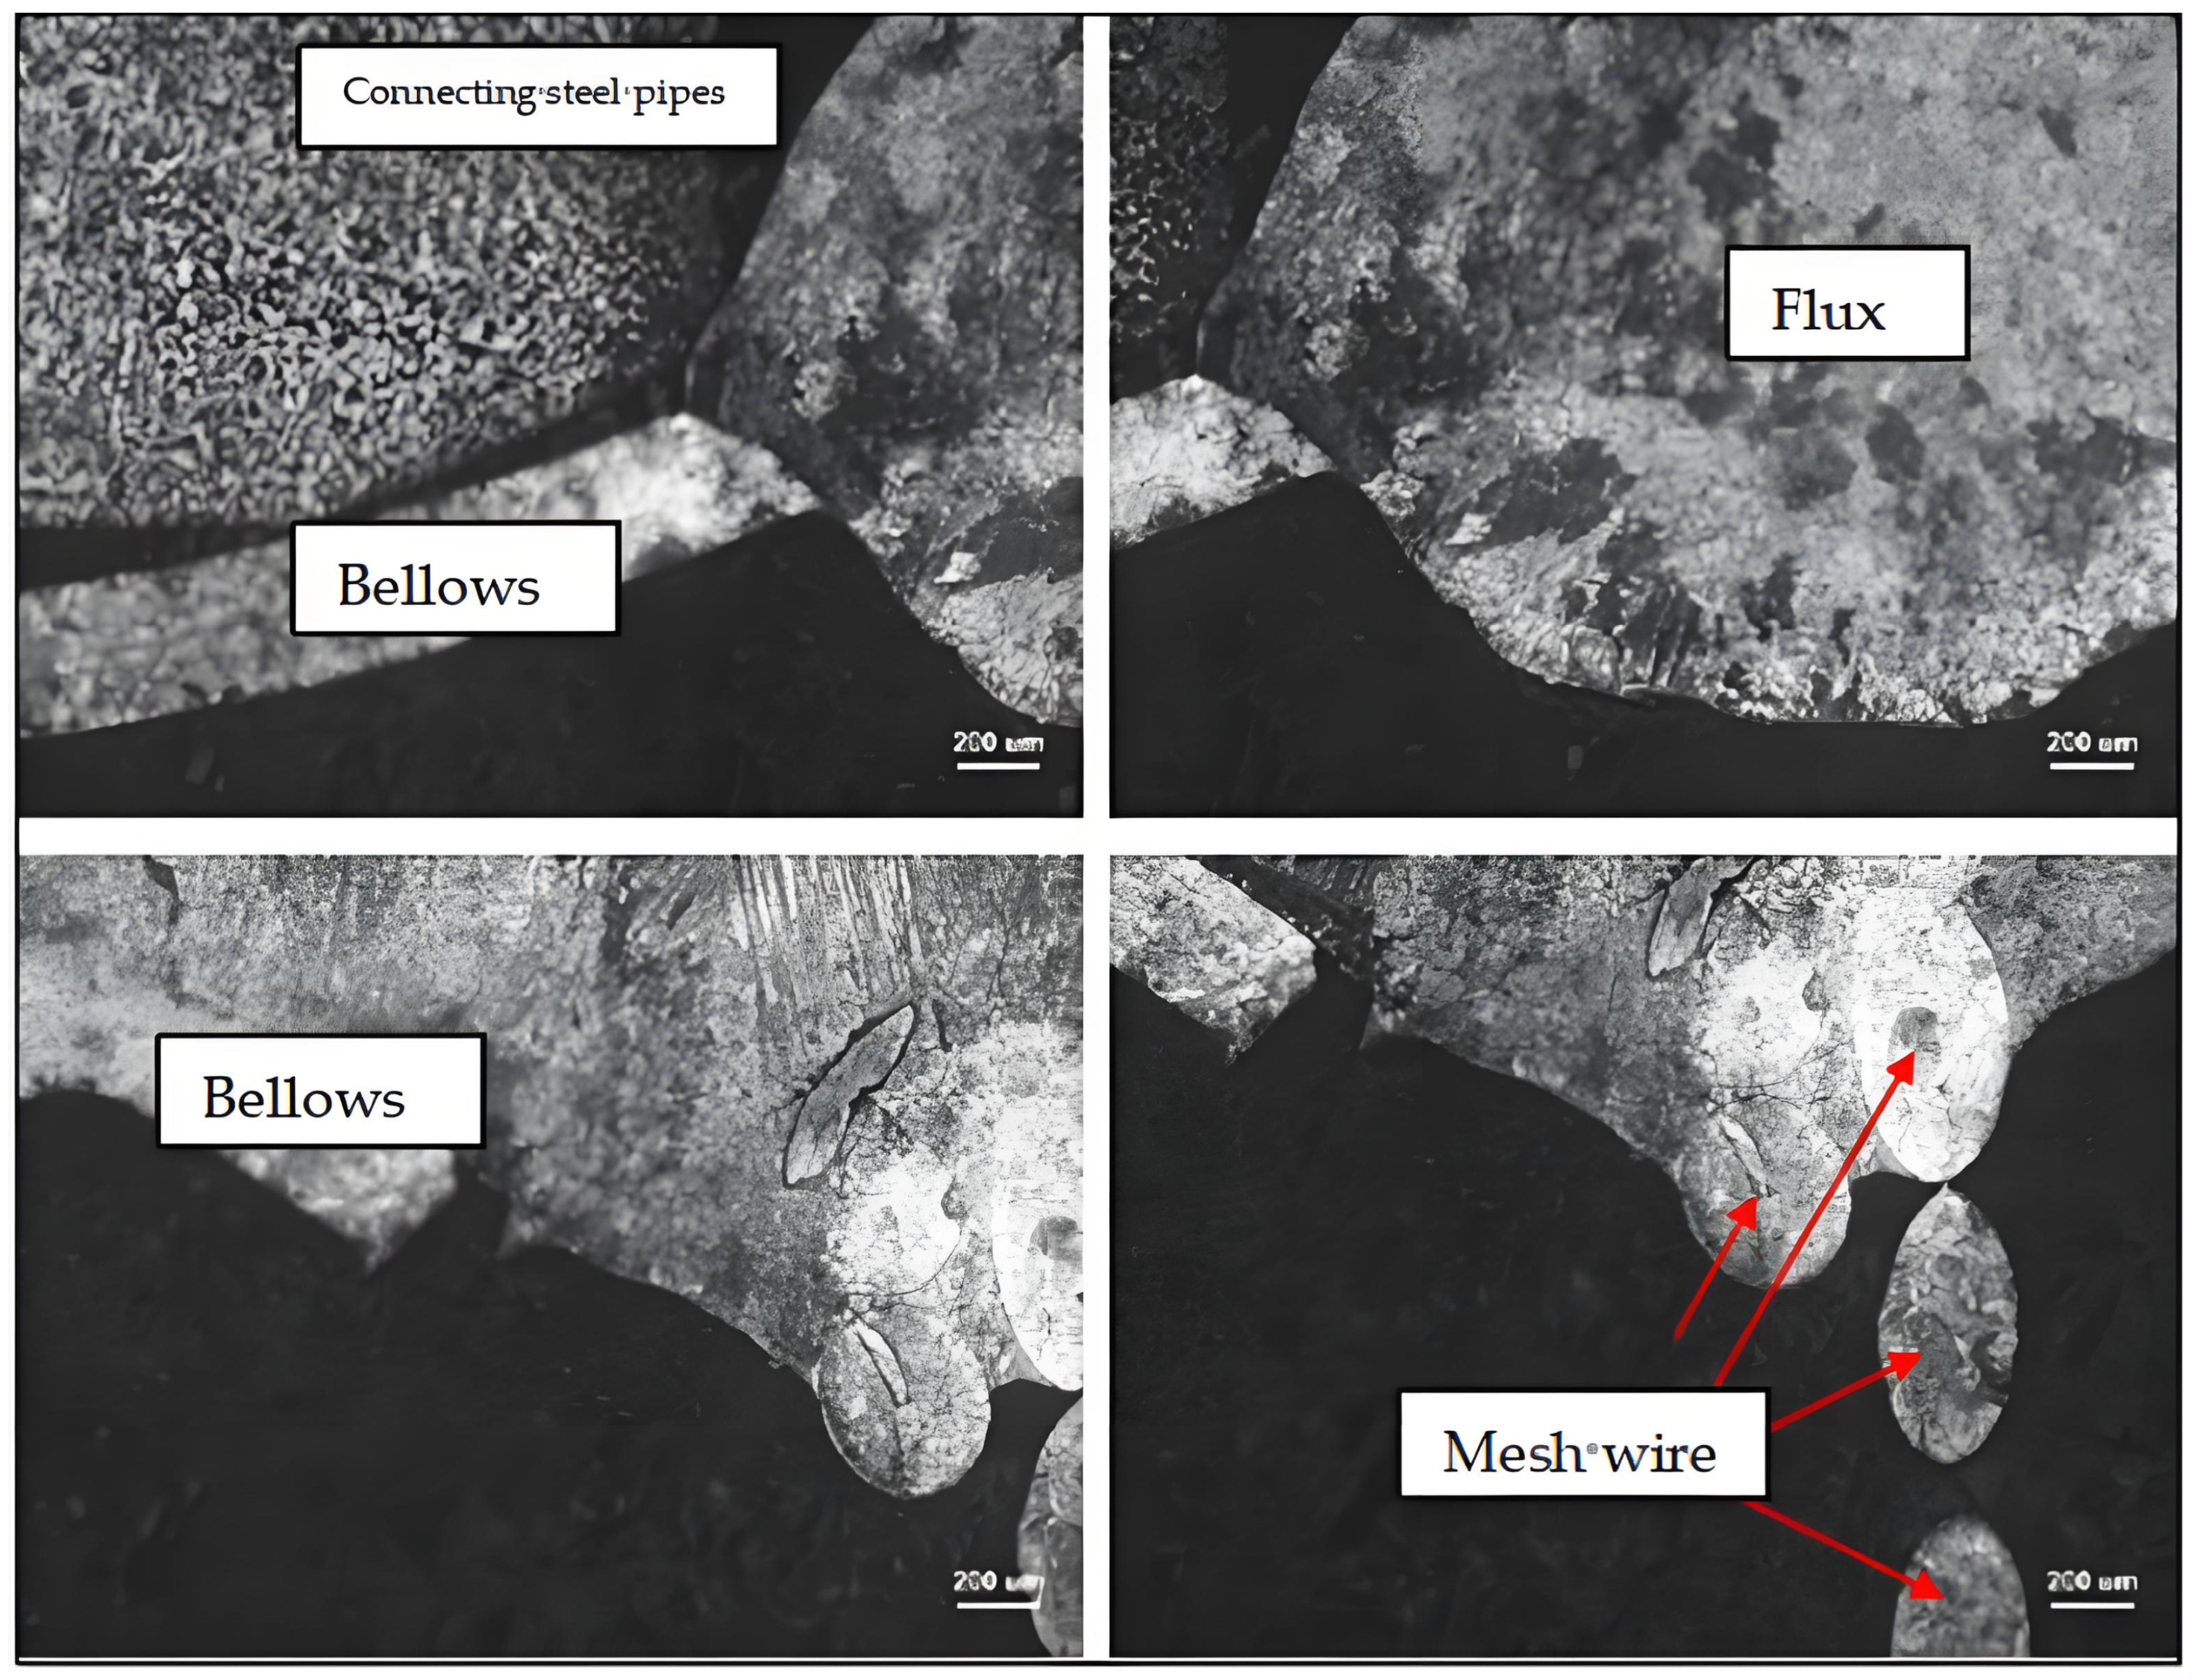
Observe the metallographic photo of the bellows welding area without coarse grinding, fine grinding, and polishing, as shown in Figure 9, of the metallographic photo of the flux area before corrosion. It can be seen that the corrugated tube and woven wire mesh are well fused with the flux, with no gaps between them. Even if the corrugated tube fractures, no cracks form between it and the flux. The corrugated tube has inward-extending tips, indicating that it was subjected to inward tensile forces. At the interface between the corrugated tube and the flux, there are small indentation regions concave toward the flux side.
Pope regia mainly acts on 304 stainless steel through comprehensive corrosion, intergranular corrosion, and pitting corrosion. Its strong corrosion ability stems from the synergistic effect of strong oxidation and chloride ion coordination ability. Figure 10 shows the low-fold metallographic structure of the sample after being corroded by aqua regia [15]. The microstructure of the connected steel pipe consists of ferrite and pearlite, typical of hot-rolled carbon steel. Preliminary judgment suggests it may be Q355 structural steel. After corrosion, the welded area and the corrugated pipe exhibit significantly different microstructures, with a distinct interface. Fibrous structures are visible in the corrugated pipe, indicating that it is made of a cold-rolled steel plate [16]. In the welded area, coarse grain boundaries are observed, indicating some overburning (excessive heating temperature not only causes coarse austenite grains but also local oxidation or melting at grain boundaries, leading to grain boundary weakening). During the analysis process, the specimen was ground again and analyzed using high-magnification metallographic analysis. Figure 11 and Figure 12 shows the high-magnification metallographic image formed after two grindings, revealing that part of the solvent was pulled apart, causing the fracture surface to sunken toward the solvent direction. On one side of the corrugated tube, there is a small segment approximately 20 μm in length remaining perpendicular to the steel plate surface, extending at an angle. In the first metallographic sample, the residual section extended at an angle for approximately 72 μm before becoming perpendicular to the steel plate again. However, in the second sample, the angle of inclination decreased, and the extension distance increased. At the interface between the corrugated tube and the flux, a black area was observed.

2.5. EDS Composition Analysis

As shown in Table 1, the steel wire was prepared into metallographic samples and placed on an energy-dispersive spectrometer (EDS) to analyze its composition, yielding the following results: Fe-18.55Cr-9.62Ni-1.67Mn (wt.%). The main element contents are consistent with the standard composition of 304 stainless steel, indicating that the material used in the workpiece is 304 stainless steel.
As shown in Table 2, Table 3 and Table 4, Prepare cross-sectional samples of the welded area near the port and analyze the composition of each region using an energy-dispersive spectrometer. The composition of the corrugated tube is Fe-18.03Cr-9.28Ni-1.42Mn, which is consistent with the main element content in the standard composition of 304 stainless steel. Therefore, it can be inferred that the material of the metal corrugated tube is 304 stainless steel. The composition of the flux is Fe-14.51Cr-2.70Ni-10.61Mn, with Cr and Ni content significantly lower than that of the metal corrugated tube, and Mn content significantly higher than that of the metal corrugated tube. The connecting sleeve does not contain Cr, and its Mn content is 1.09%. Based on the detected microstructural characteristics, it is inferred that the material of the connecting tube is hot-rolled Q355 steel pipe. The sleeve at the mesh connection contains 20.95% Cr and trace amounts of Ni and Mn, differing from the previous materials, and is therefore inferred to be another type of stainless steel.
Welding carbon steel with 304 stainless steel poses significant risks due to increased chromium carbide content in the weld, primarily resulting in brittle martensitic layers formed by carbon migration and electrochemical corrosion. This practice should not be undertaken without rigorous process qualification and specialized expertise, particularly in pressure vessels, piping, or critical structures. For critical applications, adherence to relevant standards (e.g., ASME BPVC Section IX, API) and rigorous welding procedure qualification testing are mandatory. This also provides a reference basis for identifying accident causes in subsequent analyses.

2.6. Scanning Electron Microscope Analysis of the Fracture Surface

2.6.1. Scanning Electron Microscope Analysis of the Weld Cross-Section

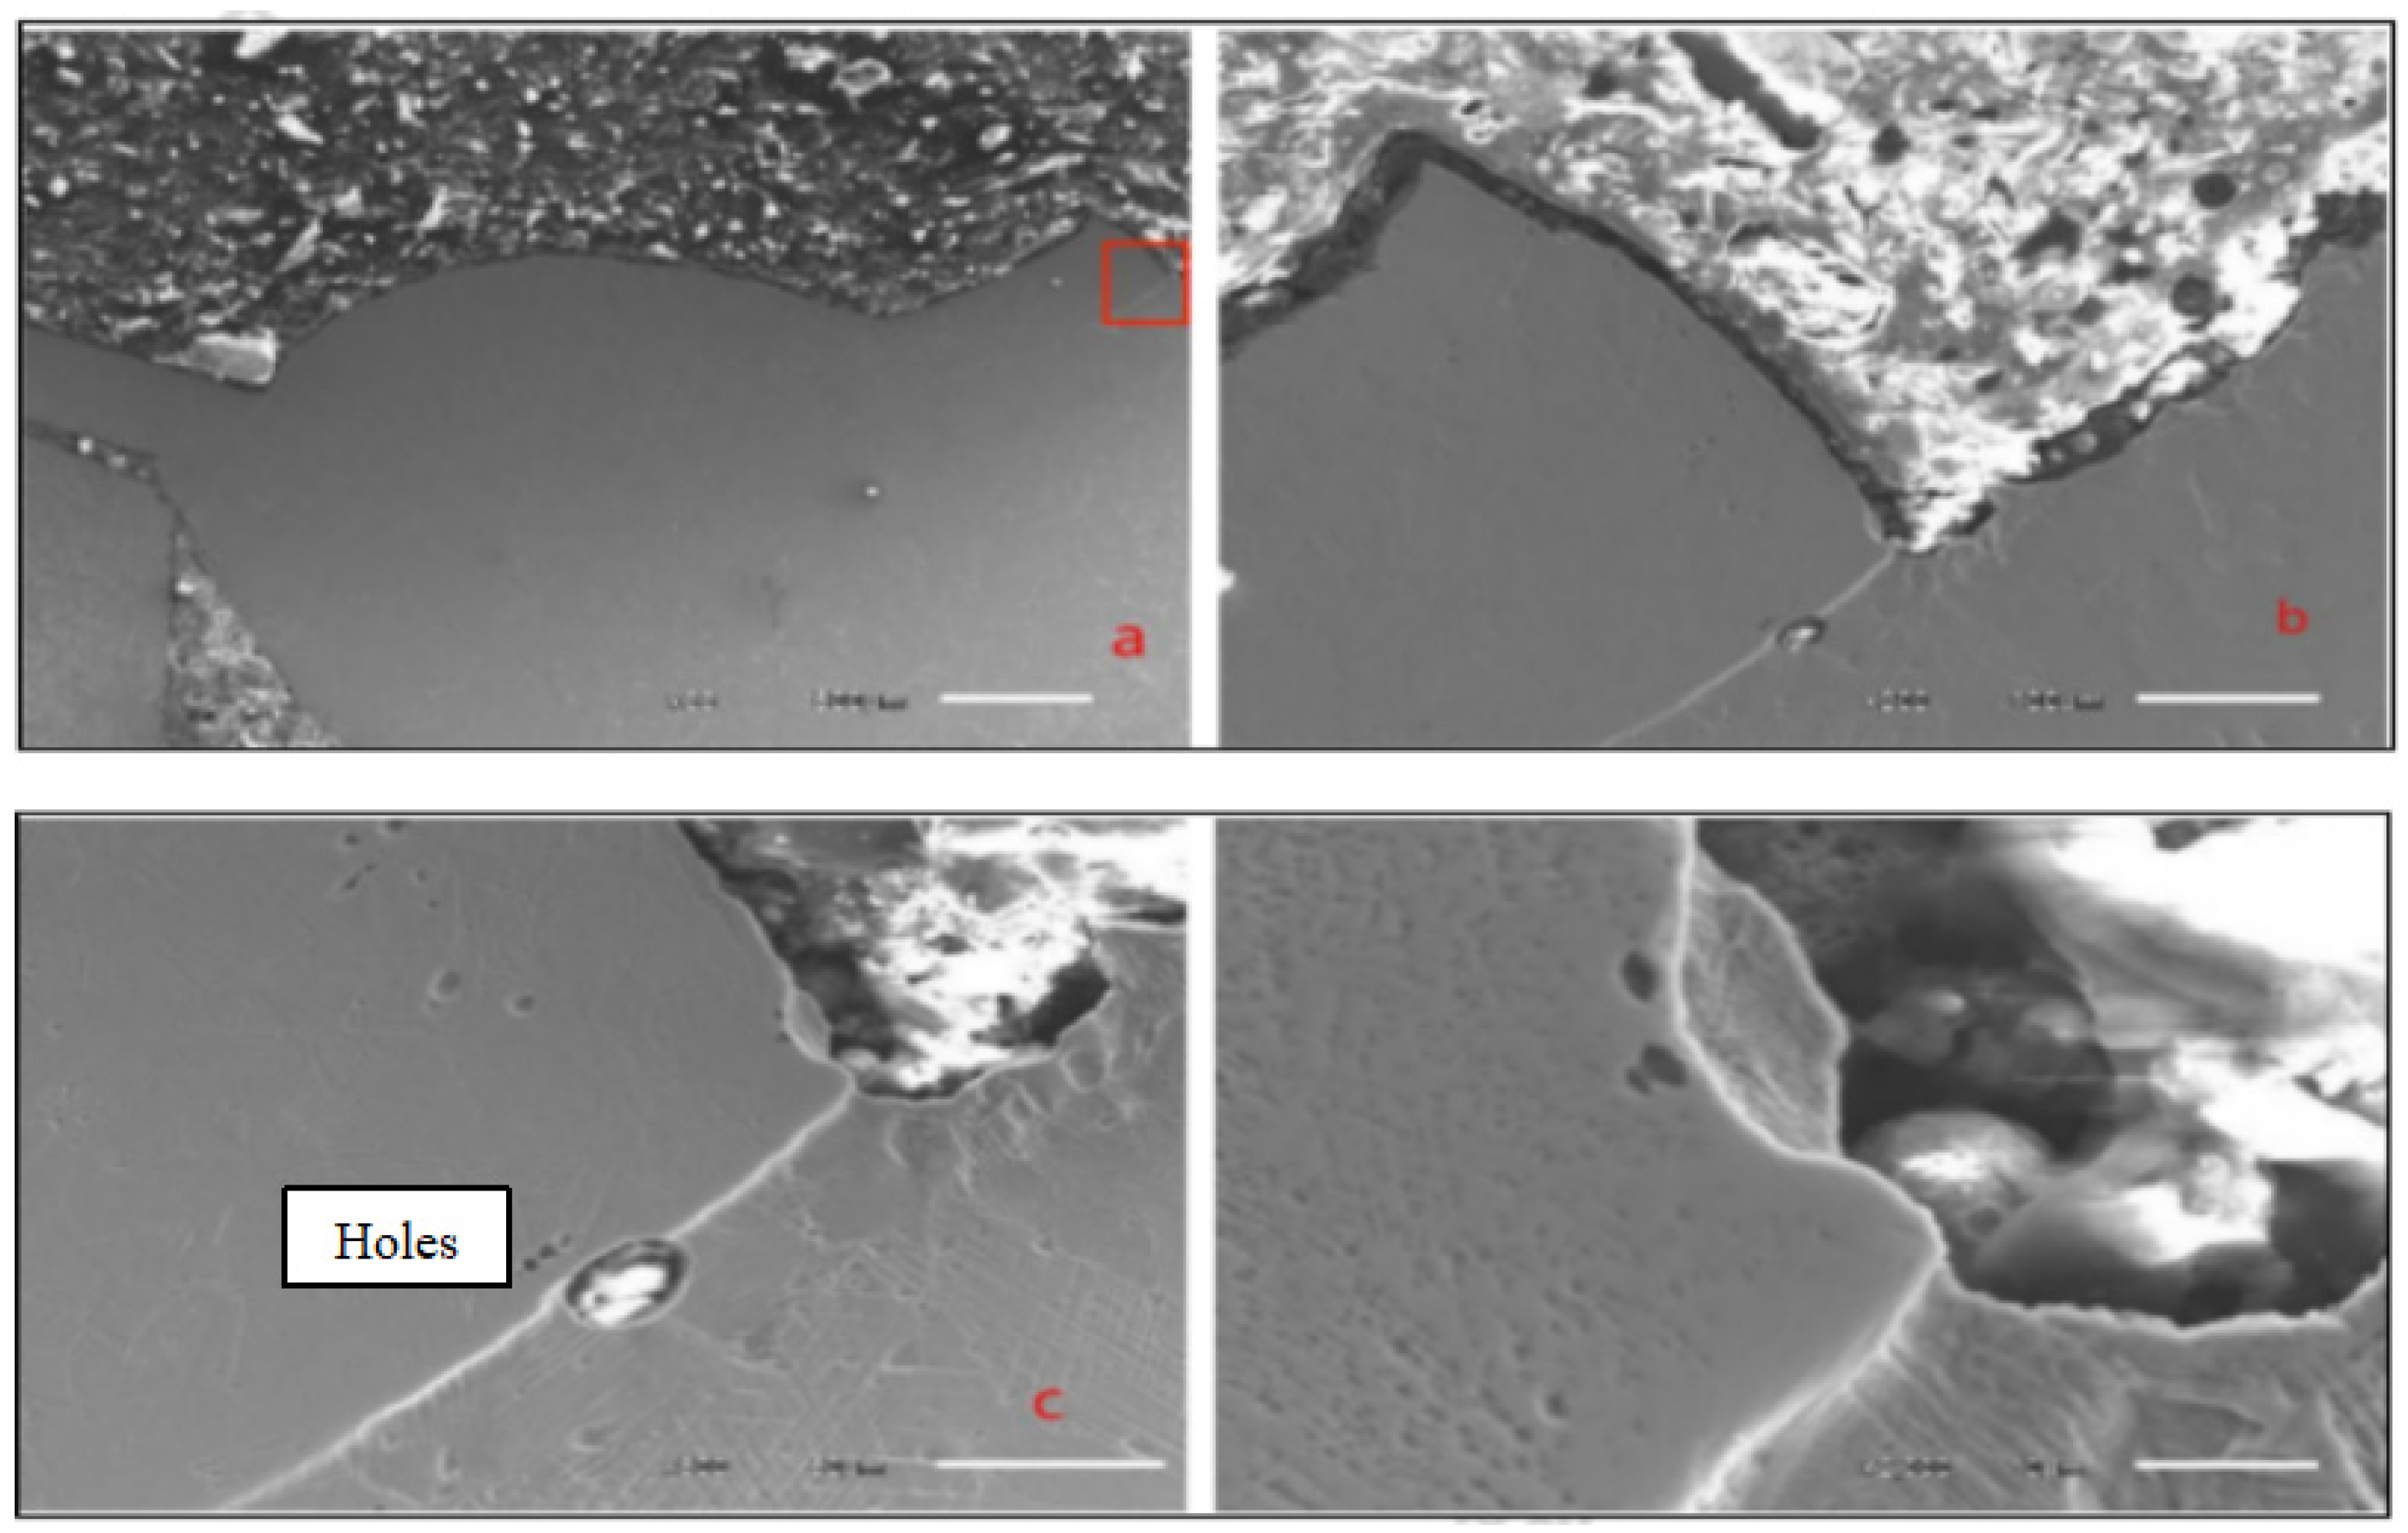
As shown in Figure 13, a scanning electron microscope analysis was conducted on the weld cross-section of the corrugated pipe in the accident section. A hole was observed at the interface between the corrugated pipe steel plate and the flux, while no obvious cracks were found in other areas. This indicates that the hole was not formed after the accident but was a defect left during welding. At the edge of the region where the flux is indented, abnormal shapes were observed in the flux structure compared to other parts, suggesting that the corrugated pipe and part of the flux were torn apart by a large force in a short period of time. A protrusion on the fracture surface of the flux indicates the presence of welding defects.

2.6.2. Analysis of the Fracture Morphology of the Woven Wire Mesh

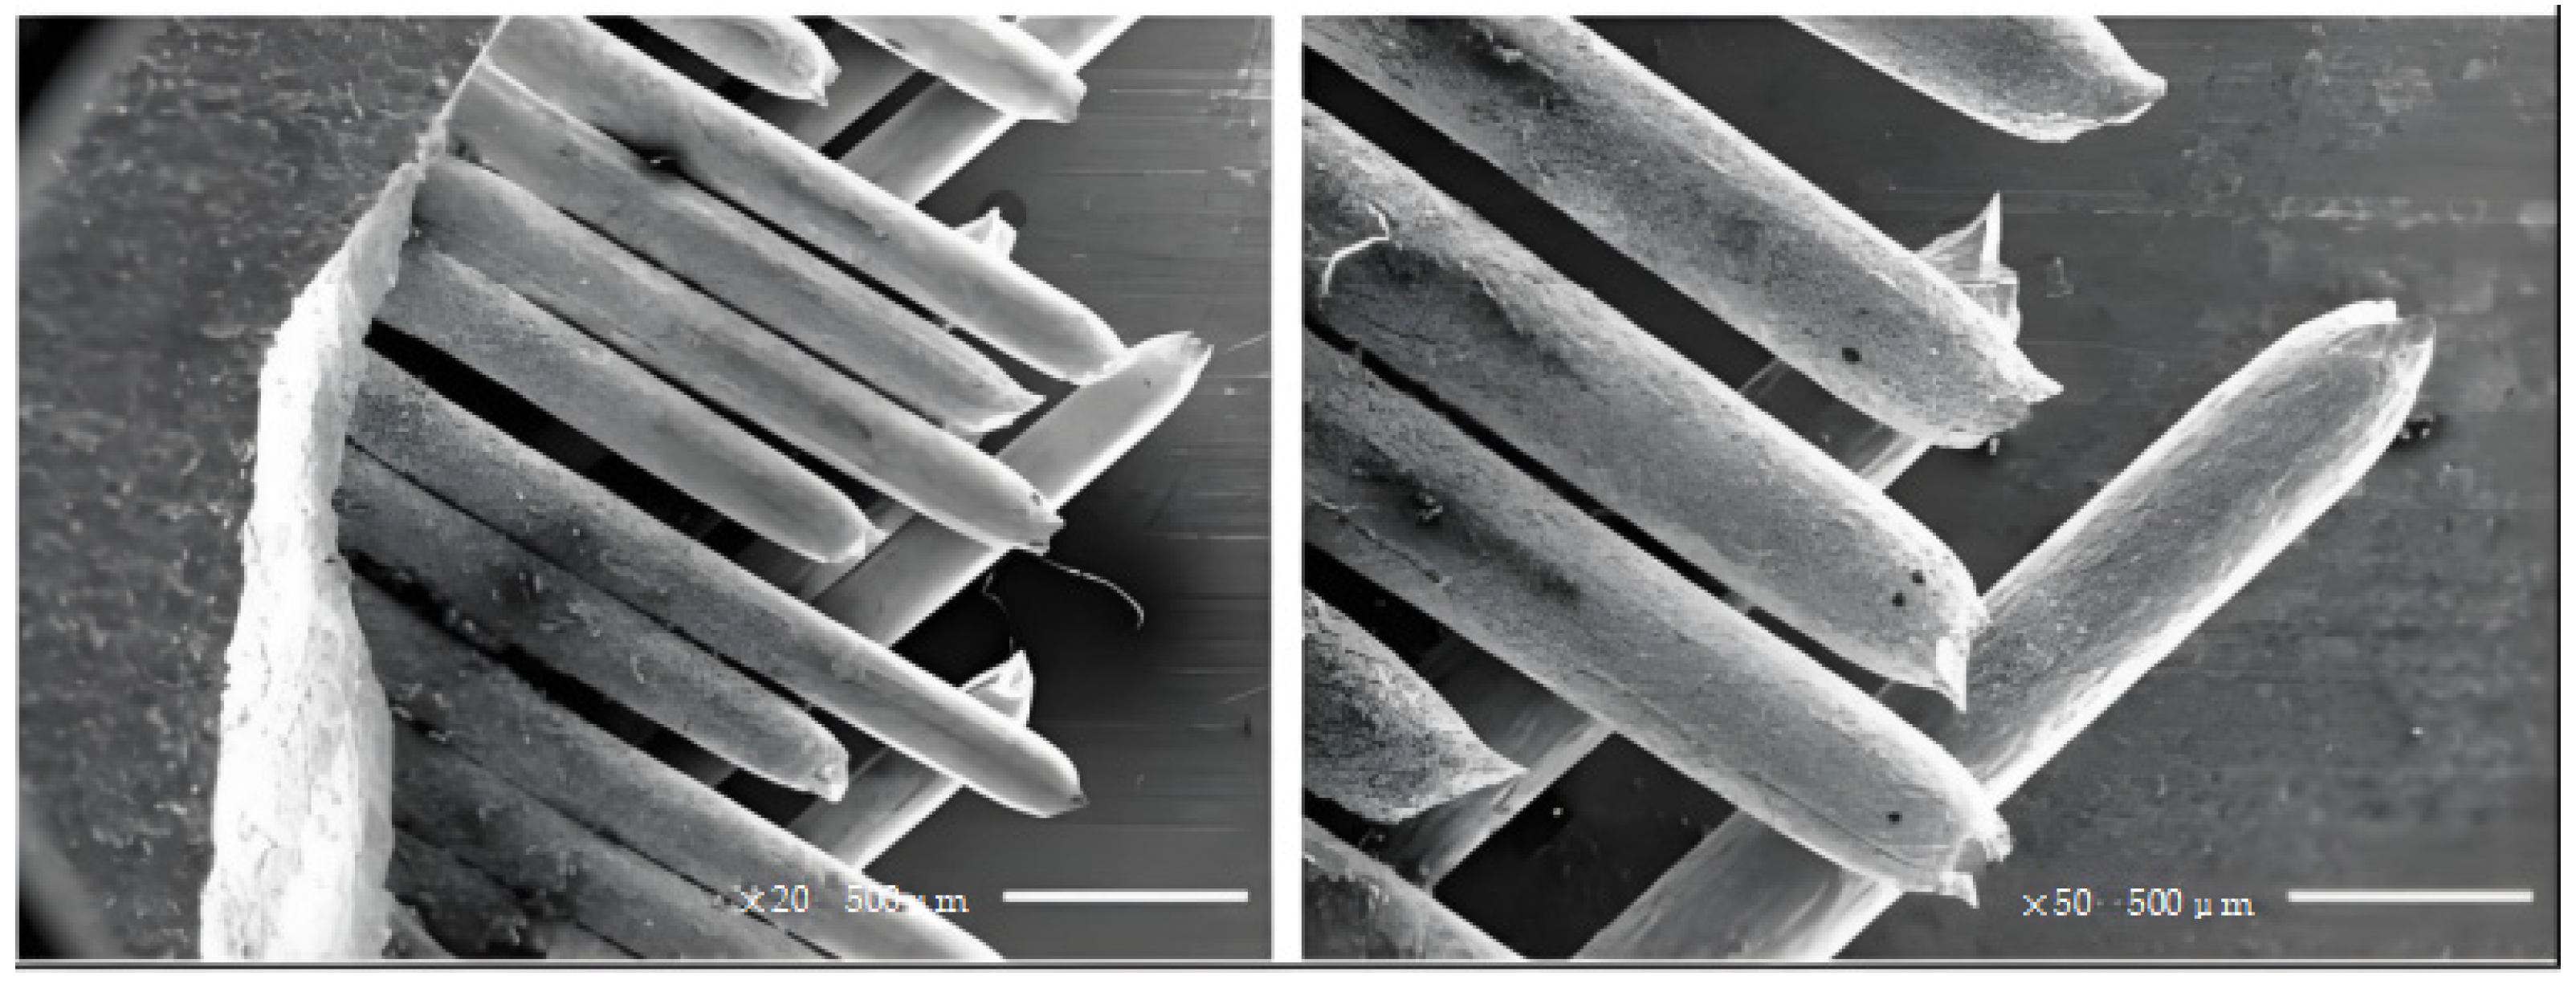
As shown in Figure 14, SEM scanning of the wire at the fracture site revealed significant necking of the wire prior to fracture, with distinct ductile dimples present at the fracture surface. This suggests that the woven wire mesh was fractured under high tensile force, and the wire exhibited good ductility. The steel wire did not bend inward from the weld interface toward the tube interior. Instead, the inner side of the corrugated tube fracture occurred at the weld interface. This confirms that the corrugated tube fractured first, subsequently breaking the outer woven steel wire.
Observing the area indicated in Figure 15, there is no obvious difference in the fracture direction of the woven steel wires in different directions in this area, which can be inferred to be the area where the woven steel wires first fractured.

2.6.3. Analysis of the Fracture Morphology of the Corrugated Tube [17]

Figure 16 shows the scanning electron microscope photo and enlarged view of some bellows fractures. There are obvious fractures on the fracture, especially near the side of the inner tube, and there are obvious plastic fracture characteristics, indicating that it has been broken under great tension. Near the side of the braided wire, the fracture is relatively flat, the flaw is small, or even not obvious, and there is no obvious source of fatigue cracks. Microscopic analysis of the fracture found that the surface of the fracture was distributed with elongated ductile flesh. These grooves exhibit significant directionality, and their long axis orientation tends to be consistent, indicating that the cracks are propagated under high unidirectional or cyclic tensile stresses, which is consistent with the conditions under which the bellows are subjected to large alternating bending loads. In addition, the failure component had a break width of approximately 0.29 mm, which is slightly thinner than the measurement of historical data. More importantly, secondary cracks were observed in the area where the fracture surface meets the braided wire (shown by the red arrow in the figure). The crack is narrow and long, and it originates from the edge of the steel wire with a significant stress concentration, which is consistent with the dissociation caused by excessive tensile stress. This finding further confirms that the site was subjected to severe tensile overload during failure.

2.6.4. SEM Analysis of the Fracture Surface at the Interface Between the Corrugated Tube and the Woven Wire Mesh

As shown in Figure 17, near point A, although the corrugated tube fractured at the boundary with the welded area, the fracture surface is not smooth and has a wavy shape. At higher positions, there is no obvious gap between the corrugated tube and the flux, while at lower positions, there is a certain gap between them, with foreign objects present in the gap. At lower positions, there are more foreign objects toward the side closer to the woven wire mesh. In this area, there is a certain gap between the corrugated tube and the flux, and the fracture originated from the root.

2.6.5. SEM Observation of the Transverse Section of the Broken Steel Wire

As shown in Figure 18, the spacing between the woven steel wires varies, but most are closely arranged. The steel wires at the fracture site show obvious necking, indicating a ductile fracture under tensile stress. The fracture lengths within the same group of steel wires are inconsistent, and the fracture directions of some adjacent steel wires also differ, indicating that these woven steel wires did not fracture simultaneously.

3. Establishment of the Finite Element Model of the Metal Corrugated Tube

3.1. Establishment of the Corrugated Tube Model

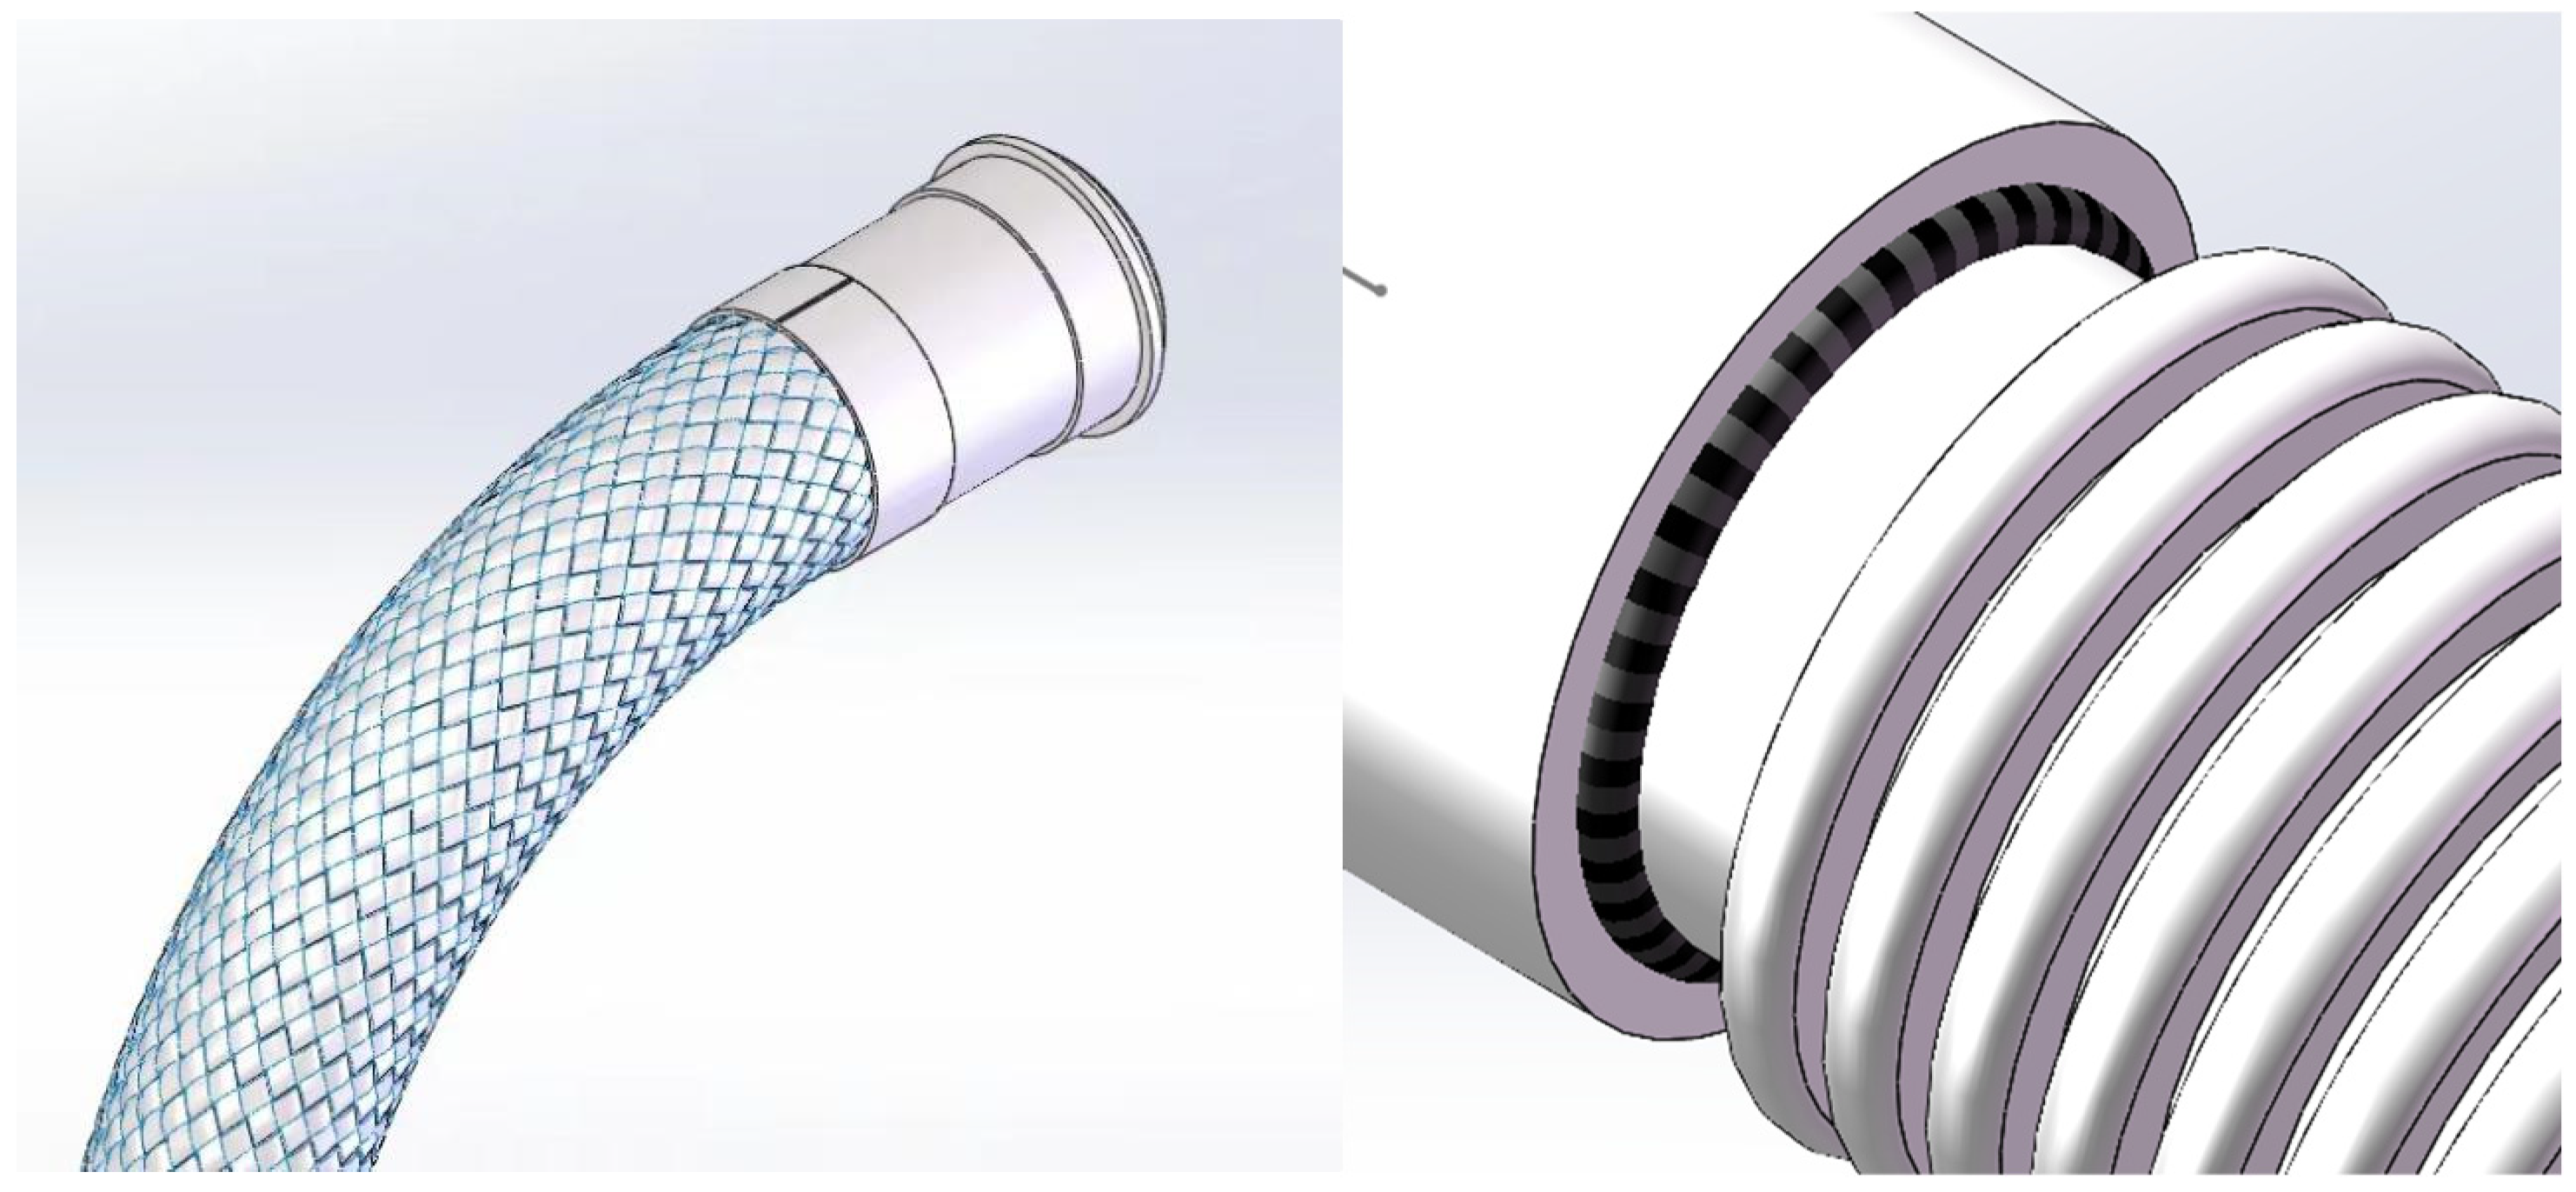
According to the actual situation, the three-dimensional model of the intact metal bellows is established with SOLIDWORKS, and the metal bellows are bent at a bending angle of 90°. The basic parameters of metal bellows are shown in Table 5. After that, it is connected with the braided steel wire and the outer protective cover, and the bellows show a natural bending state, which is convenient for subsequent real simulation. The internal metal bellows and internal connection cannot be seen from this figure, so the external braided steel wire is hidden, as shown in Figure 19, which is a schematic diagram of the internal connection without welding defects.

3.2. Mathematical Models

In order to establish the equation, modern engineering simulation combines the classical laws of physics (conservation of mass and momentum) with the mathematical model of modern development (turbulence model) to solve complex industrial problems (bellows failure analysis).
Continuity equation [18]:
ρ / t + ( ρ v ) = 0
In the equation, ρ represents the fluid density (which is a constant for incompressible fluids), v represents the velocity field of the fluid, and represents the divergence operator.
Momentum equation [19]:
ρ u ¯ t + u ¯ u ¯ = p ¯ + τ lam ρ   u ¯   u ¯ + ρ f
In the equation, u ¯ and p ¯ are the time mean of velocity and pressure, τ lam is the laminar viscous stress, and the Reynolds stress term ρ u ¯   u ¯ is the additional stress caused by turbulent pulsation, which needs to be closed by the turbulence model (k-ω).
Standard k-ω model equations [20]:
The expression for turbulent energy k is
k t + u k = P k β * ρ k w + ( ( v + σ k k w ) k )
The expression for turbulence dissipation rate ω is
ω t + u ω = γ ω P k β ρ ω 2 + ( ( v + σ ω k ω ) ω ) + 2 ( 1 F 1 ) σ ω 2 ω S 2
where k is the turbulent flow energy, ω is the turbulence dissipation rate, u is the velocity field of the fluid, ρ is the density of the fluid, v is the dynamic viscosity, Pk is the turbulence generation term, and S is the strain rate tensor. α , β , β * , σ k , σ ω are the model constants, and the values of different versions of the k-ω model are different.
This paper selects the Wilcox Revised Standard k-ω model (2006), α = 0.52 ,   β = 0.0708 ,   β * = 0.09 ,   σ k = 0.6 ,   σ ω = 0.5 .
Energy equation: applicable to heat transfer or compressible flow.
This paper primarily investigates the failure mechanism of corrugated tubes, where the failure fracture occurs at the welded joint between the corrugated tube and the external connector. Since the contact time between the fluid and solid is brief, there is no need to consider heat exchange issues at the coupling interface. During simulation and solution, only the continuity equation and momentum equation need to be considered [21].
Unidirectional fluid–structure interaction model [22] with linear elastic mechanics equations [23]:
ρ s 2 u 2 t = σ ( u ) + f s o l i d
where u is the structural displacement, ρ s is the structural density, σ (u) is the stress tensor caused by the displacement, and fsolid is the external force acting on the structure.
In this paper, a one-way fluid–structure coupling method is adopted. Single fluid–structure coupling focuses on the influence of the fluid on the structure, without considering the feedback effect of the structure on the fluid. The equation for the two-way fluid–structure coupling fluid domain is the same as that for single-nomial coupling. The difference is that the displacement or deformation of the structure affects the boundary conditions of the fluid domain, which often requires moving the boundary to achieve this. Thus, the equations of fluids and structures are coupled together, solved through iterations until they converge. In order to simulate the state of the metal bellows after passing through the medium, the time of liquid carbon dioxide flowing out of the inlet is instantaneous [24], which will only produce a stress concentration of 2 s, and the structural deformation has little effect on the fluid flow [25], only for the sole impact of the fluid [26].

3.3. Parameter Settings

The fluid calculation parameters in the pipeline are set according to the real working environment, and the relevant thermophysical parameters are extracted from the user manual and standard database provided by the enterprise for purchasing bellows materials. See Table 6 for details [27].
According to the metal materials manual and standard materials database, the mechanical properties of 304 stainless steel are shown in Table 7 [28]. After comparison, it can be seen that the comprehensive mechanical properties of 304 stainless steel are still very good at a low temperature of −10 °C [29], and even the strength has been improved, while maintaining good plasticity. This makes it often used in cryogenic environments. Potential phase transition (highly unlikely at −10 °C) [30]: Martensite phase transitions (induced martensitic) can occur at low temperatures, but this usually occurs at lower temperatures (e.g., below the Ms point) or with plastic deformation [31]. In a static environment of −10 °C, this phase change is almost negligible and has no noticeable impact on performance [32]. The increase in yield strength mainly affects crack development by changing the size of the plastic zone at the crack tip and the local plastic strain amplitude. In most cases, increasing yield strength reduces the local deformation amplitude of the crack tip, thereby slowing down the propagation rate of fatigue cracks in the medium velocity region. However, it should be noted that the increase in strength may be accompanied by a decrease in fracture toughness, which will increase the risk of crack instability and propagation. This dependence is nonlinearity and must be established by the cyclic constitutive relationship of the material (cyclic stress–strain curve). Ultimately, in engineering, this dependence is integrated into material constants determined by experiments (such as C and m in Paris’s law) or accurately calculated through advanced elastoplastic numerical simulations. Therefore, in order to accurately calculate the crack development of a particular material, it is necessary to obtain experimental data on the fatigue crack propagation rate of the material at the corresponding strength level, or to have an accurate cyclic plastic model and perform numerical analysis.
According to the actual working environment of the enterprise, the flow field inlet is set as the speed inlet, the outlet is set as the pressure outlet, and the unidirectional fluid–structure coupling flow field of the metal bellows is calculated through ANSYS Workbench 2020R2 software, and the fluid boundary and initial conditions are shown in Table 8 [33].
After directly importing the model into Fluent, the NIST database is referenced to locate the CO2 substance and insert it into the database. This substance can automatically undergo property transformations based on the set temperature and pressure to meet simulation requirements.

3.4. Mesh Generation

3.4.1. Fluid Domain Mesh Generation [34]

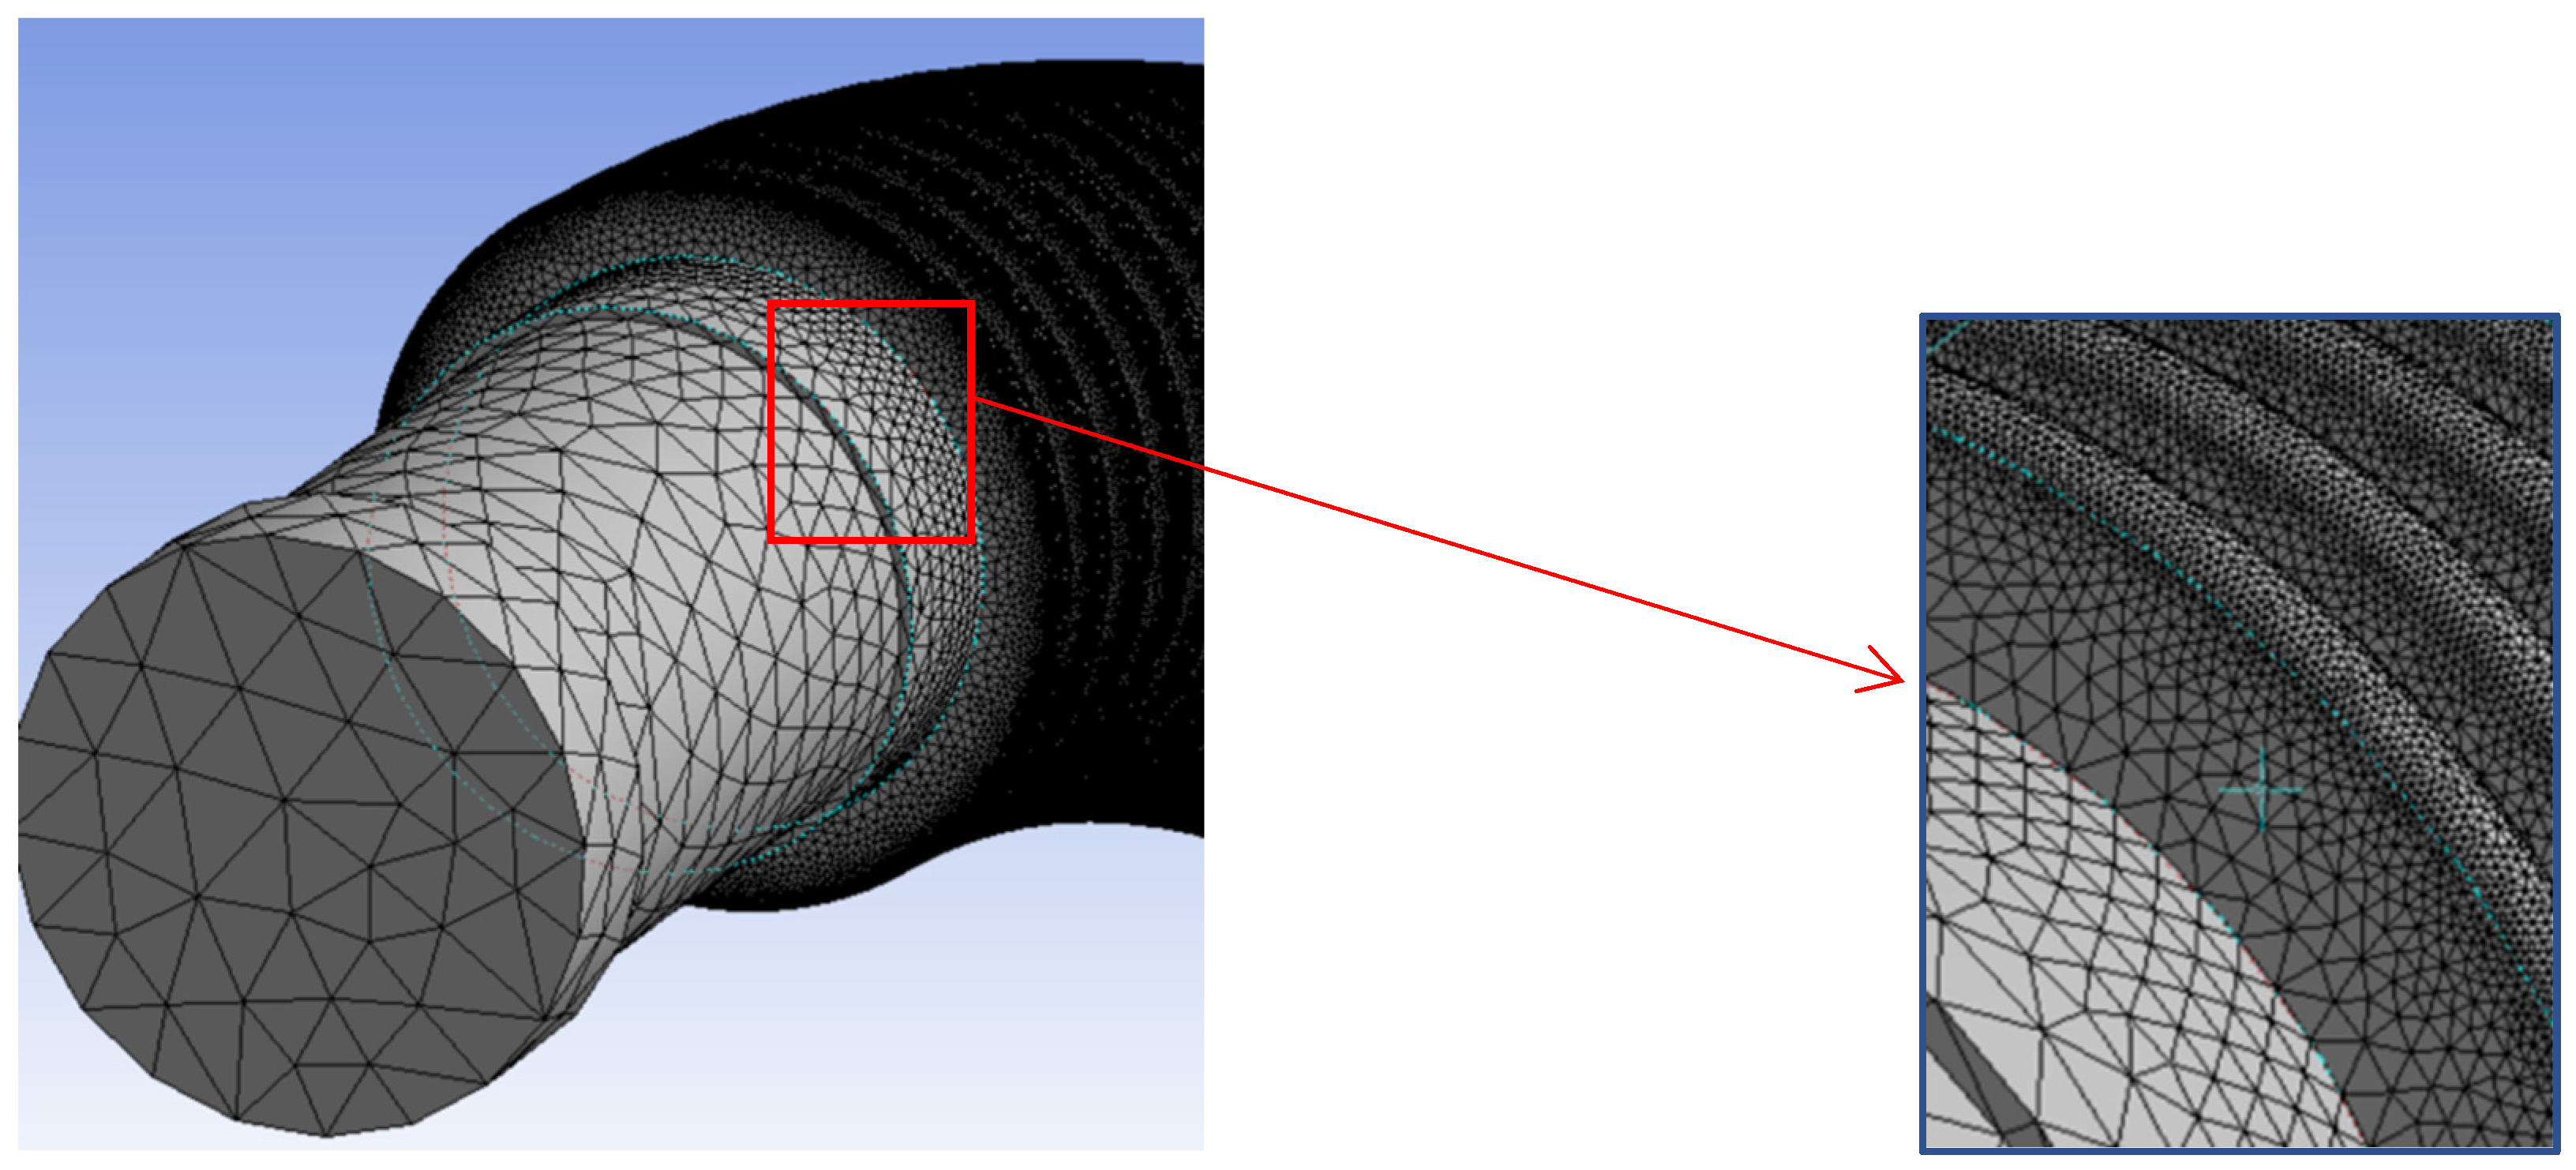
In this study, as shown in Figure 20, the mesh module built into the Workbench Static Module was used for mesh generation. Since the research object is a metal corrugated tube, the hexahedral mesh generated using the sweeping method for rotating bodies is highly regular and of high quality, and it is less prone to errors during calculations.
To calculate the force conditions of the fluid within the object, two mesh divisions are required. First, the fluid domain must be meshed. Considering the complex structure of the metal corrugated tube assembly, direct meshing of the fluid domain is not feasible. First, the entire assembly is enclosed using the shell command and then cut along the plane of the inlet and outlet, suppressing the excess solid portions to obtain the internal fluid domain space. During this process, the fluid domain appears transparent, allowing clear observation of fluid flow and force conditions. By utilizing the shell command and cutting techniques, the geometric shape of the internal fluid domain can be accurately obtained and used for subsequent mesh generation and fluid dynamics analysis.
As shown in Figure 21, after the fluid domain is established, enter the mesh module and directly divide it into meshes:
Due to the complex forces and small force-bearing area at the corrugations of the corrugated pipe, the mesh is denser in this area. During the solution process, while keeping the constraints and input load sizes unchanged, the mesh is refined, and the model is simulated multiple times. By comparing the stress calculation results under different mesh conditions, the mesh independence is determined. When the influence of mesh density on the results can be neglected, a mesh-independent solution can be obtained. To verify the mesh independence, six sets of data were compared under the conditions that model parameters, input load magnitudes [35], and boundary conditions were consistent. The number of mesh elements were 3,179,164, 3,654,227, 4,137,517, 4,678,341, 5,203,414, and 5,753,491. To make the comparison results more intuitive, the maximum static pressure of the fluid was adopted as the evaluation parameter, and the ratio of the results from two consecutive analyses was used as the evaluation criterion. The comparison of analysis results is shown in the figure below.
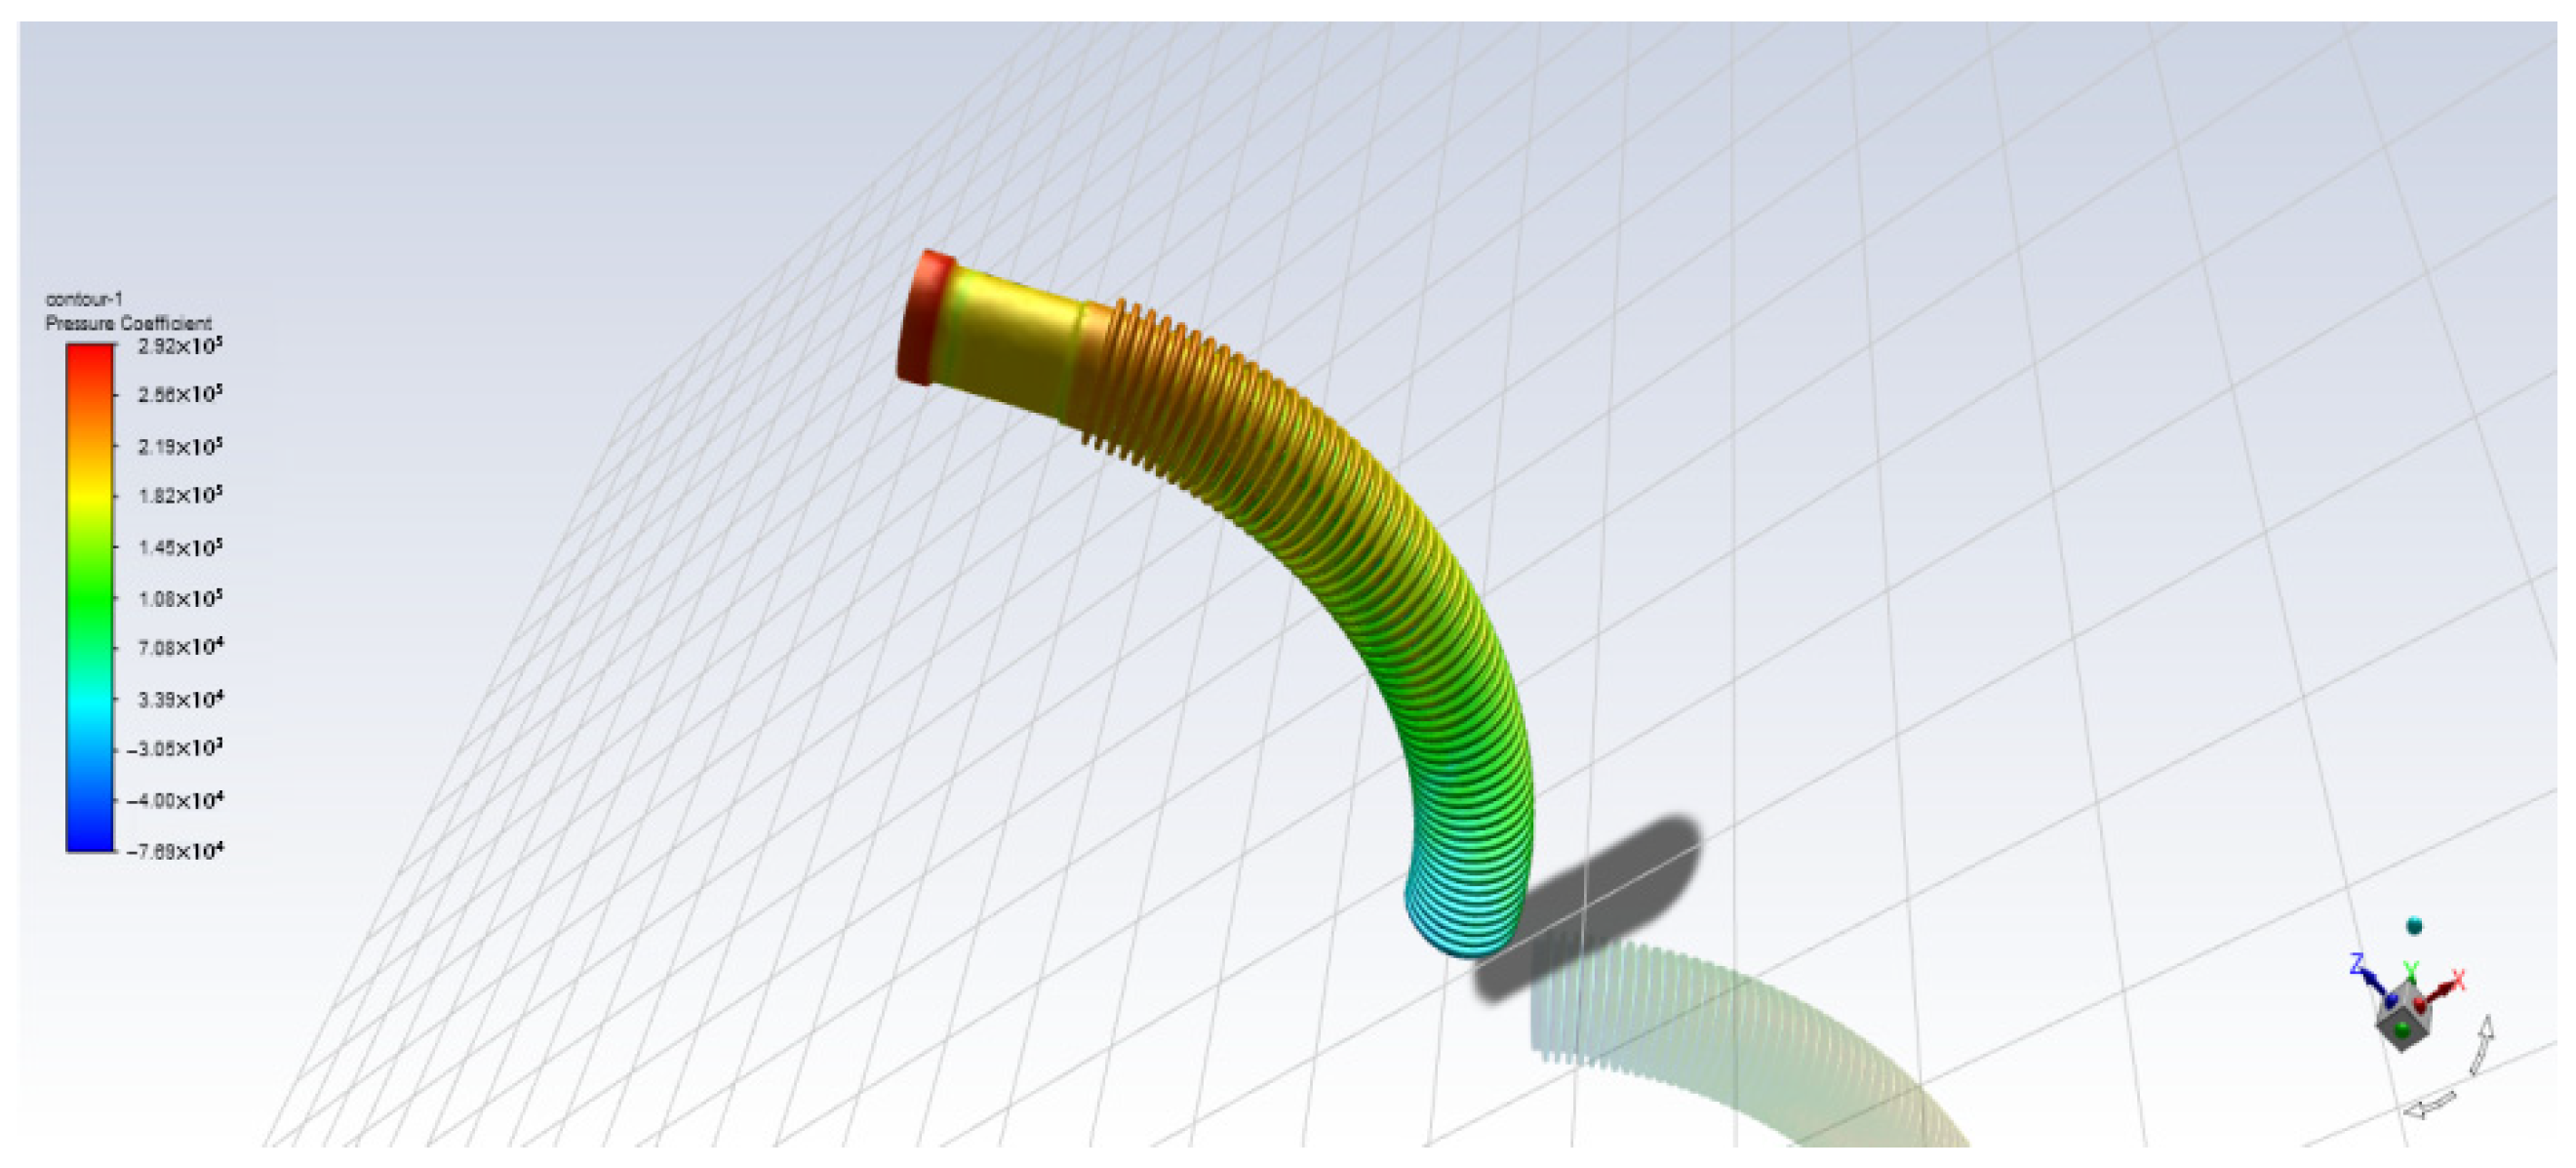
As shown in Figure 22, as the number of grid cells increases, the results gradually converge toward a constant value. When the number of grid cells reaches 4,137,517, the data shows no significant changes, corresponding to a grid size of 2 mm. It can be concluded that the numerical simulation results have converged at this point. Therefore, the number of grid cells is set to 4,137,517. The pressure distribution in the fluid domain at this point is shown in Figure 23.

3.4.2. Solid Domain Mesh Partitioning

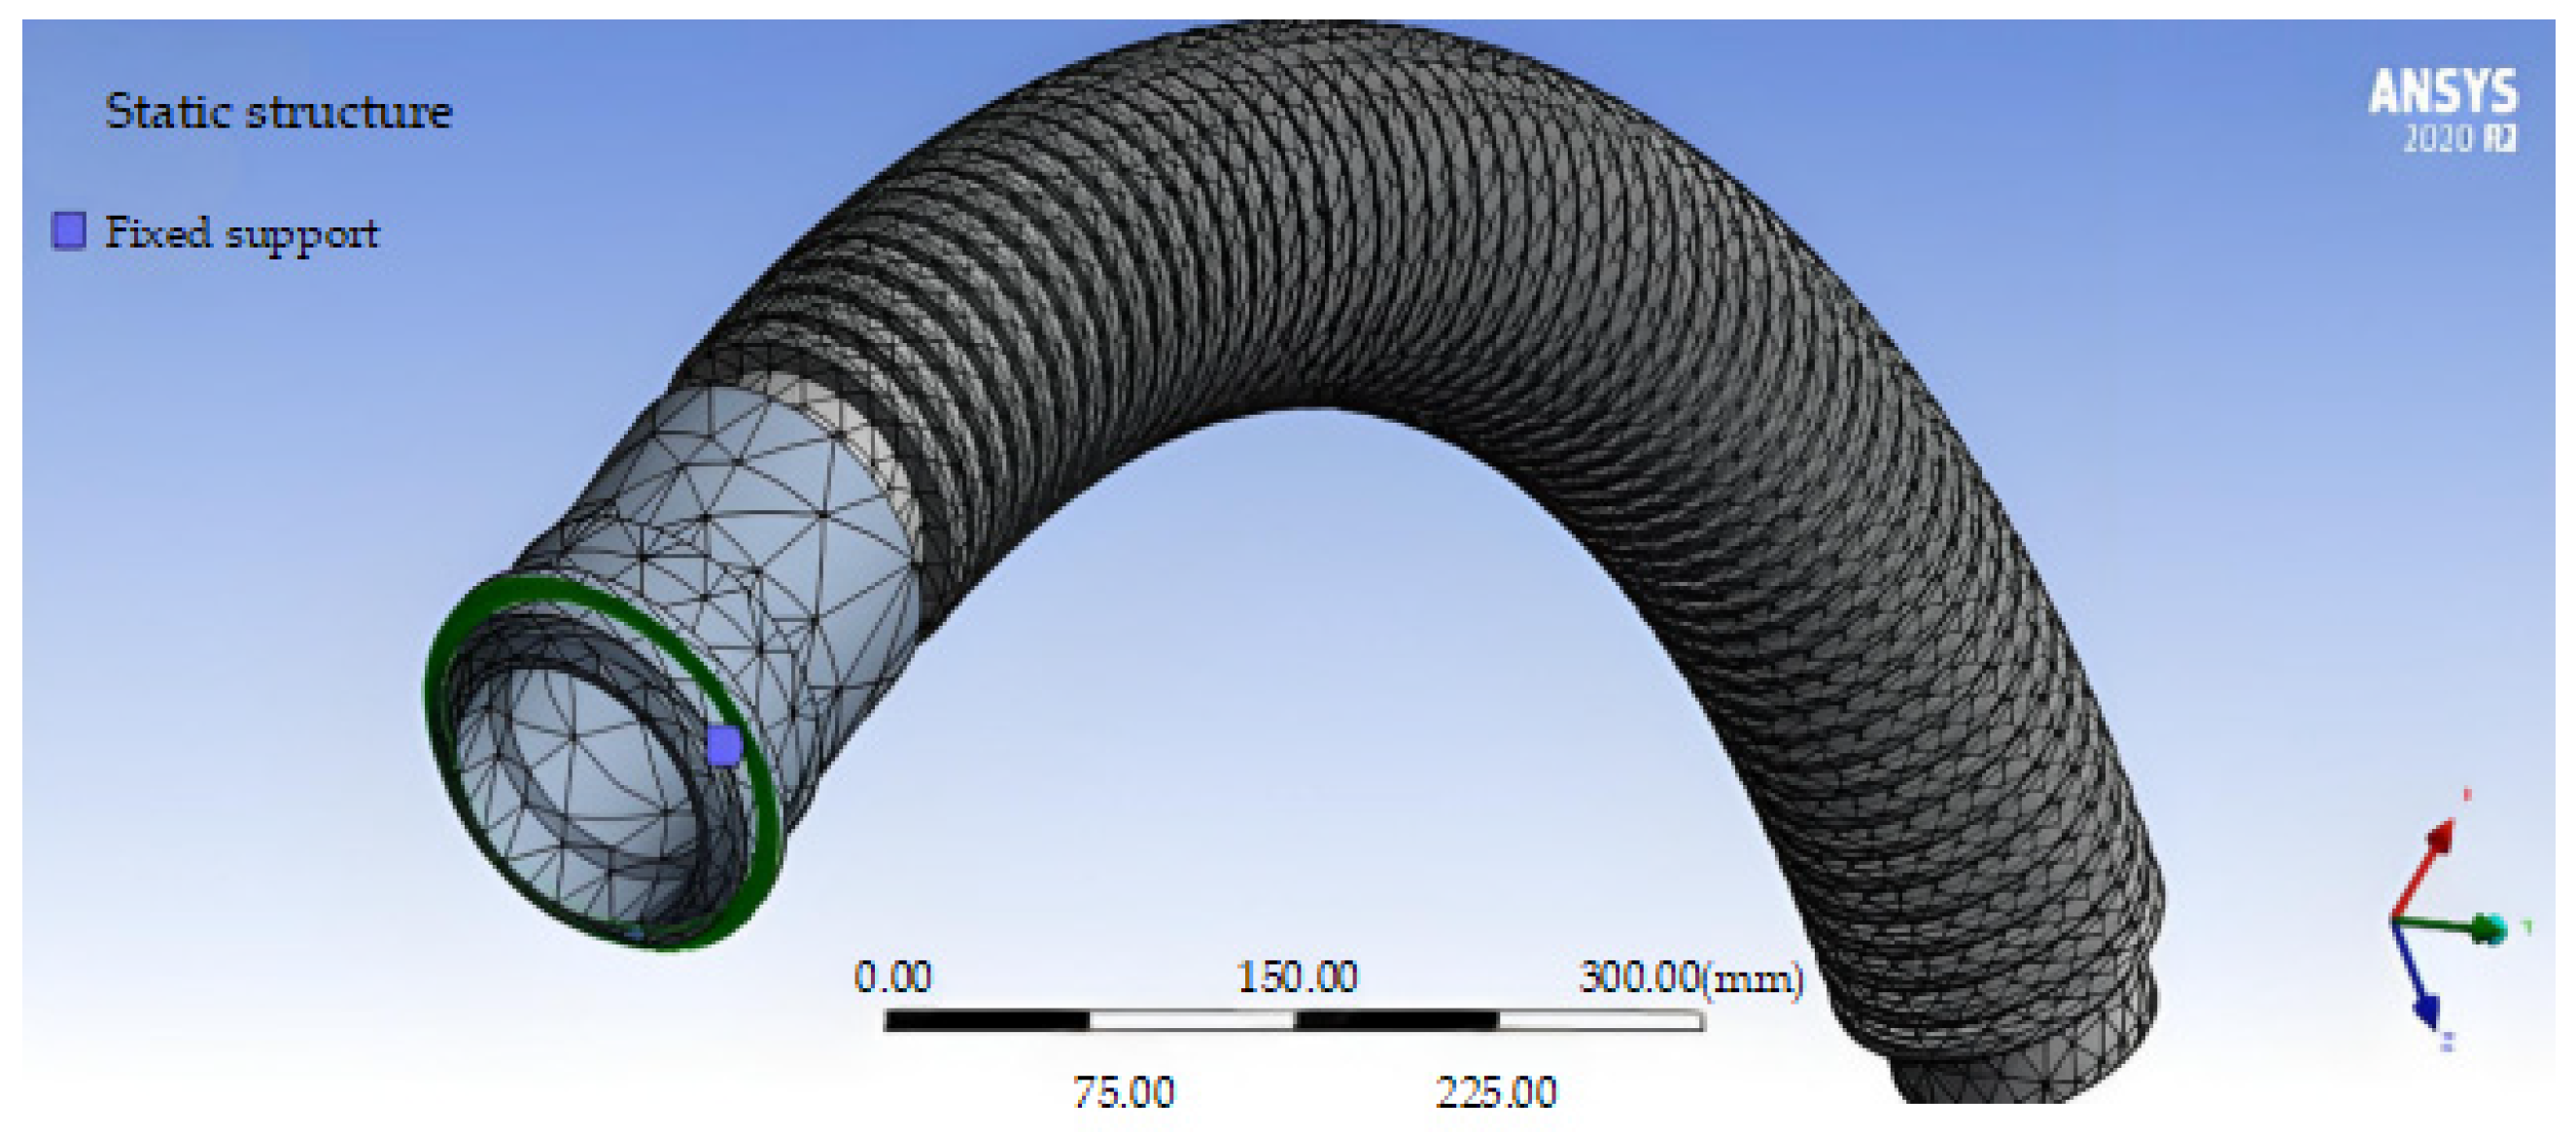
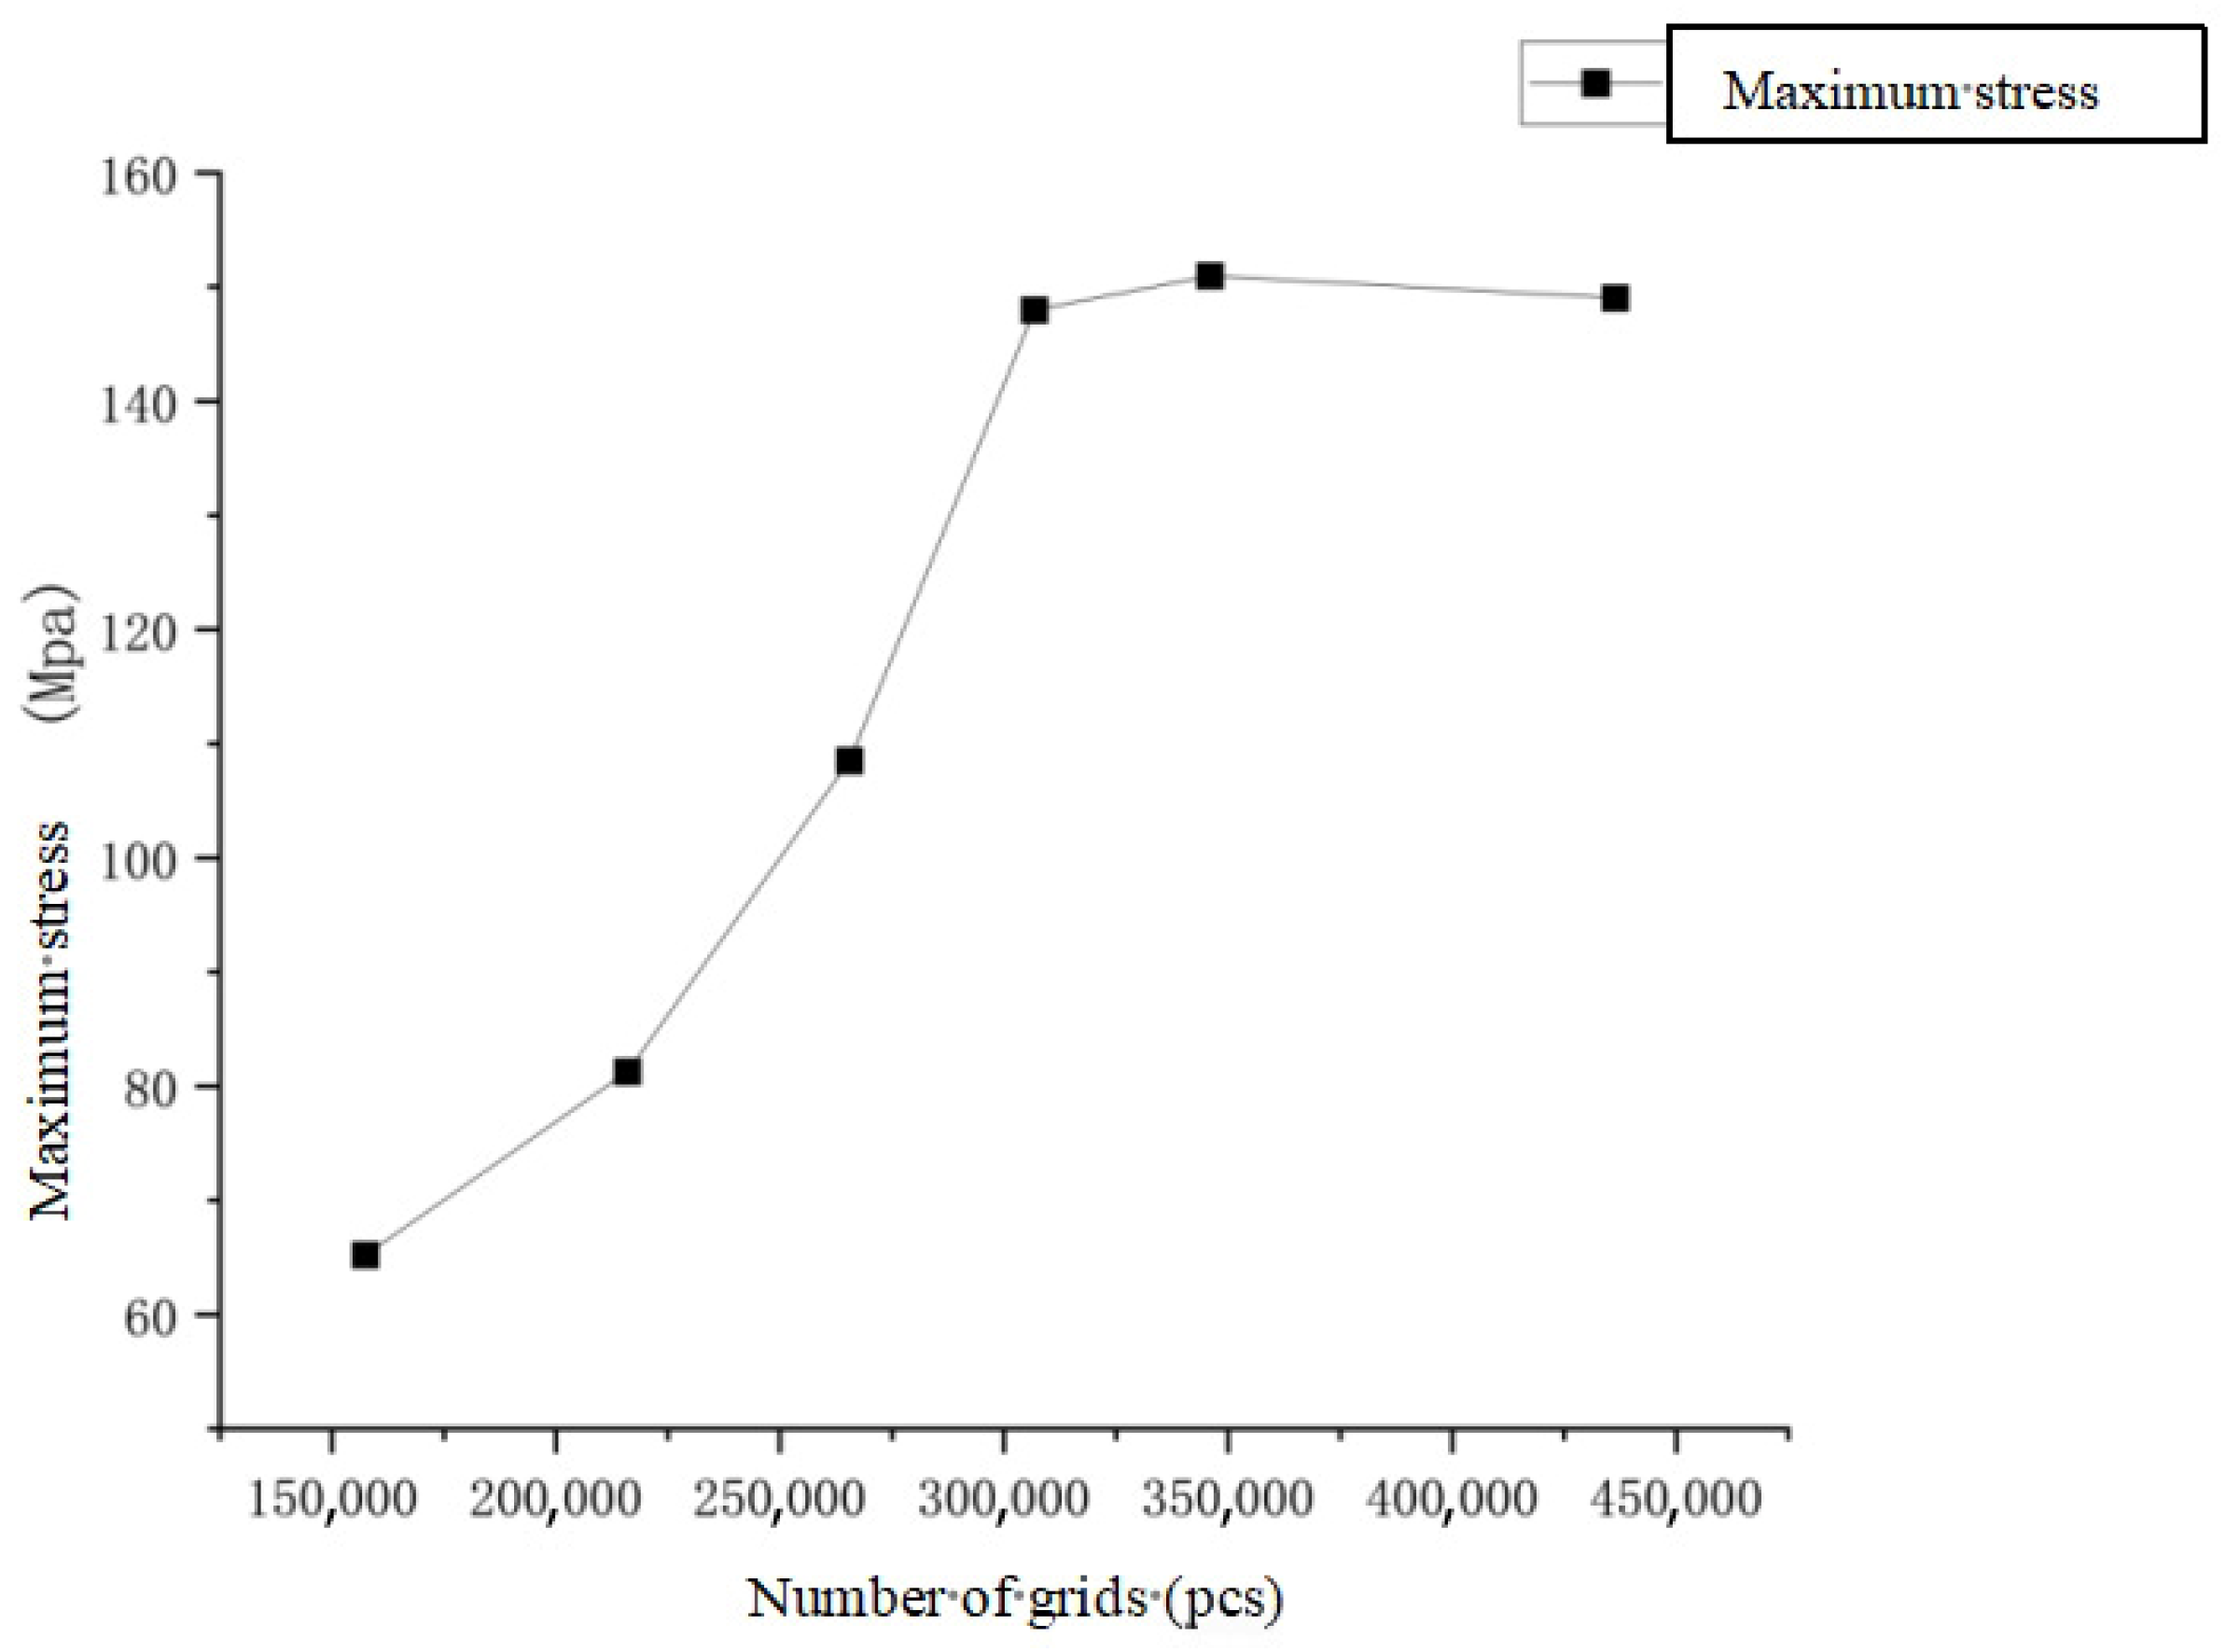
The previously created three-dimensional diagram of the bellows was imported into ANSYS 2020R2 software, and the same sweep method was used for mesh partitioning. The pressure results obtained from the fluid domain were then imported into the structural model. The flange connection point marked in Figure 24 was set as a fixed constraint, and six sets of mesh data were used to compare the calculation results: 157,492, 215,984, 265,508, 306,782, 345,967, and 436,340. To make the comparison results more intuitive, the maximum stress is used as the evaluation parameter, and the ratio of the results from adjacent analyses is used as the evaluation criterion. The mesh partitioning results and mesh independence analysis results are shown in Figure 24 and Figure 25.
As shown in the figure above, as the number of mesh elements increases, the results gradually converge to a constant value. When the number of mesh elements exceeds 306,782, the data shows no significant changes, with the corresponding mesh size being 5 mm. It can be concluded that the numerical simulation results have converged at this point, so setting the number of mesh elements to 306,782 ensures the accuracy of the results. Under normal conditions, the maximum equivalent stress acting on the metal corrugated pipe is 147.99 MPa, with the maximum stress occurring at the point of greatest bending.

3.5. Model Validation

To verify the validity of the aforementioned three-dimensional corrugated pipe model, the deformation animation of the corrugated pipe is observed to determine if it aligns with actual conditions. A 2 s segment of the corrugated pipe deformation animation is displayed in Figure 26.
As shown in the figure above, the structural body has not deformed, and the corrugated tube has undergone overall bending deformation. The primary stress concentration occurs at the front bending section, which aligns with actual conditions, indicating the effectiveness of the three-dimensional model. The force of the bellows under normal conditions does not exceed the yield strength of the material itself, and it can work normally.

3.6. Finite Element Stress Analysis of Bellows Under Different Defects

Due to slag inclusion at the weld joints during welding, cracks form in metal corrugated pipes. A corresponding model was established to address this issue. Five groups of cracks with widths of 1 mm, 2 mm, 3 mm, 4 mm, and 5 mm were set at the point of maximum bending of the corrugated pipe. When making changes, only the defects were added to the structure, and the fluid domain remained unchanged. The mesh conditions were similar to those under normal conditions, so there was no need for repeated verification. The loads and stresses from the previous section are shared within the same Fluent module. The structural bodies with five different defects are imported into the static module. During mesh generation, the mesh is refined at the defect locations. The results include equivalent stress values, allowing observation of the maximum equivalent stress under different crack widths. The equivalent stress plots for the five different defects are shown in Figure 27 [36,37].
The influence relationship between the maximum equivalent stress values corresponding to models with different crack widths is illustrated using a scatter plot. According to the influence relationship curve, it is found that under normal operating conditions, the maximum equivalent stress at the crack location of the metal corrugated pipe increases rapidly as the crack width increases. The change curve is shown in Figure 28.
As can be seen in the above figure, when the crack width is about 1 mm, the equivalent stress at the crack is below the yield strength, which has little effect on the bellows. Until the crack widens to about 2 mm, the maximum stress on the crack is close to the yield strength of the material itself. The simulation proves that under normal working conditions, the stress at the crack when the weld width exceeds 2 mm has caused the bellows to fail, the crack will be extended at this time, the width will become larger in a short period of time, and the stress concentration will be more obvious. If it is in work, after the crack reaches a certain width, the generated stress will exceed the tensile strength of the material itself to break the bellows.

3.7. Analysis of the Effects of Different Inlet Parameters on Defective Corrugated Pipes

This section primarily analyzes the effects of inlet flow velocity and temperature on the equivalent stress of the corrugated tube under cracked conditions. When analyzing the effect of flow velocity, the defect is controlled at 2 mm, and its temperature and pressure values are set to match those of the previous section’s model parameters. Therefore, each group contains five different flow velocity parameter configurations (including those from the previous section) for the corrugated tube’s equivalent stress diagram. Each configuration is subjected to simulation analysis to obtain corresponding data, thereby identifying the influence relationships.

3.7.1. Analysis of the Effect of Inlet Flow Velocity on the Stress of Defect-Containing Bellows

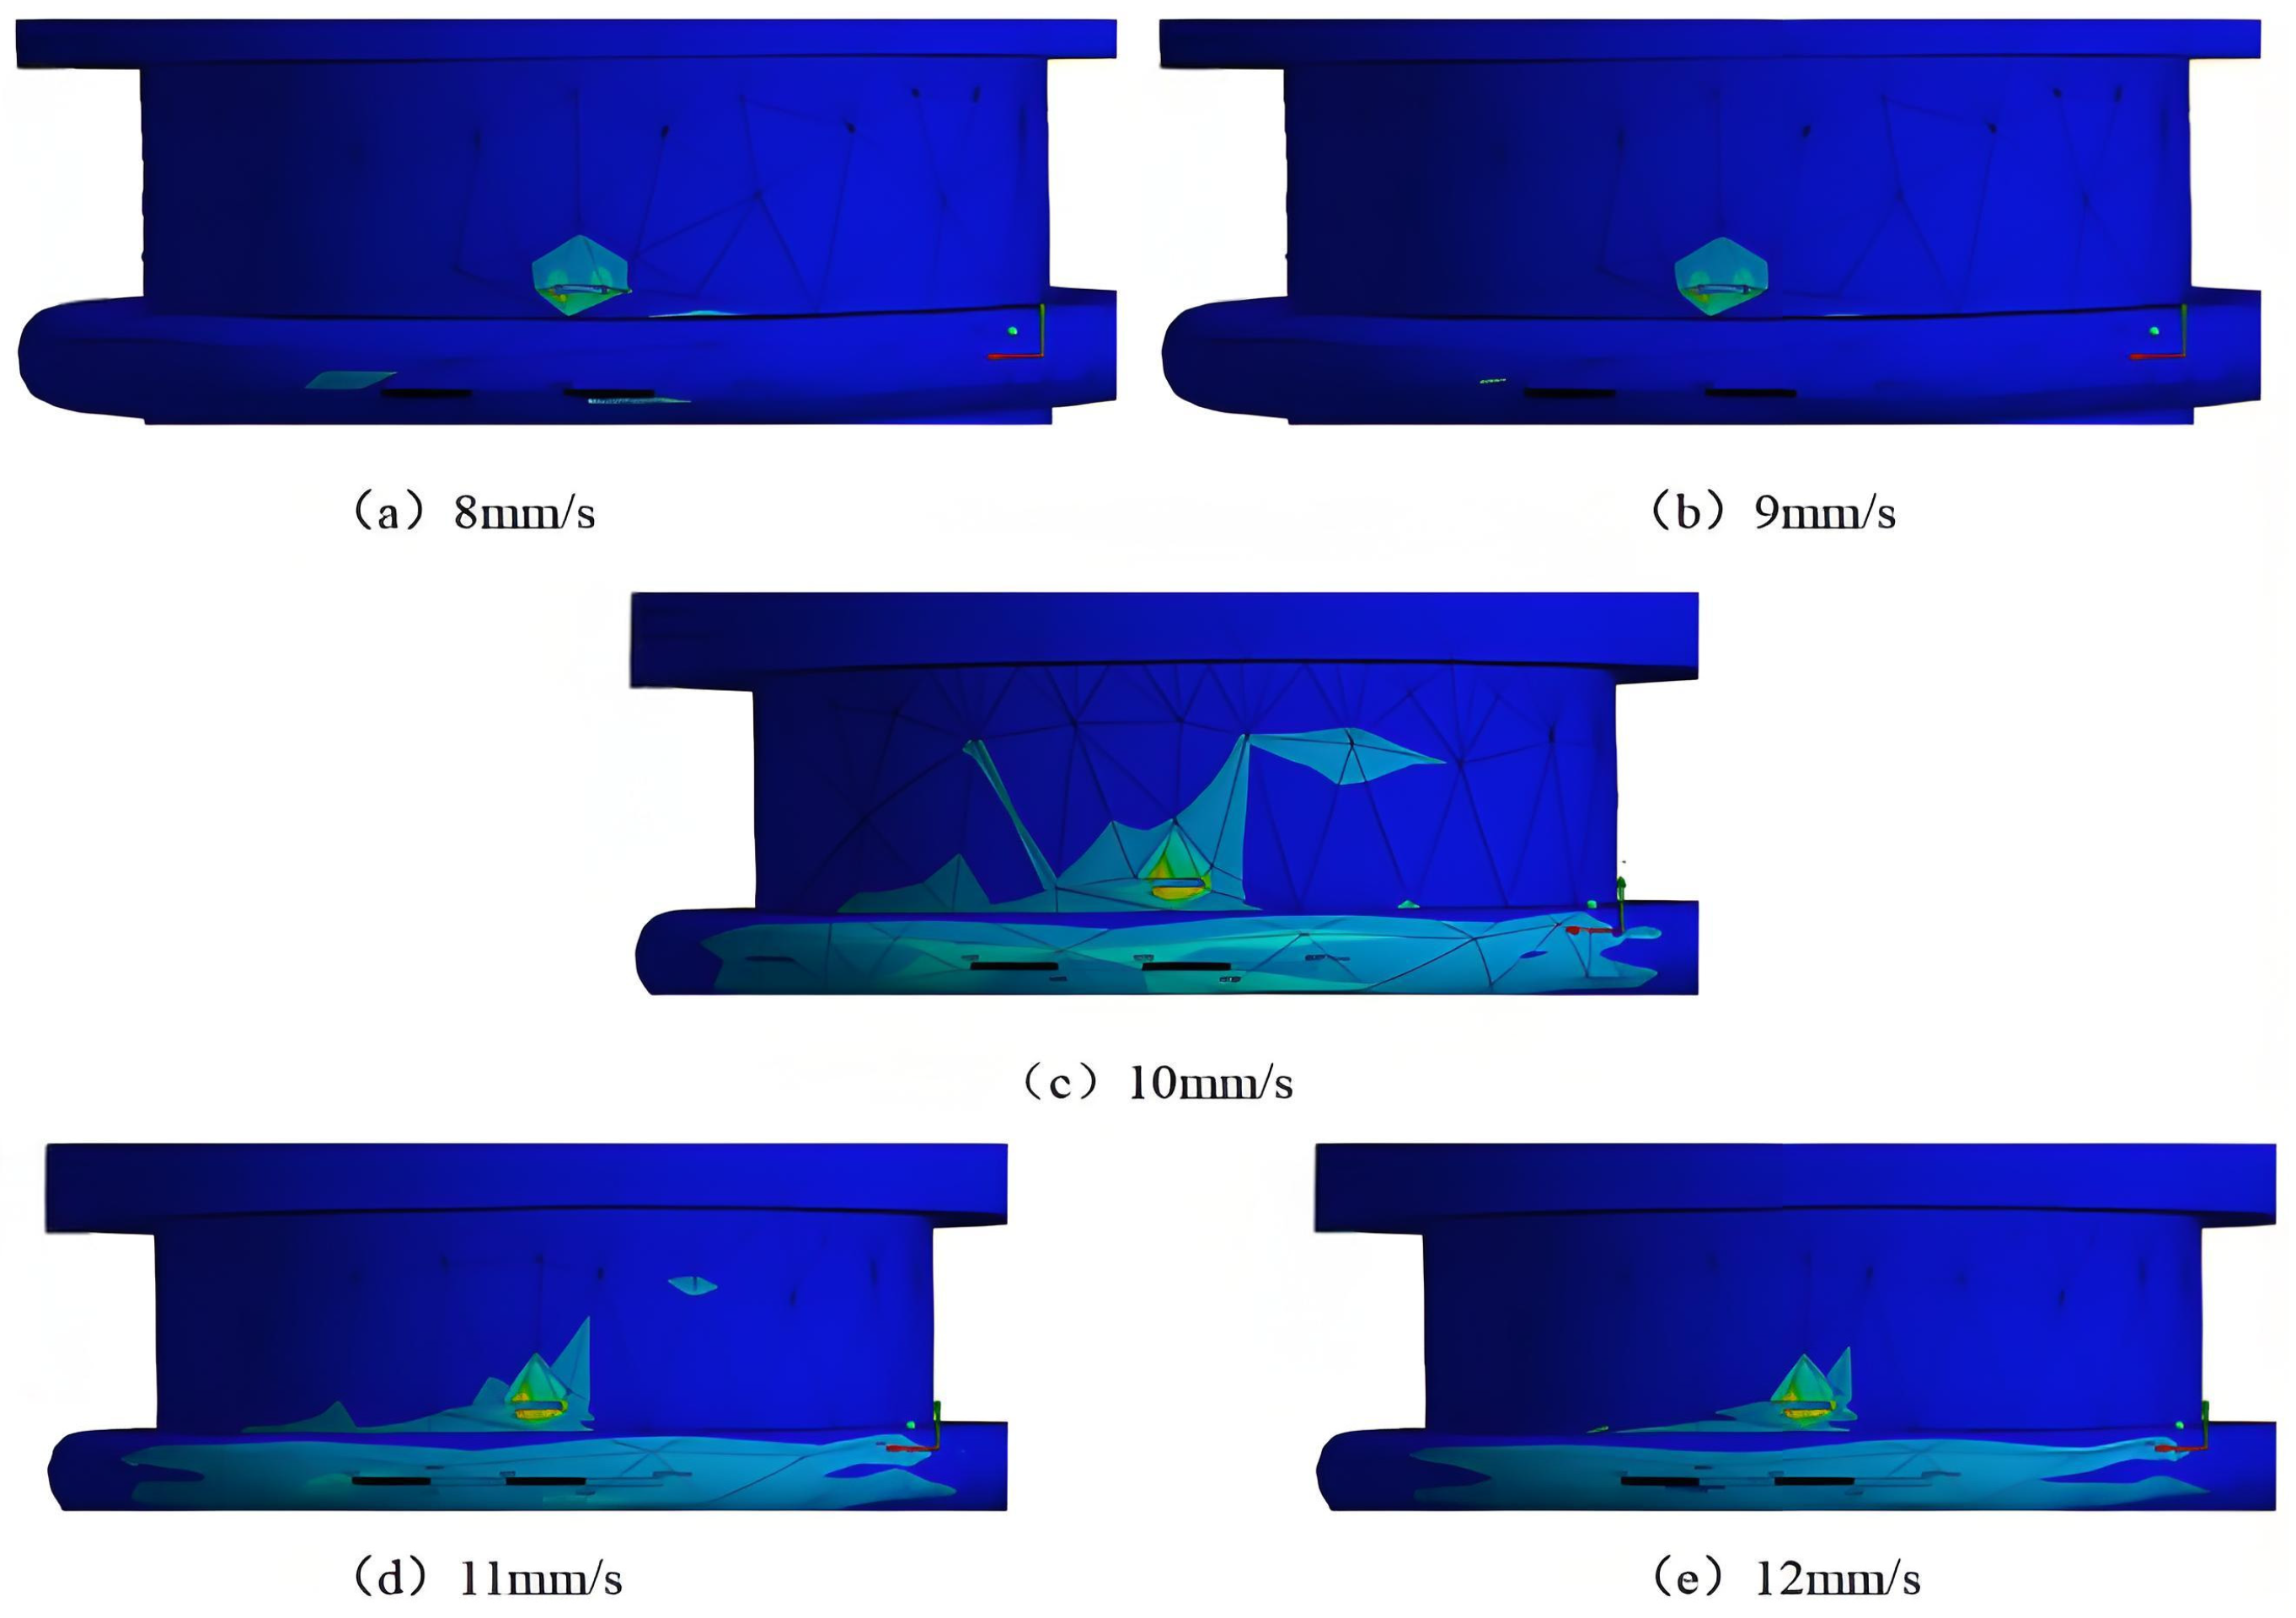
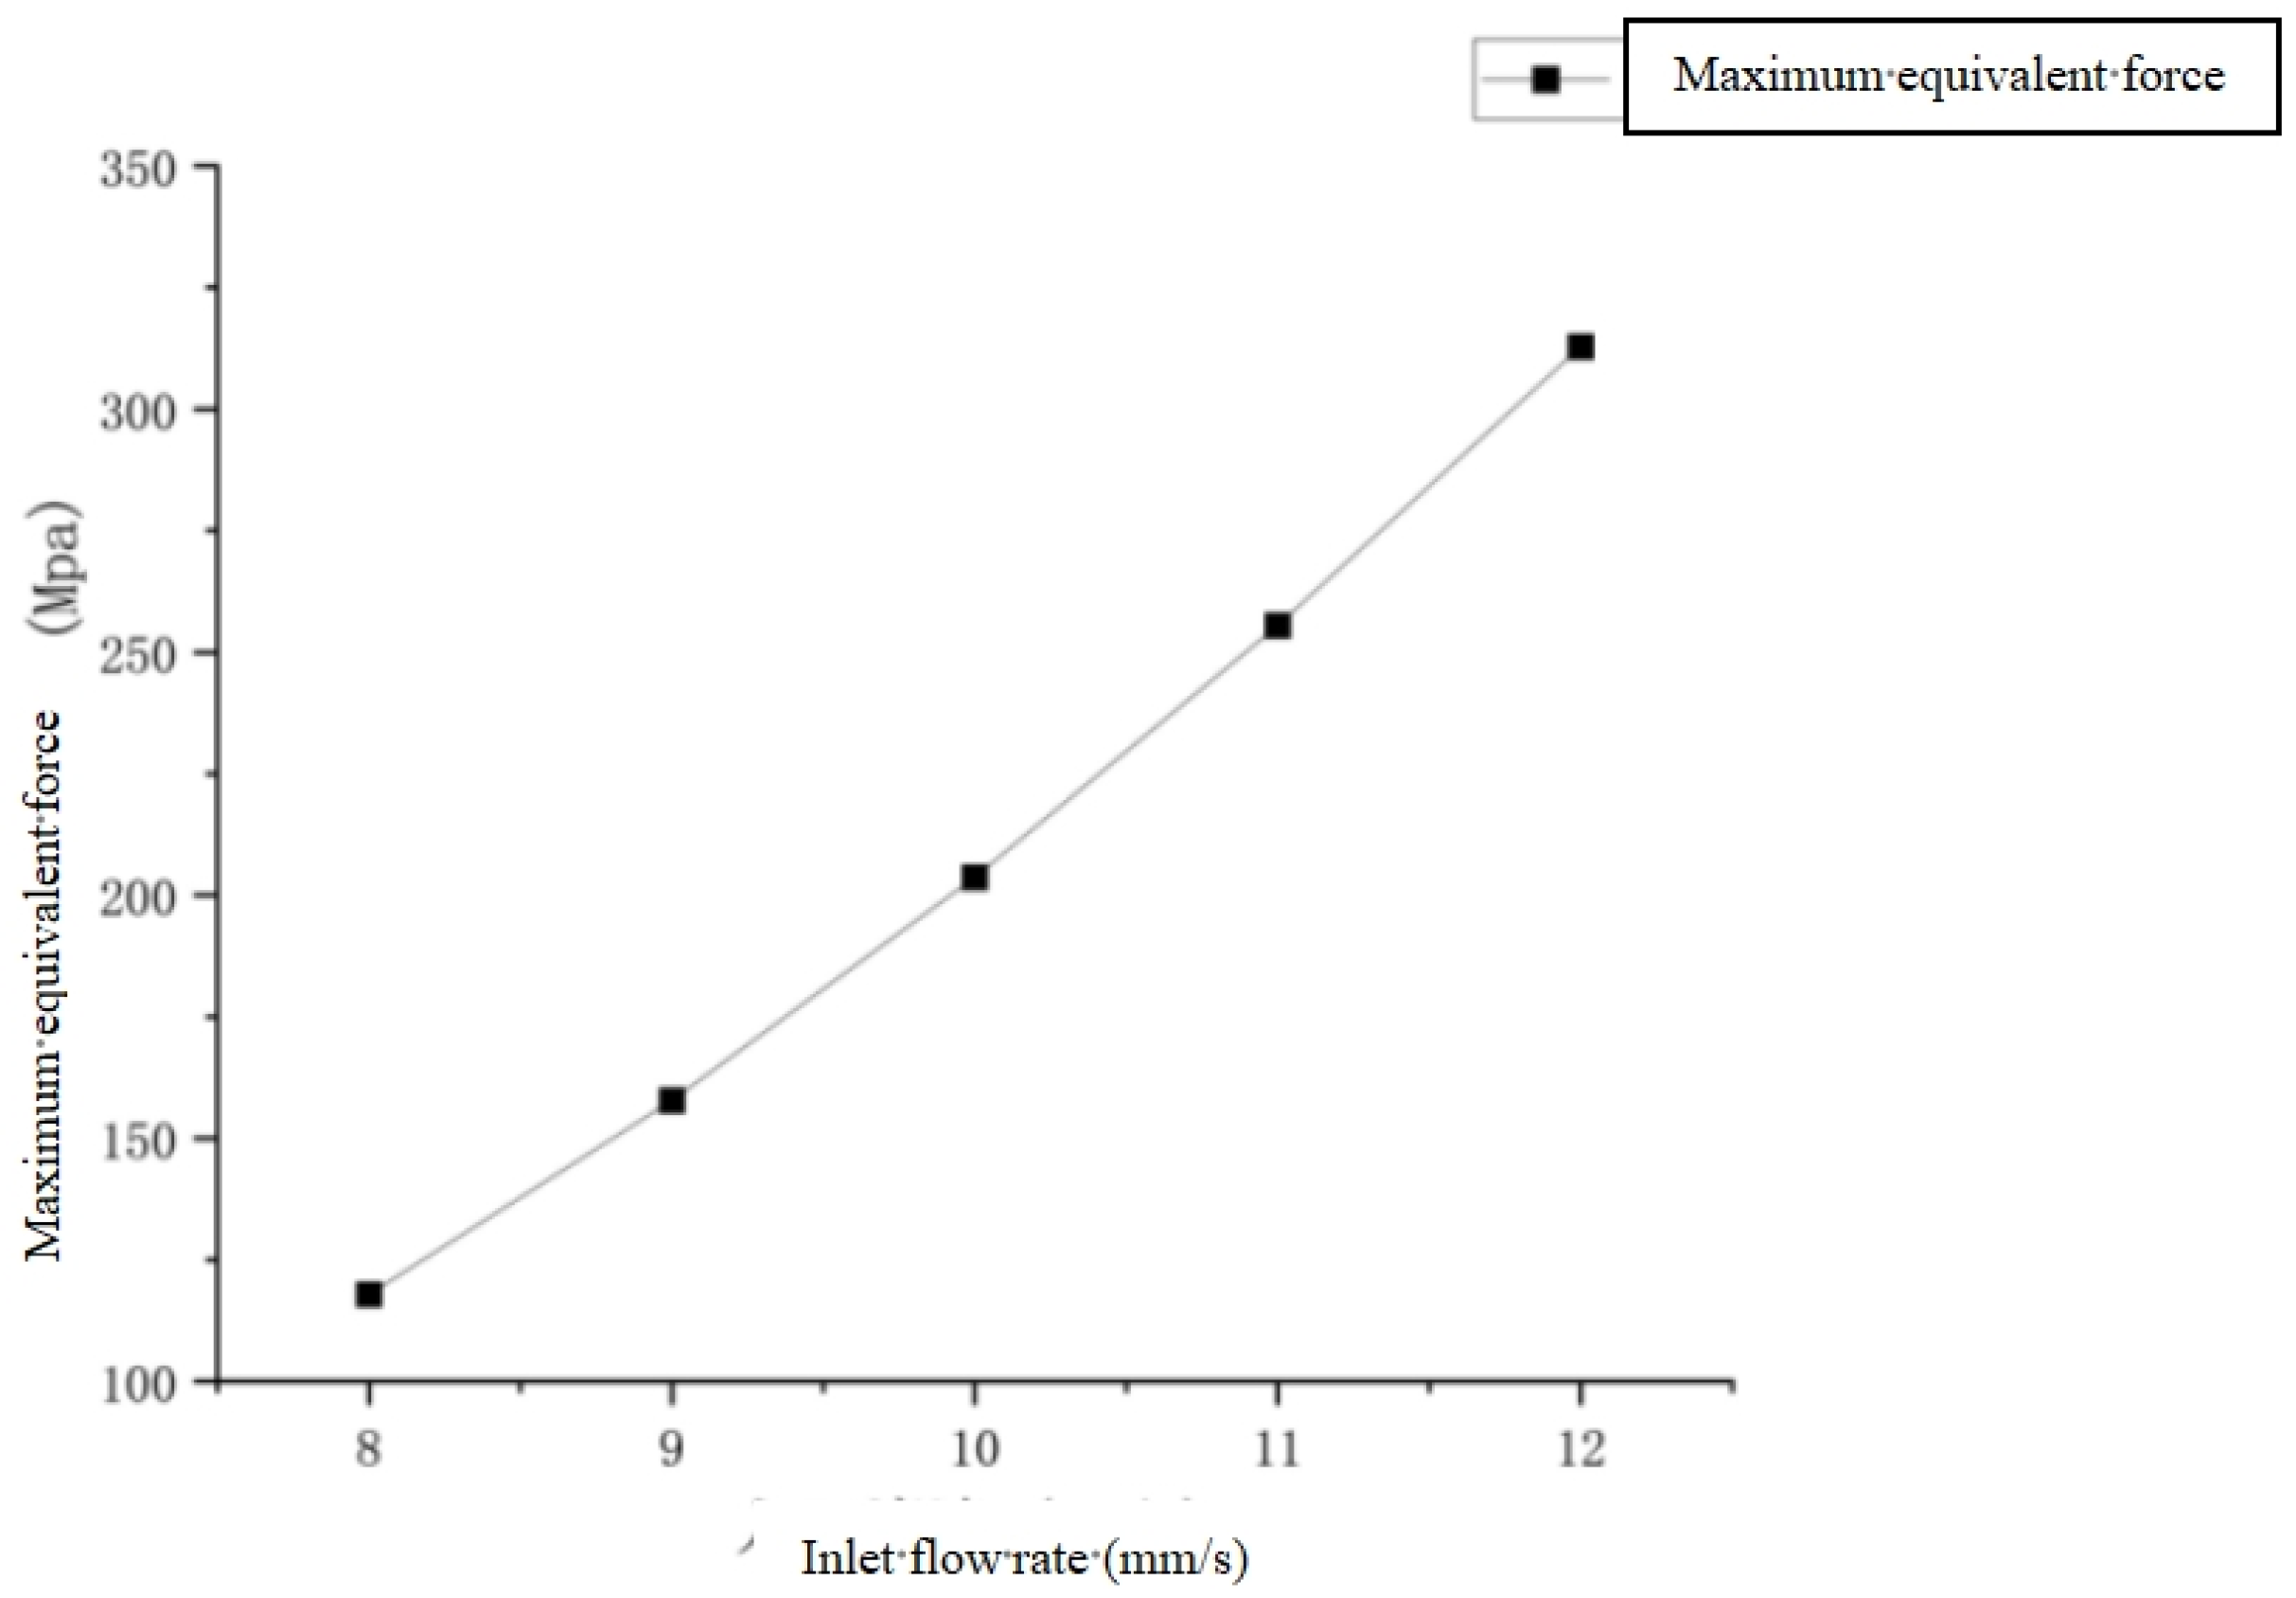
As shown in Figure 29, based on the analysis of equivalent stress in the previous subsection, it is known that the corrugated pipe begins to fail when the crack is 2 mm. Now, with the defect controlled at 2 mm and the temperature set to −10 °C, five different inlet flow rates are set: 8 mm/s, 9 mm/s, 10 mm/s, 11 mm/s, and 12 mm/s. The results are calculated for each, and the comparison of equivalent stress is shown in the figure below:
As shown in Figure 30, the stress at the crack increases with the increase in inlet flow velocity. For every 1 mm/s increase in inlet flow velocity, the stress at the crack increases by approximately 30%, which has a significant impact. During operation, the inlet flow rate should be controlled to prevent the recurrence of accidents.

3.7.2. Analysis of the Effect of Different Temperatures on the Stress Distribution of a Defective Corrugated Tube [38]

As shown in Figure 31, with the defect controlled at 2 mm and the inlet velocity set to 10 mm/s, five different temperature conditions were tested: −20 °C, −15 °C, −10 °C, −5 °C, and 0 °C. The comparison of equivalent stresses obtained under these conditions is shown in the figure below:
As shown in Figure 32, the equivalent stress at the crack site decreases with increasing temperature. Under conditions where liquid carbon dioxide does not undergo phase transformation, for every 5 °C increase in temperature, the stress at the crack site decreases by approximately 3%, which has a negligible effect compared to flow velocity.

4. Conclusions

(1)
For the failure analysis of metal bellows, metallographic analysis, EDS component analysis, fracture scanning electron microscopy analysis, mechanical property detection, and other methods are used to experimentally detect and analyze the fracture, and the fracture cause of the metal bellows is mainly a crack of about 20 μm perpendicular to the surface of the bellows at the root of the bellows. Subsequently, the bellows are further bent, causing the crack direction to be tilted, resulting in the bellows being pulled. If the A side of the workpiece is impacted (the source of the outer impact mark is not clear), the crack and its propagation will be accelerated [39]. At the same time, due to the deformation of the workpiece, the outer braided steel wire is broken, and the wire in the first fracture area with the greatest tensile stress is broken first, and its fracture position is closest to the welding point. Even if the pressure of the internal solvent is not over-pressurized, it will lead to cracking of the outer surface of the inner bellows and then further bending, accelerating crack propagation and finally leading to the failure and fracture of the workpiece.
(2)
The finite element model of the metal bellows under normal conditions and the metal bellows model with welding cracks are established, respectively. The stress situation of the fluid medium was determined, and the stress distribution in the normal state and the presence of cracks was compared. The maximum stress of metal bellows under normal conditions is less than its own yield strength, and the material can work normally.
(3)
When the welding crack of the metal bellows is greater than 2 mm, the stress generated at the crack exceeds the yield strength of the material itself, and the stress concentration becomes more obvious with the increase in the crack. Yield deformation will occur in the work. Because the workpiece is perpendicular to the ground after connection, it will lead to large angle bending, and the stress diagram can show that there has been a stress concentration phenomenon at this position, which may cause structural instability during operation. The simulation results were consistent with the actual physical verification results, and it was finally determined that the accident was caused by welding defects. At the same time, it is proved that the establishment of a finite element simulation model can be used as one of the important auxiliary methods for bellows failure analysis.
(4)
The effects of different inlet flow velocities and temperatures on stress concentration under the same fracture conditions were analyzed. The results show that the stress will increase with the increase in flow velocity, and the stress at the crack will increase by about 30% for every 1 mm/s increase in the inlet flow velocity, but it will decrease with the increase in temperature. In actual working conditions, by appropriately reducing the flow rate and carefully increasing the temperature, the vibration state of the conveyor system can be improved to a certain extent, and the flow resistance can be reduced, thus having a positive impact on the stiffness and fatigue life of the system. Therefore, before practical application, systematic modeling, simulation, and experimental verification must be carried out, and it must be comprehensively compared and decided with other technical schemes (such as optimized support and material upgrading) under the framework of multi-objective optimization. At the same time, a sound monitoring and maintenance plan can ensure the safe, economical, and long-term operation of the conveyor system [40].

Author Contributions

Conceptualization, C.L. and Y.G.; Methodology, S.Z.; Software, Y.G.; Validation, S.Z., C.L. and Y.G.; Formal analysis, C.L.; Investigation, Y.G.; Resources, P.J.; Data curation, Y.G.; Writing—Original draft preparation, C.L.; Writing—Review and editing, C.L.; Visualization, H.W.; Supervision, P.J.; Project management, H.W.; Funding acquisition, P.J. All authors have read and agreed to the published version of the manuscript.

Funding

This research received no external funding.

Data Availability Statement

The original contributions presented in this study are included in the article. Further inquiries can be directed to the corresponding author.

Conflicts of Interest

Author Yunlong Gu is employed by the company Henan Tezhong Equipment Testing Co., Ltd. The remaining authors declare that the research was conducted in the absence of any commercial or financial relationships that could be construed as a potential conflict of interest.

References

  1. Agraja, M.; Umamagesh, G.; Raji, S. Key parameters that affect the fatigue life of metal bellows-type expansion joint: Another look. Mater. Today Commun. 2024, 38, 108400. [Google Scholar] [CrossRef]
  2. Pagar, N.D.; Gawande, S.H. Parametric design analysis of meridional deflection stresses in metal expansion bellows using gray relational grade. J. Braz. Soc. Mech. Sci. Eng. 2020, 42, 256. [Google Scholar] [CrossRef]
  3. Fernand, B.; Maurice, B. Daniel Thomasset, Control of a planar fine positioner actuated by metal bellows. Automatica 1994, 30, 1677–1691. [Google Scholar] [CrossRef]
  4. Snedden, N.W. Analysis and design guidance for the lateral stiffness of bellows expansion joints. Thin-Walled Struct. 1985, 3, 145–162. [Google Scholar] [CrossRef]
  5. Yu, S.; Wan, Z.; Lin, J.; Zhou, Z.; Liu, Y. Effect of residual stress on the axial buckling behaviour of the hydraulic-formed bellows. Int. J. Press. Vessel. Pip. 2025, 215, 105468. [Google Scholar] [CrossRef]
  6. Hou, K.; Guo, J.; Liu, X.; Lv, K.; He, M. Dynamic characteristics and performance analysis of typical liquid carbon dioxide energy storage systems. Energy 2025, 336, 138463. [Google Scholar] [CrossRef]
  7. Kim, S.; Chang, S.; Jeon, B.; Ju, B. Limit state assessment for bending deformation of multi-ply bellows systems. J. Constr. Steel Res. 2023, 206, 107928. [Google Scholar] [CrossRef]
  8. Zheng, P.; Shi, P.; Yue, Y.; Hao, J.; Yang, J.; Li, X.; Zhang, Z. Numerical simulation and characteristic analysis of cold storage and release of a liquid carbon dioxide energy storage system. J. Energy Storage 2025, 132 Pt B, 117655. [Google Scholar] [CrossRef]
  9. Li, H.; Su, W.; Dai, H.; Lin, X.; Ding, R.; Wang, J.; Guan, S.; Zheng, Z.; Ye, Q. Thermo-economic analysis on the gas-liquid compressed carbon dioxide energy storage under different sliding pressure ranges of low-pressure gas storage. J. Energy Storage 2025, 134 Pt A, 118167. [Google Scholar] [CrossRef]
  10. Wang, M.; Yan, M.; Zhang, H.; Liu, Y.; Huang, H. A new dual strengthening strategy to improve the bending resistance of thin-walled bellows using prefabricated martensite and a gradient structure. Eng. Fract. Mech. 2025, 316, 110902. [Google Scholar] [CrossRef]
  11. Hao, Z.; Luo, J.; Chen, L.; Cai, Y.; Chen, Y.; Cheng, M. Failure mechanism of unequal parameters metal bellows under repeated bending process. Eng. Fail. Anal. 2021, 129, 105671. [Google Scholar] [CrossRef]
  12. Gan, C.; Chen, Y.; Wan, F.; Lu, X. Failure analysis and optimization design of metal hose under vibration loads. Eng. Fail. Anal. 2025, 179, 109818. [Google Scholar] [CrossRef]
  13. Xiang, X.; Lu, G.; Li, Z.; Lv, Y. Finite element analysis and experimental study on a bellows joint. Eng. Struct. 2017, 151, 584–598. [Google Scholar] [CrossRef]
  14. Tsuyoshi, F.; Nguyen, Q.; Manabe, K.; Osamu, S. Development of semi-dieless metal bellows forming process. J. Mater. Process. Technol. 2013, 213, 1406–1411. [Google Scholar] [CrossRef]
  15. Creep-fatigue testing of metal bellows in sodium: Balachander, K.; Rajan, K.K.; Ramalingam, P.; Vijayashree, M.; Gupta, S.K.; Chellapandi, P.; Chetal, S.C. and Kale, R.D. Transactions of the Indian Institute of Metals (1996) 49, 595–600. Int. J. Fatigue 1998, 20, 84. [CrossRef]
  16. Yuan, Z.; Huo, S.; Ren, J. Mathematical description and mechanical characteristics of reinforced S-shaped bellows. Int. J. Press. Vessel. Pip. 2019, 175, 103931. [Google Scholar] [CrossRef]
  17. Lee, S.W. Study on the forming parameters of the metal bellows. J. Mater. Process. Technol. 2002, 130–131, 47–53. [Google Scholar] [CrossRef]
  18. Prelle, C.; Jutard, A.; Betemps, M. Compliance adjustment of a metal bellows actuator by control law parameters. Mechatronics 2001, 11, 631–647. [Google Scholar] [CrossRef]
  19. Pierce, S.O.; Evans, J.L. Failure analysis of a metal bellows flexible hose subjected to multiple pressure cycles. Eng. Fail. Anal. 2012, 22, 11–20. [Google Scholar] [CrossRef]
  20. Aakash; Krovvid, S.C.S.P.K.; Khan, I.A.; Sapra, M.K.; Dureja, A.K. A finite element based parametric study to assess the suitability of factors used in EJMA for estimation of the meridional stresses in bellows. Mater. Today Proc. 2023, 90 Pt 1, 221–225. [Google Scholar] [CrossRef]
  21. Prithvirajan, R.; Sugavaneswaran, M.; Sathishkumar, N.; Arumaikkannu, G. Metal bellow hydroforming using additive manufactured die: A case study. Rapid Prototyp. J. 2019, 25, 765–774. [Google Scholar] [CrossRef]
  22. Zhang, J.; Ma, Y.; Su, T.; Yuan, Q.; Song, Z.; Pang, H. Improved SWT model for predicting multiaxial fatigue life of bellows under combined movement load. Int. J. Press. Vessel. Pip. 2024, 208, 105146. [Google Scholar] [CrossRef]
  23. Faraji, G.; Mashhadi, M.M.; Norouzifard, V. Evaluation of effective parameters in metal bellows forming process. J. Mater. Process. Technol. 2009, 209, 3431–3437. [Google Scholar] [CrossRef]
  24. Mechanical seal assembly with metal bellows. Seal. Technol. 2004, 10, 11. [CrossRef]
  25. Bijayani, P.; Sujata, M.; Madan, M.; Bhaumik, S.K. Stress corrosion cracking in 316L stainless steel bellows of a pressure safety valve. Eng. Fail. Anal. 2014, 36, 379–389. [Google Scholar] [CrossRef]
  26. Lu, M.; Ge, j.; Xie, Y.; Gong, Z.; Liu, S.; Li, Z. Structural assumption on design of rounded rectangular bellows under pressure. Int. J. Press. Vessel. Pip. 2024, 210, 105256. [Google Scholar] [CrossRef]
  27. Ma, Y.; Li, P.; Su, T.; Yuan, Q.; Wang, J.; Xia, L. Fatigue life and experimental study of high-temperature bellows based on the improved Manson-Coffin equation. Int. J. Press. Vessel. Pip. 2024, 209, 105216. [Google Scholar] [CrossRef]
  28. Gao, Y.; Wei, Y.; Liu, X.; Jia, H.; Zhao, W. Stress interaction analysis and mitigation in multi-process bellows manufacturing using continuous finite element simulation. J. Mater. Process. Technol. 2025, 339, 118826. [Google Scholar] [CrossRef]
  29. Zhang, X.; Ma, Y.; Zou, H.; Tao, S.; Zhang, Q.; Zhang, E. Experimental study: Correcting the calculation formula for a welded metal bellows’ effective diameter. Seal. Technol. 2016, 10, 7–12. [Google Scholar] [CrossRef]
  30. Guo, H.; Mao, C.; Ke, C.; Liu, W.; Luo, J. Failure analysis and structural optimization of unequal-parameter metal bellows in resistance to bending and torsional composite deformation. Eng. Fail. Anal. 2024, 166, 108844. [Google Scholar] [CrossRef]
  31. Zhao, X.; Wang, A.; Wang, J.; Ling, C.; Gui, X. Study on the effect of solid solution treatment on the microstructure evolution and properties of 304 stainless steel bellows. Results Eng. 2025, 26, 104565. [Google Scholar] [CrossRef]
  32. Pavithra, E.; Senthil Kumar, V.S. Experimental Investigation and Numerical Analysis on Fatigue Life of Bellows. Mater. Today Proc. 2018, 5 Pt 3, 18848–18856. [Google Scholar] [CrossRef]
  33. Atkinson, S. Mechanical seal with metal bellows and Plan 66A solve process pump sealing problems. Seal. Technol. 2018, 2018, 5–6. [Google Scholar] [CrossRef]
  34. Hao, Z.; Luo, J.; Jin, Y.; Wei, W.; Liu, L. Failure analysis of corrugated metal hose under ultimate repeated bending process. Eng. Fail. Anal. 2020, 109, 104295. [Google Scholar] [CrossRef]
  35. Wankhede, S.D.; Gawande, S.H. Design and analysis aspect of metal expansion bellows: A review. Forces Mech. 2023, 13, 100244. [Google Scholar] [CrossRef]
  36. Lin, J.; Wang, X.; Lei, Y.; Ding, J.; Li, K.; Guo, F. Residual stress analysis and measurement in multi-layer bellows. J. Manuf. Process. 2021, 72, 179–194. [Google Scholar] [CrossRef]
  37. Guo, H.; Xuan, Y.; Qiao, W.; Liu, W.; Luo, J. Failure analysis and waveform structure optimization of bending and torsion composite deformation of metal bellows. Int. J. Press. Vessel. Pip. 2025, 214, 105445. [Google Scholar] [CrossRef]
  38. Ying, X.; Yan, J.; Zhang, K.; Zhou, B.; Yang, Z.; Geng, D.; Cao, H. Study on equivalent mechanical properties of U-shaped bellows based on novel implementation of asymptotic homogenization method. Mar. Struct. 2024, 96, 103622. [Google Scholar] [CrossRef]
  39. Metal bellows condition-monitoring system. Seal. Technol. 2016, 1, 14. [CrossRef]
  40. Wang, M.; Yan, M.; Liu, Z.; Liu, Y.; Huang, H. Enhancement of bending fracture resistance of thin-walled stainless steel bellows with minor deformation through a new gradient strengthening strategy. Eng. Fail. Anal. 2025, 174, 109538. [Google Scholar] [CrossRef]
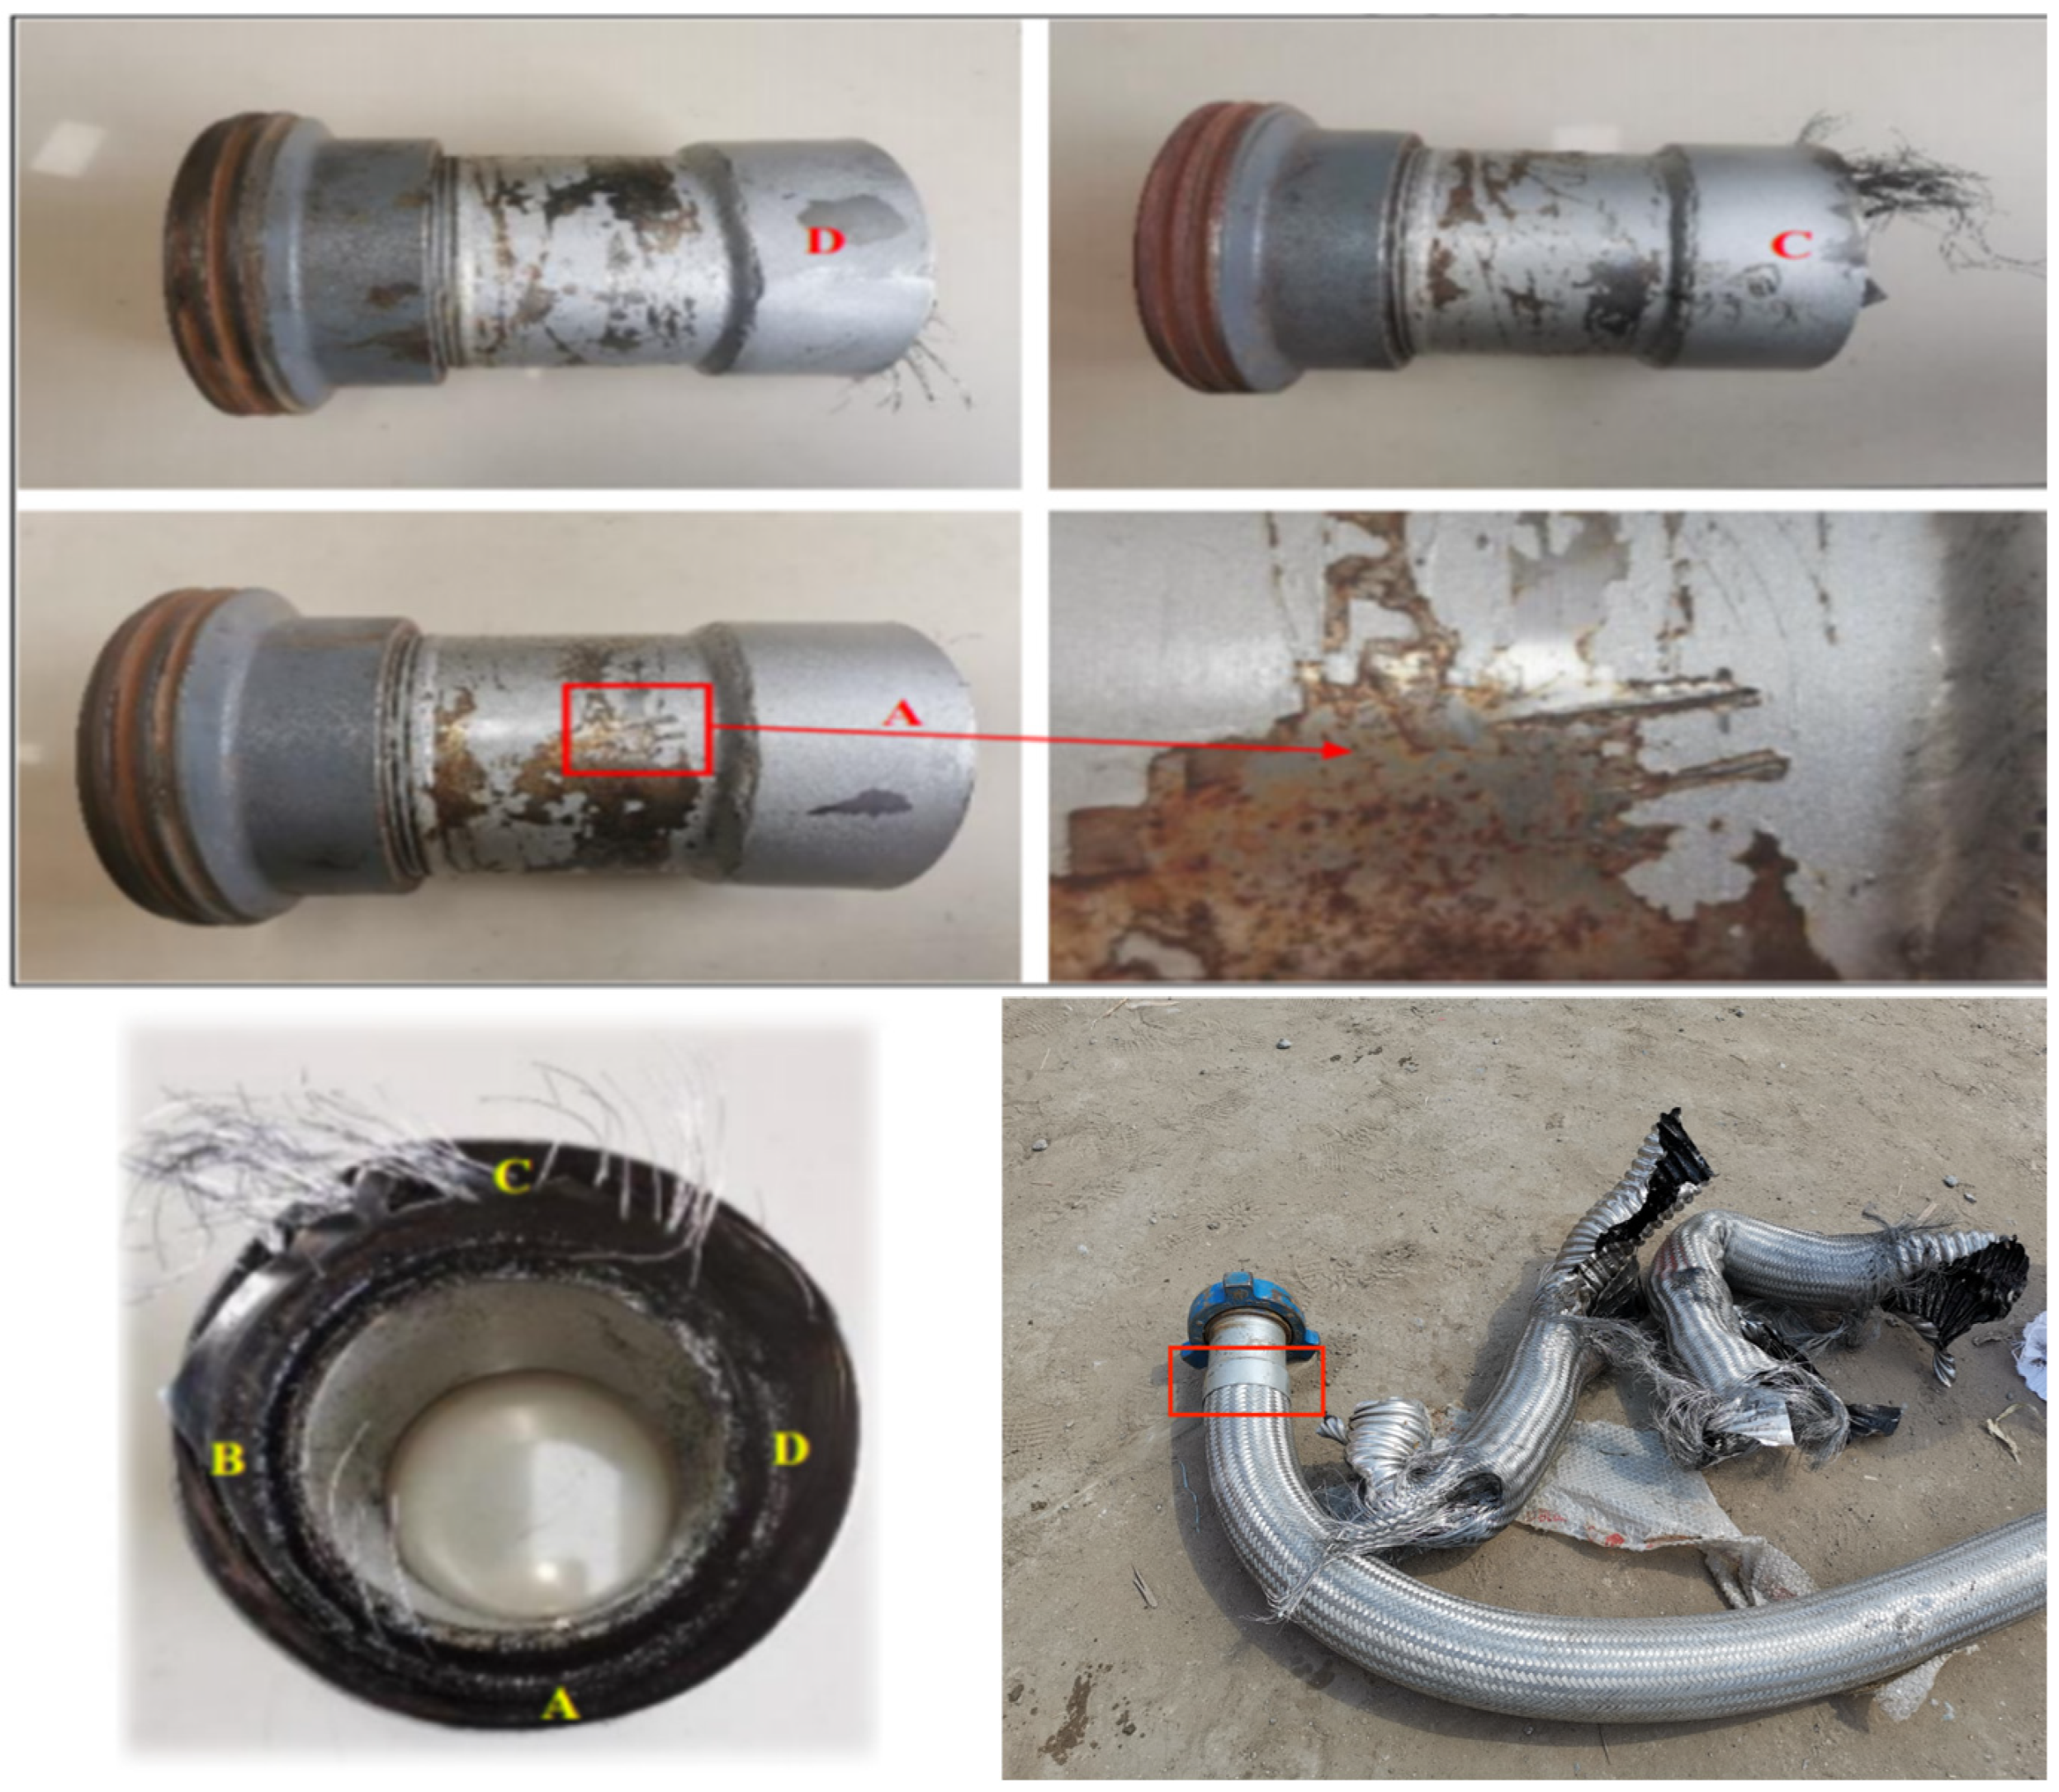
Figure 1. Overall appearance of the fractured workpiece.
Processes 13 02908 g001
Figure 2. Partial photos of the inside of the workpiece in B, C, and D.
Processes 13 02908 g002
Figure 3. Localized photograph of the inner side of the workpiece at point A.
Processes 13 02908 g003
Figure 4. Macro view of the A1 sample obtained by cutting.
Processes 13 02908 g004
Figure 5. Macro view of the A2 sample obtained by cutting.
Processes 13 02908 g005
Figure 6. Microstructure of woven wire mesh after aqua regia etching.
Processes 13 02908 g006
Figure 7. Sampling location image.
Processes 13 02908 g007
Figure 8. Photograph of the metallographic specimen prepared from the region at the interface between Sample A1 and Sample A2 (after etching).
Processes 13 02908 g008
Figure 9. Metallographic photograph of the flux area before corrosion.
Processes 13 02908 g009
Figure 10. Low-magnification metallographic photograph of the welded area after corrosion by aqua regia (50×).
Processes 13 02908 g010
Figure 11. High-power metallographic photographs of the welded area after aqua regia etching (left 200×, right 500×).
Processes 13 02908 g011
Figure 12. High-magnification metallographic photographs of the welded area after aqua regia etching (second grinding, left 200×, right 500×).
Processes 13 02908 g012
Figure 13. Scanning electron microscope (SEM) image of the fracture interface between the corrugated tube and the flux.
Processes 13 02908 g013
Figure 14. Scanning electron microscope photograph of steel wire fracture (low magnification).
Processes 13 02908 g014
Figure 15. Ports without obvious elongation orientation.
Processes 13 02908 g015
Figure 16. Scanning electron microscope (SEM) image of the corrugated tube fracture surface.
Processes 13 02908 g016
Figure 17. Scanning electron microscope (SEM) image of the intermediate region between the corrugated tube and the woven wire mesh.
Processes 13 02908 g017
Figure 18. Scanning electron microscope image of the broken steel wire in the transverse direction.
Processes 13 02908 g018
Figure 19. Three-dimensional model diagram of the workpiece and schematic diagram of internal connections free of welding defects.
Processes 13 02908 g019
Figure 20. Fluid domain model establishment.
Processes 13 02908 g020
Figure 21. Mesh partitioning results.
Processes 13 02908 g021
Figure 22. Fluid mesh independence analysis.
Processes 13 02908 g022
Figure 23. Pressure conditions in the fluid domain.
Processes 13 02908 g023
Figure 24. Structure grid division diagram.
Processes 13 02908 g024
Figure 25. Mesh independence analysis diagram.
Processes 13 02908 g025
Figure 26. Animation of corrugated tube deformation (2 s).
Processes 13 02908 g026
Figure 27. Comparison of equivalent stress under different crack widths.
Processes 13 02908 g027
Figure 28. Variation in equivalent stress at the crack site with increasing crack width.
Processes 13 02908 g028
Figure 29. Comparison of equivalent stress under different inlet flow rates.
Processes 13 02908 g029
Figure 30. Variation in equivalent stress at the crack with increasing inlet flow velocity.
Processes 13 02908 g030
Figure 31. Comparison of equivalent stress at different temperatures.
Processes 13 02908 g031
Figure 32. Variation in equivalent stress at the crack site with increasing temperature.
Processes 13 02908 g032
Table 1. SEM-EDS composition analysis results of the wire mesh wire.
Spectrum wt.%CrMnFeNiCCorresponding Materials
Spectrum 118.551.6770.159.620.05304 stainless steel
Spectrum 218.371.7571.088.800.04304 stainless steel
Table 2. SEM-EDS composition analysis results of the welded interface.
Spectrum wt.%CrMnFeNiCCorresponding Materials
Spectrum 118.031.4271.229.280.05304 stainless steel
Spectrum 2-1.0998.230.550.13carbon steel (Q355)
Spectrum 314.5110.6172.172.70---stainless steel welding rod composition
Table 3. SEM-EDS composition analysis results of the corrugated pipe fracture edge area on the welded area cross-section.
Spectrum wt.%CrMnFeNiCCorresponding Materials
Spectrum 118.171.5071.448.850.04304 stainless steel
Spectrum 214.3210.9772.002.71---stainless steel welding rod composition
Table 4. SEM-EDS composition analysis results for the protective tube outside the grid.
Spectrum wt.%CrMnFeNiCCorresponding Materials
Spectrum 120.950.6078.400.020.04304 stainless steel
Table 5. Geometric parameters of the corrugated tube.
Total Length/mmOutside Diameter/mmInner Diameter
/mm
Wave Height
/mm
Pitch/mmThe Walls Are Thick/mm
70012010010122
Table 6. Thermophysical parameters.
Relevant ParametersDensity ρ (kg/m3)Dynamic Viscosity μ (Mpa × S) Thermal Conductivity (W/(m k))Specific Heat Capacity (J/(kg °C))
Liquid CO29830.120.142.5
304 stainless steel7930----16.20.5
Table 7. Mechanical properties of 304 stainless steel.
TemperatureRoom Temperature (Approx. 20 °C)Low Temperature (−10 °C)Trends and Explanations
Material grade18Cr-8Ni18Cr-8Niunchanged
Density (kg/m3)79307930is largely unchanged
Elastic modulus (GPa)193Slightly elevated (approx. 1–3 GPa increase)Slightly enlarged
Poisson’s ratioApprox. 0.29Approx. 0.285Basically stable
yield strength
(MPa)
205Rise to 220–240Significantly increased
tensile strength
(MPa)
520550–580Significantly increased
Elongation (%)40Slight decline (may drop to 38–39%)Slightly lowered but still good
Table 8. Fluid boundaries and initial conditions.
Calculation ConditionsParameter
MediumLiquid carbon dioxide
Turbulence modelstandard k-ω
Entrance boundary conditionsSpeed entry
Inlet pressure30 Mpa
Export boundary conditionsPressure outlet
AlgorithmPhase-coupled SIMPLE
Temperature−10 °C
Inlet displacement5 m3/min
Entrance speed10.6157 mm/s
Disclaimer/Publisher’s Note: The statements, opinions and data contained in all publications are solely those of the individual author(s) and contributor(s) and not of MDPI and/or the editor(s). MDPI and/or the editor(s) disclaim responsibility for any injury to people or property resulting from any ideas, methods, instructions or products referred to in the content.