Article

Research on Photovoltaic Power Stations and Energy Storage Capacity Planning for a Multi-Energy Complementary System Considering a Combined Cycle of Gas Turbine Unit for Seasonal Load Demand

1
Hangzhou Huadian Jiangdong Cogeneration Power Co., Ltd., Hangzhou 311228, China
2
Department of Engineering Mechanics, Tsinghua University, Beijing 100084, China
3
Beijing Laboratory of New Energy Storage Technology, School of Energy Storage Science and Engineering, North China University of Technology, Beijing 100144, China
*
Author to whom correspondence should be addressed.
Processes 2025, 13(9), 2897; https://doi.org/10.3390/pr13092897
Submission received: 14 August 2025 / Revised: 2 September 2025 / Accepted: 8 September 2025 / Published: 10 September 2025

Abstract

Multi-energy systems could utilize the complementary characteristics of heterogeneous energy to improve operational flexibility and energy efficiency. However, seasonal fluctuations and uncertainty of load would have a great influence on the effectiveness of the system planning scheme. Regarding this issue, this paper proposes a photovoltaic power (PV) station and thermal energy storage (TES) capacity planning model with considering the electrical load uncertainty based on a stochastic optimization method. And four-season load demand scenarios are built by Generative Adversarial Networks (GANs). At last, the proposed capacity configuration model is tested in a case study, and the results show the influence of seasonal fluctuations in load, scenario number, and TES capacity.

1. Introduction

The complementary nature of different energy sources can help balance energy supply and demand, as well as improve the utilization rate of renewable energy. Constructing and operating energy systems independently reduces energy efficiency. Moreover, the combined cycle of gas turbine (CCGT) unit is seen as playing a critical role in contributing to the system operational flexibility and economy due to its fast starting speed, high thermal efficiency, and low pollution. Based on this, combining CCGT units, photovoltaic power (PV) station, and thermal energy storage (TES) could improve the utilization efficiency of renewable energy and reliable power supply capability of the energy system, by using the complementary characteristics and the flexible adjustment capability of energy coupling components.
However, the CCGT system is composed of multiple components, including a gas turbine, a waste heat boiler, a steam turbine, and waste heat power generation (WHPP). Due to participating in the peak load regulation of the power grid, the gas turbine would decrease output and its thermal efficiency correspondingly during the partial load operation status of the CCGT units. In addition, the PV stations, TES, and gas boiler contained in the multi-energy complementary system (MECS) increase the complexity of system operation and provide more operational flexibility. Moreover, the seasonal fluctuation of load demand increases the difficulty of balancing supply and demand, which brings more uncertainty to the planning of PV station and TES. Therefore, it is urgent to optimize the capacity of PV and TES from a holistic perspective, considering the load uncertainty, to improve the economy of the CCGT and the energy supply efficiency of MECS.
Reasonable planning and configuration scheme of energy supply equipment play a crucial role in improving power supply reliability and economy of the system [1]. Energy storage technology has been studied widely due to its advantages in promoting renewable energy consumption and increasing regulation flexibility [2,3]. A planning and operation framework of solar energy-based renewable energy communities is proposed in [4] based on the multi-objective optimization theory. In [5], the combination of transportation, natural gas, and active distribution networks is considered via building a novel optimal planning model, and the optimal investment and operational strategies of the multi-energy system are developed. A co-expansion planning method of integrated electricity and natural gas is studied in [6] while considering the economy and safety of system operation, and the uncertainty of supply and demand is modeled by the information-gap decision theory technique. Integrated energy systems’ structure and component capacity are optimized to reduce the fluctuation of the source and load in [7] based on the synergistic effects of multiple energy resources. In [8], carbon emission reduction in integrated energy systems is introduced in the capacity optimization configuration model, and the operation characteristics of energy conversion and storage devices are analyzed and modeled.
The randomness and volatility of the load directly influence the effectiveness of the energy supply system planning scheme. Uncertainty modeling is a critical component in energy system optimization research. Scenario analysis is commonly used to model the uncertainty of parameters in an optimization problem [9]. Uncertainties of wind speed are modeled in [10] via a transfer learning-based scenario generation method, and the correlation of multiple wind farms is described. The temporal and spatial correlation model of wind and solar energy resources is constructed in [11], and the proposed method is validated in Indian. The multiple scenarios of PV output are built in [12] to study the effect of the number of PV stations and storage batteries on system reliability and cost. The Monte Carlo simulation method is used in [13] to generate the scenarios of wind power and load. The Latin hypercube sampling method is adopted in [14] to reflect the forecast errors of wind and PV plants’ output. Similarly, Latin hypercube sampling is combined with K-means in [15] to generate the scenarios of sources and loads. The probability distribution is established to describe the stochasticity and uncertainty of the wind power in [16]. Scenarios with uncertainty and randomness are established to represent the randomness and volatility of the load based on probability theory. The Markov Chain method and the Monte Carlo method are combined in [17] to simulate time series output scenarios of wind power. The sequential sampling method is used in [18] to generate the time series output of wind power by counting the probability distribution of multiple wind power outputs. The above research mainly adopts probability models based on statistical theory to build scenarios of parameter uncertainty. And the selection of probability models has a great impact on the efficiency and effectiveness of scenarios. However, in reality, the load curve on weekdays is quite different from that on weekends or holidays, and it shows seasonal characteristics, which means that there are multiple “peaks” or “patterns” in the data distribution. And the electrical load pattern is significantly influenced by many external factors, such as temperature, humidity, weather type, user energy consumption behavior, and so on. Moreover, the load has obvious diurnal, weekly, and seasonal periodicity, and the loads at adjacent time points are highly correlated. These show that the electrical load characteristics are high-dimensional, multimodal, and time series coupled. It is difficult to know the probability distribution of the load in advance and describe the load with a specific single probability distribution. To solve this problem, Generative Adversarial Networks (GANs) are introduced to generate uncertainty scenarios. Unlike statistical simulation methods, GANs have the advantage of not knowing the distribution in advance and generating a large number of samples quickly.
To solve the above issues, this paper proposes a stochastic programming model to optimally configure the capacity of PV station and TES, considering the load demand uncertainty in the MECS including CCGT units, gas boiler, PV station, and TES. And the uncertainty of load demand in four seasons is modeled via the GANs, which could learn the correlation, seasonality, and multimodality of load time series based on the historical data, and efficiently generate a number of load scenarios according to the distribution characteristics of historical load. In addition, to decrease the computation costs of the stochastic optimization model, the Fuzzy C-means clustering method is adopted to reduce the load scenarios. The highlights of the paper are listed below.
(1)
To utilize the complementation of multi-energy carriers and the flexible adjustment capability of energy components, a stochastic optimization model for optimally configuring the capacity of the PV station and TES is proposed in this paper.
(2)
The load demand uncertainty is modeled via GANs, which capture the temporal correlation of load time series. And the load demand scenarios in spring, summer, autumn, and winter are generated separately, which reflects the influence of seasons on the electricity consumption behavior of users.

2. System Configuration

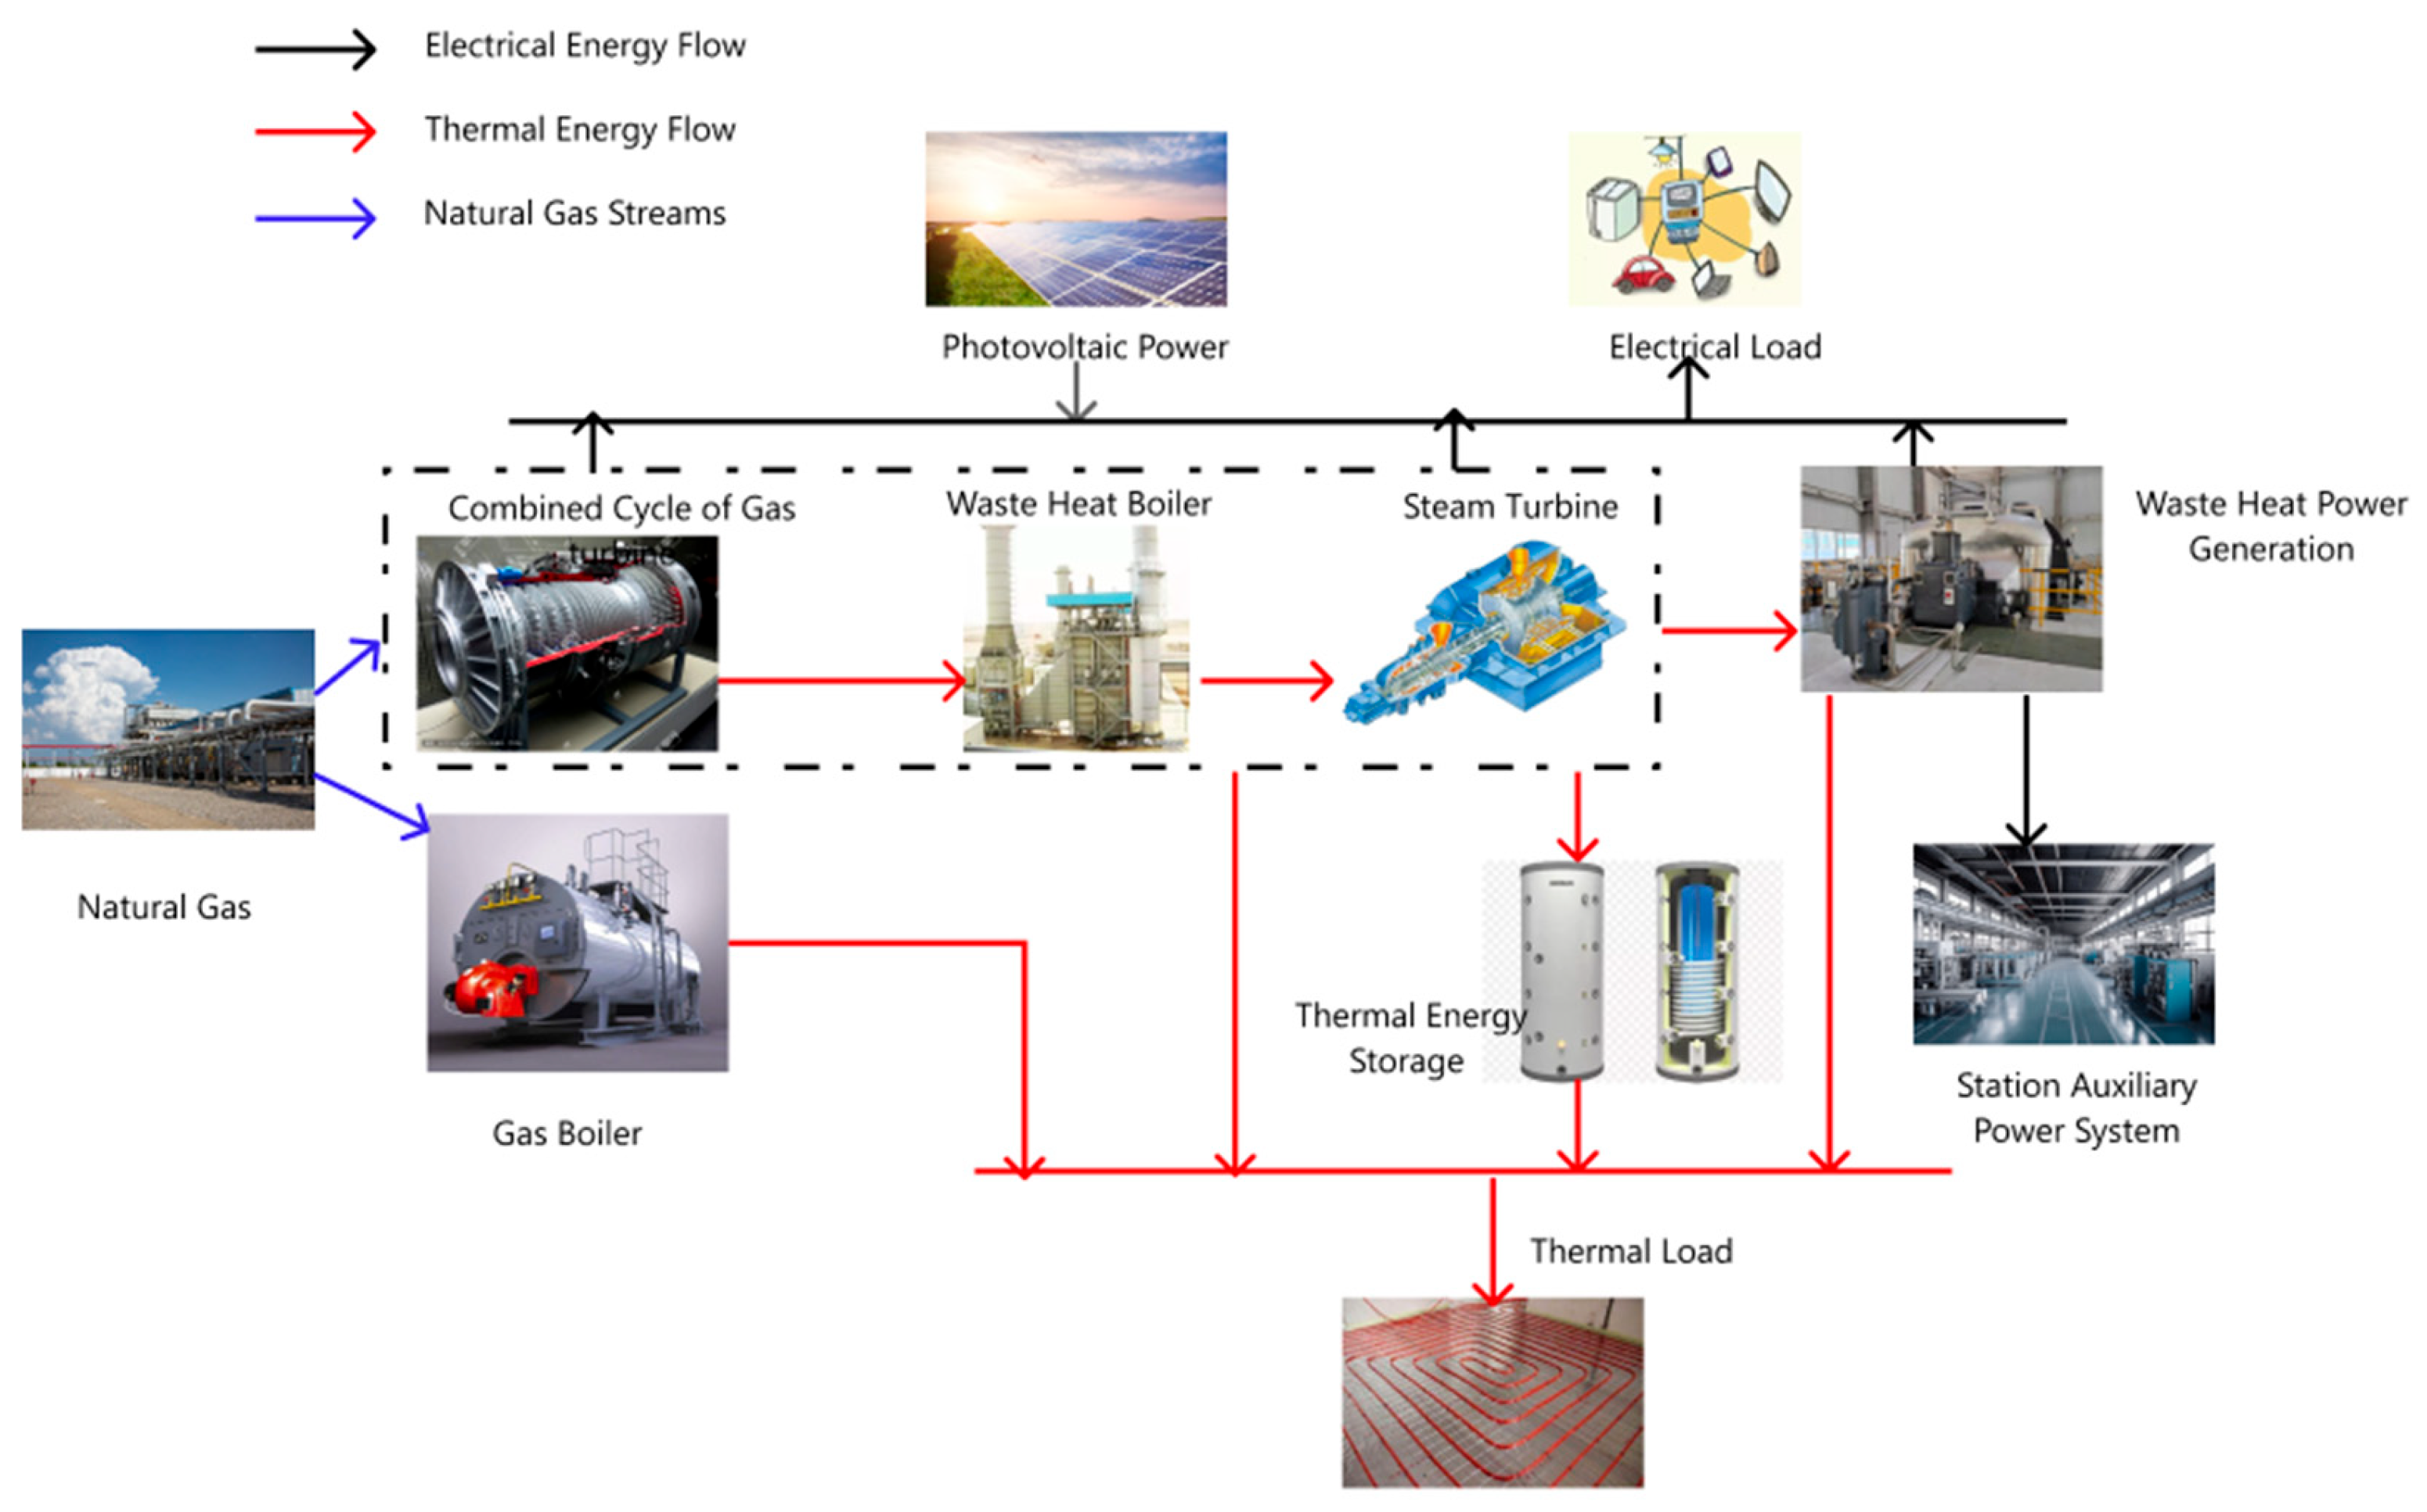
The MECS consists of the CCGT unit, PV station, TES, WHPP, and gas boiler, illustrated in Figure 1. The gas turbine, steam turbine, WHPP, and PV station provide electricity to satisfy the electrical demand. And the steam turbine, WHPP, TES, and gas boiler supply thermal energy for heat users. The gas turbine consumes natural gas to generate electricity and heat. The waste heat boiler in the CCGT system recycles the heat produced by the gas turbine to generate high-temperature steam, which drives the steam turbine to generate electricity and heat. The gas boiler consumes natural gas to provide heat. The WHPP could make full use of waste heat produced during the whole energy production process to improve the energy supply efficiency of the system effectively. In addition, the TES could realize the transfer of heat energy on time scales to promote the consumption of the PV station with less power curtailment. Furthermore, the MECS could provide power support capability during the peak electricity consumption at night, when the power supply is tight. And when the light resources are insufficient, the CCGT unit could provide electricity, and extra heat could be stored in the TES.
To ensure the economy of the MECS utilizing the multi-energy complementation and flexible adjustment capability of energy components, a stochastic optimization model for optimally configuring the capacity of PV station and TES is proposed in this paper.

3. Mathematical Model

3.1. Objective Function

The proposed stochastic planning model is formulated as a mixed-integer programming problem with the objective function given in (1), which considers the energy supply revenue, PV and TES investment costs, as well as operation and maintenance costs of energy components, including the CCGT unit, PV station, TES, WHPP, and gas boiler [19,20].
max F = s = 1 S p s s c e n 1 8760 ρ t e P t , s G + P t , s PV Δ t + ρ t h H t , s G + H t , s TESdis Δ t P s P V , m a x × c P V , i n v × i 1 + i r PV 1 + i r PV 1 + E s , m a x T S × c T S , i n v × i 1 + i r T S 1 + i r T S 1 t = 1 8760 c GS , o m P t G + P t ST + H t whb Δ t + c WHPP , o m P t WHPP Δ t + c G B , o m P t GB Δ t + c PV , o m P t PV Δ t + c T S , o m H t TESdis Δ t + c g a s F t G + F t GB Δ t
The objective function will maximize the annual net income of the MECS. The proposed problem will determine decision variables pertaining to the capacity of the PV station and TES by considering all scenarios of electrical demand.
The first line in the objective function is the annual power and heat supply income. The second line is the investment cost of the PV station and TES. The third and fourth lines are the operation and maintenance costs of the CCGT unit, WHPP, gas boiler, PV station, and TES. The load uncertainties are represented in scenarios, while the PV station and TES capacity configuration will provide a planning strategy to accommodate the system variations.

3.2. Constraints

The constraints are discussed as follows:
A.
PV unit Constraints
The PV output power usually depends on the local solar radiation intensity. The relationship between the PV output power and solar radiation intensity is expressed as follows:
P t P V = G t T G S T C η P V P P V , max 1 + α P V T C T S T C
T C = T en + G t T G OCT T OCT t OCT
The PV output power at each interval is bounded by the rated capacity of the PV unit:
0 P t PV P PV , m a x
B.
CCGT unit Constraints
The CCGT unit mainly consists of a gas turbine, waste heat boiler, and steam turbine. The gas turbine consumes natural gas to produce electricity and heat. The waste heat boiler uses the heat produced by the gas turbine to generate steam. And the steam turbine is driven by the steam to generate electrical and thermal energy. The energy conversions of the gas turbine, waste heat boiler, and steam turbine are illustrated as follows:
P t G = η ge G F t G
H t G = η gh G F t G
H t whb = η hh whb H t G
P t ST = η he ST H t whb
H t ST = η hh ST H t whb
The output power of the CCGT unit is limited by the minimum and maximum output limits, and the power changes in consecutive intervals depend on the CCGT unit’s ramp capability, expressed as follows:
P GS , min P t G + P t ST P GS , max
R d o w n P t G + P t ST P t 1 G P t 1 ST R u p
C.
TES Constraints
The operation of TES is limited by capacity status, capacity, operation cycle, and charge/discharge rate, and the charge/discharge rate is influenced by the maximum storage capacity and full load hours of the TES. The operation constraints of TES are expressed as follows [21,22]:
E t TS = 1 γ s t r E t 1 TS + η c H t TESch Δ t H t TESdis η d Δ t
E min TS E t TS E max TS
E 24 d = E d , d = 1 , 2 , , 365
0 H t TESdis E max TS T full TS
0 H t TESch E max TS T full TS
D.
WHPP Constraints
To enhance the energy efficiency of the MECS, the WHPP is adopted to capture the waste heat from steam turbines, which would produce electricity and heat to fulfill the energy requirements, as demonstrated as follows:
P t RSP = η he RSP H t ST H t TESch H t ST , load
H t RSP = η hh RSP H t ST H t TESch H t ST , load
E.
Gas Boiler Constraints
The gas boiler could realize the conversion of natural gas and thermal energy, and the thermal energy provided by the gas boiler is defined as follows:
H t GB = η gh GB F t GB
0 H t GB H max GB
F.
Power Balance Constraints
The electrical power balance constraints of the MECS are as follows:
P t PV + P t G + P t ST + P t RSP = P t load
The thermal power balance constraints of the MECS are as follows:
H t ST , load + H t RSR + H t TESdis + H t GB = H t load

4. Uncertainty Modeling

In this work, a set of possible scenarios is generated based on the GANs for describing the uncertainty of load demand in four seasons. GANs are one of the machine learning methods for learning the latent distribution of historical data. They could discover the potential correlations via continuously learning the patterns of training data and generate new data sets with similar features. It is widely used for data generation when the real data are insufficient.
GANs usually consist of a generative model and a discriminative model. The generative model would artificially synthesize data samples according to the real data samples to deceive the discriminative model. The discriminative model would learn to identify whether samples are real or synthetic by using neural networks. The generative model and discriminative model continuously improve their own generation and discrimination capabilities through mutual training. And the learning optimization process is to find the Nash equilibrium between them [23].
In the generative model, random noise is received and sampled by neural networks during the training process, and the generated sample data are obtained after a large number of iterations of learning.
In the discriminative model, the model inputs are the real samples from the training set and sample data generated by the generative model. And these input data are sampled by neural networks to determine the probability that the data comes from the real training samples. The confrontation between the generative model and discriminative model forms a minimax game problem, expressed as follows:
min G max D L G , D = E R D R E S D G S
where D and G are weight parameterizations from two different deep neural networks.
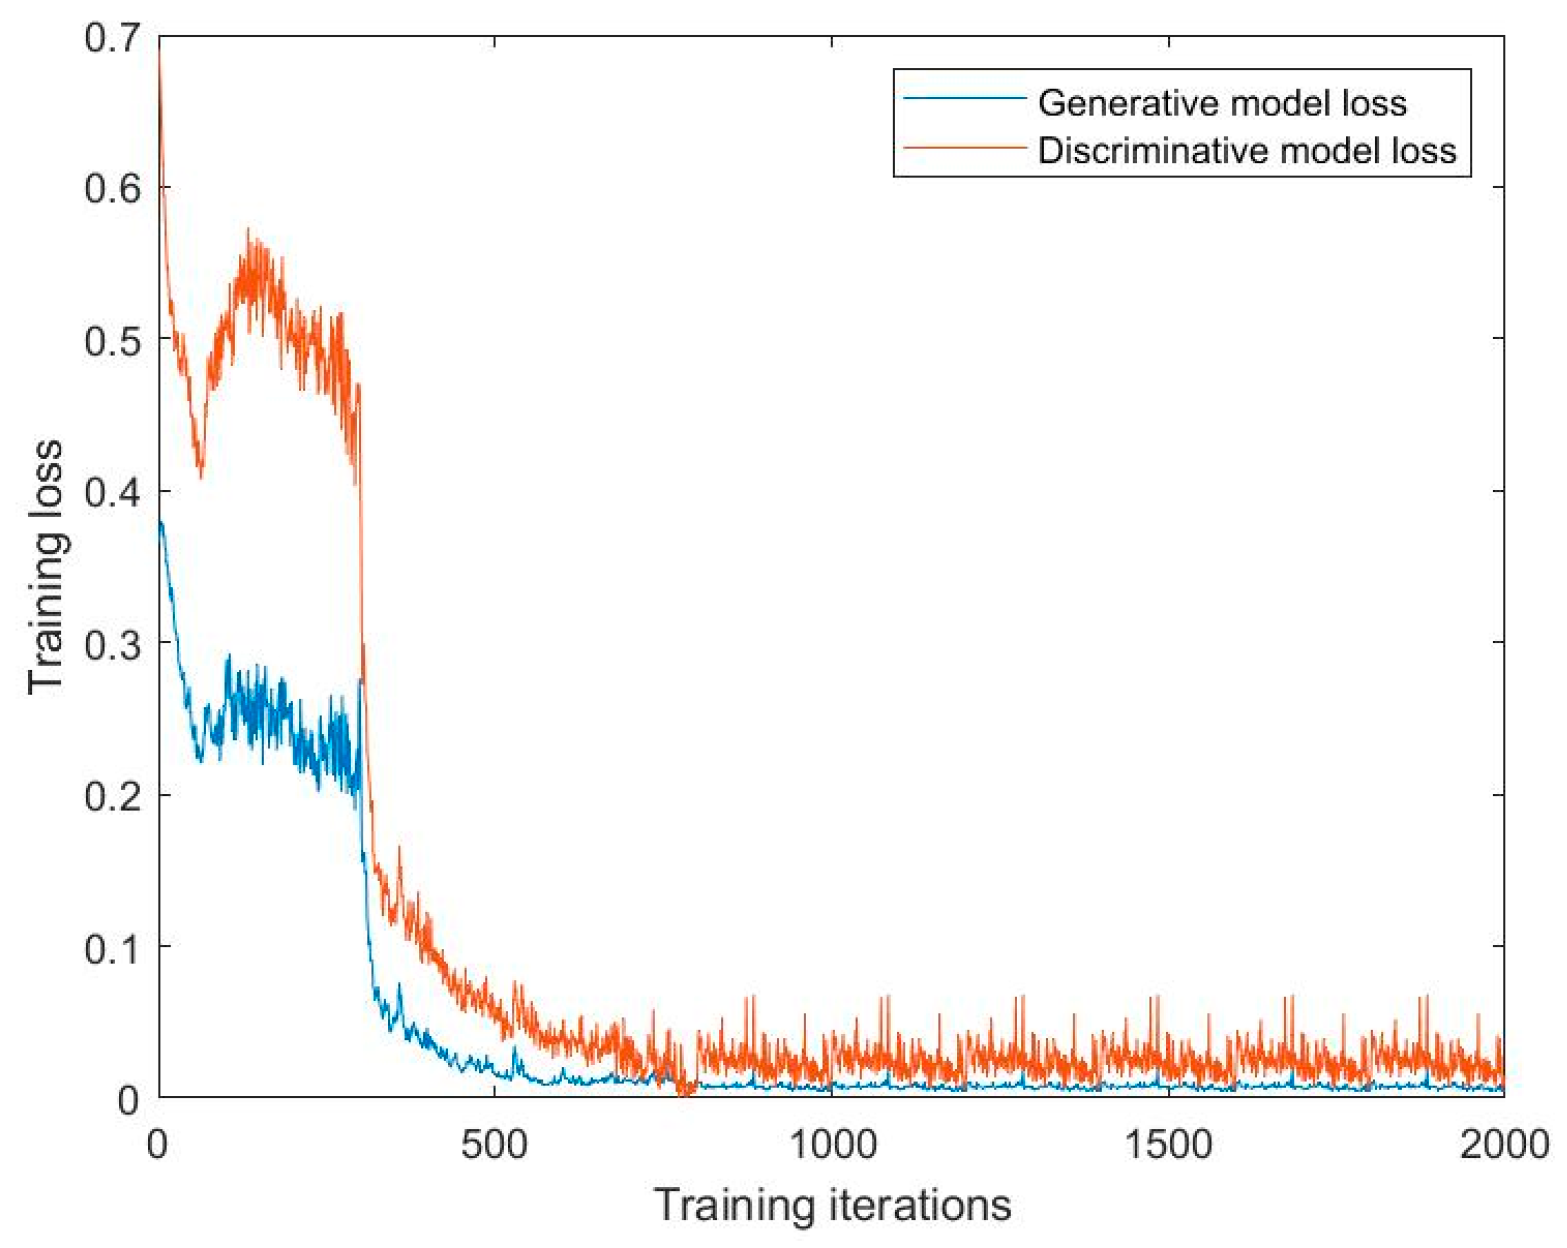
In the initial stage of training, there is a significant difference between the generated data and the actual data. The discriminative model has a higher success rate in distinguishing the generated data and the actual data. At this stage, the loss function of the generative model is larger and the loss function of the discriminative model is smaller. As the training process develops, the generative model and the discriminative model constantly compete until converging to a dynamic equilibrium state.
Based on the above GANs approach, the load demand scenario is built considering the temporal correlation of the load time series. And as the electricity consumption behavior of users is influenced by seasons, the load demand scenarios in four seasons are generated separately.
5. Case Study

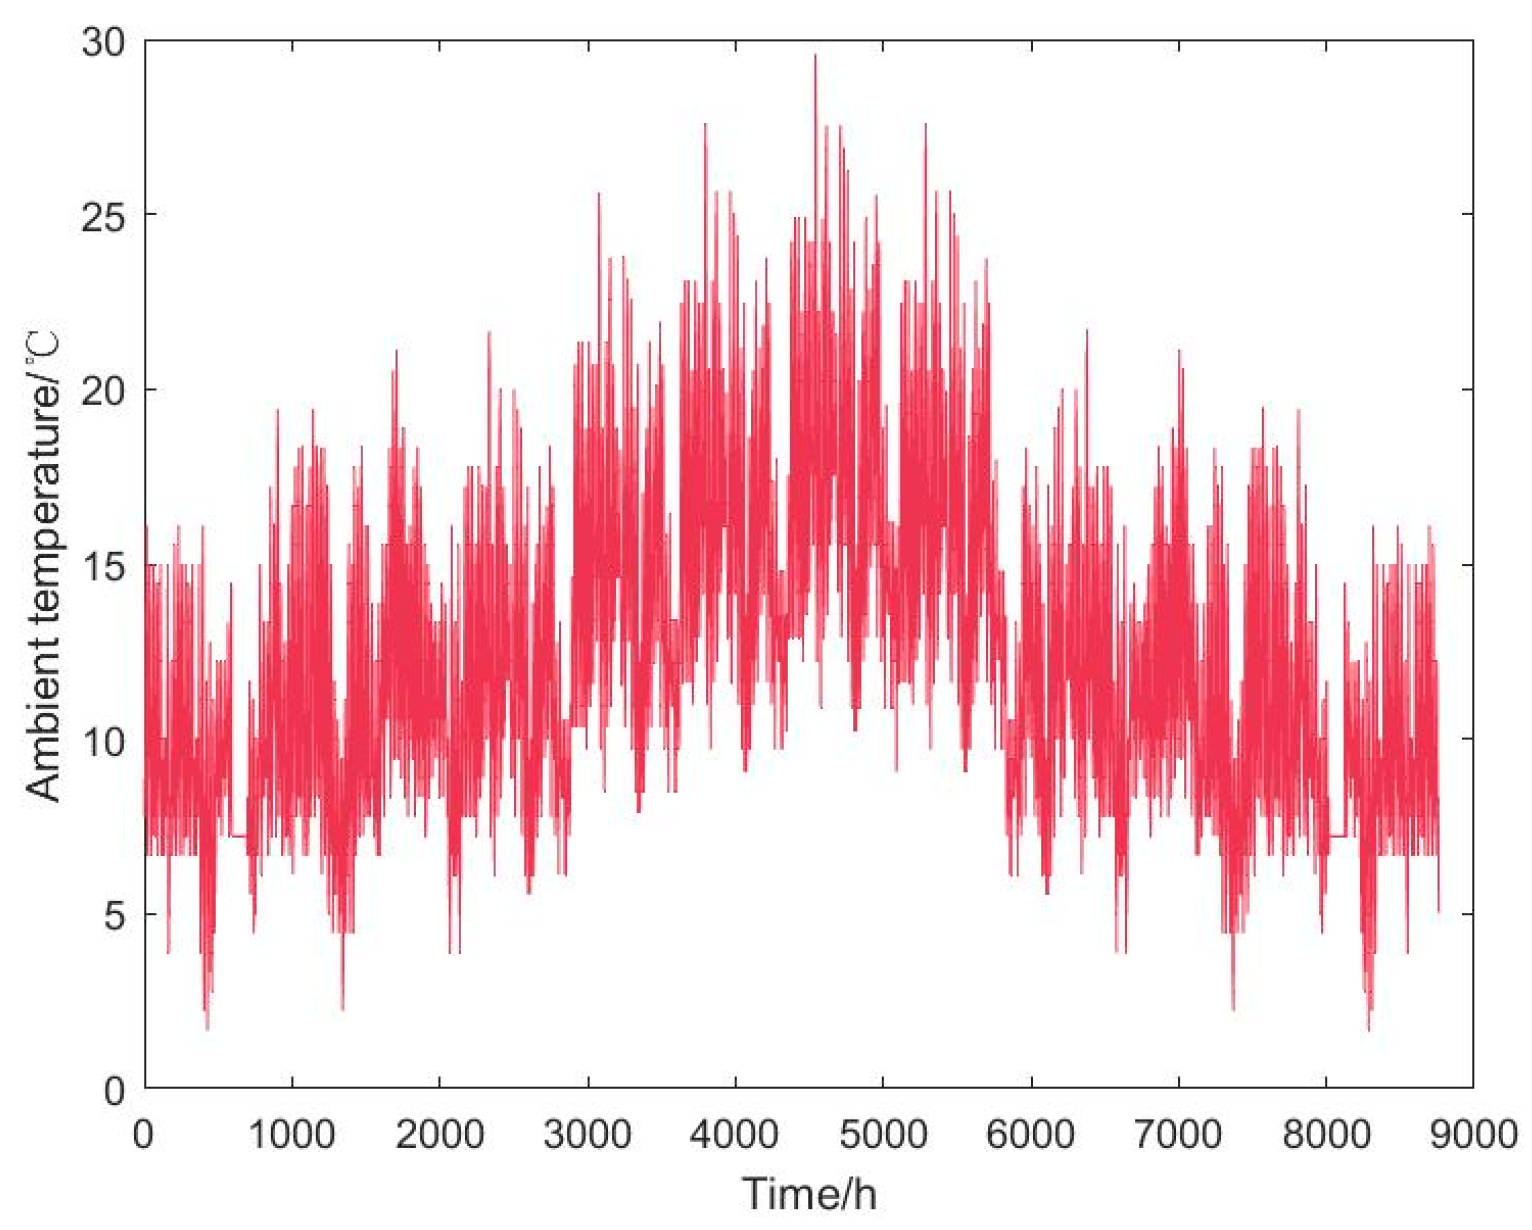
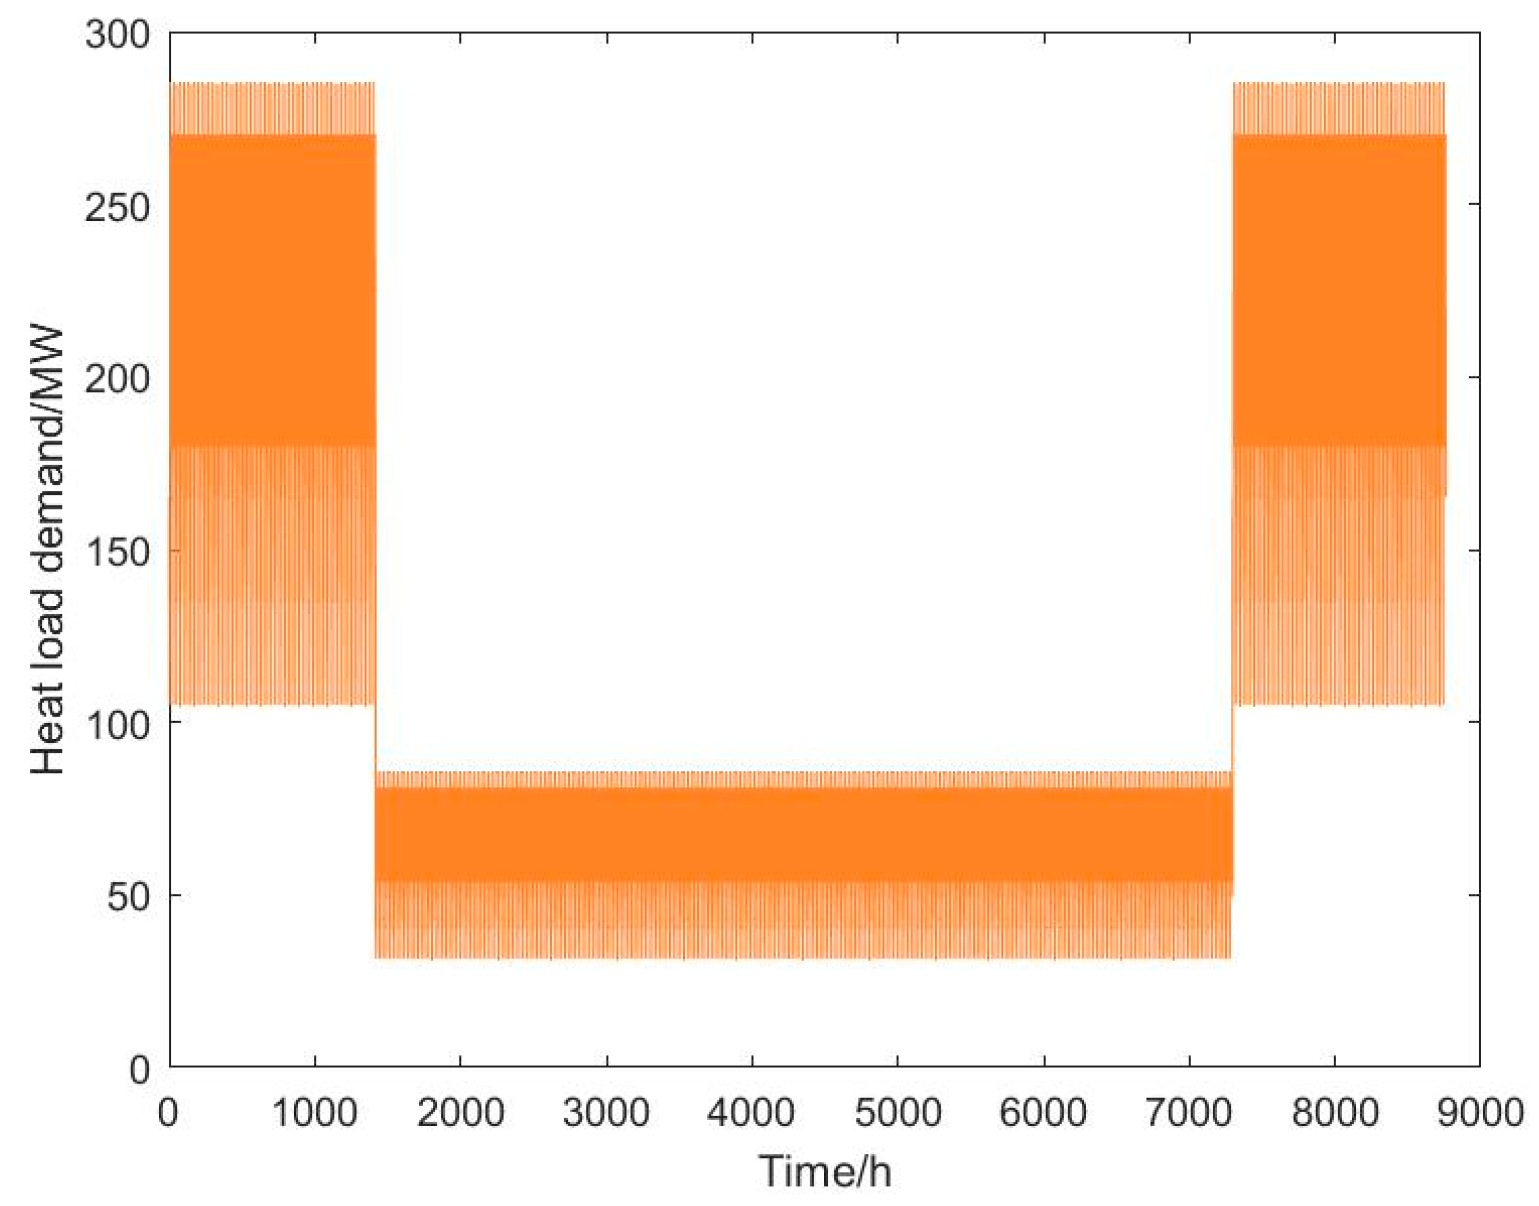
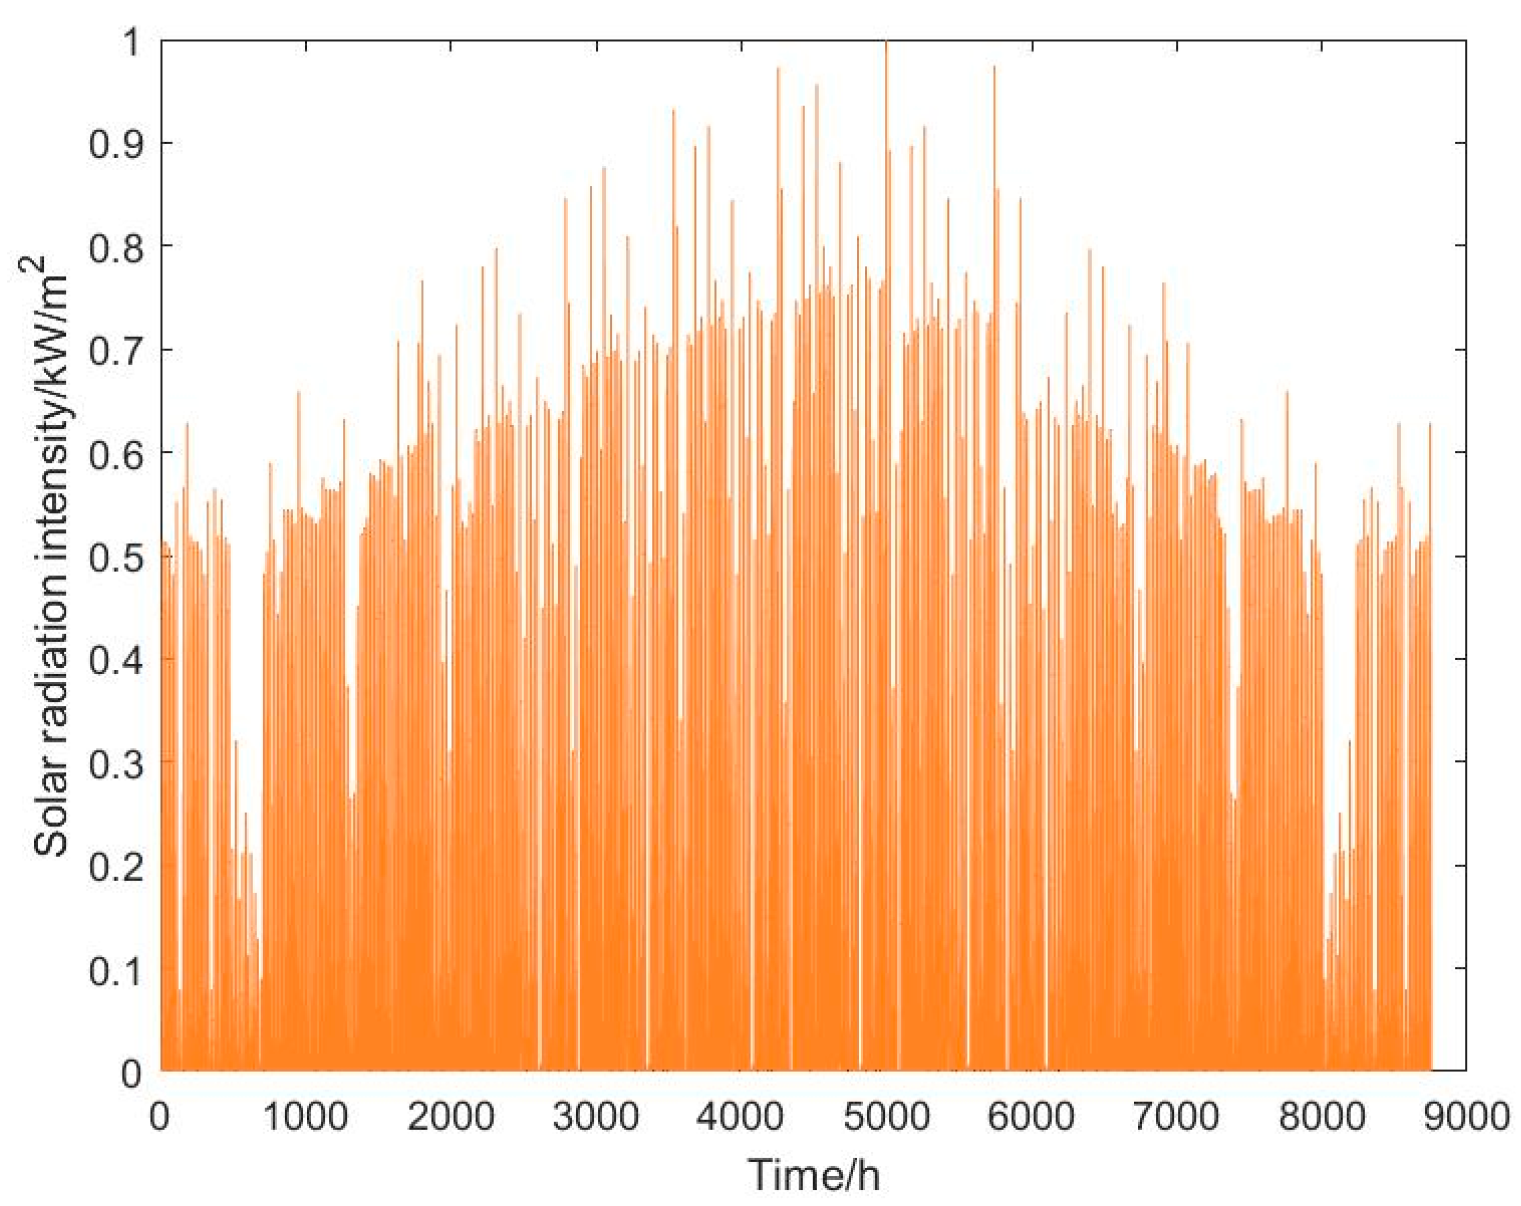
To validate the proposed method, a multi-energy complementary zone has been considered as a case study. The parameters of the equipment in the multi-energy complementary zone have been listed in Table 1. The parameters related to investment, operation, and maintenance costs are shown in Table 2. The annual solar radiation intensity, ambient temperature, heat load demand, and energy prices are shown in Figure 2, Figure 3, Figure 4 and Figure 5, respectively.
The multiple scenarios have been generated for electrical demand through GAN, including spring, summer, autumn, and winter. The historical load data of a certain region from 2006 to 2007 are used as training samples. And the proposed framework is still valid if the data for future or existing conditions could be obtained. The hyperparameters adopted for model training of the GANs model are shown in Table 3.
The proposed stochastic planning model in this paper is a mixed-integer linear programming problem. The Gurobi Optimizer is used in the MATLAB R2021a software to code and solve the model.

5.1. Scenario Generation Results

The generative and discriminative model loss during training is shown in Figure 6. The loss reflects the difference between the sample distribution and the true distribution. In the early stages of training, the loss of the generative and discriminative models is larger. This shows that the discriminative model can effectively distinguish between generated samples and real samples. Through continuous training, the loss of the discriminative model gradually decreases, and the generated samples gradually approach the real samples. When the similarity between the generated sample and the real sample reaches a certain level, the loss gradually converges to near zero and samples with a similar distribution to real data are generated.
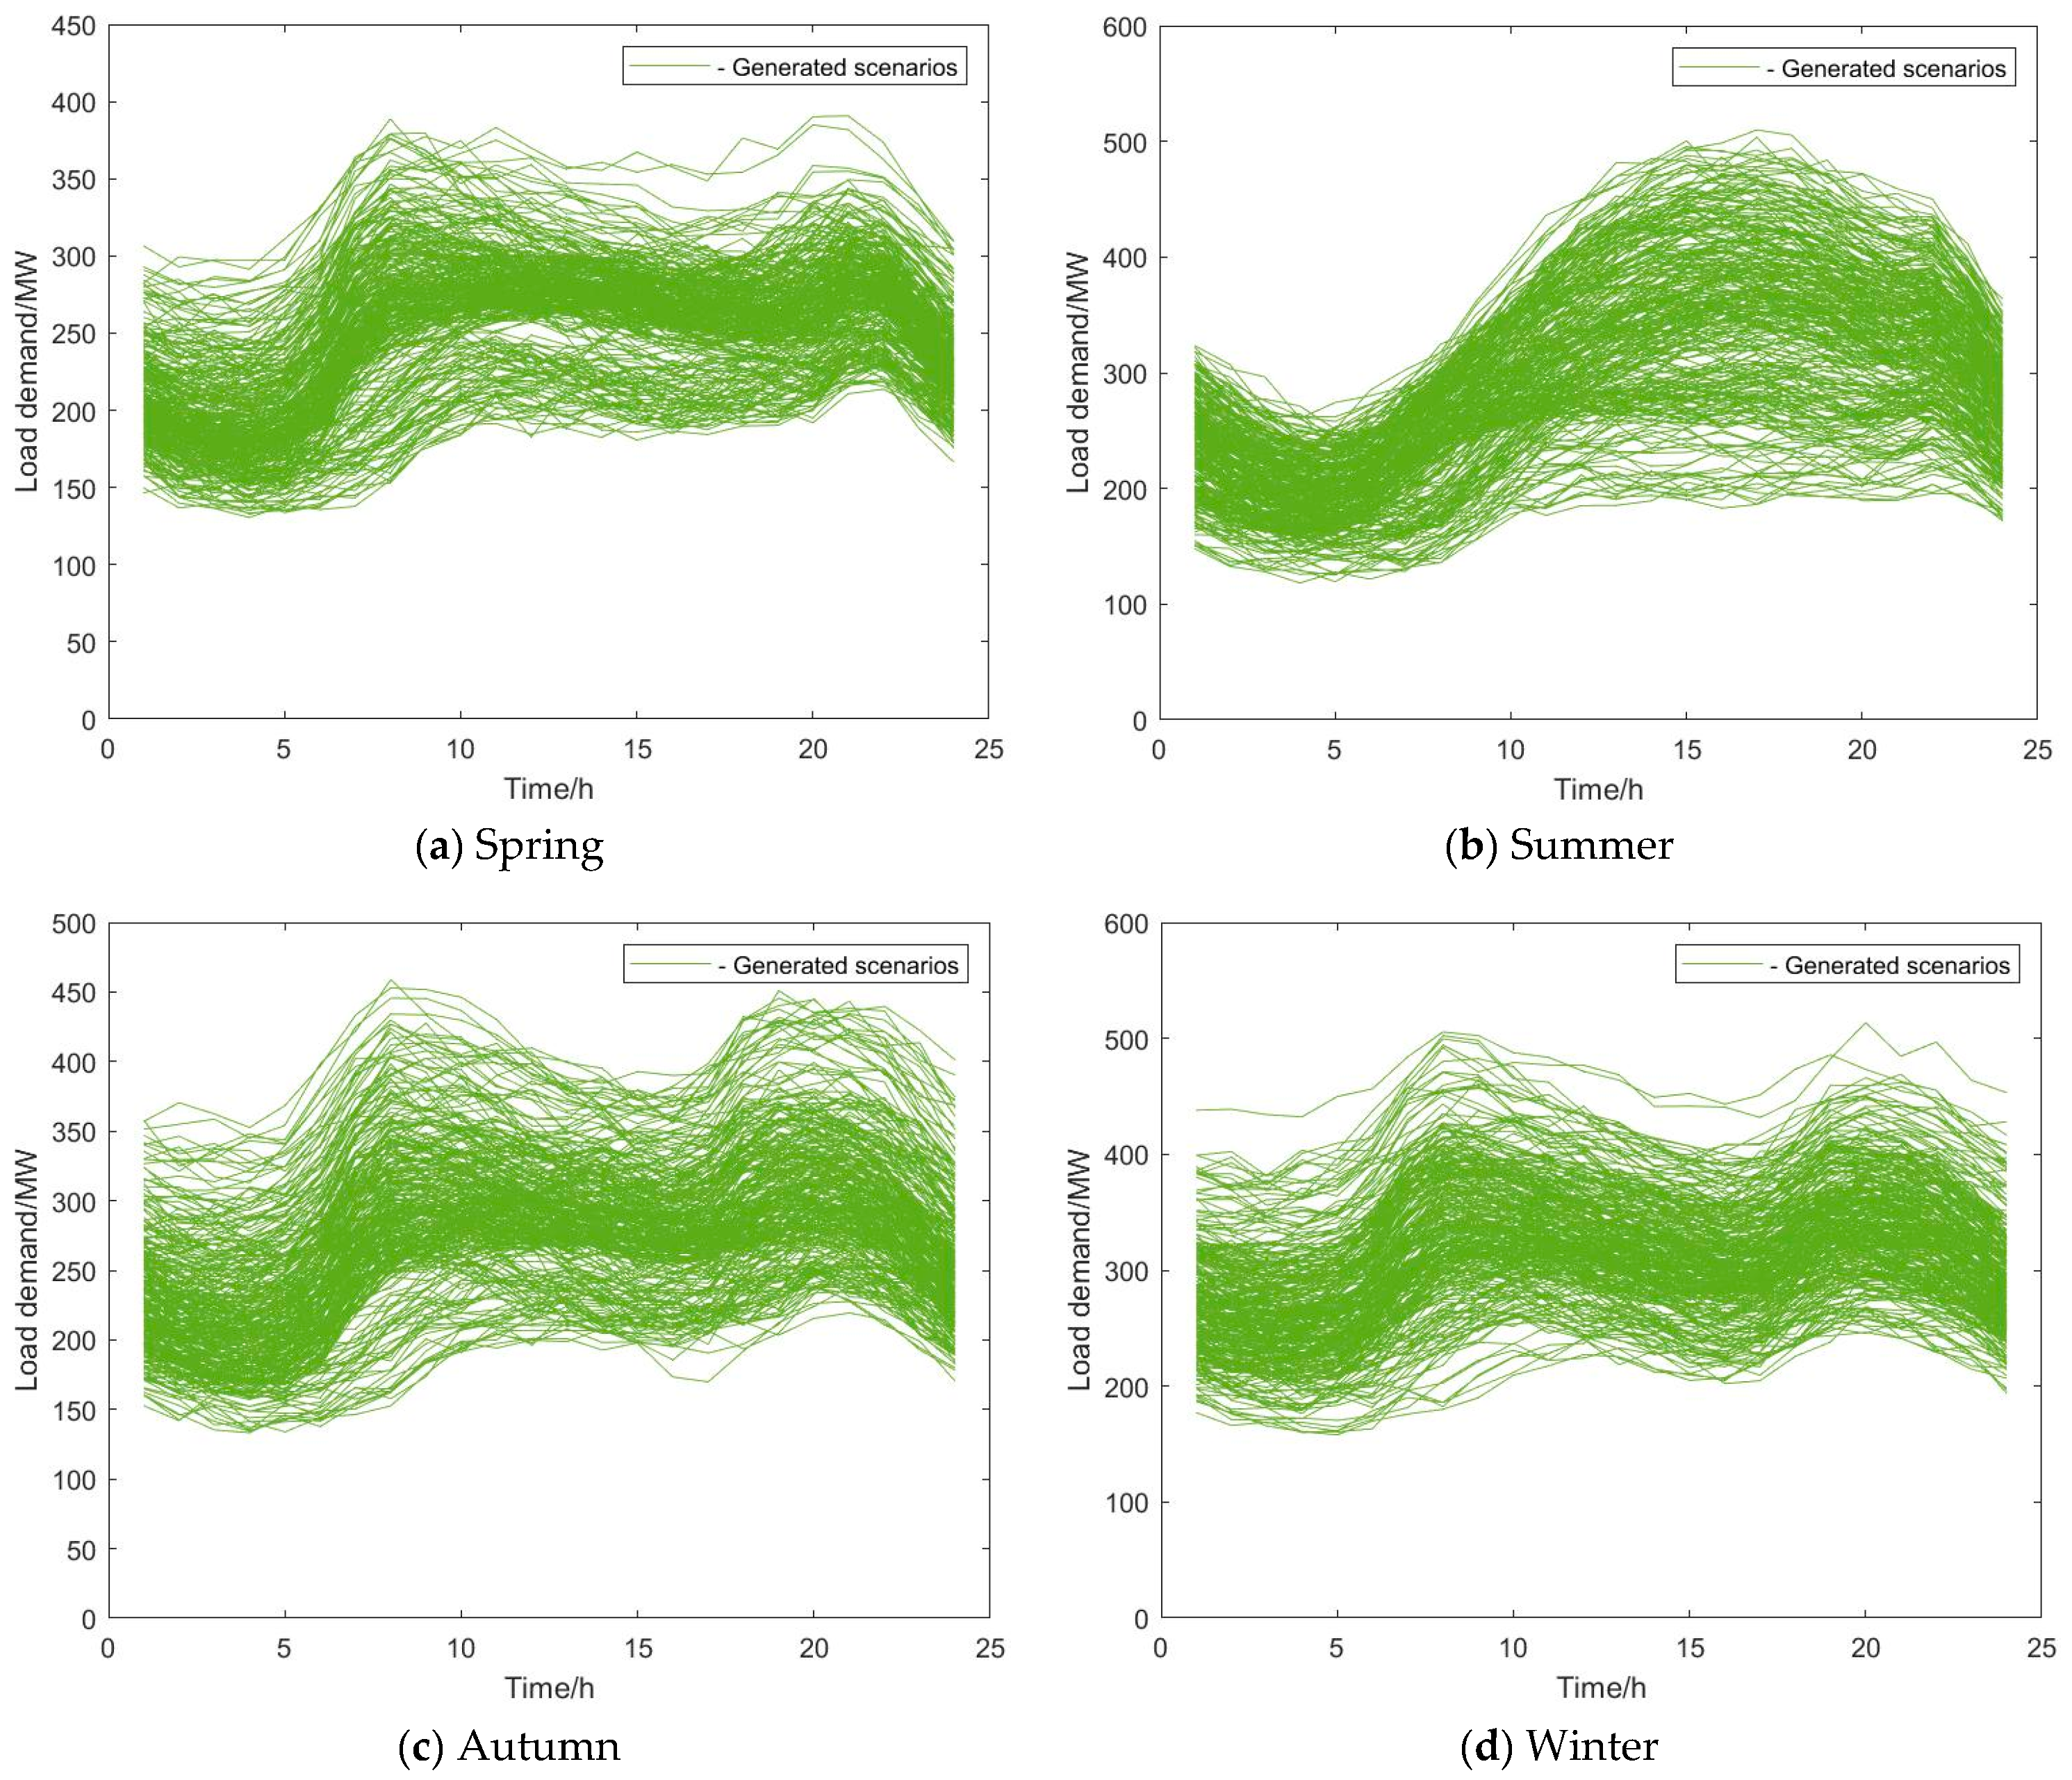
The generated load demand scenarios in different seasons are illustrated in Figure 7. It can be seen from Figure 7 that the electrical demand in different seasons has different trends during a 24 h day. The load demand in spring, autumn, and winter presents bimodal, and the peak load occurs at 7 to 9 in the morning and 19 to 23 in the evening. Unlike this, the load demand in summer presents unimodal, and the peak load is centered around 14 to 21. The duration of peak load is longer, from afternoon to evening. In addition, the peak load of summer and winter is larger than the peak load of spring and autumn, which is consistent with the actual users’ electricity usage habits.
To improve the computation efficiency, the Fuzzy C-means method is adopted to reduce 300 scenarios to 4 typical scenarios of each season, shown in Figure 8. The Fuzzy C-means clustering is selected because its soft-partitioning nature allows extreme scenarios to influence multiple cluster centers, reducing the smoothing effect. Most importantly, the feature vector used for clustering each load scenario explicitly included the seasonal peak load value. This ensures that the clustering algorithm distinguishes scenarios based on their maximum demand levels. The four typical load scenarios could reflect the differences in users’ electricity consumption characteristics in different seasons.

5.2. Optimization Results

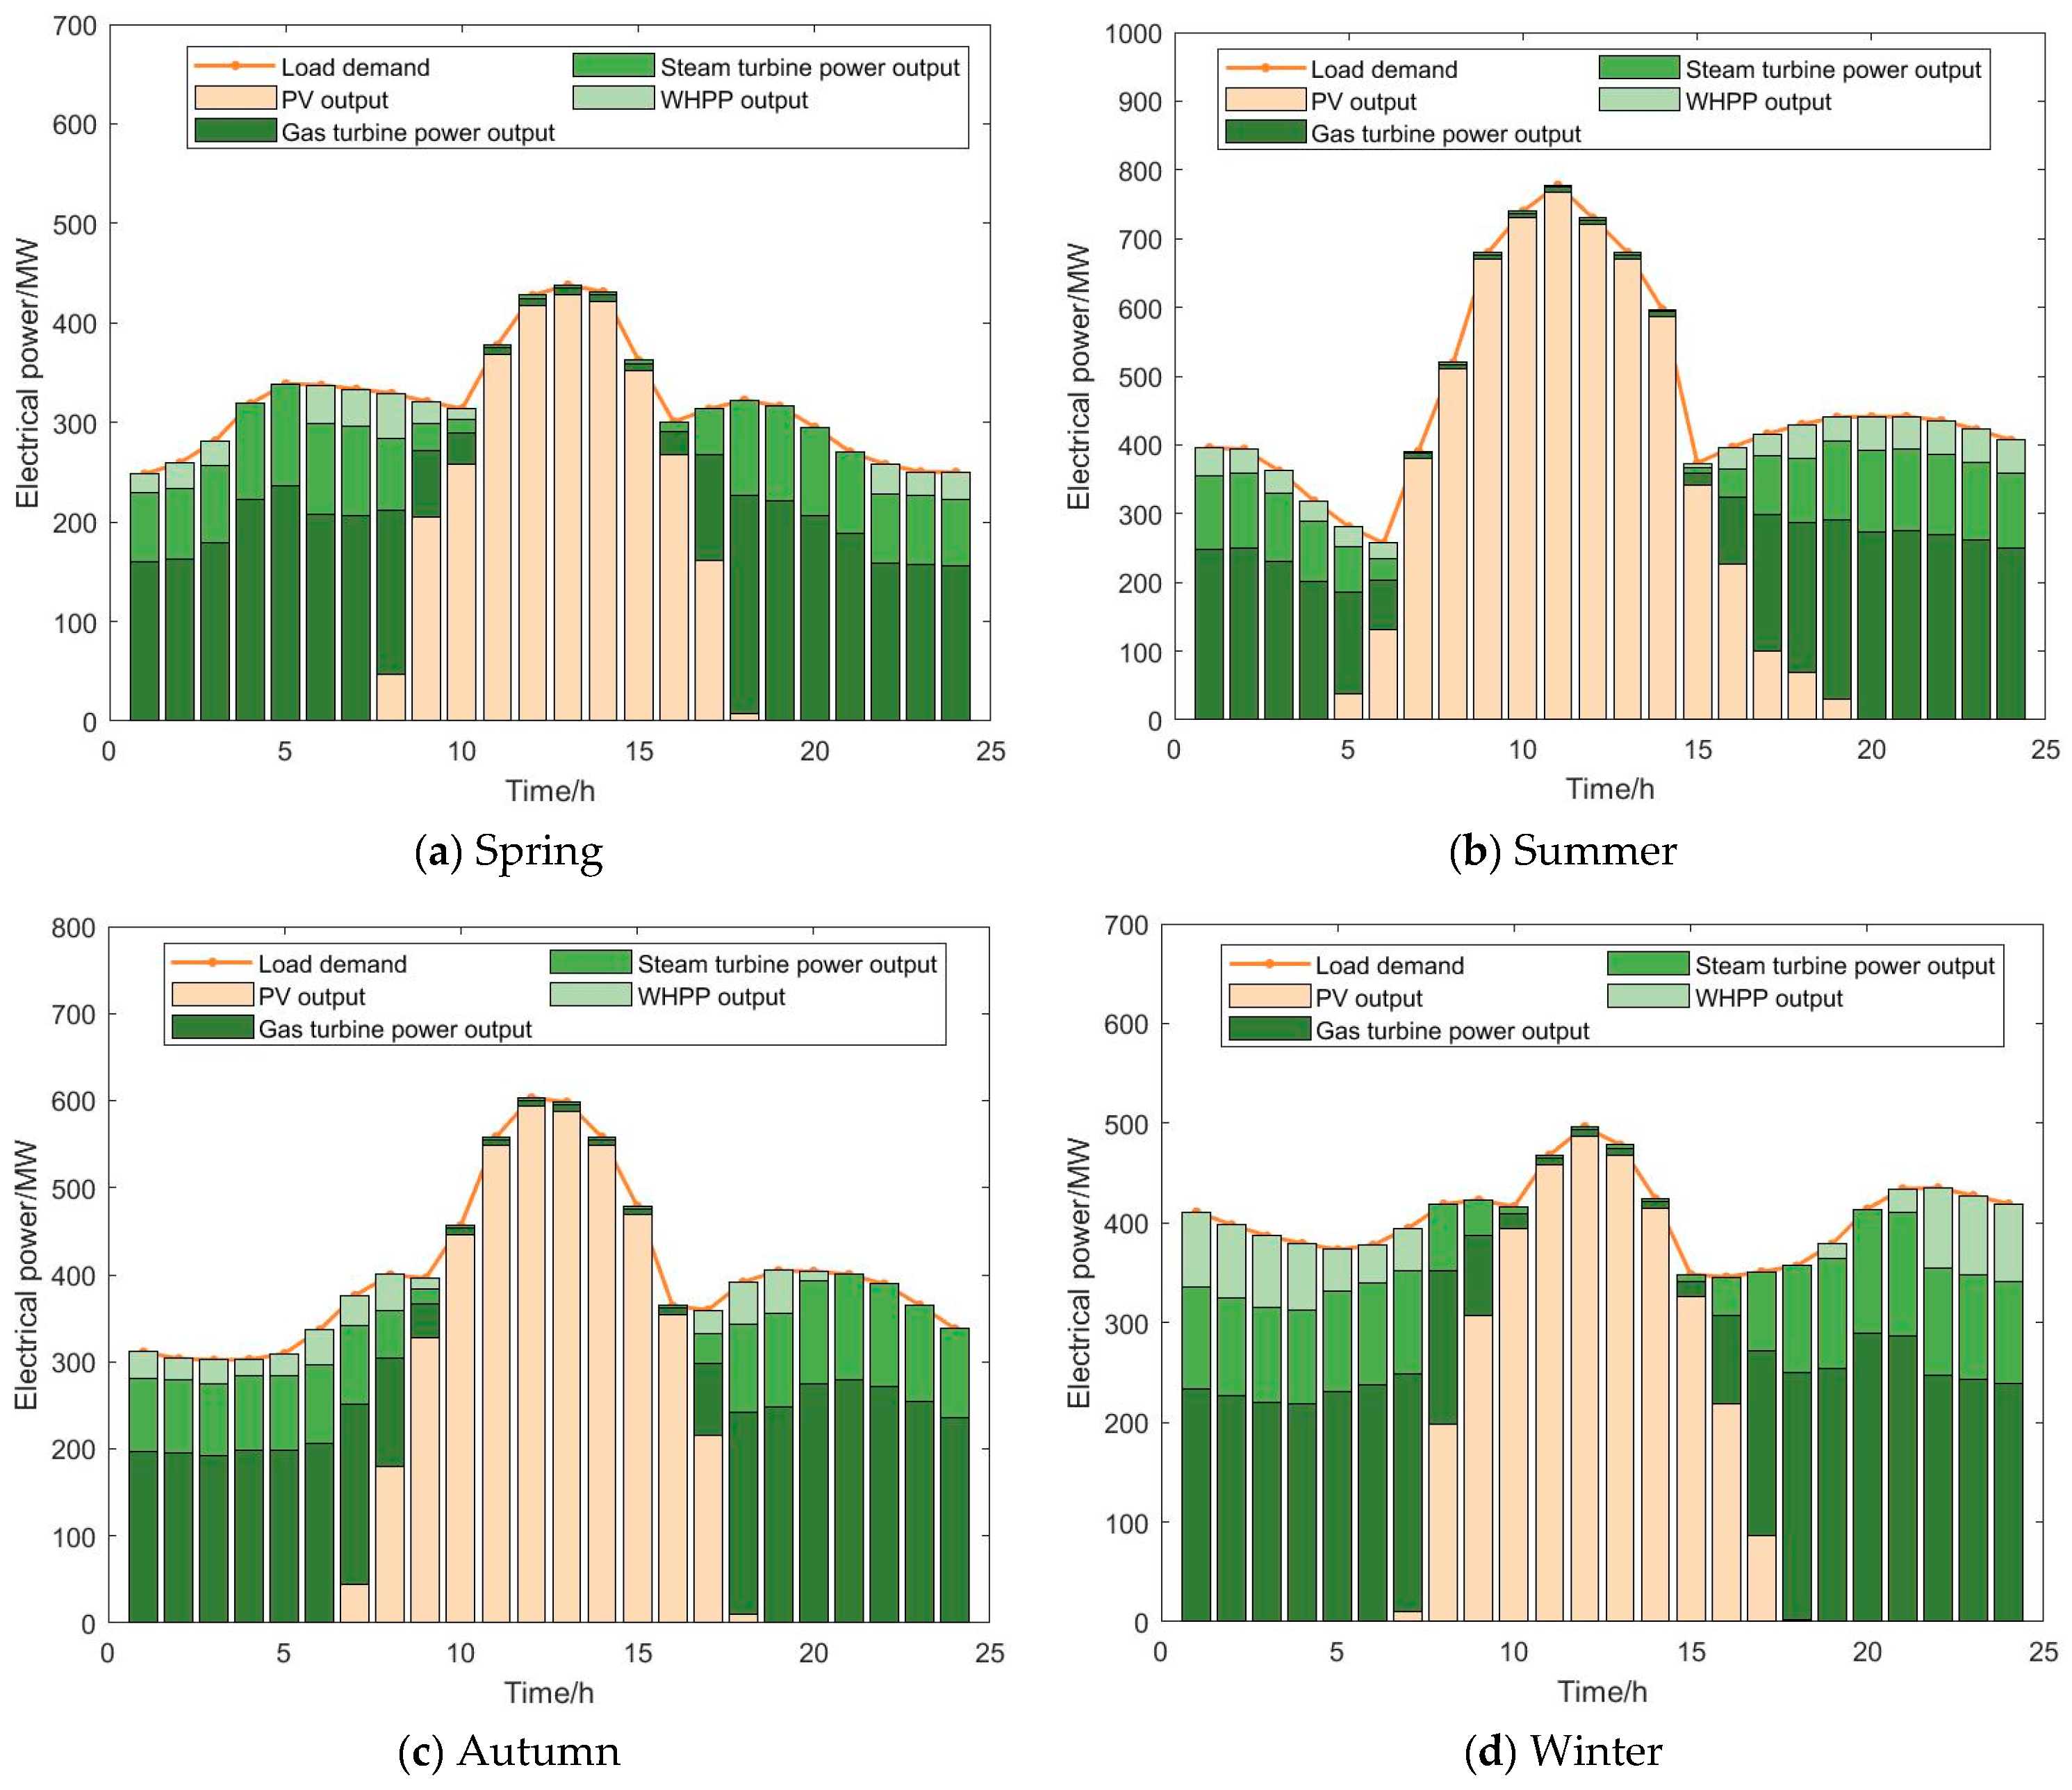
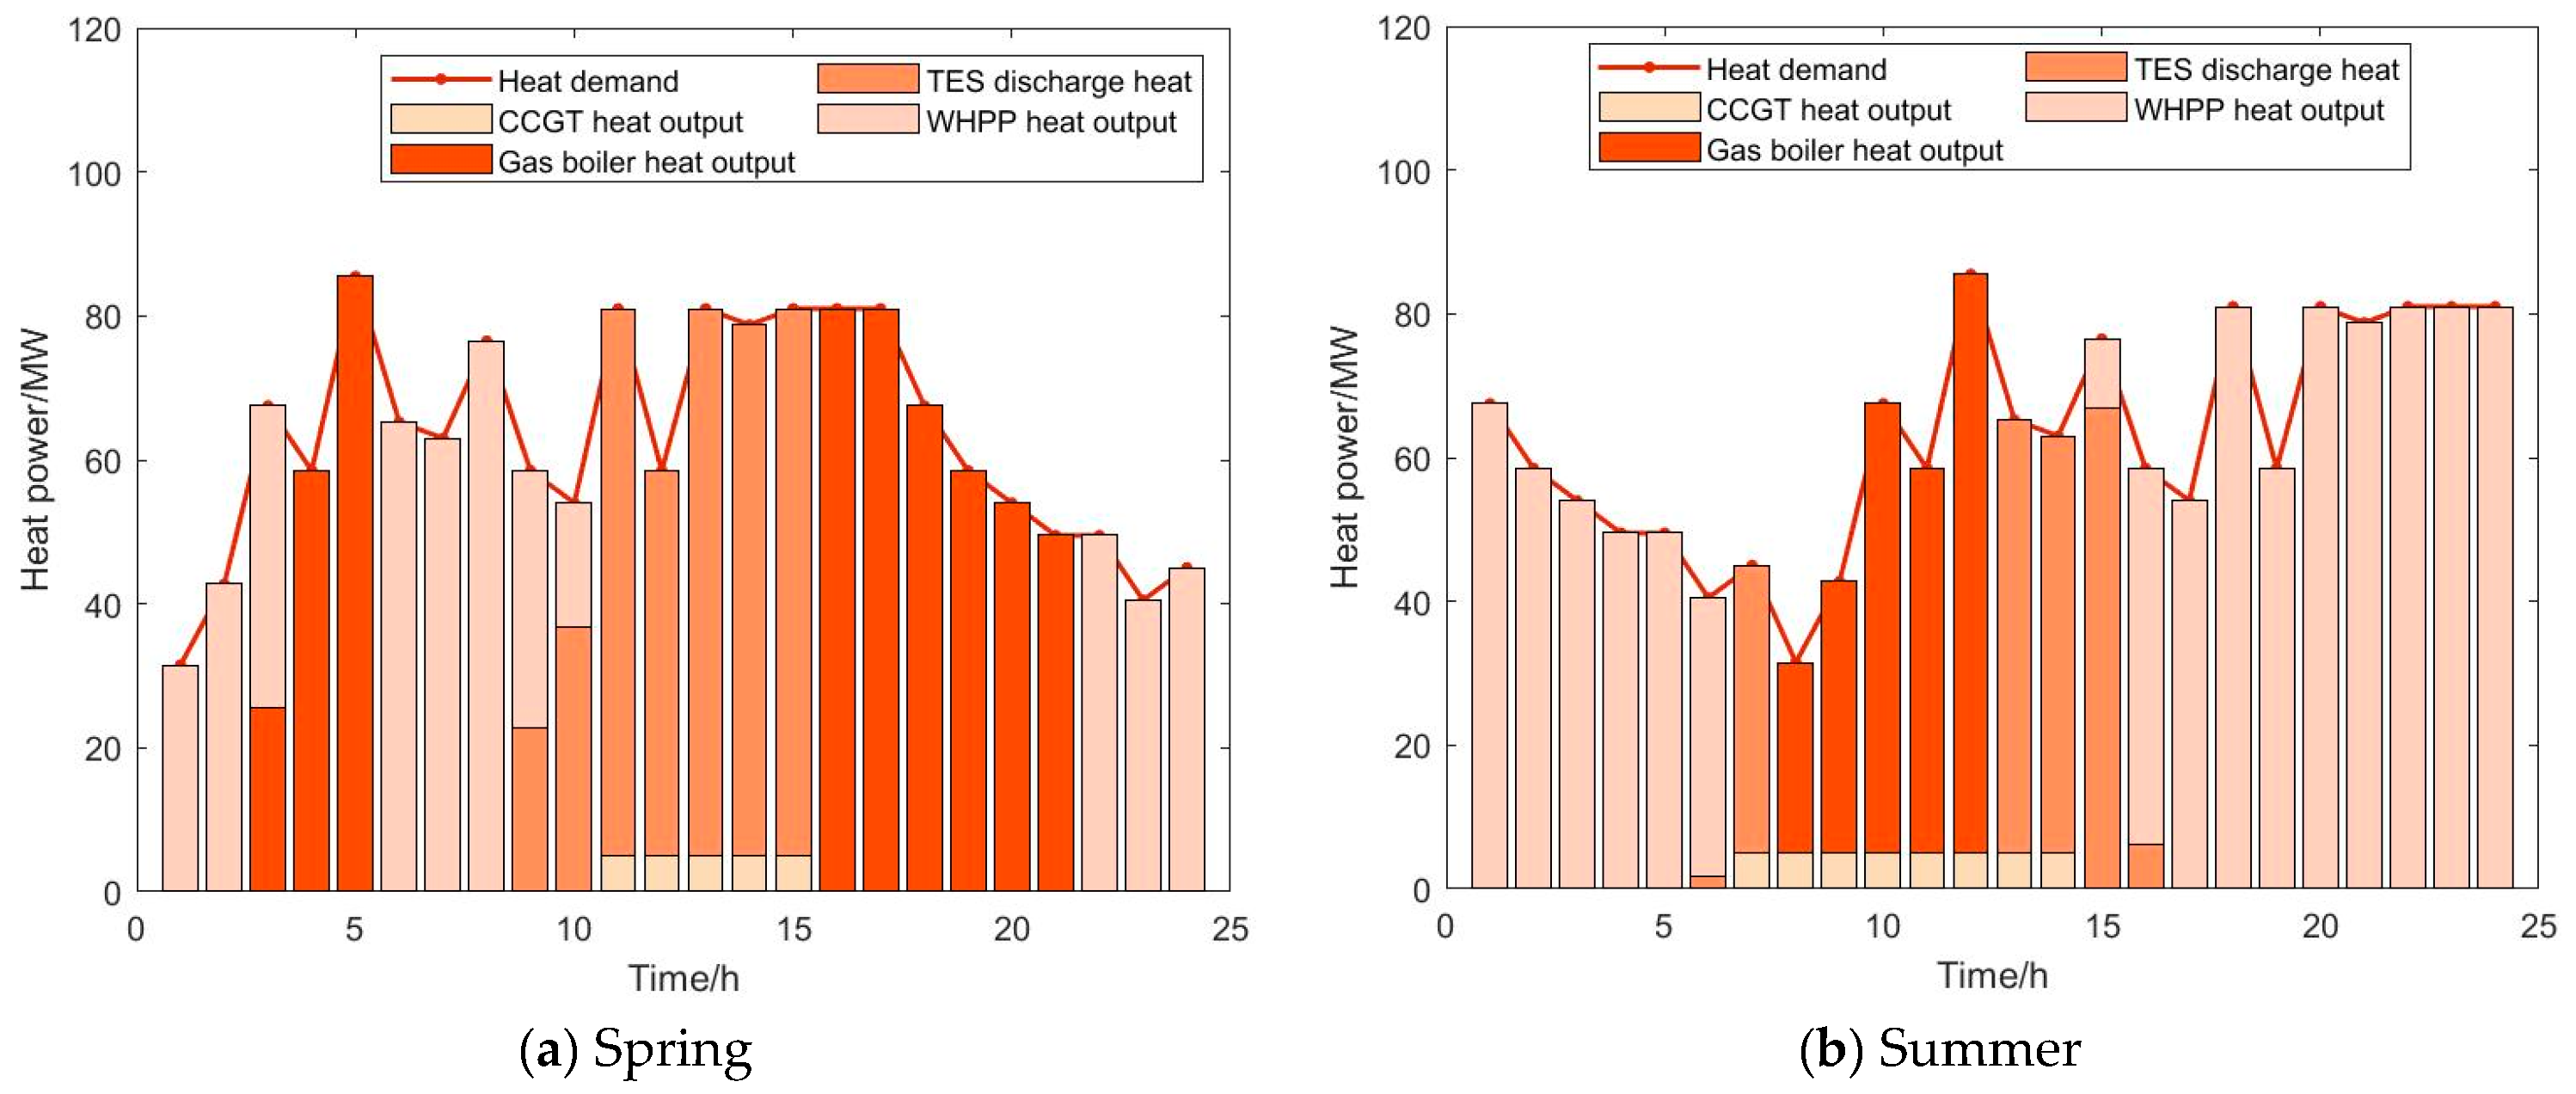
The optimal typical daily electrical and thermal output of MECS in four seasons obtained by the proposed planning method is shown in Figure 9 and Figure 10. Figure 9 shows that PV station output is different in spring, summer, autumn, and winter due to the varying solar radiation intensity and ambient temperature. And when PV stations’ output is at peak, the electricity produced by PV stations would be used first. When PV stations’ output is at the valley, the CCGT unit and WHPP would produce electricity to satisfy the electrical demand. Figure 10 shows that the CCGT unit, gas boiler, TES, and WHPP would adjust their heat output to meet the heat load demand in spring, summer, autumn, and winter. The TES discharges heat when the heat price is high, and the regulating ability of TES is shown in spring, summer, and autumn.
In addition, the economic benefits of WHPP could be studied based on the optimization results. In the proposed system, the economic benefits of WHPP primarily manifest in two ways: (1) direct fuel cost savings by reducing the need for auxiliary fossil-fueled generation, and (2) revenue increase by selling more energy. In terms of fuel cost savings, WHPP captures the waste heat from the combined cycle gas turbine (CCGT) unit to reduce natural gas consumption. According to the optimization results shown in Figure 9, WHPP produces electricity (1965.3 MWh) on four typical days of four seasons, mainly when the photovoltaic output is small, which replaces the CCGT unit and saves CNY 1,162,788.0 in natural gas costs. In addition, as shown in Figure 10, WHPP generates heat (3275.5 MWh) on four typical days of four seasons, which replaces the gas boiler and saves CNY 1,130,488.4 in natural gas costs. In terms of revenue increase, WHPP generates electricity and heat to meet the electrical and thermal demand of users, and gains profits of CNY 635,148.4 and CNY 712,739.6 by selling electricity and heat, respectively.

5.3. The Influence of Number of Scenarios

To study the influence of the number of typical scenarios on optimization results, 16, 81, and 256 scenarios are considered to calculate the proposed planning model, and the optimization results are shown in Table 4. It can be seen from Table 4 that the investment and operation costs of the multi-energy complementary system increase with the increase in number of scenarios. This is due to the fact that the more scenarios there are, the more seasonal changes are considered, and the more robust the optimization result is. Compared with the planning scheme based on actual load, the optimization result based on 256 scenarios is more accurate. This indicates that the optimal strategy is more practical when considering more scenarios. But as the number of scenarios increases, the calculation time increases. The number of scenarios would significantly affect the calculation times of the optimization model. This is because the computational cost of the optimization model is highly positively correlated with the number of scenarios, and is usually a nonlinear growth relationship. Thus, it is necessary to balance the reliability of the calculation results with computation time by setting the number of scenarios.

5.4. The Influence of Energy Storage Capacities

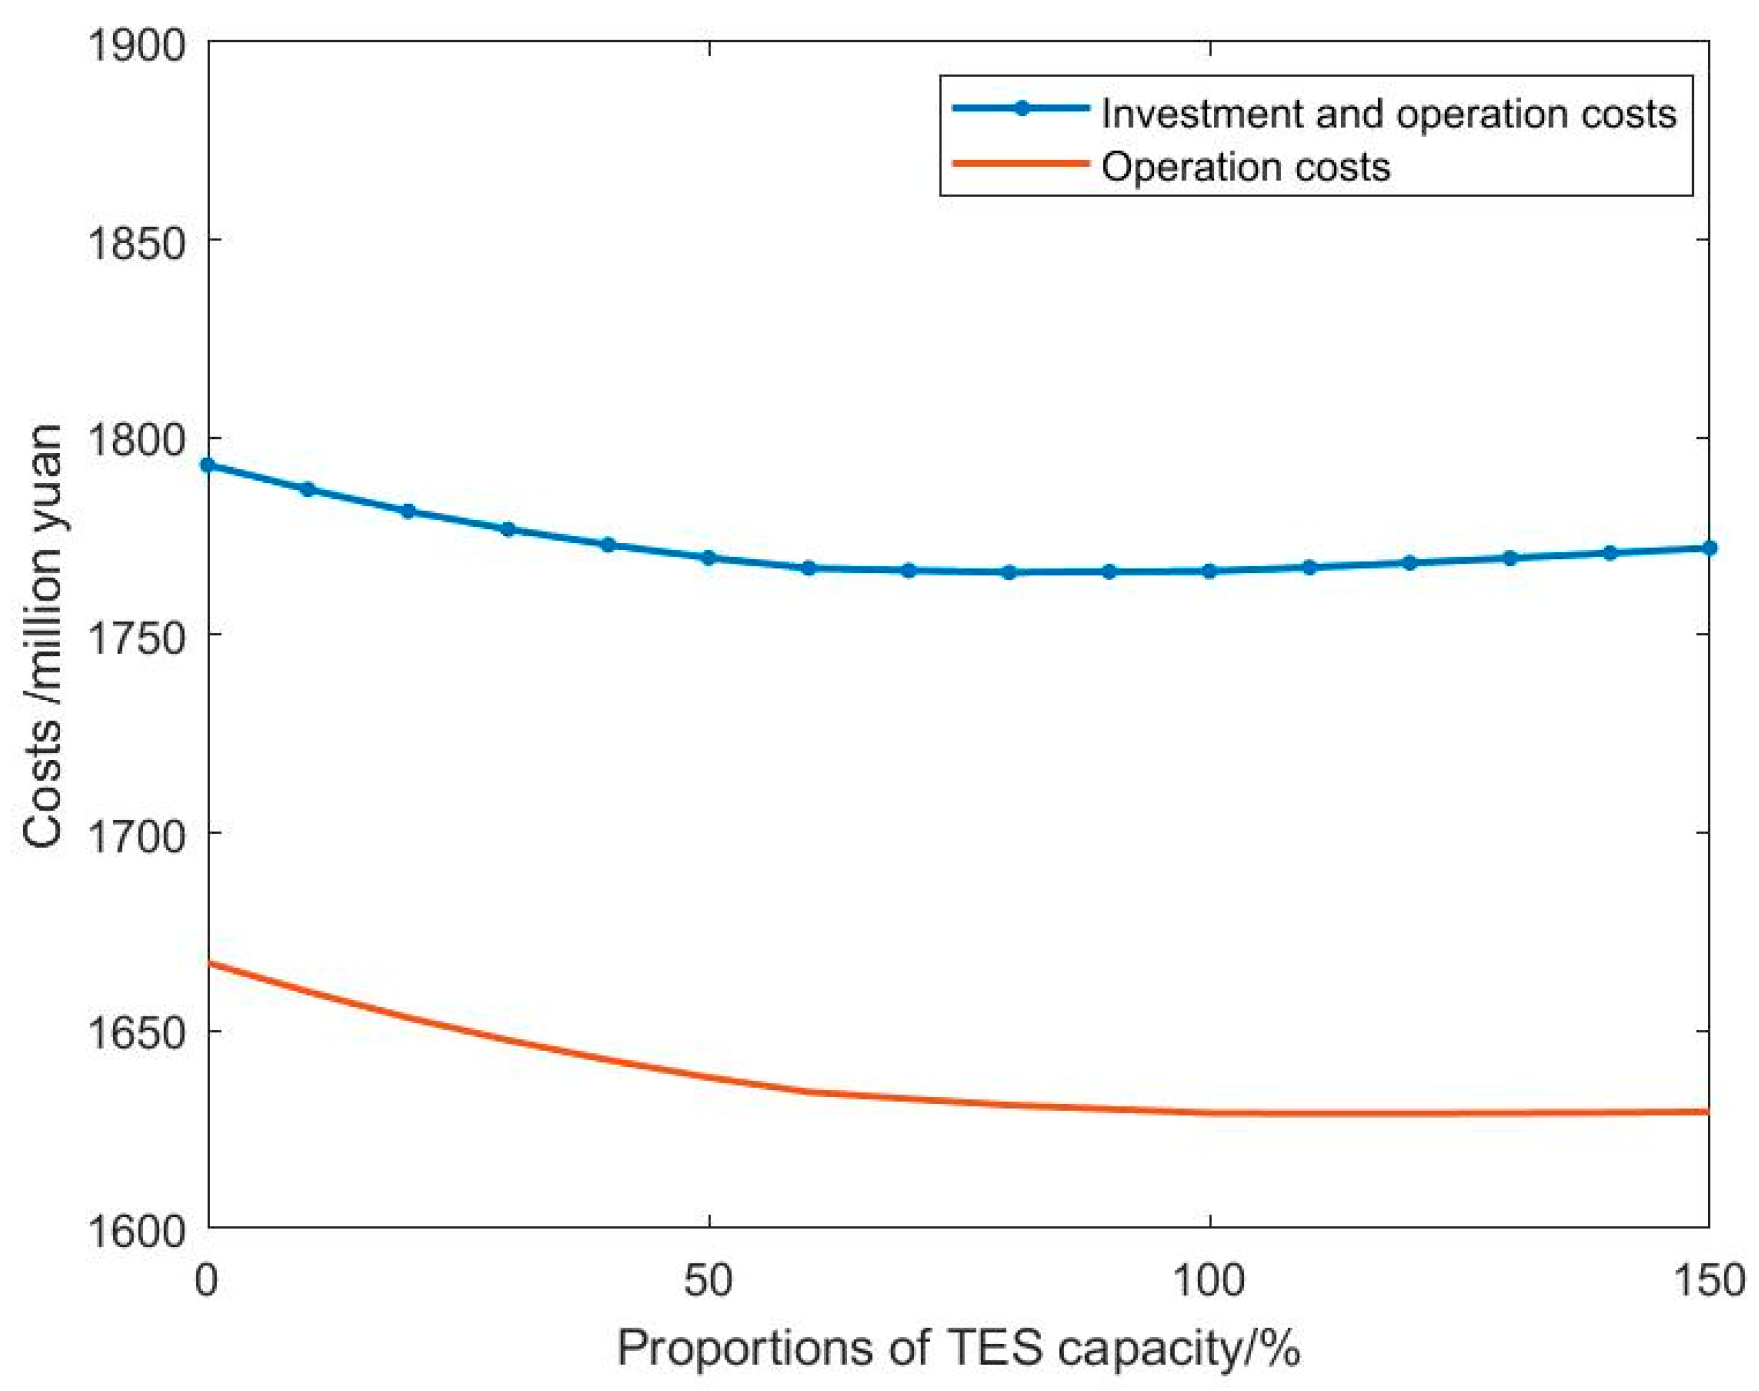
To analyze the impact of TES on the operation of the multi-energy complementary system, a comprehensive sensitivity analysis on the TES capacity is conducted with considering varied TES capacity from 0 to 150% of the CCGT unit and gas boilers capacity, shown in Figure 11. Some calculation results are listed in Table 5. It can be seen that the relationship curve between TES capacity and investment and operation costs is U-shaped, and the lowest point corresponds to the economically optimal TES capacity. In addition, the relationship curve between TES capacity and operation costs is J-shaped. After the TES capacity reaches the CCGT unit and the gas boiler capacity, the operation cost of the system remains basically unchanged. Moreover, with the increase in TES capacity, the operation costs of the MECS drop, but the investment costs grow. The sum of investment and operational costs gradually fall, which indicates that the investment costs account for a smaller proportion of the overall cost.

5.5. Carbon Emission Reduction Analysis

To analyze the carbon abatement impact of the studied system, a quantitative assessment of the carbon emissions is conducted in this paper. The carbon emissions of the studied PV+TES+CCGT system and a reference system are compared. In the proposed MECS, the carbon emission reduction mainly comes from fuel substitution and operation optimization. That is, PV power generation directly replaces the power generation of CCGT units, and TES provides more operational flexibility by storing heat waste. Based on this, the reference system is defined as a system that meets the same electrical demands solely using CCGT units and gas boilers, without the integration of PV stations or TES. The natural gas consumption and carbon emissions of the two systems are illustrated in Table 6, and the carbon emission factor of natural gas is taken as 0.202 tons/MWh. It can be seen that the reference system consumes 5,405,460.5 MWh of natural gas, leading to 1,091,903.02 tons of carbon emissions, and the natural gas consumption of the PV+TES+CCGT integration system is 4,932,549.4 MWh, leading to 996,375.0 tons of carbon emissions, which saves carbon emissions by 10%. Thus, the optimized PV+TES+CCGT integration contributes to emission savings.

6. Summary

This paper proposes a planning model to configure the capacity of PV station and TES economically in a CCGT unit-based MECS. The load demand uncertainty is modeled via probability, and uncertainty scenarios in four seasons are generated by GANs. The proposed model has been tested based on a multi-energy complementary zone. Key findings are summarized below:
  • The users’ electricity consumption characteristics are different in four seasons. The load demand in spring, autumn, and winter presents bimodal, while the load demand in summer presents unimodal. And the peak load of summer and winter is larger than the peak load of spring and autumn on the whole.
  • The larger scales of scenarios would increase the computation costs but contribute more practical optimization results. Thus, it is necessary to balance the reliability of the calculation results with computation time.
  • The TES provides more operational flexibility as well as influences the system economy. The relationship curve between TES capacity and investment and operation costs is U-shaped, and the relationship curve between TES capacity and operation costs is J-shaped. As a result, the selection of TES capacity requires a balance between flexibility and economy.
  • The introduction of PV stations and TES contributes to carbon emission reduction, and the optimized multi-energy system could save carbon emissions by 10%.
Limited by research scope and model complexity, the long-term performance degradation of PV and TES was not considered in this paper. In future research, we will study the impact of the dynamic degradation characteristics of PV stations and TES on the long-term planning and operation of the system.

Author Contributions

Conceptualization, Y.D. and Y.L.; Methodology, Y.D.; Software, Y.D.; Validation, Y.L., W.Y. and Y.H.; Formal Analysis, Y.D.; Investigation, W.Y.; Data Curation, Y.H.; Writing—Original Draft Preparation, Y.L.; Writing—Review and Editing, X.Z. All authors have read and agreed to the published version of the manuscript.

Funding

This research received no external funding.

Data Availability Statement

The raw data supporting the conclusions of this article will be made available by the authors on request.

Conflicts of Interest

Authors Yongneng Ding, Weitao Yi and Yan Huang were employed by the Hangzhou Huadian Jiangdong Cogeneration Power Co., Ltd. The remaining authors declare that the research was conducted in the absence of any commercial or financial relationships that could be construed as a potential conflict of interest.

Abbreviations

The following abbreviations are used in this manuscript:
PVPhotovoltaic power
TESThermal energy storage
GANsGenerative Adversarial Networks
CCGTCombined cycle of gas turbine
WHPPWaste heat power generation
MECSMulti-energy complementary system
Indices and Sets
tTime index
dDay index
sScenario index
SScenario set
Variables
P t P V Electrical output of PV stations at time t
P t G Electrical output of gas turbine at time t
P t S T Electrical output of the steam turbine at time t
P t W H P P Electrical output of WHPP at time t
F t G Natural gas consumption of gas turbine at time t
F t G B Natural gas consumption of gas boiler at time t
H t G The heat output of gas turbine at time t
H t S T The heat output of steam turbine at time t
H t T E S d i s The heat discharge of heat storage at time t
H t T E S c h The heat charge of heat storage at time t
H t w h b The heat output of the waste heat boiler at time t
E t T S Capacity of heat storage at time t
P t RSP The electrical output of the WHPP at the time t
H t ST , load The heat output of the steam turbine for thermal load at the time t
H t RSP The heat output of the WHPP at the time t
H t GB The heat output of the gas boilers at time t
P P V , m a x The capacity of the PV stations
E m a x T S The maximum capacity of the heat storage
Parameters
Δ t Time step duration
ρ t e Hourly electricity price
ρ t h Hourly heat price
G t T Solar radiation intensity at time t
T C The ambient temperature
R u p Ramping up of the CCGT unit
R d o w n Ramping down of the CCGT unit
P t load Electrical load at time t
H t l o a d Thermal load at time t
E m i n T S The minimum capacity of heat storage equipment
c P V , i n v Investment cost per unit capacity of PV stations
c T S , i n v Investment cost per unit capacity of heat storage
c G S , o m Operation and maintenance cost per unit power of CCGT units
c W H P P , o m Operation and maintenance cost per unit power of WHPP
c G B , o m Operation and maintenance cost per unit power of gas boiler
c P V , o m Operation and maintenance cost per unit power of PV stations
c T S , o m Operation and maintenance cost per unit power of heat storage
c g a s The price of natural gas
r T S The service life of heat storage
r P V The service life of PV stations
iDiscount rate
G S T C Solar radiation intensity under standard test condition
η P V The derating factor of PV cells
α P V The power temperature coefficient of the PV cells
T S T C The standard operating temperature of PV cells
T e n The ambient temperature of PV cells
T O C T The unit surface temperature of the PV cells under rated operating conditions
t O C T The ambient temperature of the PV cells under rated operating conditions
G O C T Solar radiation intensity of PV cells under rated operating conditions
η g e G Gas-electricity conversion efficiency of gas turbine
η g h G Gas-heat conversion efficiency of gas turbine
η h h whb Thermal energy conversion efficiency of waste heat boilers
η he ST Thermoelectric conversion of steam turbines
η hh ST Heating efficiency of steam turbines
P GS , m i n Minimum electrical output of the CCGT unit
P GS , m a x Maximum electrical output of the CCGT unit
γ s t r Dissipation coefficient of heat storage
T full T S Full load hours of heat storage
η he RSP Thermoelectric conversion efficiency of the WHPP
η hh RSP Heating efficiency of the WHPP
η gh GB Gas-heat conversion efficiency of gas boilers
H m a x GB Maximum heat ouput of gas boilers

References

  1. Mu, Y.; Chen, W.; Yu, X.; Jia, H.; Hou, K.; Wang, C.; Meng, X. A double-layer planning method for integrated community energy systems with varying energy conversion efficiencies. Appl. Energy 2020, 279, 115700. [Google Scholar] [CrossRef]
  2. Gao, J.; Wang, Y.; Huang, N.; Wei, L.; Zhang, Z. Optimal site selection study of wind-photovoltaic-shared energy storage power stations based on GIS and multi-criteria decision making: A two-stage framework. Renew. Energy 2022, 201, 1139–1162. [Google Scholar] [CrossRef]
  3. Jia, Y.; Dong, Z.Y.; Sun, C.; Chen, G. Distributed economic model predictive control for a wind-photovoltaic-battery microgrid power system. IEEE Trans. Sustain. Energy 2020, 11, 1089–1099. [Google Scholar] [CrossRef]
  4. Lazzari, F.; Mor, G.; Cipriano, J.; Solsona, F.; Chemisana, D.; Guericke, D. Optimizing planning and operation of renewable energy communities with genetic algorithms. Appl. Energy 2023, 338, 120906. [Google Scholar] [CrossRef]
  5. Xie, S.; Hu, Z.; Wang, J.; Chen, Y. The optimal planning of smart multi-energy systems incorporating transportation, natural gas and active distribution networks. Appl. Energy 2020, 269, 115006. [Google Scholar] [CrossRef]
  6. Aldarajee, A.H.M.; Hosseinian, S.H.; Vahidi, B.; Dehghan, S. Security constrained multi-objective bi-directional integrated electricity and natural gas co-expansion planning considering multiple uncertainties of wind energy and system demand. IET Renew. Power Gener. 2020, 14, 1395–1404. [Google Scholar] [CrossRef]
  7. Li, C.; Wang, N.; Wang, Z.; Dou, X.; Zhang, Y.; Yang, Z.; Maréchal, F.; Wang, L.; Yang, Y. Energy Hub-based Optimal Planning Framework for User-level Integrated Energy Systems: Considering Synergistic Effects Under Multiple Uncertainties. Appl. Energy 2022, 307, 118099. [Google Scholar] [CrossRef]
  8. Yan, R.; Wang, J.; Lu, S.; Ma, Z.; Zhou, Y.; Zhang, L.; Cheng, Y. Multi-objective Two-stage Adaptive Robust Planning Method for an Integrated Energy System Considering Load Uncertainty. Energy Build. 2021, 235, 110741. [Google Scholar] [CrossRef]
  9. Li, J.; Zhou, J.; Chen, B. Review of wind power scenario generation methods for optimal operation of renewable energy systems. Appl. Energy 2020, 280, 115992. [Google Scholar] [CrossRef]
  10. Hu, J.; Li, H. A transfer learning-based scenario generation method for stochastic optimal scheduling of microgrid with newly-built wind farm. Renew. Energy 2022, 185, 1139–1151. [Google Scholar] [CrossRef]
  11. Jani, H.K.; Kachhwaha, S.S.; Nagababu, G.; Das, A. Temporal and spatial simultaneity assessment of wind-solar energy resources in India by statistical analysis and machine learning clustering approach. Energy 2022, 248, 123586. [Google Scholar] [CrossRef]
  12. Ridha, H.M.; Gomes, C.; Hizam, H.; Mirjalili, S. Multiple scenarios multi-objective salp swarm optimization for sizing of standalone photovoltaic system. Renew. Energy 2020, 153, 1330–1345. [Google Scholar] [CrossRef]
  13. Grochowicz, A.; Benth, F.E.; Zeyringer, M. Spatio-temporal smoothing and dynamics of different electricity flexibility options for highly renewable energy systems—Case study for Norway. Appl. Energy 2024, 356, 122338. [Google Scholar] [CrossRef]
  14. Lu, L.; Yuan, W.; Su, C.; Wang, P.; Cheng, C.; Yan, D.; Wu, Z. Optimization model for the short-term joint operation of a grid-connected wind-photovoltaic-hydro hybrid energy system with cascade hydropower plants. Energy Convers. Manag. 2021, 236, 11405. [Google Scholar] [CrossRef]
  15. Mei, F.; Zhang, J.; Lu, J.; Lu, J.; Jiang, Y.; Gu, J.; Yu, K.; Gan, L. Stochastic optimal operation model for a distributed integrated energy system based on multiple-scenario simulations. Energy 2021, 219, 119629. [Google Scholar] [CrossRef]
  16. Turk, A.; Wu, Q.; Zhang, M.; Østergaard, J. Day-ahead stochastic scheduling of integrated multi-energy system for flexibility synergy and uncertainty balancing. Energy 2020, 196, 117130. [Google Scholar] [CrossRef]
  17. Borujeni, M.S.; Foroud, A.A.; Dideban, A. Wind speed scenario generation based on dependency structure analysis. J. Wind Eng. Ind. Aerodyn. 2018, 172, 453–465. [Google Scholar] [CrossRef]
  18. Tang, C.; Wang, Y.; Xu, J.; Sun, Y.; Zhang, B. Efficient scenario generation of multiple renewable power plants considering spatial and temporal correlations. Appl. Energy 2018, 221, 348–357. [Google Scholar] [CrossRef]
  19. Benalcazar, P. Sizing and optimizing the operation of thermal energy storage units in combined heat and power plants: An integrated modeling approach. Energy Convers. Manag. 2021, 242, 114255. [Google Scholar] [CrossRef]
  20. Wang, Z.; Li, S.; Cai, W.; Li, P.; Deng, J. Strategy and capacity optimization of renewable hybrid combined cooling, heating and power system with multiple energy storage. Appl. Therm. Eng. 2024, 242, 122499. [Google Scholar] [CrossRef]
  21. Wang, Z.; Cai, W.; Tao, H.; Wu, D.; Meng, J. Research on capacity and strategy optimization of combined cooling, heating and power systems with solar photovoltaic and multiple energy storage. Energy Convers. Manag. 2022, 268, 115965. [Google Scholar] [CrossRef]
  22. Zhang, R.; Li, Z.; Liu, P. Modeling and optimization of a heating and cooling combined seasonal thermal energy storage system towards a carbon-neutral community: A university campus case study. Energy 2025, 319, 135122. [Google Scholar] [CrossRef]
  23. Chen, Y.; Wang, Y.; Kirschen, D.S.; Zhang, B. Model-free renewable scenario generation using generative adversarial networks. IEEE Trans. Power Syst. 2018, 33, 3265–3275. [Google Scholar] [CrossRef]
Figure 1. MECS configuration.
Processes 13 02897 g001
Figure 2. Annual solar radiation intensity.
Processes 13 02897 g002
Figure 3. Ambient temperature.
Processes 13 02897 g003
Figure 4. Heat load demand.
Processes 13 02897 g004
Figure 5. Energy prices.
Processes 13 02897 g005
Figure 6. Training loss of GANs.
Processes 13 02897 g006
Figure 7. The generated load demand scenarios in four seasons.
Processes 13 02897 g007
Figure 8. Reduced typical scenarios in four seasons.
Processes 13 02897 g008
Figure 9. Optimal typical daily electrical output of MECS in four seasons.
Processes 13 02897 g009
Figure 10. Optimal typical daily thermal output of MECS in four seasons.
Processes 13 02897 g010aProcesses 13 02897 g010b
Figure 11. The relationship between the proportions of TES capacity and costs.
Processes 13 02897 g011
Table 1. The parameters of CCGT units, WHPP, and Gas Boiler.
EquipmentParametersValue
CCGT unitsRated capacity480 MW
η ge G / η gh G 0.35/0.45
η hh whb 0.75
η he ST / η h h ST 0.45/0.75
WHPP η he RSP / η h h RSP 0.45/0.75
Gas Boiler η gh GB 0.6
Table 2. The parameters related to investment and operation costs of equipment.
EquipmentParametersValue
PV stationInvestment costs2400 ¥/kW
Operation costs0.03 ¥/kWh
TESInvestment costs140 ¥/kWh
Operation costs0.016 ¥/kWh
CCGT unitsOperation costs0.05 ¥/kWh
Table 3. The hyperparameters of the GANs model.
HyperparametersSelected Value
Learning rate2 × 10−4
Momentum0.5
Mini-batch size64
Table 4. Optimization results for different numbers of scenarios.
Number of ScenariosInvestment and Operation Costs (¥)Error (%)Computation Time (s)
Actual load1819.1 million0.007.1
161651.7 million9.28.8
811723.6 million5.236.7
2561772.2 million2.6265.0
Table 5. Costs of MECS with different TES capacity configurations.
Proportions of TES Capacity (%)Investment and Operation Costs (¥)Operation Costs (¥)
01793.1 million1667.2 million
201781.4 million1653.3 million
401772.9 million1642.6 million
601767.0 million1634.5 million
801765.9 million1631.2 million
1001766.2 million1629.2 million
1201768.3 million1629.1 million
1401770.8 million1629.3 million
Table 6. The natural gas consumption and carbon emissions results.
CasedNatural Gas Consumption (MWh)Carbon Emissions (tons)
Reference5,405,460.51,091,903.02
PV+TES+CCGT4,932,549.4996,375.0
Disclaimer/Publisher’s Note: The statements, opinions and data contained in all publications are solely those of the individual author(s) and contributor(s) and not of MDPI and/or the editor(s). MDPI and/or the editor(s) disclaim responsibility for any injury to people or property resulting from any ideas, methods, instructions or products referred to in the content.