Abstract
The integration of renewable energy and power-to-gas (P2G) technology into park-level integrated energy systems (PIES) offers a sustainable pathway for low-carbon development. This paper presents a low-carbon economic dispatch model for PIES that incorporates uncertainties in renewable energy generation and load demand. A novel two-stage P2G, replacing traditional devices with electrolysers (EL), methane reactors (MR), and hydrogen fuel cells (HFC), enhances energy efficiency and facilitates the utilisation of captured carbon. Furthermore, adjustable thermoelectric ratios in combined heat and power (CHP) and HFC improve both economic and environmental performance. A ladder-type carbon trading and green certificate trading mechanism is introduced to effectively manage carbon emissions. To address the uncertainties in supply and demand, the study applies information gap decision theory (IGDT) and develops a robust risk-averse model. The results from various operating scenarios reveal the following key findings: (1) the integration of CCT with the two-stage P2G system increases renewable energy consumption and reduces carbon emissions by 5.8%; (2) adjustable thermoelectric ratios in CHP and HFC allow for flexible adjustment of output power in response to load requirements, thereby reducing costs while simultaneously lowering carbon emissions; (3) the incorporation of ladder-type carbon trading and green certificate trading reduces the total cost by 7.8%; (4) in the IGDT-based robust model, there is a positive correlation between total cost, uncertainty degree, and the cost deviation coefficient. The appropriate selection of the cost deviation coefficient is crucial for balancing system economics with the associated risk of uncertainty.
1. Introduction
1.1. Background
Given the increasing severity of global climate change, the reduction in carbon emissions has become a critical global priority, requiring urgent and coordinated international efforts [1]. Thus, increasing the share of renewable energy is critical to advancing the low-carbon energy transition. In this context, PIES has garnered growing attention in both academic and industrial spheres. PIES enhances the synergy between various energy subsystems through coordinated planning and optimal operation, reducing energy consumption and greenhouse gas emissions. It also optimises resource allocation, improving energy system security and stability. Therefore, advancing research and application of PIES is crucial for facilitating the transformation of the energy sector and achieving sustainable, low-carbon development.
Traditional distributed generation, heavily reliant on natural gas, presents substantial carbon emission challenges. PIES tackle these challenges by combining distributed generation, CCT, renewable energy sources, energy coupling technologies, and advanced energy storage systems, thereby enhancing energy conversion efficiency and minimising emissions. Nevertheless, the intermittent and unpredictable nature of renewable energy, particularly from wind and solar, introduces significant challenges to maintaining grid stability. Consequently, it is crucial to account for the inherent variability of renewable energy and explore its complementary characteristics to ensure the secure and cost-effective operation of power systems.
1.2. Literature Review
Concentrating solar power (CSP) provides a flexible alternative to traditional photovoltaic (PV) solar generation, enabling efficient conversion and closed-loop management of both electrical and thermal energy. Jiang et al. integrated CSP with other energy sources to form an IES-CSP system, demonstrating through simulations that it met energy demand while improving overall system efficiency [2]. Yousefzadeh et al. developed a bottom-up engineering model to simulate CSP operation under low Direct Normal Irradiance conditions [3]. Xu et al. presented a two-stage day-ahead economic dispatch model that takes into account the complementary interaction between CSP and wind turbines (WT) [4]. Li et al. investigated the integration of CSP with CHP systems to reduce the intermittency of renewable energy and increase system flexibility [5]. Yang et al. constructed an isolated energy system including CSP and other sources, quantifying the benefits of optimised operation from both supply and demand perspectives [6]. The aforementioned research on CSP primarily focused on the economic optimization and coordination with other energy systems, while largely overlooking the environmental impact of carbon emissions from PIES.
Carbon capture power plants (CCPP) have shown the potential to significantly reduce carbon emissions while maintaining high efficiency [7]. P2G represents an effective means of promoting the consumption of wind power, while simultaneously utilising carbon dioxide absorption [8]. The joint operation of CCPP and P2G can enhance carbon utilisation and diminish system operational expenses. Ju et al. introduced a model that coordinated CCPP-P2G with electric vehicles, leveraging flexible demand response to enhance carbon reuse and cut system costs [9]. Zhang et al. developed a coupling model for P2G and CCPP, extending it to a comprehensive energy system that integrates electricity, heat, and gas, improving renewable energy absorption [10]. Momeni et al. proposed an electricity-to-gas process for recovering carbon dioxide generated by gas-fired power plants and synthesising it into natural gas, which was shown to reduce carbon emissions from plants by 66% [11]. Lu et al. presented a robust two-stage scheduling model that uses excess wind and solar power in P2G systems while considering demand response [12]. While existing research has examined both economic and environmental dimensions of PIES operations, the majority predominantly concentrate on the overall power-to-gas transformation process, often overlooking its two-phase nature involving electrolytic hydrogen generation and subsequent methanation [13]. Therefore, refining this two-stage process is crucial. Additionally, most studies assume a constant thermoelectric ratio in CHP, leading to a mismatch between CHP output and actual energy demand, which reduces operational efficiency.
Carbon trading is a policy mechanism that employs market-based instruments with the objective of promoting carbon emission reductions. Liang et al. proposed an electricity-gas coupled IES dispatch optimisation model aimed at minimising power generation and carbon trading costs and analysed the impact of carbon prices on system operation [14]. He et al. integrated a price-based demand response mechanism with a traditional carbon trading framework, introducing an environmental-economic dispatch model for IES [15]. Unlike conventional carbon trading mechanisms, the ladder-type carbon trading establishes distinct trading prices for carbon emission allowances across varying intervals. A multi-objective scheduling framework with multi-temporal-scale ladder carbon trading mechanisms was established in [16], enhancing operational precision across day-ahead, intra-day, and real-time scheduling horizons. Lei et al. proposed a comprehensive optimisation framework for integrated energy systems, employing hierarchical planning strategies to coordinate energy generation, storage, and emission control via tiered carbon pricing mechanisms [17]. Zhang et al. introduced an advanced dispatch methodology for PIES, integrating demand response and two-stage P2G conversion processes within a ladder carbon trading scheme [18]. Meanwhile, the implementation and optimisation of renewable energy certificate trading mechanisms have emerged as prominent research focuses in recent studies. Gao et al. analysed its application in distributed markets [19], while Liu et al. developed a framework for integrating green certificates into IES, using a combinatorial double auction mechanism to determine green certificate prices [20]. As the carbon and green certificate markets continue to mature and improve, further research is needed to explore their synergies within IES.
In addition, renewable energy and load uncertainty pose significant challenges for the optimal dispatch of PIES. IGDT is a decision-making approach designed to handle severe uncertainties. It can assess the impact that uncertainties may have on the system by optimising the deviation of uncertain quantities, and make decisions accordingly, without relying on the specific probability distribution of these uncertain quantities [21]. An IGDT-driven framework for microgrid operation was introduced in [22], incorporating heat and electric load uncertainties through dual risk perspectives. Peng et al. established an IGDT-enabled optimisation approach for IES, focusing on renewable energy variability mitigation [23]. Boroumandfar et al. implemented IGDT methodology with conservative risk strategies for the resilient design of distributed PV-wind-storage hybrid systems [24]. Fathi et al. introduced an approach for optimising the allocation of PV and WT in distribution networks under uncertainty [25]. Wang et al. implemented IGDT-based uncertainty modelling through dual risk perspectives, demonstrating a 5.91% profit reduction under conservative strategies and a 6.12% gain under aggressive approaches in PIES operations [26].
In conclusion, there is currently a lack of literature examining the coordinated operation of CSP, CCPP and P2G to assess their potential for participation in PIES dispatching. Furthermore, there is a limited body of research investigating the coordinated operation of P2G, particularly its two-stage operation. The operational advantages of flexible thermoelectric characteristics in CHP and HFC remain underexplored. Finally, current carbon accounting methodologies frequently lack sophistication, particularly regarding the operational implications of ladder-type carbon trading and green certificate trading mechanisms.
1.3. Contributions and Organisation
This study is dedicated to an in-depth collaborative analysis of CSP, CCPP, and two-stage P2G, employing IGDT to accurately characterise the uncertainty of multiple parameters on both the supply and demand sides. Additionally, CHP and HFC units with adjustable thermoelectric ratios are employed to enable a flexible response to fluctuations in electric and heat load. Additionally, ladder-type carbon trading and green certificate trading are incorporated into the dispatch operations of PIES, aiming to achieve further reductions in carbon emissions.
The primary innovations of this research in the field of PIES include the following:
- (1)
- The implementation of CHP and HFC with adjustable thermoelectric ratios allows for dynamic adaptation of the heat-to-electricity output based on real-time demand and operational conditions, significantly enhancing energy utilisation efficiency. A PIES operating model incorporating CSP, CCPP and two-stage P2G has also been constructed.
- (2)
- In terms of the carbon trading mechanism, this study proposes ladder-type carbon trading based on the traditional model and incorporates green certificate trading, aiming to provide more comprehensive and effective incentives for carbon emission reduction and renewable energy consumption.
- (3)
- Based on the IGDT, the uncertainties faced by PIES during dispatch operations are systematically analysed, including the uncertainties of the output of WT and CSP on the supply side and the volatility of the electric load, heat load, and gas load on the demand side. A robust model for PIES dispatch operation has been developed.
2. PIES Scheduling Optimisation Model
2.1. Basic Structure of PIES
This section outlines the design of the PIES as an integrated electric-thermal-gas-hydrogen multi-energy system, with the overall structure depicted in Figure 1. Specifically, the CSP utilises a heat transfer fluid (HTF) as a medium to convert solar energy into both electrical and thermal energy. The CHP unit meets electric and heat load by combusting natural gas and has been upgraded with CCT to achieve low-carbon transformation. In the two-stage P2G process, the EL converts electricity into hydrogen, with part of the hydrogen energy directed to the MR and HFC units. The MR produces methane via the Sabatier reaction using hydrogen, which is then supplied to the gas load, CHP, and gas boiler (GB). The HFC directly converts hydrogen into electrical and thermal energy. Excess hydrogen is stored in the hydrogen storage tank (HST) for later use. The GB generates thermal output through natural gas combustion to satisfy heating demands, while gas requirements are met through dual supply sources: the upstream gas network and MR. Notably, the PIES incorporates multiple energy storage systems (electric, thermal, gas, and hydrogen) to facilitate temporal energy management and storage capabilities.
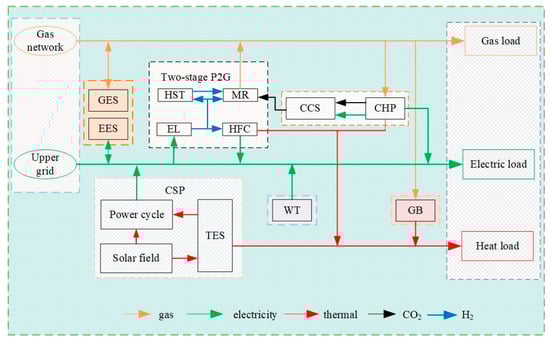
Figure 1.
Structure of PIES and energy flow diagram.
2.2. Mathematical Modelling of Basic Components
2.2.1. Concentrating Solar Power
As illustrated in Figure 2, the CSP comprises three principal components: heat collection, thermal energy storage (TES) and power cycle (PC). The effective interconnection between subsystems is achieved through the utilisation of the HTF as the medium for energy transfer and conversion. In the heat collection subsystem, the solar energy absorbed by the solar field (SF) is converted into thermal energy and transferred via the HTF. The TES serves to store the residual thermal energy of the HTF, which can be employed in a flexible manner to generate electricity and to meet the heat load demand. The PC refers to the process of utilising a turbine to transform the thermal energy transported by the HTF into electrical energy for use by the system [27].
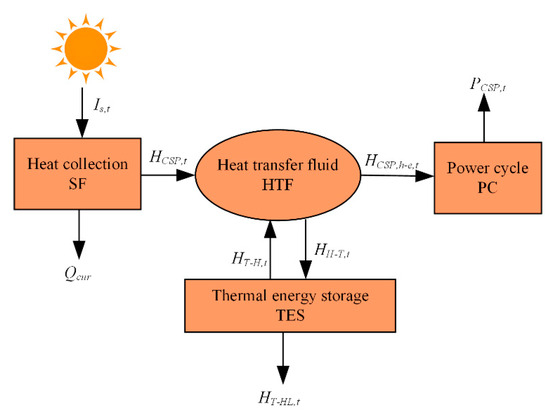
Figure 2.
Schematic diagram of the internal energy flow of the CSP.
The internal power balance constraint of the CSP is described as follows:
where is the thermal energy collected by the SF at time t; and are the thermal energy delivered by the TES to the HTF and the thermal energy delivered by the HTF to the TES, respectively, at time ; is the thermal energy utilised by the TES to meet the heat load demand at time ; represents the thermal energy transferred from the HTF to the PC at time . is the thermal energy collected by the SF can be determined by the following:
where is the photothermal conversion efficiency of the SF; is the solar mirror field area; is the amount of solar radiation per unit area at time .
The operational process of the TES can be described by the following equations:
where represents the heat storage capacity of the TES at time ; is the heat self-loss rate of the TES; and are the charging and discharging efficiencies of the TES; and are the energy charging and discharging power of the TES at time ; indicates the upper limit of and ; and indicate the upper and lower limits of , respectively; is a 0–1 variable representing the state of the TES at time , where = 1 means charging and = 0 means discharging.
The electrical energy generation of the CSP can be expressed by the following equation:
where is the power generation of the CSP at time ; is the thermoelectric conversion efficiency of the CSP; and are the upper and lower limits of ; and are the upward and downward ramping capacities of the CSP, respectively.
2.2.2. Carbon Capture Power Plant
Carbon capture technology is defined as a process whereby carbon dioxide emitted during the production process is captured and then input into a new production process for recycling and reuse. This technology has the potential to achieve significant reductions in greenhouse gas emissions and facilitate the low-carbon utilisation of fossil energy, representing a crucial technological choice for addressing global warming in the future. A carbon capture device is integrated alongside the CHP to absorb and utilise the CO2 produced by the CHP, thereby transforming the traditional CHP into a CCPP.
The CHP with adjustable thermoelectricity ratio is capable of adjusting the output ratio of electrical energy and thermal energy in accordance with the real-time electric and heat loads, thereby enhancing operational efficiency [28]. The operational process is illustrated as follows:
where and are the electrical and thermal energy outputs of the CHP at time ; is the combined efficiency of the CHP in converting natural gas into electrical and thermal energy; is the natural gas input to the CHP at time , with an upper limit of and a lower limit of ; and are the upper and lower limits of the CHP thermoelectric ratio, respectively; and are the upward and downward ramping capacities of the CHP, respectively.
The amount of electricity consumed by the CCPP to capture CO2 must satisfy the following formula:
where is the electrical power consumption of the CCPP to capture a ton of ; is the amount of captured at time ; and are the carbon capture efficiency and maximum capture capacity of the CCPP, respectively; is the maximum operating condition factor of the CCPP; is the maximum carbon emission per unit time for the CHP.
The real carbon emissions produced by the CCPP can be determined as described below:
where is the actual carbon emissions of the CCPP at time ; denotes the emissions generated by the CHP at time ; is the carbon emission intensity of the gas unit.
Since the carbon capture device also consumes electrical energy in standby mode, the electrical energy output of the CCPP can be expressed as follows:
where is the fixed energy consumption of the carbon capture device.
2.2.3. Two-Stage Power-to-Gas
As shown in Figure 3, the refined two-stage power-to-gas process comprises two distinct stages: the electrolysis of water to produce hydrogen and the subsequent methanisation of the hydrogen. The initial stage of the process entails the conversion of electricity to hydrogen energy through the utilisation of EL. A proportion of the hydrogen is then introduced into the MR, where it is combined with the captured CO2 to produce synthetic natural gas. Subsequently, the natural gas is conveyed to the gas load, GB and CHP. A proportion of the hydrogen is fed directly to the HFC for conversion to electricity and heat, while the remainder is stored in a hydrogen tank.
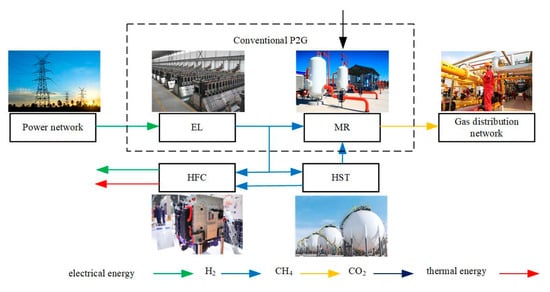
Figure 3.
Two-stage operational process of P2G.
- (1)
- Modelling of EL
The working model of EL can be expressed as follows:
where and are the hydrogen energy output and electrical power consumption of the EL at time , respectively; is the energy conversion efficiency of EL; is the upper limit of ; and are the upward and downward ramping capacities of the EL, respectively.
- (2)
- Modelling of MR
The working model of MR can be expressed as follows:
where and are the natural gas output and hydrogen energy consumption of the MR at time , respectively; is the energy conversion efficiency of the MR; is the upper limit of ; and are the upward and downward ramping capacities of the MR, respectively.
During the methanation process, according to Equation (10) and the law of conservation of mass, the amount of consumed and the amount of natural gas produced by P2G can be expressed as follows:
where is the amount of consumed by the P2G at time ; is the density of ; is the volume of natural gas generated by the MR; is the calorific value of natural gas.
- (3)
- Modelling of HFC
The working model of HFC is as follows:
where and are the electrical and thermal energy outputs of the HFC; is the combined efficiency of HFC to electrical and thermal energy; is the hydrogen energy consumption of the HFC at time , with an upper limit of ; and are the upper and lower limits of the HFC thermoelectric ratio, respectively; and are the upward and downward ramping capacities of the HFC, respectively.
2.2.4. Gas Boiler
In the PIES dispatch optimisation, GB serves as a crucial component for meeting thermal demands. Its operation is based on converting gas input into heat output, governed by efficiency and power constraints to ensure a stable and efficient thermal energy supply. Its working model can be expressed as follows:
where is the thermal energy output of the GB at time ; is the energy conversion efficiency of the GB; is the natural gas power consumption of the GB at time , with an upper limit of and a lower limit of ; and are the upward and downward ramping capacities of the GB, respectively.
2.3. Carbon Trading and Green Certificate Trading Mechanism
2.3.1. Ladder-Type Carbon Trading
Within the carbon trading framework, carbon emissions are treated as tradable commodities in the market. This study assumes that the carbon emissions of each unit are directly proportional to its power generation output. If the system’s total carbon emissions surpass the initial quota allocated by the government, the excess emissions are subject to a tiered pricing mechanism for purchase [29]. This approach ensures that the costs of carbon emissions are shared reasonably and that incentives work effectively.
The present study assumes thermal power generation as the exclusive source for grid electricity procurement, establishing three principal carbon emission contributors in the PIES: grid electricity consumption, GB, and CCPP.
where is the actual carbon emissions of the PIES; is the amount of electricity purchased by the PIES from the upper grid; and are the carbon emission intensities of coal-fired and gas-fired generating units, respectively.
The carbon emission allowances allocated by the government are proportional to the active power output of coal-fired and gas-fired generating units, the value of which can be calculated using the following equation:
where is the carbon allowance allocated to the PIES by the government; and are the carbon allowances per unit of active power output for coal-fired and gas-fired generating units, respectively.
Accordingly, the carbon allowances that the PIES is obliged to procure from the carbon trading market can be calculated as follows:
To facilitate carbon emission mitigation, this study implements a tiered carbon pricing mechanism for emission allowance acquisition within the carbon trading market. Ladder-type carbon trading works by dividing multiple carbon emission zones so that as more carbon emission allowances need to be purchased, the price of purchasing carbon emission allowances in the corresponding zone increases. Its cost model can be expressed as follows.
where is the carbon emission cost of the PIES based on a tiered pricing mechanism; represents the baseline carbon price; is the length of the carbon emission interval; is the price escalation coefficient.
2.3.2. Green Certificate Trading
The green certificate trading system incentivises power sales companies and electricity consumers to actively participate in green certificate trading activities by mandating a minimum proportion of renewable energy in the total societal electricity consumption. As illustrated in Figure 4, if the actual number of green certificates obtained by an enterprise through green power generation is lower than its green certificate quota, the enterprise is required to purchase a corresponding number of green certificates in order to meet the quota standard. Conversely, if the number of green certificates held by an enterprise exceeds its quota, the enterprise is permitted to sell the surplus in the green certificate market to obtain financial revenue.
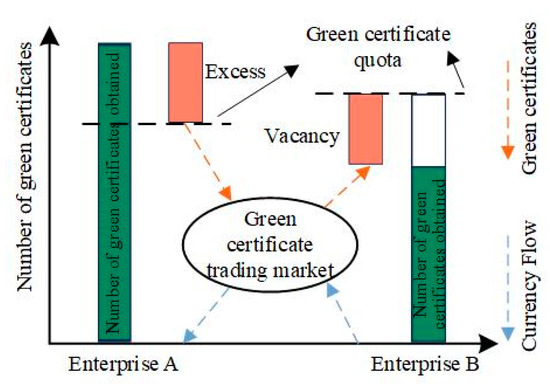
Figure 4.
Green certificate trading mechanism.
The cost of the PIES green certificate can be expressed as follows:
where is the green certificate trading cost; is the unit price of a green certificate; is the number of green certificate quota; indicates the number of green certificates obtained for the green electricity generated by the system; represents the quota coefficient of the system green certificate; is the electrical load at time ; represents the conversion factor between renewable energy and the number of green certificates.
2.4. Problem Formulation
2.4.1. Objective Function
The objective of the PIES scheduling optimisation model is to minimise the daily operating cost of the PIES, which is derived from five primary aspects: energy procurement cost (), operation and maintenance cost (), carbon trading cost (), curtailment penalty for wind and solar power (), and green certificate trading cost (). In light of the aforementioned considerations, the objective function can be expressed as follows:
The cost of purchased energy can be expressed as follows:
where and are the prices of electricity and natural gas purchased from the upper grid and gas network, respectively; and are the purchased electricity and natural gas at time , respectively.
The cost of operating and maintaining the PIES can be expressed as follows:
where , , , , , , , , and are the unit operation and maintenance costs for CSP, WT, GB, CHP, EL, MR, HFC, and CCPP, respectively; , , , and are the unit operation and maintenance costs of electric, thermal, gas, and hydrogen energy storage devices, respectively.
The curtailment penalty cost for wind and solar power can be expressed as follows:
where and are the predicted values of WT output and thermal energy collected by SF; and are the penalties for unit wind and photovoltaic curtailment, respectively.
2.4.2. Constraints
- (1)
- Constraints of energy storage devices
The electric, gas, and hydrogen energy storage devices considered in this paper are based on the same operational mechanism, which involves charging and discharging processes governed by efficiency rates, self-loss characteristics, and capacity constraints to ensure reliable and flexible energy management. Therefore, they are modelled in a uniform manner, as shown below.
where is the capacity of the energy storage device at time , with an upper limit of and a lower limit of ; is the self-loss rate of the energy storage device ; and are the charging and discharging efficiency of the energy storage device ; and are the charging and discharging powers of the energy storage device at time , with an upper limit of ; is a 0–1 variable representing the charging and discharging state of the energy storage device at time , where = 0 means discharging and = 1 means charging.
- (2)
- Electric power balance
- (3)
- Thermal power balance
- (4)
- Natural gas power balance
- (5)
- Hydrogen power balance
- (6)
- Constraints of WT and PV
The remaining constraints are presented in Equations (1)–(18) above.
3. PIES Economic Dispatch Model Based on IGDT
The deterministic PIES scheduling model is based on the predicted values of parameters and performs optimal scheduling. However, in practice, due to the inability to accurately predict the uncertain parameters, the actual results may often deviate significantly, leading to potential economic losses. IGDT is a decision-making method designed to address non-probabilistic uncertainty [30]. The IGDT method consists of two distinct models: risk aversion and opportunity seeking. However, the inherent fluctuations associated with renewable energy sources can have a detrimental impact on operational outcomes. Consequently, this paper investigates the risk aversion strategy based on the IGDT model, which considers the inherent uncertainties associated with WT, PV, and electric, heat, and natural gas loads.
3.1. Deterministic Model
In the absence of consideration of parameter uncertainty, the deterministic model constructed in Section 2 can be rewritten in vector form as follows:
where is the objective function of the deterministic model, and the optimally derived objective function value is set as the baseline value; and are the equation constraints and inequality constraints for the deterministic model, respectively; is the decision variable; is the uncertainty parameter.
3.2. Uncertainty Model
3.2.1. Calculation of Weights for Uncertain Parameters
When applying IGDT to address parameter uncertainty, the uncertain parameters need to be expressed as functions of the predicted variables. This paper employs envelope constraints to model the uncertain parameter , which are defined as follows:
where and are the magnitude of fluctuation (uncertainty degree) and the predicted values of the uncertain parameters, respectively. Where = 0 means the deterministic scheduling model.
The majority of traditional IGDT is applicable to problems involving a single uncertain parameter. In this paper, however, multiple uncertainties related to WT, PV, and electric, heat and natural gas loads are considered simultaneously, rendering it a decision problem with numerous uncertain parameters. To address this issue, this paper employs a weighted sum method to normalise multiple uncertain parameters into a single comprehensive uncertain parameter for resolution. The specific model is as follows:
where , , , , and are the uncertainty degree of the parameters WT, PV, electric load, heat load, and natural gas load, and , , , , and are the weights of the uncertain parameters, respectively.
The output of renewable energy is characterised by a high degree of uncertainty due to the inherent variability and unpredictability of these resources. Conversely, the fluctuations in load are relatively minor and remain within a defined range. This paper selects hourly data for WT, PV, electric load, heat load, and natural gas load over a period of 30 consecutive days in the region. The standard deviation of each hourly dataset over the 30 days is then calculated using the Bayesian principle. The maximum of these standard deviations () is taken as the basis for measuring the weight ratio of the uncertain parameter [31].
where is the data for each parameter at time period on day . is the average value of each parameter over the period within 30 days.
The maximum standard deviation of WT, PV, electric load, heat load, and natural gas load has been calculated to be 36.1, 28.2, 15.8, 11.9, and 9.9, respectively. In order to facilitate the calculations, the weighting ratio of each uncertain parameter is set to be 0.35:0.28:0.15:0.12:0.10.
3.2.2. IGDT Risk Aversion Model Based on Multiple Uncertain Parameters
In the IGDT risk aversion model, the generation costs of WT and PV are significantly lower than those of conventional power generation. Consequently, the total cost is inversely proportional to the output of WT and PV, meaning that the smaller the output, the greater the total cost. Conversely, when the terminal load exceeds the forecasted value, the discrepancy is absorbed by higher-level energy suppliers and energy supply units, resulting in an increase in both carbon trading costs and energy purchase costs. The IGDT risk aversion model ensures that the total cost will never exceed the expected dispatch target, while minimizing the impact of uncertainty on the optimisation results. Therefore, the IGDT risk aversion model takes the maximum uncertainty degree as the optimisation objective. A higher calculated uncertainty degree indicates a greater risk tolerance of the system, but it also corresponds to a higher total cost. The mathematical model is as follows
where is the cost deviation factor; , and are the predicted values of electric load, heat load, and natural gas load.
Based on the above, Figure 5 shows the whole process of building and solving the PIES scheduling model.
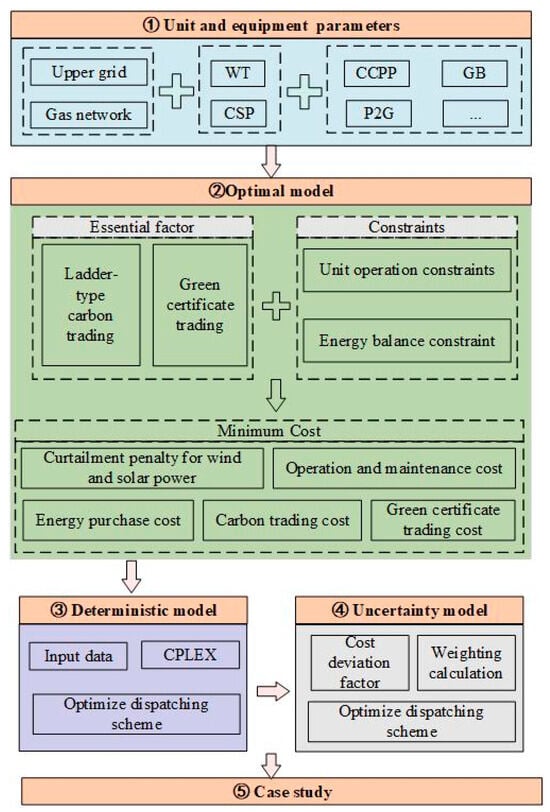
Figure 5.
Schematic overview of the solving process.
4. Case Study
4.1. Simulation Data
This study selected a representative industrial park located in North China as the research area and conducted a case simulation with a 24 h dispatch cycle and a one-hour time step. Figure 6 displays the forecasted profiles of WT, PV, electric load, heat load and natural gas load on a typical winter day in the region. Table 1 outlines the electricity procurement prices, while the natural gas price is fixed at 0.35 CNY/kWh. The upper limits for purchased electricity and natural gas are 2000 kW. Detailed parameters utilized in this study are listed in Table 2 [26,32,33,34,35].
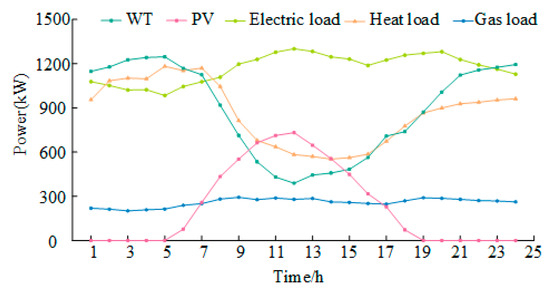
Figure 6.
Day-ahead forecast curve.

Table 1.
Time-of-use electricity price.
Table 2.
The relevant parameters of PIES.
4.2. Deterministic Scenario Setting and Analyses
4.2.1. Deterministic Scenario Setting
To evaluate the economic feasibility and environmental sustainability of the proposed framework, four comparative scenarios are established for computational analysis. Amongst these, Scenario 4 represents the model structure adopted in this paper and is therefore designated as the baseline scenario.
Scenario 1: Introducing traditional carbon trading without considering CCT and P2G equipment.
Scenario 2: Introducing traditional carbon trading while considering CCT and P2G equipment.
Scenario 3: Introducing traditional carbon trading while considering CCT and refined two-stage P2G equipment.
Scenario 4: Introducing ladder-type carbon trading and green certificate trading while considering CCT and refined two-stage P2G equipment.
The carbon emissions and cost data for each scenario are obtained by solving the four different scenarios, and the specific results are shown in Table 3. Additionally, the balance results for each type of power in Scenario 4 are presented in Figure 7.
Table 3.
Scheduling results for different scenarios.
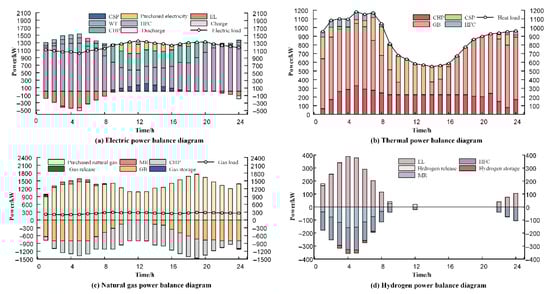
Figure 7.
Power balance diagram for scenario 4.
4.2.2. Comparative Analysis of the Results of Each Scenario
In Scenario 1, the system does not include the P2G device. During nocturnal periods of maximum wind turbine generation coinciding with minimum electricity demand, the predominant WT output directly supplies the load, while residual energy is allocated to electrical storage systems. However, this still leads to a significant wind curtailment phenomenon. In contrast, Scenario 2 incorporates the CCT-P2G device, where the P2G process produces hydrogen through water electrolysis, which then reacts with captured by the CCPP to produce natural gas for utilisation in gas-fired equipment. This integration markedly improves the utilization efficiency of clean energy while substantially mitigating WT-PV curtailment. In Scenario 2, the curtailment cost for WT-PV decreases by 594.5 CNY, equivalent to an 85.5% reduction. Furthermore, carbon emissions are reduced by 582.5 kg (a 3.4% decrease), and the energy procurement cost is lowered by 396.4 CNY, leading to a total cost reduction of 980.3 CNY. These findings highlight that the combined operation of CCT and P2G not only optimizes clean energy utilization but also effectively mitigates carbon emissions and enhances the overall system efficiency.
Scenario 3 introduces an advanced two-stage P2G system, integrating EL, MR, and HFC, as an enhancement over the traditional P2G. Compared to Scenario 2, this configuration achieves a total cost reduction of 597 CNY, corresponding to a 3.4% decrease. Additionally, carbon emissions are reduced by 436.9 kg (2.6%), while the energy procurement cost is lowered by 408.3 CNY. These improvements demonstrate the superior performance of the two-stage P2G in terms of cost efficiency and environmental impact mitigation. Notably, there is no WT-PV curtailment in this scenario. This improvement can be attributed to the enhanced energy utilization and flexibility provided by the two-stage P2G. Surplus WT and PV energy is fully converted into hydrogen via the EL equipment. A proportion of the hydrogen is stored for backup, while another portion is directed to the MR for conversion into methane through a chemical reaction with . Additionally, some hydrogen is transported to the HFC for direct conversion into electricity and heat, thereby meeting the load demands and reducing the output from the CHP and GB. The direct conversion of hydrogen via the HFC eliminates the need for intermediate energy conversion steps, reducing energy losses and improving system efficiency.
Considering the time-of-use electricity pricing and natural gas costs, the PIES prioritizes natural gas utilization to fulfill electric and heat load, as natural gas prices are consistently lower than electricity prices throughout all time intervals. However, the combustion of natural gas in CHP and GB generates carbon emissions that significantly exceed the permitted carbon quota. Scenario 4 addresses this issue by introducing a ladder-type carbon trading and green certificate mechanism, reducing emissions to 16,242 kg, the lowest among all scenarios. This phenomenon can be attributed to the incremental escalation in the unit cost of carbon emissions as emission levels increase. In terms of the overall system cost, it becomes apparent that, despite the relatively low purchase price of natural gas, once a certain amount is burned, the savings from continued use are insufficient to offset the carbon trading costs incurred through purchasing carbon allowances. Consequently, the PIES maximizes the energy conservation and emission reduction capabilities of CCT-P2G, enabling low-carbon economic dispatch. Furthermore, the integration of green certificates provides additional financial incentives for renewable energy, making Scenario 4 the most cost-effective, with a reduction of 2918.6, 1938.3 and 1341.3 CNY, respectively, compared to the preceding three scenarios. This represents a decrease of up to15.7%, 11.0% and 7.9%.
4.3. Analysis of the Benefits of Adjustable Thermoelectric Ratio
In this study, we design two comparative scenarios. In Scenario 5, thermoelectric ratio is fixed at 2.1, while in Scenario 6, an adjustable thermoelectric ratio is employed. The scheduling outcomes for both scenarios are summarized in Table 4. As shown in the table, Scenario 6 reduces carbon emissions by 294.1 kg compared to Scenario 5, reflecting a 1.8% decline. Simultaneously, the ladder-type carbon trading cost and total cost decreased by 67.9 CNY and 423 CNY, respectively, equivalent to reductions of 4.0% and 2.6%. This illustrates that the utilisation of HFC and CHP with a flexible thermoelectric ratio can not only efficaciously diminish carbon emissions, but also significantly improve economic efficiency.
Table 4.
Comparison between different thermoelectric ratio mechanisms.
Taking CHP as a case study for detailed analysis. Figure 8 presents the thermoelectric ratio of CHP across different times of the day, whereas Figure 9 demonstrates the thermal power balance under each scenario. The results indicate that the heat load reaches a peak at night. Since the higher efficiency of GB in heat generation, it primarily handles the majority of the heat load, with CHP offering additional support. In the early morning, the WT output reaches its daily peak, electric load is low, and the price of electricity is at its lowest point of the day. Given that the WT is sufficient to meet the electric load and that CHP is not required to provide additional heat load, the thermoelectric ratio of CHP is maximized during this time period. During the daytime, the heat load decreases, the output of the GB drops, but the electric load peaks. This period coincides with the highest electricity demand and peak electricity prices, while natural gas prices remain relatively low. Under these conditions, the PIES tends to rely on CHP to meet peak electricity demand, resulting in a reduction in the thermoelectric ratio to its lowest level. Furthermore, the HFC functions in a manner analogous to the CHP, yet it generates no carbon emissions during its operation. Therefore, under this mechanism, it plays a more significant role in reducing emissions.
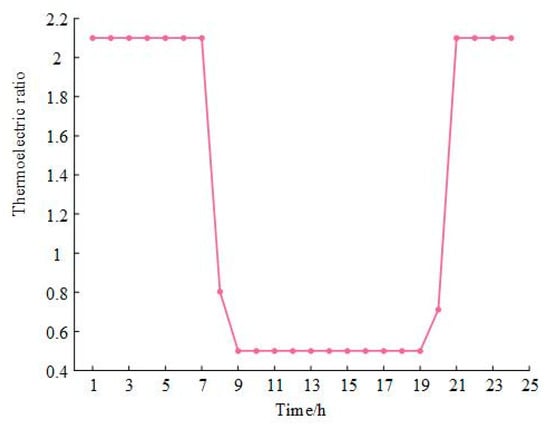
Figure 8.
Thermoelectric ratio of CHP in each period.
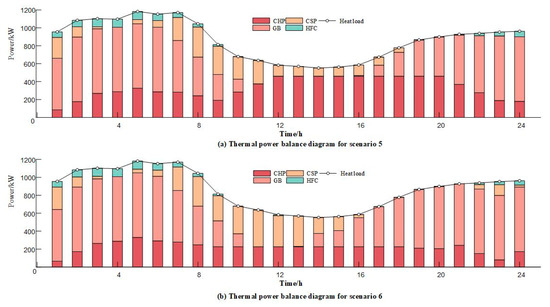
Figure 9.
Thermal power balance diagram for each scenario.
In summary, the PIES utilizes a flexible thermoelectric ratio strategy to dynamically optimize the output of CHP and HFC in response to fluctuations in WT output, time-varying electricity pricing, natural gas costs, and real-time load demand. This approach not only optimizes operational costs but also achieves a notable reduction in carbon emissions.
4.4. Analysis of the IGDT Risk Aversion Model
This section employs the IGDT method to address multiple uncertainties on both the supply and demand sides, with Scenario 4 designated as the baseline scenario, where the optimal dispatch cost is determined to be 15,719.8 CNY.
To investigate the impact of the cost deviation factor on both the uncertainty degree and total cost, this paper incrementally increases from 0 to 0.15 in steps of 0.025. Based on this, and in conjunction with Equation (33), the variation in both uncertainty degree and total cost in response to changes in is calculated and presented.
As illustrated in Figure 10, as the cost deviation factor increases from 0 to 0.15, both the uncertainty degree and the total cost exhibit an upward trend. This indicates that an increase in the cost deviation factor implies that the PIES is more tolerant of forecast errors, meaning it can withstand higher operational uncertainty or risk. Consequently, a moderate increase in the expected dispatch cost can improve the resilience and adaptability of the PIES, while reducing the reliance on highly accurate forecasts. Specifically, an increased cost deviation factor leads to a higher total cost but enhances the adaptability and stability of the PIES in the presence of prediction errors. In contrast, a reduced cost deviation factor lowers costs but necessitates enhanced prediction accuracy, thereby elevating the risk.
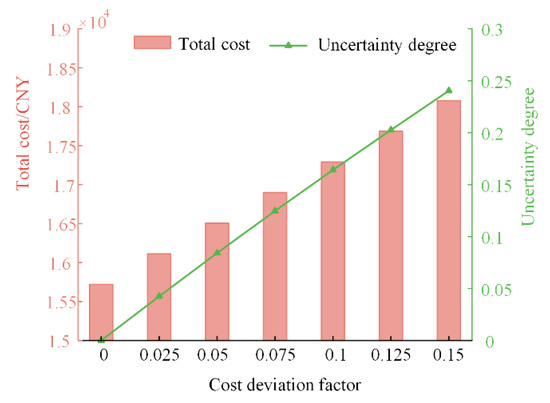
Figure 10.
Comparison of optimization results of different cost deviation factor.
To further explore the influence of source-load bilateral uncertainty on the operation of the PIES, a cost deviation factor of 0.1 has been chosen for detailed examination. Figure 11 illustrates the balance results of each type of energy based on the IGDT risk aversion model. The critical total dispatch cost of PIES is 17,291.78 CNY, with the uncertainty degrees of WT, PV, electric load, heat load, and natural gas load being 0.0575, 0.046, 0.0246, 0.0197, and 0.0164, respectively. The comprehensive uncertainty degree () of PIES is 0.1643. This indicates that the total dispatch cost will not exceed 17,291.78 CNY when these fluctuations in actual output and demand are contained within a range of 5.75%, 4.6%, 2.46%, 1.97%, and 1.64%, respectively. Given the multiplicity of uncertainties pertaining to both the source and load, the total cost of the PIES is guaranteed to remain within the predicted range through the optimal adjustment of the output of each unit.
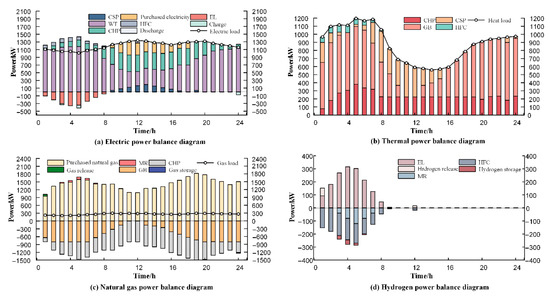
Figure 11.
Power Balance Diagram under Risk-Averse Strategy.
It is noteworthy that under the IGDT risk aversion strategy, the actual load exceeds the forecasted value, while the outputs of WT and PV are lower than expected. This discrepancy intensifies the energy supply pressure during peak load periods. To address the heightened demand, the PIES adopts measures such as boosting the output of CHP and increasing the procurement of electricity and natural gas. As a result, the total cost increases by 1571.98 CNY. Additionally, the increased unit output results in elevated carbon emissions, reaching 17,821.99 kg, marking a 9.73% increase.
5. Conclusions
This study proposes a low-carbon economic dispatch framework for PIES, integrating participation in ladder-type carbon trading and green certificate trading mechanisms. The model emphasizes the synergistic operation of CCPP and two-stage P2G to utilize renewable energy and capture . Additionally, it incorporates the adjustable thermoelectric ratio of CHP and HFC. To address uncertainties related to renewable energy generation on the supply side and fluctuations in electricity, heat, and natural gas demand on the load side, a robust optimization model based on IGDT is developed, focusing on risk-averse strategies. The effectiveness of the proposed model is validated through a comparative case study analysis, leading to the following conclusions:
- (1)
- When the combined operation of a CCPP and a two-stage P2G system is implemented, the model significantly improves the utilization of wind and solar energy while leveraging the high energy efficiency of hydrogen, thereby reducing energy cascade losses. Furthermore, the captured can be effectively utilized, leading to a 5.8% decrease in overall system carbon emissions.
- (2)
- The adjustable thermoelectric ratio of CHP and HFC enables the PIES to adapt its output levels according to the actual electric and heat loads, offering a flexible energy supply. This adaptability allows dynamic adjustment of the thermoelectric ratio in coordination with time-of-use electricity tariffs and natural gas prices, leading to a reduction in total costs while simultaneously achieving the environmental benefit of reduced carbon emissions.
- (3)
- Compared to the conventional carbon trading mechanism, the implementation of ladder-type carbon trading and green certificate trading reduces total costs by 1341.3 CNY, a decrease of 7.9%, while carbon emissions are the lowest among all scenarios, amounting to only 16,242 kg.
- (4)
- In the IGDT risk aversion model, an increase in the cost deviation factor results in higher dispatch cost, but also enhance the stability and reliability of the PIES. Conversely, a decrease in the cost deviation factor leads to lower costs but may increase the risk of the PIES operation. Therefore, decision-makers must balance economic benefits and risk management by selecting an appropriate cost deviation factor to achieve optimal system performance
Author Contributions
Conceptualization, Z.S. and X.Z.; methodology, J.W.; software, X.M. and C.H.; validation, Z.S., X.J. and M.Z.; formal analysis, Z.S.; investigation, J.W.; resources, M.Z.; data curation, C.H.; writing—original draft preparation, Z.S.; writing—review and editing, J.W. and X.Z.; visualization, M.Z.; supervision, X.J.; project administration, Z.S.; funding acquisition, X.Z. All authors have read and agreed to the published version of the manuscript.
Funding
This research was funded by Technical Service Project of State Grid Jiangsu Economic Research Institute, grant number SGJSJY00JJJS2400106.
Data Availability Statement
The data presented in this study are available in reference number [26,32,33,34,35]. [Multi-objective optimal scheduling model with IGDT method of integrated energy system considering ladder-type carbon trading mechanism] [10.1016/j.ijepes.2022.108386] [26]; [Thermoelectric optimization of integrated energy system considering wind-photovoltaic uncertainty, two-stage power-to-gas and ladder-type carbon trading] [10.1016/j.renene.2023.119806] [32]; [Low carbon optimal operation of integrated energy system based on carbon capture technology, LCA carbon emissions and ladder-type carbon trading] [10.1016/j.apenergy.2022.118664] [33]; [Risk-averse distributed optimization for integrated electricity-gas systems considering uncertainties of Wind-PV and power-to-gas] [10.1016/j.renene.2024.120358] [34]; [Research on optimal dispatch method of virtual power plant considering various energy complementary and energy low carbonization] [10.1016/j.ijepes.2021.107670] [35].
Conflicts of Interest
Zhuo Song was employed by State Grid Corporation of China. Xin Mei, Cheng Huang and Xiang Jin were employed by State Grid Jiangsu Electric Power Co., Ltd. Min Zhang was employed by State Grid Jiangsu Economic Research Institute. The remaining authors declare that the research was con-ducted in the absence of any commercial or financial relationships that could be construed as a potential conflict of interest.
References
- Jafarian, M.; Assareh, E.; Ershadi, A.; Wang, X. Optimal tariffs of resources and users scale size for a combined Cooling, Heat, power and water (CCHP-RO) system from Energy, Economic, and environmental point of view. Energy Build. 2023, 297, 113480. [Google Scholar] [CrossRef]
- Jiang, P.; Dong, J.; Huang, H. Optimal integrated demand response scheduling in regional integrated energy system with concentrating solar power. Appl. Therm. Eng. 2020, 166, 114754. [Google Scholar] [CrossRef]
- Yousefzadeh, M.; Lenzen, M. Performance of concentrating solar power plants in a whole-of-grid context. Renew. Sustain. Energy Rev. 2019, 114, 109342. [Google Scholar] [CrossRef]
- Xu, T.; Zhang, N. Coordinated Operation of Concentrated Solar Power and Wind Resources for the Provision of Energy and Reserve Services. IEEE Trans. Power Syst. 2017, 32, 1260–1271. [Google Scholar] [CrossRef]
- Li, X.; Gui, D.; Zhao, Z.; Li, X.; Wu, X.; Hua, Y.; Guo, P.; Zhong, H. Operation optimization of electrical-heating integrated energy system based on concentrating solar power plant hybridized with combined heat and power plant. J. Clean. Prod. 2021, 289, 125712. [Google Scholar] [CrossRef]
- Yang, S.; Lin, H.; Ma, J.; De, G.; Ju, L.; Tan, Z. A two-stage operation optimization model for isolated integrated energy systems with concentrating solar power plant considering multi-energy and multi-type demand response. Energy Rep. 2022, 8, 13320–13332. [Google Scholar] [CrossRef]
- Yu, G.; Zhang, Z.; Cui, G.; Dong, Q.; Wang, S.; Li, X.; Shen, L.; Yan, H. Low-carbon economic dispatching strategy based on feasible region of cooperative interaction between wind-storage system and carbon capture power plant. Renew. Energy 2024, 228, 120706. [Google Scholar] [CrossRef]
- Pignataro, V.; Liponi, A.; Bargiacchi, E.; Ferrari, L. Dynamic model of a power-to-gas system: Role of hydrogen storage and management strategies. Renew. Energy 2024, 230, 120789. [Google Scholar] [CrossRef]
- Ju, L.; Yin, Z.; Lu, X.; Yang, S.; Li, P.; Rao, R.; Tan, Z. A Tri-dimensional Equilibrium-based stochastic optimal dispatching model for a novel virtual power plant incorporating carbon Capture, Power-to-Gas and electric vehicle aggregator. Appl. Energy 2022, 324, 119776. [Google Scholar] [CrossRef]
- Zhang, X.; Zhang, Y. Environment-friendly and economical scheduling optimization for integrated energy system considering power-to-gas technology and carbon capture power plant. J. Clean. Prod. 2020, 276, 123348. [Google Scholar] [CrossRef]
- Momeni, M.; Soltani, M.; Hosseinpour, M.; Nathwani, J. A comprehensive analysis of a power-to-gas energy storage unit utilizing captured carbon dioxide as a raw material in a large-scale power plant. Energy Convers. Manag. 2021, 227, 113613. [Google Scholar] [CrossRef]
- Lu, J.; Liu, T.; He, C.; Nan, L.; Hu, X. Robust day-ahead coordinated scheduling of multi-energy systems with integrated heat-electricity demand response and high penetration of renewable energy. Renew. Energy 2021, 178, 466–482. [Google Scholar] [CrossRef]
- Gu, C.; Tang, C.; Xiang, Y.; Xie, D. Power-to-gas management using robust optimisation in integrated energy systems. Appl. Energy 2019, 236, 681–689. [Google Scholar] [CrossRef]
- Liang, Y.-L.; Zhang, H.; Yang, C.-T.; Li, K.-J. Research on optimization scheduling of integrated electricity-gas system considering carbon trading and P2G operation characteristics. Electr. Power Syst. Res. 2023, 225, 109797. [Google Scholar] [CrossRef]
- He, L.; Lu, Z.; Geng, L.; Zhang, J.; Li, X.; Guo, X. Environmental economic dispatch of integrated regional energy system considering integrated demand response. Int. J. Electr. Power Energy Syst. 2020, 116, 105525. [Google Scholar] [CrossRef]
- Zhu, G.; Gao, Y. Multi-objective optimal scheduling of an integrated energy system under the multi-time scale ladder-type carbon trading mechanism. J. Clean. Prod. 2023, 417, 137922. [Google Scholar] [CrossRef]
- Lei, D.; Zhang, Z.; Wang, Z.; Zhang, L.; Liao, W. Long-term, multi-stage low-carbon planning model of electricity-gas-heat integrated energy system considering ladder-type carbon trading mechanism and CCS. Energy 2023, 280, 128113. [Google Scholar] [CrossRef]
- Zhang, J.; Liu, Z. Low carbon economic scheduling model for a park integrated energy system considering integrated demand response, ladder-type carbon trading and fine utilization of hydrogen. Energy 2024, 290, 130311. [Google Scholar] [CrossRef]
- Gao, J.; Shao, Z.; Chen, F.; Lak, M. Multi-energy trading strategies for integrated energy systems based on low-carbon and green certificate. Electr. Power Syst. Res. 2025, 238, 111120. [Google Scholar] [CrossRef]
- Liu, D.; Luo, Z.; Qin, J.; Wang, H.; Wang, G.; Li, Z.; Zhao, W.; Shen, X. Low-carbon dispatch of multi-district integrated energy systems considering carbon emission trading and green certificate trading. Renew. Energy 2023, 218, 119312. [Google Scholar] [CrossRef]
- Mohammadi-Ivatloo, B.; Zareipour, H.; Amjady, N.; Ehsan, M. Application of information-gap decision theory to risk-constrained self-scheduling of GenCos. IEEE Trans. Power Syst. 2013, 28, 1093–1102. [Google Scholar] [CrossRef]
- Ding, X.; Yang, Z.; Zheng, X.; Zhang, H.; Sun, W. Effect of decision-making principle on P2G–CCS–CHP complementary energy system based on IGDT considering energy uncertainty. Int. J. Hydrog. Energy 2024, 81, 986–1002. [Google Scholar] [CrossRef]
- Peng, B.; Kong, X.; Tian, C.; Zhang, F.; Ma, X. An IGDT-based a low-carbon dispatch strategy of urban integrated energy system considering intermittent features of renewable energy. Energy Rep. 2023, 10, 4390–4401. [Google Scholar] [CrossRef]
- Boroumandfar, G.; Khajehzadeh, A.; Eslami, M.; Syah, R.B.Y. Information gap decision theory with risk aversion strategy for robust planning of hybrid photovoltaic/wind/battery storage system in distribution networks considering uncertainty. Energy 2023, 278, 127778. [Google Scholar] [CrossRef]
- Fathi, R.; Tousi, B.; Galvani, S. A new approach for optimal allocation of photovoltaic and wind clean energy resources in distribution networks with reconfiguration considering uncertainty based on info-gap decision theory with risk aversion strategy. J. Clean. Prod. 2021, 295, 125984. [Google Scholar] [CrossRef]
- Wang, L.; Dong, H.; Lin, J.; Zeng, M. Multi-objective optimal scheduling model with IGDT method of integrated energy system considering ladder-type carbon trading mechanism. Int. J. Electr. Power Energy Syst. 2022, 143, 108386. [Google Scholar] [CrossRef]
- Wang, R.; Yang, L.; Wang, X.; Zhou, Y. Low carbon optimal operation of integrated energy system based on concentrating solar power plant and power to hydrogen. Alex. Eng. J. 2023, 71, 39–50. [Google Scholar] [CrossRef]
- Li, F.; Wang, D.; Guo, H.; Zhang, J. Distributionally Robust Optimization for integrated energy system accounting for refinement utilization of hydrogen and ladder-type carbon trading mechanism. Appl. Energy 2024, 367, 123391. [Google Scholar] [CrossRef]
- Zhang, L.; Liu, D.; Cai, G.; Lyu, L.; Koh, L.H.; Wang, T. An optimal dispatch model for virtual power plant that incorporates carbon trading and green certificate trading. Int. J. Electr. Power Energy Syst. 2023, 144, 108558. [Google Scholar] [CrossRef]
- Sun, Q.; Fu, Y.; Lin, H.; Wennersten, R. A novel integrated stochastic programming-information gap decision theory (IGDT) approach for optimization of integrated energy systems (IESs) with multiple uncertainties. Appl. Energy 2022, 314, 119002. [Google Scholar] [CrossRef]
- Peng, X.; Bao, G.; Li, Z.; Zhu, C. Optimal scheduling of integrated energy system considering carbon capture and photothermal power station. Proc. CSU-EPSA 2024, 36, 79–91. (In Chinese) [Google Scholar] [CrossRef]
- Gao, J.; Meng, Q.; Liu, J.; Wang, Z. Thermoelectric optimization of integrated energy system considering wind-photovoltaic uncertainty, two-stage power-to-gas and ladder-type carbon trading. Renew. Energy 2024, 221, 119806. [Google Scholar] [CrossRef]
- Wang, R.; Wen, X.; Wang, X.; Fu, Y.; Zhang, Y. Low carbon optimal operation of integrated energy system based on carbon capture technology, LCA carbon emissions and ladder-type carbon trading. Appl. Energy 2022, 311, 118664. [Google Scholar] [CrossRef]
- Liu, F.; Duan, J.; Wu, C.; Tian, Q. Risk-averse distributed optimization for integrated electricity-gas systems considering uncertainties of Wind-PV and power-to-gas. Renew. Energy 2024, 227, 120358. [Google Scholar] [CrossRef]
- Liu, X. Research on optimal dispatch method of virtual power plant considering various energy complementary and energy low carbonization. Int. J. Electr. Power Energy Syst. 2022, 136, 107670. [Google Scholar] [CrossRef]
Disclaimer/Publisher’s Note: The statements, opinions and data contained in all publications are solely those of the individual author(s) and contributor(s) and not of MDPI and/or the editor(s). MDPI and/or the editor(s) disclaim responsibility for any injury to people or property resulting from any ideas, methods, instructions or products referred to in the content. |
© 2025 by the authors. Licensee MDPI, Basel, Switzerland. This article is an open access article distributed under the terms and conditions of the Creative Commons Attribution (CC BY) license (https://creativecommons.org/licenses/by/4.0/).