Abstract
Efficient development of bottom-water reservoirs is seriously affected by low recovery due to the rapid rise in water content in horizontal wells. In order to cope with this problem, a number of water control devices (including ICD and AICD) have been installed in horizontal wellbores in recent years. These are used in conjunction with packers to achieve the effect of balancing the fluid production profile and controlling water in sections. As an alternative to packers, the method of horizontal-well gravel packing has been widely used. This technique utilizes the permeability of gravel to block axial flow in the annulus of the horizontal wellbore, and uses water control devices for the purpose of sectional flow restriction. In this paper, a coupled method of numerical simulation of the production dynamics of gravel-packed water-control completions in horizontal wells in bottom-water reservoirs is proposed, which can consider multi-phase flows in porous media, in layers packed with gravel particles, and in water control devices simultaneously. In order to obtain the blocking capacity of the layer packed with gravel, we built an experimental setup of the same size as the borehole and annulus of a horizontal well, tested the permeability of the layer using Darcy’s law, and applied it to a coupled numerical simulation model. After comparison with actual well examples, it was proved that the coupled numerical simulation model has good accuracy, and can be used to carry out production predictions for gravel-packed water-control completions in horizontal wells in bottom-water reservoirs. The study also provides field engineers with a design tool for parameter optimization using a different water control method.
1. Introduction
Horizontal wells are one of the technologies currently used for efficient exploitation of oil and gas reservoirs. They have been widely used in bottom-water reservoirs, fractured reservoirs, low-permeability reservoirs, thick oil reservoirs, and other fields. In the process of developing bottom-water reservoirs, the bottom water is easy to cone in the heel of a horizontal well when the drop in flow pressure in the horizontal wellbore reaches a certain degree compared with the production differential pressure. However, due to the change in permeability along the horizontal wellbore, especially in highly non-homogeneous and highly fractured reservoirs, premature water coning is also caused [1]. There are a large number of bottom-water reservoirs in China’s offshore oilfields. The development of these reservoirs is generally characterized by a high rate of oil recovery, a rapid rise in water content, a greatly declining rate of production, a high rate of water content, and low oil production. In order to cope with problems arising from water content, a number of water control techniques have been developed; these include regulation of production differential pressure, as well as chemical or mechanical plugging. Chemical water-shutoff technologies often require multiple interventions based on the production conditions of the well. In contrast, gravel packing is a once-and-for-all solution. The returns from a single operation extend throughout the entire life cycle of the well. Among these water control techniques, the method of gravel packs combined with water control tools to jointly inhibit bottom-water coning has been applied in a large number of cases in China’s offshore oilfields, achieving outstanding results. This study will focus on a coupled method of numerical simulation of production dynamics of gravel-packed water-control completions in horizontal wells in bottom-water reservoirs.
1.1. Water Control Device
At the beginning of the 21st century, water control technology in bottom-water reservoirs mainly used methods of variable-density screen-tubing completion and center-tubing completion [2]. With further developments in technology, ICD (Inflow Control Device) water-control completion technology became widely used. Subsequently, AICD (Autonomous Inflow Control Device) water-control completion technology came into being in response to the inadequacy of ICD with respect to the late water control effect. Latterly, there emerged in China a combination of ICD and AICD water control technology, called C-AICD. These water control tools are typically used in conjunction with sand control screen tubing, where the fluid passes through the sand control screen into the annulus between the screen and the base pipe, flows axially toward the water control valve, and passes through the water control valve into the horizontal wellbore.
The concept of ICD was first introduced in the 1990s by Hydro in Norway to solve the problem of uneven fluid production from horizontal wellbores in the Troll field [3]. Field experiment results showed that the use of this flow control device could indeed have the effects of delaying bottom-water coning and regulating the production profile. Since then, ICD completion has become a research hotspot.
ICD can generate a flow-dependent pressure differential which is determined by fluid properties and ICD types, and this is utilized to optimize the distribution of influent flow along a horizontal well. As a result, ICDs have been designed in various types, such as orifice-type ICD, nozzle-type ICD, tube-type ICD, labyrinth-type ICD, combination-type ICD and so on. The nozzle-type ICD is shown in Figure 1. The nozzle-type ICD limits high fluid volume intervals by creating additional pressure drops through the throttling effect.
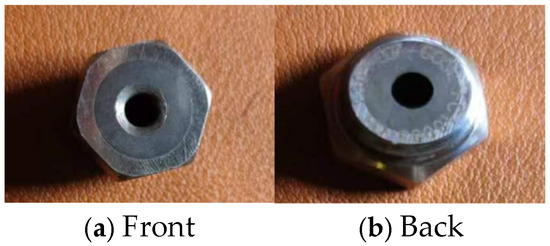
Figure 1.
Nozzle-type ICD diagram.
ICD completion is a passive inflow control technique, and its parameters cannot be changed once the device is in the well; however, the structure of an ICD is relatively simple, and any installation and maintenance difficulties are low, greatly reducing the cost of well completion.
AICD is an upgraded water-control completion technology based on ICD which solves the problem of not being able to regulate ICD after installation [4]. As is the case with the ICD, the AICD also appears in a variety of structural forms, mainly flow-channel-type AICD, expansion-type AICD, floating-disk-type AICD and pilot-control-type AICD. Flow-channel-type AICD utilizes the proportionality between fluid inertial forces and viscous forces to change the fluid flow path, introducing fluid with a higher Reynolds number into the vortex chamber, increasing the length of its flow path, and generating greater resistance. Expansion-type AICD utilizes water-expandable rubber as a throttling element which expands and reduces the flow area after water coning. Floating-disk-type AICD is a kind of AICD that automatically adjusts the flow area according to the fluid properties and flow conditions, and can effectively reduce the inflow of low viscous fluids. Pilot-control-type AICD adds a channel control to the floating-disk-type AICD [5]. The floating-disk-type AICD is shown in Figure 2.
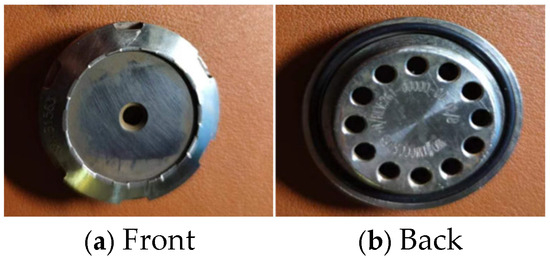
Figure 2.
Floating-disk-type AICD diagram.
1.2. Gravel-Packed Water Control Method
Gravel packing is the process of pumping a certain concentration of packed gravel particles into the wellbore with a surface pumping unit. Gravel particles pass through a conversion tool into the annulus between the sand screen tubing and the reservoir until the entire horizontal section is covered. The sand-carrying liquid returns to the surface through the annulus or enters into the formation, so that the sand of formation is covered by gravel of larger particle size which can realize the purpose of sand control [6]. Sand screen tubing mainly plays a role in blocking the formation sand, thus forming a fluid flow channel which is composed of the center of the base tube, the inner layer of the sand filter layer, and the outer stainless protection sleeve [7]. The sand screen tubing is shown in Figure 3.
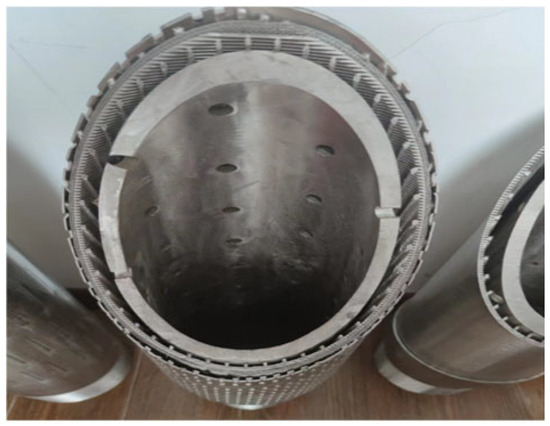
Figure 3.
Sand screen tubing diagram.
The gravel-packed water control method is based on conventional water control technology and gravel pack technology. In this new technology, the packers used to section the horizontal wells are replaced with filled lightweight gravel particles that largely block the axial flow of fluids in the annulus between the completion tubing and the reservoir. Horizontal wells are separated into units by packed gravel. In each unit, additional resistance is created by the installed water control devices (ICD, AICD, and C-AICD), and the pressure drop adjusts the production flow differential pressure in each section to equalize the radial flow [8].
Results obtained from practical application in the field show that the completion method has good effects on water control and on increasing oil production, especially in fractured reservoirs, where the packed gravel particles fill the formation fractures, resulting in increased resistance to the flow of the bottom water.
1.3. Simulation Method of Horizontal Wells Equipped with Water Control Device
With the rapid development in water-control completion technology, scholars have produced a series of mathematical models for different water-control completion devices and different methods of water-control completion.
Baker Oil Inc. proposed a finite-difference reservoir–wellbore coupling model, and used this model to study the economics of ICD completions in horizontal wells. The model includes an integrated network of reservoir, wellbore, completion hardware, and surface facilities that can analyze production history and, further, utilize economic evaluation principles for horizontal-well completion design [9].
Durlofsky proposed a method for the optimal control of fluid production from smart wells based on a conjugate gradient algorithm. The method requires the use of a conjugate gradient optimization technique, and is used in conjunction with a reservoir simulator with multi-stage well simulation capability. Results of a simulation study of multilayer reservoirs showed that the optimization method could be used for the purpose of improving oilfield recovery [10].
Preston investigated the role of inflow control devices in optimizing the production dynamics of horizontal wells. Using the local epidermal factor to represent the additional pressure drop generated by the production control device, a coupled model of horizontal wells with ICD completions was established to predict the dynamics of horizontal wells. At the same time, based on the relationship between the ICD additional pressure drop and reservoir pressure drop, a reference criterion for ICD completion was proposed [11].
Birchenko et al. developed a semi-analytical coupled model for non-homogeneous reservoirs which solves the problem of inflow equalization for ICD completions of horizontal wells in non-homogeneous reservoirs and enables suitable ICD completion parameters to be estimated [12]. However, the model fails to simulate oil well production, and the conclusions obtained cannot be verified by actual production results or experiments.
Xiong et al. established a well completion coupling model of a center tube and nozzle-type ICD by analyzing the mechanism of water coning in bottom-water reservoirs, based on the principle of superposition of potentials and mirroring reflection, and on the conservation of mass and momentum, and proposed a design process for a water control method [13].
Yang et al. established a multi-segment well model for ICD completion of horizontal wells, and studied the dynamic rules of fluid production in horizontal wells with ICD completion in bottom-water reservoirs. The effect of ICD completion is analyzed by using perforated completion as a comparison, and the effect on production capacity and recovery is analyzed [14].
Zhang et al. established a numerical simulation calculation model of production dynamics of horizontal wells with continuous-packer ICD completion on the basis of analyzing the flow law of horizontal wells with continuous-packer ICD completion in bottom-water reservoirs, and verified it with examples [15].
A number of domestic and international commercial software programs have also been implemented to simulate water-control completions. Eclipse software (version 2023.1, Schlumberger, Houston, TX, USA) realizes the coupled simulation of horizontal wellbore flow and reservoir flow based on a multi-segment well mathematical model. In recent years, in line with demand for water control, Eclipse software has increased the pressure drop model of different water-control completion tools which can be selected by the user. The keywords of labyrinth-type ICD and spiral-channel-type ICD are WSEGLABY and WSEGSICD, respectively, and the keyword of AICD is WSEGAICD. The software describes the model of characteristic curves of different water-control completion tools, and the parameters of characteristic curve experimental correction are entered into the software using keywords.
Netool software (version 10.9, Halliburton, Houston, TX, USA) determines the reservoir inflow into the horizontal wellbore based on a steady-state capacity model, and determines the variable mass flow in the horizontal wellbore based on a multiphase flow model, adopting the node network to combine the different flows together for determination purposes. Due to the node system, Netool software provides a large number of completion simulations, including bare-hole completion, perforation completion, water-control completion, and gravel-fill completion, with water-control completion covering a variety of types of water-control completion tools from Haliburton and Baker.
In short, the multi-segment well model is regarded as the most effective method for dynamic prediction of water-control completion of horizontal wells in bottom-water reservoirs. However, there is still no simulation method for gravel-packed water-control completions.
2. Permeability Testing of Gravel
The most commonly used gravel in China is composed of synthetic low-density ceramic particles, on the surfaces of which there are large numbers of active hydroxyl groups which can change the surface wettability of the particles through special surface modification technology, so that the surfaces of the particles can obtain hydrophobic and lipophilic groups. The capillary force in the pore throat of particles treated in this way can be changed from the driving force of the water-phase flow to the resistance of the water-phase flow, which can further improve the effectiveness of water control.
In this chapter, the packed gravel particles produced by CNOOC are selected to carry out the experimental study of permeability, and the packed gravel particles are shown in Figure 4.
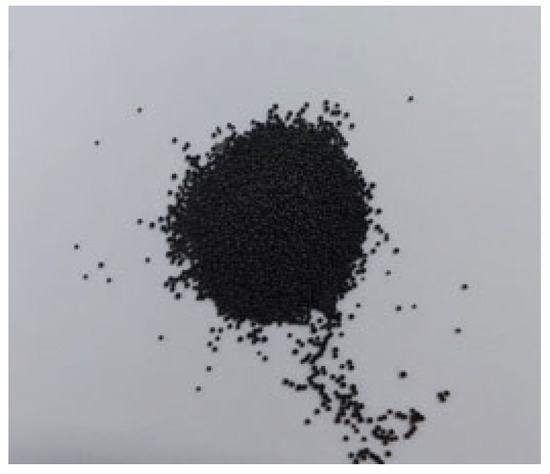
Figure 4.
Gravel particles produced by CNOOC.
2.1. Experimental Equipment
The purpose of this experiment was to test the permeability of packed gravel particles under actual borehole size and completion size conditions. The experimental setup included a water storage tank, a sand-adding device, an agitator, an injection screw pump, a pressure gauge, an electromagnetic flowmeter, a simulated tube, a blind tube, a sand sinker, and a return water pump. Among these, the simulated pipe was used to simulate the borehole, and the blind pipe was used to simulate the water control pipe, as depicted in Figure 5. The experimental device is shown in Figure 6. Relevant parameters of experimental device are shown in Table 1.
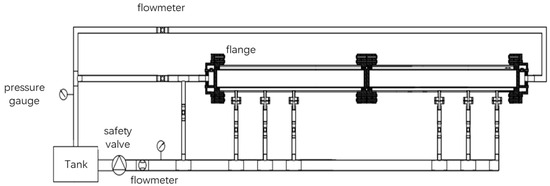
Figure 5.
Experimental equipment diagram.
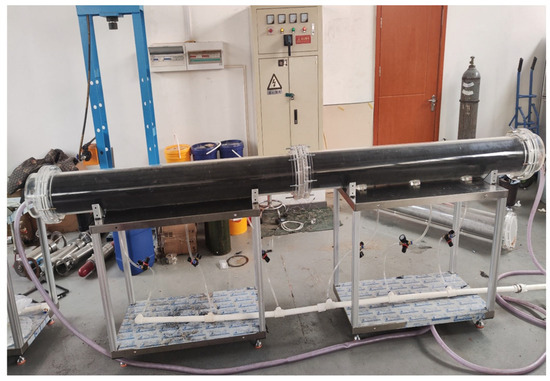
Figure 6.
Physical drawing of particle-filling device.

Table 1.
Parameters of experimental device.
The experimental procedure for permeability testing was as follows:
- (1)
- Connect the water-control completion string according to the experimental schematic diagram, and install ICD on one end of the water control screen, as depicted in Figure 7.
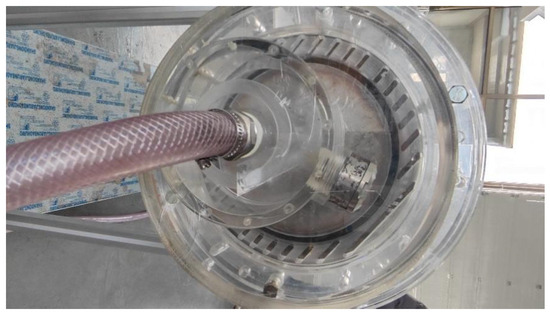 Figure 7. ICD installation side view.
- (2)
- Carry out a ventilation process for the entire experimental device to check the airtightness of the entire device to ensure that the airtightness of the experimental device meets the requirements;
- (3)
- Fill the annulus with particles and compact them with tools, as depicted in Figure 8.
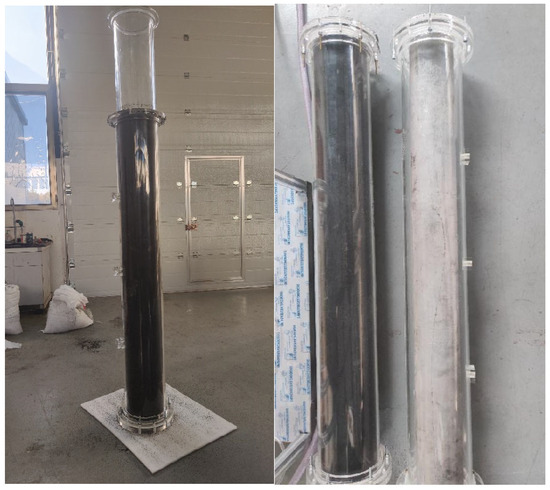 Figure 8. Stowing operation.
- (4)
- Add 50 Pa·s industrial white oil to the water tank, start the screw pump, change the frequency, and measure the pressure gauge data and flowmeter data at the inlet and outlet;
- (5)
- Replace with 100 Pa·s. industrial white oil and repeat step 4.
2.2. Experimental Results
Darcy’s Law is the relationship between pressure drop loss and fluid velocity which was first summarized in 1856 by French engineer Henry Darcy after he conducted a large number of experimental studies. In this experiment, Darcy’s law was used to test the permeability of the packed gravel, as expressed in the following Equation (1) [16]:
where Q is the flow rate; K is the permeability; μ is the viscosity; Ac is the area of the test tube; Lc is the length of the test tube; and ∆P is the pressure drop.
Table 2.
Experimental results for case 1.
Table 3.
Experimental results for case 2.
Through permeability testing experiments on two pellet samples, it was possible to determine that the permeability of the filled pellets was 40 μm2.
With regard to characteristics, therefore, it was necessary to verify the plugging effect of the no-sand control screen in the case of pure oil. It can be seen from Table 3 that in the particle-packed annulus flow at a position without a screen, the plugging permeability of the particle-packed layer to oil with a viscosity of 50 mPa·s is 39.9D, and the plugging permeability to oil with a viscosity of 100 mPa·s is 33.6D. This is almost consistent with the result of 39.54D obtained for the same particle 1 in the pure water plugging ability test in the previous subsection, thereby proving that the hydrophobic and oleophilic characteristics of the particles had little impact on the plugging ability of pure oil, and further proving that oil and water flow in the filling and flow of particles in horizontal wells with bottom-water reservoirs were consistent.
3. Numerical Simulation Model of Gravel-Packed Water Control Completion
Due to the strong aquifer support in the bottom-water reservoir, which effectively compensates for reservoir pressure depletion and maintains a nearly constant fluid temperature, this bottom-water reservoir model does not account for formation temperature variations or rock compressibility. The oil and water phases flow isothermally, and there is no free gas. The gravity factor and the effect of capillary pressure are taken into account. The compressibility of rock and fluid is weak. The annulus between the borehole and the water control pipe is blocked by filled gravel particles. The effect of flow pressure drop between sections of the horizontal wellbore is neglected. A schematic diagram of the gravel-packed water-control completion is shown in Figure 9.
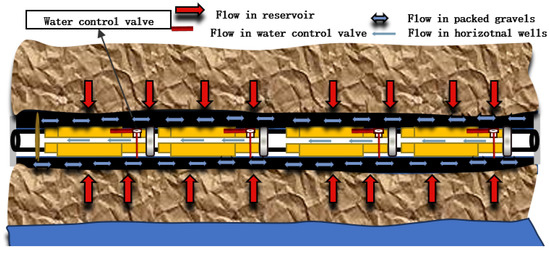
Figure 9.
Schematic diagram of the gravel-packed water-control completion.
3.1. Numerical Simulation Model of Bottom-Water Reservoir
Cartesian grids are commonly used in the numerical simulation of oil reservoirs, which is widely used for oil reservoirs with various geometries. Using the Cartesian coordinate system, a three-dimensional grid division of the reservoir simulation area is achieved, and each hexahedral grid establishes the inflow and outflow equilibrium equations, and oil and water two-phase mathematical models for numerical simulation can be expressed, respectively, as follows:
where Φ is the porosity of the reservoir; Bw and Bo are the volumetric factors of water and oil, respectively; Sw and So represent saturation of water and oil, respectively; qw and qo are the block inflows of water and oil respectively; Tw and To represent the transmissibility of water and oil, respectively; and Pw and Po represent the pressure of water and oil respectively.
where A is the area between neighboring grids; L is the length between neighboring grids; Ki and Kj represent the permeability of block i and j, respectively; krw and kro represent the relative permeability of water and oil, respectively; and μw and μo represent the viscosity of water and oil, respectively.
where WI is the well index of the well segment; and Pannulus is annulus pressure corresponding to the block of reservoir.
3.2. Flow Model of Gravel-Packed Annular Space
The flow within the packed gravel particles conforms to Darcy’s law, and the pressure drop between neighboring well sections can be described as follows:
where Pannulus, i and Pannulus, j represent the pressure of annulus of blocks i and j, respectively.
3.3. Flow Model of Different Control Device
The mathematical models currently used to describe the different types of water control tools (ICD, AICD) are mainly characteristic curves, which are flow rate versus pressure drop. In this chapter, we will summarize the characteristic curve equations of ICD and AICD on the basis of previous studies, and propose the characteristic curve equation of C-AICD.
3.3.1. ICD Performance Model
Fluid passing through an ICD creates a differential pressure associated with the flow [17], expressed as follows:
where Q is the flow rate of mixed fluids through an ICD orifice; ρ is the density of mixed fluids; d is the orifice diameter of ICD; and CD is the flow coefficient.
3.3.2. AICD Performance Model
The flow performance formula of an AICD can be determined using Equation (10) [18], as follows:
where ΔPAICD is the pressure drop across the AICD; q is the volume flow; and K is the AICD coefficient.
When the properties of the fluid or the water content change, the formula for calculating K is as follows:
where y is the viscosity index; aAICD is the AICD control constant; ρm is the mixture density of oil and water; ρcal is the calibration density; μm is the mixture viscosity of oil and water; μcal is the calibration viscosity; and fw is the water content.
3.4. Coupled Model
Because the ICD and AICD water control models are nonlinear, it is difficult to use the SEQ solution method, so the concept of “pseudo-conductivity” is introduced, which means the volume throughput through the water control valve under the standard state under unit potential difference, expressed as follows:
where the superscript u represents the number of iterations in the current time step, and ΔφICD is the potential difference between the inner and outer grid blocks of the water control valve member, Pa.
Both ΔφICD and ΔpICD reflect the potential difference between the inner and outer walls of the water control valve. ΔφICD is the value obtained by solving the pressure of the dense grid system, and ΔpICD is the value obtained by solving the screen pipe flow control model. Equation (14) reflects the repeated correction of the “pseudo-conductivity” in the grid model through the water control valve model in the current time step.
The introduction of the concept of “quasi-conductivity” allows the mass conservation equation for any grid block in the hybrid grid to be uniformly written in the linear mathematical expression of “conductivity × potential difference = cumulative term”, thus making it easy for the coupling model to list large linear equations to solve.
On the basis of the numerical simulation of multi-stage well theory, reservoir multiphase flow equations, packed-gravel seepage equations, and water control device flow equations are established. Each reservoir grid corresponds to a section of horizontal wellbore, and the solution variables are set as oil-phase pressure and water-phase saturation for each grid, annulus pressure for each section of horizontal wellbore, and bottoming flow pressure for the whole horizontal well. The coupled numerical simulation matrix for a multi-segment well is shown in Figure 10.
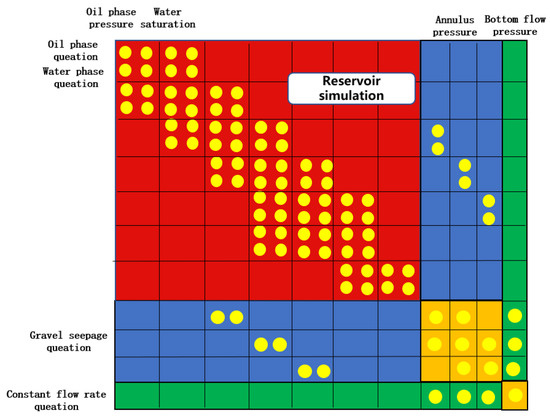
Figure 10.
Diagram of coupled method of numerical simulation.
The red area in Figure 10 represents the mathematical model of reservoir flow, the yellow area represents the mathematical model of the particle-packed layer flow, and the blue area illustrates the fluid coupling between the reservoir and the particle-packed layer. The green area in the bordered matrix indicates the fluid coupling between the particle-packed layer and the water control tool.
4. Case Study
Gravel-packed water-control completion represents a contemporary advancement in completion techniques. Diverging from conventional packer-based approaches, the gravel-packed water control method involves the injection of gravel particles into the annular between the well bore and the completion tube to establish a blocking area with a small permeability zone. This exploits percolation resistance within the annulus to mitigate the occurrence of bottom water coning. Over time, the method of gravel-packed water-control completion has attained increasing levels of sophistication, so that dynamically predicting production of gravel-packed water-control completion has become a formidable challenge. In contrast to traditional completion methodologies, existing commercial software currently lacks the capability to dynamically predict production of gravel-packed water-control completion. In this study, we create a pioneering approach, the coupled method of numerical simulation for predicting production dynamics in gravel-packed water-control completion in horizontal wells in bottom-water reservoirs. To validate the model’s accuracy, we compared its production dynamic predictions with those of horizontal wells located in the offshore oilfield of China.
In order to evaluate the accuracy of the coupled model, we carried out a dynamic prediction study for a horizontal well, A1, in a bottom-water reservoir which adopts gravel-fill + ICD water-control completion. We established a reservoir model with the following dimensions: 80 grids in the x-direction, 50 grids in the y-direction, and three grids in the z-direction. The grid spacing for the x, y, and z directions was set at 11.3 m, 50 m, and 1.5 m, respectively. The grid near the wellbore was locally refined, as shown in Figure 11. The orientation of the horizontal well aligned with the x-direction, giving a total length of 689 m. This horizontal well was discretized into 61 segments, each corresponding to a reservoir grid, and the ICD nozzle size used for each horizontal well segment was designed based on the reservoir permeability distribution to ensure a balanced distribution. Detailed reservoir parameters are tabulated in Table 4, while reservoir permeability characteristics and ICD nozzle sizes are graphically depicted in Figure 12.
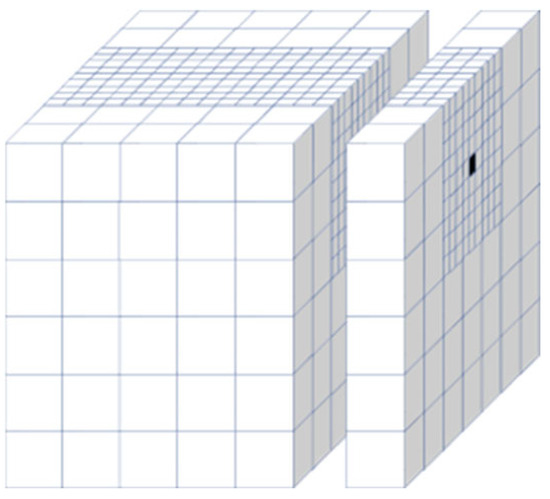
Figure 11.
Schematic diagram of the refined grid (The horizontal well resides in the black grid blocks).
Table 4.
Well A1 reservoir parameters table.
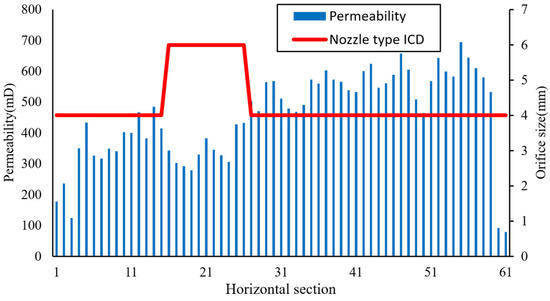
Figure 12.
Permeability distribution and ICD nozzle size distribution diagram for Well A1.
In this study, we applied the coupled production dynamic prediction model to forecast the dynamic performance of both screen completion and gravel-packed water-control completion. It is evident from Figure 13 that utilization of gravel-packed water-control completion substantially enhances oil recovery. Specifically, the gravel-packed water-control completion method exhibits a remarkable 13.5% increase in production compared to the screen completion method. Concurrently, we compared the simulation results for gravel-packed water-control completion obtained using a coupled production dynamic prediction model with actual oilfield production data. Figure 14 provides a comparative visual representation of field water cut data for the horizontal well, aligning them with the model’s predictions. Comparing the simulated water cut data and the actual production data, it can be seen that the proposed model in this paper demonstrates a commendable level of accuracy, achieving a notable 93.2% correspondence with the observed data.
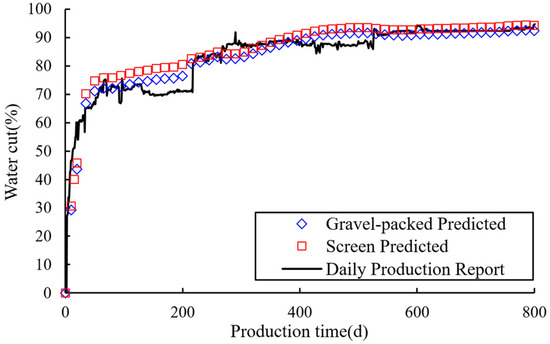
Figure 13.
Comparison of predicted results with field results for Well A1.
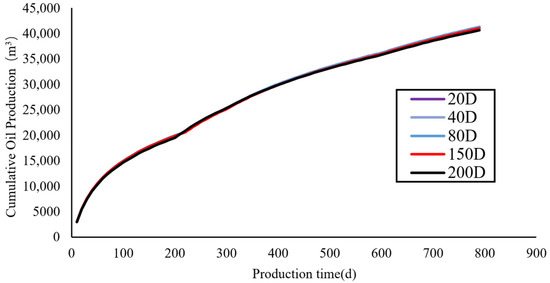
Figure 14.
Cumulative oil production at different particle permeabilities for Well A1.
To determine the influence of gravel pack particle size (measured in permeability) on water control performance in gravel-packed completion, we tested five different gravel permeabilities: 20D, 40D, 80D, 150D, and 200D. By comparing levels of cumulative oil production under varying gravel permeabilities, we aimed to identify the optimal permeability range for gravel pack particles.
It can be seen from Table 5 that when the permeability of gravel-packed particles is lower than 40D, the cumulative oil production does not change much, indicating that within this permeability range, the crossflow of fluid within the packed particles is effectively limited; when the permeability of packed particles is greater than 40D, the cumulative oil production is significantly reduced. When the permeability of filled particles is increased from 200D to 20D, the cumulative oil production is increased by 1.5%, and the production is increased by 628 m3.
Table 5.
Cumulative oil production table for Well A1.
For Well A2, with strong heterogeneity in reservoir permeability, the permeability distribution is shown in Figure 15, calculations of pack permeabilities with different particles are shown in Figure 16.
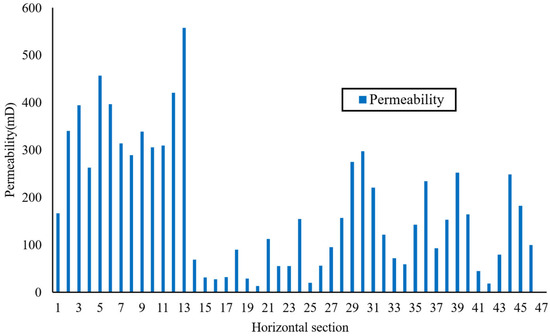
Figure 15.
Permeability Distribution for Well A2.
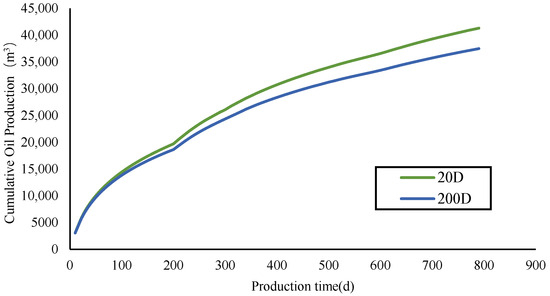
Figure 16.
Cumulative oil production at different particle permeabilities for Well A2.
It can be seen from Figure 16 that in the case of Well A2, with stronger permeability heterogeneity, the permeability of particulate packing has a more obvious impact on the cumulative oil production. The permeability of particulate packing in 20D is 9.28% higher than that of 200D, increasing oil production by 3831 m3. Comparing the changes in the cumulative oil production of the two wells under different packed particle permeabilities, it can be concluded that in the case of the A2 well, which is more heterogeneous, the particle-packed completion method has a better water control effect.
In this study, we employed the coupled model of numerical simulation to perform dynamic prognostications concerning screen completion and gravel-packed water-control completion. We calculated the flow profile of the horizontal well on the 300th day of the horizontal well with different completions, as visually presented in Figure 17. Examination of the horizontal well flow profile reveals the pronounced efficacy of the gravel-packed water-control completion in inhibiting fluid flow. Remarkably, it effectively mitigated the occurrence of bottom-water coning within the high permeability section, raising the possibility of substantial financial benefits from bottom-water reservoir production.
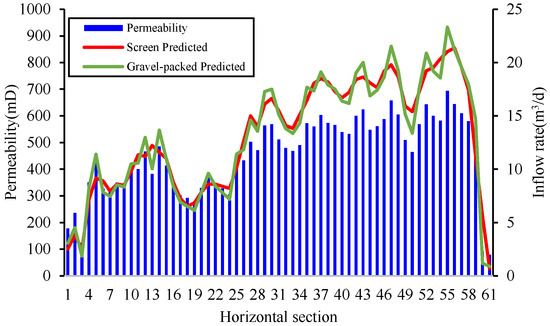
Figure 17.
Inflow profile for horizontal Well A1.
Analysis of the streamline water saturation distribution maps shown in Figure 18 reveals that in the early stage of production, due to the heterogeneity of permeability, there is lateral flow between strata in the formation. It can be concluded from the numbering that an axial flow of fluid generally exists between adjacent grids with larger permeability interpolation, and the larger the permeability interpolation, the greater the proportion of lateral flow. Moreover, as production progresses, as the water saturation of the high-permeability grid increases, the resistance of the water control valve member to the high-permeability and high-water-containing grid with high fluid flow rates increases, and the flow of grids with low permeability and low water saturation begins to increase. The water saturation interpolation between grids begins to decrease, and the lateral flow between grids begins to decrease. However, observing grid No. 60, it can be seen that due to the extremely low permeability at this grid, despite the low water saturation, the flow resistance is still much greater than that of the adjacent high-water-content grid. After 150 days of production, the crude oil at grid No. 60 is still not expelled. Therefore, it can be concluded that gravel packing can alleviate the problem of uneven liquid production caused by heterogeneity of permeability, and increase the production of the oil well, but the most important factor affecting production is the nature of the reservoir itself.
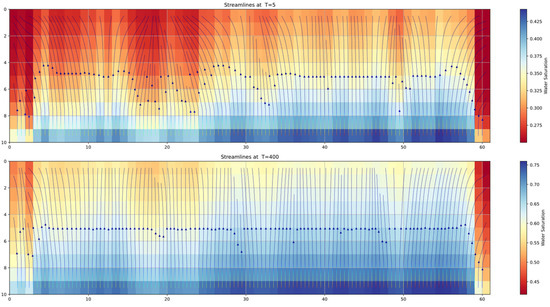
Figure 18.
Streamline plots for Well A1 at different time steps (The lines in the figure are the streamlines, the arrows are the flow direction of the streamlines).
5. Conclusions
In this paper, in view of the characteristics of gravel-packed water-control completions, we carried out permeability test experiments on packed gravel provided by CNOOC, and the results of the experiments showed that a full fill of gravel in the annulus between the well bore and the completion tube was able to produce a permeability of about 40 μm2. Based on the understanding of permeability testing experiments, we developed numerical simulation models for bottom-water reservoirs, seepage models for the annulus between the well bore and the completion tube filled with gravel, and flow models for different water-control completions (ICD and AICD). A multi-segment well numerical simulation mathematical model was used to establish a dynamic prediction mathematical model of gravel-packed water-control completion with coupling of a reservoir, an annulus packed layer and a water-control completion tool. A horizontal well in a bottom water reservoir in an offshore field was selected for a case study to compare field production data with model calculations. On the one hand, the model proposed in this study exhibited high accuracy in comparison with the field data; on the other hand, compared with conventional screen tube completion, the gravel-packed water-control completion demonstrated a better blocking ability for the high-permeability zone, and achieved a good water control effect in the bottom-water reservoir. Future research could further explore the adaptability of gravel packing in fractured reservoirs.
Author Contributions
Conceptualization, J.Z. and S.Q.; methodology, Q.Z.; software, Y.A. and C.X.; validation, J.Z., S.Q., and Q.Z.; resources, Y.A.; data curation, J.Z.; writing—original draft preparation, J.Z.; writing—review and editing, S.Q.; visualization, Q.Z.; supervision, Y.A. All authors have read and agreed to the published version of the manuscript.
Funding
This research is part of the National Major Project, “Research on Simulation Method and Evaluation System of a New Type of Water-controlled Completion with Continuous Packer” (CCL2022SZPS0285).
Data Availability Statement
The original contributions presented in this study are included in the article. Further inquiries can be directed to the corresponding author.
Conflicts of Interest
Junbin Zhang, Shili Qin and Qiang Zhang were employed by the CNOOC (China) Co., Ltd. The remaining authors declare that the research was conducted in the absence of any commercial or financial relationships that could be construed as a potential conflict of interest.
References
- Zhang, J.Q.; Lei, H.; Yu, C.H. Analysis and quantitative characterization of water-cut rising law of horizontal wells in bottom water reservoir in western South China Sea. J. Complex Hydrocarb. Reserv. 2020, 13, 51–56. [Google Scholar] [CrossRef]
- Li, W.; Chen, Y.; Zou, X.M. Optimization of completion parameters of horizontal well with variable density screen and blind pipe flow control. Pet. Geol. Eng. 2016, 30, 110–114. [Google Scholar] [CrossRef]
- Brekke, K.; Lien, S.C. New and simple completion methods for horizontal wells improve the production performance in high-permeability, thin oil zones. SPE Drill. Complet. 1994, 9, 205–209. [Google Scholar] [CrossRef]
- Wang, L.; Feng, Y.H.; Yuan, P.D.; Li, Y.N.; Bi, J.P. Intelligent completion AICD technology and domestic application status. J. Qilu Univ. Technol. 2019, 33, 34–39. [Google Scholar] [CrossRef]
- Jia, P.; Xue, S.F.; Lei, Y.J.; Zhu, X.X.; Zhou, B.; Wang, H.J.; Zhu, Y.; Pang, J. Water control performance analysis and structural parameter optimization of autonomous inflow control device with floating disc. J. China Univ. Pet. (Ed. Nat. Sci.) 2021, 45, 136–143. [Google Scholar] [CrossRef]
- Sun, L.B.; Xiao, B.; Liu, X.Y.; Deng, H.G.; Xie, M.C. C-AICD + Inhibitor Intelligent Water Control Technology Application in Offshore Oilfields. J. Petrochem. Ind. Appl. 2022, 41, 62–66. [Google Scholar] [CrossRef]
- Wu, S.W.; Wan, X.J.; Zhou, H.Y.; Yuan, H.; Li, Q.T. Application of continuous packer water control technology in offshore oilfield. J. Drill. Prod. Technol. 2021, 44, 47–51. [Google Scholar] [CrossRef]
- Li, Z.; Qiu, H.; Wen, M.; Fan, B.T.; Huang, H.; Pan, H.; Li, Z.D.; Zheng, Y. Experimental evaluation of composite water control for continuous packer in buried hill fractured gas reservoir: A case study of HZ condensate gas field. J. Fault-Block Oil Field 2022, 29, 837–841. [Google Scholar]
- Augustine, J.R. An investigation of the economic benefit of inflow control devices on horizontal well completions using a reservoir-wellbore coupled model. In Proceedings of the European Petroleum Conference, Aberdeen, UK, 29–31 October 2002. SPE 78275-MS. [Google Scholar]
- Yeten, B.; Durlofsky, L.J.; Khalid, A. Optimization of Smart Well Control. In Proceedings of the SPE International Thermal Operations and Heavy Oil Symposium and International Horizontal Well Technology Conference, Calgary, AB, Canada, 4–7 November 2002. [Google Scholar] [CrossRef]
- Preston, F.; Li, Z.Y. Understanding the Roles of Inflow-Control Devices in Optimizing Horizontal-Well Performance. In Proceedings of the SPE Annual Technical Conference and Exhibition, New Orleans, LA, USA, 4–7 October 2009. SPE124677. [Google Scholar] [CrossRef]
- Birchenko, V.M.; Bejan, A.I.; Usnich, A.V.; Davies, D. Application of inflow control devices to heterogeneous reservoirs. J. Pet. Sci. Eng. 2011, 78, 534–541. [Google Scholar] [CrossRef]
- Xiong, Y.M.; Liu, L.M.; Tang, H.X.; Chen, Y.; Zhang, L.; Wang, B. Well equalizing flowing completion technology to delay and control bottom water coning in horizontal well. J. Pet. Drill. Tech. 2011, 39, 66–71. [Google Scholar] [CrossRef]
- Yang, Q.S.; Liu, L.; Wang, Z.M. Dynamic simulation for water-controlled completion with inflow control device (ICD) in horizontal wells of bottom water reservoirs. J. Yangtze Univ. (Nat. Sci. Ed.) 2015, 32, 47–54. [Google Scholar] [CrossRef]
- Zhang, J.B.; An, Y.S.; Wang, H.L. Study on numerical simulation method for production performance of ICD completion with continuous packer in horizontal wells. J. China Offshore Oil Gas 2021, 33, 121–125. [Google Scholar]
- Yuan, B.J.; Zhang, Y.W.; Jiang, Y. Practical application edified from illustrating darcy theory on seepage flow in a project. J. Chang. Inst. Technol. 2002, 18, 6–9. [Google Scholar] [CrossRef]
- Wang, X.Q.; Wang, Z.M.; Wei, J.G. Investigation of variable mass flow in horizontal well with perforation completion coupling reservoir. J. Hydrodyn. 2005, 20, 326–331. [Google Scholar] [CrossRef]
- Mathiesen, V.; Werswick, B.; Aakre, H.; Elseth, G. The Autonomous RCP Valve—New Technology for Inflow Control In Horizontal Wells. In Proceedings of the SPE Offshore Europe Oil and Gas Conference and Exhibition, Aberdeen, UK, 6–8 September 2011. SPE-145737-MS. [Google Scholar] [CrossRef]


Disclaimer/Publisher’s Note: The statements, opinions and data contained in all publications are solely those of the individual author(s) and contributor(s) and not of MDPI and/or the editor(s). MDPI and/or the editor(s) disclaim responsibility for any injury to people or property resulting from any ideas, methods, instructions or products referred to in the content. |
© 2025 by the authors. Licensee MDPI, Basel, Switzerland. This article is an open access article distributed under the terms and conditions of the Creative Commons Attribution (CC BY) license (https://creativecommons.org/licenses/by/4.0/).