1. Introduction
The pursuit of sustainability in CO
2 refrigeration systems through the integration of renewable energy sources—namely solar, wind, and tidal energy—has gained increasing importance in the current global context, characterized by significant socio-economic and environmental challenges [
1,
2,
3]. The selection of CO
2 as the refrigerant is justified by its advantages over other fluids, including a low global warming potential (GWP), high thermodynamic efficiency, and non-toxic, non-flammable properties, making it a safer and more environmentally sustainable alternative. Recent statistics indicate post-harvest losses exceeding 30% in the coastal regions of sub-Saharan Africa, exacerbated by energy poverty and inadequate refrigeration infrastructure. This scenario, particularly relevant for Cape Verde, underscores the urgent need to develop sustainable and resilient thermal preservation solutions adapted to local conditions [
4]. The municipality of Tarrafal, Santiago, was chosen as the study location not only due to its strong reliance on artisanal fishing but also because of the advantages associated with the availability and potential of renewable energy resources in the region. Additionally, the fact that it is the hometown of one of the authors facilitates access to and understanding of the local context. International agreements, such as the Kyoto Protocol and the Paris Agreement, have reinforced the global commitment to reducing greenhouse gas emissions by promoting the adoption and implementation of low-carbon technologies across various sectors, including cold storage and food preservation. Research in refrigeration has predominantly focused on optimizing the performance of conventional systems [
5,
6], as well as on developing and evaluating alternative configurations and energy sources [
7]. In alignment with these global objectives, this study aims to assess the feasibility and benefits of integrating renewable energy technologies into refrigeration systems, seeking to reduce environmental impact and improve energy efficiency in isolated or resource-constrained regions. Notably, from the outset, the integration of tidal energy—a novel and distinctive feature of this work—explores the unique energy potential characteristic of coastal areas. This study presents a comparative analysis of four integrated system configurations for a refrigerated storage facility located in Tarrafal, Santiago, Cape Verde. The implementation of sustainable and energy-efficient refrigeration infrastructure aims not only to achieve environmental objectives—such as emission reduction—but also to foster local economic development. By ensuring the improved preservation of fish products and reducing post-harvest losses, the system enhances the commercial value of the catch, strengthens the bargaining power of local fishermen, and creates opportunities for distribution and export to other cities within the country. These developments align with broader national strategies aimed at strengthening food security, economic resilience, and sustainability in coastal zones [
8]. To provide a clear and structured understanding of the applied methodology,
Figure 1 illustrates the sequential process developed in this study. This flowchart serves as a concise visual representation of the main stages of the investigation, guiding the reader throughout the progression of the work.
2. Principles of Vapor Compression Refrigeration
Before proceeding with the system sizing and performance analysis, it is essential to present the operating principles of vapor compression refrigeration systems, which form the technological foundation of the solution considered in this study.
Vapor compression refrigeration systems are widely used in cooling applications and operate according to the inverted Rankine cycle, which involves four primary components: compressor, condenser, expansion valve, and evaporator. These elements are interconnected in a closed-loop configuration, where the refrigerant undergoes successive thermodynamic transformations, namely compression, condensation, expansion, and evaporation—to produce the cooling effect [
9]. This process is made possible by establishing two distinct pressure zones within the system: a high-pressure side, where heat is rejected to the surroundings, and a low-pressure side, where heat is absorbed from the environment. The temperature difference between the refrigerant’s phases facilitates efficient thermal exchange, enabling effective refrigeration [
10].
In the framework of this study, all the refrigeration configurations analyzed are based on the vapor compression cycle and follow the operating logic of the inverted Rankine cycle. In recent years, heightened environmental awareness and the enforcement of international climate agreements have prompted a transition towards the use of more sustainable refrigerants. In this regard, carbon dioxide (CO
2) has been identified as a promising alternative to synthetic refrigerants such as R134a, particularly considering its use in the case study system [
11].
CO
2, as a natural refrigerant, offers several advantages that make it particularly suitable for vapor compression applications. These include its non-flammable and non-toxic nature, low environmental impact, and natural abundance. Unlike many hydrofluorocarbons (HFCs), CO
2 does not significantly contribute to global warming, as its Global Warming Potential (GWP) is negligible [
12]. As such, the adoption of CO
2-based refrigeration systems reflects a broader shift within the industry towards technologies that are both technically robust and environmentally responsible, aligning with the goals of reducing emissions and promoting sustainable development.
3. Thermal Loads for Refrigerated Spaces
Based on the previously described system characterization and associated energy considerations, this section focuses on the estimation of thermal loads related to the refrigerated compartments. Accurate quantification of these loads is essential for the proper sizing of the refrigeration system and for assessing its performance across the various configurations analyzed in this study. Precise determination of the thermal loads in each compartment is crucial to maintain appropriate temperature levels and storage conditions, which are fundamental for ensuring efficient operation and energy optimization of the system. To this end, Equations (1) through (4) provide the analytical framework for estimating the total cooling demand, guiding the selection of refrigeration equipment best suited to the specific requirements of each space. These equations allow for a systematic evaluation of the various sources of heat gain, considering material properties, heat transfer mechanisms, and temperature differentials. A major component of the total thermal load is heat transfer by conduction through the structural elements enclosing the refrigerated volumes, such as walls, ceilings, and floors. The magnitude of this conductive heat transfer depends on the thermal conductivity of the insulation material, insulation thickness, and the temperature difference (ΔT) between the interior and exterior environments—factors that directly influence the rate of heat flow into the compartment. Equation (1) is employed to calculate the conductive thermal load, providing a foundational estimate for refrigeration system sizing [
13]. Regarding thermal insulation, standardized 100 mm thick polyurethane panels were adopted, ensuring effective insulation and maintenance of internal conditions. The internal corridor of the cold storage facility is maintained at a constant temperature of 15 °C, providing a stable climatized environment. Furthermore, occupancy within the refrigerated and frozen chambers was limited to a maximum of two persons to minimize heat gains from human presence. Lighting within the refrigerated spaces, excluding the buffer zone, is provided by two fixtures per compartment, while the buffer zone is equipped with four fixtures, all utilizing 64 W LED lamps. For internal product handling, the use of a pallet truck equipped with a 0.75 kW starter motor and a 0.7 kW lifting motor was considered. Concerning the thermal load from stored products, densities were defined as 600 kg/m
3 for the frozen chamber, 350 kg/m
3 for the refrigerated chamber, and 450 kg/m
3 for the buffer. Product inlet temperatures were set at 8 °C for the buffer, 5 °C for the refrigerated chamber, and −5 °C for the frozen chamber. Heat dissipation per occupant was assumed as 270 W for the refrigerated chamber and 420 W for the frozen chamber. Additionally, a safety factor of 1.1 was applied to account for extra thermal loads arising from the dissipation of evaporator fan motors and other unaccounted sources, ensuring an adequate margin in the system design. Finally, an operational period of 16 h per day for the evaporators was assumed, reflecting realistic usage conditions. These specifications and methodologies enabled a rigorous calculation of the thermal loads for each refrigerated compartment, providing essential data for the appropriate sizing of the refrigeration system and ensuring optimal conservation conditions and energy efficiency.
—Thermal load from conduction (W)
—Internal temperature (°C)
—External temperature (°C)
—Thermal resistance of the wall (°C/W)
The temperature gradient between the product being introduced into the refrigerated chamber and the ambient air temperature inside the chamber is a critical factor in determining the heat load associated with product insertion. This thermal differential, quantified by Equation (2), represents the amount of heat transferred into the refrigerated space because of the product’s initial temperature upon entry. Accurately accounting for this heat gain is essential for assessing the refrigeration demand, as it directly impacts the cooling capacity required to bring the product to the desired storage temperature [
14].
—Thermal load from product (W)
—Specific heat of the product before freezing (J/ (kg ·K))
—Product inlet temperature (°C)
—Product flow into the cold chamber (kg/s)
Within the refrigerated environment, the presence of occupants, operational equipment, and lighting constitutes three distinct sources of heat gain, as represented by Equation (3) [
15]. The heat generated by human occupants arises from metabolic processes and contributes to both sensible and latent heat loads, due to differences in temperature and humidity between the human body and the ambient air within the refrigerated space. Conversely, heat emitted by lighting fixtures and electrical equipment contributes exclusively to the sensible heat load. Accurate quantification of these internal heat sources is essential for a comprehensive assessment of the overall thermal load and for the proper sizing of the refrigeration system.
—Internal thermal load (W)
—Thermal loads from occupants (W)
—Thermal loads from lighting (W)
—Thermal loads from equipment (W)
Air infiltration from the external environment into the interior of the refrigeration chamber—primarily occurring through door openings—constitutes a significant source of thermal load. This infiltration introduces unwanted heat and moisture into the refrigerated space, thereby increasing the cooling demand. The thermal load attributed to such air ingress is quantified by Equation (4), which accounts for the volumetric flow of infiltrating air and the corresponding temperature and humidity differentials between the interior and exterior environments [
16]. Precise estimation of infiltration loads is critical for ensuring accurate refrigeration system design and maintaining optimal storage conditions.
—Thermal load from infiltrations (W)
—Infiltration air flow (kg/s)
—Specific energy of air (J/kg)
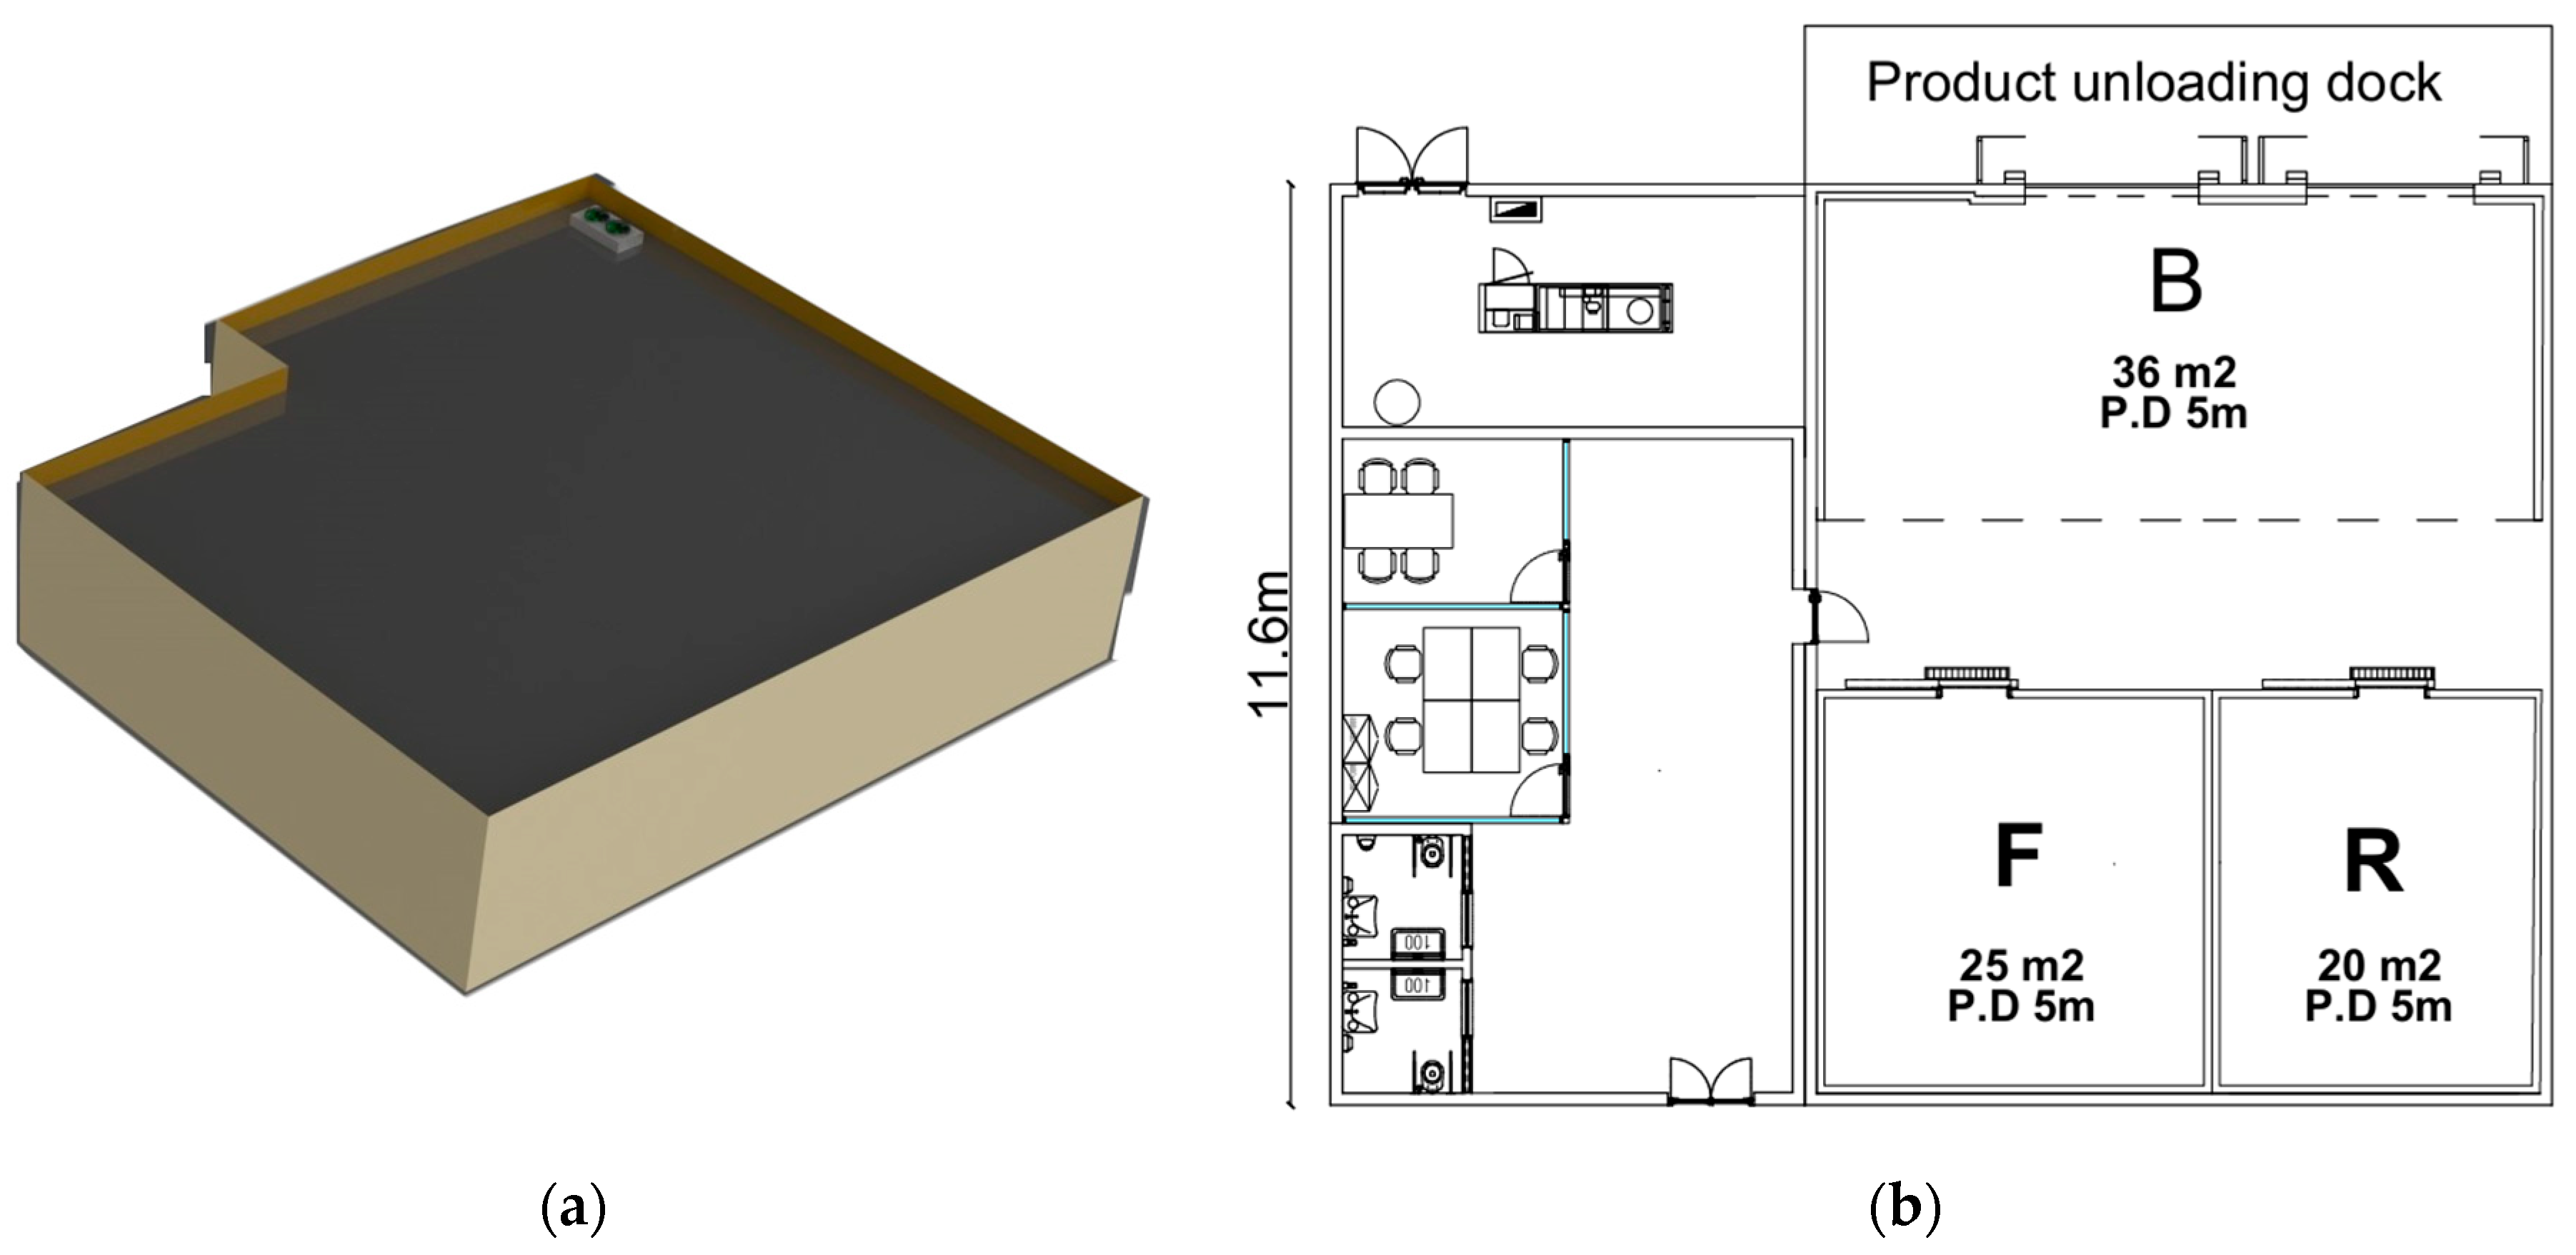
The configuration of the refrigeration warehouse is illustrated in
Figure 2. The facility comprises three primary zones: a frozen product chamber (F), a refrigerated product chamber (R), and a buffer zone (B) designated for the reception and dispatch of goods.
Table 1 presents the calculated values of the four distinct types of thermal loads for each refrigerated compartment. These values were derived from detailed calculations based on established thermodynamic principles and validated input data. An uncertainty margin of approximately 10% has been included to account for potential variations and measurement inaccuracies in the thermal load estimations.
An analysis of the data presented in
Table 1 indicates that the thermal loads fall within ranges commonly reported for refrigerated environments [
4,
17]. This alignment confirms that the calculated loads are consistent with standard values, thereby supporting the accurate dimensioning of the refrigeration system tailored to the requirements of each individual space.
4. Renewable Source
Following the assessment of the refrigeration system requirements, this section addresses the renewable energy sources considered to power the proposed solution. The integration of renewable resources is essential to ensure energy autonomy, environmental sustainability, and long-term operational viability, considering the specific conditions of the case study.
Tables S6 and S7 present the electrical energy requirements of the installation, while Figure 8 illustrates the operational conditions of the tidal turbine. The
Supplementary Materials provide additional evidence and detailed data supporting these topics.
4.1. Wind Energy
Wind energy is a renewable and environmentally sustainable resource, widely accessible and harnessed from the kinetic energy of the wind. The successful deployment of wind turbines requires a thorough site assessment, considering factors such as surface roughness, topography, and the presence of physical obstacles that may influence wind flow characteristics [
18]. In coastal areas like Tarrafal of Santiago Island, particular attention must be given to salt-induced corrosion, which can significantly affect turbine components and reduce their operational lifespan. To mitigate these effects, strategies such as the application of protective coatings, use of corrosion-resistant materials, and regular maintenance are implemented, thereby ensuring system durability and reliability.
Wind turbines operate by capturing the kinetic energy of the wind through rotor blades, which are driven by aerodynamic forces, specifically drag and lift. This mechanical motion is transmitted to a rotor connected to a generator via a gearbox, converting mechanical energy into electrical energy [
19]. The generated electrical power can be fed directly into the electrical grid or stored in energy storage systems, such as batteries, for later use. Wind energy systems have been extensively applied in refrigeration facilities, contributing to the provision of reliable and continuous energy supply. Vaughan et al. [
20] investigated the integration of wind energy into refrigeration systems by powering an apple storage unit with a wind turbine, reporting favorable outcomes regarding system reliability and environmental impact reduction. Similarly, Roselli et al. [
21] analyzed a wind-powered system providing heating, cooling, and electricity for office buildings in two Italian cities, demonstrating the effective incorporation of wind energy into thermal management systems. This integration represents a viable strategy to advance global environmental objectives and regulatory frameworks.
The theoretical power available in a wind stream can be expressed by Equation (5), which quantifies the maximum extractable energy from the airflow [
22]:
P—Generated power (W)
V—Wind velocity (m/s)
A—Area of rotor (m2)
ρ—Air density (kg/m3)
The actual power output of a wind turbine rotor is determined by the efficiency with which kinetic energy from the wind is converted into mechanical energy by the rotor. This efficiency is commonly expressed as the power coefficient, denoted as Cp which quantifies the fraction of available wind power that can be harnessed by the rotor. The relationship is defined by Equation (6) [
23].
It is important to note that, although the mechanical energy of the wind turbines can be estimated using classical aerodynamic equations, the electrical power delivered to the grid was determined based on the power curve of the selected turbine model as a function of wind speed, as documented in the
Supplementary Material. This approach allows for a realistic representation of turbine performance under varying operational conditions.
4.2. Photovoltaic Energy
The integration of photovoltaic (PV) solar energy into refrigeration systems constitutes a notable advancement within the sector. Hameed et al. [
24] demonstrated the practical feasibility of employing PV energy for refrigeration applications in Baghdad, underscoring its potential to reduce reliance on conventional electricity grids. Similarly, Yvon et al. [
25] emphasized the beneficial effects of integrating solar energy with vapor compression refrigeration cycles.
The PV system under consideration is a conventional arrangement comprising solar panels for electricity generation, solar inverters to convert direct current (DC) into alternating current (AC), and energy storage devices such as solar batteries to ensure energy availability during non-generating periods [
26]. The overall efficiency of the system is contingent upon the performance and operational effectiveness of each individual component. The primary energy conversion efficiency is mathematically described by Equation (7) [
27].
—Cable performance
—Performance of solar charge controller
—Battery performance
—Inverter Performance
The power capacity of the photovoltaic panel array is designed to supply approximately fifty percent of the daily energy demand of the refrigeration facility. The system sizing is based on the solar availability for the month of December, which corresponds to the period of lowest solar irradiance in Tarrafal, Cape Verde. The maximum power capacity required for the photovoltaic panel array is determined by Equation (8) [
28].
Furthermore,
Table 2 presents the monthly and daily solar irradiation levels at the site, along with the average daily hours of solar exposure, providing essential data for the accurate design and performance assessment of the photovoltaic system [
29].
4.3. Tidal Energy
Tidal energy is a renewable resource that harnesses the kinetic energy of ocean currents generated by tidal movements. It is characterized by high predictability and consistency, making it a promising option for refrigeration systems requiring stable and continuous power supply. This energy is captured using underwater turbines, similar in design to wind turbines, which convert the flow of tidal currents into electrical energy [
30]. The efficiency of these systems depends on local conditions such as current velocity, water depth, and environmental factors.
Despite the potential demonstrated in studies and pilot projects, the integration of tidal energy into refrigeration applications remains at an early stage and requires further technological development and specific adaptations [
31]. Key challenges include marine corrosion, biofouling, and environmental impacts, which can be mitigated using resistant materials and proper maintenance [
32,
33]. In this study, tidal energy is considered an innovative complementary renewable source aimed at enhancing the energy sustainability of the refrigeration facility in Tarrafal, Santiago, Cape Verde.
To estimate the electrical power output of tidal energy, the actual power curve of the selected turbine was employed, which correlates the tidal current velocity with the power effectively produced by the turbine. This approach allows for an accurate assessment of turbine performance under real operational conditions. The power curve used can be consulted, with all relevant information provided in the
Supplementary Material.
5. Reference Environmental Conditions and Design Assumptions
To ensure traceability and reproducibility of the presented results, reference environmental conditions were defined, and the main design assumptions were established based on historical climate data for the city of Tarrafal de Santiago, located in Cape Verde—the intended site for implementation of the refrigeration system and associated renewable energy technologies. The refrigeration system was sized considering the most demanding climatic scenario recorded over the past 30 years, specifically a maximum dry-bulb temperature of 35 °C observed in the month of September, according to Meteoblue database records. The average wind speed in the region is approximately 26 km/h, with minimum values around 18 km/h. Relative humidity ranges from 60% to 85%; for thermal calculation purposes, a representative average value was adopted.
Figure 3 presents the observed climatic conditions.
The preservation of fish products requires strict control of temperature and relative humidity within the storage chambers. For chilled products, the storage temperature must be maintained between 0 °C and 2 °C, while frozen products must be stored within the range of −30 °C to −20 °C. Regarding humidity control, recommended levels range between 95 and 100% for chilled storage and 90–95% for frozen storage. These conditions aim to prevent dehydration, oxidation, and surface ice crystallization, thereby ensuring the retention of the organoleptic and nutritional qualities of the fish products.
From an energy perspective, the system integrates three renewable energy sources: photovoltaic solar, wind, and marine current energy. The photovoltaic energy production was sized based on an average monthly solar irradiation of 159,730 Wh/m2 and an average of 5.2 peak sun hours per day. The system includes 51 photovoltaic modules distributed over a total active area of 180 m2, resulting in an estimated daily electricity production of approximately 123.5 kWh.
Regarding the exploitation of marine current energy, a mean flow velocity of 6 km/h was considered, based on in situ measurements. The turbine is planned to be installed at a depth of 30 m, with velocity corrections applied according to vertical hydrodynamic profile models. For the wind component, an average wind speed of 26 km/h at a height of 64 m was estimated, supporting the feasibility of deploying small- to medium-scale horizontal-axis wind turbines.
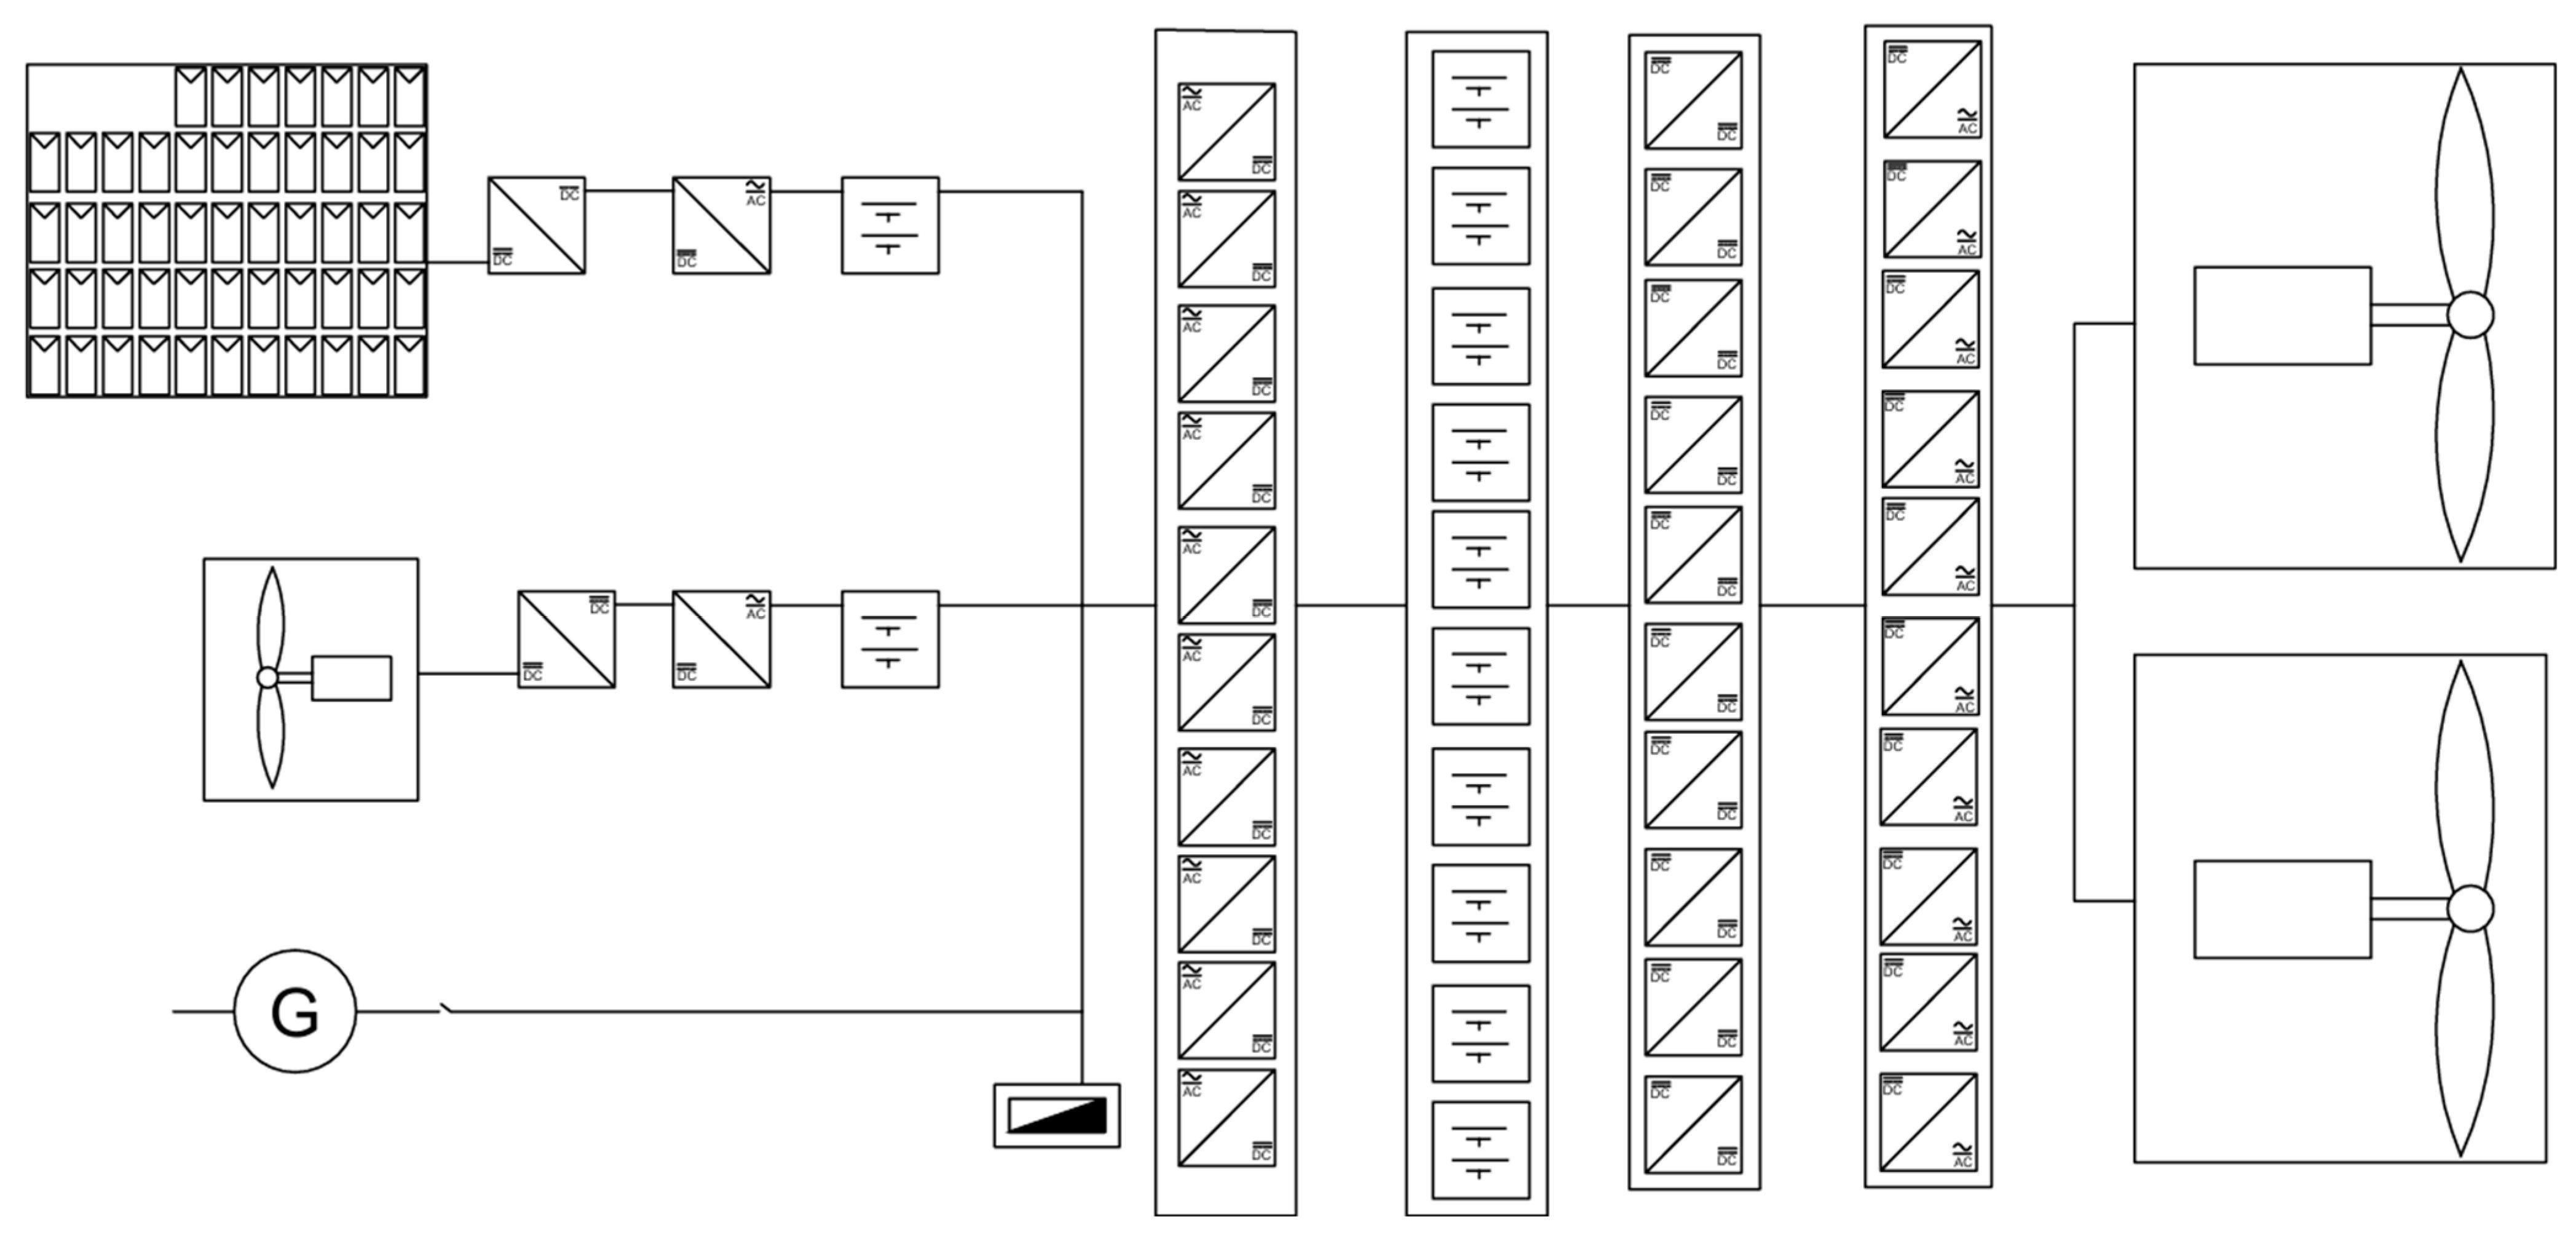
Figure 4 illustrates the schematic diagram of the proposed system, highlighting the main refrigeration subsystems and the integrated energy conversion technologies. All relevant environmental, thermal, and electrical parameters are explicitly defined, ensuring the full reproducibility of the adopted assumptions and the analytical procedures undertaken.
The overall procedure adopted in the development of the study involved the definition of reference environmental conditions and the thermal requirements of the refrigeration system, followed by the preliminary design of the renewable energy system for different operational scenarios. Subsequently, the energy production from the various considered renewable sources was estimated, and finally, the subsystems were integrated and jointly evaluated to assess the technical and energetic feasibility of the proposed solution.
6. Analyzed Strategies
Based on the characterization of the refrigeration system and the evaluation of renewable energy sources, this section presents the various operational strategies analyzed in the context of this study. Each strategy incorporates different configurations and technological combinations, aiming to optimize system performance, energy efficiency, and environmental impact, considering the specific conditions of the case study.
6.1. Strategy A
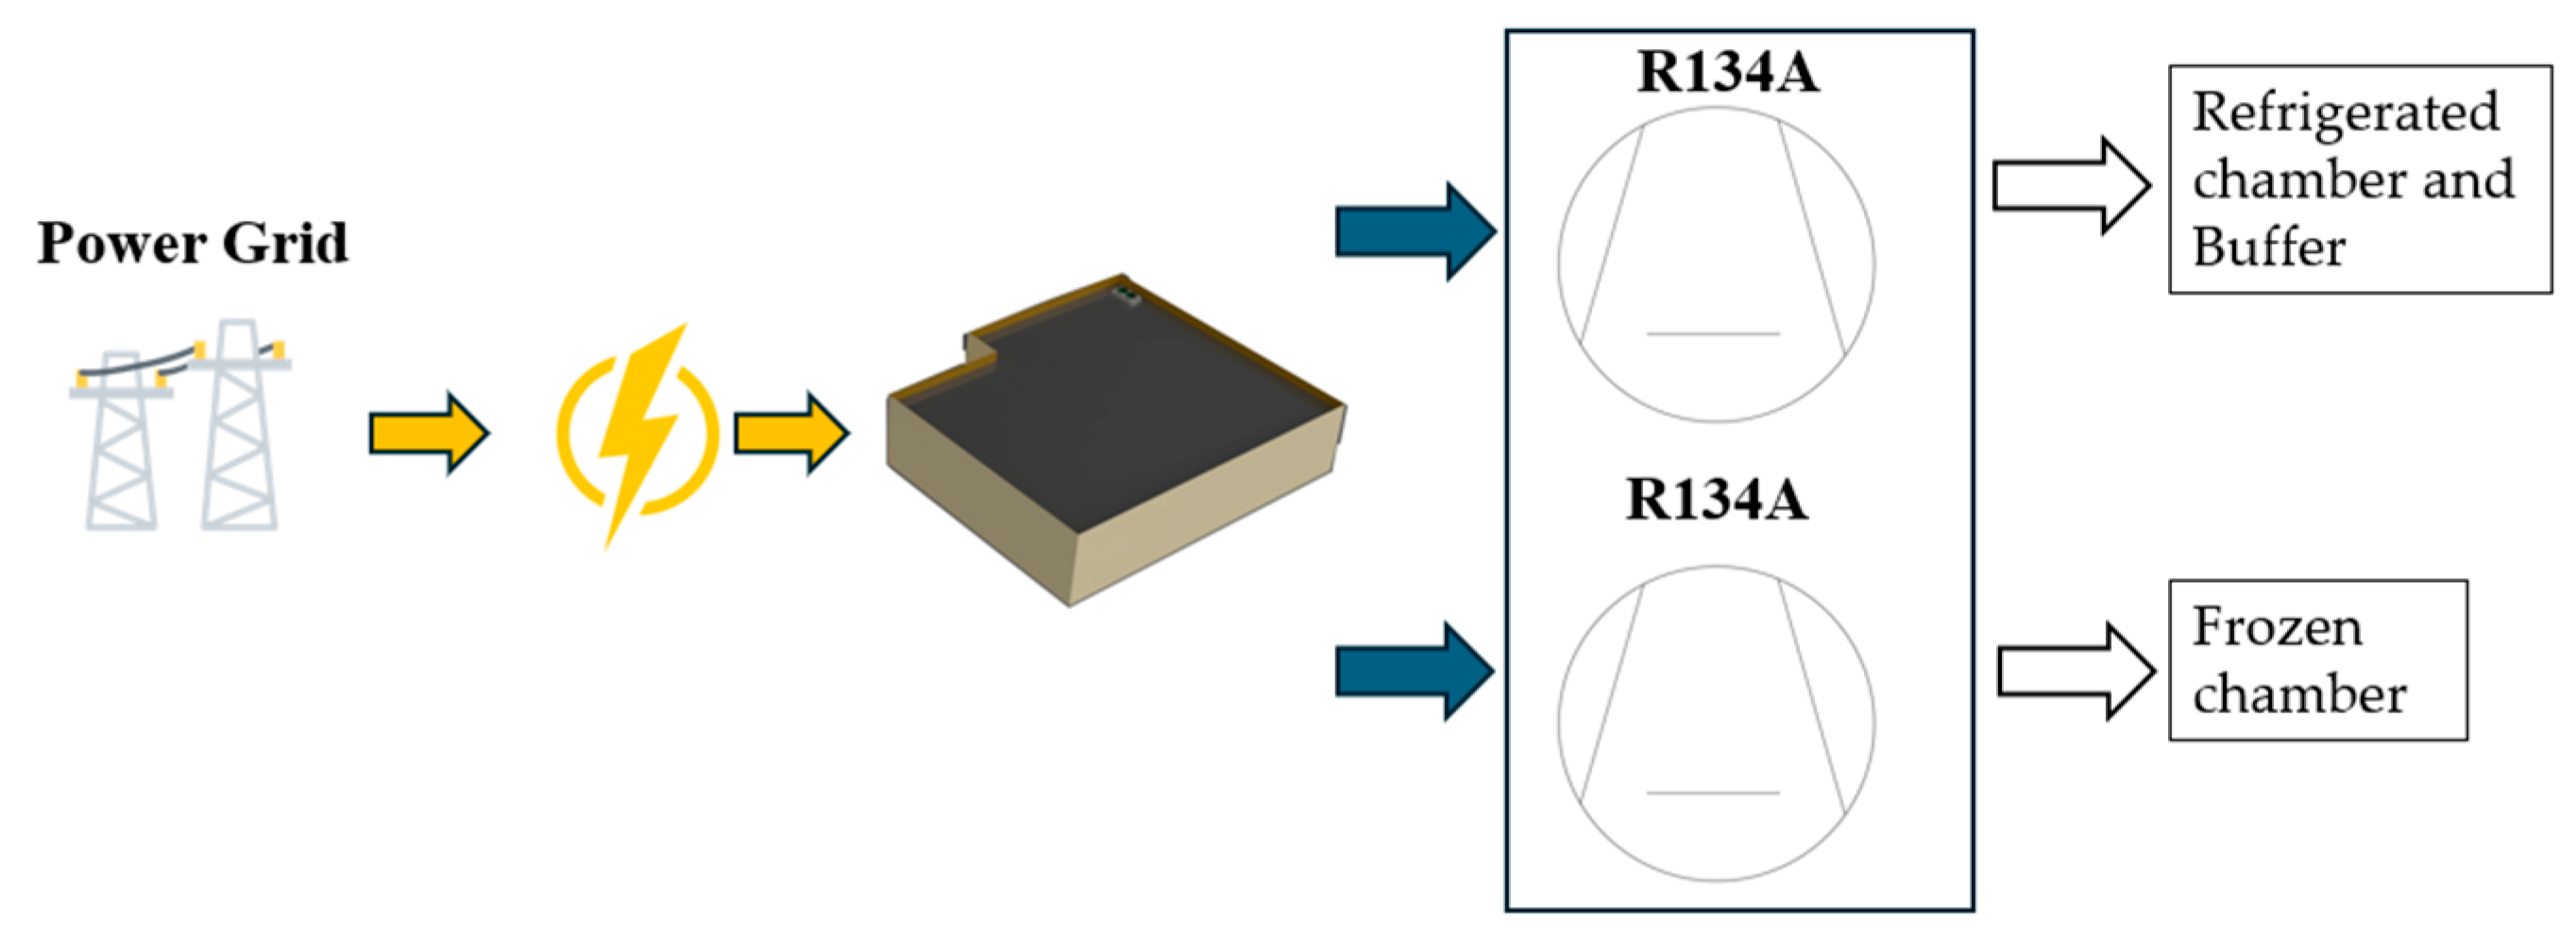
Strategy A involves the implementation of a refrigeration system composed of two independent units, both operating with the refrigerant R134a. One unit is designated for the storage of frozen products, while the other is intended for chilled products. The electrical energy required for the operation of the refrigeration warehouse is entirely supplied by the public power grid (
Figure 5).
6.2. Strategy B
In Strategy B, the refrigeration warehouse operates using electrical energy sourced exclusively from the public power grid. The refrigeration system adopted in this strategy consists of a transcritical CO
2 booster configuration, selected for its potential in high-efficiency, environmentally friendly cooling applications (
Figure 6).
6.3. Strategy C
In Strategy C, a transcritical CO
2 booster refrigeration system was adopted. The electrical energy required for the operation of the refrigeration warehouse is supplied through renewable energy sources, namely wind power, photovoltaic solar energy, and marine current energy (
Figure 7), thereby reducing dependence on conventional energy grids and enhancing environmental sustainability.
6.4. Strategy D
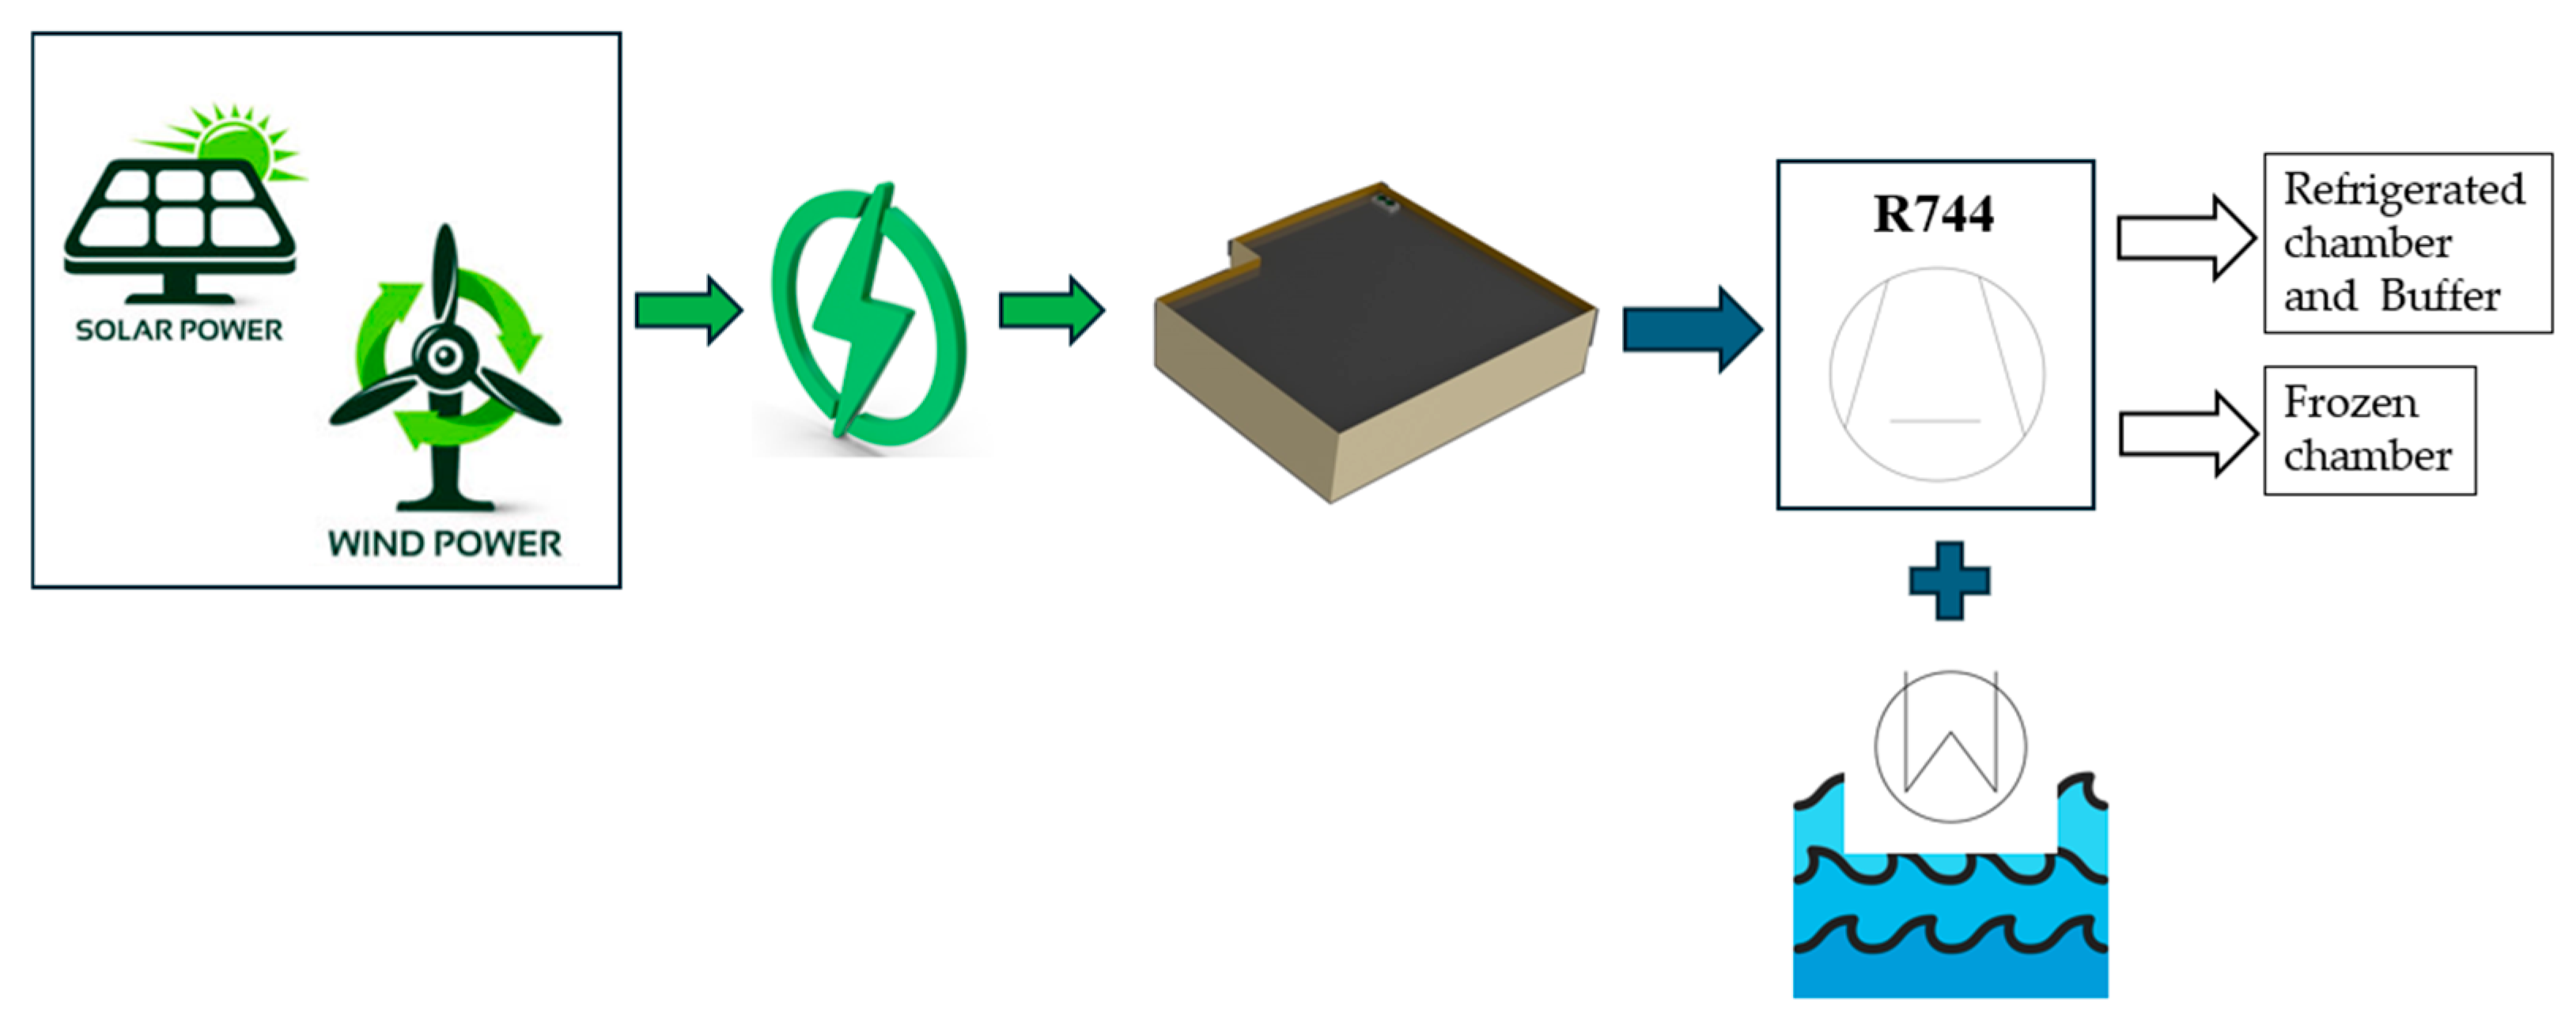
In Strategy D, a subcritical CO
2 booster refrigeration system was considered. The cooling of the refrigerant is achieved through a heat exchange process utilizing seawater located adjacent to the refrigeration warehouse. Additionally, this strategy incorporates renewable energy sources—specifically wind and photovoltaic solar energy—for the generation of the electrical power required for the facility’s operation (
Figure 8).
7. Results
This section presents and analyzes the main results obtained from the implementation of the defined strategies, considering technical performance, energy efficiency, economic feasibility, and environmental impact. The data are structured to enable a clear comparison between the proposed configurations, highlighting the advantages and limitations of each approach within the specific context of the case study.
7.1. Coefficient of Performance (COP) Analysis
This section presents the comparative analysis of the Coefficient of Performance for the four evaluated refrigeration strategies.
Table 3 summarizes key performance indicators, including cooling capacity, heat recovery, power demand, and energy consumption.
Based on the results presented in
Table 3 and illustrated in
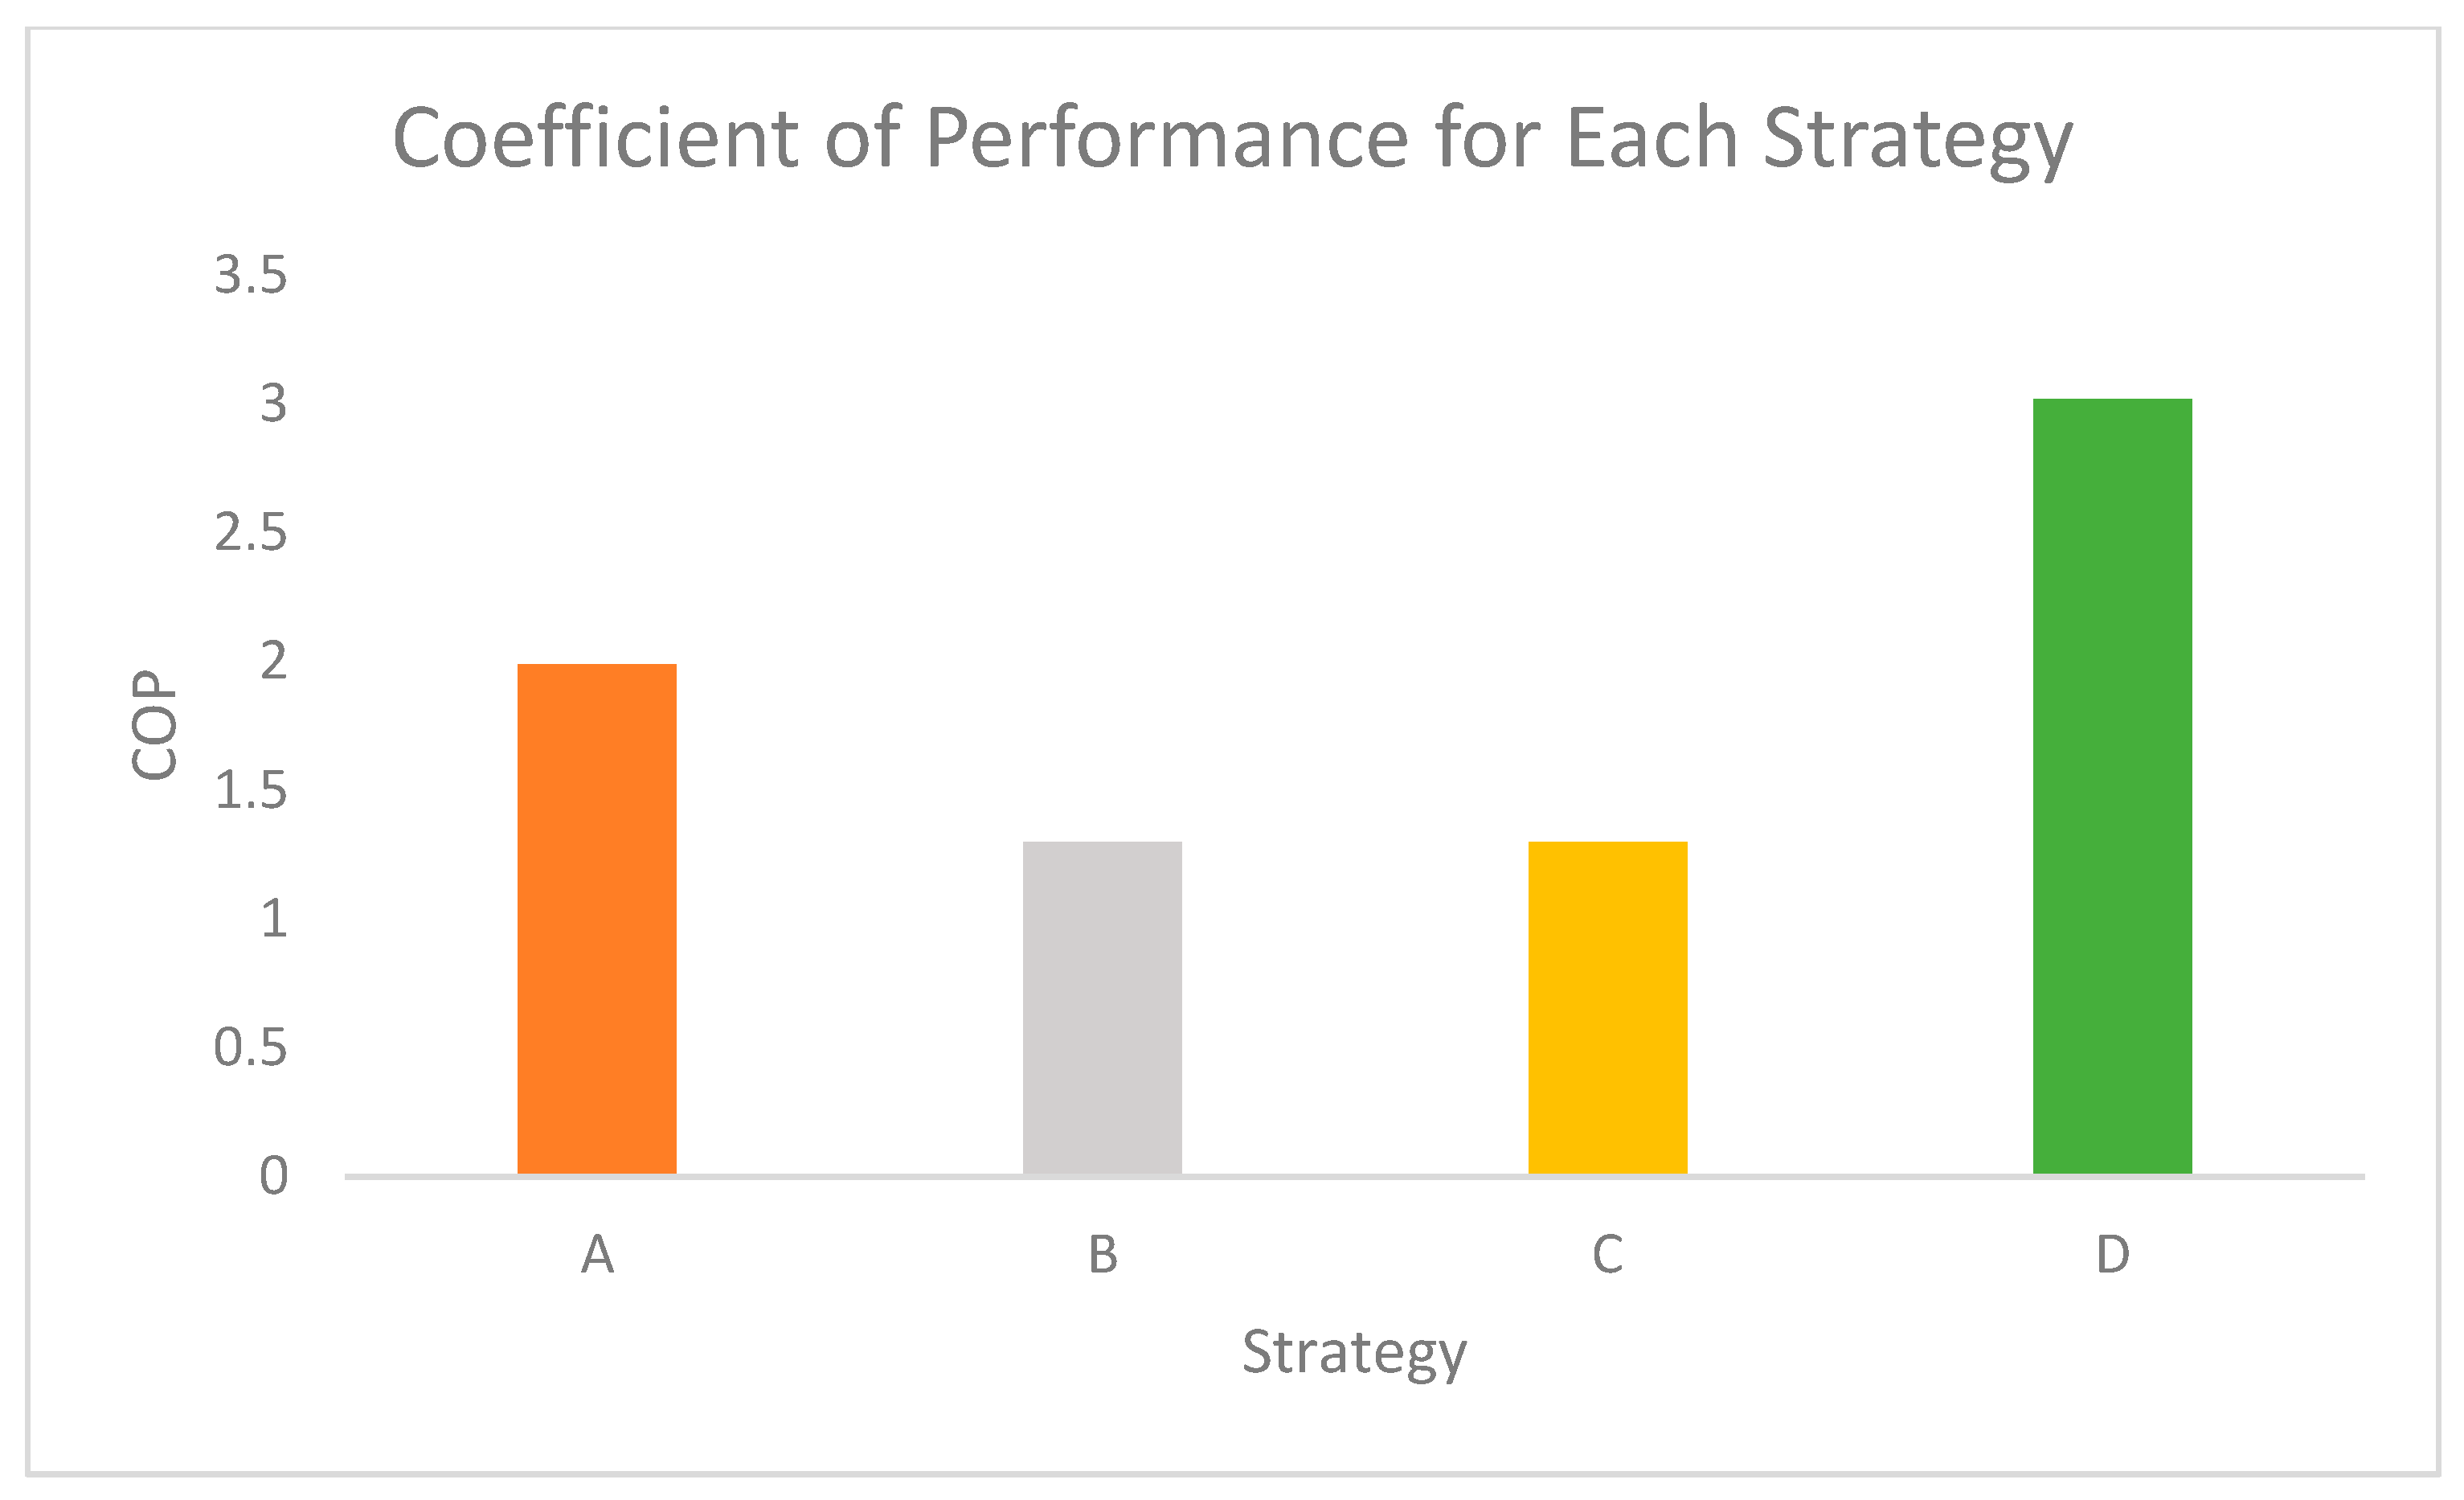
Figure 9, Strategy D achieves the highest COP value (3.02), indicating superior energy efficiency in refrigeration operations. This markedly improved performance is primarily attributed to the use of seawater as a heat sink, whose temperature is significantly lower than that of the ambient air, thereby enhancing the thermodynamic performance of the system.
This greater temperature difference enhances heat exchange in the heat exchanger, thereby improving the overall cycle efficiency. Additionally, Strategy D exhibits the lowest electrical power demand among all scenarios, indicating a more optimized and sustainable system configuration. In contrast, Strategy A shows a reduced COP due to the absence of heat recovery mechanisms. Strategies B and C demonstrate lower efficiencies, consistent with findings from similar studies such as Sengupta et al. [
34]. These results highlight the importance of heat recovery and the utilization of more favorable temperature sources in enhancing energy performance. Overall, Strategy D stands out as the most efficient approach, combining high thermal performance with minimized energy consumption.
Figure 9 presents the graphical representation of the COP values for each strategy, clearly illustrating the differences in energy performance among the evaluated solutions.
7.2. Economic Performance and Payback Period
A financial feasibility assessment was conducted for each strategy over a 10-year horizon. Key factors analyzed included initial capital investment, energy-related savings, cumulative financial balance, and payback period, with detailed results presented in
Table 4. The investment encompassed both refrigeration infrastructure and renewable energy generation systems. Energy cost estimates were based on the power demand profile of each strategy, with savings resulting from the displacement of grid electricity by on-site generation.
Based on
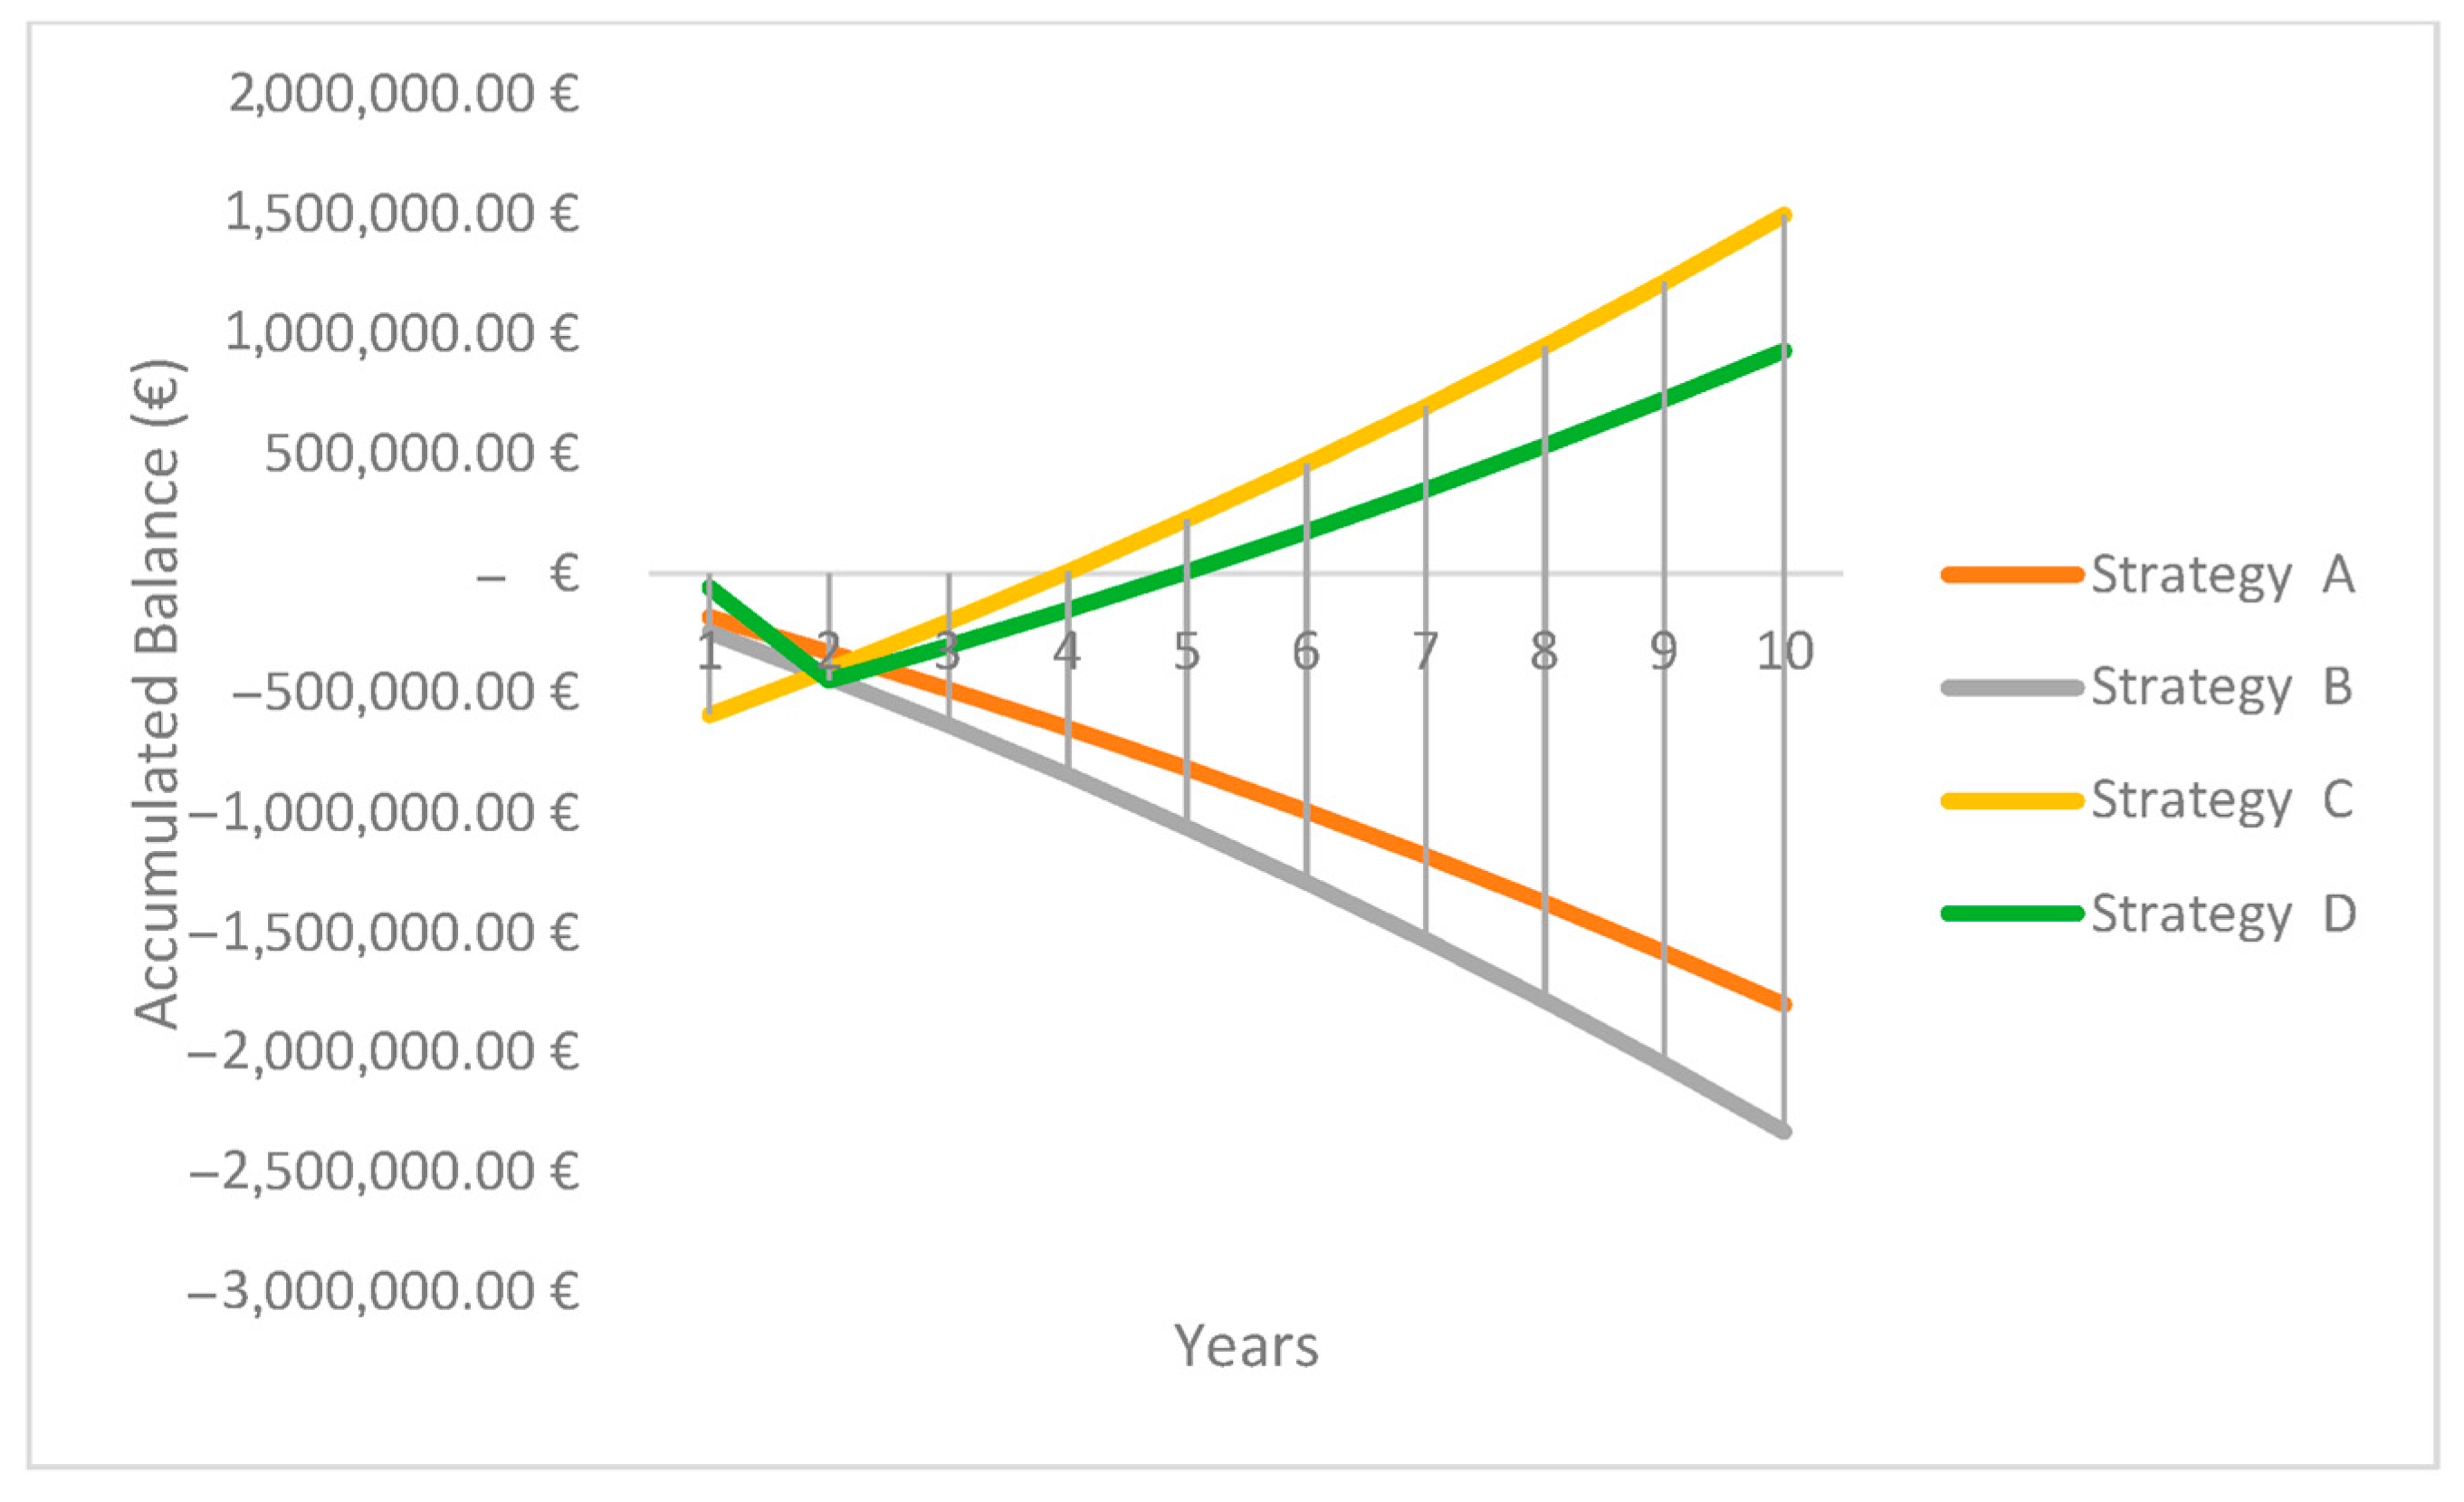
Table 4 and as illustrated in
Figure 10, the accumulated balance trends over the years for each strategy are observed. Strategies C and D, despite requiring higher initial investments, demonstrate significant long-term financial benefits due to their reliance on autonomous renewable energy sources. Strategy C exhibits the shortest payback period of 4 years and the highest cumulative financial return, while Strategy D, with a 5-year payback period, represents a more conservative investment profile. In contrast, Strategies A and B, which are fully dependent on public grid electricity, incur continuous energy expenses without associated savings. This perpetual dependence results in negative financial balances throughout the evaluation period, leading to infinite payback periods since no financial returns are realized from energy cost reductions.
7.3. CO2 Emissions Assessment
Table 5 and
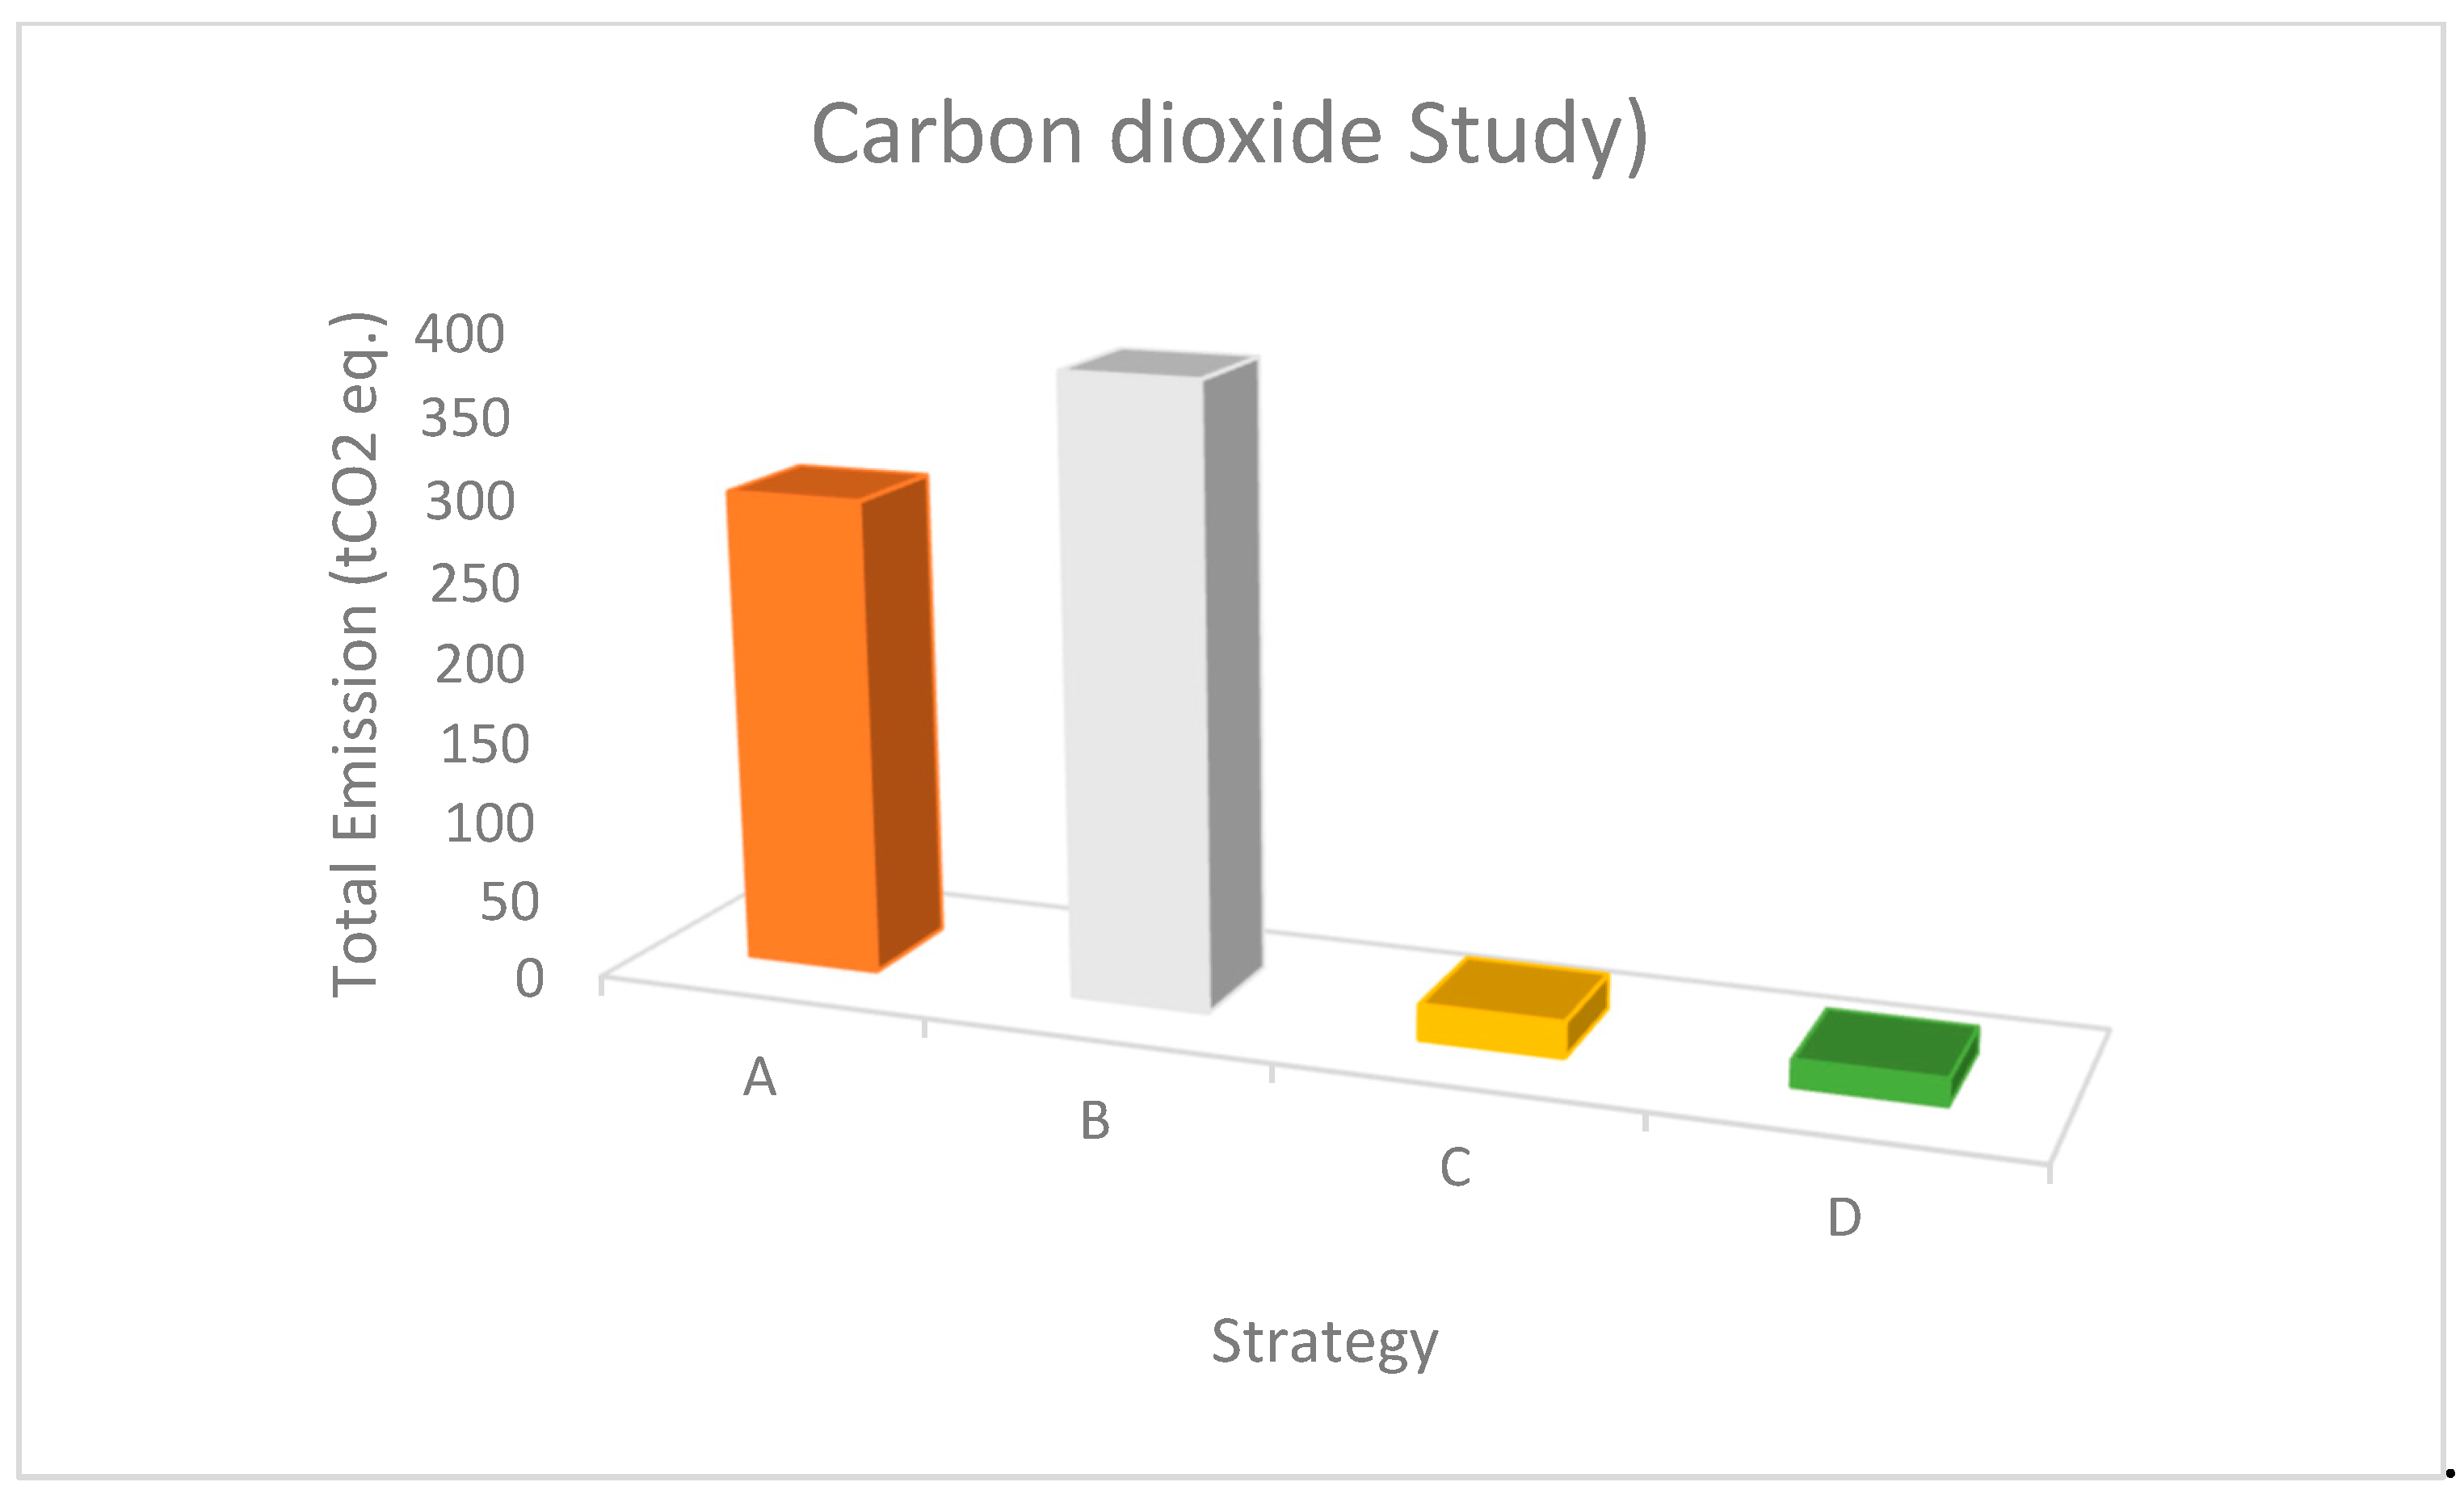
Figure 11 provide a comparative analysis of the carbon emissions associated with the electricity consumption of each strategy. The emission factors applied were based on data from Cabo Verde’s public electrical grid, as well as typical reference values for renewable energy systems, including wind, photovoltaic, and tidal energy technologies.
Analyzing the data presented in
Table 5 and illustrated in
Figure 11, it is evident that Strategies C and D, which utilize renewable energy sources for electricity generation, result in significantly lower carbon dioxide (CO
2) emissions compared to Strategies A and B, which rely solely on the public electrical grid. Specifically, Strategy C achieves a 92% reduction in CO
2 emissions, while Strategy D achieves a 95% reduction. These results clearly demonstrate the environmental advantages of autonomous energy systems powered by renewables and underscore the critical role of renewable energy integration in promoting sustainable refrigeration practices and reducing dependence on fossil fuels.
8. Discussion
The comparative analysis of the four refrigeration strategies reveals critical trade-offs among energy efficiency, economic viability, and environmental impact. Strategy D stands out with the highest coefficient of performance (COP) and the lowest emissions, demonstrating superior thermodynamic performance and sustainability. However, the associated high initial investment may pose a barrier to implementation in contexts with limited financial resources, thus restricting the scalability of this solution. Strategy C, although slightly less efficient than Strategy D, offers the shortest payback period and ensures substantial economic returns. Its integration of multiple renewable sources, including tidal energy, highlights the potential of hybrid systems for deployment in remote or coastal areas. Nevertheless, the inherent intermittency of tidal energy and the technological challenges related to its implementation represent limitations that require further investigation. Conversely, Strategies A and B are characterized by simplicity and lower initial investment; however, their full dependence on the public electrical grid results in higher operational costs and significantly greater emissions. This contrast underscores the strategic importance of renewable energy integration to enhance the sustainability of refrigeration systems. Regarding limitations, there is a clear need for real-scale experimental validation, consideration of climatic and operational variability, and addressing data heterogeneity for accurate modeling and simulation—factors that may affect the robustness of the conclusions. The scalability of these solutions in developing environments, such as Cape Verde, demands thorough analysis given existing financial and infrastructural constraints. Future research should focus on the resilience of these systems under diverse environmental and operational conditions, the optimization of renewable technologies to ensure long-term reliability, and the development of adaptive strategies capable of responding to varying operational regimes. Additionally, further studies should address the optimization of hybrid system integration, including detailed assessments of their economic and environmental impacts.
In summary, the strategic integration of renewable energy in refrigeration system design is crucial for advancing energy security, environmental sustainability, and economic efficiency in food preservation. A balanced approach that considers advantages, limitations, and potential challenges is essential to effectively guide future research and implementation efforts.
9. Conclusions
This study demonstrates that among the analyzed strategies, Strategy D stands out as the most balanced and advantageous in terms of thermodynamic performance, environmental sustainability, and economic viability. Despite a moderate initial investment, this strategy effectively integrates a subcritical CO2 refrigeration system with renewable electricity generation, resulting in reduced energy consumption, lower carbon emissions, and satisfactory economic returns. Strategy C also represents a valid option, offering a shorter payback period and diversified renewable sources; however, its higher upfront cost may limit applicability in certain contexts. Both strategies highlight the potential of renewable energy integration within cold chain infrastructure. The study underscores the importance of holistic approaches that simultaneously consider multiple performance criteria. The transition towards low-emission, energy-efficient systems must account not only for technical and financial aspects but also for long-term sustainability and policy support. Therefore, the implementation of public policies promoting incentives and subsidies for renewable energy adoption in refrigeration is essential. Future research should explore hybrid systems combining Strategies C and D and assess the scalability of these solutions to other regions, particularly in developing countries such as Cabo Verde. Investigations into local adaptability, system resilience under variable conditions, and integration with complementary technologies are also crucial. In summary, a balanced approach addressing performance, sustainability, and cost is vital to advance sustainable refrigeration solutions aligned with environmental and development goals. Further model refinement and experimental validation will contribute significantly to progress in this field.

