Article

Modeling the Joint Influence of Milk Fat Particle Size Micro-Distribution and Absorption on Optical Scattering and Composition Determination

1
School of Photoelectric Engineering, Changzhou Institute of Technology, Changzhou 213032, China
2
Discipline Inspection Office, Changzhou Institute of Technology, Changzhou 213032, China
3
The Higher Educational Key Laboratory for Measuring & Control Technology and Instrumentations of Heilongjiang Province, Harbin University of Science & Technology, Harbin 150080, China
*
Author to whom correspondence should be addressed.
Processes 2025, 13(9), 2846; https://doi.org/10.3390/pr13092846
Submission received: 28 July 2025 / Revised: 25 August 2025 / Accepted: 2 September 2025 / Published: 5 September 2025
(This article belongs to the Section Particle Processes)

Abstract

Optical scattering techniques often lead to simplified assumptions about secondary factors, such as neglecting the absorption effect of particles or the residual particle size micro-distribution after homogenization; these are made to enhance measurement efficiency. However, such simplifications can introduce systematic errors in precise detection. This study uses the scattering–transmission ratio composition determination method as an example, revises the basic scattering–transmission ratio model to incorporate absorption effects, and demonstrates the coefficient calculation process. Furthermore, Mie key coefficients, including the particle size micro-distribution—which are core parameters of this method—are derived. Based on these models, effective particles from image processing are analyzed to assess the impact of these two factors. The results demonstrate the joint influence of the micro-distribution and absorption characteristics of milk fat particles on Mie key coefficients and composition determination, exhibiting non-uniform enhancement and reduction effects. Specifically, at a wavelength of 800 nm, the scattering–transmission ratio of the modified model increases by a factor of 1.56 compared to the traditional model at a volume concentration of 0.5%, while at 3.3% concentration, the scattering–transmission ratio of the modified model is approximately one-third of the traditional model. These findings provide a theoretical basis for developing dairy product quality assessment technologies.

1. Introduction

Particle suspensions are used in many fields, including pharmaceuticals, environmental monitoring, food safety, and material science, where precise composition determination is essential for quality control. Optical models, particularly those based on scattering–transmission ratios [1,2], provide a non-invasive method to infer composition from light interaction with particles [3,4]. This approach builds upon the foundational Mie scattering theory for colloidal systems [5,6] and recent international advancements in the optical characterization of dairy emulsions, which emphasize the role of fat content, homogenization, and particle distribution on scattering properties [7,8,9]. However, traditional models often assume uniform particle sizes, overlooking the micro-distribution of particle sizes, which can significantly affect scattering properties [10,11,12,13,14].
The particle size micro-distribution influences the overall optical behavior in suspensions, as smaller particles enhance scattering while larger ones may dominate transmission, leading to deviations in model predictions [15,16,17]. Studies have shown that ignoring this distribution can result in errors of up to 30% in concentration estimates, especially in non-diluted solutions [18,19]. Furthermore, absorption effects, arising from the material’s imaginary refractive index, further complicate the models by attenuating transmitted light and altering the ratio calculations [20,21].
In high-concentration solutions, the joint impact of size distribution and absorption becomes pronounced, with wavelength-dependent variations exacerbating inaccuracies at shorter wavelengths [22,23,24]. Despite advances in imaging techniques like electron microscopy for particle characterization, integrated models accounting for both factors remain limited [25,26]. In light-scattering techniques, the scattering–transmission ratio composition determination method (STRD) could be employed to enhance detection speed. To achieve this, secondary factors that may influence detection accuracy are often idealized, such as neglecting the absorption effects of the particles under measurement or simplifying the particle size micro-distribution in the homogenized particle system to a uniform value. While these simplifications improve the measurement efficiency of the model, they may sacrifice accuracy to some extent.
However, a significant problem persists: to enhance measurement efficiency, traditional STRD models often make simplifying assumptions, such as neglecting the absorption effect of particles or simplifying the residual particle size micro-distribution after homogenization to a uniform value [1,2,27]. These simplifications can introduce substantial systematic errors in precise composition determination, especially in non-diluted, complex systems like raw milk.
Therefore, this paper focuses on the STRD method for measuring milk fat, which has significant potential for applications in the dairy industry [27]. The primary purpose of this study is to solve this accuracy problem by (1) constructing a modified mathematical model for the STRD method that incorporates both the effect of absorption and the particle size micro-distribution; (2) quantifying the individual and joint impact of these two overlooked factors on the Mie key coefficients and the final composition’s determined accuracy; and (3) providing a theoretical basis for improving the reliability of optical scattering techniques in practical dairy industry applications. The results of this research are expected to improve the detection accuracy of the STRD method and expand the boundaries of the theoretical model for the scattering-to-transmission ratio. The theories and methods involved also have important significance and application potential for the measurement practices of complex dispersed systems, such as pharmaceutical solutions and biological macromolecule colloidal solutions, and are expected to provide more cost-effective solutions for online monitoring in multiple fields.

2. Materials and Methods

2.1. Modified Model for the STRD

The scattering–transmission ratio composition determination method (STRD) is a particle characterization technique based on multi-angle optical sensing. This methodology establishes a quantitative relationship model between the ratio of scattered light intensity (Is) and transmitted light intensity (It) (defined as the scattering–transmission ratio R = Is/It) at specific detection angles and the intrinsic properties of particulate matter, determined through quantitative analysis of the composite optical effects (including scattering and absorption) of suspended particles on monochromatic incident light. According to the Mie scattering theory and the Beer–Lambert law, when the ratio of incident wavelength to particle size satisfies specific proportionality conditions, this ratio parameter demonstrates significant sensitivity to both the real part of the complex refractive index (reflecting chemical composition) and particle size distribution. In general, the ratio of 0° forward transmission intensity to 90° scattering intensity can be used as the characteristic parameter to evaluate the measurement results.
Since the absorbed intensity by milk fat particles is much smaller than the scattering intensity, the absorption effect is usually ignored. For instance, in the literature [1,2,27], the absorption effect of particles is not taken into account. In the Beer–Lambert law, the calculation of the transmitted intensity It is related to the incident intensity I0; the scattering coefficient κs; the milk fat concentration c; and the optical path length d, as shown in Equation (1).
I t = I 0 e κ s c d
At the same time, on the basis of ignoring absorption, according to the law of conservation of energy, the incident energy is equal to the sum of the scattered energy and the transmitted energy as follows:
I 0 Δ S = I s S R + I t Δ S
where ΔS is the cross-sectional area of the incident beam. SR represents the surface area of an imaginary sphere centered at the sample, which encompasses the effective scattering volume and is proportional to the particle concentration c, as derived from Mie scattering principles for isotropic scattering in dilute suspensions [3]. Specifically, SR = 4πr2, where r is the radius of the sphere approximating the interaction volume, which varies with c but can be approximated as constant despite small changes in concentration to simplify calculations. When the concentration c changes minimally, it can be approximated as a constant. On the surface of an imaginary sphere, Is is equal everywhere. Assuming a coefficient w = SRS, Equation (2) can then be rewritten as follows:
I 0 = w I s + I t
According to Equations (1) and (3), the basic models of the scattering–transmission ratio and the fat concentration are obtained.
R 1 = I s I t = 1 w e κ s c d 1
c 1 = ( κ s d ) 1 ln ( w R 1 + 1 )
However, although the absorption effect is relatively weak compared to scattering, the absorption coefficient κa affects the measurement results during continuous cumulative calculations. In the actual detection of milk components, the transmitted intensity should also be related to the absorption coefficient, as shown in Equation (6).
I t = I 0 e κ s + κ a c d
Meanwhile, the law of conservation of energy should also include the light absorption effect, as shown in Equation (7). After simplification, it can be expressed as Equation (8), where the absorbed intensity Ia is depicted by Equation (9).
I 0 Δ S = I s S R + I t Δ S + I a Δ S
I 0 = w I s + I t + I a
I a = e κ a c d
Since the absorbed intensity of the solution is much smaller than the scattering intensity, and the scattering intensity is much smaller than the transmitted intensity, the value of Ia/It is an extremely small quantity, which can be simplified to the correction constant C of the scattering–transmission ratio.
The simplification of Ia/It to a correction of the constant C arises from the empirical observation that absorption is negligible compared to scattering and transmission in milk fat solutions (Ia << Is << It), leading to a small, near-constant perturbation. This empirical correction is valid for low-absorption regimes (e.g., fat concentrations below 3.3% and wavelengths >800 nm), where multiple scattering effects are minimal. For higher concentrations, more rigorous radiative transfer models may be required to account for non-constant behavior.
Therefore, the modified models of the scattering–transmission ratio and the fat concentration can be expressed as follows:
R = 1 w ( e ( κ s + κ a ) c d 1 ) + C
c 2 = [ κ s + κ a d ] 1 ln [ ( R C ) w + 1 ]

2.2. Experimental Methods and Demonstration Calculation of Modified Model Parameters

The homogenized sample for optical measurements was prepared from a commercially available homogenized milk product (brand: Yili; product type: pure milk; fat content: 3.3%; protein content: 3.2%). This specific brand and type were chosen for their consistent homogenization quality and widespread market availability, ensuring the reproducibility and practical relevance of our findings. The milk was purchased from a local supermarket and used within its shelf life (≤7 days post-packaging; stored at 4 °C) to guarantee freshness and minimize any physicochemical changes. To ensure sample uniformity, the milk container was gently inverted several times before sampling, and the sample was taken from the middle of the liquid column after opening to avoid potential creaming or sedimentation.
The macromolecular proteins in the sample were degraded using the protein solubilizer ethylenediaminetetraacetic acid (EDTA) (2% w/v, incubated at 40 °C for 15 min), so that the only macromolecules in the system were fat particles. Subsequently, the sample underwent 30 min of ultrasonic treatment (using a KQ-300DE ultrasonic cleaner, Kunshan Ultrasound Co. Kunshan City, Jiangsu Province, China; power: 300 W, frequency: 40 kHz) at 25 °C to ensure uniformity and disrupt any potential aggregates. This sample preparation protocol was strictly followed for consistency with the method used in [28], ensuring that the particle size micro-distribution analyzed in that study was directly comparable to the samples used in our optical experiments. To facilitate observation and calibration for the optical measurements, the sample was diluted to a fat volume concentration of 0.5% with deionized water. The experiments were conducted using a standard cuvette with an optical path length (d) of 10 mm. Error analysis: the particle size measurement uncertainty was ±0.05 μm (standard error from 10 replicate measurements); a statistical test (Kolmogorov–Smirnov) confirmed the Gaussian fit (p = 0.05). The initial parameters were obtained based on two experiments.
The scattering–transmission ratio R was first measured for a sample with a fat volume concentration of 0.5% using the custom-built experimental device described above. To reduce the impact of measurement deviation, the average value of 5 test results was adopted, with R = 1.2710 ± 0.008 (mean ± standard deviation, n = 5). Concurrently, the absorbance, A, of the same milk fat solution was measured using NIR spectroscopy, resulting in a value of A = 0.867 at the relevant wavelength. The absorbance A is expressed in Equation (12), where a represents the extinction coefficient.
A = ln I 0 I t = a c d
In addition, according to Equation (6), the following can be obtained:
ln I 0 I t = ( κ s + κ a ) c d
As can be seen from Equations (12) and (13), the value of the extinction coefficient a is the sum of the scattering coefficient κ and the absorption coefficient κ in the scattering –transmission ratio experiment. Therefore, by substituting the initial parameters obtained from the above experiments into the calculation, the coefficient w ≈ 0.87 can be obtained. The basic models R1 and c1 are shown in Equations (14) and (15). The modified models R and c2 are shown in Equations (16) and (17).
R 1 = I s I t = 0.922 e κ s c d 1
c 1 = ( κ s d ) 1 ln ( 0.87 R 1 + 1 )
R = 0.922 ( e ( κ s + κ a ) c d 1 ) + 1
c 2 = [ κ s + κ a d ] 1 ln 0.87 R + 0.13
In these equations, c1 represents the basic concentration of the model without absorption (Equation (15)), while c2 denotes the modified model incorporating absorption effects (Equation (17)). Similarly, R1 is the basic scattering–transmission ratio, and R is the modified version.
These specific forms (Equations (16) and (17)) demonstrate the application of the generalized models (Equations (10) and (11)) to the 0.5% concentration case, with numerical constants derived from the experimental parameters. In the same way, modified models for other volume concentration solutions can be calculated.

2.3. Deduction of Mie Key Coefficients Including Particle Size Micro-Distribution

During the calculation process of the scattering coefficient and the absorption coefficient in the classical Mie scattering theory, the diameter parameter D involved is usually a single value. Therefore, for the homogenized particle system, the average particle size is generally used to replace the existing particle size micro-distribution. To quantify the calculation deviation caused by the particle size micro-distribution, this paper re-establishes the calculation model of Mie coefficients in the micro-distribution state to avoid ignoring the particle size distribution information in the process of obtaining the average value.
Since the orientation of milk fat particles is random during motion, it can be considered that the probability of each particle facing each direction is the same. Therefore, some ellipsoidal fat particles can be simplified as spheres for processing [29]. When the milk fat particles satisfy the independent scattering condition [30], the particle sizes in the particle system with particle size micro-distribution are grouped according to the arithmetic difference, where z is the number of particle size groups and Ni is the particle number density of the i-th group of particle sizes. The absorption coefficient κ and the scattering coefficient κ of the particle system containing the particle size micro-distribution can be expressed by Equations (18) and (19), respectively.
κ a λ = π 4 i = l z D i 2 N i Q a λ , i = 3 2 i = l z Q a λ , i f v , i D i
κ s λ = π 4 i = l z D i 2 N i Q s λ , i = 3 2 i = l z Q s λ , i f v , i D i
where fv,i is the volume percentage of the i-th group of particle sizes, f v , i = π D i 3 N i / 6 , and Di is the diameter of the particles in the i-th group of particle sizes in the particle size micro-distribution Dm. Here, Qaλ,i and Qsλ,i are the absorption factor and the scattering factor of the i-th group of particle sizes, respectively, and their calculation formulas are Equations (20) and (21), respectively. χi represents the scale parameter with χi = πDi/λ, where λ is the wavelength. The calculation methods of the parameters an and bn involved in the formulas are consistent with those expressed in the classical Mie theory; thus, they are not listed again.
Q s λ , i = 2 χ i 2 n = 1 2 n + 1 a n 2 + b n 2
Q a λ , i = 2 χ i 2 n = 1 2 n + 1 Re a n + b n Q s λ , i
Based on the above deductions, the Mie key coefficients, including the particle size micro-distribution, can be calculated. In addition, for comparison, this study included three common average particle sizes to calculate the Mie coefficients: the Sauter mean diameter D(3,2), which represents the surface-area-weighted mean and is relevant for scattering processes; the volume mean diameter D(4,3), which is the volume-weighted mean; and the number mean diameter D ¯ , which is the arithmetic mean.
D ( 3,2 ) = ( i = 1 j n i x i ¯ 2 x i ¯ ) / ( i = 1 j n i x i ¯ 2 )
D ( 4,3 ) = ( i = 1 j n i x i ¯ 3 x i ¯ ) / ( i = 1 j x i ¯ 3 )
D ¯ = ( i = 1 j n i x i ¯ ) / i = 1 j n i

2.4. Particle Size Data Source and Image Processing Analysis

The particle size micro-distribution data used in this study for model validation were derived from transmission electron microscopy (TEM) images presented in the work of Min [28], which were obtained using a Hitachi H-7500 transmission electron microscope (Hitachi High-Technologies Corporation, Tokyo, Japan). As an illustrative example, Figure 1 (adapted from [28]) shows one of the analyzed images. The sample preparation protocol used to generate these images is coincident with that used for our optical experiments (as detailed in Section 2.2), ensuring direct comparability.
Image processing and analysis of the 100 TEM images from [28] were performed using MATLAB (R2021a) in this study. The workflow included grayscale conversion (rgb2gray function), binarization via Otsu’s method (global threshold = 0.5), masking to isolate regions of interest, median filtering (3 × 3 kernel) for noise reduction, and Canny edge detection (sigma = 1.0) for boundary identification. From the processed set of images, the first 400 valid particle sizes (diameter > 0.1 μm, circularity > 0.8) were selected for analysis to avoid outliers. Parameters for Gaussian fitting of the size distribution are as follows: initial μ = 1.0 μm and σ = 0.5 μm, optimized via nonlinear least-squares regression. The obtained particle size distribution is denoted as Dm. After processing, the particle sizes were confirmed to be primarily between 0.5 μm and 3.0 μm, approximately following a Gaussian distribution (Kolmogorov–Smirnov test, p > 0.05) with an expected value of μ = 0.58 μm and a standard deviation of σ = 0.7 μm.

3. Results and Discussion

3.1. Influence of Particle Size Micro-Distribution on Mie Key Parameters

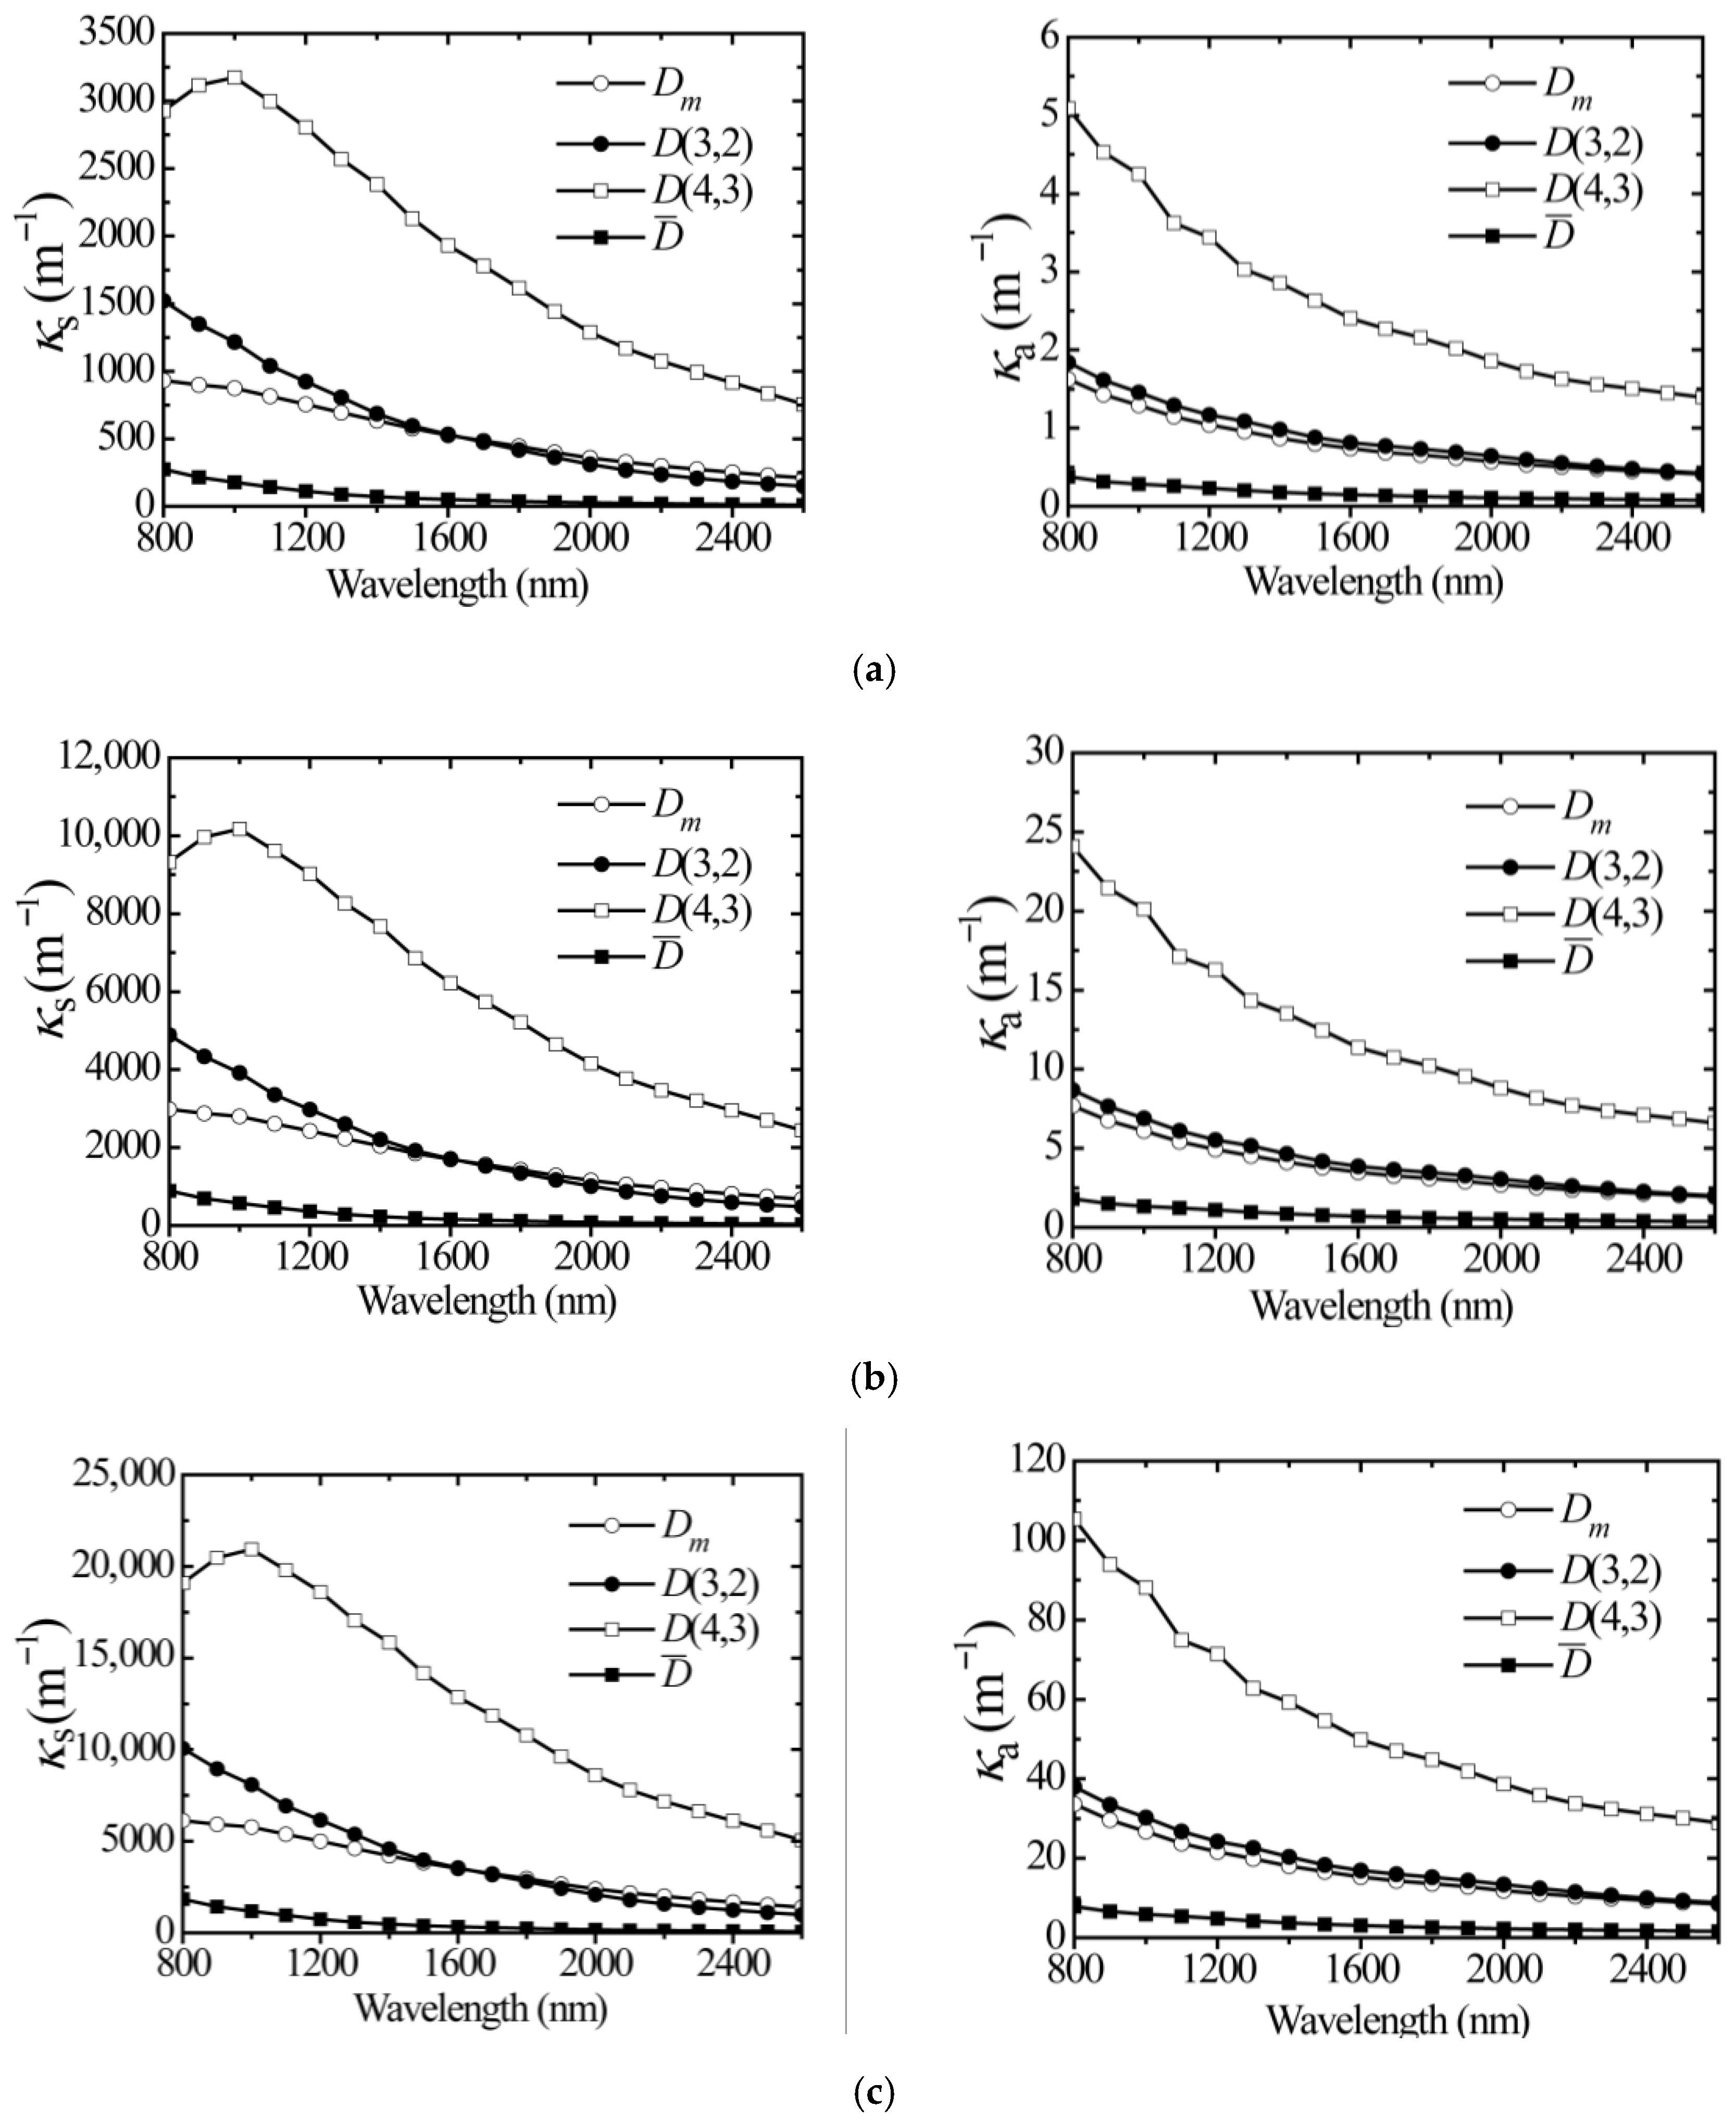
To illustrate the influence of particle size averaging methods on the key optical coefficients, we present calculations of the scattering and absorption coefficients based on the first 400 effective particle sizes. Figure 2, which originally appeared in our prior work [31], primarily to present the computational outcome, was not accompanied by a detailed physical interpretation. In this work, we repurpose this figure as the basis for a thorough investigation and detailed explanation of the underlying phenomena.
The calculations were carried out successively based on the particle size micro-distribution Dm, the Sauter mean diameter D(3,2), the volume mean diameter D(4,3), and the number mean diameter D ¯ . In the present study, milk fat particles were constrained to satisfy the independent scattering condition, which requires the ratio of the inter-particle distance l to the incident light wavelength λ to be greater than 0.5. Our calculations confirmed that this condition holds for volume concentrations below approximately 3.0%. To demonstrate the concentration dependence of the results, milk fat solutions with volume concentrations of 0.5% (identical to the concentration used in the parameter demonstration), 1.6% (selected as an intermediate concentration for transition and comparison), and 3.3% (the original concentration of raw milk) were ultimately chosen for the calculation. It is noteworthy that the 3.3% concentration exceeds the strict limit of independent scattering; however, its inclusion provides a valuable reference for understanding the behavior in high-concentration environments, such as those encountered during the online monitoring of finished milk products. Their corresponding complex refractive indices m were 1.34846 + 0.00021i, 1.35012 + 0.00031i, and 1.35123 + 0.00066i, respectively [32]. After the calculation, the variations in the Mie scattering coefficient and the Mie absorption coefficient are shown in Figure 2.
In the three milk fat solutions with different volume concentrations, as the wavelength of the light source increased, the scattering coefficients and absorption coefficients obtained by all calculation methods showed a downward trend. It can be observed that for both the scattering coefficient and the absorption coefficient, the calculation results based on the particle size micro-distribution exhibit milder characteristics. They do not excessively amplify or reduce the results during the iterative calculation process, and the data do not express extreme values. The results obtained remain in the middle among those calculated by other average-value methods.
At shorter wavelengths, the results obtained using different calculation methods vary significantly. The κ and κ calculated based on the volume mean diameter D(4,3) are significantly higher than those based on Dm, while the k and k calculated based on the number mean diameter D ¯ are significantly lower than those based on Dm. At longer wavelengths, the differences between different calculation methods are significantly reduced, and the calculation results based on the Sauter mean diameter D(3,2) are closest to those based on Dm.
The observed discrepancies among different averaging methods can be attributed to the differential weighting of particle sizes. The volume mean diameter D(4,3) places greater emphasis on larger particles, which exhibit higher scattering cross-sections, thus overestimating both κ and κ. Conversely, the number mean diameter D ¯ underestimates these coefficients due to its bias toward smaller, less scattering-efficient particles. The Sauter mean diameter D(3,2), which is surface-area-weighted, aligns more closely with the micro-distribution model because scattering efficiency is inherently linked to the particle surface area. These findings underscore the necessity of incorporating full-size distribution data rather than relying on simplistic averages, particularly at shorter wavelengths where scattering behavior is more sensitive to size variations. As the solution concentration continuously increases to the level of raw milk, the deviation between the calculation results based on the average particle size and those based on the particle size micro-distribution gradually reaches a maximum. Therefore, ignoring the existence of particle size micro-distribution during the online monitoring of finished milk will inevitably affect the final measurement’s accuracy.

3.2. Influence of Particle Size Micro-Distribution on the Composition Determination Model

Without considering the absorption effect for solutions of different concentrations, the average particle size and the particle size micro-distribution can be used to calculate the basic model of the scattering–transmission ratio. The degree of influence of the particle size micro-distribution on the composition determination is analyzed, and the results are shown in Figure 3. The left-hand side of the figure shows the calculation results when using the average particle size, and the right-hand side shows the results when using the particle size micro-distribution.
The results show that without considering the absorption effect and solutions of various concentrations, the values of the scattering–transmission ratio calculated using the average particle size are significantly higher than those obtained from the particle size micro-distribution. At the same wavelength, the higher the concentration, the greater the difference between the two. Taking the wavelength of 800 nm as an example, the following is calculated: at a volume concentration of 0.5%, R1 ≈ 0.50 and R2 ≈ 0.28; at a volume concentration of 1.6%, R1 ≈ 2.75 and R2 ≈ 1.22; and at a volume concentration of 3.3%, R1 ≈ 14.97 and R2 ≈ 4.30. As the wavelength increases to about 2000 nm, the difference between the two gradually decreases. This reduction is attributed to decreased scattering efficiency at longer wavelengths, following the Rayleigh approximation where scattering ∝ 1/λ4.
However, in research on the determination of milk fat using near-infrared spectroscopy technology, the commonly used characteristic wavelengths are generally between 900 and 1700 nm, such as 950 nm, 1210 nm, 1700 nm, etc. In this wavelength range, the influence of the particle size micro-distribution is relatively significant, and the calculation method using the average particle size will affect the determination results to varying degrees.
The overestimation of R using average particle sizes underscores a major limitation of traditional STRD models. This overestimation arises because larger particles—overrepresented in volume-based averages—contribute disproportionately to scattering. In reality, the presence of smaller particles reduces the overall scattering efficiency, leading to lower R values. This effect is concentration-dependent: as concentration increases, multiple scattering and inter-particle interactions become non-negligible, further exacerbating the error when micro-distribution is ignored. Thus, employing a full distribution model is essential for the accurate determination of composition, especially in industrial applications where milk fat concentrations are typically high.

3.3. Influence of Absorption Effect on the Composition Determination Model

Neglecting the existence of particle size micro-distribution, for solutions of different concentrations, calculations are carried out based on the basic model and the modified model of the scattering–transmission ratio, respectively, to analyze the degree of influence with which the absorption effect is considered during composition determination. The results are shown in Figure 4. The left-hand side of the figure shows the calculation results without considering the absorption effect and using the average particle size, and the right-hand side shows the results calculated using the modified model of the scattering–transmission ratio and considering the absorption effect.
The results show that when the influence of particle size micro-distribution is not considered, in solutions of various concentrations, the calculation results obtained using the modified model of the scattering–transmission ratio are slightly higher than those of the basic model. At the same wavelength, the higher the concentration, the greater the difference between the two, but the increasing ratio shows a decreasing trend. Taking the wavelength of 800 nm as an example, at a volume concentration of 0.5%, R1 ≈ 0.50 and R3 ≈ 1.50; at a volume concentration of 1.6%, R1 ≈ 2.75 and R3 ≈ 3.76; and at a volume concentration of 3.3%, R1 ≈ 14.97 and R3 ≈ 16.15. Similarly, after the wavelength increases to about 2000 nm, the difference between the two is relatively small. The slight increase in R3 reflects enhanced absorption at shorter wavelengths due to particle material properties (e.g., imaginary refractive index).
Although the absorption effect is secondary compared to size distribution, its omission still leads to measurable inaccuracies, particularly at higher concentrations and shorter wavelengths. The increase in R3 relative to R1 is due to the additional attenuation of transmitted light via absorption, which effectively increases the measured scattering-to-transmission ratio. However, this effect is partially offset by the wavelength-dependent nature of absorption, which diminishes at longer wavelengths. Therefore, while absorption can be treated as a corrective factor in low-concentration regimes, it must be explicitly included in models intended for broad operational ranges. This confirms that although neglecting absorption has a measurable impact, its influence is secondary compared to particle size micro-distribution, and it can be treated as a corrective factor in many practical scenarios.

3.4. Joint Influence of Particle Size Micro-Distribution and Absorption Effect on Composition Determination

Considering both the particle size micro-distribution and the light absorption of particles for solutions of different concentrations, calculations were carried out based on the “basic model of scattering–transmission ratio + average particle size” and the “modified model of scattering–transmission ratio + particle size micro-distribution”, respectively, to analyze the joint influence of these two factors on the composition determination. The results are shown in Figure 5. The left-hand side of the figure shows the calculation results without considering the absorption effect and using the average particle size, and the right-hand side shows the calculation results under the joint influence of the two factors.
The results show that in solutions of various concentrations, after considering the joint influence of the two factors, the calculated values of the scattering–transmission ratio are significantly lower than those of the initial model. This indicates that among the two influencing factors, the factor leading to the decrease in the calculated values of the scattering–transmission ratio plays a dominant role; that is, the influence of the particle size micro-distribution is more significant. At the same wavelength, the higher the concentration, the greater the difference between the two. Taking the wavelength of 800 nm as an example, at a volume concentration of 0.5%, R1 ≈ 0.50 and R ≈ 1.28; at a volume concentration of 1.6%, R1 ≈ 2.75 and R ≈ 2.23; and at a volume concentration of 3.3%, R1 ≈ 14.97 and R ≈ 5.35. It is clear that the enhancement of the calculated values of the scattering–transmission ratio caused by the absorption effect fails to compensate for the reduction caused by the particle size micro-distribution.
The dominant role of particle size micro-distribution is evident across all concentrations, with its influence surpassing that of absorption, especially in high-concentration samples like raw milk. The failure of the absorption’s effect to compensate for the reduction in R caused by micro-distribution underscores the necessity of prioritizing accurate size characterization in STRD implementations. These results emphasize how improving detection accuracy requires a holistic approach that integrates both factors, with micro-distribution receiving primary attention.
The calculation results of solutions with various concentrations are categorized, as shown in Figure 6, and the influence of the two factors on solutions of different concentrations can be observed more intuitively. In the solution with a volume concentration of 0.5%, there is a significant demarcation between R1, R2 (without considering the absorption effect) and R3, R (considering the absorption effect). This indicates that for solutions with lower concentrations, neglecting the absorption effect can have a relatively clear impact on the composition determination.
After the volume concentration increases to 1.6%, the values of R1, R2 (without considering the absorption effect) and R3, R (considering the absorption effect) start to intersect, suggesting that the influence of the absorption effect decreases. In the solution with a volume concentration of 3.3%, the curves of R1, R3 (without particle size distribution) gradually diverge from the curves of R2, R (with particle size micro-distribution), indicating that in the raw milk concentration, the influence of the particle size micro-distribution on the composition determination exceeds that of the absorption effect and becomes dominant.
Throughout the process of gradually increasing the volume concentration, the curve of R gradually approaches that of R2, which once again shows that the influence of the particle size micro-distribution should not be ignored during the online monitoring of finished milk.
The influence of the two factors on the scattering–transmission ratio will ultimately be reflected in the calculated values of the concentration. When the wavelength ranges from 800 nm to 1600 nm, neglecting the particle size micro-distribution will result in a higher scattering–transmission ratio and a correspondingly higher calculated concentration value. This phenomenon becomes more pronounced as the solution concentration increases. In this paper, a low-concentration solution is used as an example for experimental verification. At 800 nm, the scattering–transmission ratio of a solution with a milk fat volume concentration c0 = 0.5% (i.e., a mass concentration of 0.45 g/100 mL) is measured, and the measured value is R = 1.2710 ± 0.008. The concentration values under the interference of the two influencing factors are calculated according to the model in this paper, as shown in Table 1. Here, c1 represents a case where both light absorption and particle size distribution are neglected; c2 represents a case where light absorption is neglected but particle size distribution is considered; c3 represents a case where light absorption is considered but particle size distribution is neglected; and c represents a case where both light absorption and particle size distribution are considered. The calculation method that neglects light absorption and considers particle size micro-distribution leads to the largest calculation error. Among the four different calculation methods, the theoretical value obtained by the method that considers both light absorption and particle size micro-distribution is the closest to the experimental value. The degree of closeness of the four calculation results to the experimental value is c > c3 > c1 > c2. In the online monitoring of highly concentrated finished milk, neglecting the particle size micro-distribution and the light absorption of the medium leads to greater deviations in the component detection results.
This joint influence amplifies deviations at high concentrations, suggesting that ignoring either factor can lead to the overestimation of the composition by up to 50% in low-wavelength regimes. Compared to traditional models ignoring micro-distribution, our results highlight the need for integrated approaches that improve accuracy in composition determination, particularly for colloidal solutions. Limitations include the assumption of spherical particles; future work could incorporate experimental validation using dynamic light scattering.
It is noteworthy that Mie theory primarily accounts for intra-particle scattering, while inter-particle multiple scattering effects in dense suspensions (e.g., >3% fat concentration) may introduce additional deviations [33]. As evidenced by the reduced bare transmission at a 3.3% concentration (73.8% vs. 92.3% at 0.5%), photon redirection between droplets becomes non-negligible. Future extensions of this work should incorporate dense media approximations to address this limitation.

4. Conclusions

In this study, we investigated the joint influence of two factors—namely, the particle size micro-distribution remaining after homogenization and the light absorption characteristics of the medium—on the Mie key coefficients and composition determination using the STRD. By modifying the basic STRD model to incorporate the absorption effect, we demonstrated the calculation process of the coefficients in the modified model. Additionally, we deduced the Mie key coefficients, including the particle size micro-distribution, which are core parameters for the STRD method. By analyzing the effective particles extracted from image processing based on the aforementioned models, we evaluated the degree of influence of these two factors on the target method. The results of this study clearly demonstrate that, although the absorption effect increases the scattering-to-transmission ratio, the primary factor affecting the accuracy of the model is the particle size micro-distribution. This finding highlights the need to prioritize particle size distribution for more accurate measurements in complex systems. In the online monitoring of highly concentrated finished milk, neglecting the particle size micro-distribution and the light absorption of the medium leads to deviations in the results. When considering enhancing the accuracy of the STRD method, the influence of the particle size micro-distribution should be taken as the primary factor. The particle size micro-distribution and absorption jointly affect the model’s accuracy, with greater discrepancies at high concentrations and shorter wavelengths. Incorporating both factors enhances its reliability for practical applications. Furthermore, the model’s scope is currently limited to independent scattering regimes. Future work should explore extensions into dense media where inter-particle multiple scattering effects become significant [33]. These enhancements provide a more robust theoretical foundation for the STRD method, particularly in applications involving complex colloidal systems.

Author Contributions

Conceptualization, S.Z.; methodology, S.Z.; software, L.W.; validation, A.L., L.W. and J.W.; formal analysis, J.W.; investigation, S.Z.; resources, X.Y.; data curation, A.L.; writing—original draft preparation, S.Z.; writing—review and editing, A.L.; visualization, L.W.; supervision, J.W.; project administration, X.Y.; funding acquisition, S.Z. All authors have read and agreed to the published version of the manuscript.

Funding

This research was funded by the National Natural Science Foundation Youth Science Fund project, grant numbers 52305566 and 22408027 and the Natural Science Foundation of the Jiangsu Higher Education Institutions of China, grant numbers 23KJB460001 and 23KJB140002.

Data Availability Statement

The data analyzed were derived from the published literature [31]. We did not generate any datasets because our work was conducted using a theoretical and mathematical approach.

Acknowledgments

Special thanks go to my unborn child, Qingzhou Li, for accompanying me day and night.

Conflicts of Interest

The authors declare no conflicts of interest. The funders had no role in the design of the study; in the collection, analyses, or interpretation of the data; in the writing of the manuscript; or in the decision to publish the results.

Abbreviations

The following abbreviations are used in this manuscript:
STRDScattering–Transmission Ratio Composition Determination Method

References

  1. Zhou, Z.; Wu, J.; Su, L.; Li, Z.; Zhao, H. Development of a New Instrument for the Measurement of the Milk Constituents Based on the Embedded System. J. Phys. Conf. Ser. 2007, 48, 1424–1428. [Google Scholar] [CrossRef]
  2. Zhou, Z.; Wu, J.; Li, Z.; Yu, Z. Study on Milk Composition Detection Based on Laser Scattering-Transmission Ratio. Chin. J. Sci. Instrum. 2006, 27, 1185–1186. [Google Scholar] [CrossRef]
  3. Bohren, C.F.; Huffman, D.R. Absorption and Scattering of Light by Small Particles; Wiley: Hoboken, NJ, USA, 1983. [Google Scholar]
  4. Kerker, M. The Scattering of Light and Other Electromagnetic Radiation; Academic Press: Cambridge, MA, USA, 1969. [Google Scholar]
  5. Mie, G. Beiträge zur Optik trüber Medien, speziell kolloidaler Metallösungen. Ann. Phys. 1908, 330, 377–445. [Google Scholar] [CrossRef]
  6. Van De Hulst, H.C. Light Scattering by Small Particles. Phys. Today 1957, 10, 28–30. [Google Scholar] [CrossRef]
  7. Postnov, D.D.; Sosnovtseva, O.; Tuchin, V.V. Dependency of the Optical Scattering Properties of Human Milk on Fat Content and Homogenization. J. Biomed. Opt. 2020, 25, 045001. [Google Scholar] [CrossRef]
  8. Kucheryavskiy, S.; Melenteva, A.; Bogomolov, A. A Monoblock Light-Scattering Milk Fat Percentage and Somatic Cell Count Sensor for Use in Milking Systems. Sensors 2023, 23, 8612. [Google Scholar] [CrossRef] [PubMed]
  9. Bogomolov, A.; Bondarenko, S.; Belikova, V.; Belikov, A. LED-Based Desktop Analyzer for Fat Content Determination in Milk. Sensors 2023, 23, 6861. [Google Scholar] [CrossRef]
  10. Smith, A.; Johnson, B. Particle Size Distribution Effects on the Light Scattering Properties in Non-Diluted Colloidal Suspensions: A Numerical Study. Colloids Surf. A Physicochem. Eng. Asp. 2024, 678, 134567. [Google Scholar] [CrossRef]
  11. Koestner, D.; Stramski, D.; Reynolds, R.A. Assessing the Effects of Particle Size and Composition on Light Scattering Through Measurements of Size-Fractionated Samples. Limnol. Oceanogr. 2019, 64, 2565–2581. [Google Scholar] [CrossRef]
  12. Postelmans, A.; Aernouts, B.; Saeys, W. Estimation of Particle Size Distributions from Bulk Scattering Spectra: Sensitivity to Distribution Type and Spectral Noise. Opt. Express 2018, 26, 15015. [Google Scholar] [CrossRef]
  13. Zhou, Z.; Wen, J.; Qin, Y.; Wang, L. Study on Influencing Factors in Detection of Milk Protein Using Light Scattering Technology. Infrared 2010, 31, 5–8. [Google Scholar] [CrossRef]
  14. Tan, C.; Ji, G.; Tian, X.; Huang, J.; Yu, Z. Research on Milk Fat Testing Technology Based on Laser Scattering-Transmission Ratio. Sci. Technol. Inf. 2008, 31, 2–3. [Google Scholar] [CrossRef]
  15. Li, W.; Xu, L.; Wang, Y.; Riemer, N.; Adachi, K.; Shi, Z.; Zhang, D.; Zheng, Z.; Laskin, A. Microphysical Properties of Atmospheric Soot and Organic Particles: Measurements, Modeling, and Impacts. Npj Clim. Atmos. Sci. 2024, 7, 65. [Google Scholar] [CrossRef]
  16. Kim, H.; Lee, S. The Influence of Particle Number Size Distribution and Hygroscopicity on the Microphysical Properties of Cloud Droplets. Atmos. Chem. Phys. 2025, 25, 5711–5725. [Google Scholar] [CrossRef]
  17. Patel, S.; Gupta, R. Particle Size Amplification of Black Carbon by Scattering Observations. Environ. Res. Lett. 2023, 18, 014001. [Google Scholar] [CrossRef]
  18. Gao, R.; Yin, J.; Liu, R.; Liu, Y.; Li, J.; Dong, L.; Ma, W.; Zhang, L.; Zhang, P.; Tian, Z.; et al. A Novel Particle Size Distribution Correction Method Based on Image Processing and Deep Learning for Coal Quality Analysis Using NIRS-XRF. Talanta 2025, 285, 127427. [Google Scholar] [CrossRef]
  19. Knepp, T.N.; Kovilakam, M.; Thomason, L.; Miller, S.J. Characterization of Stratospheric Particle Size Distribution Uncertainties Using SAGE II and SAGE III/ISS Extinction Spectra. Atmos. Meas. Tech. 2024, 17, 2025–2054. [Google Scholar] [CrossRef]
  20. Stocker, S.; Foschum, F.; Krauter, P.; Bergmann, F.; Hohmann, A.; Scalfi Happ, C.; Kienle, A. Broadband optical properties of milk: Scattering and absorption characteristics measured by integrating sphere and collimated transmission. Appl. Spectrosc. 2017, 71, 951–962. [Google Scholar] [CrossRef]
  21. Zhang, K.; Tran, I.; Tan, S. Characterization of Particle-Size-Based Homogeneity and Mycotoxin Distribution Using Laser Diffraction Particle Size Analysis. Toxins 2023, 15, 450. [Google Scholar] [CrossRef]
  22. Luo, Y.; Dai, L.; Jiang, X.; Fu, X. Measurement of absorption and scattering properties of milk using a hyperspectral spatial frequency domain imaging system. J. Food Meas. Charact. 2022, 16, 753–761. [Google Scholar] [CrossRef]
  23. Gramsch, E.; Oyola, P.; Reyes, F.; Vásquez, Y.; Rubio, M.A.; Soto, C.; Pérez, P.; Moreno, F.; Gutiérrez, N. Influence of Particle Composition and Size on the Accuracy of Low-Cost Sensors for Fine Particulate Matter in Absorbing Media. Front. Environ. Sci. 2021, 9, 751267. [Google Scholar] [CrossRef]
  24. Jain, P.; Sarma, S.E. Light scattering and transmission measurement using digital imaging for online milk analysis. In Proceedings of the SPIE Optical Metrology, Munich, Germany, 23–26 June 2015; Volume 9525, p. 95254A. [Google Scholar] [CrossRef]
  25. Rühle, B.; Krumrey, J.F.; Hodoroaba, V.-D. Workflow towards automated segmentation of agglomerated, non-spherical particles from electron microscopy images using artificial neural networks. Sci. Rep. 2021, 11, 4942. [Google Scholar] [CrossRef] [PubMed]
  26. Zhang, J.; Li, C.; Rahaman, M.; Yao, Y.; Ma, P.; Zhang, J.; Zhao, X.; Jiang, T.; Grzegorzek, M. A Comprehensive Review of Image Analysis Methods for Microorganism Counting: From Classical Image Processing to Deep Learning Approaches. Artif. Intell. Rev. 2022, 55, 2875–2944. [Google Scholar] [CrossRef]
  27. Xin, Q.; Ling, H.Z.; Long, T.J.; Zhu, Y. The rapid determination of fat and protein content in fresh raw milk using the laser light scattering technology. Opt. Lasers Eng. 2006, 44, 858–869. [Google Scholar] [CrossRef]
  28. Min, C. Study on Mechanism and Influence Factors of Optical Measurement of Milk Quality. Ph.D. Thesis, Tianjin University, Tianjin, China, 2007; pp. 68–73. [Google Scholar] [CrossRef]
  29. Yin, J.; Zhang, S.; Yang, H.; Wang, L.; Zhou, Z. Influence of Fat Particle Size on Light Scattering Properties in Milk Quality Testing. In Proceedings of the International Conference on Instrumentation & Measurement, Harbin, China, 18–20 September 2014; IEEE: Piscataway, NJ, USA; pp. 740–744. [Google Scholar] [CrossRef]
  30. Yin, J.; Zhang, S.; Yang, H.; Zhou, Z. Theoretical Study of the Effect of Multi-Diameter Distribution on the Mie Scattering Characteristics of Milk Fat. J. Harbin Inst. Technol. (New Ser.) 2015, 6, 115–120. [Google Scholar] [CrossRef]
  31. Zhang, S. Research on the Influence of Milk Fat Particle Size Distribution on Component Detection. Master’s Thesis, L Harbin University of Technology, Harbin, China, 2016; pp. 25–27. [Google Scholar] [CrossRef]
  32. Michalski, M.-C.; Camier, B.; Briard, V.; Leconte, N.; Gassi, J.-Y.; Goudédranche, H.; Michel, F.; Fauquant, J. The Size of Native Milk Fat Globules Affects Physico-Chemical and Functional Properties of Emmental Cheese. Le Lait. 2004, 84, 343–358. [Google Scholar] [CrossRef]
  33. Jaksch, S.; Pipich, V.; Frielinghaus, H. Multiple scattering and resolution effects in small-angle neutron scattering experiments calculated and corrected by the software package MuScatt. J. Appl. Crystallograph. 2021, 54, 1580–1593. [Google Scholar] [CrossRef] [PubMed]
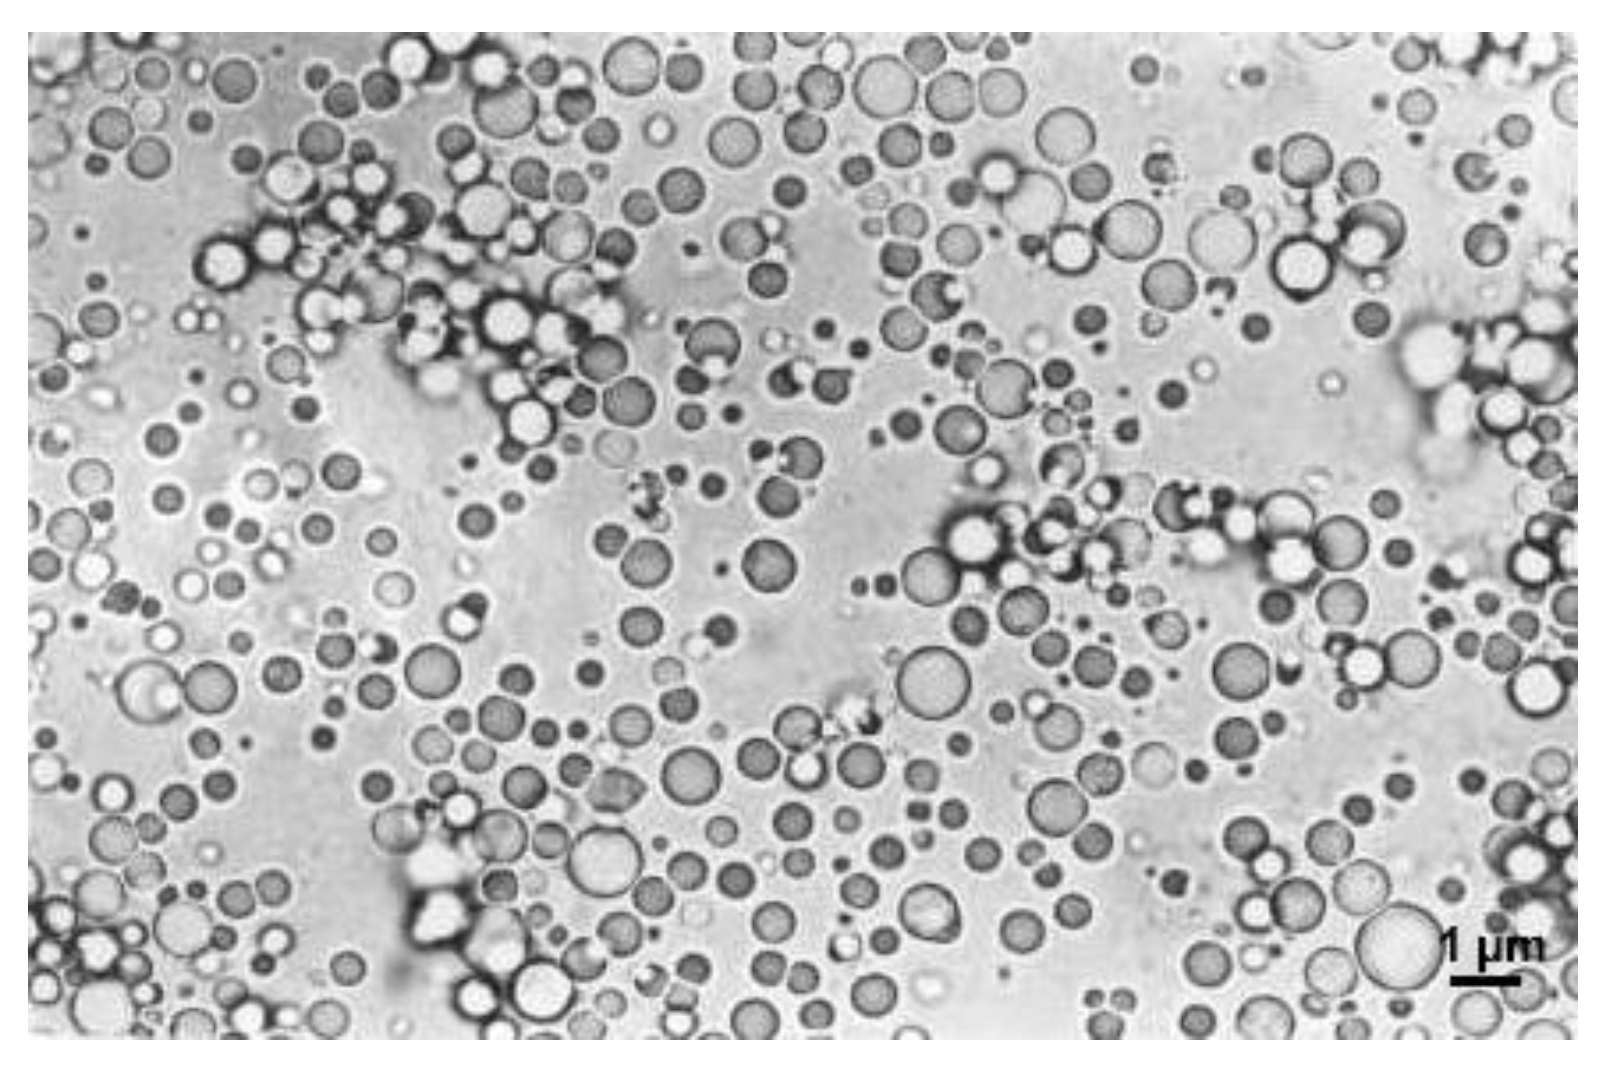
Figure 1. Image of fat particles in the emulsion, taken under electron microscope [28].
Processes 13 02846 g001
Figure 2. The scattering coefficient and absorption coefficient of milk fat particles in the models of Dm, D(4,3), D(3,2), and D ¯ at 800 to 2600 nm with fat volume concentrations of (a) 0.5%, (b) 1.6%, and (c) 3.3% [31], where Dm = particle size micro-distribution; D(4;3) = volume mean diameter; D(3;2) = Sauter mean diameter; and D ¯ = number mean diameter.
Processes 13 02846 g002
Figure 3. Influence of particle size micro-distribution on the composition determination model without considering the absorption effect.
Processes 13 02846 g003
Figure 4. Influence of considering the absorption effect on the composition determination model when ignoring particle size micro-distribution.
Processes 13 02846 g004
Figure 5. Comparison of the joint influence of particle size micro-distribution and the absorption effect on composition determination.
Processes 13 02846 g005
Figure 6. The ratio of scattering intensity to transmission intensity for each volume concentration, where R1 = ignores light absorption and particle size micro-distribution; R2 = ignores light absorption but considers particle size micro-distribution; R3 = considers light absorption but ignores particle size micro-distribution; and R = considers light absorption and particle size micro-distribution. (a) volume concentration of 0.5%, (b) volume concentration of 1.6%, (c) volume concentration of 3.3%.
Processes 13 02846 g006
Table 1. The calculation results of fat volume concentration, where c0 = the experimental value of concentration; c1 = ignores light absorption and particle size micro-distribution; c2 = ignores light absorption but considers particle size micro-distribution; c3 = considers light absorption but ignores particle size micro-distribution; and c = considers light absorption and particle size micro-distribution.
Rc0c1c2c3c
Fat volume
concentration(%)
R = 1.2710 ± 0.0080.500.8671.4170.2520.412
Disclaimer/Publisher’s Note: The statements, opinions and data contained in all publications are solely those of the individual author(s) and contributor(s) and not of MDPI and/or the editor(s). MDPI and/or the editor(s) disclaim responsibility for any injury to people or property resulting from any ideas, methods, instructions or products referred to in the content.