Article

Multi-Objective Cooperative Optimization Model for Source–Grid–Storage in Distribution Networks for Enhanced PV Absorption

1
Jinan Power Supply Company of State Grid Shandong Electric Power Company, Jinan 250013, China
2
Department of Electrical Engineering, School of Electrical and Electronic Engineering, Shandong University of Technology, Zibo 255049, China
*
Author to whom correspondence should be addressed.
Processes 2025, 13(9), 2841; https://doi.org/10.3390/pr13092841
Submission received: 8 August 2025 / Revised: 27 August 2025 / Accepted: 29 August 2025 / Published: 5 September 2025
(This article belongs to the Section Energy Systems)

Abstract

High penetration of distributed photovoltaics (DPV) in distribution networks can lead to voltage violations, increased network losses, and renewable energy curtailment, posing significant challenges to both economic efficiency and operational stability. To address these issues, this study develops a coordinated planning framework for DPV and energy-storage systems (ESS) that simultaneously achieves cost minimization and operational reliability. The proposed method employs a cluster partitioning strategy that integrates electrical modularity, active and reactive power balance, and node affiliation metrics, enhanced by a net-power-constrained Fast-Newman Algorithm to ensure strong intra-cluster coupling and rational scale distribution. On this basis, a dual layer optimization model is developed, where the upper layer minimizes annualized costs through optimal siting and sizing of DPV and ESS, and the lower layer simultaneously suppresses voltage deviations, reduces network losses, and maximizes PV utilization by employing an adaptive-grid multi-objective particle-swarm optimization approach. The framework is validated on the IEEE 33-node test system using typical PV generation and load profiles. The simulation results indicate that, compared with a hybrid second-order cone programming method, the proposed approach reduces annual costs by 6.6%, decreases peak–valley load difference by 22.6%, and improves PV utilization by 28.9%, while maintaining voltage deviations below 6.3%. These findings demonstrate that the proposed framework offers an efficient and scalable solution for enhancing renewable hosting capacity, and provides both theoretical foundations and practical guidance for the coordinated integration of DPV and ESS in active distribution networks.

1. Introduction

The strategic deployment involved in achieving peak carbon emissions and carbon neutrality has laid a solid policy foundation and created a favorable development environment for the adjustment of China’s energy structure [1,2]. Distributed photovoltaic systems featuring cleanliness, pollution-free operation, flexible scale adjustment, high system safety, and excellent peak-regulating performance have consequently become a core component of China’s renewable energy system in recent years [3].
In power system research, the concept of “cluster”—defined as a logical aggregation of multiple functionally similar components—has been widely adopted to manage the complexity introduced by distributed energy integration. Reference [4] pioneered the application of the cluster concept to power systems, defining it as a network structure integrating generation, storage, consumption, and distribution units to ensure grid stability. Building upon this, Reference [5] specifically proposed a distributed energy cluster framework for distribution networks, emphasizing that clusters possess inherent power balance capabilities and intra-cluster communication functions, such as the capacity to coordinate power redistribution to mitigate voltage violations through internal power flow management. However, the continuous expansion of distributed photovoltaic integration into distribution networks has concurrently exposed significant technical challenges. These include difficulties in the local consumption of renewable energy, issues with power reverse flow, increased network losses, and violations of voltage limits [6,7]. Such problems not only undermine the operational reliability of distribution networks but also restrict the efficient utilization of new energy sources, making the development of systematic planning strategies an urgent priority [8].
Current research addressing these challenges through cluster partitioning primarily focuses on two dimensions: evaluation metrics and methodological approaches. Regarding metrics, studies such as Reference [9] utilize intra/inter-cluster electrical distance calculations, while Reference [10] suggests incorporating factors like regulation costs, response characteristics, and geographic location. Common partitioning methods involve clustering and optimization algorithms, with References [11,12,13] applying techniques like partitioning clustering, affinity propagation, and Fast Unfolding algorithms to distributed energy clustering, respectively. Furthermore, effective cluster partitioning for operational optimization must align with dispatch center requirements concerning new energy utilization efficiency and network loss control, necessitating pre-optimization of the DPV cluster output [14]. Strategies have been proposed to optimize new energy output, such as coordinated dispatch for wind–solar–thermal-storage systems [15], combining new energy consumption with economic costs using flexible resources [16], and balancing grid operational economy with new energy utilization through energy-storage allocation [17].
In recent years, a large number of studies have adopted bi-level optimization models for distribution network planning with DPV and ESS. Reference [18] constructed a bi-level programming model considering the demand response of the user side. The upper layer selected the location and capacity of the distributed power supply, and the lower layer considered the operation of the energy-storage device, which realized the joint planning of the source and storage. In Reference [19], the double-layer nested particle-swarm optimization algorithm was used to optimize the capacity and location of photovoltaic and energy storage with the goal of minimizing the annual comprehensive cost and network loss, which effectively improved the proportion of photovoltaic consumption. In Reference [20], the cost objectives of the microgrid and distribution network are considered in the upper and lower layers, respectively, through the bi-level optimal configuration method, and the feasibility of the model is verified by practical examples. Based on time-of-use electricity price, a bi-level optimization model, with photovoltaic consumption rate and voltage deviation as the objectives, is established in [21], and solved by parallel double quantum differential evolution algorithm. Overall, the existing studies address the joint planning of distributed photovoltaics and energy storage from various perspectives, effectively mitigating the adverse impacts of high PV penetration. However, most works neglect the role of cluster division and its correlation with network operation, leading to incomplete analysis and results. Hence, it is necessary to further investigate joint PV–storage optimization models that incorporate cluster division in both the planning and operation stages.
Despite existing advancements, research on decentralized solar–storage hybrid systems in distribution networks still exhibits notable limitations. Cluster partitioning metrics often focus excessively on electrical connectivity while neglecting critical aspects such as power balance and scale rationality, resulting in poor coordination between nodes within clusters. Additionally, insufficient integration between the planning and operational optimization phases hinders the ability to simultaneously address both economic efficiency and technical performance in the configuration of DPV and energy-storage systems. To address these gaps, this study proposes a comprehensive solution that tackles both the planning and operational challenges of distributed photovoltaic andenergy-storage systems in distribution networks. First, we develop a detailed cluster partitioning index that accounts for multiple factors: modularity based on electrical distance, active and reactive power balance metrics, and node affiliation for scale control. The Fast-Newman Algorithm is enhanced with a net-power constraint to achieve more rational clustering of the distribution network. Second, we propose a bi-level configuration model for the joint planning and operation of DPV and ESS systems. The first planning layer optimizes the siting and sizing of DPV and ESS units to minimize annualized costs, while the second operation layer refines ESS operation strategies, balancing multi-objective trade-offs such as voltage deviation suppression, loss reduction, and PV utilization maximization, using an adaptive multi-objective particle-swarm optimization algorithm.
To bridge the gap between planning and operation, we integrate the two via a bi-directional information flow: the planning layer proposes siting and sizing candidates, along with associated cost parameters, and the operation layer evaluates these candidates under voltage-deviation, network loss, and PV-utilization objectives, returning performance signals to guide subsequent planning iterations. This bi-level approach effectively closes the planning–operation gap, ensuring that investment decisions reflect both operational feasibility and benefits.

2. Metrics and Algorithms for Distribution Network Clustering

2.1. Cluster Division Principle

Incorporating distributed power sources into cluster divisions necessitates adaptation to dynamic operational conditions. To ensure the reliability and practicality of division outcomes, clusters must meet both logical and functional criteria. This paper explores the integration of high-penetration distributed photovoltaic systems into a typical distribution network through cluster division. In addition to the conventional logical and structural requirements, the uneven distribution of photovoltaic capacity necessitates the use of a power balance index to define clusters, thereby enhancing node coordination. Consequently, this investigation applies modularity depending on electrical distance and power balance aspects, whereas the scale index is integrated to limit the cluster size.

2.2. Cluster Division Indicators

2.2.1. Modularity Index Derived from Electrical Distance

The process of cluster division must consider the electrical connectivity between nodes. Electrical distance assesses the magnitude of electrical coupling between nodes, hence denoting the level of their electrical interconnection. Depending on its definition, electrical distance offers a quantitative assessment of the strength of electrical parameter linkages between nodes, making it a widely used metric for evaluating electrical coupling. Electrical distance is typically calculated using either impedance or sensitivity methods. However, as impedance is a static parameter reflecting fixed network configuration and fails to capture dynamic network characteristics, this paper employs sensitivity to compute electrical distance, using the following formulas:
Δ P Δ Q = H N J L Δ θ Δ V
Δ V = S V Q Δ Q = S V Q = L J H 1 N 1 Δ Q
d i j   =   log S V Q , j j S V Q , i j
It is assumed that there are n nodes in the network, and the Euclidean distance is applied to define the electrical separation eij between node i and node j:
e i j   =   d i 1 d j 1 2 + d i 2 d j 2 2 + + d i n d j n 2
Furthermore, to quantify intra-cluster cohesion and inter-cluster separation, modularity—a partitioning metric based on electrical distance—is introduced. First proposed by Girvan and Newman [22], modularity quantifies the strength of community structures in complex networks. This metric inherently accounts for intra-cluster versus inter-cluster connection density, cluster size, and cluster count. Modularity is calculated as shown in Equation (5).
ρ m = 1 2 m i S j S A i j κ i κ j 2 m δ ( i , j )
δ ( i , j ) = 1 , The   same   cluster 0 , Otherwise  
m = i S j S A i j / 2
κ i = j S A i j
where ρm is the modularity metric; Aij is the weight of the edge connecting vertex i and node j; m represents the total edge weight of the network graph; S is the set of system nodes; κi represents the weighted degree of centrality of node i, defined as the summation of all edge weights incident to node i; and δ(i, j) is the cluster discrimination function.
The edge weight Aij and electrical distance eij satisfy the following relation:
A i j = 1 e i j max ( e i j )
where max (eij) represents the largest element in the electrical distance matrix eij.
And, the modularity index quantitatively measures the quality of cluster division in power networks. A higher modularity index signifies tighter electrical connections among nodes within a cluster and looser connections between clusters, indicating stronger structural strength and a more reasonable division plan. Therefore, maximizing the modularity ρm can lead to the optimal cluster division plan.

2.2.2. Cluster Power Balance Metrics

Functionally, the active balance degree is employed as a cluster division metric to minimize inter-cluster active power flows and maximize self-consumption capacity, thereby reducing solar power curtailment. A higher value signifies stronger supply–demand matching within clusters, which mitigates photovoltaic output uncertainty and volatility. The active balance degree is defined as follows:
P k = 1 1 T t = 1 T P k , t max P k , t φ P = 1 N k k = 1 N k P k
where Pk signifies the active power balance value of the c-th cluster; Nk is the quantity of clusters k; Pk,t represents the net power balance for microgrid cluster k during time interval t; T is the system simulation time period; and φP is the active balance degree index of the cluster. Degree of active balance φP aims to balance the net power complementary level between nodes in the network to achieve the effect of fully utilizing the cluster autonomy.
Likewise, the cluster reactive power balance degree metric is formulated as
φ Q = 1 N k k = 1 N k ( 1 1 T t = 1 T Q need Q sup )
In the formula, φQ refers to the cluster reactive power balance index; Qneed and Qsup refer to the demand value of the reactive power and the maximum value of reactive power supply inside the cluster.
It should be noted that there is a fundamental distinction between the demand value of reactive power and the reactive power supply. Qneed is determined by the reactive requirements of loads within the cluster and represents an inflexible demand that must be satisfied to maintain voltage stability. In contrast, Qsup denotes the maximum available reactive power support from resources such as PV inverters, ESS inverters, and compensation devices, which are constrained by their technical limits. Therefore, the reactive power balance index reflects the extent to which internal resources can meet the demand, and the difference between Qneed and Qsup directly indicates the remaining reactive support that must be compensated externally.

2.2.3. Node Affiliation Metrics

Balanced sub-cluster sizing significantly impacts subsequent optimization and control feasibility. Size-uniform clusters reduce optimization model complexity, accelerate solution times, and maintain consistent mathematical dimensionality in cluster architectures. Consequently, appropriate cluster sizing is essential for operational efficacy. The αP indicates the strength of mutual influence among nodes within a sub-zone, which helps balance the number of nodes and photovoltaic installations. The range of values is [0, 1), with a larger αP signifying a more rational sub-zone. The βP represents the strength of mutual influence between different nodes within a sub-zone, preventing the unreasonable sub-zone configurations that occur due to imbalanced node and photovoltaic installation numbers. The value interval is (0, 1], with a lower βP denoting a more rational sub-zone. To evaluate post-partition size distribution, this work proposes the scale sensitivity index φM.
φ M = α P + β P = k = 1 n i Φ k j Φ k A P , i j 2 i = 1 N j = 1 N A P , i j 2 k = 1 n R K 2 + β P
β P = k = 1 n i Φ k j Φ k A P , i j 2 i = 1 N j = 1 N A P , i j 2 k = 1 n | R k | | N R k | , R k < N 1 , R k = N
where n represents the cardinality of the partition set; Φk denotes the bus set in control area k; Rk represents the count of nodes in cluster k; and N represents the total number of nodes.

2.2.4. Comprehensive Performance Indicators

Both the modularity and the power balance indices range between 0 and 1. Higher modularity values indicate stronger intra-cluster electrical coupling. Similarly, a higher active power balance index reflects minimized net power exchange with external clusters and enhanced self-consumption capability. To holistically evaluate cluster performance, we propose the following comprehensive index formula:
φ = ω 1 ρ m + ω 2 φ P + ω 3 φ Q + ω 4 φ M
In the formula, ω1, ω2, ω3, and ω4 are the weights of degree index, active power balance index, reactive power balance index, and node membership function, which satisfy 0 ≤ ω1, ω2, ω3, ω4 ≤ 1, and the sum of them is 1.
During cluster delineation, decision-makers may assign varying weights to each performance indicator according to specific operational priorities. This flexibility enables tailored partitioning outcomes aligned with distinct optimization objectives. In this study, the weights (ω1, ω2, ω3, and ω4) are determined using the analytic hierarchy process (AHP) [23], which combines expert judgment and pairwise comparison to reflect the relative importance of modularity, active power balance, reactive power balance, and node scale uniformity. For the case study, an equal weighting scheme (ω1 = ω2 = ω3 = ω4 = 1/4) is adopted to ensure fairness among different indicators and to avoid bias toward a single criterion. To validate the robustness of this choice, a sensitivity analysis was conducted by varying the weights within ±20%. As shown in Table 1, the equal-weight scheme yields the highest comprehensive index φ, while other perturbed weight combinations result in only minor decreases (within 2%). This confirms that the equal-weight approach is both reasonable and practical, while the framework remains flexible to accommodate different weighting strategies in future applications, depending on operator priorities.

2.3. Distribution Network Clustering Method

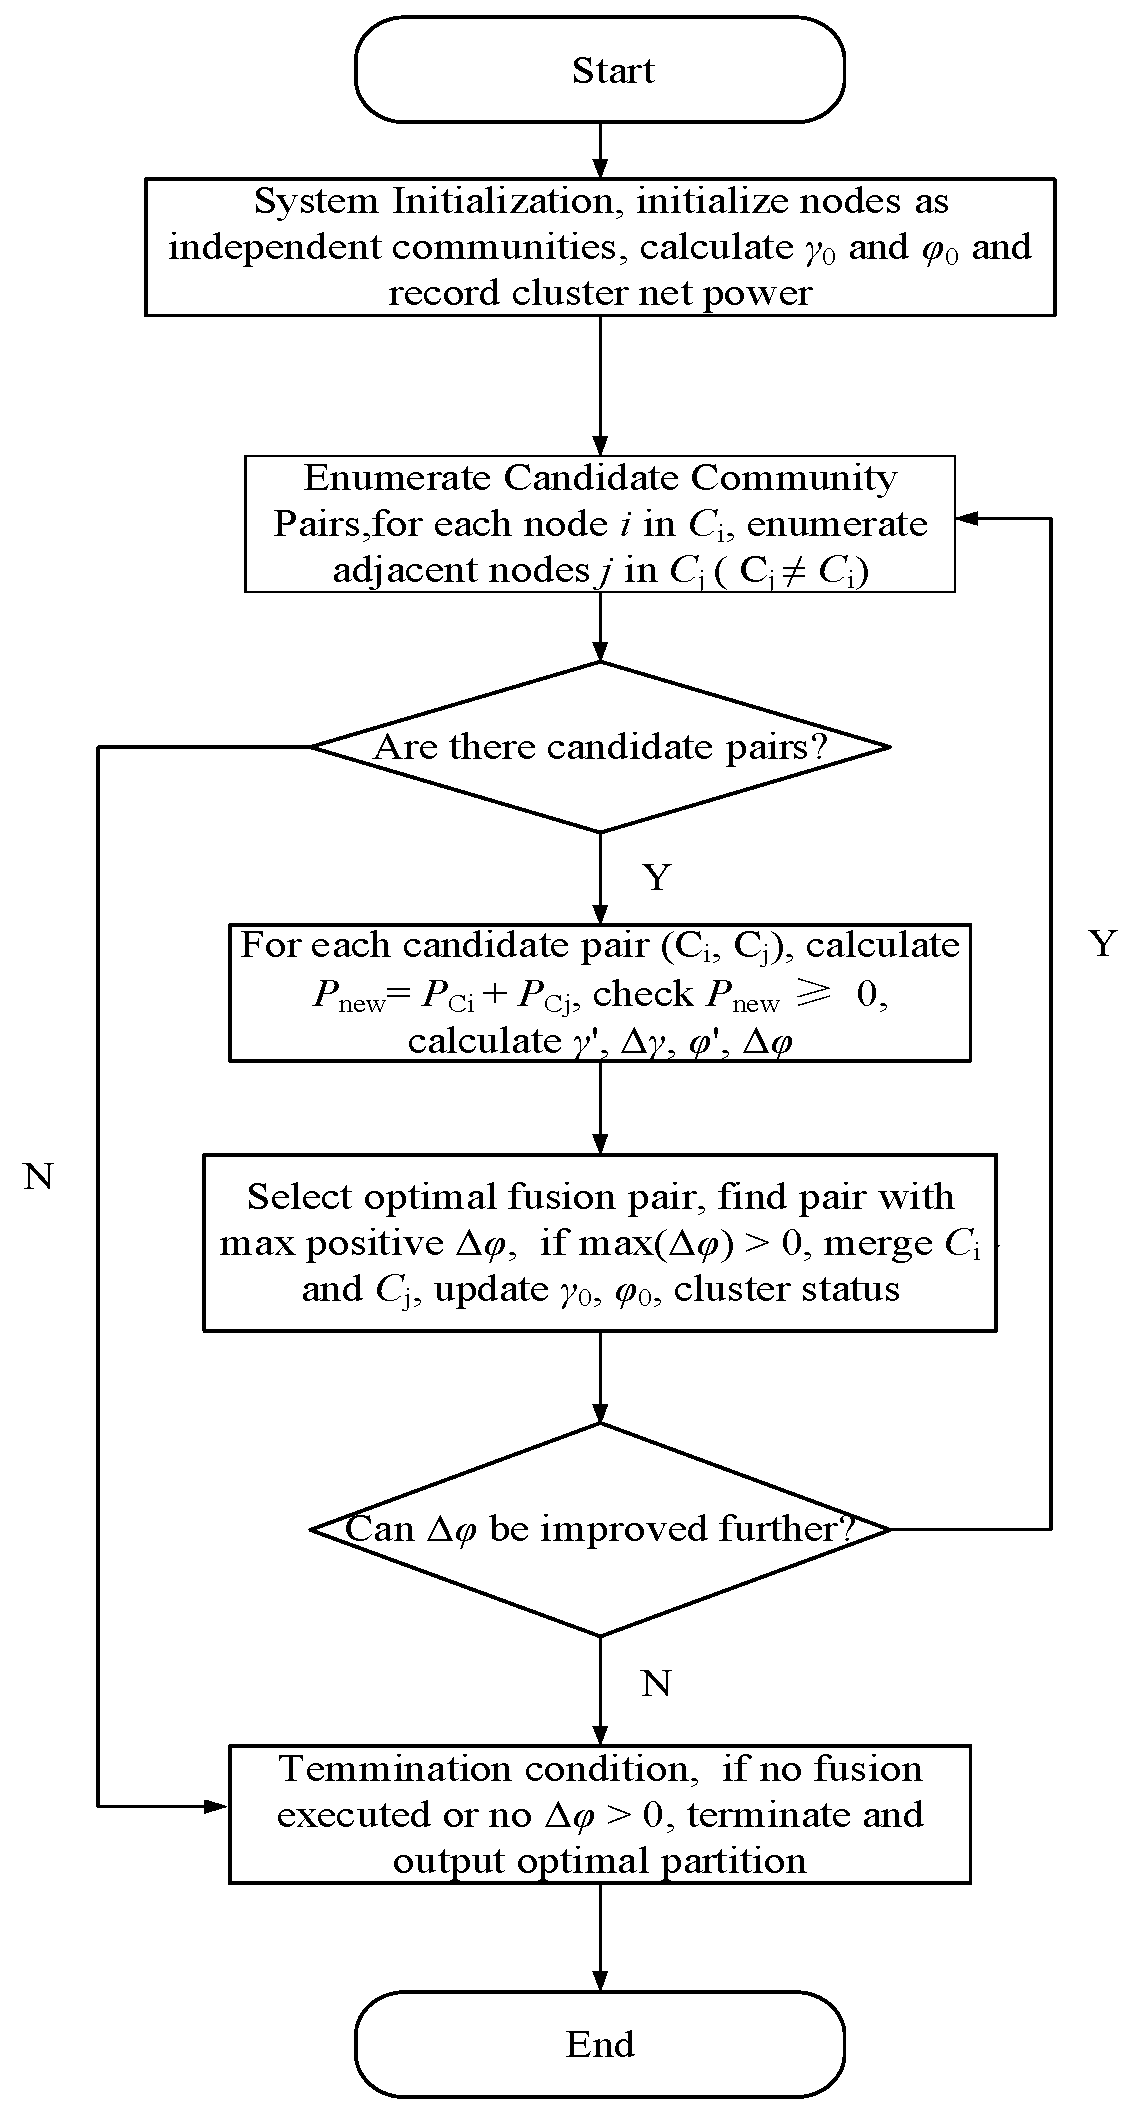
The cluster partitioning adopts an improved fast-Newman community detection (FN-CD) algorithm that selects fusion pairs. The complete algorithm procedure is presented in Figure 1, with implementation details as follows:
Step 1: System Initialization: Treat each node as an independent community. Calculate the comprehensive electrical distance γ0 (an overall indicator reflecting the strength of electrical association between clusters under the initial partition, calculated by integrating parameters such as branch impedance and voltage sensitivity; smaller values indicate tighter electrical connections between clusters) and the comprehensive index φ0. Meanwhile, record the nodes contained in each community and their net power (based on node load and distributed PV output).
Step 2: Candidate Community Pair Evaluation: Iterate over all neighboring community pairs (Cᵢ, Cⱼ) and perform the following operations. (a.) Compute the merged net power: Pnew = PCi + PCj. (b.) In the net power constraint check, if Pnew < 0, skip this candidate pair. (c.) Simulate merging Cᵢ and Cⱼ into a new community Cᵢⱼ. (d.) Calculate the new comprehensive index φ′ under the updated partition. (e.) Compute the comprehensive index gain, Δφ = φ′ − φ0.
Step 3: Select the Best Merge: From all candidate pairs that satisfy the net power constraint, select the community pair with the maximum Δφ. If max (Δφ) > 0, formally merge the selected pair and update the community structure, net power, and network indicators (γ0 = γ′, φ0 = φ′).
Step 4: Termination Check: If no feasible community pair exists that yields Δφ > 0, the algorithm terminates and returns the current partition with the highest comprehensive index.
Step 5: Output: Return the final community partition result.
Figure 1. Flow chart of the cluster partition algorithm.
Processes 13 02841 g001
The pseudocode of the algorithm is shown in Algorithm 1.
Algorithm 1. Improved Fast-Newman Community Detection (FN-CD) Algorithm
Input: Distribution network graph G (N, E)
Output: Optimal community partition C*
Step 1: Initialization
Treat each node as an independent community
Compute initial comprehensive electrical distance γ0
Compute initial comprehensive index φ0
Record nodes and net power of each community
Step 2: Candidate Community Pair Evaluation
For each neighboring community pair (Ci, Cj):
a. Compute merged net power P_new = PCi + PCj
b. If Pnew < 0, skip this pair
c. Simulate merge to form Cij
d. Calculate new comprehensive index φ′
e. Compute index gain Δφ = φ′ − φ0
Step 3: Best Merge Selection
From feasible pairs, select (Ci, Cj) with maximum Δφ
If max (Δφ) > 0:
Perform formal merge of (Ci, Cj)
Update community structure, net power, γ0 ← γ′, φ0 ← φ′
Step 4: Termination Check
If no feasible pair yields Δφ > 0, terminate
Return the partition with maximum φ
Step 5: Output
Return final optimal community partition C*
The FN-CD algorithm is selected in this study because it maximizes modularity while maintaining relatively low computational complexity, which makes it suitable for large-scale and sparse distribution networks. Compared with K-means, spectral clustering, or affinity propagation methods, the FN-CD algorithm does not require predefining the number of clusters and is capable of automatically detecting community structures that align with electrical connectivity. This property is particularly valuable in distribution systems, in which the underlying network topology and electrical distance dictate natural groupings.
In the implementation, each node is initially treated as an independent cluster, and the modularity index is calculated based on electrical distance. Candidate cluster pairs are then iteratively merged according to the maximum improvement in the comprehensive index, while a net power balance constraint is applied to ensure that each merged cluster maintains a feasible active power exchange. The algorithm terminates when no further positive modularity gain can be achieved, and the division with the highest comprehensive index is selected as the final clustering result. This process ensures that the derived clusters exhibit strong intra-cluster electrical coupling, balanced power distribution, and rational scale, thereby providing a solid foundation for subsequent optimization and control.

3. Research on Joint Planning of Distributed Photovoltaic and Energy Storage

This chapter integrates the economic and safety-related aspects of the distribution grid, along with the absorption ratio of DPV, to develop a strategy model within the framework of planning and operational processes for distribution networks. The first model, namely the planning layer, incorporates system planning costs to determine the placement and capacity of the DPV and energy-storage assets. The second-level model, the operational layer, aims to ensure voltage safety, optimize the absorption ratio of new energy, and minimize system network losses, thereby determining the operational strategies for energy storage. To solve this model, an enhanced two-layer self-adjusting lattice particle-swarm optimization algorithm is utilized. Using a cluster division of the IEEE33 node example, the solution is compared with the currently popular second-order cone mixed algorithm for energy-storage configuration, in order to confirm the feasibility of the model.

3.1. Overview of Double Layer Optimization

The two levels interact through bidirectional feedback, with the first setting decision variables for the second, and the second returning its solution to inform subsequent decisions, achieving a joint optimal solution through iterative convergence. The basic mathematical model is shown in Formula (15):
min x X , y Y F ( x , y ) s . t . y arg min y Y f ( x , y ) : g i ( x , y ) 0 , i = 1 , 2 , 3 , , n G j ( x , y ) 0 , j = 1 , 2 , 3 , , n
In the formula, F(x, y) serves as the objective function at the first level; Gj (x, y) represents the j-th constraint within the first level; f(x, y) represents the second-level objective function; gi(x, y) represents the i-th constraint of the second level; and x and y ∈ R, where x represents the first-level decision variable and y represents the second-level decision variable.

3.2. Distributed Photovoltaic and Energy Storage Joint-Optimization Configuration Model

This paper develops a two-layer model to realize the collaborative configuration. Herein, formulated to pinpoint the optimal installed capacity and placement of DPV and energy-storage facilities, the first-level model seeks to minimize the system’s yearly all-in operational costs. From the perspective of planning endeavors, it takes the siting and capacity of photovoltaics and ESS as decision variables. The second-level model focuses on certain factors, among which are network loss, voltage deviation, and the absorption rate of DPV in the distribution network, with the energy-storage output serving as its decision variable. Through two-layer optimization, a joint planning and configuration strategy for DPV and energy storage is ultimately derived. In order to handle the large variable count in the established planning and operation joint-optimization model, an improved particle-swarm optimization method and a self-adjusting lattice particle-swarm two-layer optimization algorithm are employed for solution. The dual layer optimization logic structure diagram for the joint configuration of DPV and energy storage is set out below in Figure 2.

3.2.1. Optimizing the Objective Function of the Planning-Layer Model

The first layer primarily focuses on the planning level, aiming to optimize the financial viability of the power distribution network investment operators. As illustrated in Figure 2, which outlines the dual-layer optimization logic structure for DPV and ESS configurations, the first-level model ascertains the load-bearing capability and spatial placement of DPV and ESS. The configuration scheme determined by the first model is then passed to the second layer, which optimizes the overall operation. The first layer is intended to optimize the net costs of DPV and ESS, with the goal of minimizing these costs for the benefit of investors in the distribution network. The mathematical model for this optimization is as follows:
min   F p = F inv + F om + F buy F rev
In the formula, Fp is the total yearly comprehensive operation net cost; Finv represents the total of all investment expenditures of the DPV and ESS operator; Fom stands for the aggregate of the operational and maintenance expenditures; Fbuy corresponds to the expense of purchasing electricity from the first-level distribution network; and Frev corresponds to the revenue from photovoltaic feed-in to the higher-level grid.
(1) The yearly equivalent expense associated with the investment and construction of DPV and ESS amounts to
F inv = F inv , PV + F inv , ESS
where Finv,PV is the capital input cost of distributed photovoltaic; Finv,ESS corresponds to the capital input cost for energy storage.
Given the service lives of DPV systems and their integrated energy-storage systems, and in consideration of the capital recovery coefficients and depreciation rates of these systems, it is essential to take their service life into account when calculating the investment costs. The mathematical models for the conversion coefficients of DPV and energy storage are presented in Equation (18):
R PV = r PV ( 1 + r PV ) y PV ( 1 + r PV ) y PV 1 R ESS = r ESS ( 1 + r ESS ) y ESS ( 1 + r ESS ) y ESS 1
where rPV is the discount rate of distributed DPV; rESS is the discount rate of ESS; RPV is the conversion coefficient of distributed DPV; RESS is the conversion coefficient of ESS; yPV is the serviceable lifespan of DPV; and yESS is the serviceable lifespan of ESS.
F inv , P V = R PV C inv , P V E inv , P V F i n v , E S S = R ESS C i n v , E S S E i n v , E S S
where Cinv,PV and Cinv,ESS are the unit capacity investment costs associated with photovoltaic and energy-storage systems; Einv,PV and Einv,ESS are the photovoltaic installation capacity and the grid-connected capacity of ESS.
(2) The operational and upkeep expenses of first DPV and energy storage are
F om = C PV + C ESS + C q + C loss
where CPV and CESS correspondingly denote the maintenance costs of DPV and ESS; Closs indicates the cost associated with network losses; and Cq represents the light-waste cost of the system.
The maintenance costs associated with DPV and energy-storage facilities are
C P V = 365 s = 1 N s ω s t = 1 24 i PV f mit , P V P i , s , t PV Δ t
C E S S = 365 s = 1 N s ω s t = 1 24 i E S S f m i t , ESS P i , s , t E S S + + P i , s , t E S S Δ t
where fmit,PV and fmit,ESS represent the operating costs per unit capacity for PV and energy-storage systems, respectively; P i , s , t PV , P i , s , t E S S + , and P i , s , t E S S correspond to the active power outputs of the photovoltaics, as well as the power of the energy-storage batteries under scenario s.
The expense incurred from curtailment of photovoltaic power is
C q = 365 s = 1 N s ω s t = 1 24 i Ω P V f P V cut P s , t PV , max P s , t PV Δ t
In the formula, ωs denotes the weight of the s scenario; f P V cut is the cost generated by unit light loss; P s , t PV , max and P s , t PV , respectively, represent the peak active power yield and the real-time active power yield of the DPV unit.
Network loss cost is
C loss = 365 C price t = 1 T l = 1 N l R l I l , t 2
In the formula, Cprice is the time-sharing price of electricity purchased online; Rl represents the ohmic resistance of the system branch; and Il,t represents the current of the system branch l.
(3) The expense of procuring electricity from the first-level power grid is
F buy = 365 s = 1 N s ω s t = 1 24 f t buy P t l Δ t
In the formula, P t l is the power exchanged among the distribution networks; f t buy represents the electricity procurement price.
(4) The revenue from photovoltaic feed-in to the higher-level grid is
F rev = 365 s = 1 N s ω s t = 1 24 ( f t PV , grid + f t subsidy ) P PV , grid , s , t Δ t
P PV , grid , s , t = max ( P PV , total , s , t P PV , self , s , t , 0 ) P PV , total , s , t = P PV , max , s , t P PV , curtail , s , t P PV , self , s , t = P load , PV , s , t + P ESS , charge , PV , s , t
where f t PV , grid represents the time-of-use on-grid price at time t; f t subsidy represents the subsidy per kilowatt-hour for photovoltaic power; PPV,grid,s,t represents the photovoltaic grid-connected power; PPV,total,s,t represents the actual total photovoltaic power generation; and PPV,self,s,t indicates the local consumption power of photovoltaic power.

3.2.2. Optimizing the Constraint Conditions of the Planning-Level Model

(1)
Node-level power equilibrium constraint.
P i j = 1 N e i G i j e j B i j f j + f i G i j + B i j e j = 0 Q i j = 1 N f i G i j e j B i j f j e i G i j f j + B i j e j = 0
In the formula, Pi and Qi refer to the active electrical power and reactive electrical power at the system nodes; Gij and Bij refer to the conductance and susceptance of the branch between node i and node j; and ei + fi refers to the voltage at node i.
(2)
Voltage constraints.
U i min U i U i max
where U i min and U i max are the second and first limits of the node voltage.
(3)
Line current constraint.
I i I i , max
where Ii,max indicates the maximum permissible current through the line associated with node i.
(4)
Distributed photovoltaic access capacity constraints.
P i P i , max
where Pi,max is the maximum power of DPV allowed to access by branch i.
(5)
Permeability constraint of DPV access.
i = 1 N i P i η P load
In the formula, Pi denotes the active electrical power of branch i; η is the proportion of the total DPV capacity to the total load; and Pload is the load power accessing the system.
(6)
DPV installation total capacity constraint.
E inv , PV η P load
In the formula, Pload stands for the total active power load of the connected system.
0 P i , s , t PV P i , s , t PV , max
where P i , s , t PV denotes, respectively, the photovoltaic active power output; P i , s , t PV , max stands for the maximum photovoltaic active power output.

3.2.3. Optimizing the Objective Function of the Operational-Level Model

Based on the dual-layer optimization logic structure diagram of DPV and energy-storage configuration, after the first layer optimizes and determines the configuration scheme, it passes the configuration capacity and location to the second layer. The second layer then optimizes the ESS’s capacity and location based on the parameters determined in the first layer, aiming to minimize voltage deviation, reduce network losses, and maximize the absorption ratio of DPV. The mathematical model is as below:
min ( F 1 , F 2 , F 3 ) s . t . g ( x ) 0
In the formula, F1 is the minimum voltage deviation at nodes; F2 is the maximum absorption rate of DPV; and F3 denotes the minimum network loss.
(1)
Node-level power equilibrium constraint.
F 1 = s = 1 N s t = 1 24 i Ω b u s ω s U i , s , t U i , N N b u s U i , N
In the formula, Ui,s,t and Ui,N denote, respectively, the actual voltage magnitude and rated voltage magnitude.
(2)
Distributed photovoltaic has the largest consumption ratio.
Owing to the joint connection of DPV and energy storage, the ESS can increase the proportion of DPV consumption. To measure this proportion, the curtailment rate after the integration of DPV is used as a metric. Considering economic factors, the goal function is set to minimize the expenditure of curtailed light. The cost of curtailed light is calculated as follows:
F 2 = C qg = 365 s = 1 N s ω s t = 1 24 i Ω P V f pv cut P s , t PV , max P s , t PV Δ t
(3)
The distribution network loss is minimal.
When planning DPV combined energy storage, the power loss can be efficiently mitigated, and the minimum cost of the power loss serves as the objective function. The cost associated with network losses in the distribution network is
F 3 = C loss = 365 C price t = 1 T l = 1 N l R l I l , t 2

3.2.4. Optimization Constraints of the Operation Layer Model

(1)
Power-flow constraints.
P i = U i j = 1 N U j G i j cos θ i j + B i j sin θ i j Q i = U i j = 1 N U j G i j sin θ i j B i j cos θ i j
In the formula, Pi and Qi refer to active power and reactive power; Uj is the voltage value; Gij and Bij refer to the branch conductance and admittance; and θij denotes the voltage phase difference angle.
(2)
Branch current constraint.
I i , s , t I i , max
where Ii,s,t denotes the current value; Ii,max refers to the maximum allowable current value of the branch.
(3)
Node voltage constraint.
U i min U i , s , t U i max
In the formula, U i min and U i max are the minimum and maximum permissible voltage values.
(4)
Energy-storage battery constraints.
S O C min S O C S O C max S O C sup = S O C end 0 P i , s , t ESS , + P max ESS , + X i , s , t ESS , + 0 P i , s , t ESS , + P max ESS , X i , s , t ESS , X i , s , t ESS , + X i , s , t ESS , + 1 E i , s , t + 1 ESS , + = E i , s , t ESS , + + ( P i , s , t 0 ESS , + η C P i , s , t ESS , / η D ) Δ t E i , s , t + 1 ESS = E i , s , t 0 ESS , + + ( P i , s , t 0 ESS , / η D ) Δ t
In the formula, ηC and ηD, respectively, denote the efficiency of the ESS; SOCmin and SOCmax denote the minimum and maximum charge states, respectively; E i , s , t ESS represents the energy level. The t0 refers to the end of a cycle; P max ESS + and P max ESS are, correspondingly, the maximum and minimum limits of the power; and X i , s , t ESS + and X i , s , t ESS are binary variables that indicate whether the ESS is in charging or discharging mode.
(5)
Demand-side response constraints.
Since this paper mainly incorporates demand response under time-of-use pricing, users adjust their own electricity consumption habits according to the electricity price and guarantee that the daily load variation is confined to a specific range. The constraint is as below:
P i , t DR , min P i , t DR , max P i , t DR , max
( 1 ξ ) t = 1 T n = 1 N ( P i , t load ) t = 1 T n = 1 N ( P i , t DR ) ( 1 + ξ ) t = 1 T n = 1 N ( P i , t load )
where P i , t DR is the change part of demand response; ξ refers to the allowable range of electricity variation within the user cycle; P i , t load represents the load quantity without demand response; and P i , t PR , min and P i , t PR , max refer to the first and second bounds of demand-side response adjustment.

3.3. Model Solving Method

3.3.1. Dual-Layer Improved Adaptive Grid Particle-Swarm Optimization Algorithm

Because the second operating layer falls into the category of multi-objective optimization, it is essential to consider different dimensions and multi-objective solution processing; the second layer is solved by particle-swarm optimization with an adaptive grid strategy. Through the continuous transfer between the first and second layers, the DPV joint energy-storage planning model is solved.
(1)
Multi-criteria optimization
A multi-criteria optimization problem refers to a mathematical challenge that entails optimizing two or more objective functions simultaneously.
min   F ( X ) = ( f 1 ( X ) , f 2 ( X ) , f 3 ( X ) , , f m ( X ) ) T s . t .   X Ζ
In the formula, X = {X1, X2, X3, …, Xn} refers to the n-dimensional vector in the decision space Z; F(X) refers to the objective function.
(2)
Adaptive grid construction
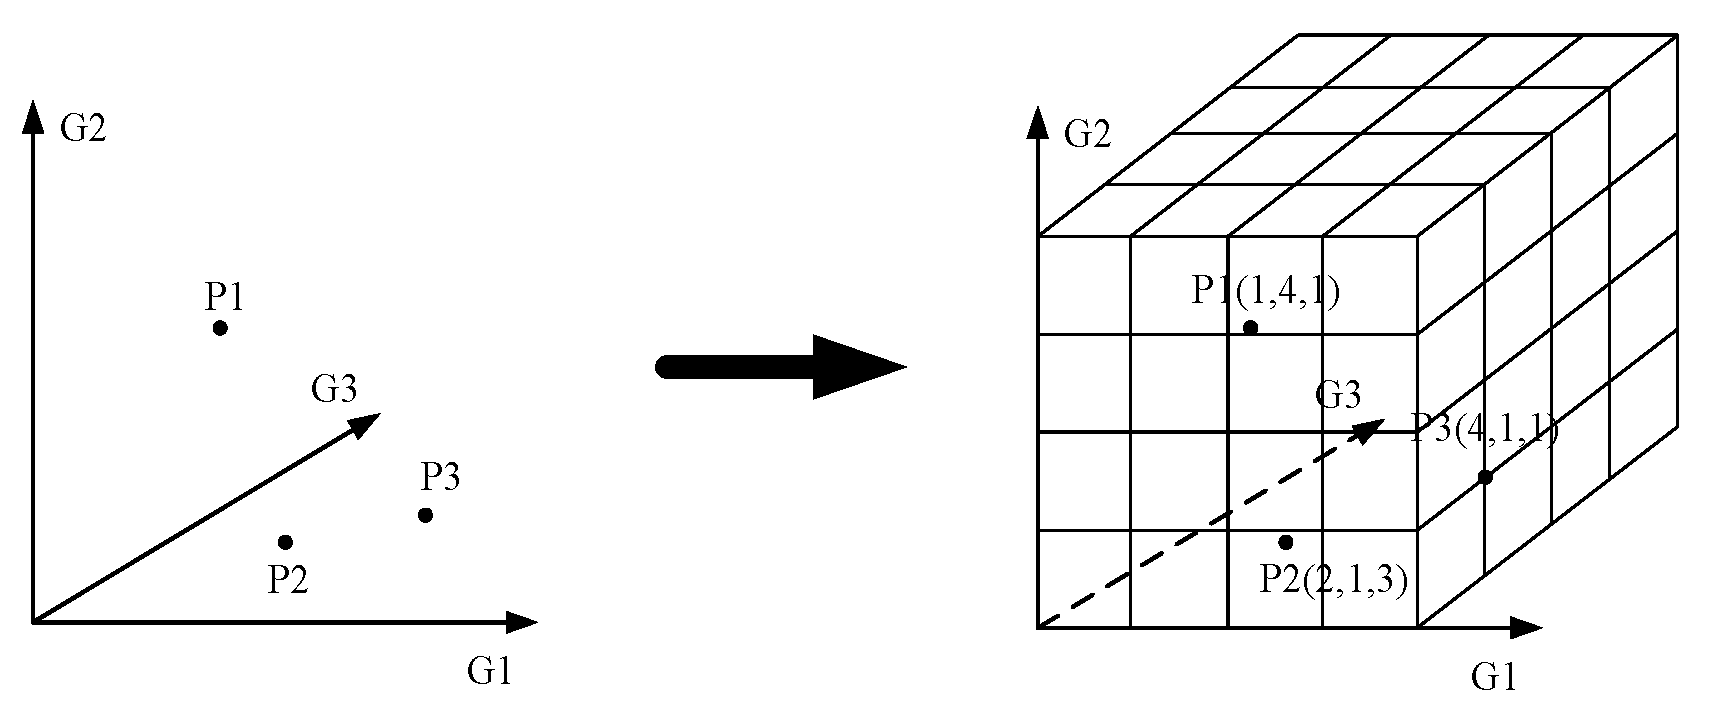
During the multi-objective particle-swarm optimization process, non-dominated solutions are generated through continuous iterations. Adaptive grid technology [24] is capable of locating these non-dominated solutions within the grid. If there exist n objective functions in an n-dimensional space, the boundaries and dimensions of the grid are defined. Each particle is positioned within the current grid based on its objective function, as illustrated in Figure 3:
The n-dimensional target space is divided into K1 × K2 × K3 × … × Kn grids, where the width of the grid εi is defined in the following manner:
ε i = μ f i max ( x ) f i min ( x ) K i
In the formula, μ is the grid control factor, the value of which is between [0, 1]; f i max (x) and f i min (x) correspond to the maximum and minimum, which can be adjusted according to the adaptive grid density. Its calculation method is as follows:
μ = ρ ( f i ( x ) ) i = 1 n ρ ( f i ( x ) )
where ρ(fi(x)) represents the standard deviation of the objective function.
The target space for particles in the external archive is defined as follows:
P i ( x ) = f i ( x ) f i min ( x ) μ i
In the formula, Pi(x) is the grid coordinates of the target space in the external archive of particles.
(3)
Maintenance Strategy for External Archive
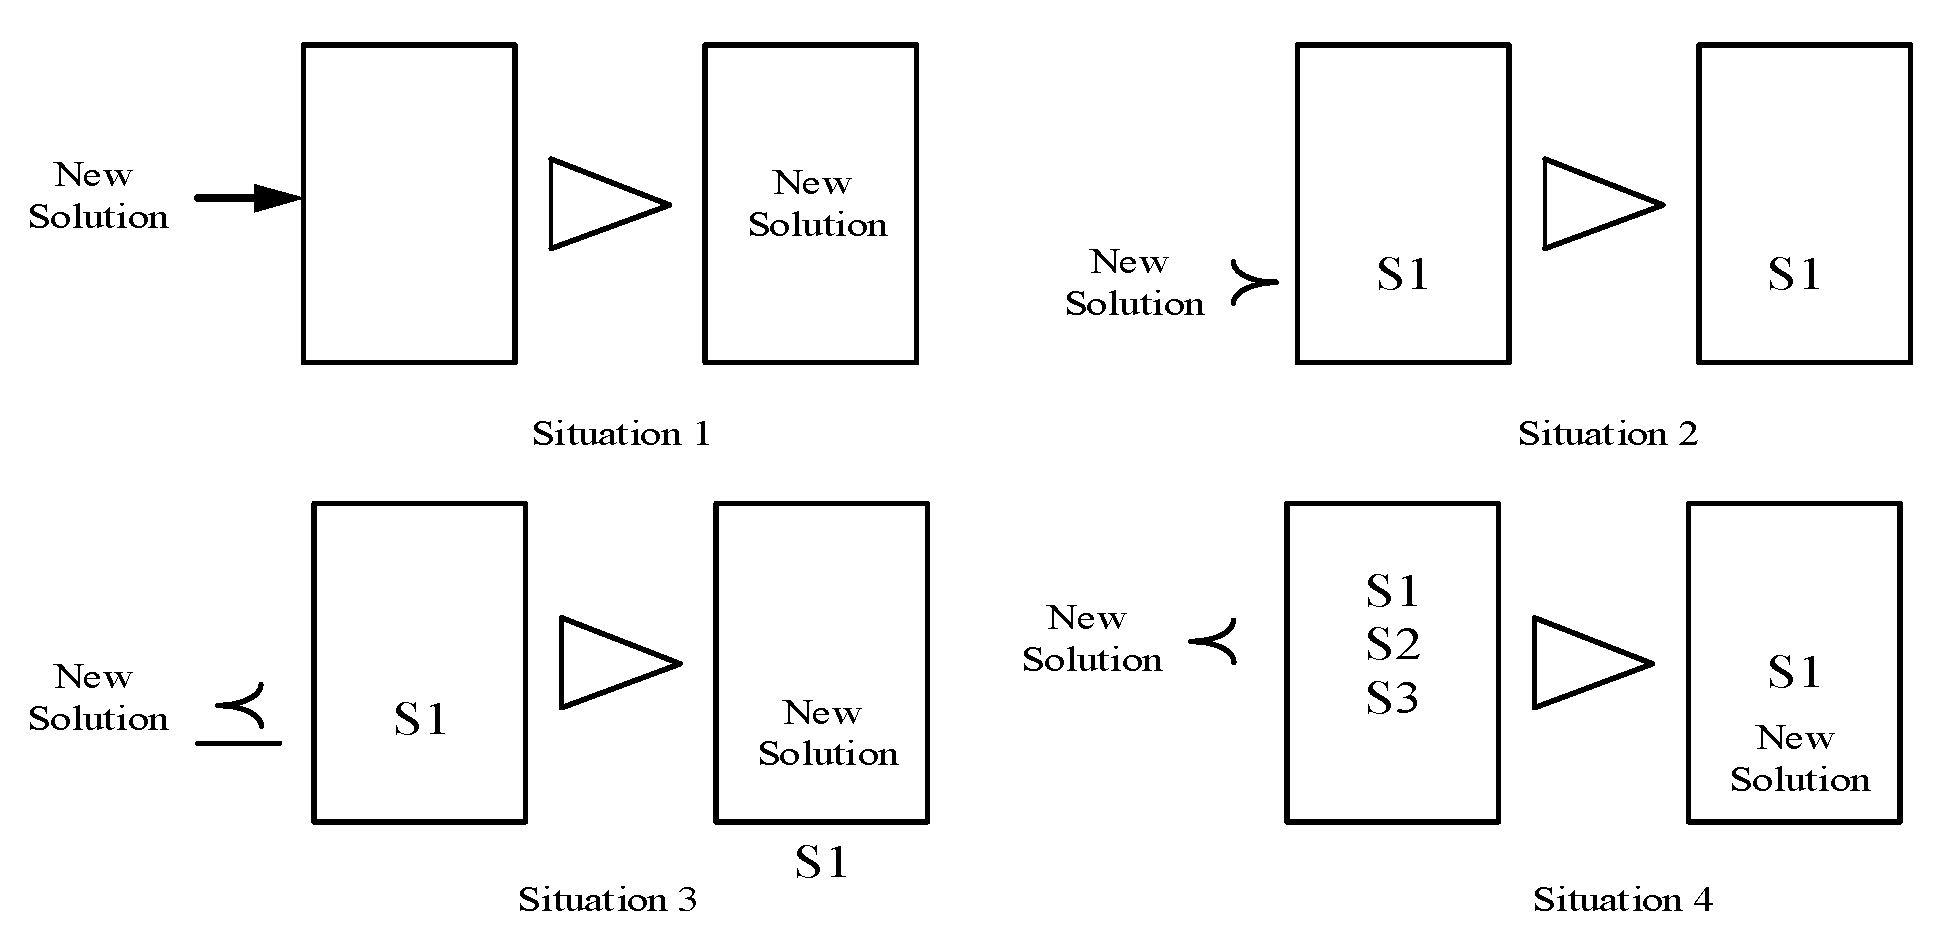
This paper uses the crowded distance method to maintain external files and ensure the diversity of the Pareto front. The strategy is shown in Figure 4.
In the initialization process, the external archive accepts the new solution as Scenario 1, the new solution is dominated by the archived solution as Scenario 2, and the new solution is not dominated by the archived solution as Scenario 3. If the externally archived solution is dominated by the new solution, it is Scenario 4. The system continuously evaluates whether the new solution can enter the external archive, based on the crowding distance used to maintain the external archive.
(4)
Approximate ideal solution sorting method
In the multi-objective optimization process, given the inherent conflicts between optimization objectives, the Technique for Order Preference by Similarity to an Ideal Solution (TOPSIS) is utilized to balance the interests of all parties comprehensively [25].
The calculation procedure of the established planning-operation double-layer model is presented as follows:
(1)
Initialization parameters to obtain typical photovoltaic and load output curves are determined;
(2)
The parameters are initialized, and configuration schemes are generated for the location and capacity of the DPV and energy-storage systems; these are transmitted to the second-level operation layer;
(3)
By introducing a reverse learning factor and incorporating mutation and disturbance strategies, the velocity and position of the new particle swarm in the sub-habitat are calculated;
(4)
The operation layer is initialized, the power flow calculations are performed,specific penalties are imposed on the operation layer, and the fitness values of the multi-objective function are computed;
(5)
The particle swarm’s velocity and position are updated using the adaptive grid method, the optimal operation strategy is output using the TOPSIS weight method, and key operational data is fed back to the planning layer, including the maximum photovoltaic output PPV,max,s,t, photovoltaic curtailment PPV,curtail,s,t, local load consumption of photovoltaic power Pload,PV,s,t, and photovoltaic power for energy-storage charging PESS,charge,s,t;
(6)
The first planning layer calculates the total photovoltaic output, local consumption, and grid-connected power. Combining these with the time-of-use grid prices and subsidies, the planning layer quantifies the annual photovoltaic grid-connected revenue via the Frev formula, providing support for the optimization of the net profit objective. Through repeated iteration of Steps 2 to 5, the solution result of the dual-layer model is obtained by means of bidirectional data transmission between the planning layer and the operation layer.

3.3.2. Improved Hybrid Optimization Algorithm of PSO and SOCP

In the field of energy-storage planning, second-order cone programming [26] (SOCP) can avoid the problem of excessive calculation, and the transformation into a SOCP problem can be achieved by second-order cone relaxation, an approach which has been widely used.
SOCP is a type of convex programming in the feasible domain. The general model of SOCP is as below:
min f ( x ) s . t .   A x + b 2 c x + d g ( x ) = 0 h ( x ) = 0
In the formula, f(x) is the convex function to be optimized, with constraints expressed as, sequentially, second-order cone constraints, linear equalities and inequalities.
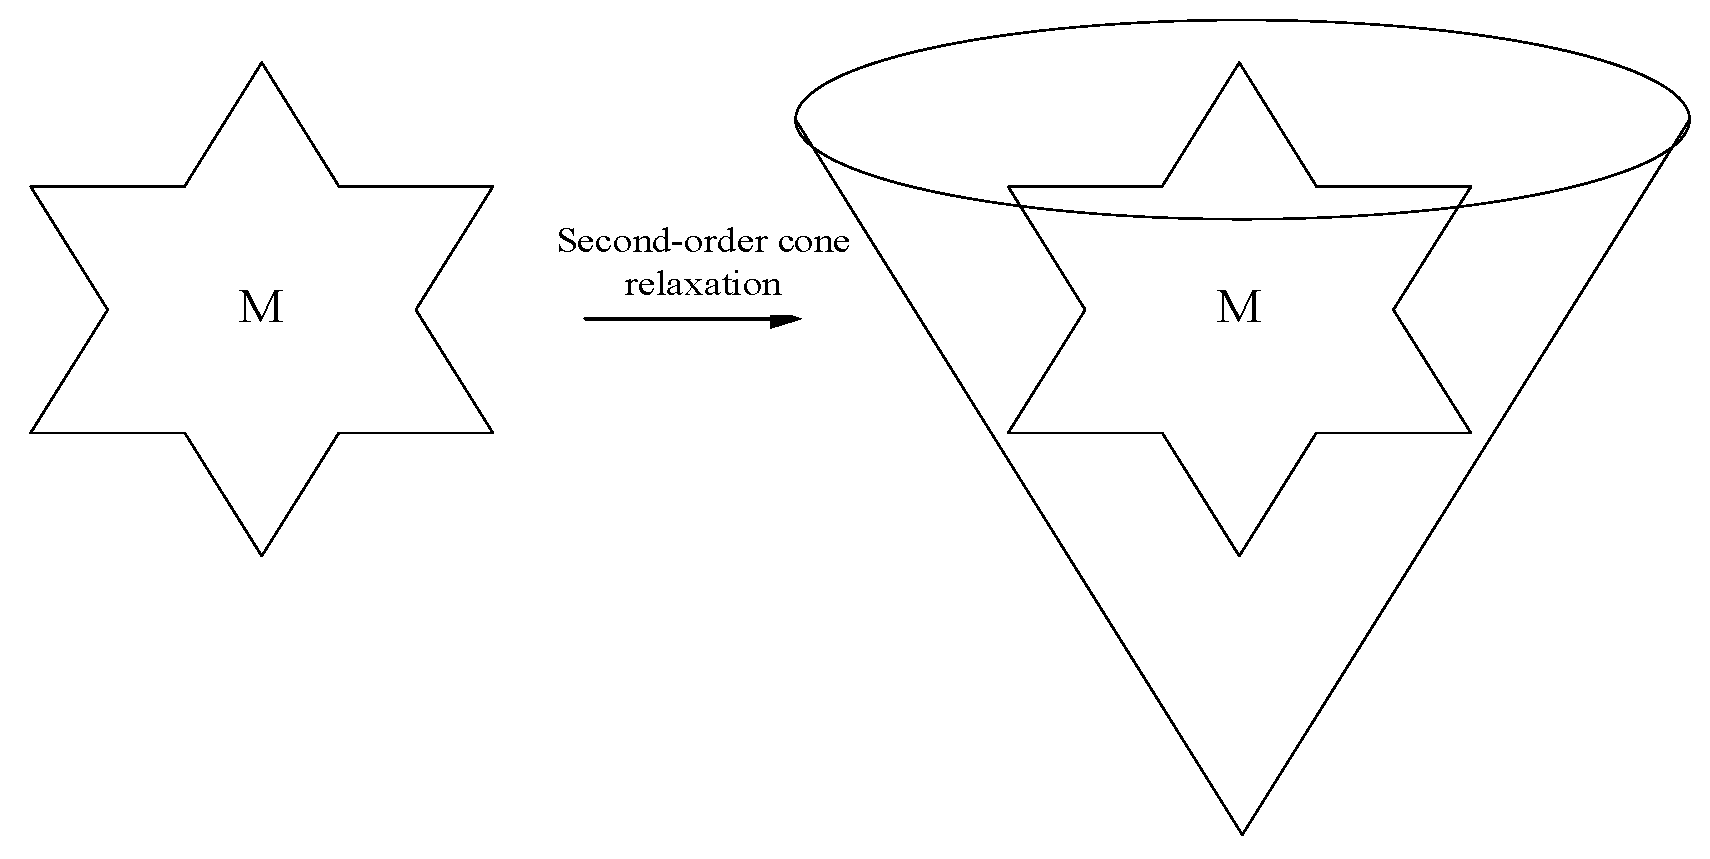
For non-convex problems in feasible domains, it is common to consider transforming them into convex second-order cone feasible domain problems through second-order cone relaxation. As shown in Figure 5, the second-order cone relaxation process results in a cone-shaped feasible domain, with the optimal solution M still within this domain. Although the constraints may introduce some error after relaxation, the literature [27] has demonstrated that the model remains correct after the second-order cone transformation.
The power flow Equation (33) is transformed into SOCR and two new variables are introduced:
α i , t = U i , t 2 β i j , t = I i j , t 2
In the formula, αi,t is the total of the square voltage; βij,t is the total of the square current.
By introducing variables for relaxation treatment, the power flow formula is transformed from Equations (49)–(53):
α j , t = α i , t 2 ( r i j P i j , t + x i j Q i j , t ) + ( r i j 2 + x i j 2 ) β i j , t
According to Equation (49), the power flow equation is transformed into the following, Equations (50) and (51).
p j , t = P i j , t r i j β i j , t k : j k P j k , t β i j , t
q j , t = Q i j , t x i j β i j , t k : j k Q j k , t
In the formula, pj,t and qj,t refer to the active power and reactive power of the node j; rij and xij refer to the resistance and reactance nodes i and j; and Pij,t and Qij,t stand for the power at the starting end of branch ij.
( U i min ) 2 α i , t ( U i max ) 2
β i j , t = P i j , t 2 + Q i j , t 2 α i , t
Equation (53) describes the nonlinear coupling relationship between the square of node voltage and branch power and current in the distribution network, which is the core constraint form of the power flow equation. Since the constraint is essentially a non-convex quadratic form, direct solution will lead to a significant increase in the complexity of the optimization problem. Therefore, after introducing auxiliary variables, the original nonlinear constraints can be rewritten into the second-order cone form, so as to realize the convex relaxation of the original power flow equation.
β i j , t P i j , t 2 + Q i j , t 2 α i , t
The above series of transformations (54) can be converted to the standard SOCP mode:
2 P i j , t 2 Q i j , t β i j , t α i , t 2 β i j , t + α i , t
In the formula, ‖ ‖2 is the second norm.

3.3.3. Multi-Objective Normalization

The first layer adopts a modified particle-swarm optimization algorithm, and the second layer employs SOCP to solve the daily scheduling strategy of the ESS. The second layer uses the AHP method to determine the weights of multiple objectives.
Multi-objective optimization problems are often more complex than single-objective optimization problems because the dimensions of each individual objective differ. Currently, multi-objective optimization problems are primarily addressed using the AHP and the weighted coefficient method. First, the sub-objectives need to be dimensionless.
The AHP is a method that combines qualitative and quantitative weight calculations. AHP is particularly effective in addressing multi-objective weight calculation issues, and it is widely applied to solving decision-making problems with multiple objectives, especially in the context of multi-objective planning. The AHP primarily constructs a multi-level analysis model by examining the relationships between various factors. It compares the importance of multiple indicators at different levels to form an analysis matrix. The weight assignment criteria for the AHP are described in the following.
The following steps are used to solve the weight coefficients of each goal of multi-objectives by using the AHP method: (1) construct the judgment matrix in the analytic hierarchy process; (2) calculate the root mean square of each element; and (3) according to the root mean square, normalize the weight coefficient of each index.
Step 1: Subjective construction of judgment matrix.
Firstly, the relative significance of indicators is judged. In order to quantify the relative importance, the criteria of importance are described in the table below, and the fuzzy judgment matrix is constructed as below:
M = m 11 m 12 m 1 n m 21 m 22 m 2 n m i j m n 1 m n 2 m n n
where mij refers to the importance of index i and j. The relevant assignment criteria are presented in Table 2:
Step 2: Calculation of the weight.
Once the judgment matrix is constructed, the weights require calculation and processing. The formula for the calculation is the following:
ω i = j = 1 n m i j + n 2 1 n 2 n
In the formula, n is the total number of indicators at the same level. The weight vector of evaluation indicators can be obtained by calculating the weights:
Step 3: Consistency test
Firstly, consistency testing can be performed based on the λmax of the judgment matrix. If λmax = n, the consistency test is in line with; if λmaxn, the consistency index CI needs to be calculated.
C I = λ max n n 1
The consistency index in the formula is shown in Table 3, below:
Throughout, RI refers to the random consistency index.
The weight of each objective in the multi-objective function is determined via the analytic hierarchy process, and the integrated optimization objective function is derived as follows:
f = d 1 f 1 * + d 2 f 2 * + d 3 f 3 *
where, d1, d2 and d3, respectively, represent the weight coefficients of voltage deviation, network loss, and the proportion of DPV energy consumption, and d1 + d2 + d3 = 1, f 1 * , f 2 * and f 3 * stand for the normalized sub-objective function values individually.

4. Practical Examples of the System and Result Analysis

4.1. Example Overview and Parameters

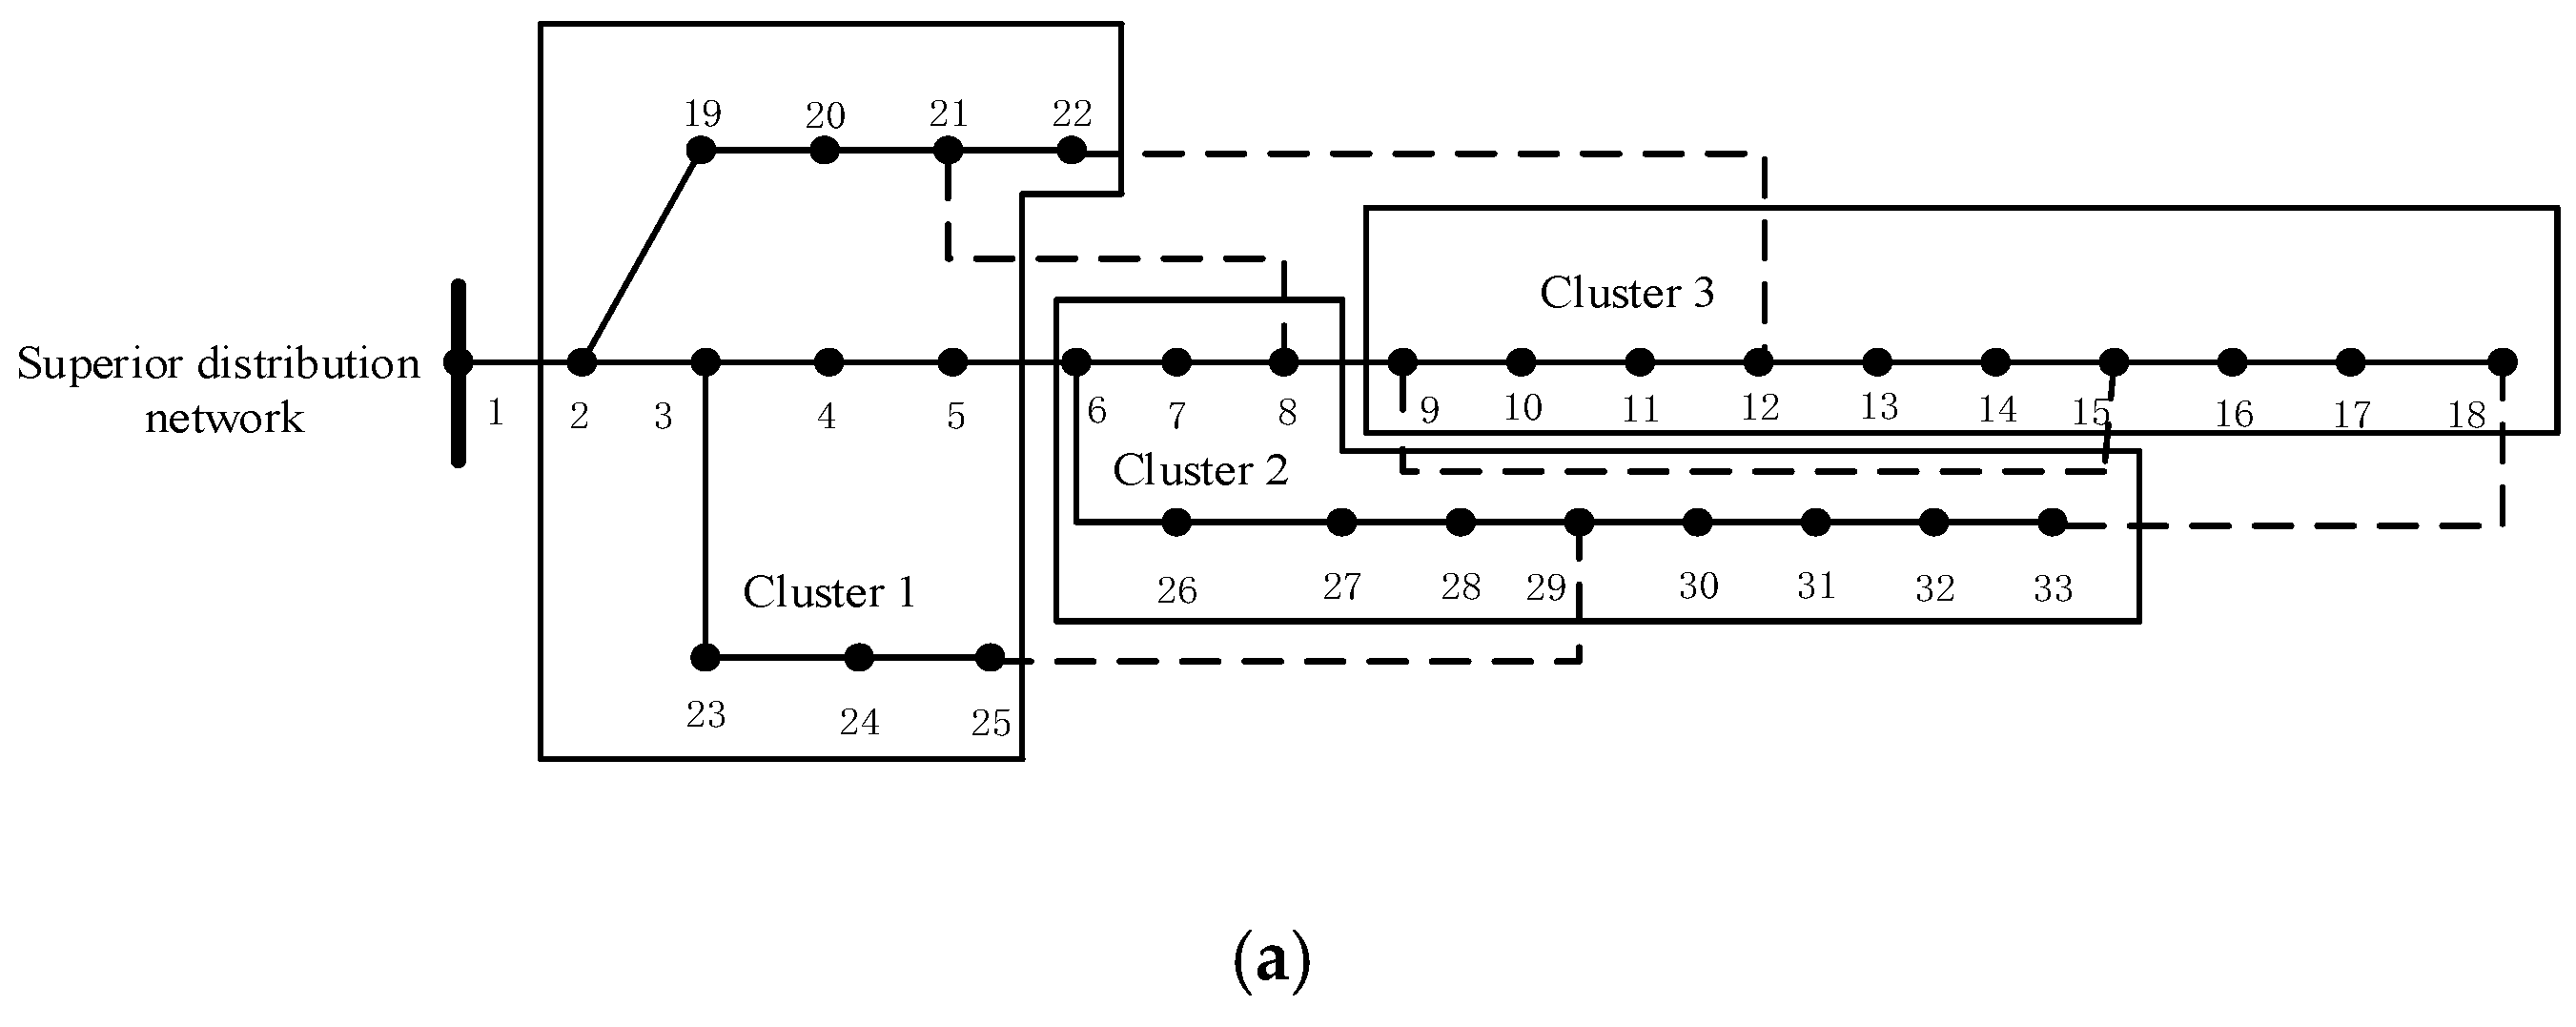
The configuration of energy storage in the cluster can improve the self-healing ability of the system, and the nodes in the cluster have high degrees of coupling and strong correlation. The cluster configuration energy storage divided by the cluster comprehensive division index can effectively coordinate the planning. An example of the analysis was conducted using the IEEE 33-node test system to verify its effectiveness and rationality. The simulation environment is based on Matlab2021a software. A comparison of modularity index grounded in electrical distance and cluster division considering multiple cluster division indicators, the cluster division algorithm adopts the improved FN-CD cluster division algorithm proposed. The weight of the cluster comprehensive division index is ω1 = ω2 = ω3 = ω4 = 1/4, and the cluster division result is presented in Figure 6.
In Figure 6a, when the modularity index rooted in electrical distance serves for cluster division, it only considers the structure between nodes for cluster division, dividing into three clusters with a relatively average number of nodes in each cluster, which reflects the strong structure within the clusters and centers around the electrical coupling intensity among nodes. However, the cluster scale is large and the regional span is large. When classifying distribution network clusters based on comprehensive performance indicators, a total of four clusters were identified, making the scale distribution of the clusters more reasonable. Under the premise of having a strong structural structure, it also has good power matching within its cluster.
In Figure 6, branch 1–2 is the main network connection branch; branches 4–5, 12–13, and 6–26 are inter-group branches; the dotted line is the tie-line. When integrating DPV, the power factor is set to 0.89 (lagging) under normal operation, meaning the inverters are capable of injecting reactive power to support the grid voltage. It is noteworthy that modern PV and ESS inverters can provide reactive power support and operate with a variable power factor. While the base case in this study assumes a fixed power factor to simplify the initial analysis, the proposed framework is capable of incorporating variable power factor control as an additional decision variable in the operational layer to further minimize voltage deviations. Reactive power compensation devices are connected at nodes 17 and 32, with capacities of 0.40 Mvar and 0.60 Mvar, respectively. Except for node 1, which is a power source, all nodes are load nodes.
At the planning level, particles are randomly generated for the location and capacity of the DPV and ES. In this example, four DPV units and four ES units are connected. The typical daily load curve is presented in Figure 7, and the PV output is based on a typical scenario from a specific location, as illustrated in Figure 8.
The system-related parameters are set as below: the DPV access nodes selected are 8, 14, 15, 19, and 24, with a maximum light rejection rate of 10%. The energy-storage nodes are chosen based on the system cluster division positions. The first-level particle population size is assigned a value of one hundred, with a maximum iteration count of one hundred, and the individual factor and learning factor are both set to 1.5. For the second-level multi-objective adaptive grid particle-swarm optimization algorithm, the inertia weight is set to 0.85, the population size is one hundred, the maximum iteration count is 100, the external archive limit is one hundred, the individual factor is 1.5, and the group factor is 2. When solving with the second-order cone hybrid algorithm, the planning layer parameters remain the same as above. The second-level multi-objectives use the AHP method to determine the multi-objective weights, and the daily scheduling strategy for the ESS is solved using second-order cone programming. The planning layer still utilizes the IPSO algorithm, while the second-level operational layer employs the Gurobi commercial solver for the solution.
In this paper, the distribution network system model implements the time-sharing electricity purchase price and sale price shown in Table 4 below. The unit electricity policy subsidy is 0.10 USD/(kW-h).
The parameters relating to DPV and energy storage are presented in Table 5 and Table 6.

4.2. Case Results and Case Comparison Analysis

To reasonably validate the model and solution method of this chapter, four scenarios can be set for comparative analysis:
(1)
Scenario 1: No consideration of DPV or energy-storage access (not planned);
(2)
Scenario 2: Consider the access of DPV, but not the access of energy storage;
(3)
Scenario 3: Considering the access of DPV and ESS, the joint access of DPV + ESS is considered, and the double-layer improved algorithm is applied to solve it;
(4)
Scenario 4: Considering the integration of DPV and ESS, the DPV + ESS joint access is implemented using an improved hybrid algorithm that combines particle-swarm optimization with second-order cone programming.
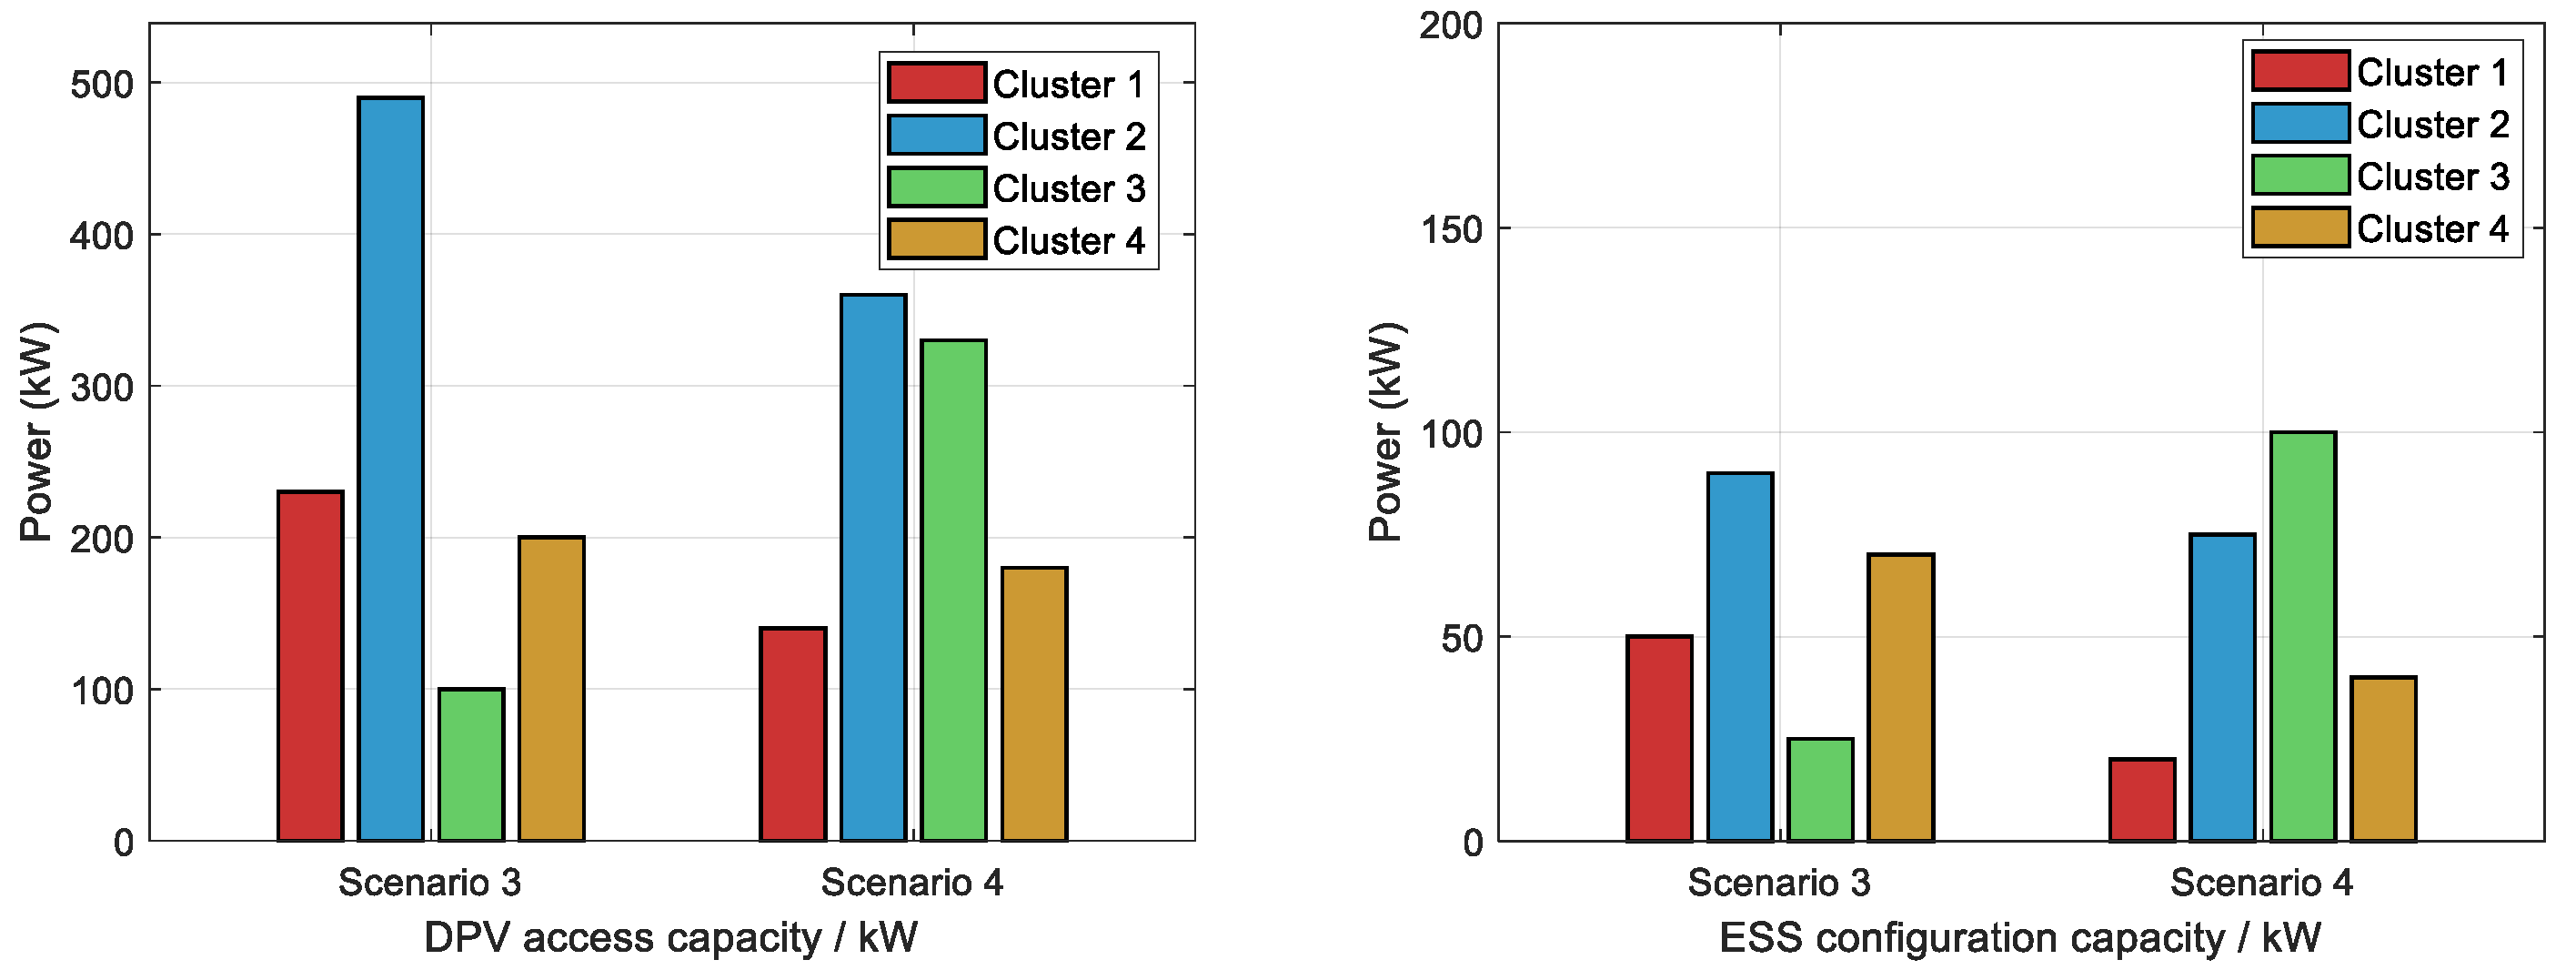
According to the two-layer model and the two-layer adaptive grid particle-swarm optimization algorithm as well as the second-order cone programming hybrid algorithm constructed in this paper, the planning scheme of each scene can be obtained, as shown in Table 7 and Figure 9.
It can be seen from Table 6 that when ESS is not configured in Scenario 2, the access power of the DPV is 580 kW, while in Scenario 3 and Scenario 4, the access power values for the DPV are 1022 kW and 1000 kW, respectively. Therefore, it can be seen that the configuration of energy storage can increase the proportion of distributed photovoltaic consumption, which can effectively improve the DPV consumption capacity. The DPV and ESS power values for each cluster access in Scenario 3 and Scenario 4 are shown in Figure 9. In Scenario 3, the ESS power is 228 kW and the capacity is 941 kWh. In Scenario 4, the ESS power is 217 kW and the capacity is 841 kW·h. Therefore, in the two-layer model constructed in this paper, the energy-storage ratio of the Scenario 3 photovoltaic configuration is about 22.31%, and the energy-storage ratio of the Scenario 4 photovoltaic configuration is about 21.70%. This provides some theoretical support for the current level of construction of photovoltaic energy-storage capacity on a national scale.
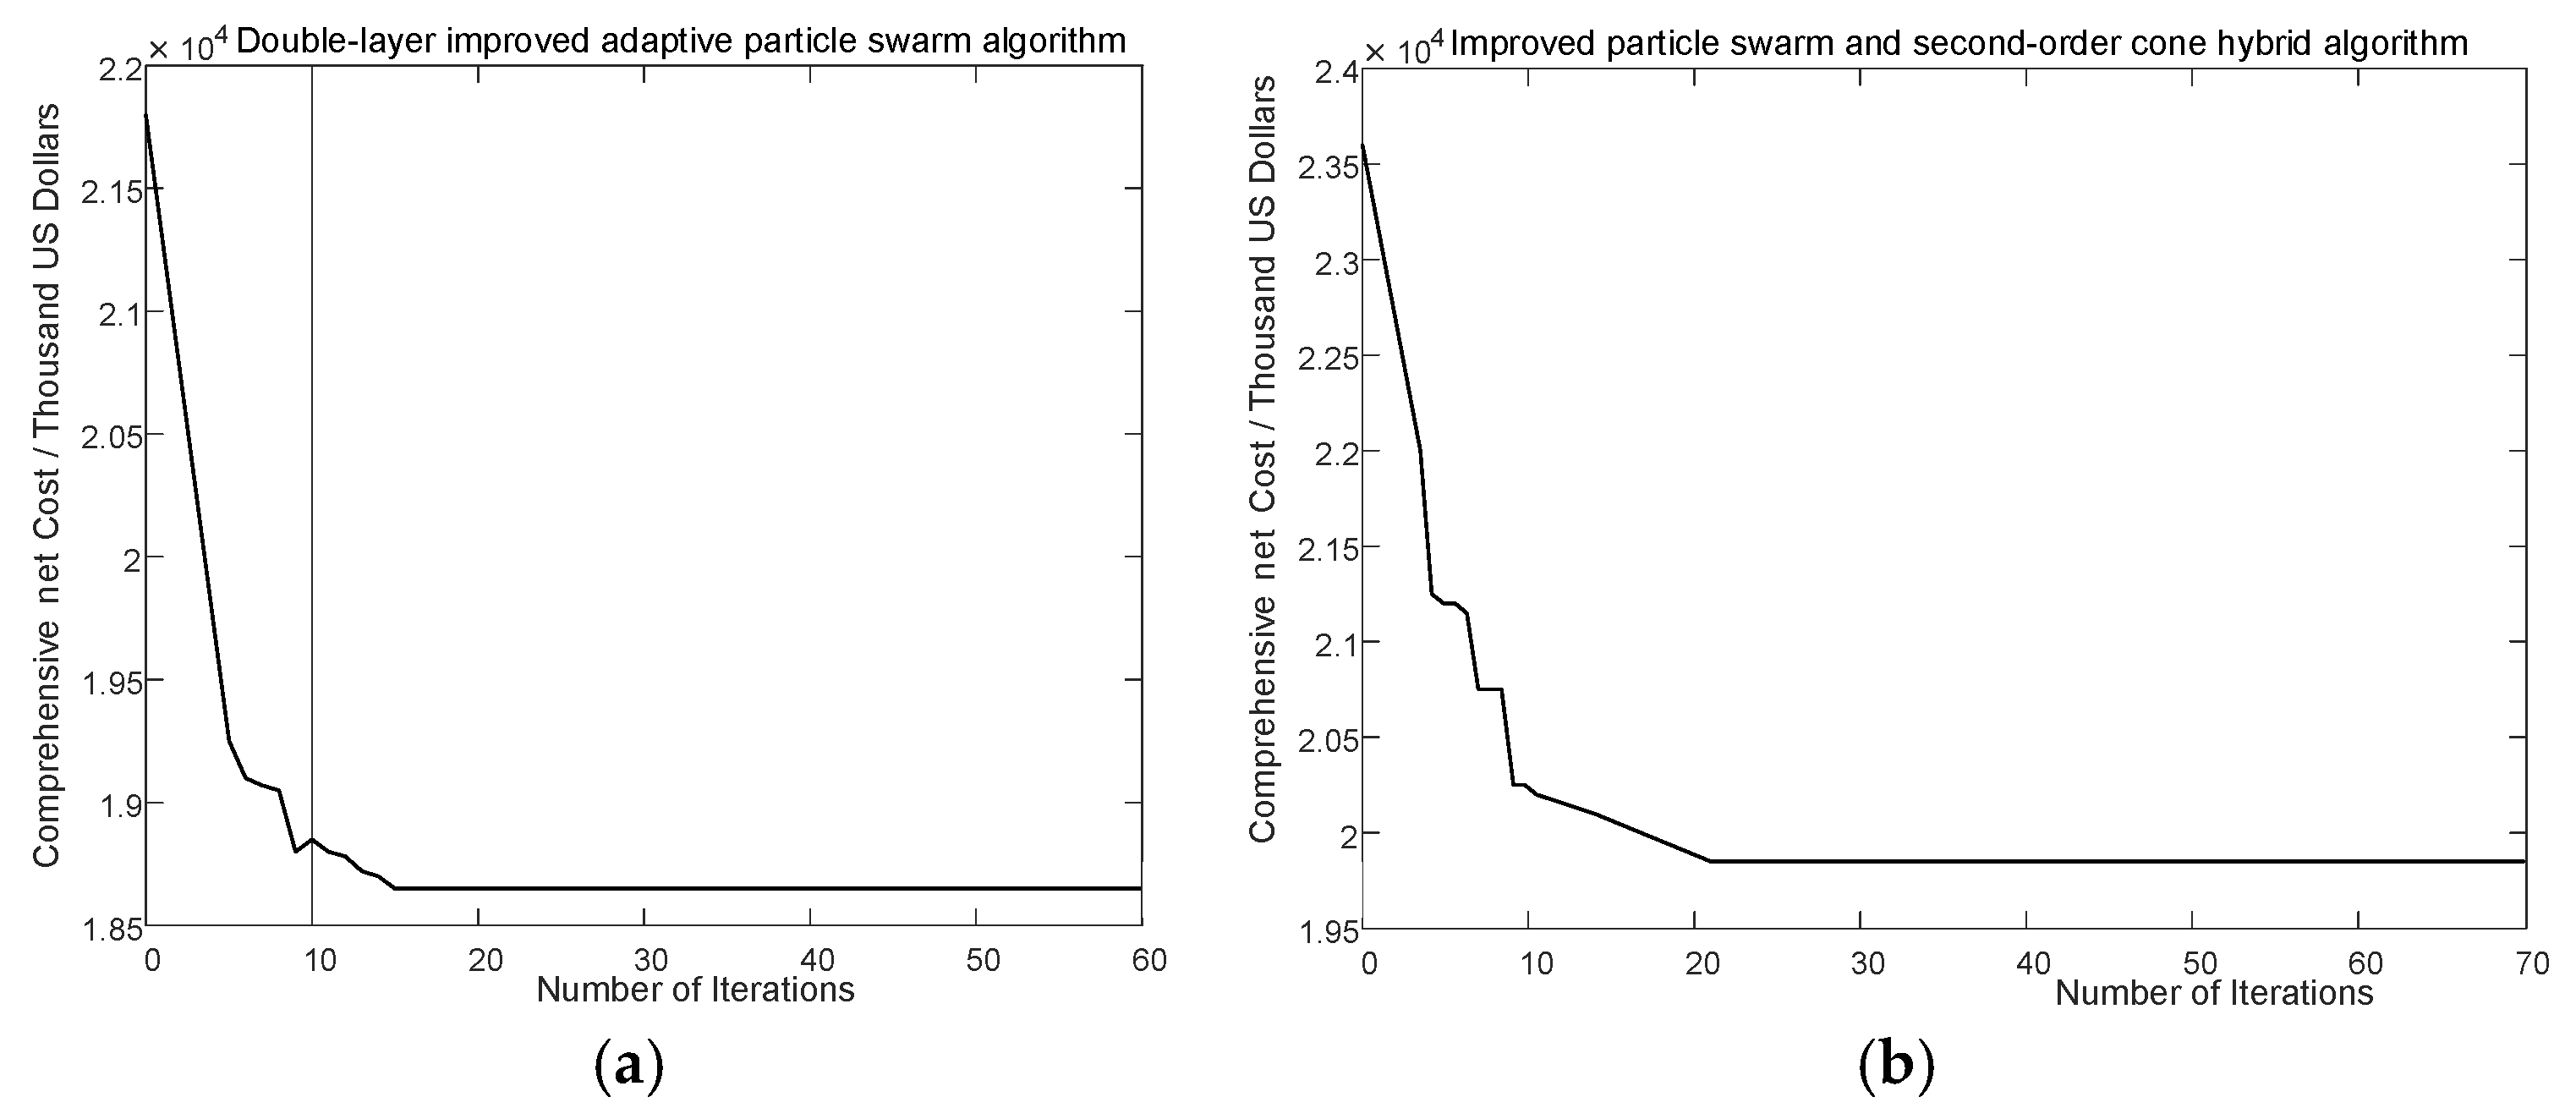
The integrated energy storage and distributed photovoltaic (DPV) capacities are both larger. This configuration leads to a more effective utilization of resources, resulting in superior system performance. Two different solving algorithms are used. Because in the second, multi-objective layer, each iteration cycle produces different Pareto solution sets, the second layer is normalized by the TOPSIS method and passed to the first layer. The first layer calls the second layer to transfer the results. The final annual comprehensive cost iteration curve is demonstrated by Figure 10:
According to the results, the convergence speed is faster, and the annual comprehensive net cost is USD 18,388.6 thousand. In contrast, when the improved PSO and second-order cone hybrid algorithm are used, the annual comprehensive net cost is USD 19,798.1 thousand. Therefore, the algorithm proposed in this paper exhibits a faster convergence rate when solving this two-layer model, thereby enhancing the computational efficiency of the model. Therefore, compared with the second-order cone hybrid algorithm, the two-layer improved adaptive grid particle-swarm algorithm proposed demonstrates certain advantages. This is due to the application of multi-objective compromise solution in the second layer of the improved two-layer adaptive grid particle-swarm algorithm, while the second layer of the second-order cone hybrid algorithm uses the analytic hierarchy process to normalize the multi-objective.

4.3. Economic Criteria Analysis

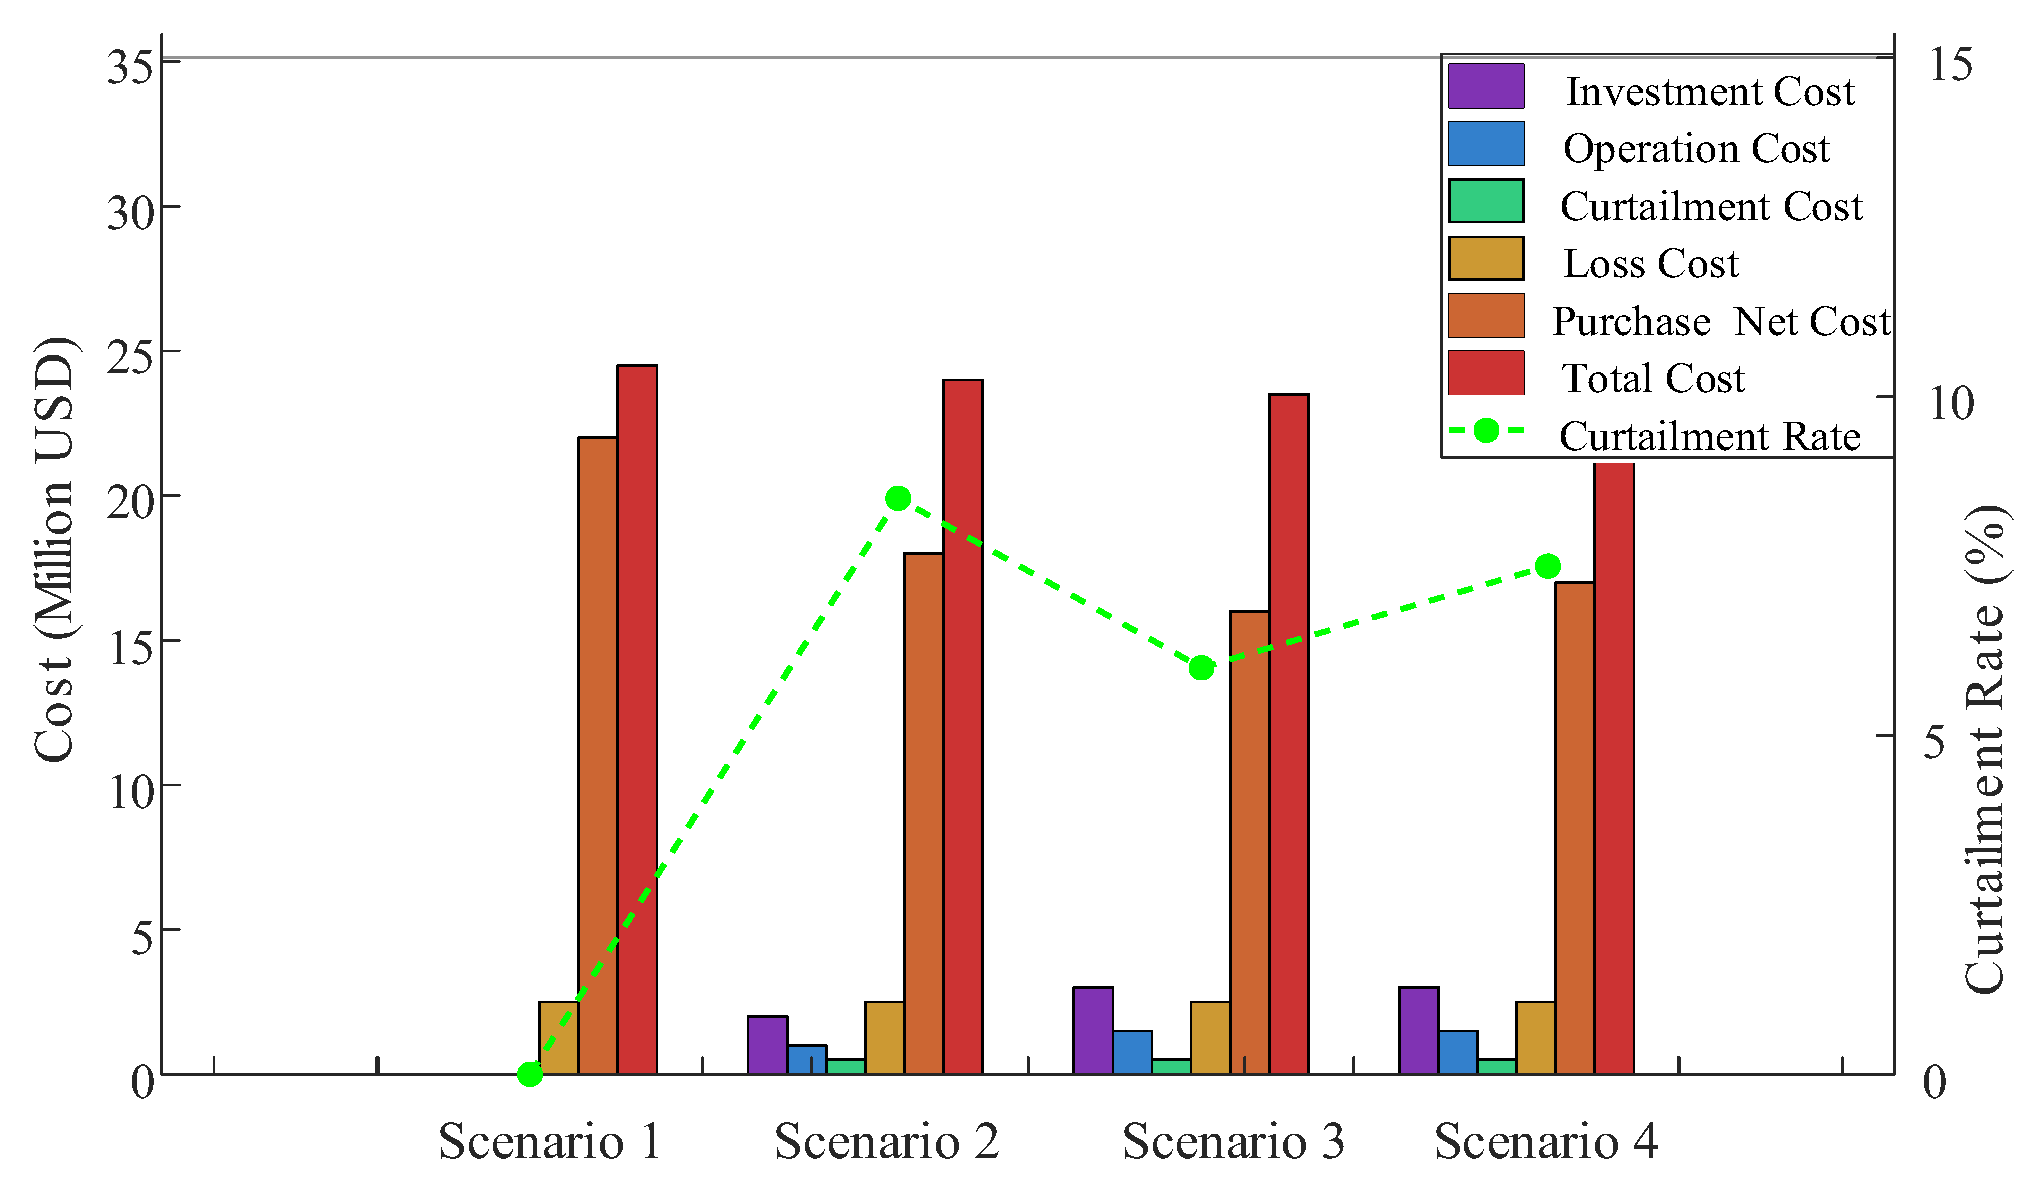
The comparison of economic indicators is shown in Figure 11 and Table 8. In Scenario 1, the net costs of distributed photovoltaic and energy storage are not involved. It only includes the network loss cost of the distribution network and the cost of purchasing electricity from the main grid. In the second scenario, the investment, operation, and maintenance costs of DPV are added. Owing to the integration of DPV and other renewable energy sources, the cost of purchasing electricity from the first-level power grid is reduced. In the third scenario, considering the joint access of DPV and energy storage, because ESS access increases the proportion of DPV consumption, the investment cost is up to USD 1748.3 thousandin the four scenarios. The cost of procuring the electricity grid is USD 4931.2 thousand and 1987.1 thousand lower than those of Scenario 1 and 2, respectively.
Comparing the annual comprehensive net cost under the four scenarios, the annual comprehensive net cost of Scenario 3 is the lowest; the annual comprehensive net cost of Scenario 3 sees reductions of 22.68% and 10.86% compared to those of Scenarios 1 and 2, respectively. Compared with Scenarios 3 and 4, the total economic cost of the proposed method is 6.6% lower than that of Scenario 4. The light rejection rates of Scenarios 2, 3, and 4 are 8.73%, 6.21%, and 7.52%, respectively. Therefore, the rational allocation of ESS is able to effectively reduce the photovoltaic curtailment rate and boost the absorption of new energy.
Comparing the four scenarios, Scenario 2 accesses DPV; compared with Scenario 1, the cost of network loss is smaller, which is conducive to reducing network loss. Comparing Scenarios 2 and 1, the annual network loss cost of DPV + ESS joint planning is reduced by USD 467.7 thousandand USD 760.9 thousand, respectively. Therefore, the coordinated integration can efficiently mitigate the network losses. Comparing Scenario 3 with the Scenario 4, it can be seen that the algorithm can increase the proportion of photovoltaic consumption to a greater extent, thus verifying its superiority in solving the double-layer model. Based on the analysis of economic indicators, it is necessary to reasonably configure DPV and ESS.

4.4. Configuration Energy Storage Peak Shaving Effect and Demand Response Analysis

To verify the effectiveness of low-storage and high-level peak load shifting following energy-storage configuration, the power of ESS and the time-of-use electricity price change curve in Scenario 3 are shown in the following, Figure 12:
In Figure 12, it can be observed that charging is carried out from one to seven in the morning, in the low load period, and discharging is carried out from seven to eleven in the evening, in the peak load period. Therefore, by optimizing the power of ESS, the fluctuation of DPV output can be improved. By virtue of satisfying the two-layer model, the operation law of low storage and high level is followed, and the rational allocation of energy storage within the system, combined with the demand-side response, can verify the effectiveness of peak shaving and valley filling.
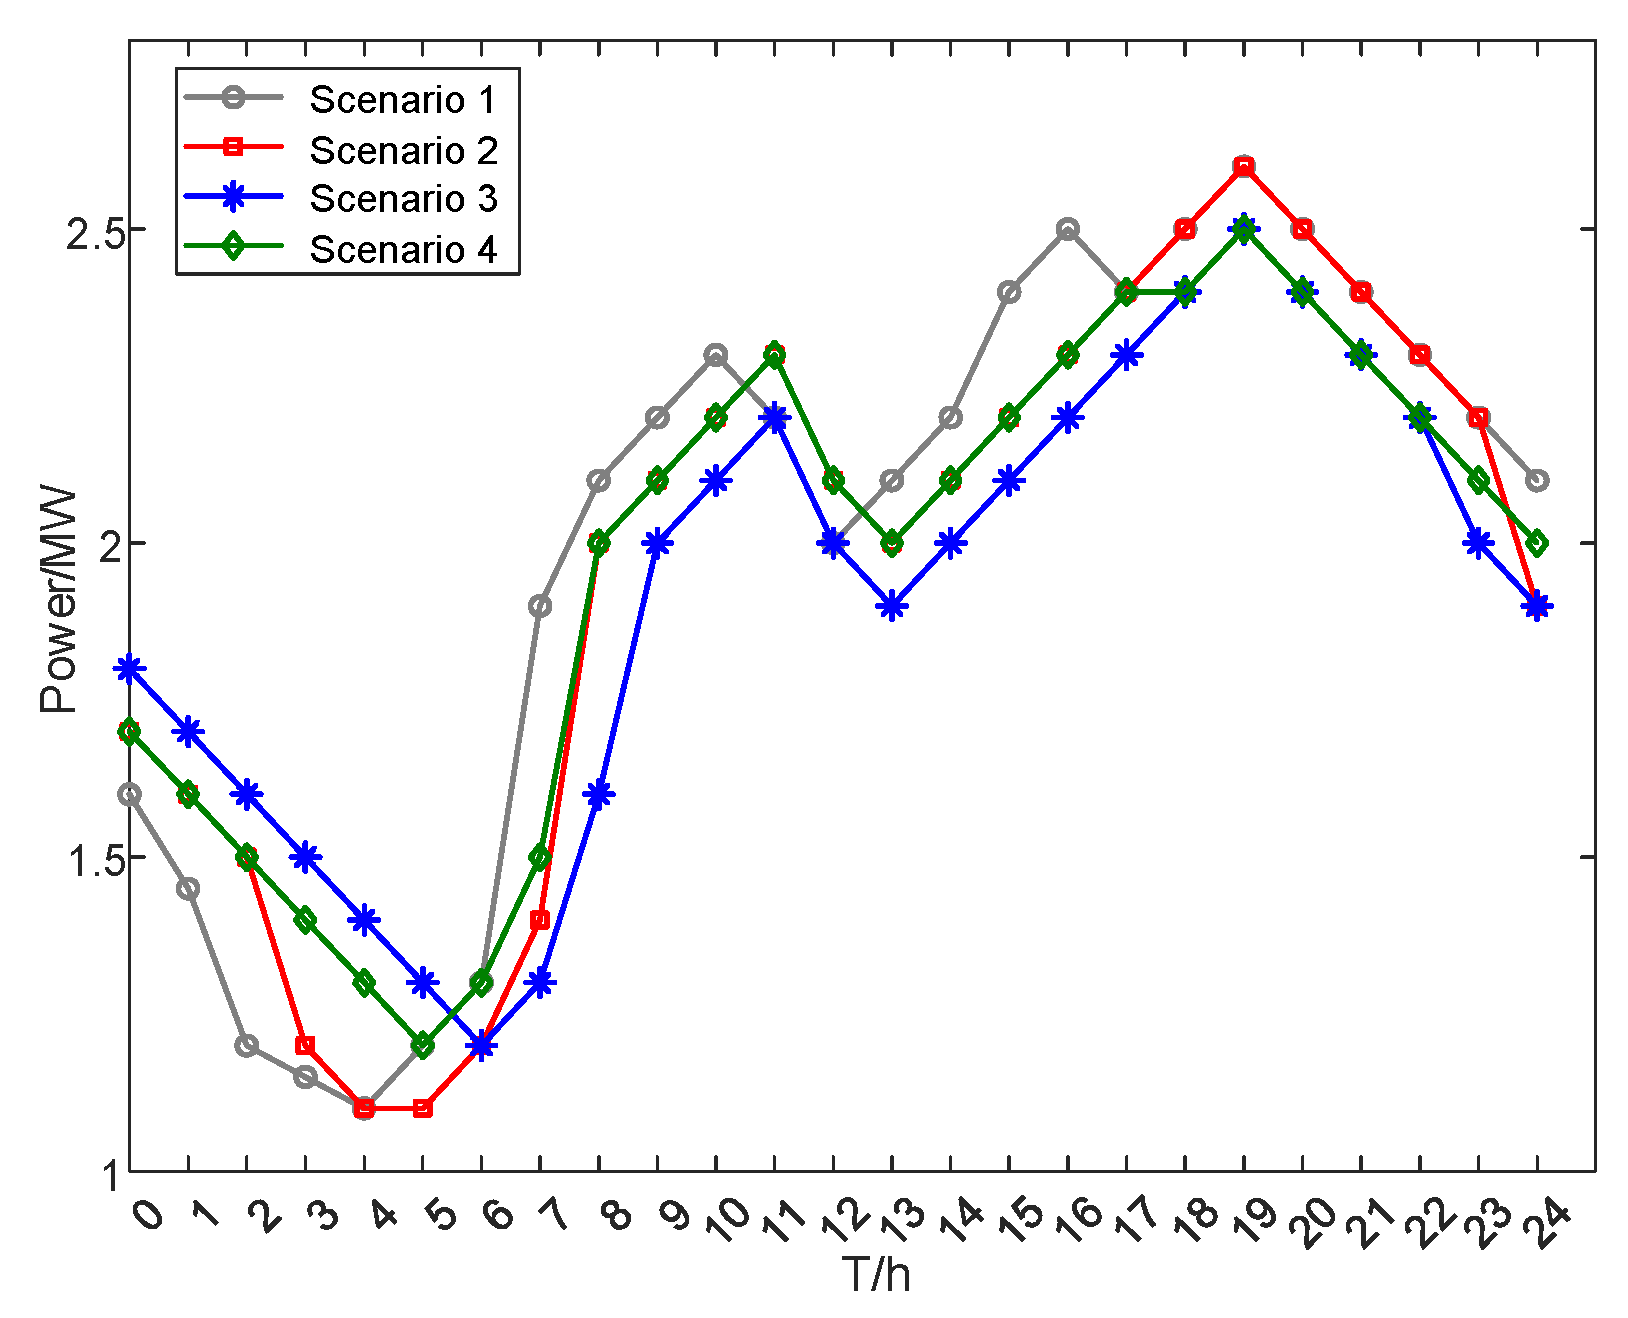
The system configuration of the energy storage and the consideration of demand response have effectively improved the peak–valley load difference, as shown in Table 9 and Figure 13. Comparing Scenario 2 with Scenario 1, the peak and valley loads in Scenario 1 are 2.6143 MW and 1.1322 MW, respectively, while in Scenario 2, they are 2.5637 MW and 1.1823 MW, respectively. The peak–valley difference has decreased from the original 1.4821 MW to 1.3814 MW. This reflects the fact that the consideration of the demand response of time-of-use electricity prices and the integration of DPV can improve the operational performance of the distribution network. Scenario 3 is designed with a reasonable configuration of energy storage and the coordination of demand response under time-of-use electricity pricing; comparing Scenario 3and Scenario 1, the peak and valley load values in Scenario 3 are 2.4421 MW and 1.2587 MW respectively, and the peak–valley difference has been reduced from the original 1.4821 MW to 1.1834 MW. Comparing Scenario 3 and Scenario 2, the peak–valley difference of the load has decreased from 1.3814 MW to 1.1834 MW. Therefore, by the configuration of the energy storage, the peak–valley difference of the load has decreased. Effective configuration of energy storage can achieve the peak shaving and valley filling of the load.
Comparing Scenario 3 and Scenario 4, the peak and valley values for the load in Scenario 3 are 2.4421 MW and 1.2587 MW, respectively, and the peak and valley values of the load in Scenario 4 are 2.4932 MW and 1.2135 MW, respectively; the difference between the peak and the valley of load is reduced from 1.2797 MW to 1.183 MW. The comparison between Scenario 3 and Scenario 4 shows the superiority of this algorithm in solving this two-layer optimization model.

5. Conclusions and Future Work

This study proposes a cluster-based bi-level optimization framework for the coordinated planning and operation of DPV and ESS in active distribution networks. By integrating electrical distance, power balance, and scale rationality into a comprehensive cluster partition index and applying an improved FN-CD algorithm, the method achieves rational partitioning with strong intra-cluster coupling and balanced sizes. On this basis, a two-layer optimization model jointly optimizes siting, sizing, and operational strategies.
Simulation results on the IEEE 33-node system highlight the quantitative advantages of the proposed method. Compared with the hybrid SOCP approach, the annual comprehensive net cost is reduced by 6.6%, the load peak–valley difference is decreased by 22.6%, and the PV utilization rate is improved by 28.9%, while voltage deviations remain below 6.3%. These outcomes demonstrate that the proposed framework can provide both economic and technical benefits for the operation of the distribution network.
The operative boundaries of the proposed method should also be noted. The current model is designed for radial distribution networks under balanced three-phase steady-state conditions and relies on accurate system data, including line parameters, load demand, and PV generation profiles. Although the cluster-based decomposition improves scalability, further algorithmic acceleration may be required to handle very large networks efficiently. In addition, unbalanced conditions, harmonic distortions, and transient dynamics are not explicitly modeled in the present work.
Future research directions are therefore essential. First, the cluster-based decomposition is inherently suitable for large-scale networks, but practical implementation will face challenges such as inter-cluster coordination complexity, higher requirements for high-quality data, and the need for reliable, low-latency communication infrastructures. Second, sudden load variations, renewable intermittency, and fault events will require more advanced stability assessments, including electromagnetic transient (EMT) validation, which remains beyond the current scope. Third, while the bi-level optimization framework could in principle be simplified for scenarios involving only active or only reactive power transfer, its advantages are more evident in complex cases involving multiple objectives such as voltage regulation, loss minimization, and PV utilization enhancement.
To further adapt the framework for real-time operation in high-voltage distribution networks, significant modifications are necessary. These include shifting the optimization time scale from long-term planning to short-term operation through model predictive control (MPC), employing linearization or convex relaxation of AC optimal power flow (ACOPF) for computational tractability, and performing hardware-in-the-loop (HIL) validation. Additionally, robust cybersecurity measures must be considered to ensure secure and reliable deployment under realistic conditions.
Author Contributions

P.Z.: Responsible for program compilation and writing the original draft. X.L.: Responsible for writingreview and editing. H.Q.: Responsible for methodology and project administration. N.L.: Responsible for obtaining the experimental data. Y.Z.: Responsible for resources and formal analysis. C.X.: Responsible for resources, literature review, and formal analysis. All authors have read and agreed to the published version of the manuscript.

Funding

State Grid Shandong Electric Power Company Science and Technology Project “Research and Application of Multi-level Cluster Planning Technology for Distribution System with High Proportion of New Energy Load” (52060124000D).

Data Availability Statement

The relevant data is contained within the article.

Conflicts of Interest

Authors Pu Zhao, Xiao Liu, Hanbing Qu, and Ning Liu are employed by Jinan Power Supply Company of the State Grid Shandong Electric Power Company. Authors Yu Zhang and Chuanliang Xiao are employed by the Shandong University of Technology. The remaining authors declare that the research was conducted in the absence of any commercial or financial relationships that could be construed as a potential conflict of interest.

References

  1. Tong, G. Construction of smart energy system based on dual carbon goal. Smart Power 2021, 49, 1–6. [Google Scholar]
  2. Ma, H.M.; Liu, L.Q.; Xie, H. Maximum access c capacity assessment t of distributed photovoltaic in integrated electric-thermal energy system considering integrated demanc response. Smart Power 2021, 49, 23–30. [Google Scholar]
  3. Xu, H. The study on development of PV technology in China. Power Syst. Technol. 2007, 31, 77–81. [Google Scholar]
  4. Zhang, Y. Research on a New Power Cluster Network Technology Based on Distributed Generation and Microgrid. Master’s Thesis, Qingdao University of Science and Technology, Qingdao, China, 2010. [Google Scholar]
  5. Sheng, W.; Wu, M.; Ji, Y. Key Technologies and Engineering Practices for Grid Integration of Distributed Renewable Energy Generation Clusters. China J. Electr. Eng. 2019, 39, 2175–2186. [Google Scholar] [CrossRef]
  6. Zhang, S.; Li, K.; Cheng, H.; Yao, L.Z.; Masoad, B. Optimal siting and sizing of intermittent distributed generator considering correlations. Autom. Electr. Power Syst. 2015, 39, 53–58. [Google Scholar]
  7. Lu, Y.; Jiang, D.; Liang, Y. A method for suppressing voltage beyond limits in distribution network with photovoltaic power sources. Electr. Power Constr. 2020, 41, 8793. [Google Scholar]
  8. Sun, F.J.; Xie, N.; Wang, C.M.; Fan, M.T.; Zhang, Z.P. Review of CIRED 2017 on power distribution system planning. Power Syst. Technol. 2018, 42, 2733–2741. [Google Scholar] [CrossRef]
  9. Kiran, D.; Abhyankar, A.R.; Panigrahi, B.K. Hierarchical clustering based zone formation in power networks. In Proceedings of the 2016 National Power Systems Conference (NPSC), Bhubaneswar, India, 19–21 December 2016; pp. 1–6. [Google Scholar]
  10. Lagonotte, P.; Sabonnadiere, J.; Leost, J.-Y.; Paul, J.-P. Structural analysis of the electrical system: Application to secondary voltage control in France. IEEE Trans. Power Syst. 1989, 4, 479486. [Google Scholar] [CrossRef]
  11. Kai, H.; Shan, G.; Quan, G. Research on partition for automaticvoltage/var control based on electrical distance to generator. In Proceedings of the IEEE PES Innovative Smart Grid Technologies, Tianjin, China, 21–24 May 2012; p. 14. [Google Scholar]
  12. Zhou, Q.; Yun, Z.; Feng, Y.; Sun, H. Reactive power-voltage control partitioning of wind power integration system based on affinity propagation clustering. Autom. Electr. Power Syst. 2016, 40, 19–27. [Google Scholar]
  13. Wang, L.; Zhang, F.; Kou, L.; Xu, Y.; Hou, X. Large-scale distributed photovoltaic power cluster division based on Fast Unfolding clustering algorithm. J. Sol. Energy 2021, 42, 29–34. [Google Scholar] [CrossRef]
  14. Shi, M.; Yin, R.; Jiang, W.; Wang, Y.; Hu, P.; Hu, K. Overview of flexible grid-connected cluster control technology for distributed photovoltaic. Electr. Meas. Instrum. 2021, 58, 19. [Google Scholar] [CrossRef]
  15. Han, Z.; Zhang, B.; Cui, K.; Zhang, Y.; Zhang, D. Research on wind-solar-thermal-storage joint scheduling strategy considering new energy consumption capacity and power generation cost. Electr. Technol. 2020, 8, 21–25. [Google Scholar]
  16. Jiang, Y.; Ren, Z.; Li, Q.; Guo, Y.; Xu, Y. An accommodation strategy for renew able e energy in distribution network considering coordinated dispatching of multi-flexible resources. Trans. China Electrotech. Soc. 2022, 37, 1820–1835. [Google Scholar] [CrossRef]
  17. Dong, X.W.; Pei, C.C.; Deng, W.; Li, B.; Dai, H. Research on control strategy of distributed energy storage system in distribution network with new energy. Electr. Power Constr. 2021, 42, 8189. [Google Scholar]
  18. Cheng, L.; Qi, N.; Tian, L. Joint Planning of Generalized Energy Storage Resources and Distributed Power Sources Considering Operation Control Strategies. Power Syst. Autom. 2019, 43, 27–35+43. [Google Scholar]
  19. Ding, M.; Fang, H.; Bi, R.; Liu, X.F.; Pan, J.; Zhang, J.J. Location and Capacity Planning for distributed Photovoltaic and energy storage in distribution Networks based on cluster division. Proc. CSEE 2019, 39, 2187–2201. [Google Scholar] [CrossRef]
  20. Liu, J.Y.; Guo, L.; Yang, S.Q. Optimal Configuration Method of Multi-photovoltaic Storage Microgrid System in Distribution Network. Power Grid Technol. 2018, 42, 2806–2815. [Google Scholar]
  21. Peng, C.; Yu, Y.; Sun, H. Planning of Integrated Photovoltaic and Storage System for Distribution Network Based on Source-Grid-Load Collaborative Optimization. Power Grid Technol. 2019, 43, 3944–3951. [Google Scholar]
  22. Girvan, M.; Newman, M.E.J. Community structure in social and biological networks. Proc. Natl. Acad. Sci. USA 2002, 99, 7821–7826. [Google Scholar] [CrossRef]
  23. Wang, H.; Xu, X.; Yan, Z. Multi-Objective Safety Constraint Unit Combination Optimization Model Considering Flexible Load and Its Solution. Power Grid Technol. 2017, 41, 1904–1912. [Google Scholar] [CrossRef]
  24. Kuo, R.J.; Gosumolo, M.; Zulvia, F.E. Multi-objective particle swarm optimization algorithm using adaptive archive grid for numerical association rule mining. Neural Comput. Appl. 2019, 31, 3559–3572. [Google Scholar] [CrossRef]
  25. Ai, X.; Qin, J.; Hu, H.; Wang, Z.D.; Peng, D.; Zhao, L. Comprehensive evaluation of power grid security and efficiency based on the optimal worst method-entropy weight-approximation to the ideal solution. Modern Power 2021, 38, 60–68. [Google Scholar] [CrossRef]
  26. Lin, S.; Wu, J.; Mo, C.; Wang, Z.Q.; Guo, Q.Y. Dynamic reactive power partitioning and optimization method for distribution network with distributed power supply based on second-order cone programming. Power Grid Technol. 2018, 42, 238–246. [Google Scholar] [CrossRef]
  27. Gao, H.; Liu, J.; Shen, X.; Xu, R. Optimal power flow research in active distribution network and its application examples. Proc. CSEE 2017, 37, 1634–1645. [Google Scholar] [CrossRef]
Figure 2. Dual-layer optimization logic structure diagram of DPV and energy storage.
Processes 13 02841 g002
Figure 3. Mapping of objective function to grid space.
Processes 13 02841 g003
Figure 4. External archiving strategy.
Processes 13 02841 g004
Figure 5. Second-order cone relaxation process.
Processes 13 02841 g005
Figure 6. IEEE33 network cluster division comparison diagram: (a) cluster division result based on modularity index of electrical distance; (b) cluster division result considering multiple cluster division indicators.
Processes 13 02841 g006aProcesses 13 02841 g006b
Figure 7. Typical daily load curve.
Processes 13 02841 g007
Figure 8. DPV daily output curve.
Processes 13 02841 g008
Figure 9. Planning cluster DPV and ESS capacity optimization results.
Processes 13 02841 g009
Figure 10. The iterative process of the solution scheme for Scenario 3 and Scenario 4: (a) annual comprehensive net-cost iteration diagram of the distribution network for Scenario 3; (b) annual comprehensive net-cost iteration diagram of the distribution network for Scenario 4.
Processes 13 02841 g010
Figure 11. Comparison of the costs of the fourscenarios and the light abandonment rate.
Processes 13 02841 g011
Figure 12. Scenario 3: 24 h output of energy storage and time-of-use electricity price curve.
Processes 13 02841 g012
Figure 13. The load change curves of the scenarios.
Processes 13 02841 g013
Table 1. Comparison of comprehensive indicators under different weights.
CaseWeight SchemeComprehensive Index φComparison
Equal-weight(0.25, 0.25, 0.25, 0.25)0.842
Case 1(0.40, 0.15, 0.25, 0.20)0.833−1.1%
Case 2(0.15, 0.40, 0.25, 0.20)0.829−1.5%
Table 2. Assignment of values to quasi-measurements.
Scale Value mijDefinition of the Relative Importance
1The former is roughly equal to the latter
3The former is slightly larger than the latter
5The former is larger than the latter
7The former is much larger than the latter
9The former is greater than the latter
2, 4, 6, 8The median of the above adjacent judgment
Table 3. Random consistency index information.
n123456789
RI000.580.901.121.241.321.411.45
Table 4. Time-of-use electricity purchase price and time-of-use electricity sale price.
SegmentationPeriod of TimeTime-of-Use Electricity Purchase Price [USD/kW·h]Time-of-Use Electricity Sale Price [USD/kW·h]
Peak period11:00–15:00, 19:00–23:001.060.89
Regular period8:00–11:00, 15:00–19:00,
23:00–24:00
0.730.54
Valley period0:00–8:000.290.26
Table 5. Parameters related to DPV.
Parameter/VariableDistributed Photovoltaic
Power grid utilization hours5400 h
The operational and maintenance cost per unit of power generation0.16 USD/kW·h
Life of DPV15 years
Discount rate0.08
Table 6. Parameters related to ESS.
Parameter/VariableEnergy-Storage System
Investment and operational cost per unit capacity2450 USD/kW·h
Investment and operational cost per unit power1250 USD/kW
Operating cost per unit of electricity generated0.07 USD/kW·h
Charging and discharging efficiency90%
First and second limits of SOC for ESS[0.1, 0.9]
Durable years15 years
Discount rate0.08
Table 7. The optimal configuration results for photovoltaic and energy storage for each cluster.
ParameterDPV Access LocationDPV Corresponds to Access Power/kWESS Access
Location
ESS Corresponds to Access Power/kWESS Corresponds to
Access Capacity/kW·h
Scenario 1-----
Scenario 214, 24236, 344---
Scenario 38, 14
19, 24
225, 492
100, 205
8, 14
19, 24
54, 85
29, 60
204, 385
97, 255
Scenario 48, 15
19, 24
145, 355
326, 183
8, 15
19, 24
20, 67
96, 34
84, 268
324, 165
Table 8. The results of the economic comparative analysis of each scenario.
ParameterInvestment Cost
(Thousand USD)
Operation and Maintenance Cost (Thousand USD)Abandoned Light Cost (Thousand USD)Network Loss Cost
(Thousand USD)
Net Cost of
Electricity Purchased from the Main Net (Thousand USD)
Total Cost (Thousand USD)
Scenario 1---2025.820,153.622,179.4
Scenario 2952.58 292.3173.91732.616,371.719,523.08
Scenario 31846.9663.9125.31264.913,326.917,227.9
Scenario 41543.9586.4184.91437.815,143.918,896.9
Table 9. Comparative analysis results of load peak–valley difference.
ParameterLoad Peak (MW)Load Valley (MW)Peak–Valley Difference (MW)
Scenario 12.61431.13221.4821
Scenario 22.56371.18231.3814
Scenario 32.44211.25871.1834
Scenario 42.49321.21351.2797
Disclaimer/Publisher’s Note: The statements, opinions and data contained in all publications are solely those of the individual author(s) and contributor(s) and not of MDPI and/or the editor(s). MDPI and/or the editor(s) disclaim responsibility for any injury to people or property resulting from any ideas, methods, instructions or products referred to in the content.