Article

Study on Multifactorial Effects Influencing the Critical Hot-Spot Temperature of Emulsified Matrix and Its Thermal Safety

by
Yibo Zhang
,
Yan He
and
Xingxing Liang
*
Faculty of Public Safety and Emergency Management, Kunming University of Science and Technology, Lianhua Campus, No. 68 Wenchang Road, No. 121 Avenue, Kunming 650093, China
*
Author to whom correspondence should be addressed.
Processes 2025, 13(9), 2840; https://doi.org/10.3390/pr13092840
Submission received: 7 July 2025 / Revised: 25 August 2025 / Accepted: 2 September 2025 / Published: 4 September 2025
(This article belongs to the Section Chemical Processes and Systems)

Abstract

This study focuses on the critical ignition conditions of emulsified matrix, defining the critical hot-spot temperature as the temperature at which the ignition probability of the emulsified matrix reaches 1% under the influence of an internal heat source within a fixed duration. By establishing an experimental system, the critical hot-spot temperature of the emulsified matrix was systematically determined by combining the Langley method with maximum likelihood estimation for statistical analysis. Furthermore, the influence of bubble content and ambient pressure on the critical hot-spot temperature was investigated. The study reveals that the critical hot-spot temperature decreases with increasing ambient pressure (at 1 atm, 2 atm, and 3 atm) and bubble content (at 0%, 1.5%, and 3%). However, under the coupled effects of ambient pressure and bubbles, bubble overflow phenomena may attenuate their influence.

1. Introduction

Emulsion explosive is a novel industrial explosive primarily characterized by an emulsified matrix. Its distinctive feature lies in its unique microstructure: a continuous oil phase and a discontinuous aqueous phase containing ammonium nitrate solution. These phases are stabilized by emulsifiers to form a highly stable emulsion system [1,2]. This unique structure endows emulsion explosives with superior water resistance, efficient energy release capabilities, and enhanced safety performance [3,4,5]. Emulsion explosives have been widely utilized in mining, building demolition, and engineering blasting due to their advantages of low cost, minimal environmental pollution, and abundant raw material sources, gradually becoming a crucial component of the global industrial explosives market. Although emulsion explosives are theoretically considered to possess high safety standards, the frequent occurrence of explosions during production, transportation, and storage in recent years has revealed their underlying safety risks [6,7,8]. These incidents have not only resulted in severe casualties and substantial property damage but have also significantly hindered the widespread application of emulsion explosives. Research indicates that the emulsion matrix is a critical factor in the safety of emulsion explosives, as its thermal decomposition characteristics directly govern the safety performance under high temperature, pressure, and other external stimuli [9]. The emulsion matrix serves as a fundamental component of emulsion explosives, and its thermal safety properties are intrinsically linked to the overall safety performance of these explosives [10]. Studies demonstrate that gas bubbles are inevitably entrapped within the emulsion matrix during the production process, and their collapse under high pressure may generate localized hot spots, which could potentially lead to ignition or even detonation [11]. For instance, studies by Bourne, Field et al. [12] have demonstrated that shock waves generated by high-speed jet-wall collisions, rapid compression-induced heating of gas within bubbles, and vortex effects constitute the primary mechanisms of hot spot formation. With the rapid growth in the demand for industrial explosives, investigations into the thermal safety of emulsion explosives have emerged as a prominent research focus. Scholars have systematically investigated the thermal decomposition behavior of emulsion matrices from multiple angles. For instance, thermally critical analysis techniques combining experimental and simulation approaches have been extensively employed, including differential scanning calorimetry (DSC), thermogravimetric analysis (TGA), and accelerating rate calorimetry (ARC) [13,14,15]. Furthermore, to further reduce the sensitivity of emulsion matrices, researchers have proposed various modification strategies, including low-temperature emulsification techniques, static emulsification processes, and optimized additive formulations [16].
From a theoretical standpoint, the critical hot-spot temperature (HST) constitutes a cardinal parameter in evaluating the thermal safety of explosives. It is operationally defined as the minimum hot-spot temperature required to initiate ignition [17]. However, conventional thermal critical parameters are typically derived from theoretical calculations, corresponding to a scenario where the ignition probability of the emulsion matrix reaches 100%. In actual production environments, there is a greater need to reduce the probability of ignition in the emulsion matrix. Therefore, determining the hotspot temperature at extremely low ignition probabilities—obtained through extensive experiments combined with mathematical statistical methods—would be more suitable as a standard for safety monitoring in practical production. Research in this field remains largely unexplored at present. Scholars such as Wang Liqiong [18] have investigated the effects of typical emulsifiers on the rheological properties and stability of emulsion matrices. They employed an automated rheometer to test the flow characteristics of matrices prepared with different emulsifiers and analyzed the mechanism of action of these emulsifiers by integrating surface tension tests with high-and-low temperature experiments. While these studies provide important references for understanding the fundamental properties of emulsion matrices, they lack systematic research on critical hotspot temperatures. This knowledge gap significantly hampers both the thermal safety monitoring and process optimization of emulsion explosives.
To address the aforementioned issues, this study redefines the critical hot-spot temperature (denoted as Tcig) from a thermal safety perspective by referencing classical thermodynamic definitions of critical parameters [19,20,21]. Specifically, Tcig is defined as the hot-spot temperature at which the emulsion matrix exhibits a 1% probability of ignition within a 10 min exposure period. Building upon this foundation, the present study developed an experimental system integrating the Langley method [22,23] and maximum likelihood estimation [24] to systematically investigate Tcig of emulsion matrices and its influencing factors, including ambient pressure, bubble content, and their coupled effects.

2. Experimental

2.1. Methodology

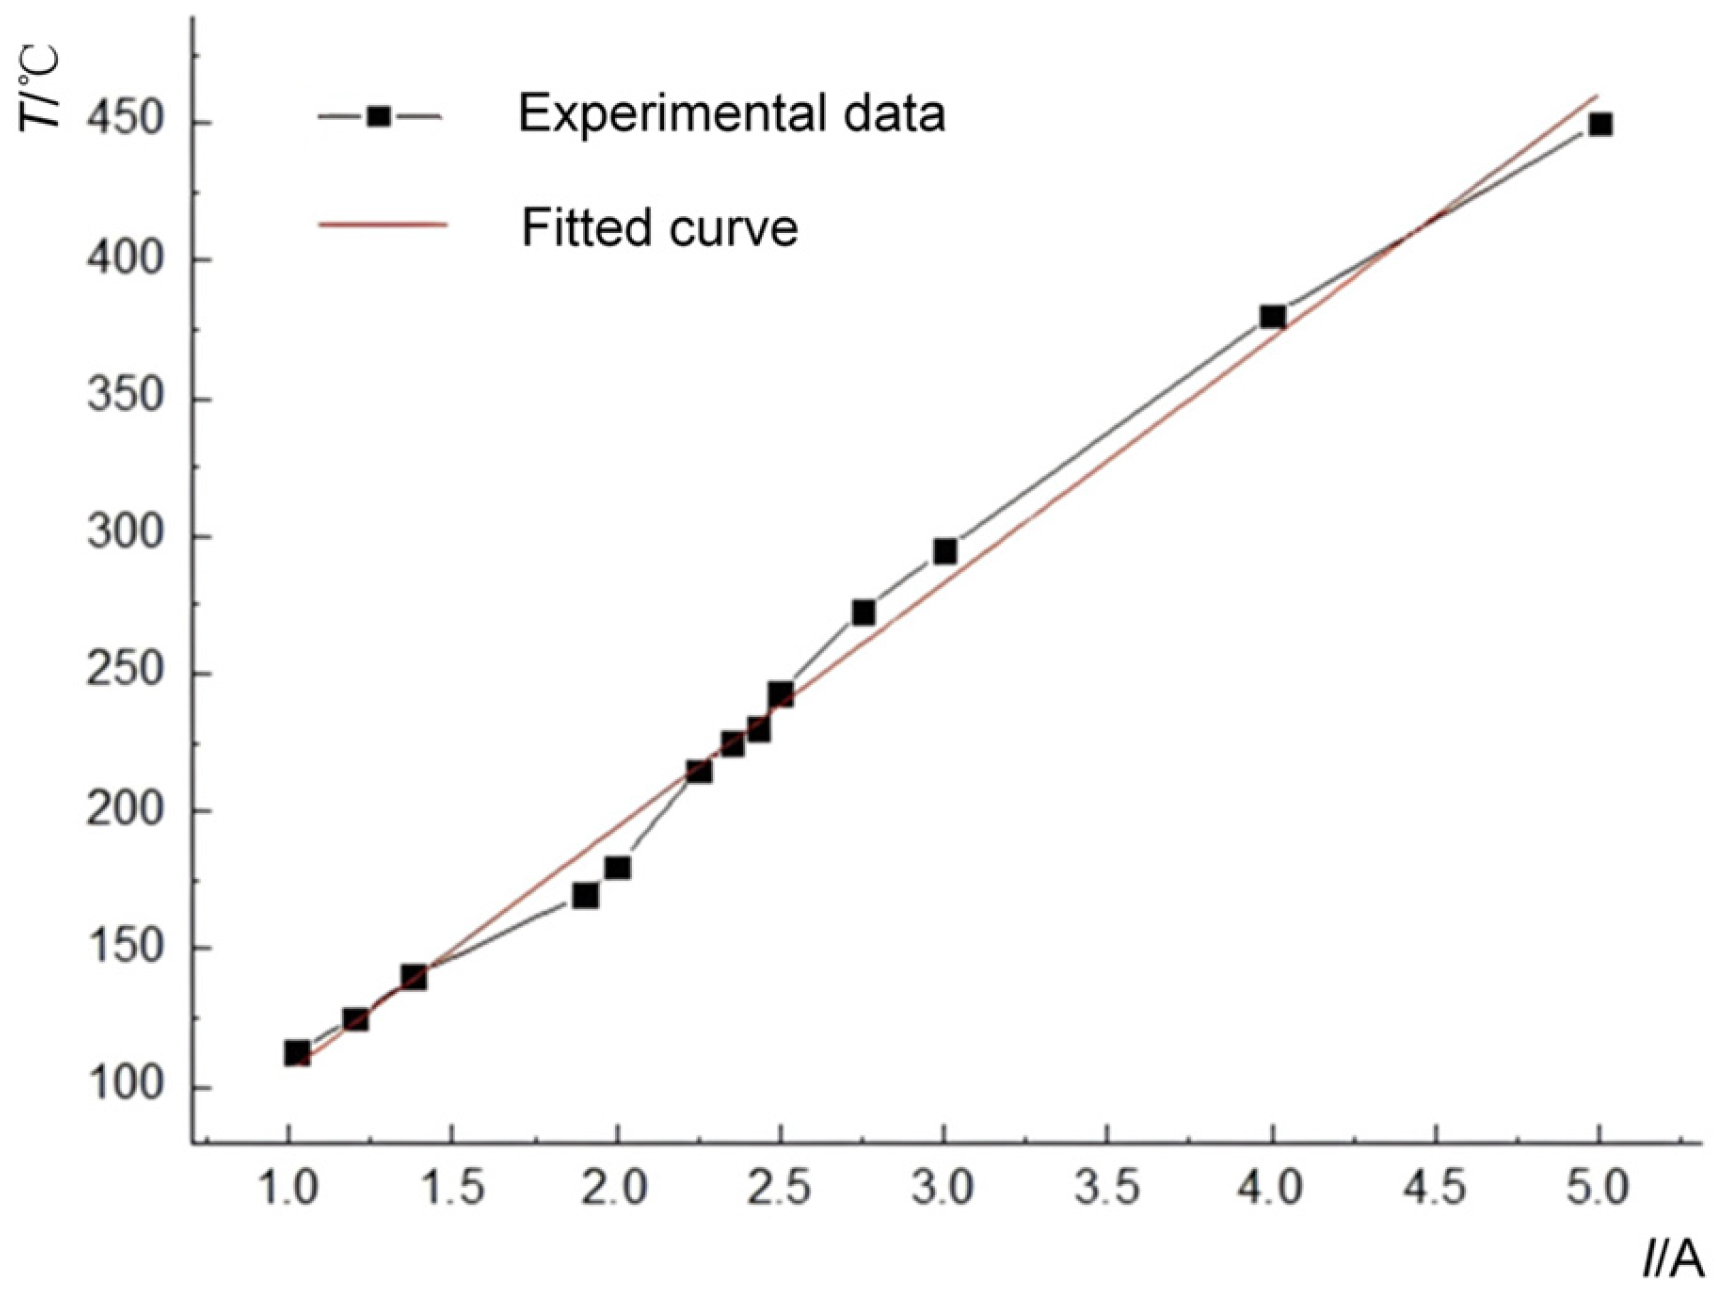
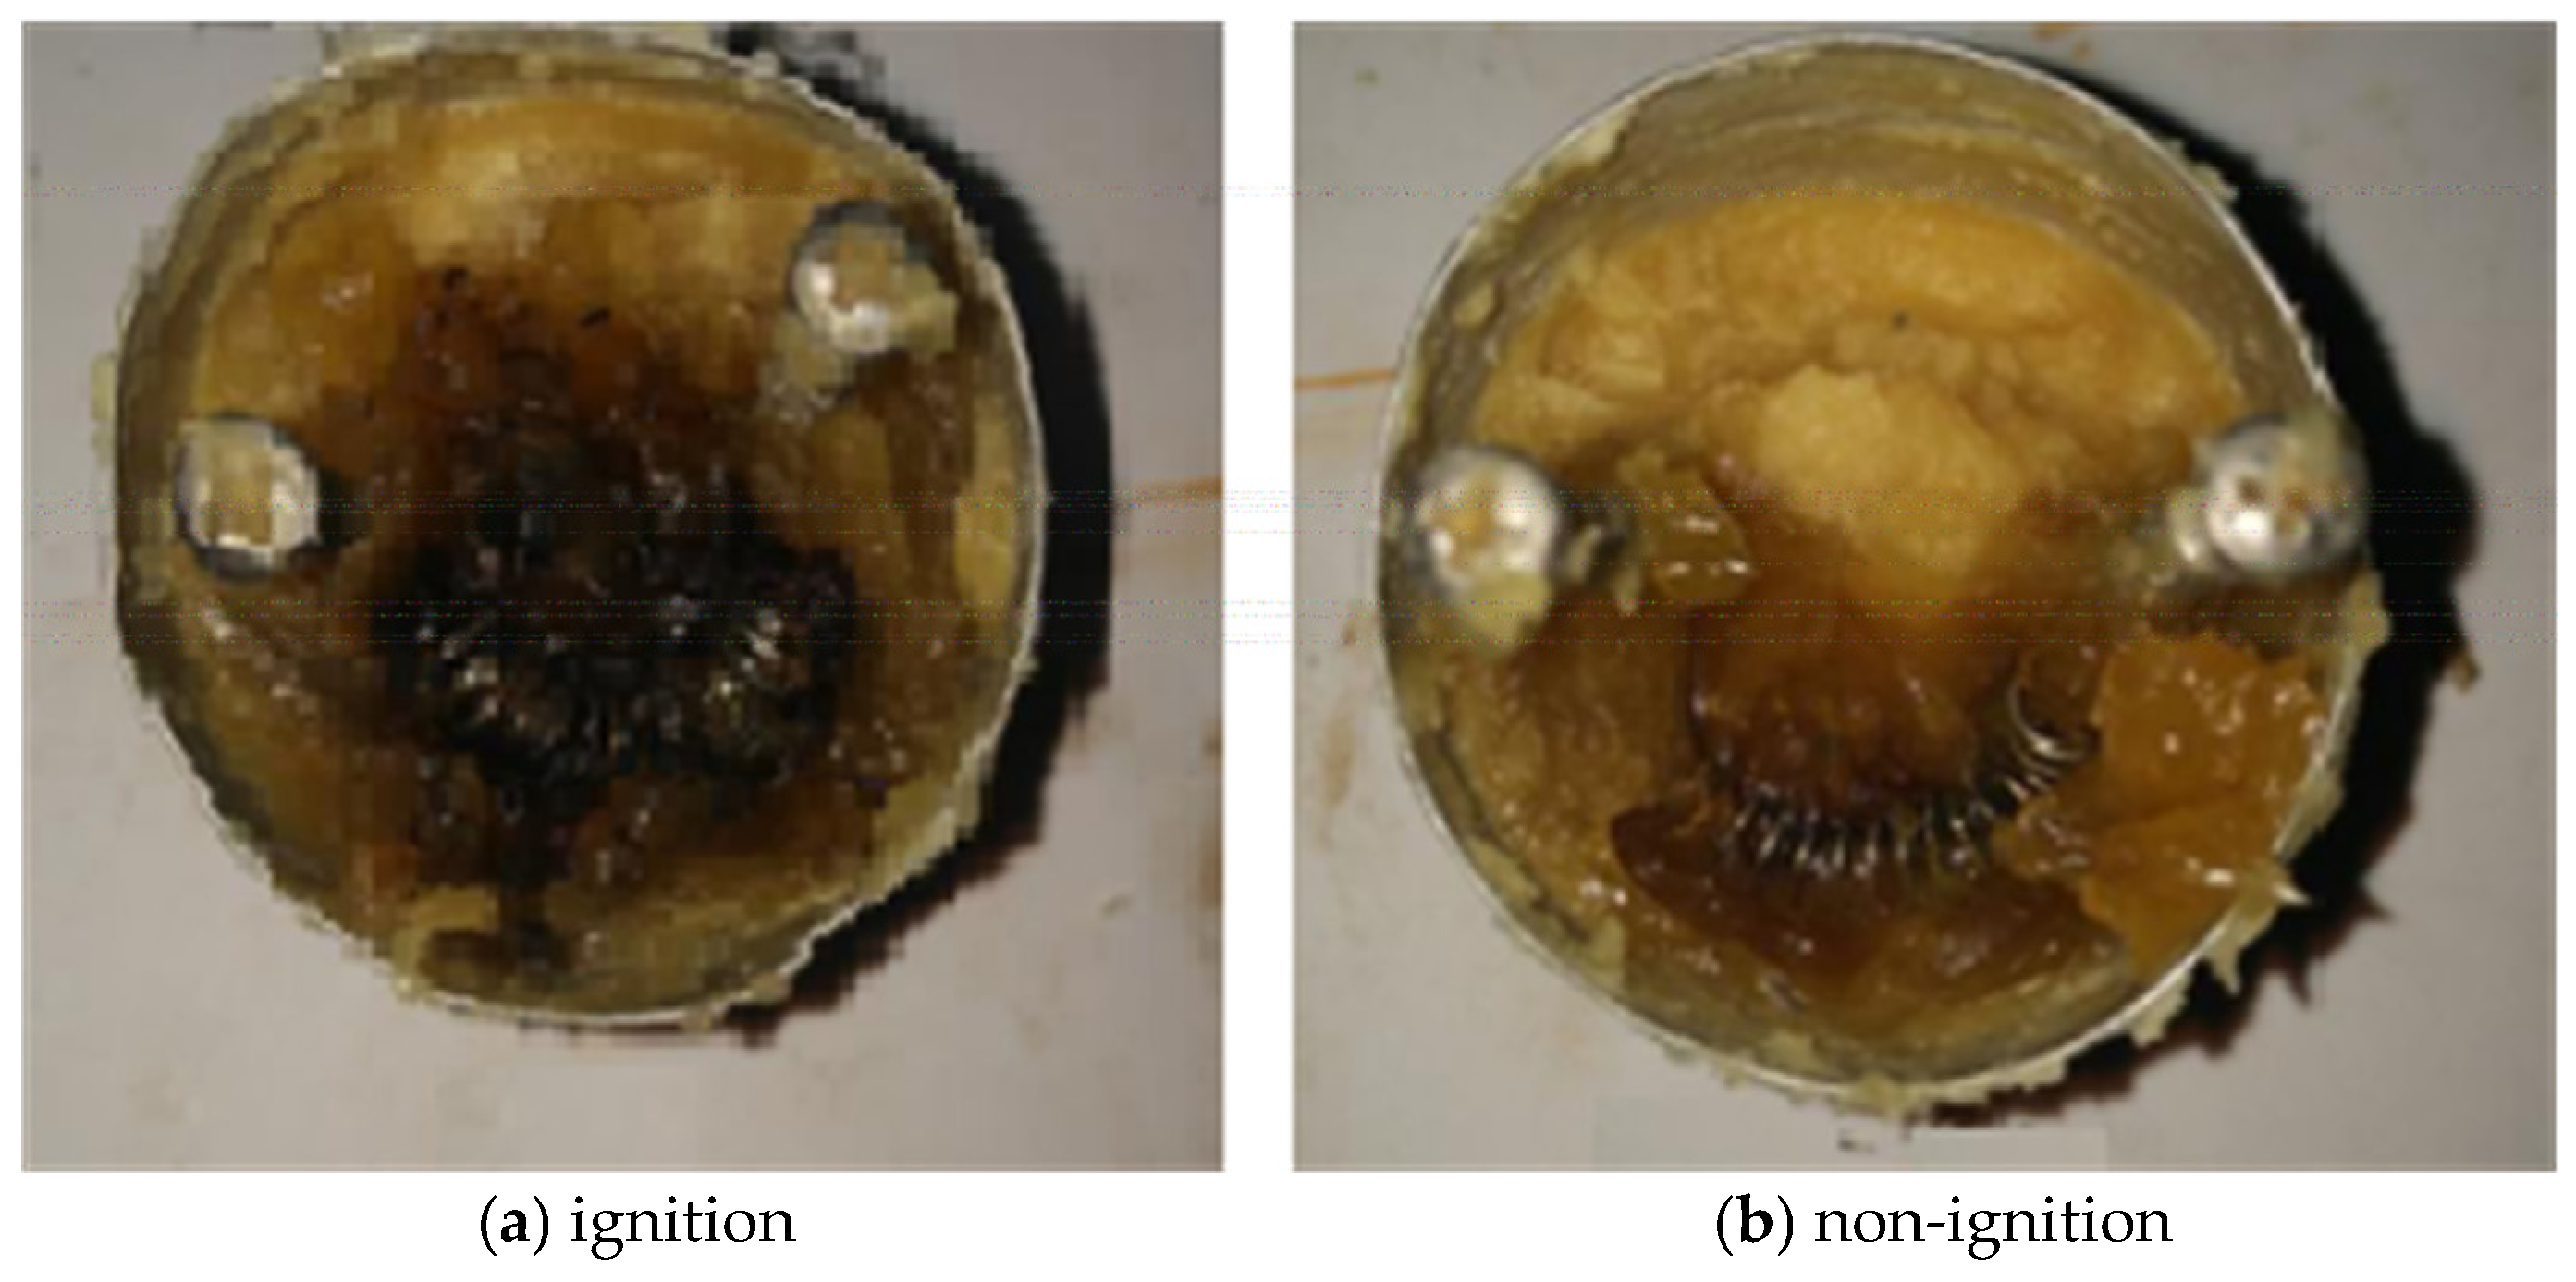
The experiment employed the Langley method to determine the ignition characteristics of the emulsion matrix under varying electrical current stimulation conditions. The maximum likelihood estimation (MLE) method was used to identify the magnitude of current stimulation corresponding to a 1% ignition probability, which was defined as the critical current intensity (Icig). Leveraging the temperature calibration results of the electric heating wire, as shown in Figure 1. and its linear fitting relationship, the temperature of the heating wire corresponding to the critical current intensity Icig at a 1% ignition probability was calculated based on this linearity; this temperature is referred to as Tcig. In this study, Tcig is defined as the hot-spot temperature at which the emulsion matrix exhibits a 1% probability of ignition within a 10 min period. During the design of the experimental system, comprehensive consideration was given to the heating method, sample cell, pressure vessel, and additives, aiming to accurately simulate localized hot spots generated within the emulsion matrix during the emulsification process while ensuring precise control over ambient pressure and the content of entrapped air bubbles in the emulsion matrix. An electrically heated wire technique was utilized to simulate localized hot spots within the emulsion system. A semi-enclosed cylindrical sample cell was employed, with the heating element made of nickel-chromium (NiCr) alloy wire. The criterion for determining whether ignition occurred in the emulsion matrix was whether the material surrounding the heating wire became charred and blackened, as illustrated in Figure 2. Given the unknown population mean and variance of the test specimens, coupled with experimental sample size constraints and safety considerations, the Langley method was systematically selected for this investigation. Pre-experimental preparations primarily involved calibrating Tcig measurement system and standardizing the emulsion matrix test specimens. The exploratory experiments estimated the lower boundary (IL) and upper boundary (IU) of the critical current stimulus, with the total number of experimental trials predetermined as N = 20. Following completion of preparatory procedures, the formal experimental sequence was conducted in accordance with the standardized Langley method protocol [22].
(1)
Based on the obtained lower and upper limits of electrical stimulation current (IL and IU), the initial stimulus intensity is determined as I 1 = ( I L + I U ) / 2 and the experimental response value ( p i = 1 or p i = 0 ) is recorded.
(2)
When the experiment reaches the k-th trial, the stimulus intensity for the (k + 1)-th trial is determined as I k + 1 = ( I k + I k * ) / 2 , where I k * is derived as follows: Starting from the most recent response p k , traverse backward through the sequence of responses ( p k , p k 1 , p k 2 , …) and count the occurrences of 1 (response) and 0 (no response). If, at any point p j , the number of responses equals the number of non-responses, then set I k * = I j . If no such equilibrium is found after checking the last “ n 1 ” trials, when p k = 0 (no response), set I k * = I U (upper stimulation limit); otherwise, set I k * = I L (lower stimulation limit).
(3)
The experimental procedure was discontinued when the trial count reached k = 20.
After obtaining the ignition responses of the emulsion matrix under different current intensities, the experimental data were processed using the maximum likelihood estimation (MLE) method to calculate the critical ignition current intensity (Icig) under varying conditions. Subsequently, based on the linear relationship between current intensity and the temperature of the electric heating wire, Tcig was determined.
Experimental data were analyzed via Maximum Likelihood Estimation [25] to estimate parameters by maximizing the likelihood function based on observed measurements, thereby determining Tcig. When an emulsion explosive is ignited using an electric heating wire, the temperature of the wire—as a function of current intensity—follows a normal distribution. Consequently, Tcig can be modeled as a normally distributed variable:
T c i g N μ , σ 2 ,
Here, μ and σ2 denote the unknown mean and variance, respectively. Accordingly, the probability density function (PDF) of Tcig follows:
f x ; μ , σ 2 = 1 2 π e x p 1 2 σ 2 x μ 2
To estimate μ and σ2, the maximum likelihood estimation (MLE) method is employed. The likelihood function is:
L μ , σ 2 = i = 1 n 1 2 π σ e x p 1 2 σ 2 x i μ 2
and its log-likelihood form simplifies to:
l n   L = n 2 l n ( 2 π ) n 2 l n σ 2 1 2 σ 2 i = 1 n x i μ 2
The solution leads to:
μ ^ = 1 n i = 1 n x i = 1 n i = 1 n X i = X ¯
Substituting μ ¯ = X ¯ into Equation (4), we obtain the solution:
σ ^ 2 = 1 n i = 1 n X i X ¯ 2
In Equations (4) and (5), μ ^ represents the maximum likelihood estimate (MLE) of μ , and σ ^ 2 is the MLE of σ 2 . By substituting these parameters into the probability density function (PDF)—specifically, setting μ = μ ^ and σ = σ ^ —the probability that the observed value x lies within the interval (a,b) can be expressed as:
P a X b = a b p x d x = 1 σ 2 π a b e x μ 2 2 σ 2 d x
Under the condition u = x μ σ , the PDF transforms to a standard normal distribution:
φ ( u ) = 1 2 π u e u 2 2 d u
The function values of ϕ ( u ) for various values of u can be retrieved from the standard normal distribution table shown in Table 1.
With u denoting the confidence factor, the interval probability P ( μ u σ < x < μ + u σ ) for varying u-values is derived using Equation (8).
P x μ u σ = 2 φ ( u ) 1
Based on Equation (8) and Table 1, the probabilities of x lying within the interval μ u σ , μ + u σ for varying values of u are calculated and summarized in Table 2.
According to the standard normal distribution, when u = 2.58, the probability of x falling within the interval μ u σ , μ + u σ is approximately 0.99. This indicates that the area under the probability density function ϕ ( u ) between μ 2.58 σ and μ + 2.58 σ accounts for 99% of the total probability. Consequently, the combined tail areas beyond μ ± 2.58 σ (i.e., x μ 2.58 σ and x μ 2.58 σ ) constitute less than 1% of the distribution. For critical hot-spot temperature analysis, this implies that the experimental mean and variance of the ignition current intensity in the emulsified matrix can be directly incorporated to determine the threshold temperature.

2.2. Experimental System

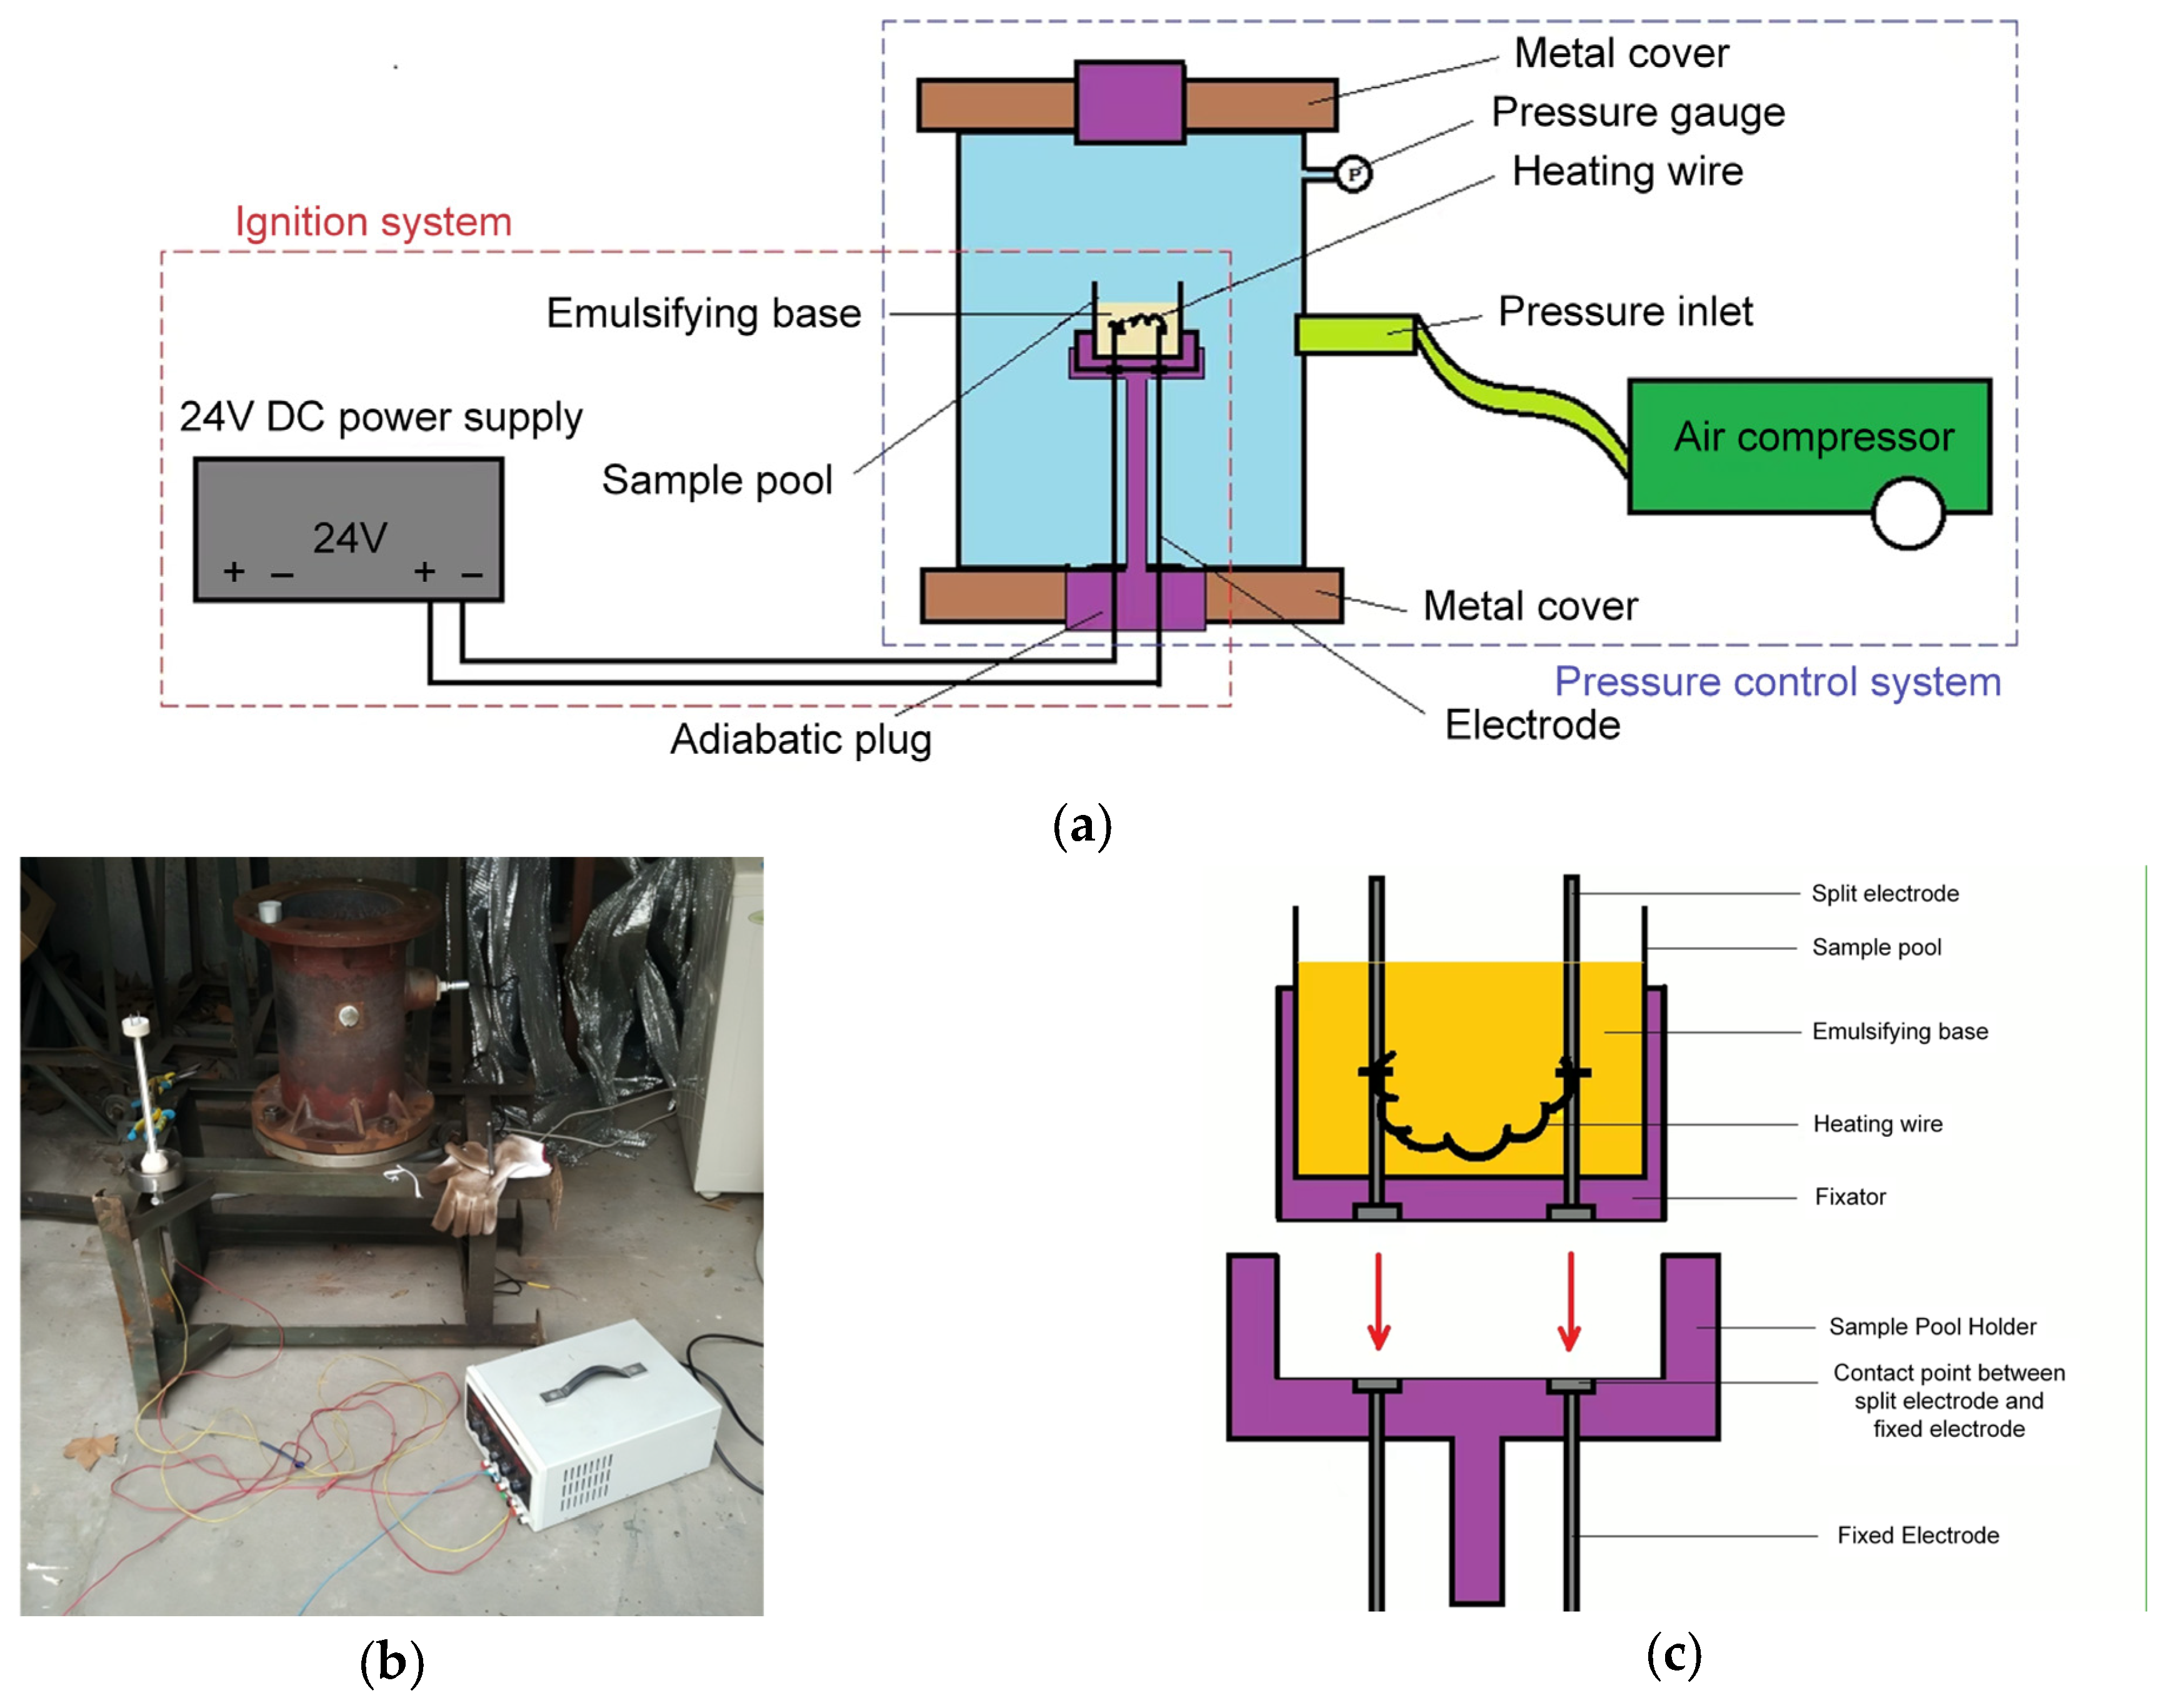
The experimental system comprises an ignition subsystem and a pressure-control subsystem, including essential components such as a pressure vessel, air compressor, and pressure gauges. The ignition system delivers controlled and stable thermal initiation through an integrated configuration consisting of a power supply unit and sample containment assembly. Specifically, the experiment employs a semi-confined cylindrical aluminum chamber with dimensions of φ38 mm × 24 mm (diameter × height), loaded with a 25 g explosive charge per trial to ensure efficient heat transfer and operational safety.
This design eliminates positioning misalignment inherent in tubular containers and demonstrates superior performance compared to PVC or cardboard alternatives, effectively isolating the influence of ambient pressure on ignition dynamics. A 0.5 mm diameter Nichrome (Ni-Cr) wire was selected as the heating element, as ferrochrome-aluminum alloys exhibit undesirable oxidation tendencies under experimental conditions.
The pressure-control system comprises a vertically separable cylindrical steel chamber (rated pressure capacity: 18 MPa; nominal volume: 12.5 L), an air compressor, and digital pressure gauges. Through integrated sealing treatment, the pressure vessel maintains a maximum internal pressure of 3.5 atm (≈354.6 kPa) with demonstrated pressure stability (±0.05 atm) over a 10 min duration. The compressed air supply system employs an oil-lubricated piston-type air compressor [26], coupled with an external pressure gauge (2.5 MPa full-scale range) for real-time monitoring of internal pressure dynamics. The ignition system provides controlled and stable thermal initiation through a configuration comprising:
Power supply unit: A 24 V bipolar DC power supply with 0.01 A current resolution, connected to fixed-length electrodes. Explosive containment assembly:
(1)
Sample containment chamber: φ38 × 24 mm cylindrical geometry;
(2)
Chamber fixture: Polytetrafluoroethylene (PTFE) support structure, selected for its high dielectric strength, corrosion resistance, and thermal stability up to 260 °C [27];
(3)
Modular electrodes: Detachable design enabling rapid sample replacement.
The experimental schematic of this system is shown in Figure 3a. The experimental setup consists of two main components: an ignition system and a pressure control system, with the physical apparatus depicted in Figure 3b. The structure diagram of a drug filling device (as shown in Figure 3c) consists of a sample cell, a sample cell holder, and split electrodes, adopting a modular split design for loading the emulsion matrix. The sample cell holder is made of polytetrafluoroethylene (PTFE), a material characterized by excellent insulation, corrosion resistance, and high temperature resistance. Two elongated electrodes are passed through the pre-reserved holes in the base of the ignition end to fix the sample cell. The device secures the split electrodes and the sample cell via an adapter. At its bottom, there are interfaces for the split electrodes and fixed electrodes, with the contact parts wrapped in a PTFE holder, which effectively prevents the emulsion matrix from oxidizing the electrodes. The split structure design enables quick replacement of components such as the sample cell, electrodes, and electric heating wires by simply taking out the adapter and the sample cell simultaneously, significantly improving the experimental efficiency. In addition, each split electrode is equipped with a nut at its front end for fixing the electric heating wire, ensuring the stable positioning of the heating element.
Samples were prepared using industrial-standard formulations (compositional details provided in Table 3). To investigate the influence of gas bubble dynamics on critical hot-spot temperature, expanded perlite—employed as a sensitizing agent—was incorporated at dosage levels of 0%, 1.5%, and 3%. These concentrations correspond to the typical sensitizer range (~3%) used in commercial emulsion explosives.

3. Results and Discussion

3.1. Experimental Results

3.1.1. Impact of Ambient Pressure on Critical Hot-Spot Temperature

During the exploratory experimental phase, it was observed that the ignition delay time of the emulsion matrix was approximately 3 min when the nichrome heating filament reached ≈260 °C, whereas the delay increased to ≈10 min at ≈180 °C. Following the experimental protocol, trials with currents exceeding 1.5 A (IL > 1.5 A) were classified as high-temperature heating experiments, while those with currents below 1.5 A (IL < 1.5 A) were designated low-temperature heating experiments. To systematically investigate the pressure-dependent mechanisms influencing critical hot-spot temperature, both low-temperature and high-temperature heating experiments were conducted under controlled ambient pressure conditions.
(1)
Low-current heating experiments with electric heating wire (IL < 1.5 A)
This study first investigated the formation of low-temperature hot-spots within the emulsion matrix. Low-current heating was implemented using a nichrome filament, and exploratory experiments established the current excitation thresholds at IU = 4 A (upper limit) and IL = 1 A (lower limit). Subsequent experiments were conducted under controlled ambient pressures of 1 atm (101.325 kPa), 2 atm (202.650 kPa), and 3 atm (303.975 kPa) with a fixed electrification duration of 10 min. The ignition response results under varying current excitation levels are summarized in Table 4. The experimental setup in this study involves placing a semi-enclosed sample chamber inside a sealed container, with internal heating applied to the sample within the chamber. Considering the potential for heat dissipation from the semi-enclosed sample chamber into the sealed container, the observed behavior may differ from the general principle in fundamental combustion physics where increased pressure enhances ignition probability.
The ignition response distributions under three ambient pressures (1 atm [101.325 kPa], 2 atm [202.650 kPa], and 3 atm [303.975 kPa]) are shown in Figure 4. Following the Langley reliability criterion, experimental validity was confirmed by observing mixed-response regions (where non-ignition stimuli exceeded ignition stimuli). At 1 atm, Trial 14 (I = 2.10 A) ignited, while Trial 19 (I = 2.12 A) failed. At 2 atm, Trial 7 (I = 1.92 A) showed no ignition, but Trial 12 (I = 1.92 A) succeeded. At 3 atm, Trial 4 (I = 1.94 A) ignited, whereas Trial 14 (I = 1.94 A) did not. The consistent emergence of mixed-response zones across all pressures validates the statistical reliability of the experimental results.
By substituting the current excitation levels into Equations (4) and (5), the mean values and standard deviations of the current stimuli under ambient pressures of 1 atm (101.325 kPa), 2 atm (202.650 kPa), and 3 atm (303.975 kPa) were computed and are summarized in Table 5.
By substituting the mean values and standard deviations of current stimuli under three pressure conditions (1 atm [101.325 kPa], 2 atm [202.650 kPa], and 3 atm [303.975 kPa]) into Equation (8), the critical current intensity and current thresholds corresponding to 50% and 99% ignition probabilities were calculated. Using the calibrated current-temperature correlation, the resultant nichrome filament temperatures were derived and are tabulated in Table 6.
When the electric heating wire heats the emulsified matrix at a lower temperature, the ignition current (Icig) is 1.38 A with a corresponding ignition temperature (Tcig) of 140 °C under the ambient pressure of 1 atm. At elevated ambient pressures, these parameters exhibit a decreasing trend: Icig decreases to 1.20 A with Tcig = 125 °C at 2 atm, and Icig further declines to 1.08 A with Tcig = 115 °C at 3 atm. The critical hot-spot temperature exhibits a significant decrease with increasing ambient pressure. This phenomenon arises from the acceleration of the decomposition reaction kinetics in the emulsified matrix under elevated pressure conditions. The applied pressure enhances heat generation rates by accelerating exothermic reactions, thereby lowering the minimum hot-spot temperature required for the matrix to reach its ignition threshold.
(2)
High-temperature heating experiments with electric heating wire (IL > 1.5 A)
When elevated-temperature hot spots develop within the emulsified matrix (i.e., under conditions of high electric heating wire temperatures), a significant reduction in the ignition delay period is observed. Consequently, a standardized heating duration of 3 min was adopted for all experimental trials. Through preliminary exploratory testing, the upper and lower bounds of current intensity were empirically determined to be IU = 3 A and IL = 2 A, respectively. The experimental protocol utilized the Langlie method, with the resulting ignition response characteristics quantitatively summarized in Table 7.
The ignition response distribution of the emulsified matrix under three distinct pressure conditions (1 atm, 2 atm, and 3 atm) is presented in Figure 5. As illustrated, the transition to mixed-result regimes occurs at the 15th, 11th, and 8th experimental trials for 1 atm, 2 atm, and 3 atm conditions, respectively. This systematic shift in transitional thresholds with increasing pressure confirms the statistical validity and experimental reliability of the test methodology.
The mean values and standard deviations of the emulsified matrix stimulus parameters under 1 atm, 2 atm, and 3 atm ambient pressures were determined through maximum likelihood estimation (MLE), with quantitative results detailed in Table 8.
Following advanced data processing, the corresponding current values for specified ignition probabilities of the emulsified matrix at 1 atm, 2 atm, and 3 atm ambient pressures were derived. Subsequent calibration against reference standards yielded the associated electric heating wire temperatures, as systematically presented in Table 9.
The experimental data obtained under three-minute high-temperature hot-spot heating conditions revealed minimal variation in critical ignition parameters across different ambient pressures. Specifically, the critical ignition current (Icig) measured 2.15 A (Tcig = 205 °C) at 1 atm, 2.13 A (Tcig = 202 °C) at 2 atm, and 2.14 A (Tcig = 203 °C) at 3 atm, demonstrating negligible pressure dependence of the critical hot-spot temperature under elevated thermal loading conditions. Analysis indicates that during high-temperature heating, the electric heating wire’s temperature is significantly higher than that of the emulsified matrix, enabling rapid heating of the matrix to its ignition temperature. Additionally, the temperature rise in the emulsified matrix induced by increasing ambient pressure is much slower compared to heating by the high-temperature electric wire. Therefore, under high-temperature hot-spot conditions, ambient pressure exerts minimal influence on the critical hot-spot temperature of the emulsified matrix.

3.1.2. Influence of Gas Bubbles on Critical Hot-Spot Temperature

During the preparation of emulsified matrices, air bubbles often become entrained, which increases the sensitivity of the matrix and adversely affects the thermal safety of the emulsification process. Since controlling the amount of intentionally added bubbles is challenging, this study employs expanded perlite as a bubble carrier. The dosage of expanded perlite can be precisely controlled, enabling systematic investigation of how bubble content influences the critical hot-spot temperature of the emulsified matrix. Using the same calculation method as described in the previous section, the critical hot-spot temperatures of the emulsified matrix were determined under an ambient pressure of 1 atm for expanded perlite contents of 0%, 1.5%, and 3%, respectively. In this experiment, only low-temperature hot-spot scenarios were considered. The influence of expanded perlite on the ignition response of the emulsified matrix is presented in Table 10.
The ignition response distribution of the emulsified matrix at 1 atm, obtained from the experiment, is shown in Figure 6. When the expanded perlite contents were 0%, 1.5%, and 3%, the emulsified matrix samples exhibited mixed-result zones in the 14th, 12th, and 11th experiments, respectively, demonstrating the reliability and validity of the experimental results. The data were processed using the maximum likelihood estimation method, and the means and standard deviations of the ignition currents for the emulsified matrices containing 0%, 1.5%, and 3% expanded perlite are presented in Table 11.
The current values corresponding to specified ignition probabilities and their associated heating wire temperatures for emulsified matrices containing 0%, 1.5%, and 3% expanded perlite at 1 atm ambient pressure were determined through maximum likelihood estimation (MLE), with complete quantitative results presented in Table 12.
The experimental results show that the critical hot-spot temperature Tcig of the emulsified matrix without expanded perlite is 140 °C. In contrast, for emulsified matrices containing 1.5% and 3% expanded perlite, the critical hot-spot temperatures Tcig are 140 °C and 110 °C, respectively. Overall, the critical hot-spot temperature decreases as the amount of expanded perlite increases. This indicates that, within the scope of this study, higher bubble content correlates with reduced safety in the production of the emulsified matrix. The analysis suggests that as bubble content increases, the sensitivity of the emulsified matrix gradually rises, reducing the heat required for ignition and consequently decreasing the critical hot-spot temperature.

3.1.3. Coupled Effects of Gas Bubbles and Ambient Pressure on Critical Hot-Spot Temperature

The previous two parts of this study investigated the influence laws of single factors, namely ambient pressure and expanded perlite content, on the critical ignition temperature of the emulsified matrix. This section focuses on analyzing the variation in the critical hot-spot temperature under the combined effects of both factors (expanded perlite content and ambient pressure). When the ambient pressure was 2 atm or 3 atm, the influence of expanded perlite content on the critical hot-spot temperature was systematically studied. Specifically, Table 13 presents the experimental results for the case when the ambient pressure was maintained at 2 atm.
(1)
Experimental Investigation on the Influence of Expanded Perlite at 2 atm Ambient Pressure
Table 13. Ignition response of emulsified matrix containing expanded perlite with different percentages at 2 atm.
i0%1.5%3%
I/ApiI/ApiI/Api
12.5012.5012.501
21.7501.7501.750
32.1312.1312.131
41.9411.9411.941
51.4701.4701.470
61.7001.7101.700
71.9201.9211.921
82.9611.8101.811
92.4411.8711.640
102.0711.8401.730
111.7701.8501.821
121.9212.9311.780
131.8502.3911.801
141.8802.1211.800
152.1611.7901.800
162.0201.9512.901
172.0911.8702.351
182.0512.0012.071
191.9501.9301.861
201.9911.9611.430
When the ambient pressure was maintained at 2 atm, the ignition response distributions of the emulsified matrices containing 0%, 1.5%, and 3% expanded perlite are shown in Figure 7. The results demonstrate that the emulsified matrix samples with 0%, 1.5%, and 3% expanded perlite exhibited mixed-result zones in the 16th, 19th, and 14th experiments, respectively, confirming the validity of the experimental data.
The means and mean square deviations of the stimulating currents for the emulsified matrices containing 0%, 1.5%, and 3% expanded perlite under an ambient pressure of 2 atm were determined using the maximum likelihood estimation method, as summarized in Table 14. Subsequent calculations revealed the current values corresponding to different ignition probabilities, along with the associated heating wire temperatures, for the same emulsified matrices under 2 atm ambient pressure. These results are compiled in Table 15.
As shown in Table 15, under an ambient pressure of 2 atm, the critical current intensity Icig of the emulsified matrix without expanded perlite is 2.03 A, with the corresponding critical hot-spot temperature Tcig being 180 °C. For the emulsified matrix containing 1.5% expanded perlite, the critical current intensity Icig decreases to 1.19 A, and the critical hot-spot temperature Tcig reduces to 120 °C. When the expanded perlite content increases to 3%, the critical current intensity Icig further lowers to 1.02 A, while Tcig slightly decreases to 113 °C. The experimental results indicate that, at 2 atm ambient pressure, the critical hot-spot temperature still decreases with increasing bubble content in the emulsified matrix, but the rate of decline slows as the bubble content rises.
(2)
Experimental Investigation of Expanded Perlite Effects under 3 atm Ambient Pressure
Table 16 presents the ignition response characteristics of the emulsified matrix containing expanded perlite at different percentages under 3 atm ambient pressure. The ignition response distributions of the emulsified matrices with varying expanded perlite contents at 3 atm are presented in Figure 8. As shown in the figure, the emulsified matrix samples containing 0%, 1.5%, and 3% expanded perlite exhibited mixed-result zones in the 14th, 16th, and 15th experiments, respectively. These results validate the experimental data.
Using the maximum likelihood estimation method, the influence of expanded perlite content on the mean and variance of the stimulating current in the emulsified matrix under 3 atm ambient pressure was analyzed, as summarized in Table 17. The calculated current values corresponding to different ignition probabilities, along with the associated heating wire temperatures, for the emulsified matrices with varying expanded perlite contents are presented in Table 18.
As shown in Table 18, under an ambient pressure of 3 atm, the critical current intensity Icig of the emulsified matrix without expanded perlite is 1.08 A (corresponding to Tcig of 115 °C) when the ignition probability is 1%. When the expanded perlite content increases to 1.5% and 3%, the critical current intensity Icig remains unchanged at 1.09 A, with the corresponding Tcig also maintaining a constant value of 116 °C. The experimental results demonstrate that, the critical hot-spot temperature does not decrease with increasing bubble content in the emulsified matrix.
3.2. Mechanistic Analysis and Discussion

The critical hot-spot temperatures of the emulsified matrix samples containing 0%, 1.5%, and 3% expanded perlite under three ambient pressure conditions (as shown in Table 19) were determined experimentally. The results indicate that the critical hot-spot temperature remains unaffected by the increased bubble content in the emulsified matrix.
As quantitatively demonstrated in Table 19, Tcig of emulsified matrices containing 0% and 1.5% expanded perlite exhibits a pressure-dependent decrease with increasing ambient pressure. Based on established research findings [29], analytical evidence suggests that while the intrinsic decomposition temperature of the emulsified matrix remains invariant to pressure variations, elevated ambient pressures significantly enhance the thermal decomposition reaction rate, accelerate heating rates, and amplify exothermic output per unit time. Consequently, higher pressures reduce both the ignition induction period and the requisite critical hot-spot temperature. Enhanced pressure further improves thermal coupling efficiency at the matrix–filament interface, reducing convective heat losses, thereby optimizing energy transfer. In contrast, under ambient pressure of 1 atm, the critical hot-spot temperature of the emulsified matrix decreases from 140 °C to 110 °C as the bubble content increases. Analysis indicates that bubbles introduced by expanded perlite enhance thermal sensitivity, thereby reducing the energy required for ignition.
Compared to single-factor influences, the variation in Tcig of the emulsified matrix under dual-factor coupling (ambient pressure and bubble content) exhibits significantly greater complexity. As shown in Table 19, at 2 atm ambient pressure, increasing bubble content reduces Tcig, whereas at 3 atm, elevated bubble content paradoxically induces a slight temperature increase. This indicates that the emulsified matrix exhibits varying bubble-carrying capacities under different pressures. As ambient pressure increases, bubbles may overflow from the matrix, reducing thermal sensitivity and thereby slightly elevating the Tcig. Previous research [30] indicates that the initial decomposition temperature of the emulsified matrix (under the formulation used in this study) is approximately 110 °C. This implies that the emulsified matrix can only attain the exothermic decomposition reaction temperature when a hot spot within it reaches a temperature slightly above 110 °C. Furthermore, the closer the hot spot temperature is to 110 °C, the longer the ignition delay period becomes, as the matrix approaches the threshold for thermal decomposition. As shown in Table 7, for the emulsified matrix without expanded perlite, a hot spot with a 99% ignition probability within 10 min requires a temperature of 300 °C, which exceeds the critical ignition temperature of the emulsified matrix. Through this experiment, we determined that when the ignition delay period is 10 min and the ignition probability of the emulsified matrix is 1%, the corresponding hot spot temperature is 140 °C. This temperature not only satisfies the basic conditions for ignition of the emulsified matrix but also remains below its critical ignition threshold.
When defining the Tcig at an ignition probability of 0.001, computational analysis reveals that the pure emulsified matrix exhibits a critical current intensity (Icig) of 1.21 A, corresponding to Tcig ≈ 127 °C. This value is lower than the Tcig = 140 °C observed at p = 0.01, a discrepancy attributable to the standard normal distribution principle wherein the area under the probability density function curve diminishes asymptotically as p approaches 0 or 1 [31]. Consequently, selecting p = 0.01 as the criterion for Tcig determination provides a statistically robust threshold that adequately satisfies industrial safety monitoring requirements, balancing sensitivity and operational practicality.

4. Conclusions

The study demonstrates that the critical hot-spot temperature of the emulsified matrix decreases with increasing ambient pressure and bubble content. However, when ambient pressure and bubbles act synergistically, the bubbles in the emulsified matrix may overflow as pressure rises. When the emulsified matrix is heated internally at low temperatures, its temperature rise rate is significantly slower compared to high-temperature heating. Consequently, the influence of ambient pressure on the critical hot-spot temperature is pronounced under low-temperature heating conditions, but becomes negligible under high-temperature conditions. Compared to the initial decomposition temperature and critical ignition temperature, the critical hot-spot temperature defined in this study offers a novel safety-oriented perspective for setting temperature monitoring thresholds in the production of emulsion explosives.

Author Contributions

Conceptualization, X.L.; methodology, Y.Z.; validation, Y.H. All authors have read and agreed to the published version of the manuscript.

Funding

This research received no external funding.

Data Availability Statement

The original contributions presented in this study are included in the article. Further inquiries can be directed to the corresponding author.

Acknowledgments

Special thanks are given to Nafeng Wang from the Institute of Process Engineering, Chinese Academy of Sciences, for her generous help when completing this paper.

Conflicts of Interest

The authors declare no conflicts of interest.

References

  1. Cooper, P.W.; Kurowski, S.R. Introduction to the Technology of Explosives; John Wiley & Sons: Hoboken, NJ, USA, 1997. [Google Scholar]
  2. Turcotte, R.; Lightfoot, P.; Fouchard, R. Thermal hazard assessment of AN and AN-based explosives. J. Hazard. Mater. 2003, 101, 1–27. [Google Scholar] [CrossRef]
  3. Xu, Z.-X.; Wang, Q.; Fu, X.-Q. Thermal stability and mechanism of decomposition of emulsion explosives in the presence of pyrite. J. Hazard. Mater. 2015, 300, 702–710. [Google Scholar] [CrossRef]
  4. Kramarczyk, B.; Pytlik, M.; Mertuszka, P. Novel sensitizing agent formulation for bulk emulsion explosives with improved energetic parameters. Materials 2022, 15, 900. [Google Scholar] [CrossRef]
  5. Ringgenberg, O.; Mathieu, J. Commercial high explosives. Chimia 2004, 58, 390. [Google Scholar] [CrossRef]
  6. Kramarczyk, B.; Suda, K.; Kowalik, P. Emulsion explosives: A tutorial review and highlight of recent progress. Materials 2022, 15, 4952. [Google Scholar] [CrossRef] [PubMed]
  7. Mertuszka, P.; Kramarczyk, B.; Pytlik, M. Implementation and verification of effectiveness of bulk emulsion explosive with improved energetic parameters in an underground mine environment. Energies 2022, 15, 6424. [Google Scholar] [CrossRef]
  8. Sitonio, F.F.; Koppe, J.C. Density monitoring of bulk emulsion explosives in confined blastholes. Holos 2024, 1, 3695. [Google Scholar] [CrossRef]
  9. Wang, S.; Xu, Z.-X.; Wang, Q. Thermal decomposition mechanism of emulsion explosives with phosphatide. J. Therm. Anal. Calorim. 2016, 124, 1053–1062. [Google Scholar] [CrossRef]
  10. Wang, K.; Xu, S.; Liu, D. Research on the critical temperature of thermal decomposition for large cartridge emulsion explosives. J. Loss Prev. Process Ind. 2015, 38, 199–203. [Google Scholar] [CrossRef]
  11. Xie, S.; Cai, X.; Wu, H. Effect of internal phase particle size on properties of site mixed emulsion explosive at plateau environment. Sci. Rep. 2024, 14, 8549. [Google Scholar] [CrossRef]
  12. Bourne, N.; Field, J.E. Bubble collapse and the initiation of explosion. Proc. R. Soc. Lond. Ser. A Math. Phys. Sci. 1991, 435, 423–435. [Google Scholar] [CrossRef]
  13. Danley, R.L. New heat flux DSC measurement technique. Thermochim. Acta 2002, 395, 201–208. [Google Scholar] [CrossRef]
  14. Wu, H.; Liu, S.-H.; Zhang, H. Pyrolysis analysis of emulsion explosive mixed industrial explosive with three preparation modes. Sci. Technol. Energ. Mater. 2022, 83, 43–47. [Google Scholar] [CrossRef]
  15. Chang, Y.-M.; Chen, C.-C.; Li, J.-S. Process safety assessment and thermal stability influence study on activation energy from four series of TNT based high explosives via grey entropy model. J. Therm. Anal. Calorim. 2023, 148, 9465–9476. [Google Scholar] [CrossRef]
  16. Forgiarini, A.; Esquena, J.; Gonzalez, C. Formation of nano-emulsions by low-energy emulsification methods at constant temperature. Langmuir 2001, 17, 2076–2083. [Google Scholar] [CrossRef]
  17. Merzhanov, A. On critical conditions for thermal explosion of a hot spot. Combust. Flame 1966, 10, 341–348. [Google Scholar] [CrossRef]
  18. Wang, L.; Fang, J. Rheological properties and water-in-oil structural stability of emulsion matrixes. Cent. Eur. J. Energ. Mater. 2013, 10, 87–102. [Google Scholar]
  19. Law, C.K. Theory of thermal ignition in fuel droplet burning. Combust. Flame 1978, 31, 285–296. [Google Scholar] [CrossRef]
  20. Shouman, A.R. A review of one aspect of the thermal-explosion theory. J. Eng. Math. 2006, 56, 179–184. [Google Scholar] [CrossRef]
  21. Huang, L.; Huang, J. Thermal energy simulation safety model of wupaolong fireworks based on Friedman method. Energy Rep. 2022, 8, 650–662. [Google Scholar] [CrossRef]
  22. Langlie, H. A reliability test method for ‘one-shot’ items. In Technical Report U-1792, 3rd ed.; Aeronutronic Division of Ford Motor Company: Newport Beach, CA, USA, 1962; pp. 146–165. [Google Scholar]
  23. Einbinder, S.K. One shot sensitivity test for extreme percentage points. In Proceedings of the Nineteenth Conference on the Design of Experiments in Army Research, Development and Testing, Rock Island, IL, USA, 24–26 October 1974. ARO-D Report, F. [Google Scholar]
  24. Pan, J.-X.; Fang, K.-T.; Pan, J. Maximum likelihood estimation. In Growth Curve Models and Statistical Diagnostics; Springer: New York, NY, USA, 2002; pp. 77–158. [Google Scholar]
  25. Wentzell, P.D.; Andrews, D.T.; Hamilton, D.C. Maximum likelihood principal component analysis. J. Chemom. J. Chemom. Soc. 1997, 11, 339–366. [Google Scholar] [CrossRef]
  26. She, X.; Zhang, T.; Peng, X. Liquid air energy storage for decentralized micro energy networks with combined cooling, heating, hot water and power supply. J. Therm. Sci. 2021, 30, 1–17. [Google Scholar] [CrossRef]
  27. Dovek, M.M.; Heben, M.J.; Lang, C.A. Design of a scanning tunneling microscope for electrochemical applications. Rev. Sci. Instrum. 1988, 59, 2333–2336. [Google Scholar] [CrossRef]
  28. Zhang, Y.-B.; Liu, Q.; Shi, X.-C. Thermal Safety Study of Emulsion Explosive Matrix under the Coupled Effects of Environmental Pressure and Bubble Content with Internal Heat Source. Processes 2024, 12, 1677. [Google Scholar] [CrossRef]
  29. Antonov, D.; Piskunov, M.; Strizhak, P. Breakup and explosion of droplets of two immiscible fluids and emulsions. Int. J. Therm. Sci. 2019, 142, 30–41. [Google Scholar] [CrossRef]
  30. Strizhak, P.; Volkov, R.; Moussa, O. Measuring temperature of emulsion and immiscible two-component drops until micro-explosion using two-color LIF. Int. J. Heat Mass Transf. 2020, 163, 120505. [Google Scholar] [CrossRef]
  31. Krithikadatta, J. Normal distribution. J. Conserv. Dent. Endod. 2014, 17, 96–97. [Google Scholar] [CrossRef] [PubMed]
Figure 1. Temperature calibration curve of electric hot wire.
Processes 13 02840 g001
Figure 2. Comparison between ignition and non-ignition of emulsion matrix.
Processes 13 02840 g002
Figure 3. Schematic and structural diagrams of critical hot-spot temperature measurement system and explosive charge containment assembly [28]. (a) Schematic diagram of measuring system for critical hot spot temperature. (b) Object diagram of measuring system. (c) The structure diagram of a drug filling device.
Processes 13 02840 g003
Figure 4. Ignition response distribution of emulsified matrix at low temperature under different ambient pressures.
Processes 13 02840 g004
Figure 5. Ignition response distribution of emulsion matrix under different pressures at high temperature.
Processes 13 02840 g005
Figure 6. Ignition response distribution of emulsified matrix containing expanded perlite with different percentages at 1 atm.
Processes 13 02840 g006
Figure 7. Ignition response distribution of emulsified matrix containing expanded perlite with different percentages at 2 atm.
Processes 13 02840 g007
Figure 8. Ignition response distribution of emulsified matrix containing expanded perlite with different percentages at 3 atm.
Processes 13 02840 g008
Table 1. Standard normal function table.
u122.583
Φ(u)0.841340.977250.995060.99865
Table 2. Corresponding relationship between u and P.
u122.5833.1
P0.682680.95450.990120.99730.9990
Table 3. Classical formula for emulsified matrix.
ComponentANWaterDiesel OilSpan-80
Percentage84%10%4%2%
Table 4. Ignition response of emulsion matrix to different ambient pressures at low temperature.
i1 atm2 atm3 atm
I/ApiI/ApiI/Api
12.5012.5012.501
21.7501.7501.750
32.1302.1312.131
43.0611.9411.941
52.7811.4701.470
62.2711.7001.700
71.6401.9201.921
81.9502.9611.810
92.3712.4411.860
102.3212.0712.931
111.9801.7702.401
122.1511.9212.101
132.0601.8501.790
142.1011.8801.940
152.0802.1612.171
162.0902.0202.061
172.2312.0911.931
182.1612.0511.470
192.1201.9501.700
202.1411.9911.881
Table 5. 2 Mean and mean square deviation of current stimulation under different pressures at low temperature.
P/atm1 atm2 atm3 atm
μ2.192.031.97
σ0.31760.32040.3447
Table 6. Hot wire temperature with different probability under different environmental pressure at low temperature.
P/atmP/%15099
1 atmI/A1.382.193.01
Tcig/°C140205300
2 atmI/A1.202.032.86
Tcig/°C125180280
3 atmI/A1.081.972.86
Tcig/°C115178280
Table 7. Ignition response of emulsion matrix under different pressures at high temperature.
i1 atm2 atm3 atm
I/ApiI/ApiI/Api
12.5002.5002.501
22.7512.7512.250
32.6312.6312.381
42.3102.3102.310
52.4002.4002.340
62.5812.5812.671
72.4912.4912.511
82.4002.4012.410
92.4512.2002.380
102.4212.3002.521
112.2102.4002.450
122.3202.4912.491
132.3902.4412.470
142.4812.3702.481
152.4402.4112.471
162.4612.3902.441
172.4512.4002.220
182.3902.4412.330
192.4202.4202.400
202.4412.4302.441
Table 8. Mean and mean square deviation of current stimulation under different pressures at high temperature.
P1 atm2 atm3 atm
μ2.452.442.42
σ0.11530.11910.1029
Table 9. Hot wire temperature with different probability under different environmental pressure at high temperature.
PP/%15099
1 atmI/A2.152.452.75
Tcig/°C205232273
2 atmI/A2.132.442.75
Tcig/°C202230273
3 atmI/A2.142.422.70
Tcig/°C203227268
Table 10. Ignition response of emulsified matrix containing expanded perlite with different percentages at 1 atm.
i0%1.5%3%
I/ApiI/ApiI/Api
12.5012.5012.501
21.7501.7501.750
32.1302.1302.131
43.0613.0611.941
52.7812.7811.470
62.2712.2701.700
71.6402.5311.921
81.9502.4011.811
92.3711.7001.640
102.3212.0501.730
111.9802.2911.820
122.1512.1712.911
132.0601.9302.371
142.1012.0502.051
152.0802.1711.841
162.0902.1111.420
172.2312.0201.630
182.1612.0701.841
192.1202.1201.740
202.1412.5911.790
Table 11. Mean and mean variance of ignition current of emulsified matrix containing expanded perlite with different percentages at 1 atm.
Expanded Perlite Content/%01.53
μ2.192.241.90
σ0.31760.33220.3543
Table 12. Hot wire temperature of emulsified matrix containing different percentages of expanded perlite at 1 atm with different ignition probabilities.
Expanded Perlite Content/%P/%15099
0I/A1.382.193.01
Tcig/°C140205300
1.5I/A1.382.243.09
Tcig/°C140210310
3I/A0.991.92.81
Tcig/°C110170280
Table 14. Mean and mean variance of ignition current of emulsified matrix containing expanded perlite with different percentages at 2 atm.
Expanded Perlite Content%01.53
μ2.031.991.91
σ0.32040.31650.3456
Table 15. Hot wire temperature of emulsified matrix containing different percentages of expanded perlite at 2 atm with different ignition probabilities.
Expanded Perlite Content%P/%15099
0I/A2.032.861.20
Tcig/°C180280125
1.5I/A1.191.992.81
Tcig/°C120180280
3I/A1.021.912.80
Tcig/°C113171279
Table 16. Ignition response of emulsified matrix containing expanded perlite with different percentages at 3 atm.
i0%1.5%3%
I/ApiI/ApiI/Api
12.5012.5012.51
21.7501.7501.750
32.1312.1312.131
41.9411.5601.941
51.4702.0311.470
61.7001.8001.70
71.9211.9111.921
81.8101.8511.810
91.8601.4301.871
102.9311.6401.841
112.4011.7801.660
122.1012.8911.750
131.7902.3311.811
141.9401.9911.780
152.1711.7101.81
162.0611.8501.80
171.9312.0911.80
181.4701.9712.91
191.7001.8402.341
201.8811.9612.071
Table 17. Mean and mean variance of ignition current of emulsified matrix containing expanded perlite with different percentages at 3 atm.
Expanded Perlite Content/%01.53
μ1.971.951.93
σ0.34470.33190.3252
Table 18. Hot wire temperature of emulsified matrix containing different percentages of expanded perlite at 3 atm with different ignition probabilities.
Expanded Perlite Content/%P/%15099
0I/A1.081.972.86
Tcig/°C115180280
1.5I/A1.091.952.81
Tcig/°C116175280
3I/A1.091.932.77
Tcig/°C116173278
Table 19. Critical hot point temperature of emulsified matrix with different pressure and expanded perlite content.
P/atmExpanded Perlite Content/%
0%1.5%3%
1140 °C140 °C110 °C
2125 °C120 °C113 °C
3115 °C116 °C116 °C
Disclaimer/Publisher’s Note: The statements, opinions and data contained in all publications are solely those of the individual author(s) and contributor(s) and not of MDPI and/or the editor(s). MDPI and/or the editor(s) disclaim responsibility for any injury to people or property resulting from any ideas, methods, instructions or products referred to in the content.