Article

Performance and Mixing Characterization of a New Type of Venturi Reactor for Hydrazine Hydrate Production

1
School of Chemical Engineering, Tianjin University, Tianjin 300000, China
2
Central Research Institute of Qinghai Salt Lake Industry Co., Ltd., Xining 810016, China
*
Author to whom correspondence should be addressed.
These authors contributed equally to this work.
Processes 2025, 13(9), 2839; https://doi.org/10.3390/pr13092839
Submission received: 29 March 2025 / Revised: 27 April 2025 / Accepted: 9 May 2025 / Published: 4 September 2025
(This article belongs to the Section Energy Systems)

Abstract

In this paper, a novel venturi jet reactor is innovatively proposed for the process of hydrazine hydrate production using the urea method. In order to investigate the performance of this reactor in depth, we used the computational fluid dynamics method to optimize the design of the structure of the new venturi jet reactor based on the flow field condition, the degree of mixing uniformity, and the efficiency of the reactor using the component transport model. The results showed that the moderate increase of the distance of mixing tube to nozzle and nozzle diameter seven could help to improve the efficiency of the jet reactor; however, in terms of the mixing effect, the increase of the distance of mixing tube to nozzle led to the mixing effect to be enhanced and then weakened, while the increase in the nozzle diameter was not conducive to the full mixing of the two fluids. In addition, the effects of ratio of throat length to diameter and constriction angle on the efficiency of the jet reactor showed nonlinear characteristics, and the optimal values existed in the study range. Based on the above analysis, this paper determines the optimal range of structural parameters, i.e., the distance of mixing tube to nozzle of 7–13 mm, the nozzle outlet diameter of 5–7 mm, the ratio of throat length to diameter of 3–5, and the constriction angle of 30–40°, and the study provides guidance for the industrial application of the venturi jet reactor.

1. Introduction

Mixing reaction is one of the most basic operations of chemical process, and the traditional reaction process is generally realized by stirring reactors for mixing and column tube reactors for heat exchange, The conventional synthesis of urea hydrazine hydrate typically employs tubular reactors, which exhibit high heat exchange efficiency. However, the absence of mixing internals in such reactors results in suboptimal mixing efficiency, complicating subsequent product purification. While traditional stirred reactors address this issue to some extent, they still suffer from inadequate inter-regional mixing. To overcome these limitations, this study proposes an innovative approach by integrating jet mixing with high-efficiency heat exchange. Specifically, we design a novel liquid–liquid continuous reactor that synergistically combines thorough mixing and efficient heat transfer, tailored to industrial-scale production to enhance reaction efficiency. An investigation of the reactor’s performance characteristics is essential to optimize its operational efficiency. Further research should focus on enhancing the reactor’s overall performance through parameter optimization and design improvements [1]. In view of this, this study proposes a new type of continuous reactor combining jet mixing technology and hollow spiral guide vane tube heat-exchange structure for the two-liquid mixed-reaction system.
Due to the wide application of jet reactors in industry, scholars have studied the behavior of flow field and mixing inside the jet reactors more thoroughly. In a study on liquid–liquid mixing, Baojun Shen [2] simulated the macroscopic mixing and microscopic mixing characteristics of two mixed-phase liquids. The computational fluid dynamics model was validated by particle image velocimetry experiments. The mixing index and diffusion mixing potential were used to accurately evaluate the mixing homogeneity. The results show that chaotic flow and vortices can promote mixing. Stefan Merkens [3] introduced a method for hydrodynamic characterization of flowing systems for monitoring transmission intensity. His numerical-physical model of solute transport confirms the experimentally derived influence of flow channel geometry on the importance of convective and diffusive solute transport.
Based on the study of jet mechanism, scholars have made structural improvements to improve the mixing effect of jet reactors. The study by Ming-Ran Li [4] showed the superiority of jet ring reactors in promoting gas–liquid mass transfer compared to stirred tank reactors. Mohammed N. Ajour [5] set up twisted bands in the model, and showed that the effect of cyclone on the nu Searle number (Nu) with increasing effect. In addition, for the optimization of the structural parameters of the venturi jet reactor, there have been a large number of studies on the nozzle diameter, mixing section length, throat–orifice distance, area ratio, contraction angle, diffusion angle, throat-to-diameter ratio, and the position and number of the pilot section. Tianwen Jiang [6] investigated the internal and external flow characteristics of the nozzles with different structures, which provided a theoretical basis for the optimization of the nozzle structure. Jia Yan [7] used numerical simulation to obtain the correlation between the length of the mixing chamber of a venturi type jet reactor and the performance of the jet reactor correlation, on the basis of which the structure optimization was carried out.
Heat exchangers with built-in spiral guide vane tubes have been widely used in various chemical processes over the years due to their large heat transfer area and good heat transfer performance. The results of the study by Yuyang Yuan [8] showed that the heat transfer rate of the double shell channel multilayer spiral coil heat exchanger can be enhanced under the same experimental conditions. Under the same experimental conditions, the heat transfer rate and thermal efficiency of the double shell and channel multilayer spiral coil heat exchanger were increased by 5.1–12.9%. The overall heat transfer coefficient was increased by 21.5–29.0%.
While gas–liquid mixing in venturi structures has been extensively investigated, research on liquid–liquid systems remains limited. The distinct physicochemical properties and process conditions of liquid–liquid systems necessitate tailored reactor designs, highlighting the critical need for venturi-type jet reactor optimization. In this study, we employ computational fluid dynamics (CFD) via ANSYS Fluent 2022R1 to systematically analyze how structural parameters govern fluid dynamics and mixing performance in liquid–liquid systems. The findings provide actionable insights for optimizing venturi jet reactor design in hydrazine hydrate synthesis, bridging a critical gap between fundamental research and industrial application.

2. Physical Geometry

Based on the actual production data and related research literature [9,10,11,12], after the theoretical calculation of the venturi jet reactor, the preliminary structural design of the venturi jet reactor with a treatment capacity of 3 m3/h was carried out.
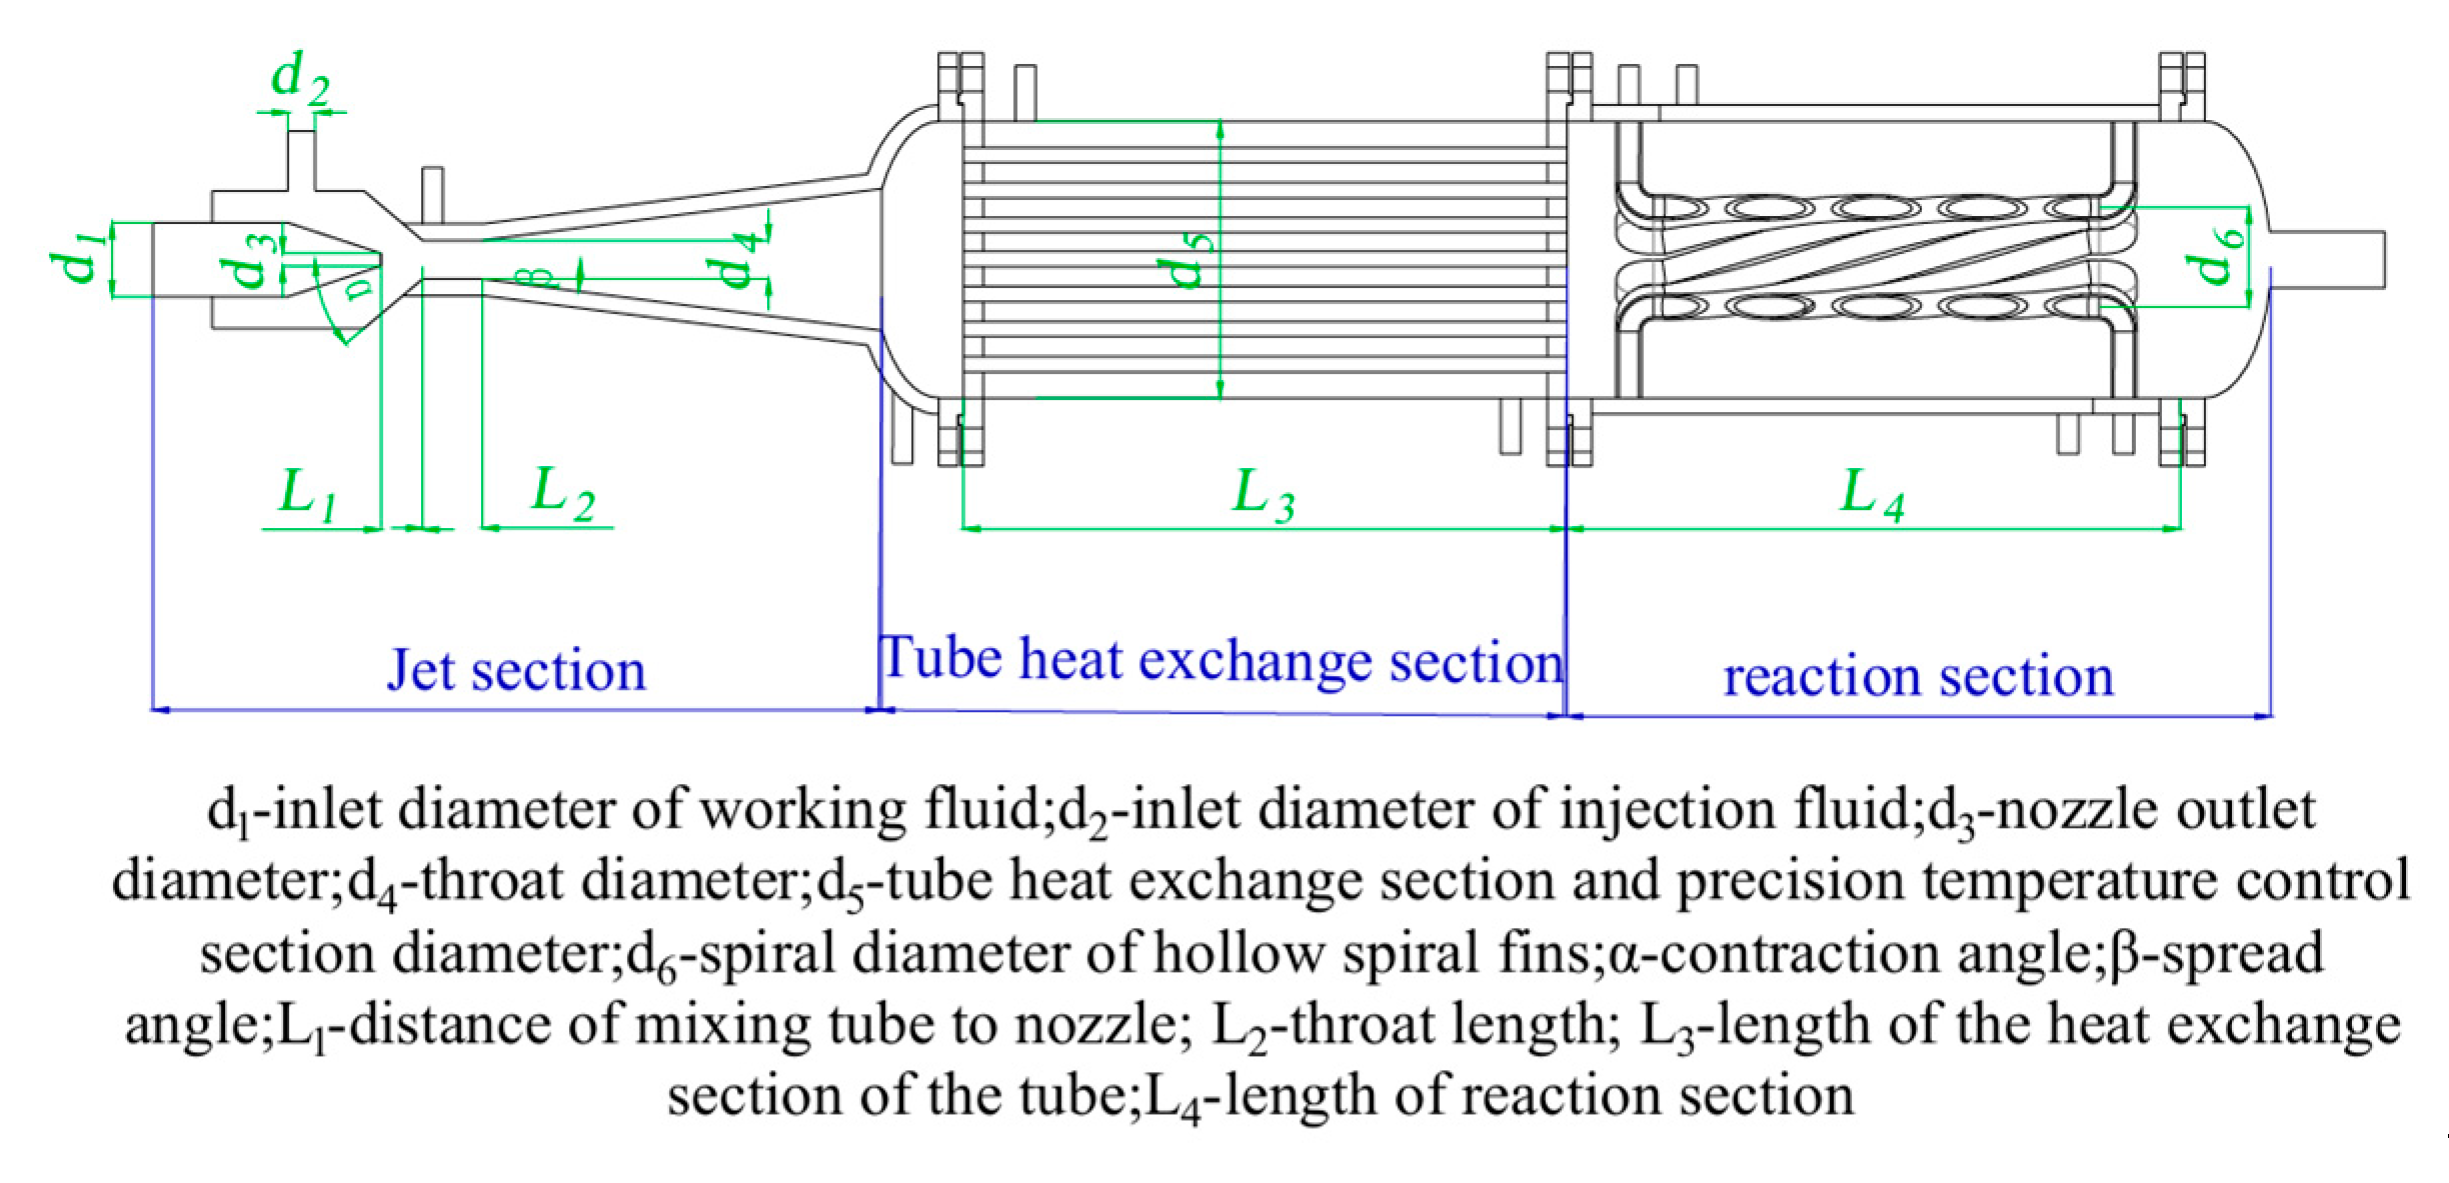
The specific structure type is shown in Figure 1.
The key dimensional parameters of the reactor, as determined through preliminary design calculations, are systematically presented in Table 1.
Venturi jet reactor includes a jet section, tube heat-exchanger section and reaction section, and each section is connected by a flange. After the working fluid passes through the nozzle, it is initially mixed with the drawn-in ejected fluid at the throat under the effect of Venturi, and then enters into the diffusion section, where the pressure of the mixed fluid is gradually restored. A jacket is set outside the jet section to provide initial heating of the mixed fluid. Subsequently, it is further heated in the column tube heat-exchanger section, and after reaching the reaction temperature, it enters the reaction section, where the mixed fluid is further mixed and reacted under the action of the spiral tube.
After preliminary calculations, the basic dimensions of the venturi reactor have been determined. The physical model was simplified and a Solidworks model was created, as shown in Figure 2.
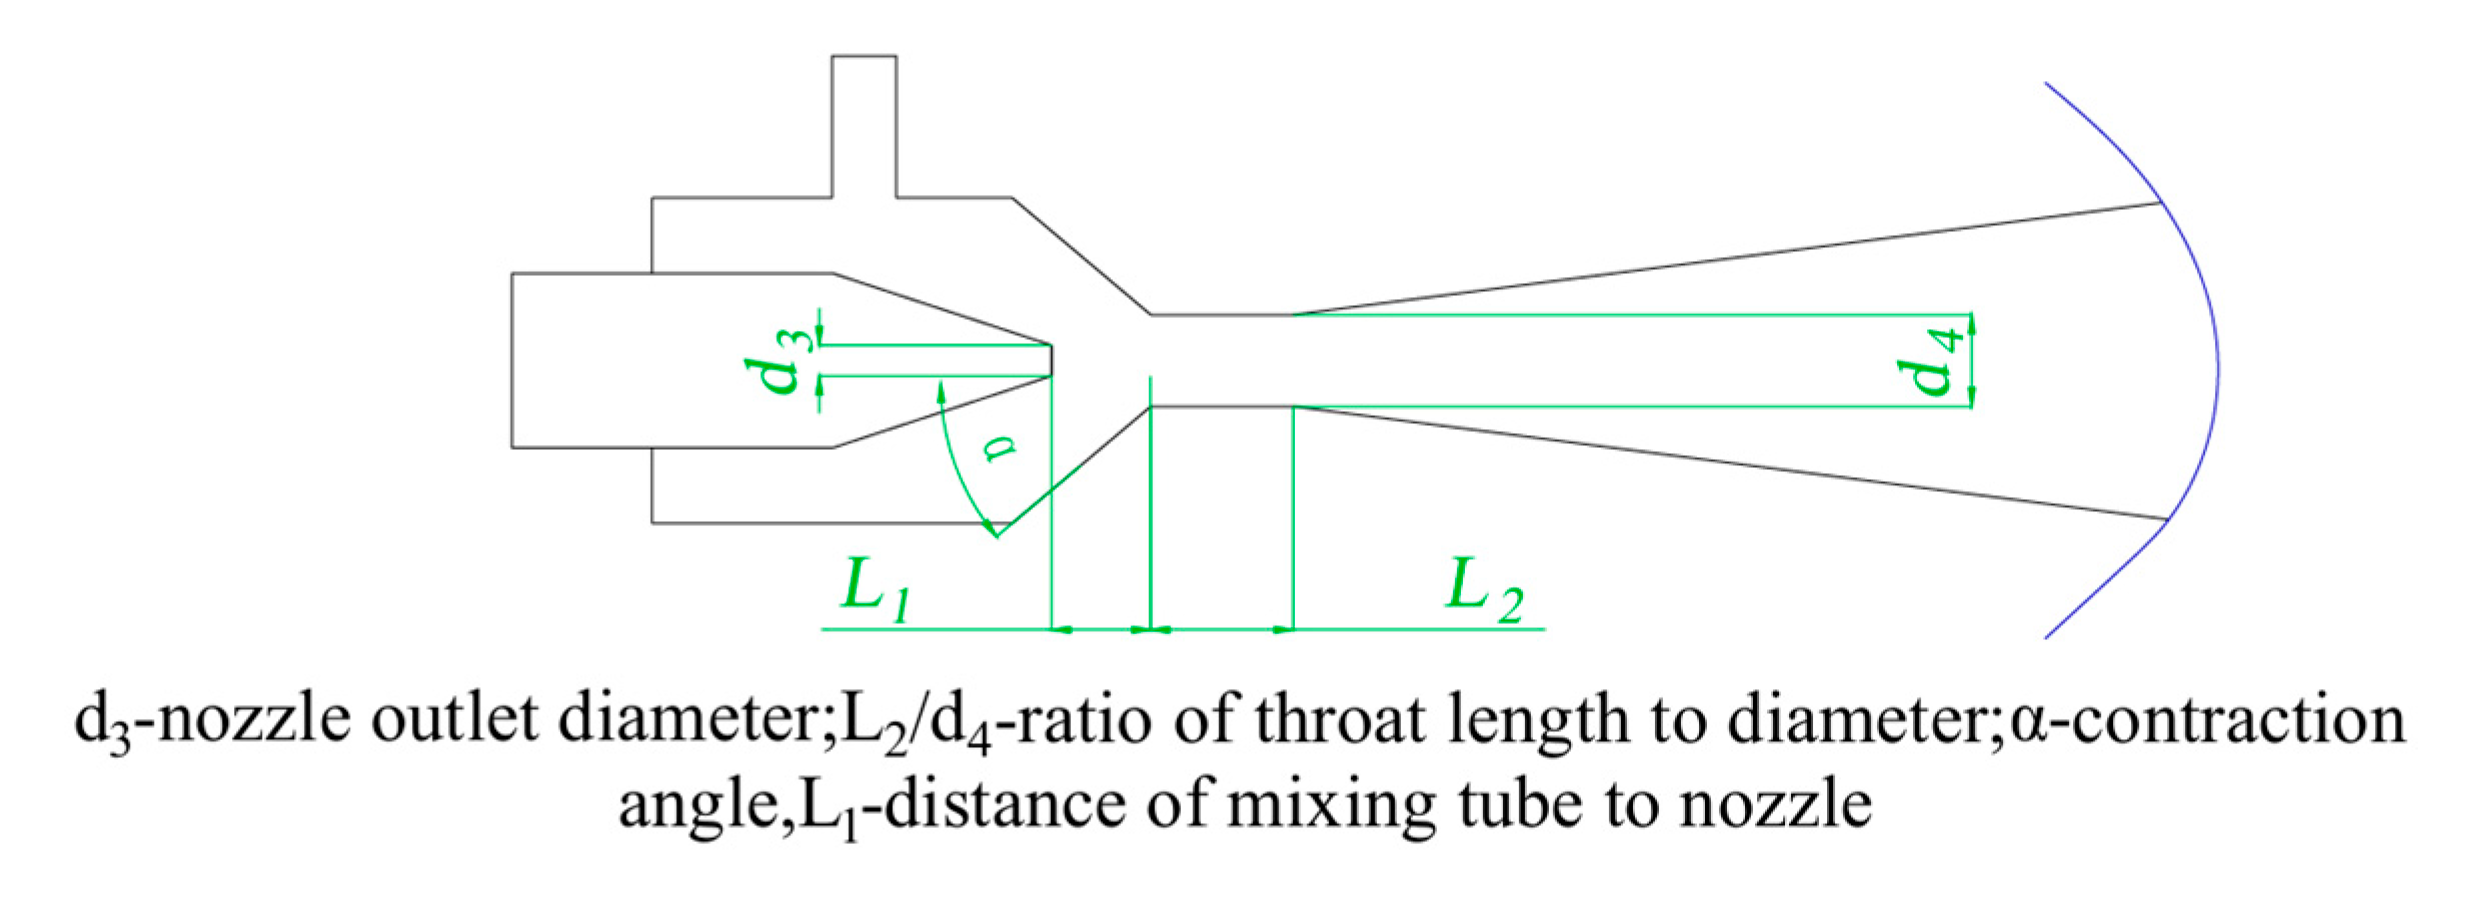
Figure 3 identifies the key structural parameters targeted for optimization in this study. Notably, parameter α represents the contraction angle, operationally defined as the angular transition at the upstream throat section.

3. Cfd Model

3.1. Turbulence Model

Considering that the standard k-ε model has a wide range of applications, requires moderate computational resources for simulating complex flow fields, and offers better convergence, it was chosen for the subsequent simulation. The specific expressions are shown in Equations (1) and (2).
ρ k t + · ( ρ u j k ) = · ( μ + μ t σ k ) k + P k ρ ε
ρ ε t + · ( ρ u j ε ) = · μ + μ t σ ε ε + ε k ( C ε 1 P k C ε 2 ρ ε )
where μt and Pk are defined as follows
μ t = ρ C μ k 2 ε
P k = μ t ( u i x j + u j x i ) u i x j
where ρ is the density of the fluid, kg/m3; k is turbulent kinetic energy, m2/s2; ε is dissipation rate, m2/s3. ui/uj is velocity components, m/s; μ means the dynamic viscosity, Pa·s; and μt shows the turbulent eddy viscosity, Pa·s, and Pk is the turbulent kinetic energy production term, generated by the mean velocity gradient. The model constants Cμ, C, C, σk, and σε are determined according to the neutral atmosphere boundary layer, and Cμ = 0.09, C = 1.176, C = 1.92, σk = 1.0, and σε = 1.3 [13].

3.2. Species Transport

The component transport model is generally used to simulate the mixing of two mutually soluble fluids. The component transport model is mainly concerned with the transport behavior of chemical substances in the flow field, and is a model used to describe the diffusion, drift, and convective motion of chemical substances in fluids. It is based on the conservation of mass and momentum, and describes the transport and reaction processes by assuming the change of the mass fraction of the chemical substances, and is able to simulate the interactions between the components of the mixture. Shilpa Kulbhushan Nandwani [14] used the component transport model without chemical reaction to simulate the mass transfer process between two fluids, and verified the validity of the model through experimental studies. Therefore, in this paper, the component transport model is used to describe the change of components in the mixing process, where the conservation equation for component i is as follows [2]:
ρ C i t + · ρ C i u = · ρ D i C i
In the formula, ρ is the density of the fluid, kg/m3; u is the velocity of the fluid, m/s; Ci is the mass fraction of the tracer, dimensionless; and Di is the diffusion coefficient, m2/s.

3.3. Boundary Conditions

The reaction temperature of hydrazine hydrate production using the urea method in industry is 120 °C, and the pressure is 0.2 Mpa. The mixed-phase system comprises sodium hypochlorite (NaClO) solution and urea solution, with three primary components considered in the transport model: (1) urea, (2) sodium hypochlorite, and (3) water. While urea and water properties were directly obtained from the ANSYS Fluent material database, the sodium hypochlorite solution was characterized with the following physicochemical parameters derived from Aspen simulation data: density = 1038 kg/m3, specific heat capacity = 3345 J/(kg·K), dynamic viscosity = 0.002 kg/(m·s), and molecular weight = 30 kg/kmol. The transport properties (density, thermal conductivity, and viscosity) were determined using established mixing rules, while mass diffusion coefficients were calculated based on kinetic theory for the species transport simulations [15].
Each boundary condition was determined by calculating the actual production data. The mixed solution of sodium hypochlorite and sodium hydroxide is the working fluid (inlet1) and the urea solution is the induced fluid (inlet2), and each boundary condition is set as follows:
Inlet1: a mixed solution of sodium hypochlorite and sodium hydroxide, with a velocity of 2 m/s, a temperature 20 °C, and a component transport model where the mass fraction of the mixed solution component is 1.
Inlet2: a urea solution, with a velocity of 2 m/s, a temperature of 20 °C, and a component transport model where the mass fraction of pure urea is 0.294 and the mass fraction of water is 0.706.
Outlet: a pressure outlet set to 0.2 MPa.
Wall function: the standard wall function is selected, with the solid wall and water vapor contact settings at a wall temperature of 160 °C. The solid–liquid interface is modeled as a coupled wall boundary condition to enable heat and momentum transfer between phases.

3.4. Grid Independence Analysis

In this paper, Fluent Meshing 2022R1 is used for meshing. The spiral tube at the back end of the venturi jet reactor has a complex structure, and in order to accurately simulate the flow field situation of the venturi jet reactor, the meshing is performed with an unstructured mesh, which is simple to operate and can reflect the information of the complex flow field.
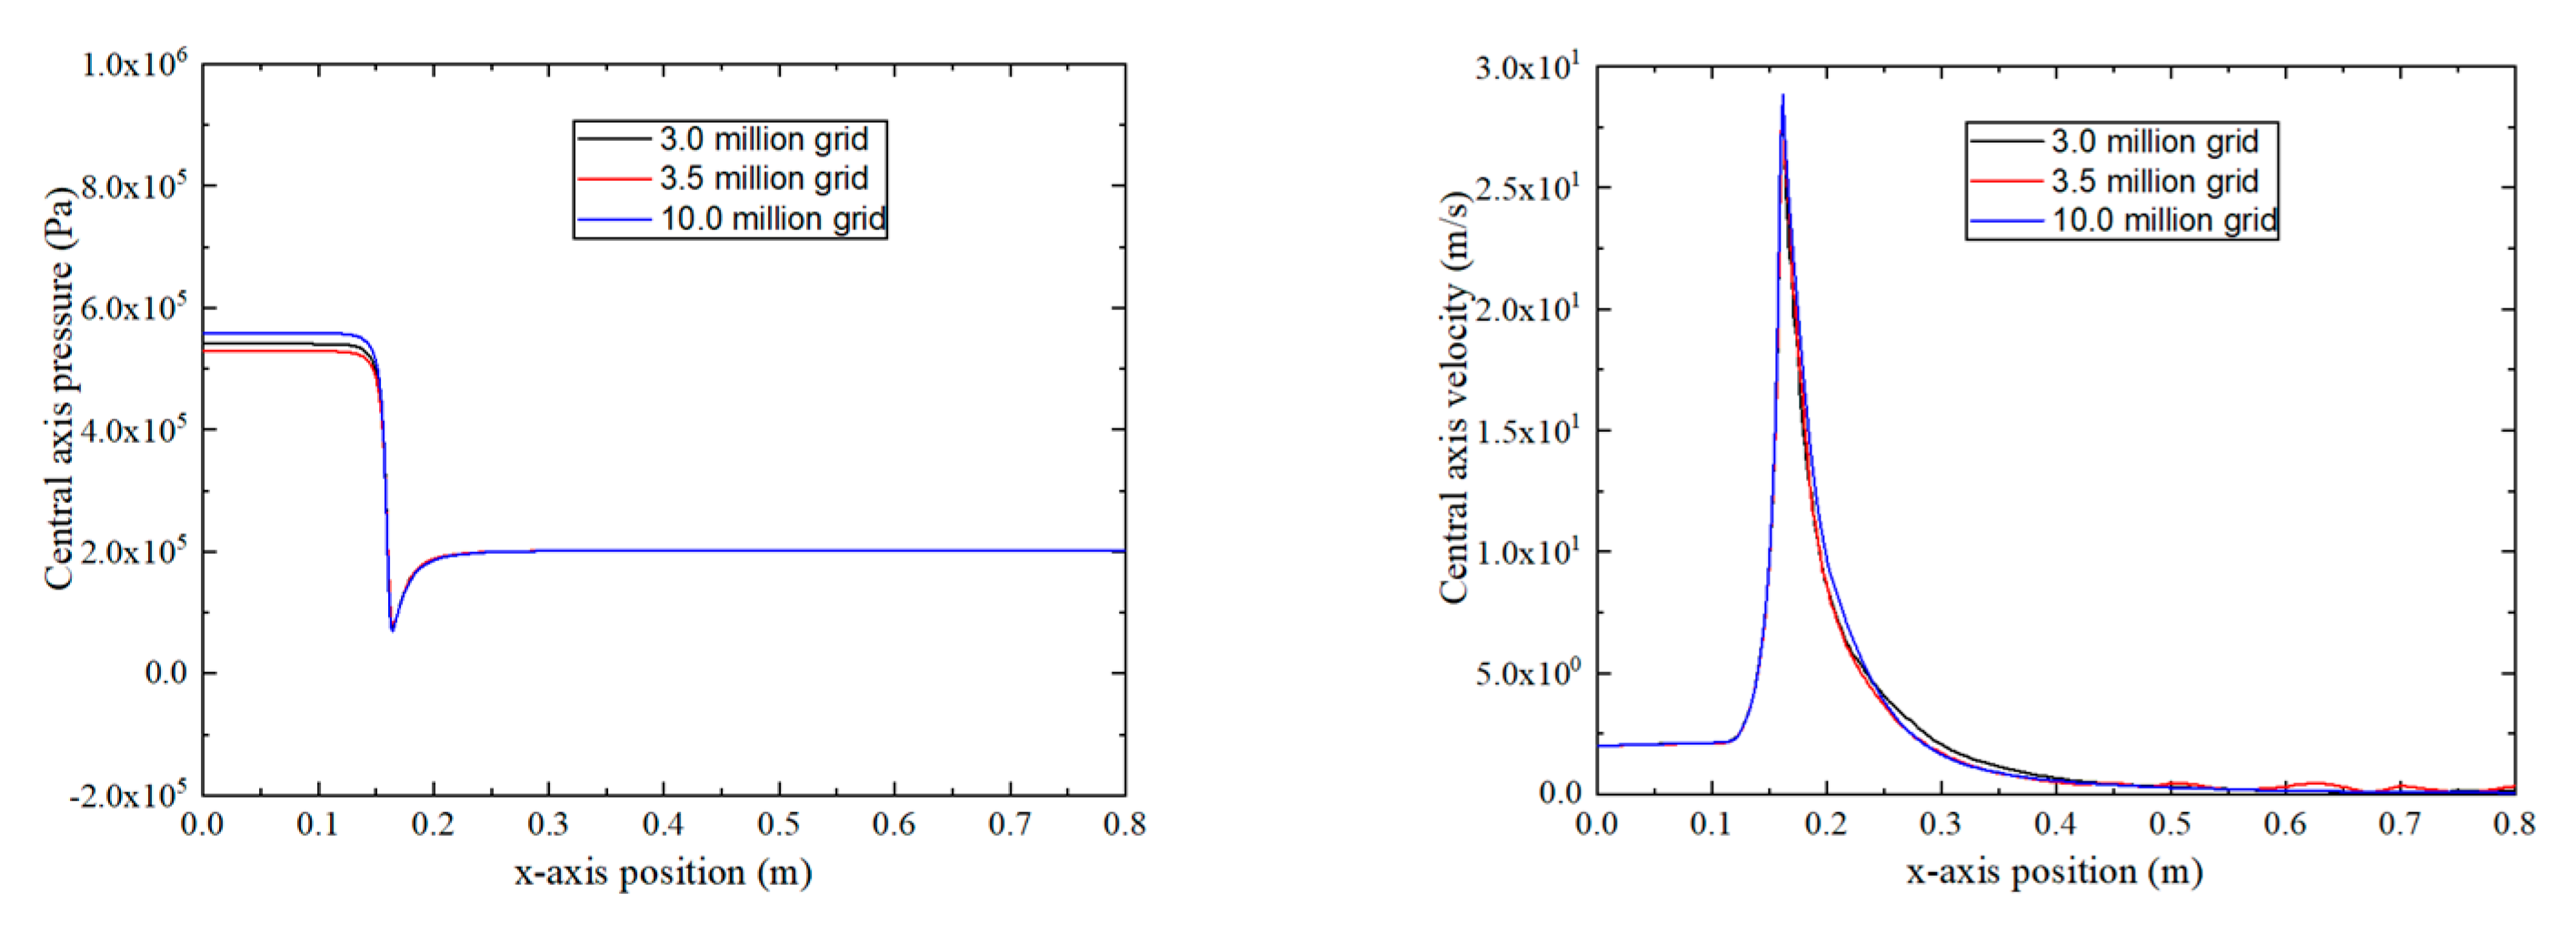
Grid-independence verification was performed to exclude the influence of the grid on the calculation results. In order to improve the computational efficiency and the credibility of the simulation results, the simulation was carried out for the models with 3 million, 3.5 million, and 10 million grids. Figure 4 shows the pressure and velocity curves of the center axis of the Venturi jet reactor with different grids, which shows that the trend of the pressure and velocity changes of the center axis with different grids are consistent, the curves are basically overlapped, and the maximum pressure on the center axis of the reactor with different grids is calculated. The error of the maximum pressure and maximum velocity on the center axis of the reactor is within 5%, and the accuracy of numerical simulation can be guaranteed.
According to the above analysis, a grid of 3.5 million is selected for subsequent simulation analysis.

4. Results

4.1. Initial Flow Field

Preliminary numerical simulation of the venturi jet reactor to obtain the internal flow field of the device is as follows. Figure 5 shows the pressure and velocity distribution in a cross-sectional view of the jet section in the venturi jet reactor. The cloud diagram illustrates the fluid dynamic characteristics of the jet mixing process: As the working fluid passes through the nozzle, its pressure gradually decreases while velocity increases, converting pressure energy into kinetic energy. This creates a high-velocity, low-pressure region at the pipe entrance, which draws the ejected fluid into the mixing section through pressure differential. In the mixing section, intensive momentum and energy exchange occur between the high-speed working fluid and ejected fluid, achieving thorough mixing. The mixed fluid then enters the diffusion section where velocity decreases and pressure recovers through gradual reconversion of kinetic energy to pressure energy.
Figure 6 illustrates the turbulent kinetic energy distribution versus urea mass fraction cloud plot for the cross section of the jet section. The observation of the cloud plot shows that the throat region presents the highest turbulent kinetic energy values, indicating that the phenomenon is particularly significant in this region, which is the main region of fluid mixing. The distribution of turbulent kinetic energy is characterized by a high degree of symmetry centered on the axis, and this distribution pattern is attributed to the higher shear velocity effect near the wall of the throat, which further emphasizes the key role of shear effect in fluid mixing.
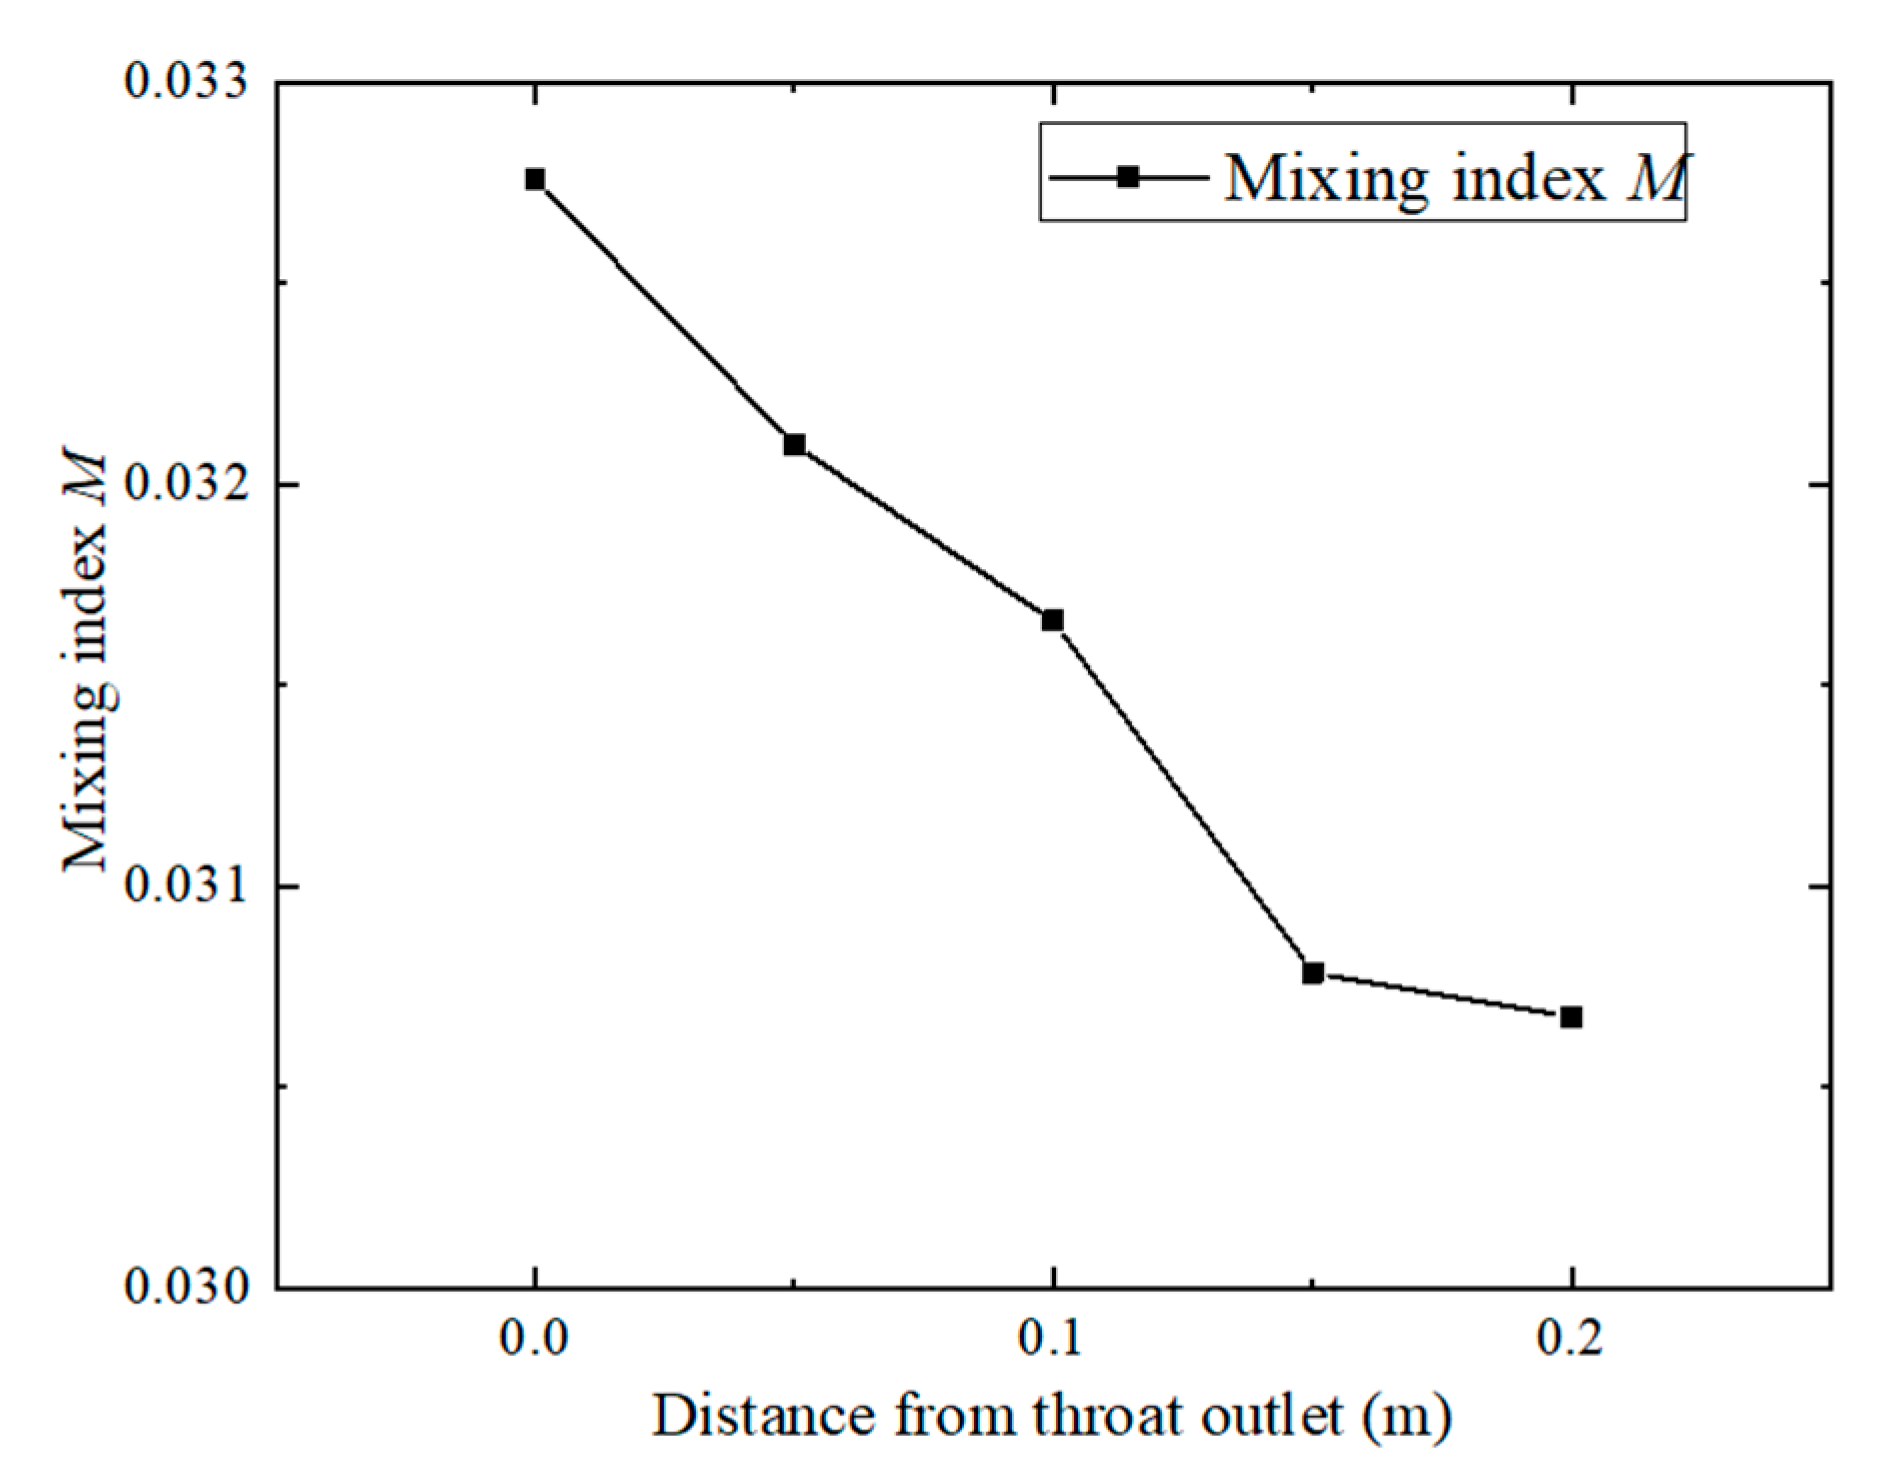
Driven by differential pressure, the urea solution is drawn into the mixing section via the pilot inlet to mix with the working fluid. However, insufficient energy transfer between the hypolimnetic solution at the nozzle outlet location and the urea solution results in a low mass fraction of urea along the center axis of the throat front, and its distribution exhibits significant inhomogeneity. In order to quantify the variation of homogeneity during this mixing process, we introduce the concept of mixing index M, which is defined as the standard deviation of the urea mass fraction on different cross sections of the diffusion section [16]. Figure 7 presents the spatial distribution of the mixing index (M) across the jet section’s cross section. The results demonstrate that as the mixing process progresses downstream, the standard deviation of urea mass fraction exhibits a consistent decreasing trend before eventually reaching a steady state. This behavior indicates the progressive homogenization of fluid components, suggesting that near-complete mixing is achieved by the end of the observed section. The M value is calculated by the following formula:
M = ( x 1 x ¯ ) 2 + + ( x n x ¯ ) 2 n 1
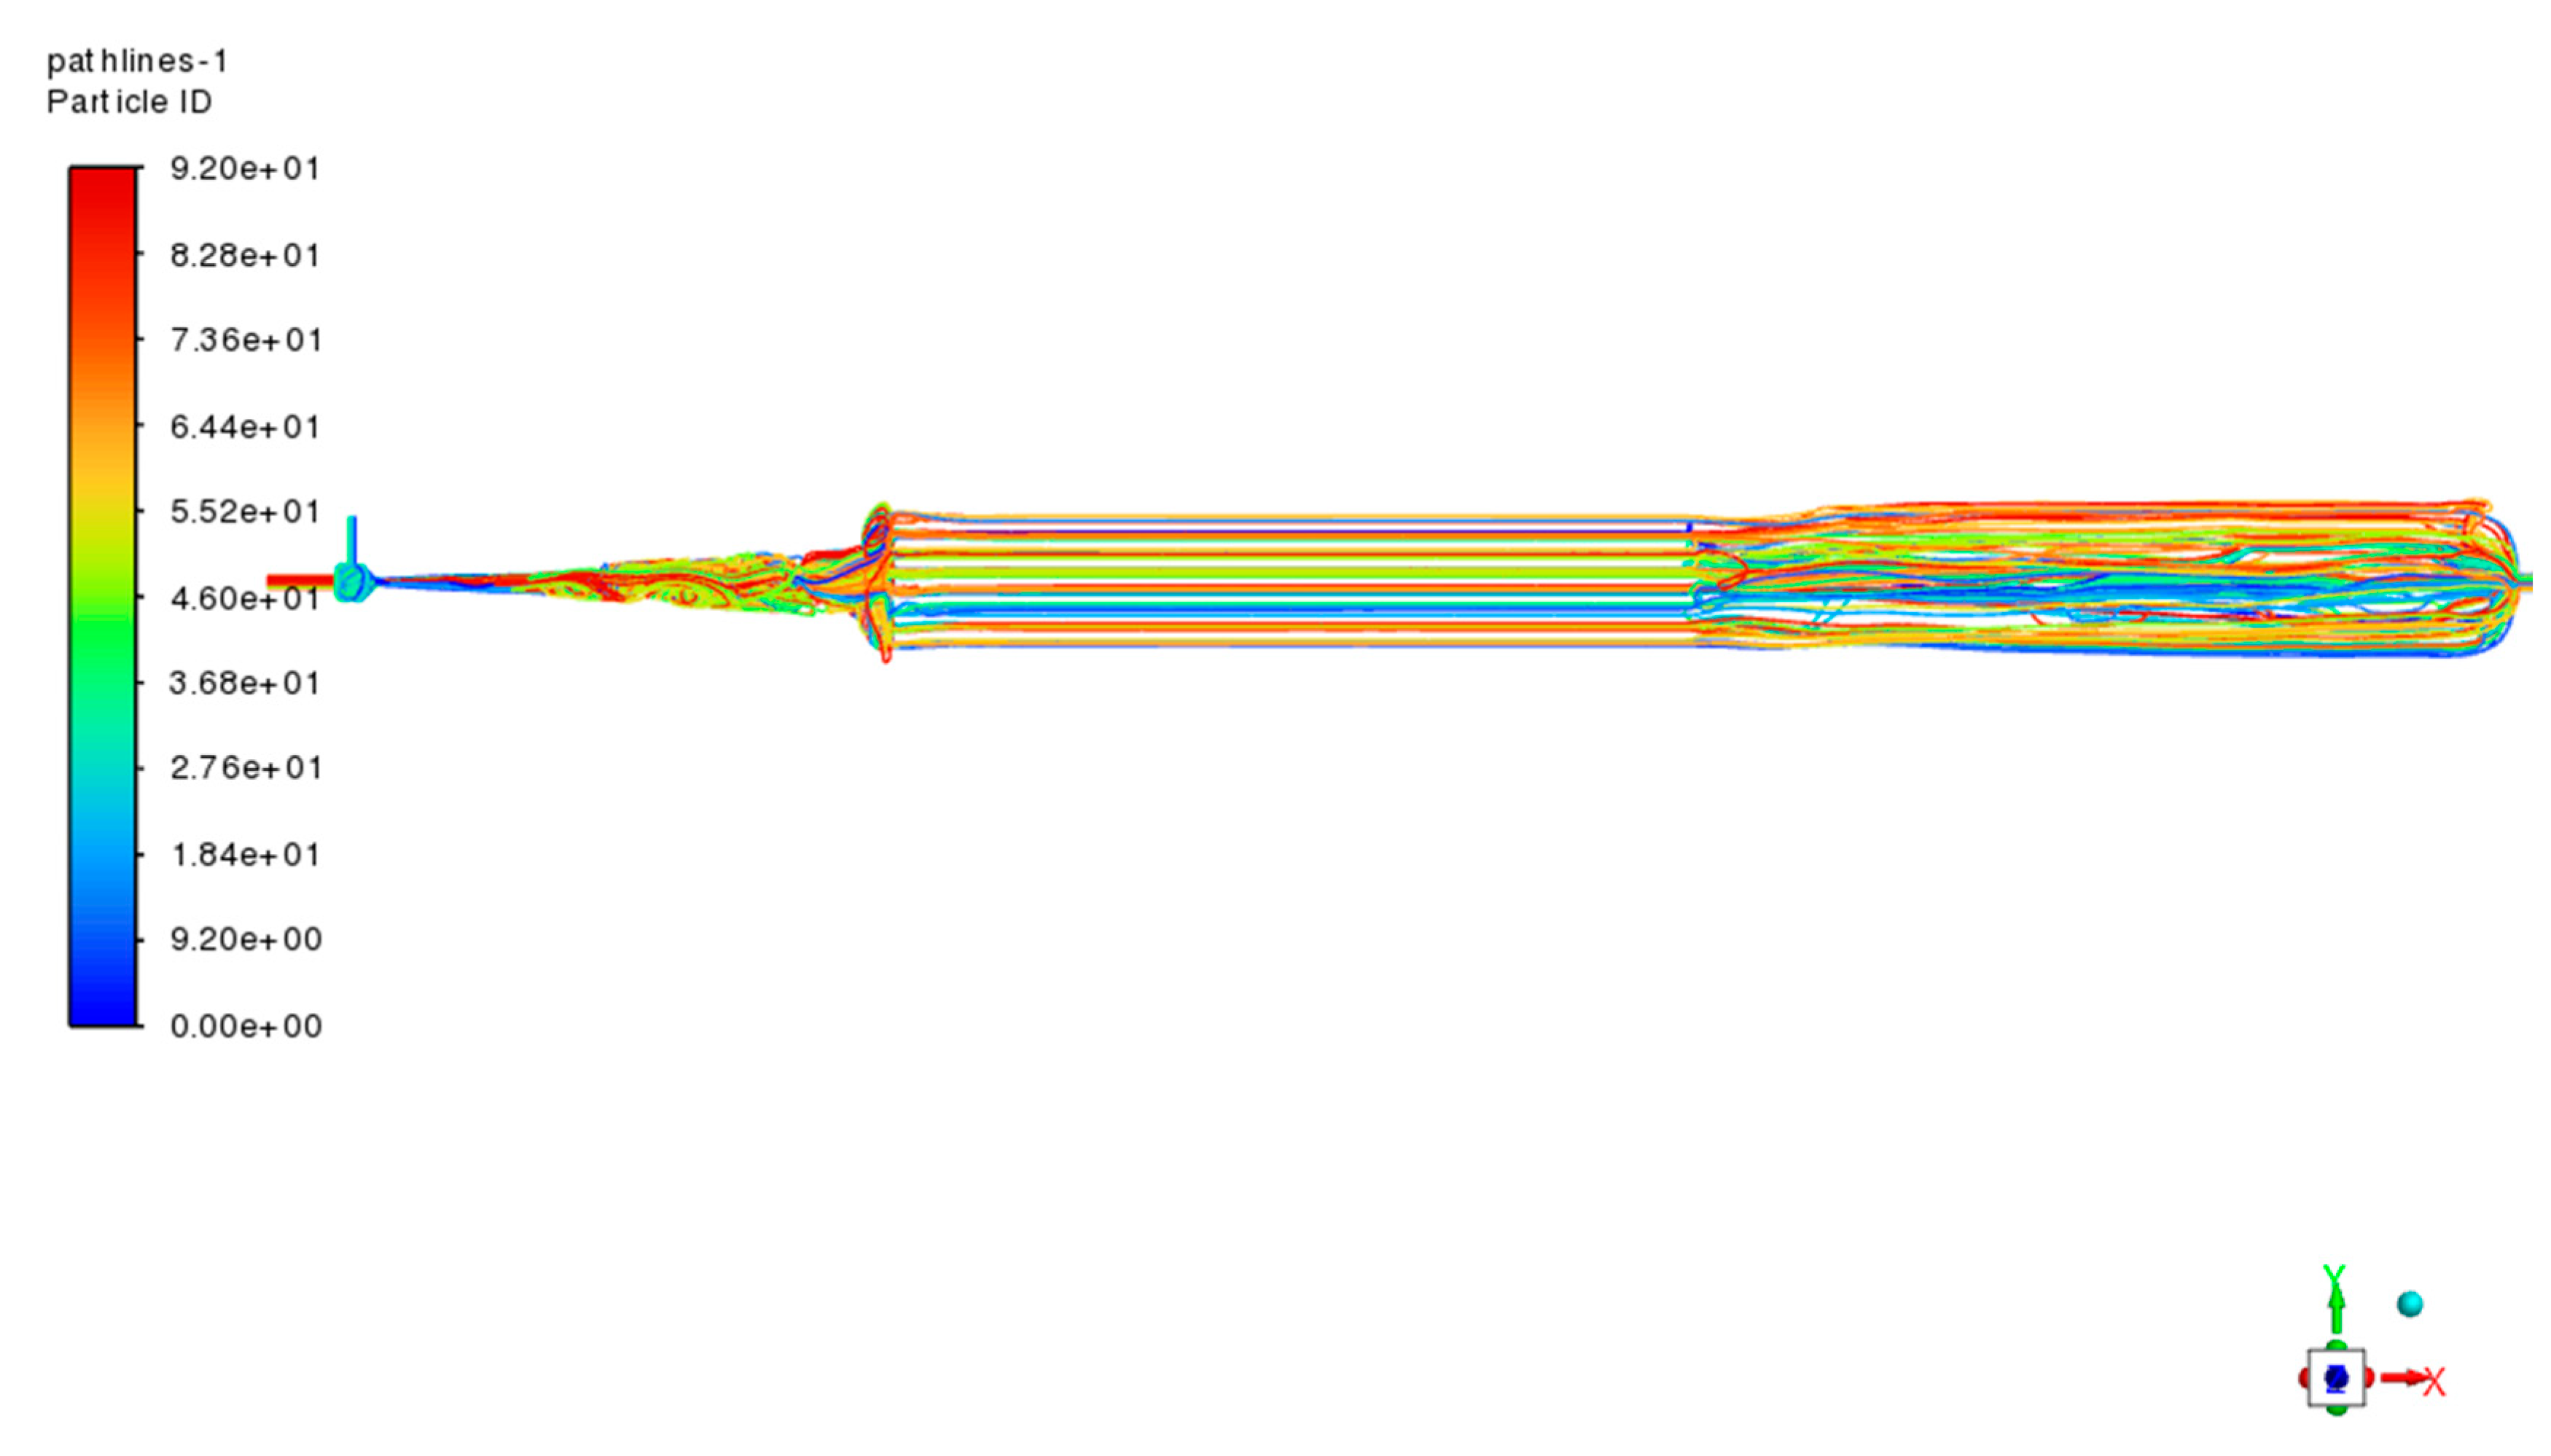
Figure 8 shows the internal flow diagram of the jet reactor. By comparing and analyzing the flow characteristics of the column tube heat-exchange section and the reaction section, it can be clearly observed that the spiral tube structure produces a significant disturbing effect on the mixed fluid.

4.2. Flow Field Under Different Structural Parameters

Many scholars at home and abroad have carried out extensive and in-depth research on the structural characteristics of the venturi jet reactor, and in the preliminary exploration of the influence of key structural parameters on the effectiveness of the venturi jet reactor, we found the following: the nozzle distance, as a crucial factor, directly determines the initial kinetic state of the working fluid in the region of the throat; as the core component of the jet reactor, the nozzle outlet diameter significantly influences the internal pressure distribution, playing a crucial role in determining the reactor’s hydrodynamic performance. The length-to-diameter ratio of the pipe affects the flow pattern of the fluid in the mixing section; and the angle of the mixing chamber contraction section mainly regulates the kinetic properties of the ejected fluid. In summary, these structural parameters affect the performance of the venturi jet reactor, so we simulated and analyzed different distances of mixing tube to nozzle L1, nozzle outlet diameters d3, ratios of throat length to diameter L2/d4, and contraction angles α. The simulations were performed using the control variable method jet reactor for structural optimization.

4.2.1. Influence of Structural Parameters on Flow Field

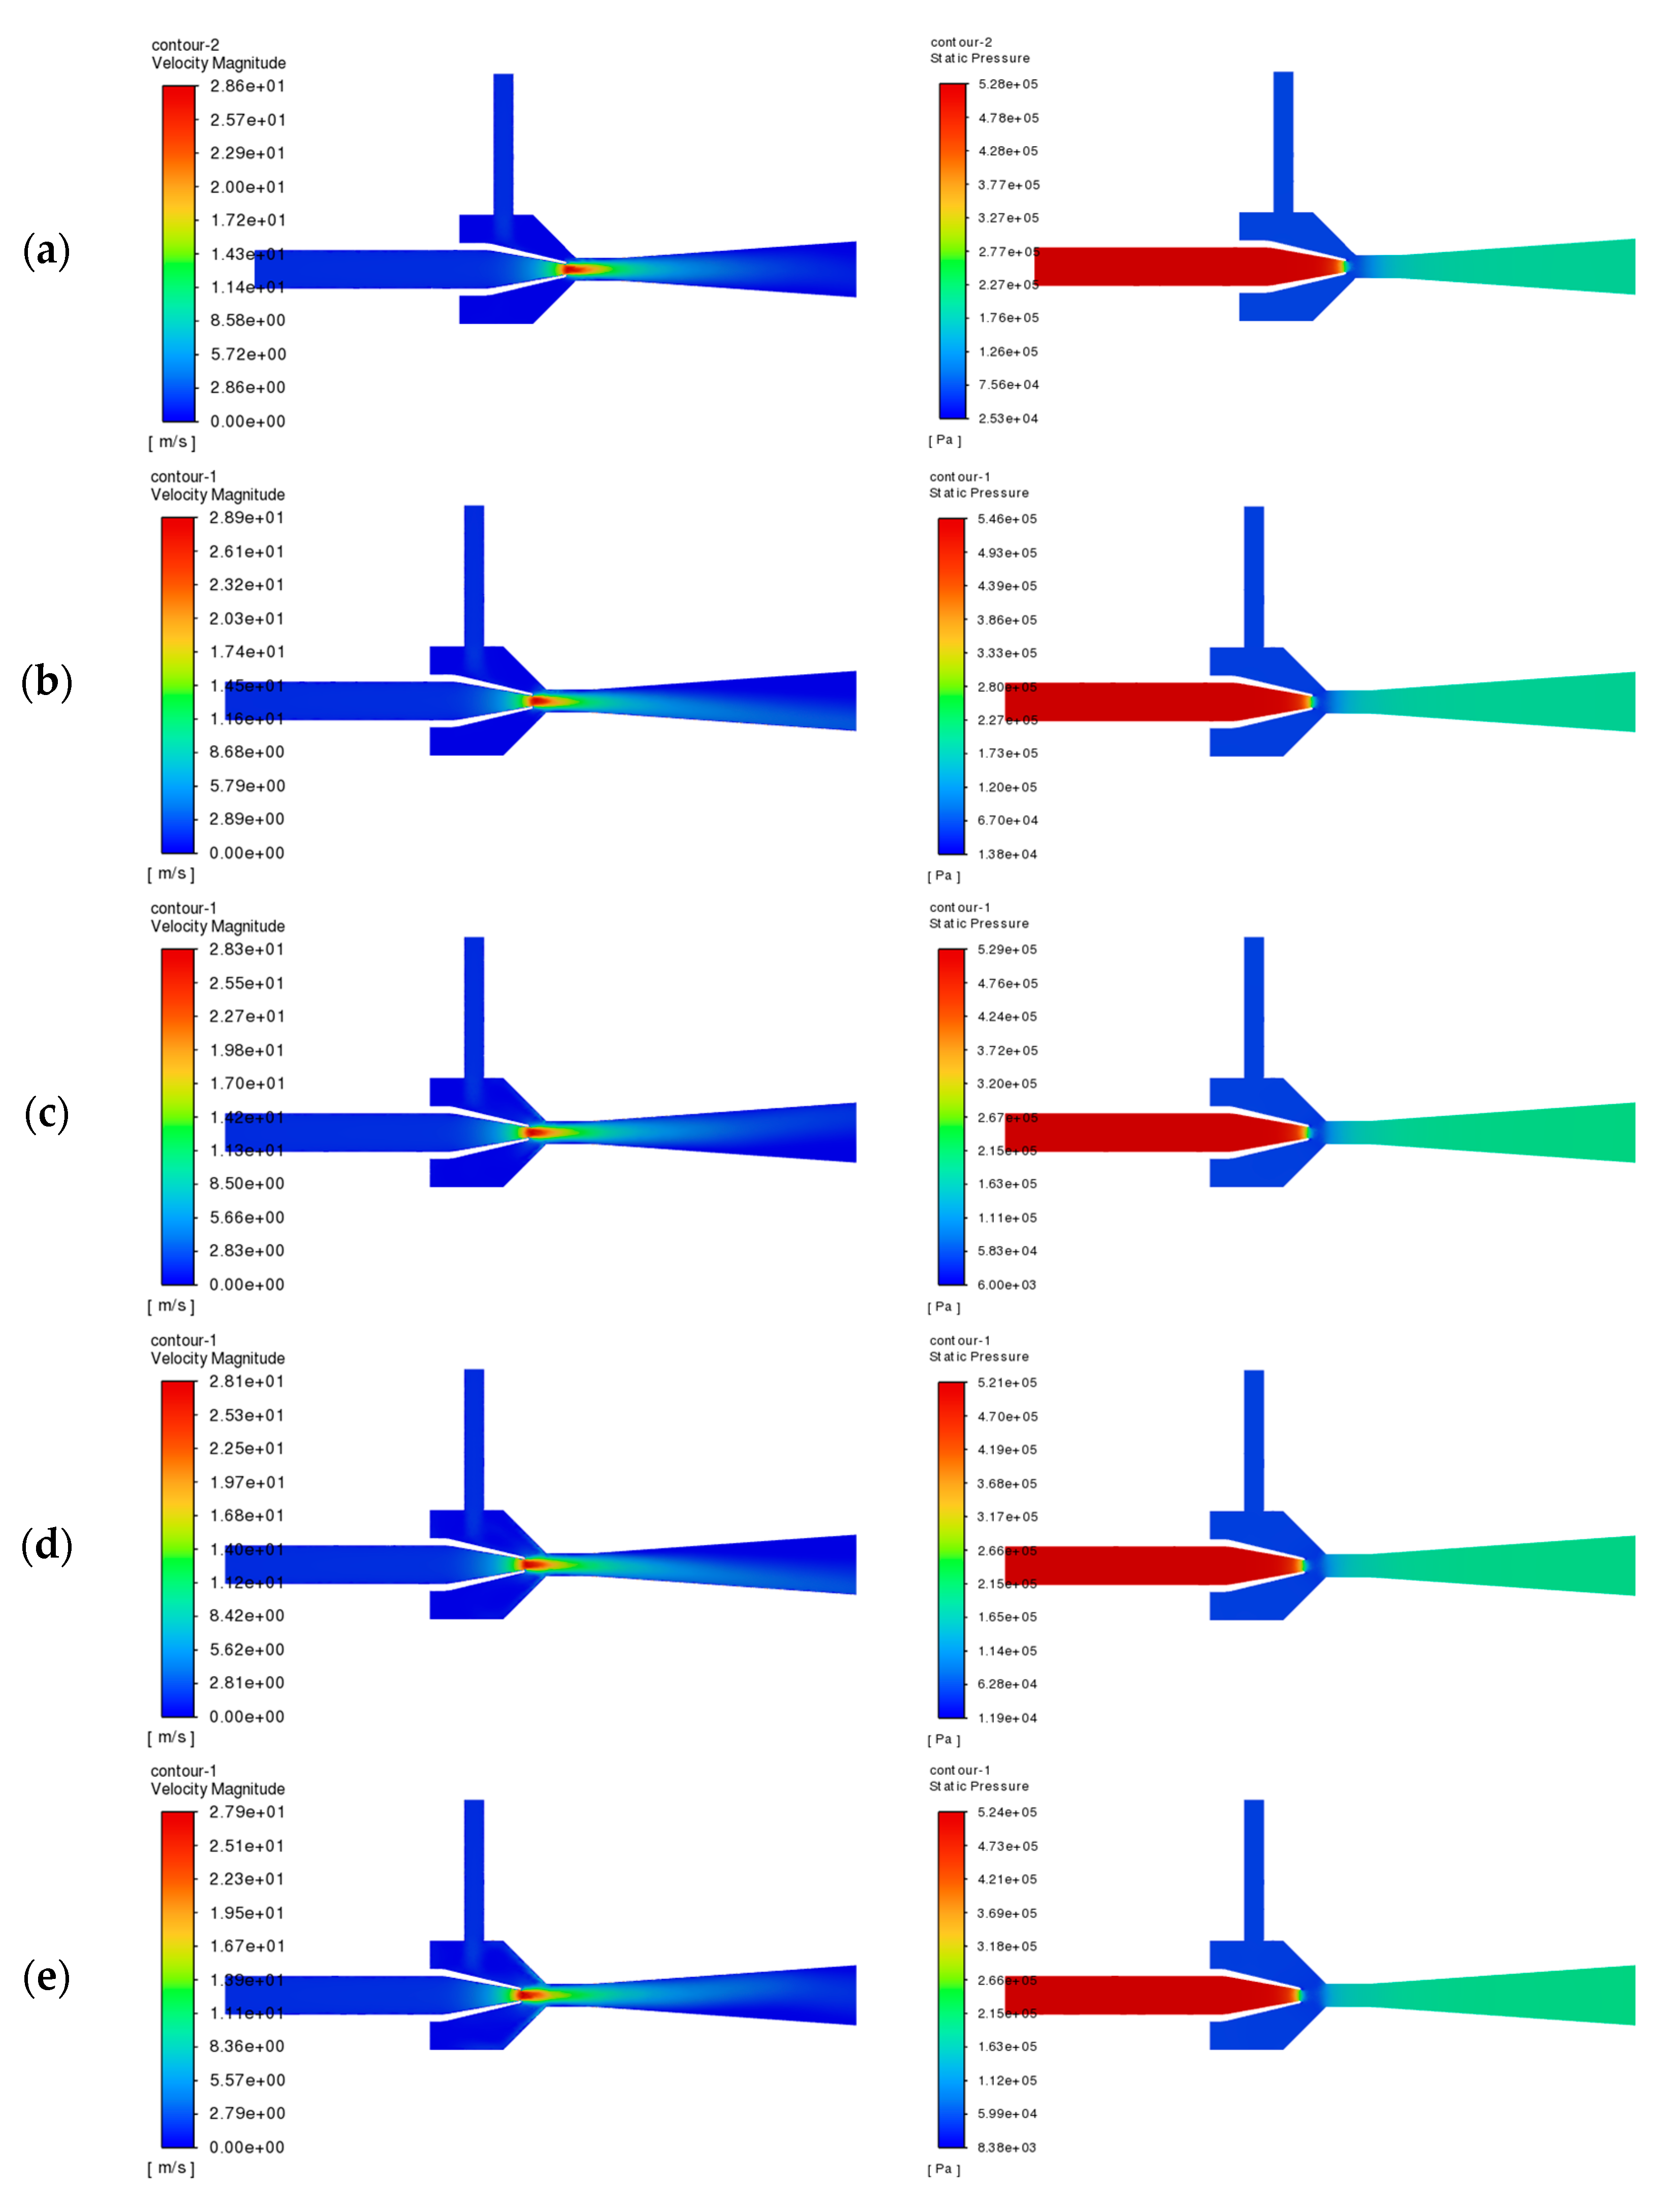
Figure 9 shows the distribution of velocity and pressure in the cross section of the jet section under different throat spacing. When the throat spacing is small, the working fluid forms a jet in the nucleus region due to the high-speed flow, which extends into the throat section, resulting in incomplete energy exchange, leading to greater energy loss. At the same time, due to the uneven velocity distribution of the two fluids at the throat, the fluid-mixing effect is not ideal. The pressure distribution pattern across different throat sections is similar, and the main difference is in the throat section. As the distance between the throat and mouth increases, the low-pressure area of the flow field mainly appears between the nozzle outlet and the throat inlet, and the range of the low-pressure area of the throat section is gradually narrowed down, and the gradient of the pressure distribution changes are not obvious.
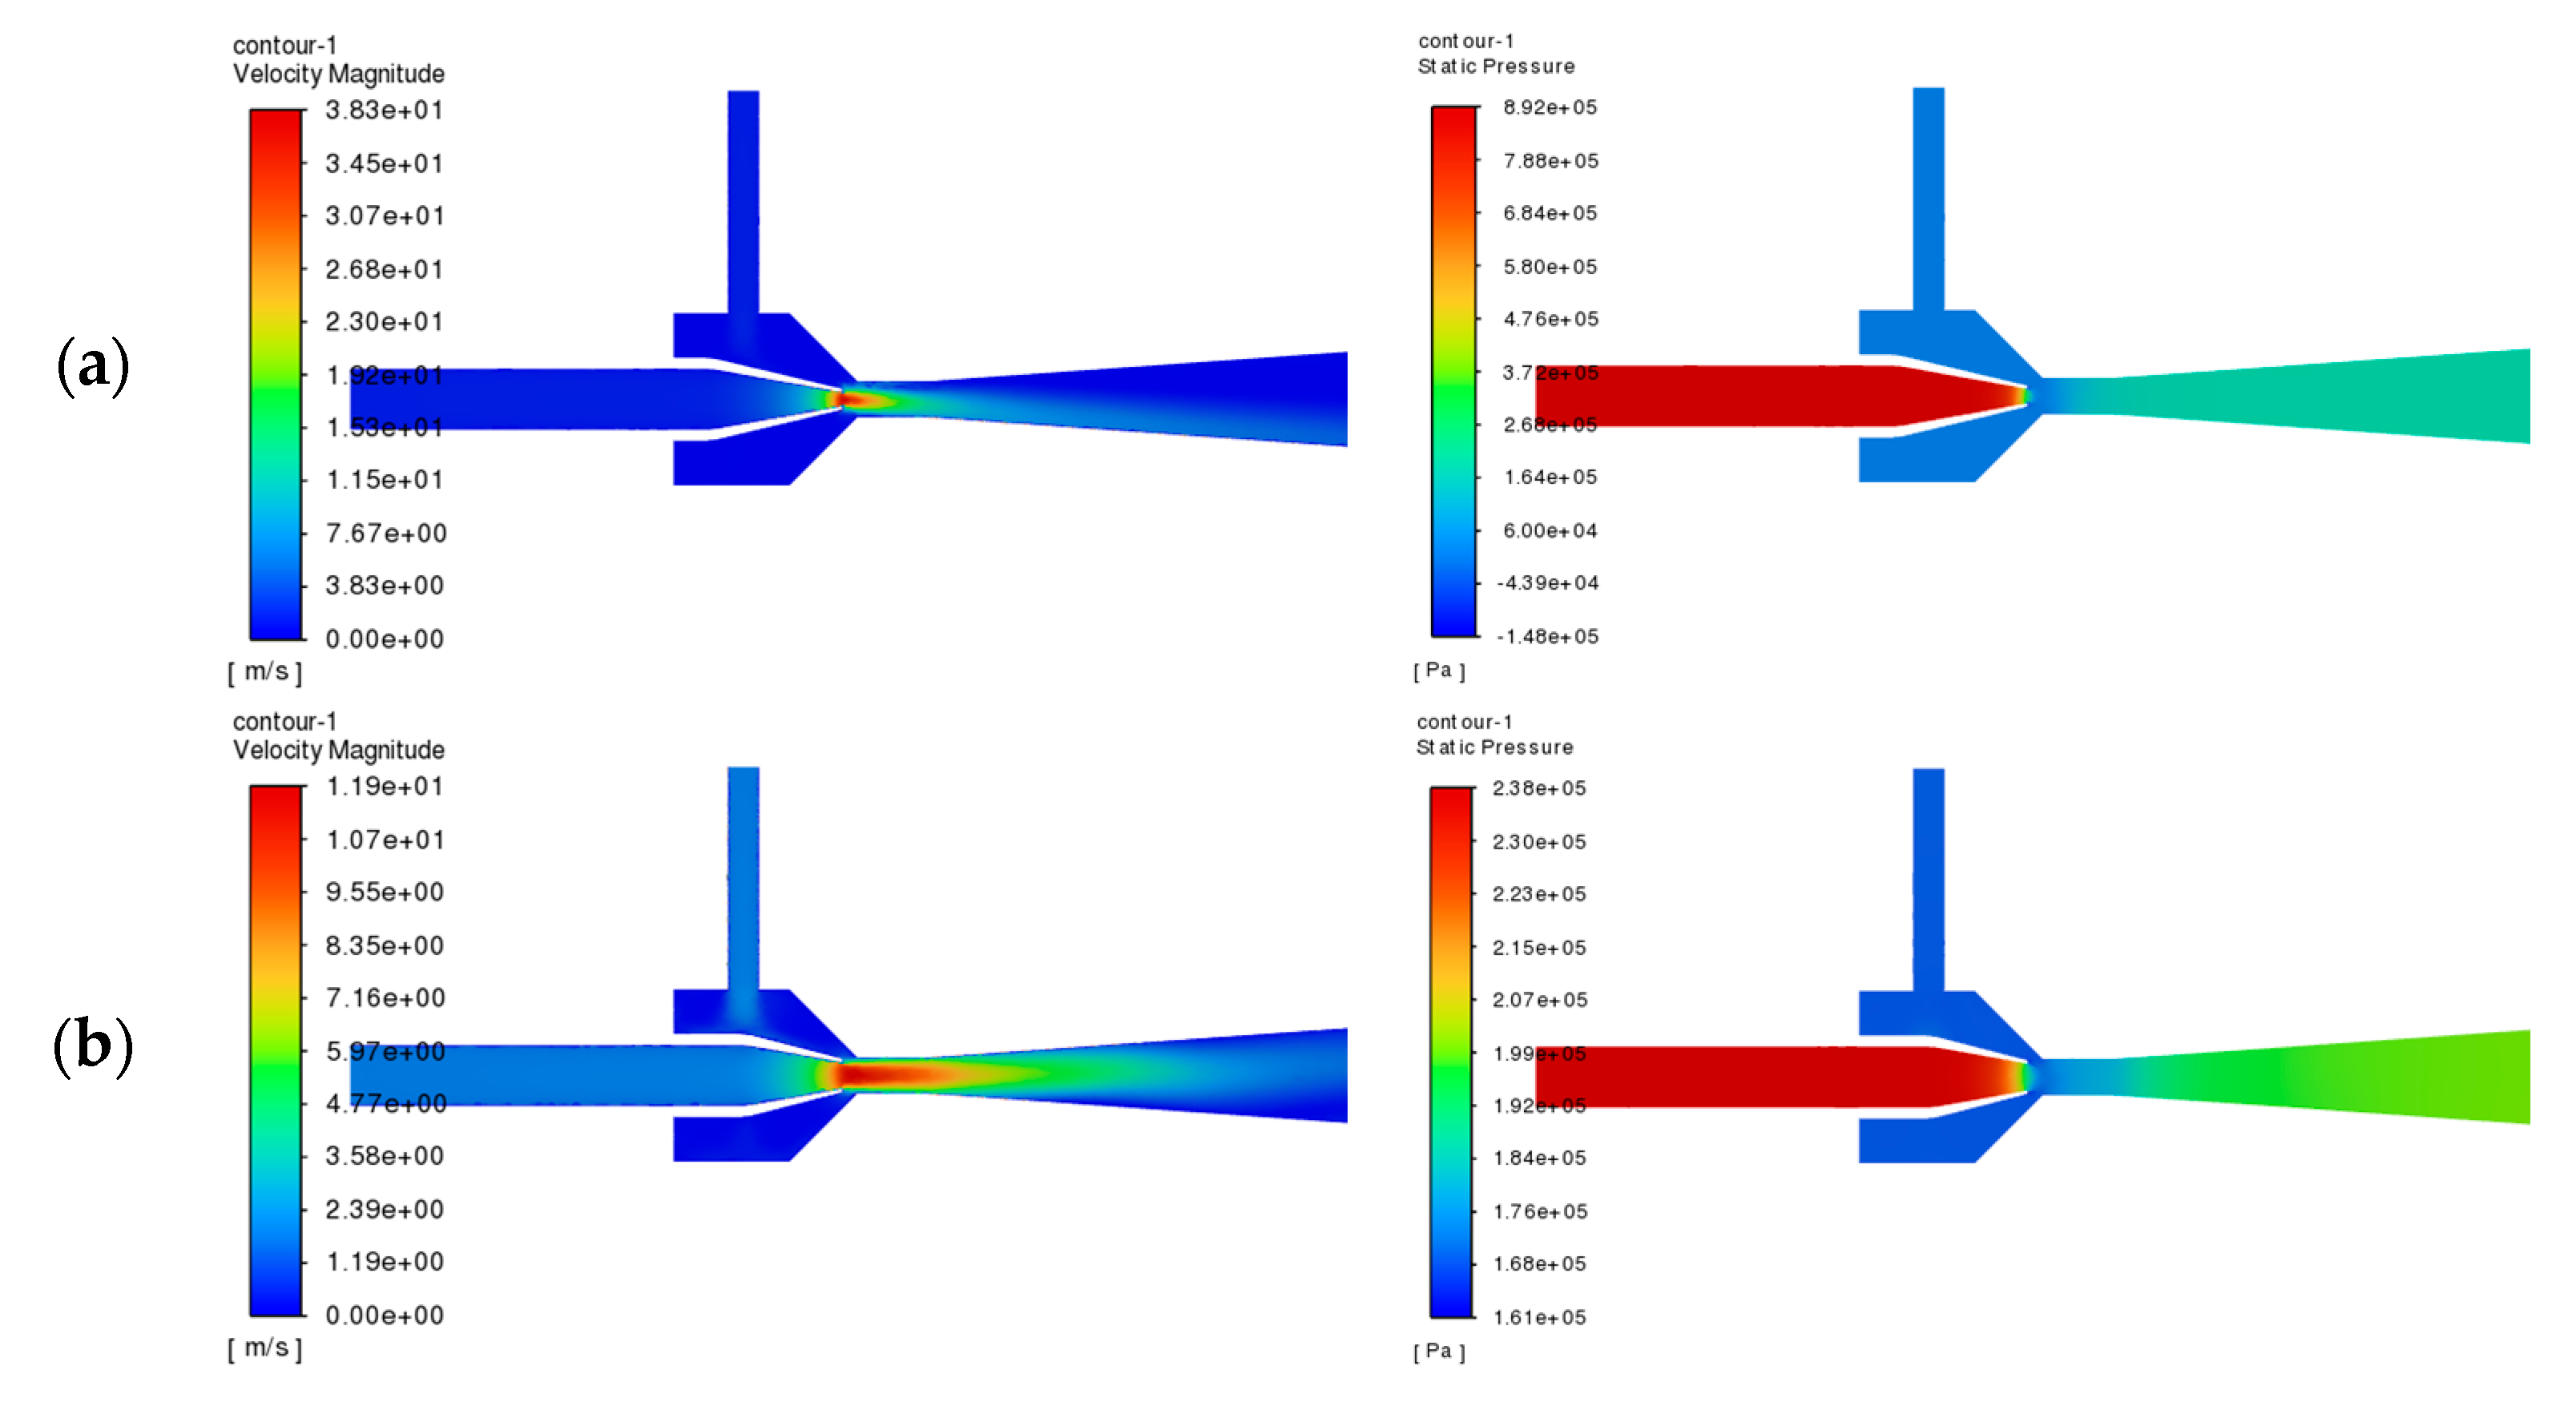
Velocity and pressure distributions were simulated for varying nozzle outlet diameters. Given the similarity of flow patterns across diameters, Figure 10 selectively presents the flow fields for 5 mm and 9 mm cases, with the remaining data provided in Appendix A. Analysis of Figure 10 reveals that smaller nozzle diameters (e.g., 5 mm) generate higher jet velocities, creating stronger impingement effects that enhance fluid mixing. However, excessively small diameters may reduce mixing efficiency due to disproportionate velocity increases and shortened momentum exchange duration. Furthermore, increasing the nozzle diameter was observed to (1) decrease the injector’s peak pressure and (2) reduce the low-pressure region at the throat, suggesting improved pressure stability within the injector.
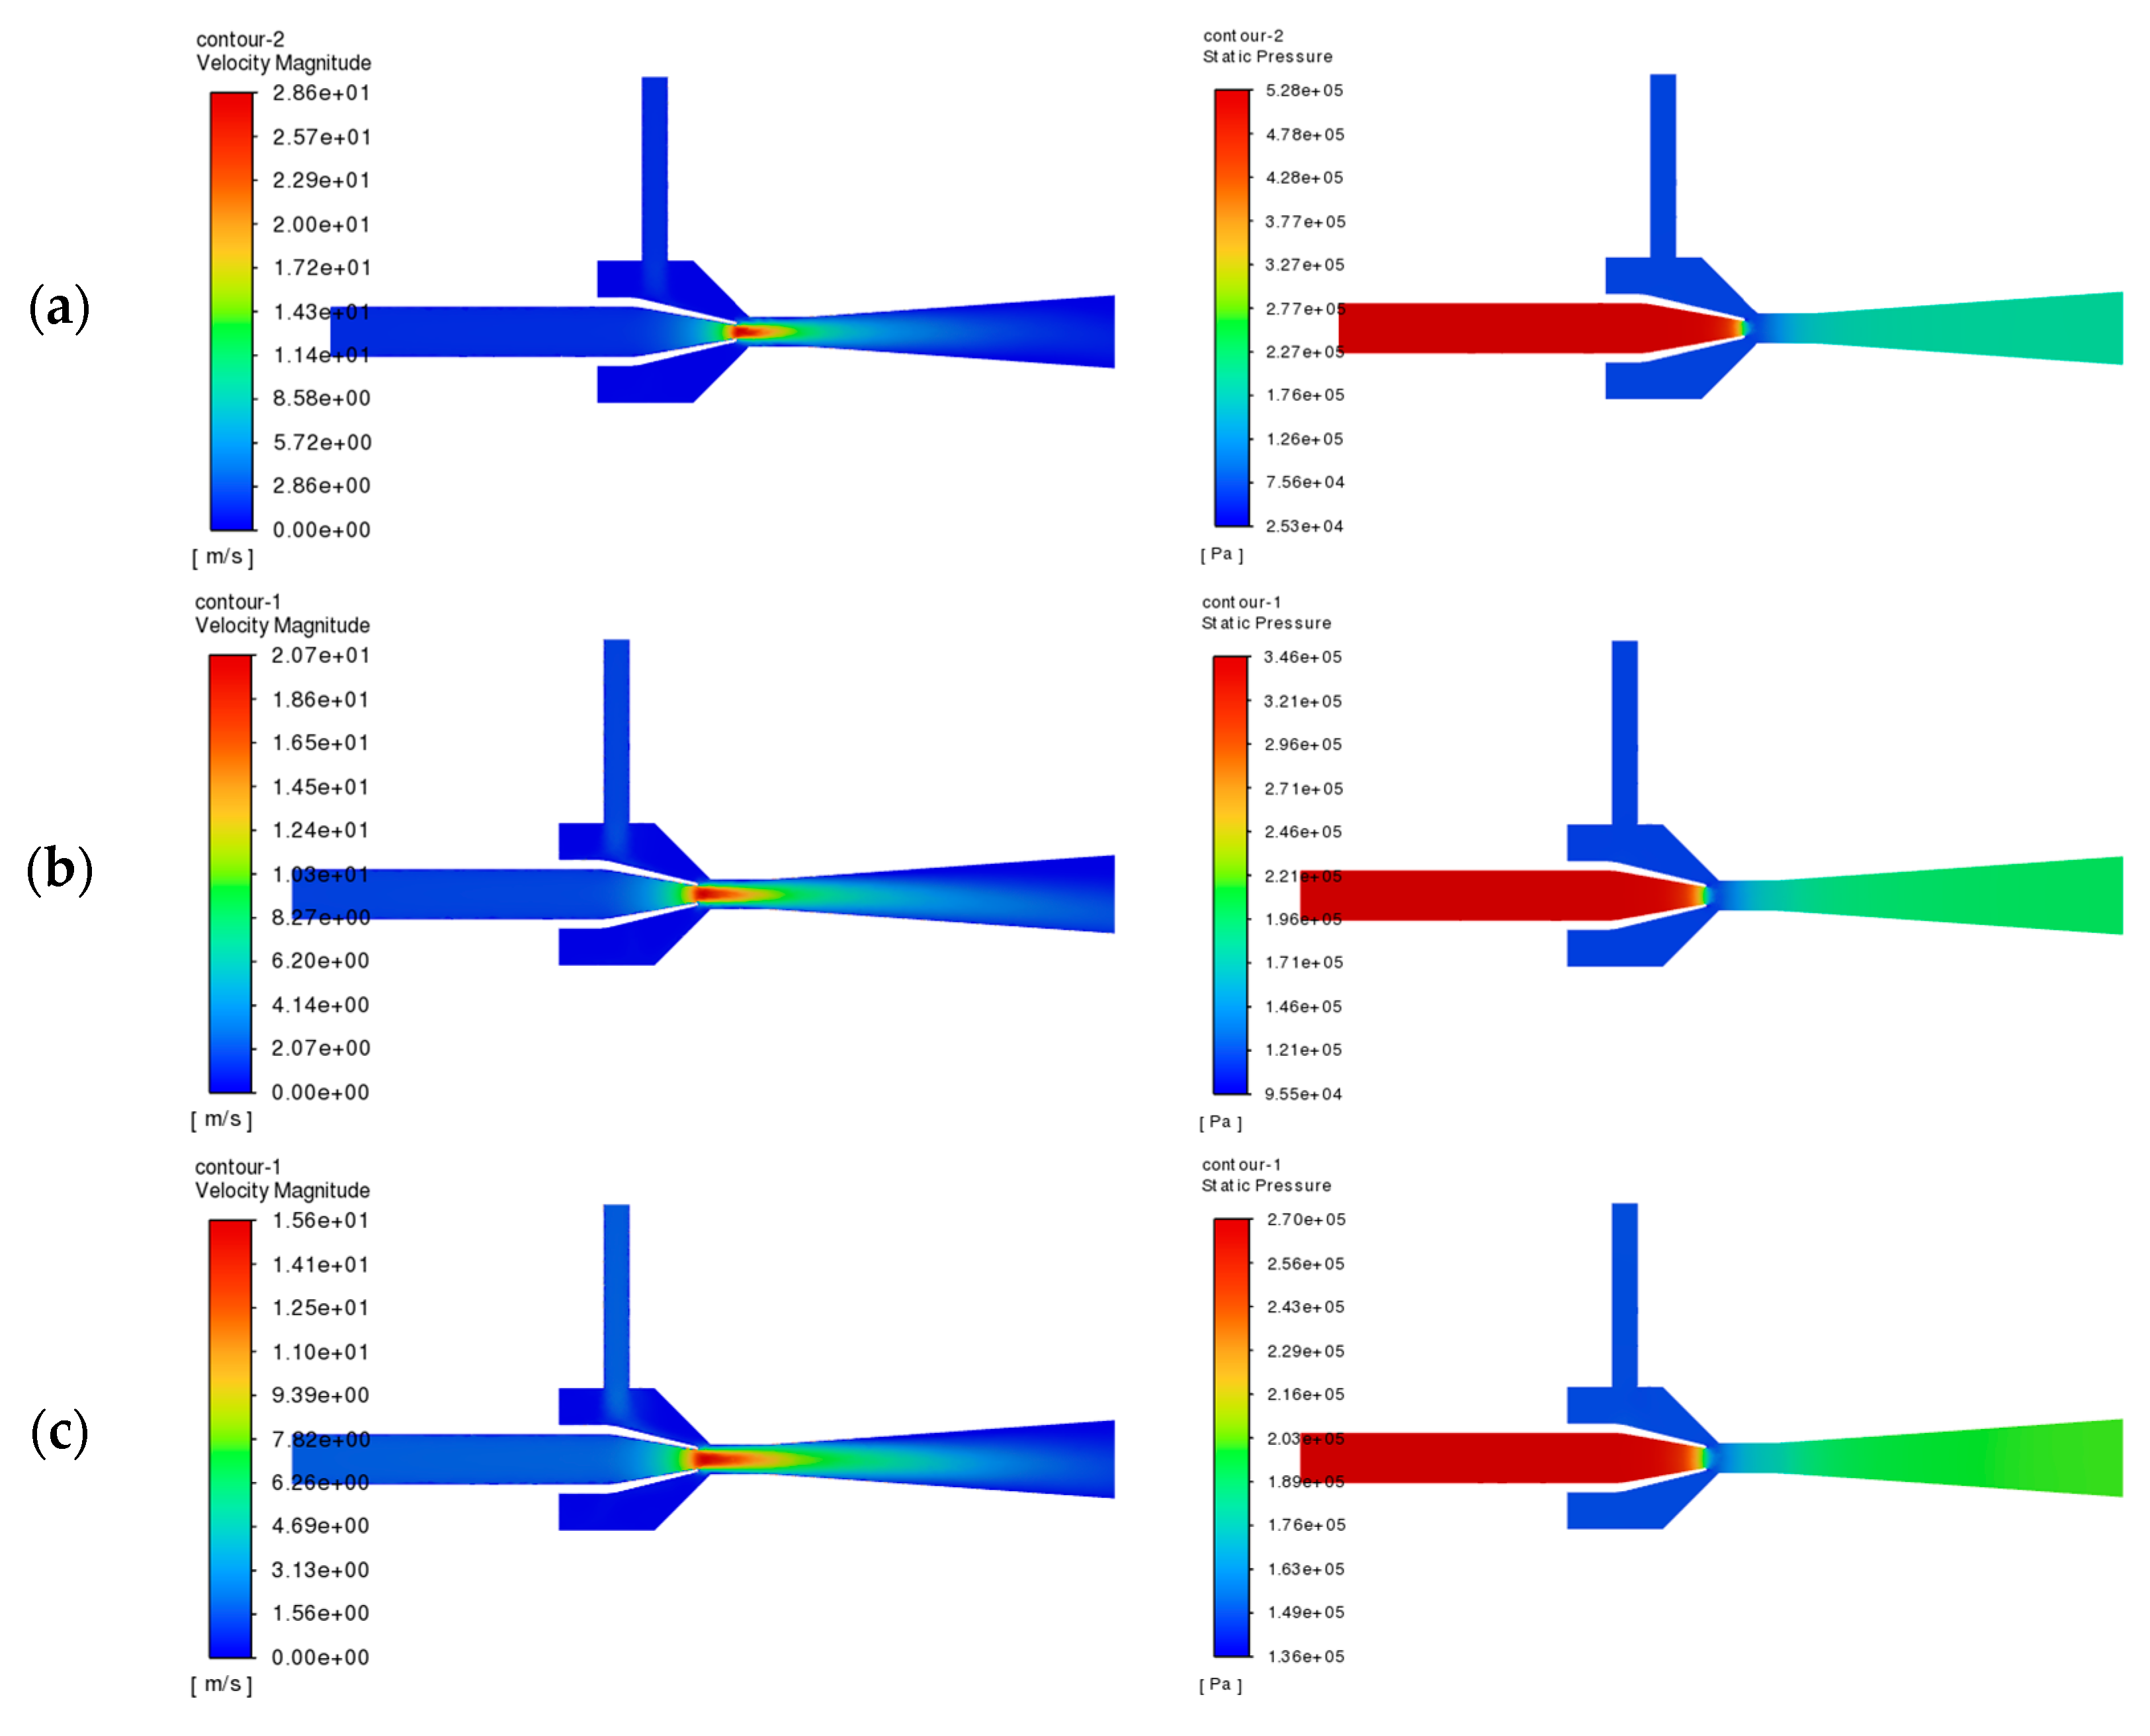
Given the minimal variation in flow field characteristics across different throat-to-diameter ratios, Figure 11 selectively presents the velocity and pressure distributions for ratios of two, three, and four, with complete data available in Appendix A. The results demonstrate that at ratios of two and three, the throat exit exhibits non-uniform velocity distribution with pronounced central acceleration; a ratio of four yields balanced velocity profiles, indicating complete fluid mixing; and post-throat pressure analysis reveals progressive stabilization along the pipe section, with the pressure drop completing within the throat region at a ratio of three without propagating into the diffuser.
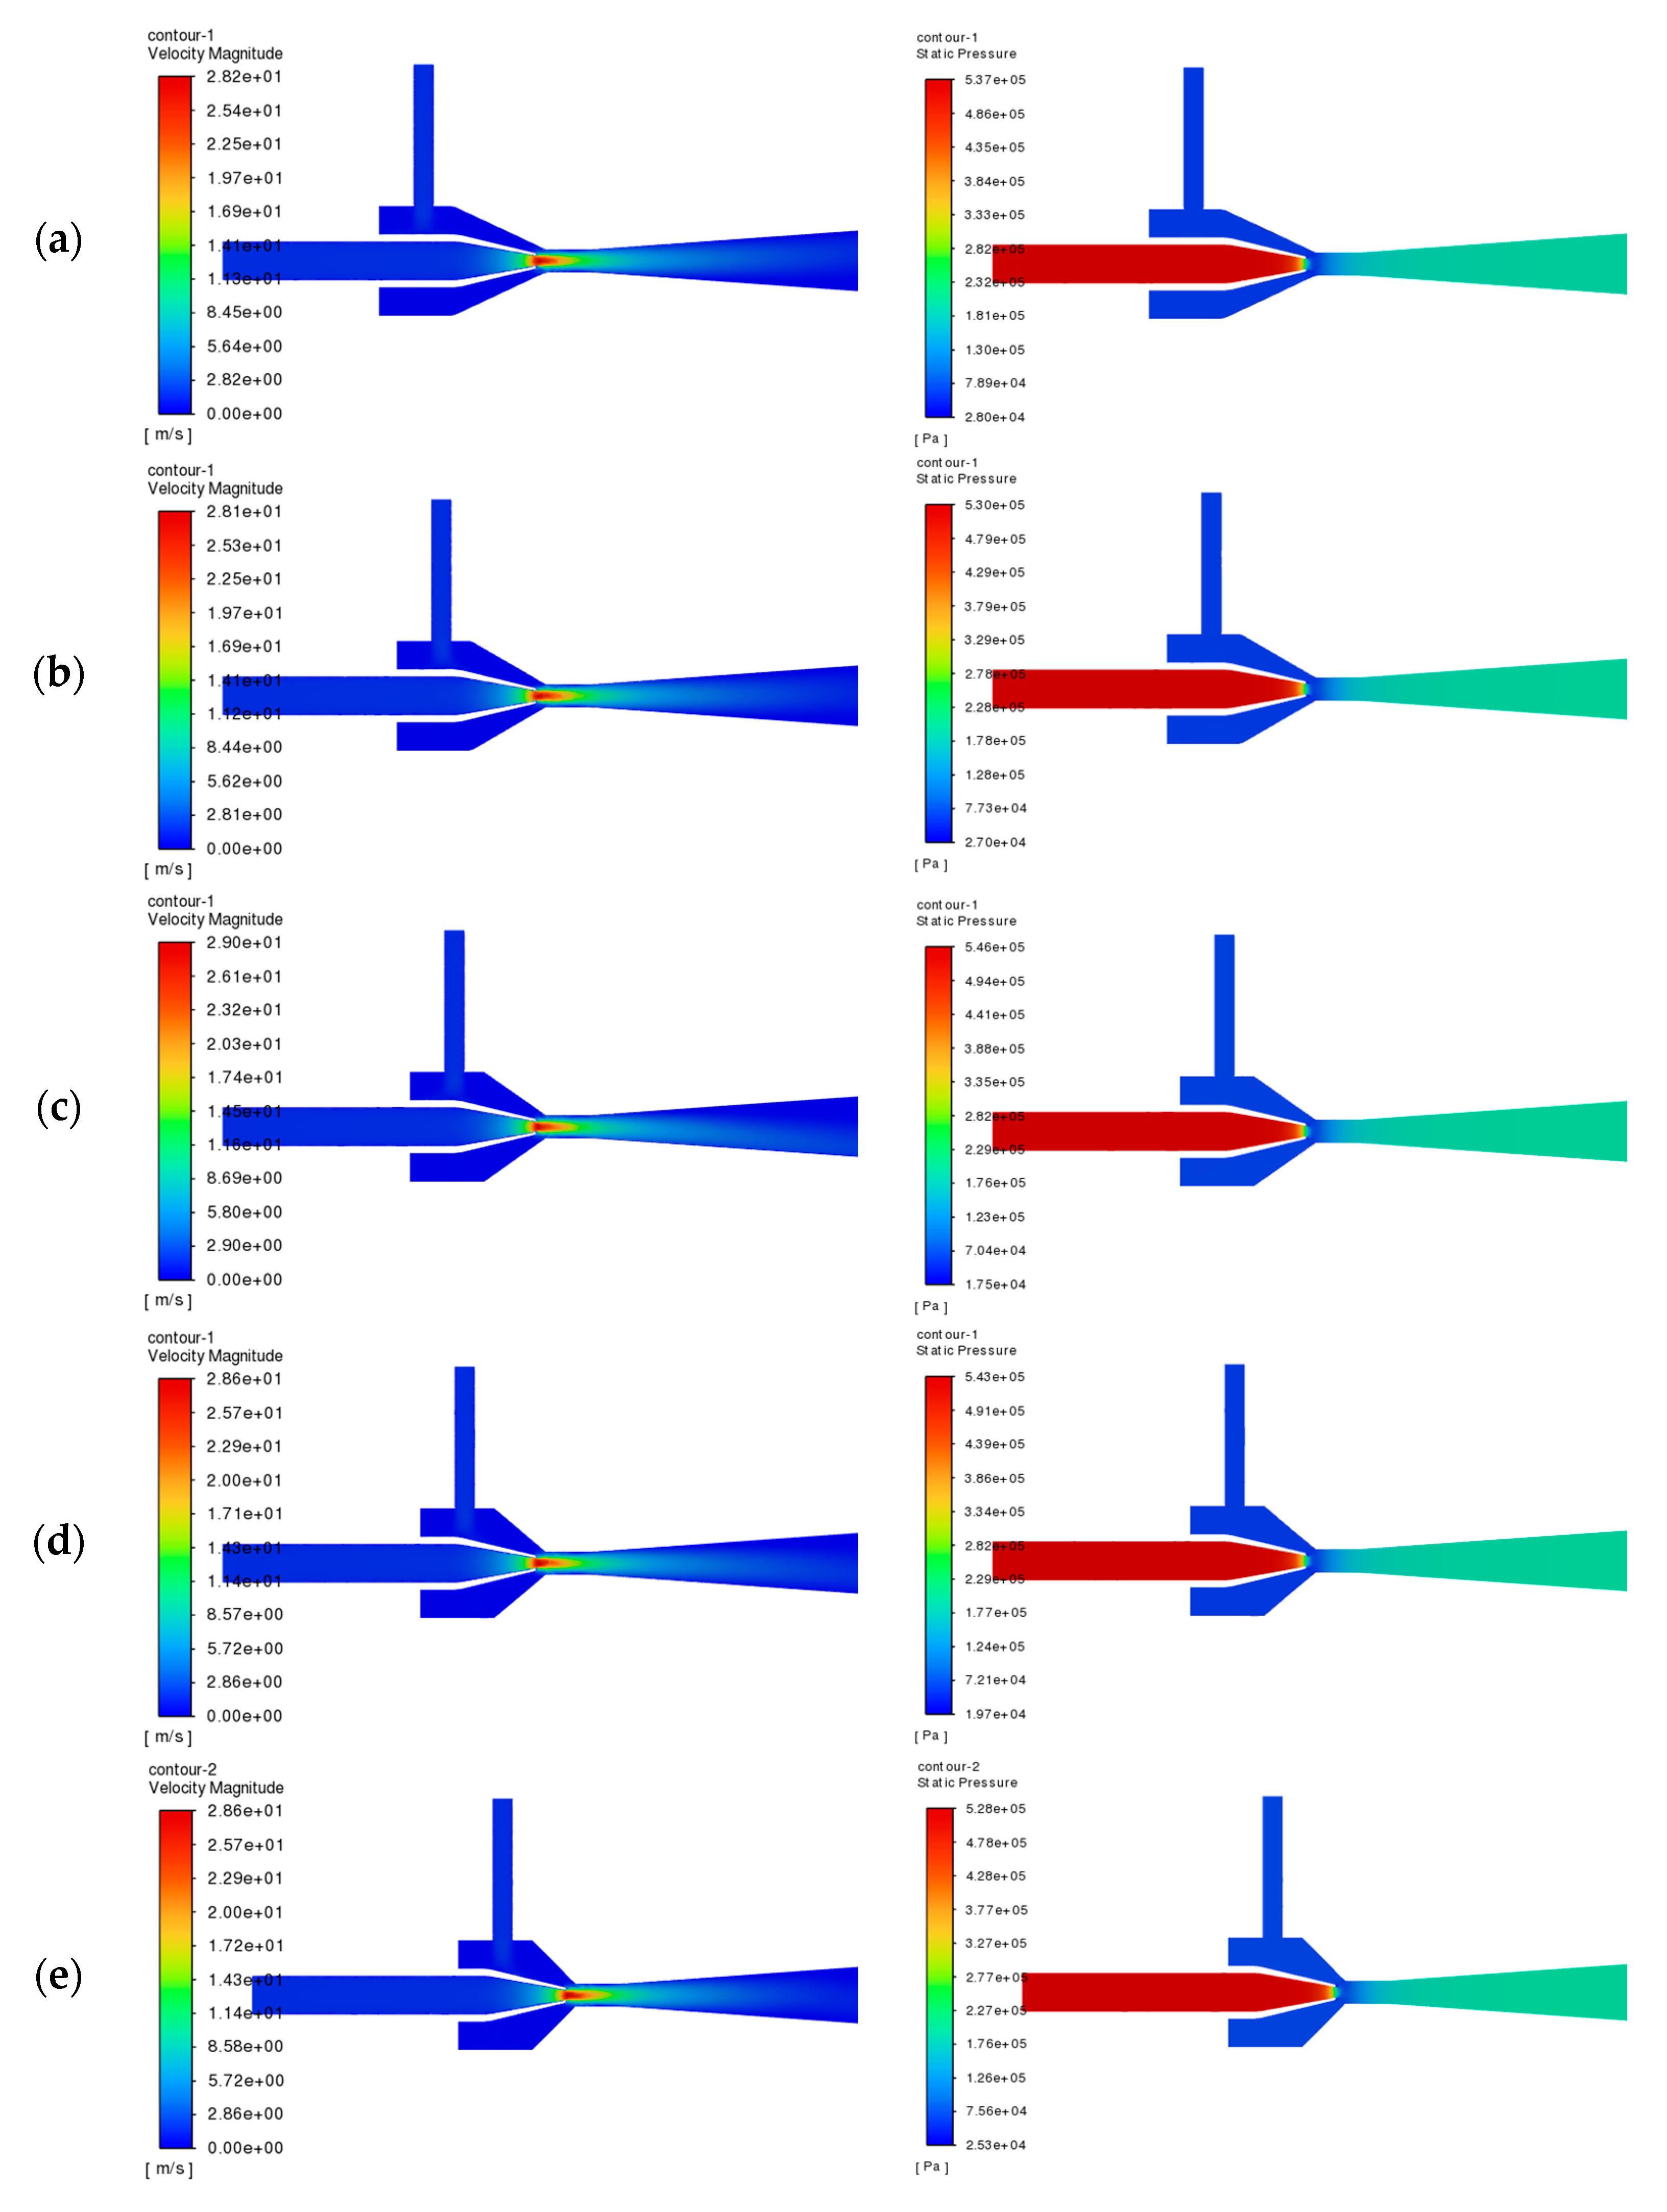
Figure 12 presents the velocity distribution and pressure cloud under different shrinkage angle conditions. It can be observed that under different contraction angles, the velocity and pressure distributions of the jet section are basically the same, and do not show obvious differences. Theoretically, with the gradual increase in the contraction angle, the path length of the ejected fluid into the throat section is shortened accordingly, which helps to reduce the along-range energy loss of the ejected fluid; however, when the contraction angle increases to a certain extent, the flow state of the ejected fluid in the corner region of the contraction section changes, and the collision and friction with the wall surface intensify, which leads to a large local resistance loss. This effect, in turn, weakens the efficiency of the injector.
Figure 13 shows the centerline pressure change in the jet section of the reactor under different parameters. According to Figure 13, the trend of the center axis pressure change is consistent with the changes in nozzle distance, both of which are first reduced and then increased, and the pressure at the nozzle outlet reaches its lowest value. Among them, the pressure at the throat is the lowest when the nozzle distance is 13 mm, and the pumping ability of the jet reactor is the strongest at this time. As the nozzle outlet diameter decreases, the working fluid inlet pressure gradually increases; this is because the nozzle outlet diameter determines the fluid flow rate—the smaller the diameter of the nozzle outlet, the higher the nozzle outlet flow rate. This means that more pressure energy needs to be converted into kinetic energy, which puts forward higher requirements for the process pumps and pipelines, and the overall energy consumption of the system increases. As the throat diameter ratio increases, the inlet pressure of the working fluid of the injector shows an upward trend, while the lowest pressure value shown in each curve remains basically the same. This phenomenon can be attributed to the fact that when the throat diameter ratio is large, the mixing process between the working fluid and the ejected fluid is completed in advance at the front end of the throat. In this case, the long throat section leads to an increase in the resistance of the fluid along the path. The pressure changes in the center axis under different constriction angles also overlap.

4.2.2. Influence of Structural Parameters on Jet Reactor

Efficiency is an important evaluation index to define the performance of the venturi jet reactor [17]. For the jet reactor efficiency η is calculated as follows,
η = P o u t P i n 2 P i n 1 P o u t × Q 2 Q 1
where Pin1 is the inlet pressure of working fluid, MPa; Pin2 is the inlet pressure of induced fluid, MPa; Pout is the outlet pressure, MPa; Q1 is the working fluid inlet flow rate, kg/s; and Q2 is the injection fluid inlet flow rate, kg/s;
According to the formula of jet reactor efficiency, the efficiency of the jet reactor represents the ratio of the energy gained by the induced fluid and the energy lost by the working fluid in the process of energy exchange between the two fluids, which represents the energy utilization rate of the jet reactor, and to a certain extent reflects the performance of the jet reactor.
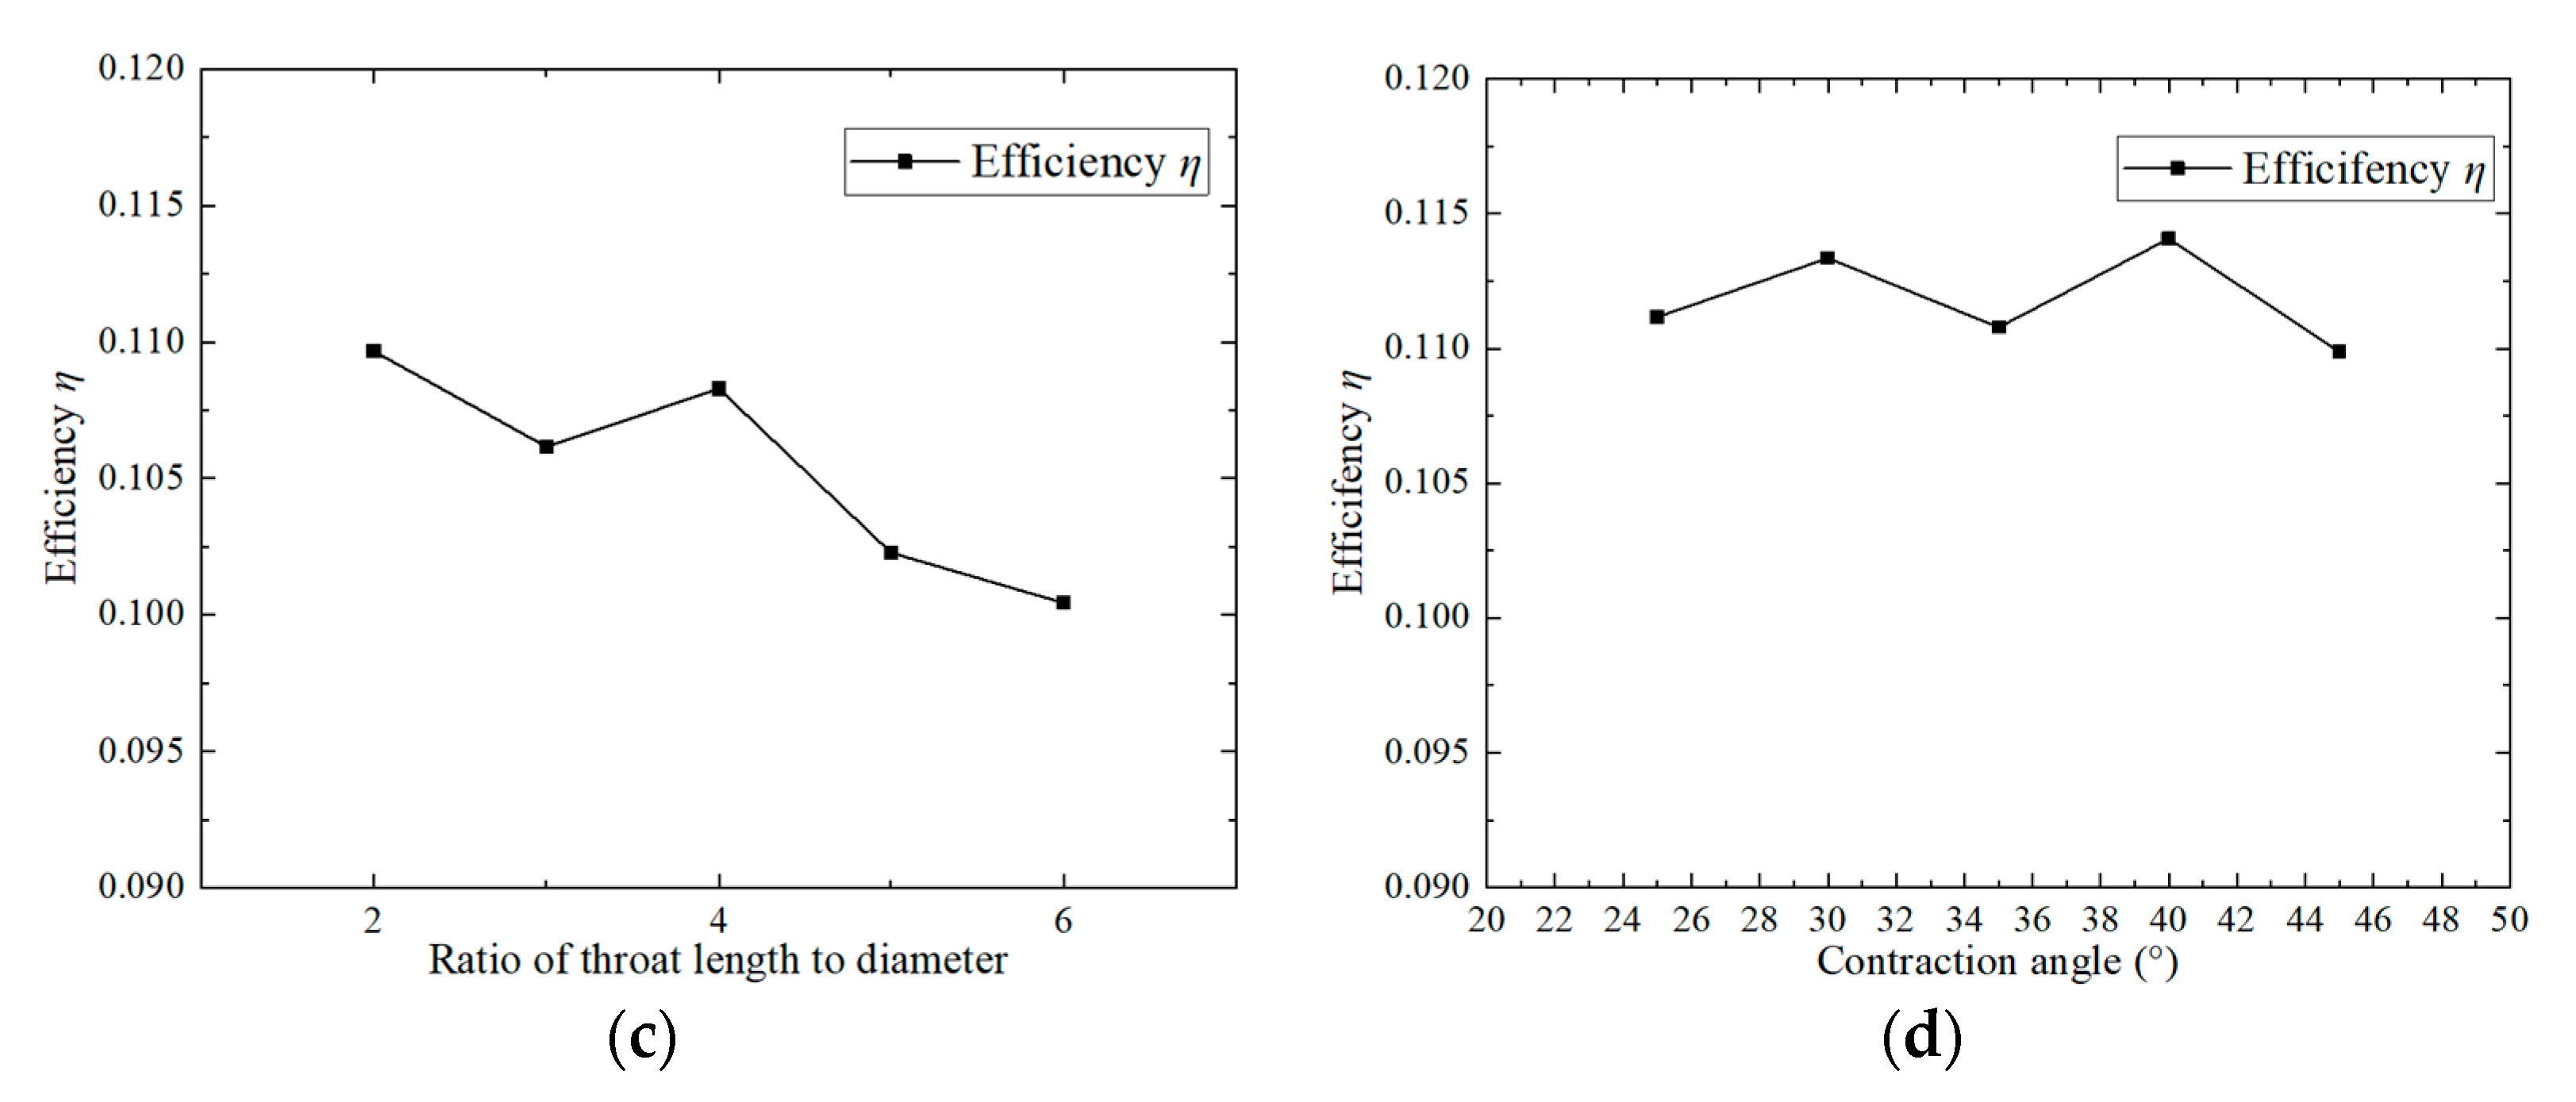
Figure 14 shows the efficiency curve of the jet reactor under different parameters; the overall efficiency of the jet reactor increases with the increase in the throat–nozzle pitch. The efficiency of the jet reactor changed significantly when the nozzle pitch increased from 7 mm to 9 mm, increasing by 10.57% after changing the size of the nozzle pitch. The efficiency of the jet reactor remained unchanged when the nozzle pitch continued to increase within the study range. With the increase in the nozzle outlet diameter of the jet reactor, efficiency gradually increases—the jet reactor outlet diameter is larger, the velocity of the working fluid jet is smaller, and the mixing process with the ejected fluid is relatively smooth, avoiding the dramatic fluctuations in the jet caused by the significant energy loss, thus ensuring that the jet reactor has high operating efficiency. The curve shows that the efficiency of the jet reactor is the highest when the throat diameter ratio is four, and then the efficiency of the jet reactor decreases with the increase in the throat diameter ratio. According to the previous analysis, when the throat diameter ratio is set to four, the distribution of velocity and pressure fields in the jet reactor shows good stability, and the mixing effect between the working fluid and the induced fluid is closer to ideal. The excess throat length leads to an increase in the flow resistance of the mixed fluid, so the efficiency of the jet reactor decreases. The efficiency of the jet reactor fluctuates up and down with the increase in the contraction angle.

4.2.3. Influence of Structure Parameters on Mixing Effect of Jet Reactor

Mixing index is an important index for evaluating the mixing effect of a venturi jet reactor. Two fluids are mixed under the action of the jet and subsequently react. The mixing effect within the jet reactor is crucial, as the mixing section is the main zone for fluid mixing. By analyzing the exit cross section of the ejected fluid from the mixing section, i.e., the mass fraction of urea, the introduction of the mixing index M is introduced. The mixing index M is defined based on the standard deviation of the urea mass fraction across the cross section. The value of M indicates the degree of uniformity of fluid mixing: the smaller the M value, the more uniform the mixing. The formula for calculating the mixing index is as follows.
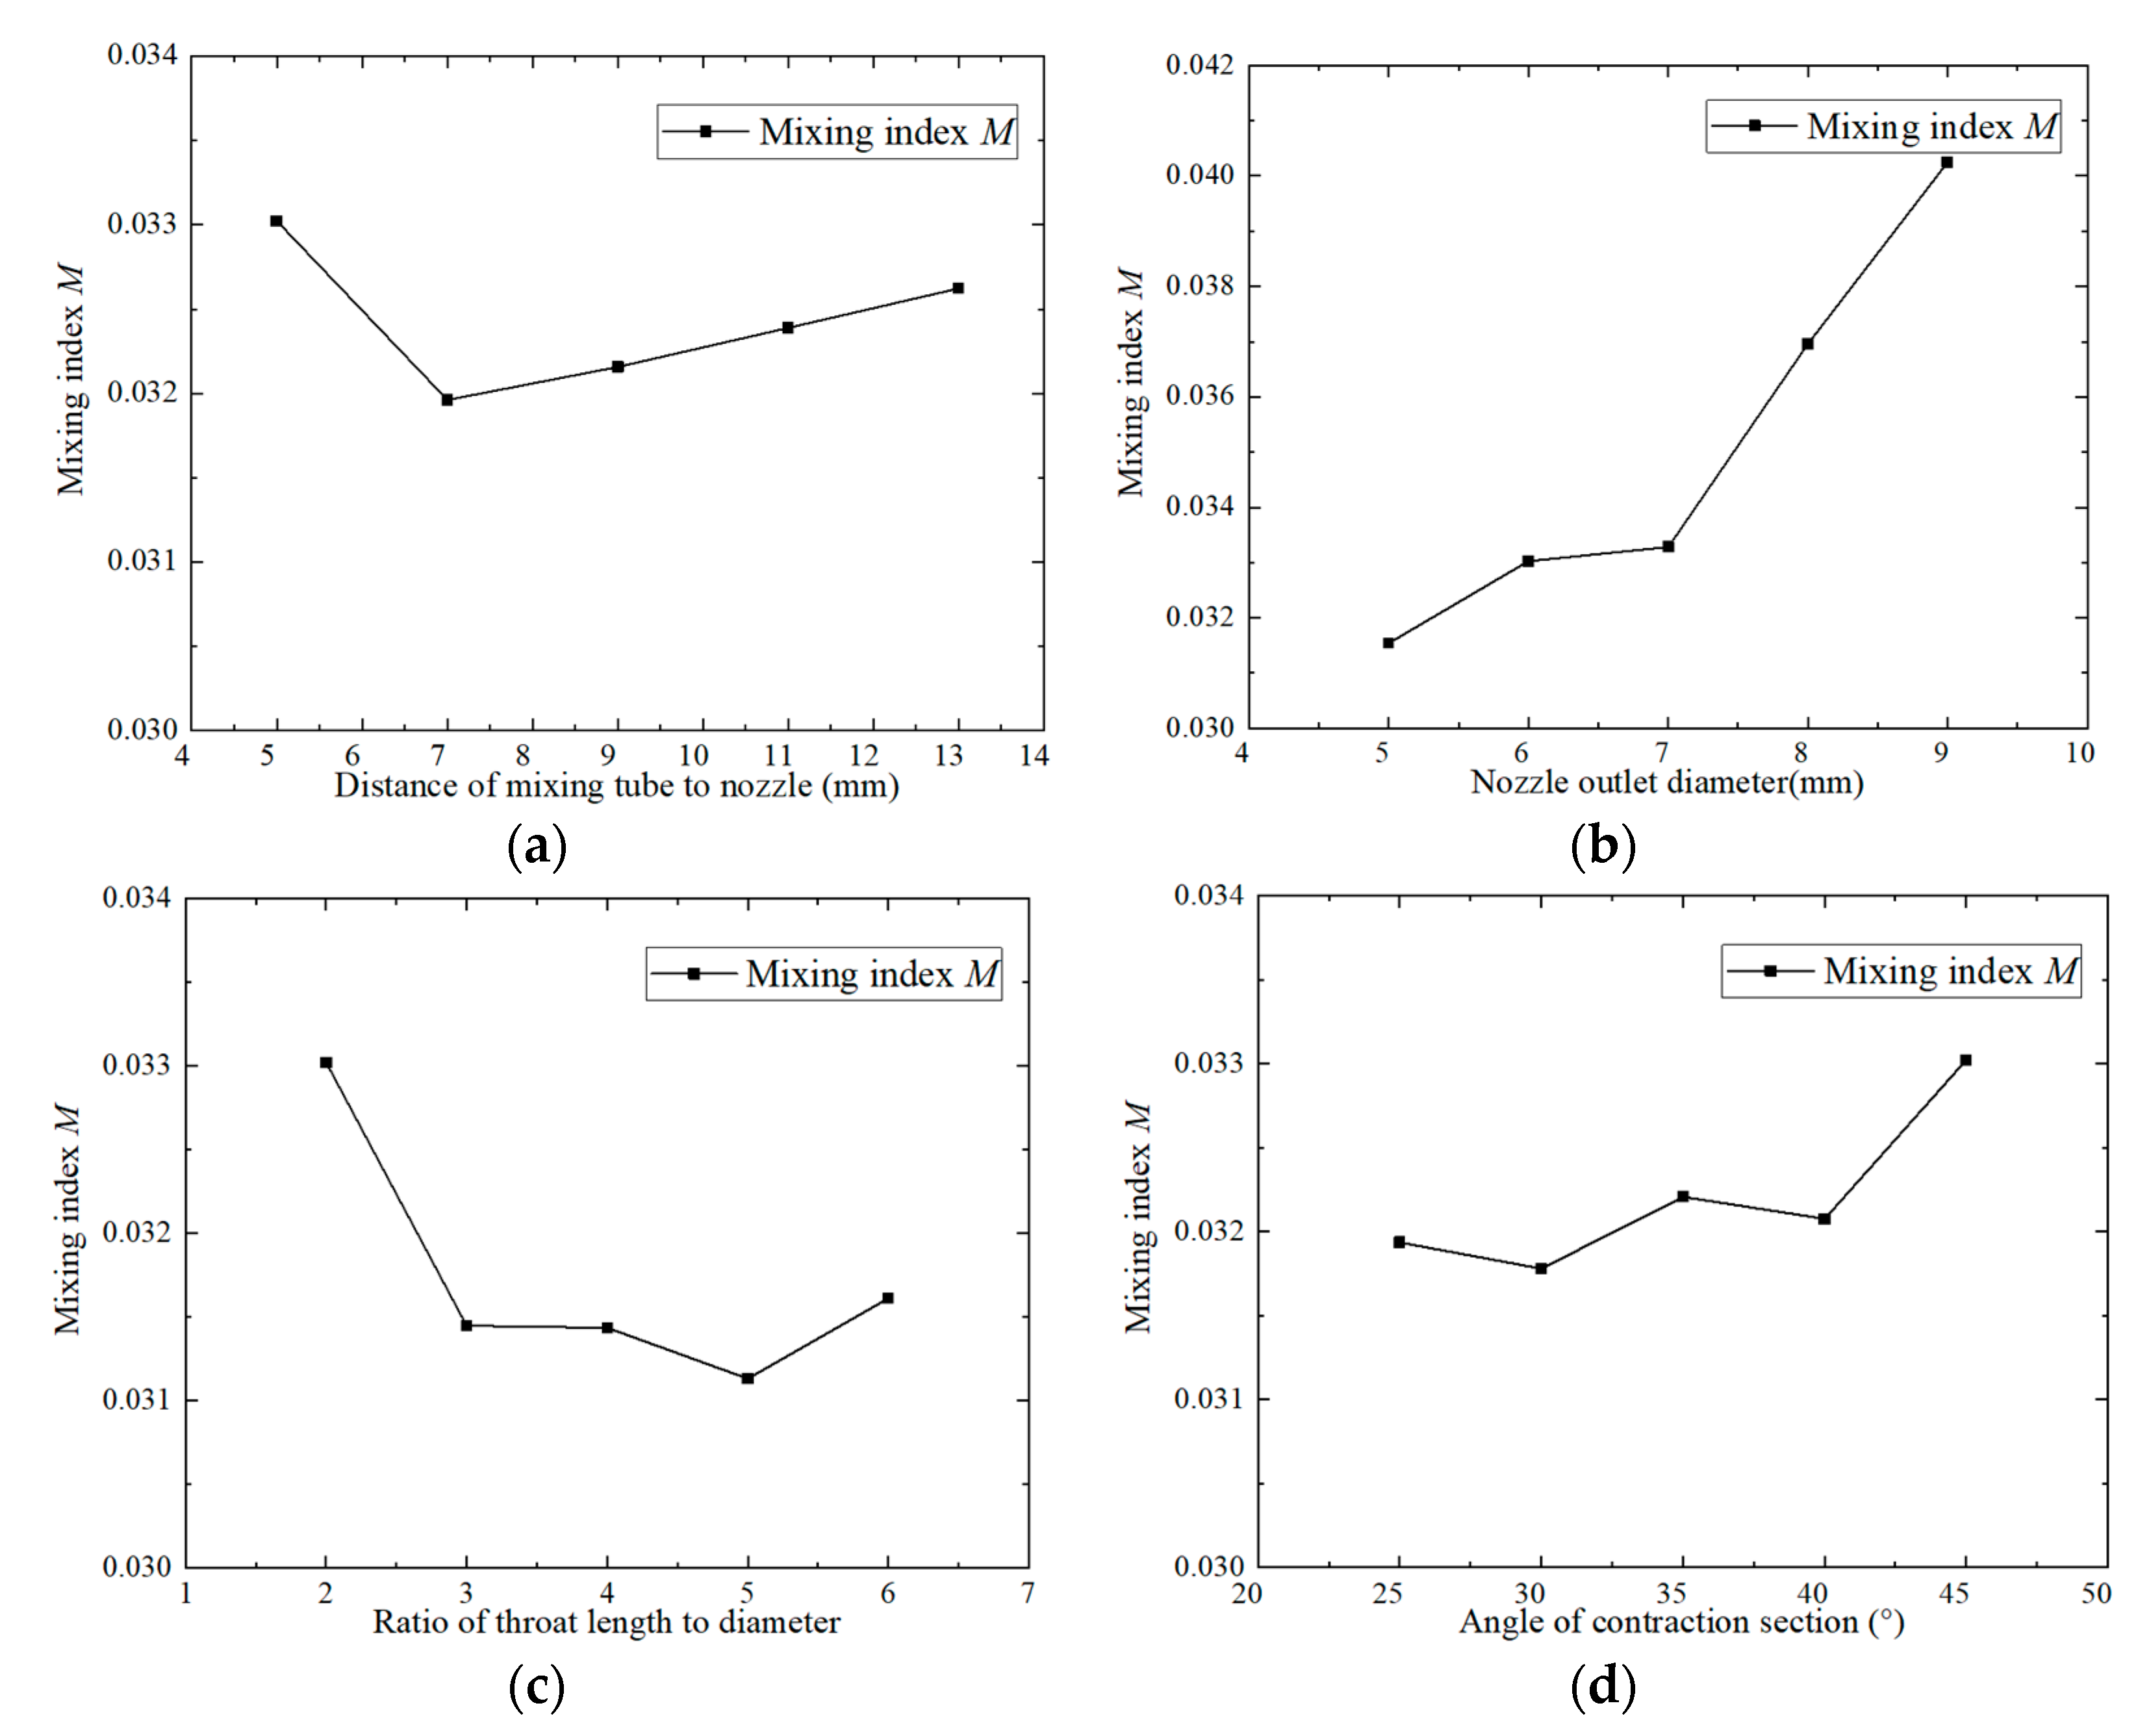
Figure 15 shows the mixing index curve of the throat outlet section of the jet reactor under different parameters. According to Figure 15, it can be seen that the mixing index M decreases and then increases with the increase in the throat–nozzle pitch, and that the mixing index is the smallest and the mixing effect the best when the throat–nozzle pitch is 7 mm. An in-depth investigation of the specific effect of the throat–nozzle distance on the performance of the jet reactor reveals that when the throat–nozzle distance is small, the jet formed by the working fluid will rapidly enter the mixing section. At this time, due to the relatively small contact area between the two fluids, the energy exchange process between them is relatively short, resulting in a poor mixing effect of the jet reactor. With the gradual increase in the throat spacing, the working fluid and the ejected fluid have a wider area for energy exchange before entering the mixing section, the contact time between the two fluids can be extended, so the ejected fluid can obtain more energy. At the same time, the resistance in the mixing process is also reduced accordingly. In addition, the free flow beam of the working fluid is fully expanded in the process, and the flow state tends to be uniform, thus reducing the energy loss of the jet reactor and improving the efficiency of the equipment. However, when the throat–nozzle distance is too large, but when the throat–nozzle distance is too large, the nozzle outlet is too far away from the throat inlet, and the jet formed by the working fluid loses part of its energy before entering the throat, which leads to a decrease in the efficiency of the jet reactor.
The mixing index M increases with the increase in the nozzle outlet diameter, and the mixing effect gradually worsens. This indicates that the increase in nozzle outlet diameter reduces the mixing effect of the two fluids. Further analysis of the impact of the nozzle outlet diameter reveals that when the nozzle diameter is too large, the working fluid flows more smoothly, and the two streams of fluid in the throat experience less collision and turbulence. As a result, energy and momentum exchange is not complete and mixing is insufficient. From the curve, it can be seen that when the nozzle outlet diameter is larger than 7 mm, the mixing index M increases dramatically, and the mixing effect decreases sharply.
With the increase in the throat diameter ratio, the mixing index M first decreases and then increases. There is a significant decrease in the mixing index between throat diameter rations of two and three, reaching its minimum at a ratio of five, where the mixing effect of the venturi jet reactor is at its best. Further increasing the throat diameter ratio leads to a deterioration in the mixing effect. This is because, under the action of the working fluid, the ejection of fluid is sucked into the throat section and mixed, and the flow becomes more uniform, the total pressure reduction and velocity equalization are largely completed within the throat. In the diffusion section of the entrance, the velocity distribution becomes more uniform, reducing energy loss, making this throat diameter ratio the most optimal. When the throat diameter ratio is small, mixing is not completed before entering the diffusion section, so the flow is uneven and the mixing effect is not ideal. When the throat diameter ratio is too large, mixing is already completed in the front of the throat, and further increases in the throat diameter ratio will not improve the mixing effect, but will increase the resistance along the way, reducing the performance of the jet reactor, and at the same time, causing a waste of resources, increasing the cost of equipment manufacturing.
From the curve, it can be seen that as the contraction angle increases, the mixing index shows an upward trend, indicating that the mixing effect gradually worsens. When the contraction angle is increased from 40° to 45°, the mixing effect is significantly reduced. When the contraction angle of 30°, the mixing effect is the best. In the contraction section, the pilot fluid undergoes mixing due to pressure differences, and when the contraction angle is small and the section is long, the velocity change of the pilot fluid is small, the fluid flow is relatively smooth, and the mixing of the two streams of fluid is smoother, and the mixing is closer to ideal. With the increase in the contraction angle, the velocity change of the ejected fluid increases, the flow is more violent and, due to the loss of part of the energy of the ejected fluid, the mixing effect decreases. On the other hand, the increase in the contraction angle expands the low-pressure zone formed by the working fluid jet, which is favorable to the inhalation of the ejected fluid.
In summary, the influence of each parameter on the performance of the jet reactor is multifaceted, and there is a complex interaction between them. Therefore, in practical application, these parameters need to be selected and adjusted reasonably according to the specific needs and conditions in order to achieve the optimal performance of the jet reactor.
The optimal structural parameters were determined based on the analysis results, and the optimized throat–orifice distance of the jet section was 9 mm, the nozzle outlet diameter was 7 mm, the throat-to-diameter ratio was 4, and the constriction angle was 30°.
The structure optimized venturi jet reactor is remodeled, the results of the simulation are analyzed, and the velocity and pressure distribution of the optimized jet section is shown in Figure 16. It can be seen that the velocity and pressure distribution of the mixed fluid through the throat section is uniform, indicating that the mixing effect of the two fluids is better, and the efficiency of the optimized venturi jet reactor is calculated to be 0.1720. The value before the structural optimization was 0.1098, which is an increase of 56.65% The mixing index is 0.0322, and the value before the structural optimization was 0.0330, which is an increase of 2.42% in the mixing effect. The calculation formula is as follows:
ε 1 = | M 2 M 1 M 1 | × 100 %
ε 2 = | η 2 η 1 η 1 | × 100 %
Among them, M1 is the pre-optimization mixing index, M2 is the post-optimization mixing index, η1 is the pre-optimization efficiency, η2 is the post-optimization efficiency, ε1 is the mixing effect improvement rate, and ε2 is the efficiency improvement rate.
5. Conclusions

In the urea-based synthesis of hydrazine hydrate, conventional methods often suffer from inadequate mixing and inefficient heat exchange. To address these limitations, this study introduces a novel jet mixing reactor optimized for high liquid–liquid ratios. The proposed design employs a venturi jet device to enhance fluid mixing efficiency while integrating straight-tube heat exchange and an internal spiral tube to further improve material homogenization, heat transfer, and reaction kinetics. This synergistic configuration significantly enhances reaction conversion rates and product yield, offering a robust solution for industrial-scale hydrazine hydrate production. The reactor’s overall performance and mixing dynamics were systematically evaluated through numerical simulations. The results show that, in improving the efficiency of the jet reactor, increasing the throat distance and the nozzle outlet diameter has a positive effect, while the influence of the throat diameter ratio and the contraction angle is more complicated, and there are specific optimal values to maximize the efficiency of the reactor. In terms of mixing effect, as the nozzle distance increases, the mixing effect is first enhanced and then weakened; the influence of the throat diameter ratio is opposite, and its increase in a certain range is conducive to the enhancement of the mixing effect. The increase of the nozzle outlet diameter is not conducive to the full mixing of the two fluids; in contrast, the contraction angle has a relatively weak effect on the mixing effect. Considering all the factors, we chose a 9 mm nozzle distance, a 7 mm nozzle outlet diameter, a throat diameter ratio of four, and a 30° constriction angle as the optimal structural parameters to optimize the structure of the venturi jet reactor. After optimization, the mixing effect of the reactor was improved by 2.42%, and the efficiency was significantly increased by 56.65%.
For subsequent studies on the application of venturi jet reactors in urea hydrazine hydrate synthesis, we recommend the following:
Performance Optimization: Building on the current investigation of reactor performance and mixing effects, future work should focus on refining the heat exchange structure to align with practical process requirements, thereby further improving reactor efficiency.
Process Integration: Additional research could explore the scalability of the proposed reactor design under varying industrial conditions, ensuring robust performance across different production scales.

Author Contributions

Conceptualization, S.Y., Z.W., H.W. and X.W.; methodology, S.Y. and Z.W.; software, S.Y., Z.W. and H.W.; validation, S.Y., Z.W. and H.W.; formal analysis, S.Y., Z.W. and H.W.; investigation, S.Y. and Z.W.; resources, X.W. and S.L.; data curation, S.Y. and Z.W.; writing—original draft preparation, S.Y.; writing—review and editing, S.Y. and X.W.; visualization, S.Y. and Z.W.; supervision, S.Y. and Z.W.; project administration, S.Y., Z.W., H.W. and X.W.; funding acquisition, X.W. All authors have read and agreed to the published version of the manuscript.

Funding

This research received no external funding.

Data Availability Statement

The data will be made available upon reasonable request to the corresponding authors.

Acknowledgments

The authors would like to acknowledge the School of Chemical Engineering, Tianjin University.

Conflicts of Interest

Author Shengting Li was employed by the company Central Research Institute of Qinghai Salt Lake Industry Co., Ltd. The remaining authors declare that the research was conducted in the absence of any commercial or financial relationships that could be construed as a potential conflict of interest.

Appendix A

Figure A1. Velocity diagram and pressure distribution with different nozzle outlet diameters: (a) 6 mm, (b) 7 mm, and (c) 8 mm.
Processes 13 02839 g0a1
Figure A2. Velocity diagram and pressure distribution under different ratios of throat length to diameter: (a) 5 and (b) 6.
Processes 13 02839 g0a2

References

  1. Tang, Z.; Huang, F.; Yao, Z.; Cai, Z.; Ma, X.; Li, Z.; Gao, Z. Optimization of flow and mixing in a venturi tube mixer with a two-step method using numerical simulation. Processes 2023, 11, 1083. [Google Scholar] [CrossRef]
  2. Shen, B.; Zhan, X.; Sun, Z.; He, Y.; Long, J.; Li, X. PIV experiments and CFD simulations of liquid–liquid mixing in a planetary centrifugal mixer (PCM). Chem. Eng. Sci. 2022, 259, 117764. [Google Scholar] [CrossRef]
  3. Merkens, S.; De Salvo, G.; Kruse, J.; Modin, E.; Tollan, C.; Grzelczak, M.; Chuvilin, A. Quantification of reagent mixing in liquid flow cells for Liquid Phase-TEM. Ultramicroscopy 2023, 245, 113654. [Google Scholar] [CrossRef] [PubMed]
  4. Li, M.R.; Gu, G.G.; Yue, T.J.; Ren, W.M.; Lu, X.B. CO2-assisted hydration of propylene oxide to produce propylene glycol: Accessing high selectivity using a jet loop reactor. J. CO2. Util. 2024, 80, 102684. [Google Scholar] [CrossRef]
  5. Ajour, M.N.; Jahangiri, S.; Al-Shati, A.S.; Abu-Hamdeh, N.H.; Mostafa, M.E.; Jasim, D.J.; Hekmatifar, M. Numerical investigation of the effect of swirling flow caused by twisted tape in impinging jet’s nozzle on heat transfer: Application in cooling of electronic components and turbine blades. J. Taiwan Inst. Chem. Eng. 2023, 150, 105058. [Google Scholar] [CrossRef]
  6. Jiang, T.; Huang, Z.; Li, J.; Zhou, Y.; Xiong, C. Experimental investigation of internal and external flow fields of jetting nozzles with different structures. J. Petrol. Sci. Eng. 2022, 217, 110891. [Google Scholar] [CrossRef]
  7. Yan, J.; Shu, Y.; Jiang, J.; Wen, H. Optimization of Two-Phase Ejector Mixing Chamber Length under Varied Liquid Volume Fraction. Entropy 2022, 25, 7. [Google Scholar] [CrossRef]
  8. Yuan, Y.; Cao, J.; Zhang, Z.; Xiao, Z.; Wang, X. Experimental and numerical simulation study of a novel double shell-passes multi-layer helically coiled tubes heat exchanger. Int. J. Heat. Mass. Tran. 2024, 227, 125497. [Google Scholar] [CrossRef]
  9. Hassan, M.; Ahmad, I.; Anwar, M.; Ali, S.M.; Subramanian, Y.; Azad, A.K. Species transport model and custom field function algorithm for computational fluid dynamics-based design and exergy analysis of downdraft biomass gasifiers. Mater. Today 2023, 123119. [Google Scholar] [CrossRef]
  10. Kotak, V.; Pathrose, A.; Sengupta, S.; Gopalkrishnan, S.; Bhattacharya, S. Experimental investigation of jet pump performance used for high flow amplification in nuclear applications. Nucl. Eng. Technol. 2023, 55, 3549–3558. [Google Scholar] [CrossRef]
  11. Ahad, J.; Farooq, A.; Siddique, W.; Ahmed, A.; Ahmad, M.; Waheed, K.; Qureshi, K.R.; Irfan, N. Influence of variation in converging section and orifice plane on the performance of venturi scrubber by using CFD. Prog. Nucl. Energ. 2022, 151, 104323. [Google Scholar] [CrossRef]
  12. Wells, K.; Sharifian, A. Design of short Venturi flow meters for incompressible and isothermal flow applications. Heliyon 2024, 10, 29311. [Google Scholar] [CrossRef]
  13. Li, N.; Liu, Y.; Li, L.; Chang, S.; Han, S.; Zhao, H.; Meng, H. Numerical simulation of wind turbine wake based on extended k-epsilon turbulence model coupling with actuator disc considering nacelle and tower. IET. Renew. Power. Gen. 2020, 14, 3834–3842. [Google Scholar] [CrossRef]
  14. Nandwani, S.K.; Saxena, N.; Kumar, A. Enhanced oil recovery potential analysis through simulation of a bio-based surfactant using CFD. J. Mol. Liq. 2024, 396, 12411. [Google Scholar] [CrossRef]
  15. Liu, L.D.; Tang, F.H.; Liu, L.J.; Ma, Y.H.; An, D.L.; Zhao, Y.L.; Song, X.J.; Shi, D.Y. Summary of trial operation of 50000 t/a urea based hydrazine hydrate plant. Chlor Alkali Ind. 2014, 50, 32–34+45. (In Chinese) [Google Scholar]
  16. Guo, Y.T. Structural Study of Venturi Type Liquid Jet Reactor. Master’s Thesis, Northwestern University, Xi’an, China, 2017. (In Chinese). [Google Scholar]
  17. Yao, Z.X. Numerical Simulation of Flow and Mixing Characteristics in a Venturi Mixer. Master’s Thesis, Beijing University of Chemical Technology, Beijing, China, 2022. (In Chinese). [Google Scholar]
Figure 1. Structural type of venturi jet reactor.
Processes 13 02839 g001
Figure 2. Physical model of a venturi jet.
Processes 13 02839 g002
Figure 3. Structural parameter annotation that needs to be optimized.
Processes 13 02839 g003
Figure 4. Pressure and velocity curves of the central axis under different meshes.
Processes 13 02839 g004
Figure 5. Velocity and pressure contour of the cross section of the jet section.
Processes 13 02839 g005
Figure 6. Turbulent kinetic energy contour and urea mass fraction of the jet section.
Processes 13 02839 g006
Figure 7. M-curve of the mixed-index cross section of the jet section.
Processes 13 02839 g007
Figure 8. Internal streamline diagram of the ejector.
Processes 13 02839 g008
Figure 9. Cross-section velocity diagram and pressure contour of the jet section under different distances between the mixing tube and nozzle: (a) 5 mm, (b) 7 mm, (c) 9 mm, (d) 11 mm, and (e) 13 mm.
Processes 13 02839 g009
Figure 10. Velocity diagram and pressure of different nozzle outlet diameters: (a) 5 mm and (b) 9 mm.
Processes 13 02839 g010
Figure 11. Velocity diagram and pressure distribution for different ratios of throat length to diameter: (a) 2, (b) 3, and (c) 4.
Processes 13 02839 g011
Figure 12. Velocity diagram and pressure distribution with different contraction angles: (a) 25°, (b) 30°, (c) 35°, (d) 30°, and (e) 45°.
Processes 13 02839 g012
Figure 13. Pressure variation curve of reactor jet section center line under different parameters: (a) different distances between mixing tube and nozzle, (b) different nozzle outlet diameters, (c) different ratios of throat length to diameter, and (d) different contraction angles.
Processes 13 02839 g013
Figure 14. Reactor efficiency curve under different parameters: (a) different distances between mixing tube and nozzle, (b) different nozzle outlet diameters, (c) different ratios of throat length to diameter, and (d) different contraction angles.
Processes 13 02839 g014aProcesses 13 02839 g014b
Figure 15. Mixing index curve of reactor throat outlet section under different parameters: (a) different distances of mixing tube to nozzle, (b) different nozzle outlet diameters, (c) different ratios of throat length to diameter, and (d) different contraction angles.
Processes 13 02839 g015
Figure 16. Velocity and pressure contours after structural optimization.
Processes 13 02839 g016
Table 1. Main structure dimensions of venturi jet reactor.
Size ParameterNumerical ValueSize ParameterNumerical Value
d120 mmL15 mm
d210.5 mmL31200 mm
d36 mmL41200 mm
d412 mmα45°
d5253 mmβ
L224 mmd6100 mm
Disclaimer/Publisher’s Note: The statements, opinions and data contained in all publications are solely those of the individual author(s) and contributor(s) and not of MDPI and/or the editor(s). MDPI and/or the editor(s) disclaim responsibility for any injury to people or property resulting from any ideas, methods, instructions or products referred to in the content.